Cities with the Highest Percentage of Native Hawaiian Population in Ohio
RELATED REPORTS & OPTIONS
Native Hawaiian
Ohio
Compare Cities
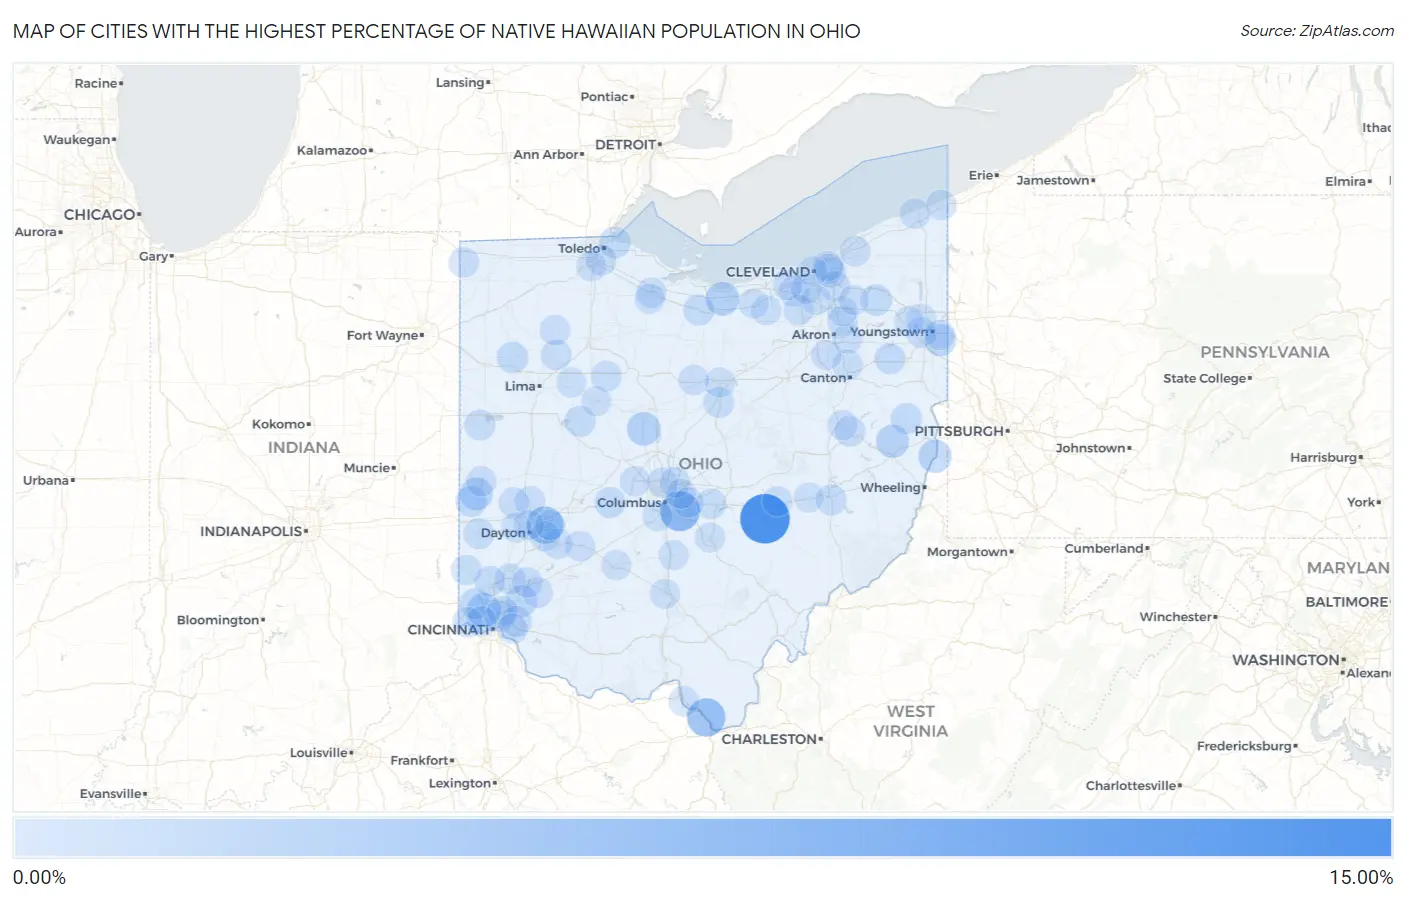
Map of Cities with the Highest Percentage of Native Hawaiian Population in Ohio
0.00%
15.00%
Cities with the Highest Percentage of Native Hawaiian Population in Ohio
| City | Native Hawaiian | vs State | vs National | |
| 1. | East Fultonham | 10.49% | 0.043%(+10.4)#1 | 0.20%(+10.3)#158 |
| 2. | Blacklick Estates | 5.15% | 0.043%(+5.11)#2 | 0.20%(+4.95)#203 |
| 3. | Coal Grove | 4.25% | 0.043%(+4.21)#3 | 0.20%(+4.05)#226 |
| 4. | Wright Patterson Afb | 3.67% | 0.043%(+3.63)#4 | 0.20%(+3.47)#250 |
| 5. | Groesbeck | 2.08% | 0.043%(+2.03)#5 | 0.20%(+1.88)#376 |
| 6. | Berlin Heights | 1.92% | 0.043%(+1.87)#6 | 0.20%(+1.72)#389 |
| 7. | Prospect | 1.82% | 0.043%(+1.77)#7 | 0.20%(+1.62)#405 |
| 8. | Brilliant | 1.59% | 0.043%(+1.55)#8 | 0.20%(+1.39)#451 |
| 9. | Jewett | 1.54% | 0.043%(+1.50)#9 | 0.20%(+1.35)#466 |
| 10. | Wayne Lakes | 1.45% | 0.043%(+1.41)#10 | 0.20%(+1.25)#485 |
| 11. | Struthers | 1.11% | 0.043%(+1.07)#11 | 0.20%(+0.915)#607 |
| 12. | Loveland Park | 0.99% | 0.043%(+0.944)#12 | 0.20%(+0.789)#667 |
| 13. | Ottoville | 0.82% | 0.043%(+0.777)#13 | 0.20%(+0.622)#773 |
| 14. | Harbor View | 0.81% | 0.043%(+0.764)#14 | 0.20%(+0.609)#782 |
| 15. | Hiram | 0.79% | 0.043%(+0.748)#15 | 0.20%(+0.593)#795 |
| 16. | New Madison | 0.73% | 0.043%(+0.688)#16 | 0.20%(+0.533)#858 |
| 17. | Belle Center | 0.56% | 0.043%(+0.521)#17 | 0.20%(+0.366)#1,069 |
| 18. | Bergholz | 0.56% | 0.043%(+0.515)#18 | 0.20%(+0.360)#1,078 |
| 19. | New Baltimore | 0.55% | 0.043%(+0.506)#19 | 0.20%(+0.351)#1,089 |
| 20. | Sebring | 0.53% | 0.043%(+0.483)#20 | 0.20%(+0.328)#1,128 |
| 21. | Choctaw Lake | 0.50% | 0.043%(+0.462)#21 | 0.20%(+0.307)#1,157 |
| 22. | Monroeville | 0.50% | 0.043%(+0.461)#22 | 0.20%(+0.307)#1,158 |
| 23. | Oakwood Village Paulding County | 0.50% | 0.043%(+0.455)#23 | 0.20%(+0.300)#1,169 |
| 24. | Monroe | 0.49% | 0.043%(+0.450)#24 | 0.20%(+0.296)#1,176 |
| 25. | Golf Manor | 0.48% | 0.043%(+0.433)#25 | 0.20%(+0.278)#1,220 |
| 26. | Byesville | 0.44% | 0.043%(+0.400)#26 | 0.20%(+0.245)#1,270 |
| 27. | Terrace Park | 0.42% | 0.043%(+0.376)#27 | 0.20%(+0.221)#1,328 |
| 28. | Forest | 0.41% | 0.043%(+0.369)#28 | 0.20%(+0.215)#1,339 |
| 29. | Pandora | 0.41% | 0.043%(+0.363)#29 | 0.20%(+0.208)#1,356 |
| 30. | Bellville | 0.40% | 0.043%(+0.358)#30 | 0.20%(+0.203)#1,366 |
| 31. | Eaton | 0.38% | 0.043%(+0.340)#31 | 0.20%(+0.185)#1,429 |
| 32. | Coldwater | 0.38% | 0.043%(+0.334)#32 | 0.20%(+0.179)#1,445 |
| 33. | Midvale | 0.35% | 0.043%(+0.303)#33 | 0.20%(+0.148)#1,525 |
| 34. | New Miami | 0.33% | 0.043%(+0.289)#34 | 0.20%(+0.134)#1,561 |
| 35. | Reading | 0.31% | 0.043%(+0.271)#35 | 0.20%(+0.116)#1,623 |
| 36. | North Bend | 0.30% | 0.043%(+0.255)#36 | 0.20%(+0.101)#1,686 |
| 37. | Kirtland Hills | 0.29% | 0.043%(+0.252)#37 | 0.20%(+0.097)#1,694 |
| 38. | Berea | 0.29% | 0.043%(+0.248)#38 | 0.20%(+0.093)#1,704 |
| 39. | Crestline | 0.29% | 0.043%(+0.247)#39 | 0.20%(+0.092)#1,712 |
| 40. | Rossford | 0.29% | 0.043%(+0.242)#40 | 0.20%(+0.087)#1,726 |
| 41. | Jamestown | 0.27% | 0.043%(+0.228)#41 | 0.20%(+0.074)#1,786 |
| 42. | North Canton | 0.26% | 0.043%(+0.222)#42 | 0.20%(+0.067)#1,818 |
| 43. | Franklin Furnace | 0.26% | 0.043%(+0.221)#43 | 0.20%(+0.066)#1,821 |
| 44. | Austintown | 0.26% | 0.043%(+0.217)#44 | 0.20%(+0.062)#1,839 |
| 45. | Morrow | 0.26% | 0.043%(+0.214)#45 | 0.20%(+0.059)#1,846 |
| 46. | Tipp City | 0.25% | 0.043%(+0.210)#46 | 0.20%(+0.056)#1,856 |
| 47. | Worthington | 0.25% | 0.043%(+0.204)#47 | 0.20%(+0.049)#1,883 |
| 48. | Lebanon | 0.24% | 0.043%(+0.200)#48 | 0.20%(+0.045)#1,908 |
| 49. | Huber Ridge | 0.23% | 0.043%(+0.190)#49 | 0.20%(+0.035)#1,957 |
| 50. | Dry Run | 0.23% | 0.043%(+0.186)#50 | 0.20%(+0.031)#1,969 |
| 51. | University Heights | 0.23% | 0.043%(+0.184)#51 | 0.20%(+0.029)#1,977 |
| 52. | Leipsic | 0.23% | 0.043%(+0.183)#52 | 0.20%(+0.028)#1,983 |
| 53. | Edon | 0.22% | 0.043%(+0.179)#53 | 0.20%(+0.024)#2,003 |
| 54. | Plain City | 0.22% | 0.043%(+0.177)#54 | 0.20%(+0.022)#2,018 |
| 55. | Fremont | 0.21% | 0.043%(+0.171)#55 | 0.20%(+0.016)#2,054 |
| 56. | West Milton | 0.21% | 0.043%(+0.169)#56 | 0.20%(+0.014)#2,064 |
| 57. | Bedford Heights | 0.21% | 0.043%(+0.167)#57 | 0.20%(+0.013)#2,076 |
| 58. | Conneaut | 0.21% | 0.043%(+0.167)#58 | 0.20%(+0.012)#2,078 |
| 59. | Greenville | 0.20% | 0.043%(+0.161)#59 | 0.20%(+0.006)#2,110 |
| 60. | New Franklin | 0.20% | 0.043%(+0.159)#60 | 0.20%(+0.004)#2,117 |
| 61. | Xenia | 0.20% | 0.043%(+0.153)#61 | 0.20%(-0.002)#2,143 |
| 62. | Ashtabula | 0.19% | 0.043%(+0.152)#62 | 0.20%(-0.003)#2,152 |
| 63. | Kirkersville | 0.18% | 0.043%(+0.137)#63 | 0.20%(-0.018)#2,224 |
| 64. | Oxford | 0.18% | 0.043%(+0.134)#64 | 0.20%(-0.021)#2,238 |
| 65. | Cheviot | 0.17% | 0.043%(+0.130)#65 | 0.20%(-0.025)#2,264 |
| 66. | Reynoldsburg | 0.17% | 0.043%(+0.128)#66 | 0.20%(-0.027)#2,273 |
| 67. | Brunswick | 0.16% | 0.043%(+0.121)#67 | 0.20%(-0.033)#2,312 |
| 68. | Zanesville | 0.16% | 0.043%(+0.119)#68 | 0.20%(-0.036)#2,331 |
| 69. | Parma Heights | 0.16% | 0.043%(+0.116)#69 | 0.20%(-0.038)#2,340 |
| 70. | Stow | 0.16% | 0.043%(+0.114)#70 | 0.20%(-0.041)#2,354 |
| 71. | Beavercreek | 0.14% | 0.043%(+0.095)#71 | 0.20%(-0.060)#2,509 |
| 72. | East Cleveland | 0.14% | 0.043%(+0.094)#72 | 0.20%(-0.061)#2,516 |
| 73. | Circleville | 0.13% | 0.043%(+0.086)#73 | 0.20%(-0.069)#2,572 |
| 74. | Campbell | 0.13% | 0.043%(+0.085)#74 | 0.20%(-0.070)#2,574 |
| 75. | Lancaster | 0.12% | 0.043%(+0.080)#75 | 0.20%(-0.075)#2,610 |
| 76. | Niles | 0.12% | 0.043%(+0.079)#76 | 0.20%(-0.076)#2,624 |
| 77. | Gahanna | 0.12% | 0.043%(+0.075)#77 | 0.20%(-0.079)#2,647 |
| 78. | Lagrange | 0.11% | 0.043%(+0.070)#78 | 0.20%(-0.085)#2,693 |
| 79. | Ballville | 0.11% | 0.043%(+0.067)#79 | 0.20%(-0.088)#2,715 |
| 80. | Perrysburg | 0.10% | 0.043%(+0.062)#80 | 0.20%(-0.093)#2,753 |
| 81. | Dayton | 0.100% | 0.043%(+0.057)#81 | 0.20%(-0.098)#2,800 |
| 82. | Ada | 0.098% | 0.043%(+0.055)#82 | 0.20%(-0.099)#2,817 |
| 83. | New Philadelphia | 0.097% | 0.043%(+0.054)#83 | 0.20%(-0.101)#2,833 |
| 84. | Mansfield | 0.094% | 0.043%(+0.052)#84 | 0.20%(-0.103)#2,850 |
| 85. | North Olmsted | 0.081% | 0.043%(+0.038)#85 | 0.20%(-0.117)#2,975 |
| 86. | Fairborn | 0.078% | 0.043%(+0.035)#86 | 0.20%(-0.119)#3,003 |
| 87. | Mogadore | 0.078% | 0.043%(+0.035)#87 | 0.20%(-0.120)#3,004 |
| 88. | New Concord | 0.077% | 0.043%(+0.034)#88 | 0.20%(-0.121)#3,014 |
| 89. | Broadview Heights | 0.076% | 0.043%(+0.033)#89 | 0.20%(-0.122)#3,032 |
| 90. | Grove City | 0.075% | 0.043%(+0.032)#90 | 0.20%(-0.123)#3,040 |
| 91. | Hudson | 0.074% | 0.043%(+0.031)#91 | 0.20%(-0.124)#3,049 |
| 92. | Oberlin | 0.073% | 0.043%(+0.030)#92 | 0.20%(-0.124)#3,060 |
| 93. | Trotwood | 0.069% | 0.043%(+0.026)#93 | 0.20%(-0.129)#3,097 |
| 94. | Cleveland Heights | 0.069% | 0.043%(+0.026)#94 | 0.20%(-0.129)#3,101 |
| 95. | Chillicothe | 0.068% | 0.043%(+0.025)#95 | 0.20%(-0.130)#3,109 |
| 96. | Cleveland | 0.065% | 0.043%(+0.022)#96 | 0.20%(-0.132)#3,129 |
| 97. | Kenton | 0.065% | 0.043%(+0.022)#97 | 0.20%(-0.133)#3,133 |
| 98. | Aurora | 0.064% | 0.043%(+0.021)#98 | 0.20%(-0.134)#3,144 |
| 99. | Washington Court House | 0.063% | 0.043%(+0.020)#99 | 0.20%(-0.135)#3,160 |
| 100. | Lordstown | 0.060% | 0.043%(+0.017)#100 | 0.20%(-0.138)#3,191 |
1
2Common Questions
What are the Top 10 Cities with the Highest Percentage of Native Hawaiian Population in Ohio?
Top 10 Cities with the Highest Percentage of Native Hawaiian Population in Ohio are:
#1
10.49%
#2
5.15%
#3
4.25%
#4
3.67%
#5
2.08%
#6
1.92%
#7
1.82%
#8
1.59%
#9
1.54%
#10
1.45%
What city has the Highest Percentage of Native Hawaiian Population in Ohio?
East Fultonham has the Highest Percentage of Native Hawaiian Population in Ohio with 10.49%.
What is the Percentage of Native Hawaiian Population in the State of Ohio?
Percentage of Native Hawaiian Population in Ohio is 0.043%.
What is the Percentage of Native Hawaiian Population in the United States?
Percentage of Native Hawaiian Population in the United States is 0.20%.