Fairfield, OH
Fairfield Map
Fairfield Overview
44,602
TOTAL POPULATION
21,419
MALE POPULATION
23,183
FEMALE POPULATION
92.39
MALES / 100 FEMALES
108.24
FEMALES / 100 MALES
38.9
MEDIAN AGE
3.0
AVG FAMILY SIZE
2.4
AVG HOUSEHOLD SIZE
$37,076
PER CAPITA INCOME
$87,350
AVG FAMILY INCOME
$67,182
AVG HOUSEHOLD INCOME
21.3%
WAGE / INCOME GAP [ % ]
78.7¢/ $1
WAGE / INCOME GAP [ $ ]
0.43
INEQUALITY / GINI INDEX
24,327
LABOR FORCE [ PEOPLE ]
67.6%
PERCENT IN LABOR FORCE
5.4%
UNEMPLOYMENT RATE
Fairfield Zip Codes
Fairfield Area Codes
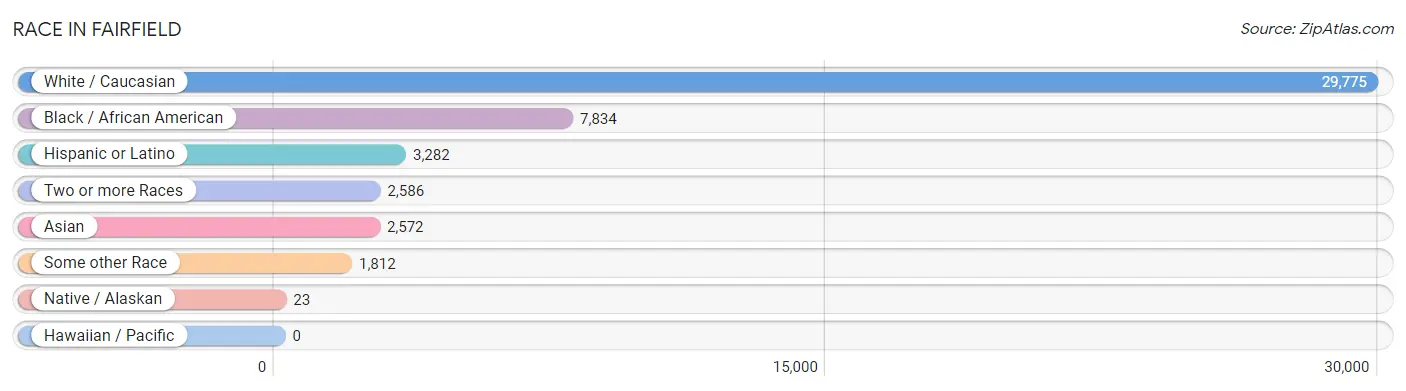
Race in Fairfield
The most populous races in Fairfield are White / Caucasian (29,775 | 66.8%), Black / African American (7,834 | 17.6%), and Hispanic or Latino (3,282 | 7.4%).
| Race | # Population | % Population |
| Asian | 2,572 | 5.8% |
| Black / African American | 7,834 | 17.6% |
| Hawaiian / Pacific | 0 | 0.0% |
| Hispanic or Latino | 3,282 | 7.4% |
| Native / Alaskan | 23 | 0.1% |
| White / Caucasian | 29,775 | 66.8% |
| Two or more Races | 2,586 | 5.8% |
| Some other Race | 1,812 | 4.1% |
| Total | 44,602 | 100.0% |
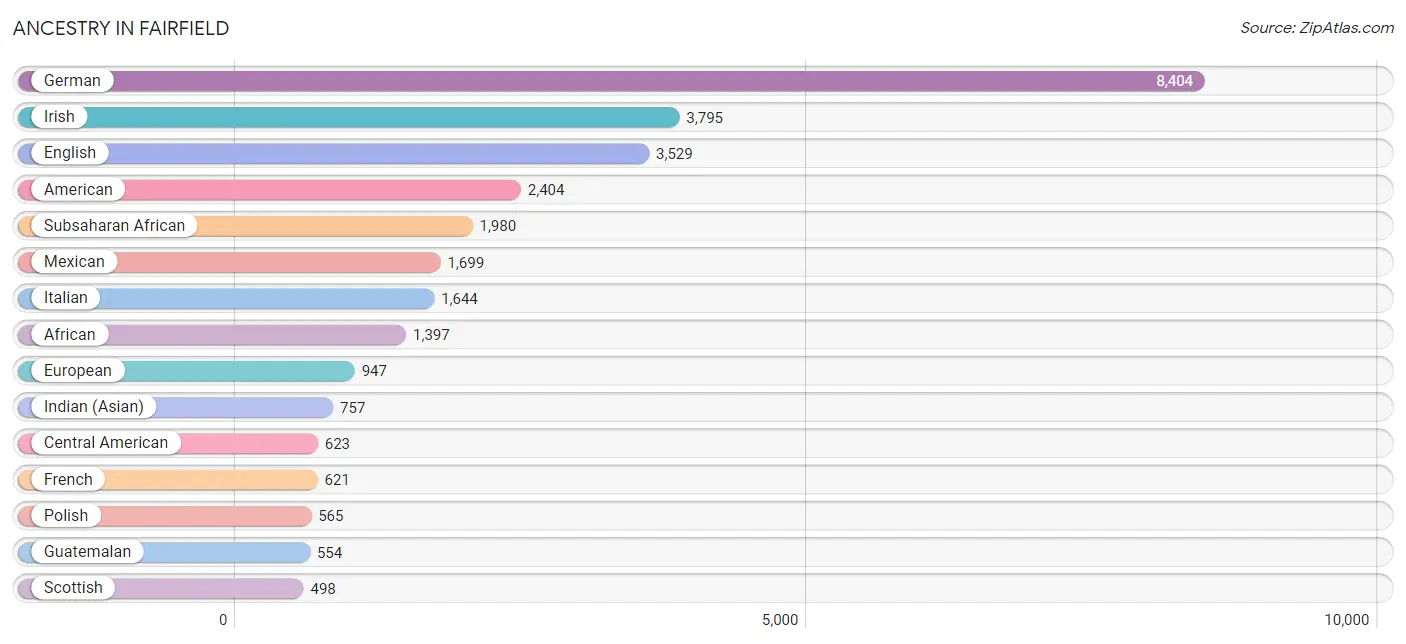
Ancestry in Fairfield
The most populous ancestries reported in Fairfield are German (8,404 | 18.8%), Irish (3,795 | 8.5%), English (3,529 | 7.9%), American (2,404 | 5.4%), and Subsaharan African (1,980 | 4.4%), together accounting for 45.1% of all Fairfield residents.
| Ancestry | # Population | % Population |
| Afghan | 19 | 0.0% |
| African | 1,397 | 3.1% |
| Alsatian | 43 | 0.1% |
| American | 2,404 | 5.4% |
| Arab | 157 | 0.4% |
| Armenian | 72 | 0.2% |
| Austrian | 53 | 0.1% |
| Barbadian | 100 | 0.2% |
| Bhutanese | 91 | 0.2% |
| Blackfeet | 21 | 0.1% |
| Bolivian | 19 | 0.0% |
| Brazilian | 56 | 0.1% |
| British | 292 | 0.6% |
| Burmese | 83 | 0.2% |
| Central American | 623 | 1.4% |
| Central American Indian | 9 | 0.0% |
| Cherokee | 251 | 0.6% |
| Cheyenne | 3 | 0.0% |
| Chilean | 12 | 0.0% |
| Choctaw | 10 | 0.0% |
| Colombian | 35 | 0.1% |
| Comanche | 20 | 0.0% |
| Croatian | 14 | 0.0% |
| Cuban | 184 | 0.4% |
| Czech | 213 | 0.5% |
| Czechoslovakian | 19 | 0.0% |
| Danish | 60 | 0.1% |
| Dominican | 218 | 0.5% |
| Dutch | 389 | 0.9% |
| Eastern European | 54 | 0.1% |
| English | 3,529 | 7.9% |
| European | 947 | 2.1% |
| Filipino | 21 | 0.1% |
| French | 621 | 1.4% |
| French Canadian | 74 | 0.2% |
| German | 8,404 | 18.8% |
| German Russian | 57 | 0.1% |
| Ghanaian | 227 | 0.5% |
| Greek | 98 | 0.2% |
| Guatemalan | 554 | 1.2% |
| Haitian | 18 | 0.0% |
| Hungarian | 173 | 0.4% |
| Indian (Asian) | 757 | 1.7% |
| Irish | 3,795 | 8.5% |
| Italian | 1,644 | 3.7% |
| Japanese | 395 | 0.9% |
| Jordanian | 68 | 0.2% |
| Kenyan | 64 | 0.1% |
| Korean | 170 | 0.4% |
| Latvian | 13 | 0.0% |
| Lebanese | 13 | 0.0% |
| Lithuanian | 34 | 0.1% |
| Mexican | 1,699 | 3.8% |
| Mongolian | 31 | 0.1% |
| Nicaraguan | 44 | 0.1% |
| Nigerian | 65 | 0.2% |
| Norwegian | 220 | 0.5% |
| Palestinian | 61 | 0.1% |
| Peruvian | 121 | 0.3% |
| Polish | 565 | 1.3% |
| Portuguese | 16 | 0.0% |
| Puerto Rican | 231 | 0.5% |
| Romanian | 27 | 0.1% |
| Russian | 117 | 0.3% |
| Salvadoran | 25 | 0.1% |
| Scandinavian | 59 | 0.1% |
| Scotch-Irish | 216 | 0.5% |
| Scottish | 498 | 1.1% |
| Seminole | 7 | 0.0% |
| Slavic | 69 | 0.2% |
| Slovak | 18 | 0.0% |
| South American | 187 | 0.4% |
| Spaniard | 41 | 0.1% |
| Spanish | 24 | 0.1% |
| Sri Lankan | 224 | 0.5% |
| Subsaharan African | 1,980 | 4.4% |
| Swedish | 179 | 0.4% |
| Swiss | 86 | 0.2% |
| Thai | 27 | 0.1% |
| Tlingit-Haida | 8 | 0.0% |
| Trinidadian and Tobagonian | 17 | 0.0% |
| Ukrainian | 10 | 0.0% |
| Welsh | 188 | 0.4% |
| West Indian | 10 | 0.0% |
| Yugoslavian | 31 | 0.1% | View All 85 Rows |
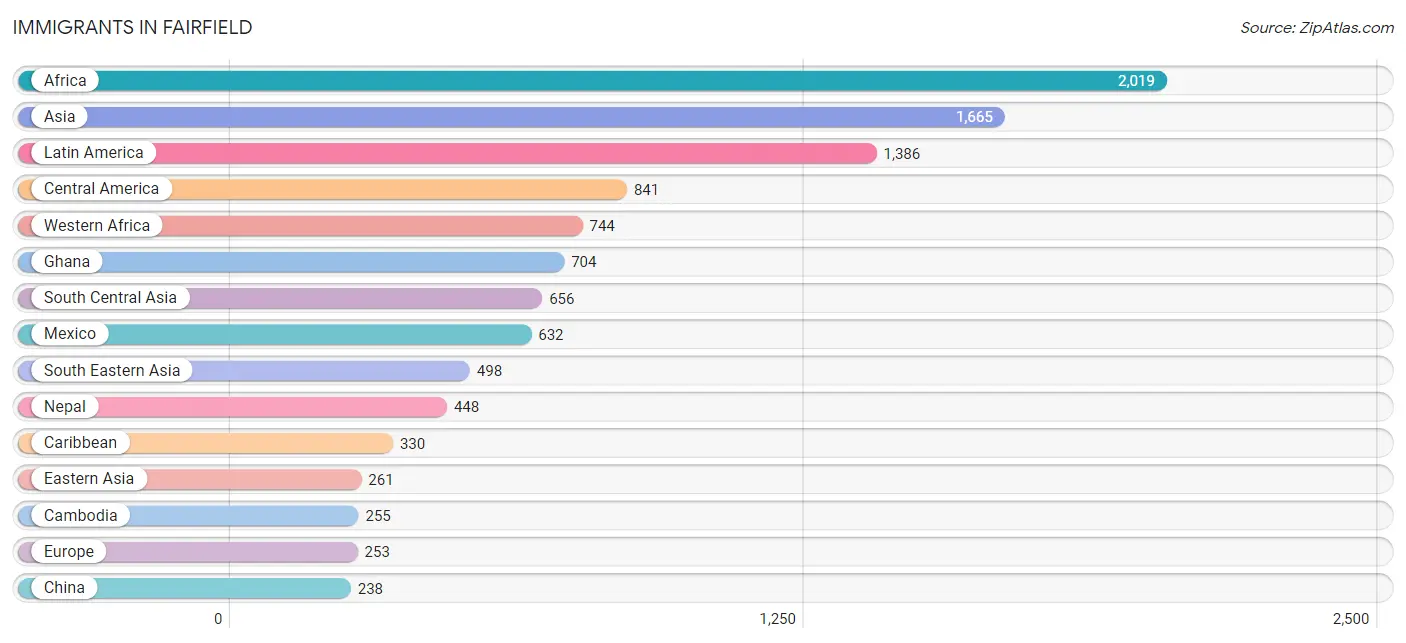
Immigrants in Fairfield
The most numerous immigrant groups reported in Fairfield came from Africa (2,019 | 4.5%), Asia (1,665 | 3.7%), Latin America (1,386 | 3.1%), Central America (841 | 1.9%), and Western Africa (744 | 1.7%), together accounting for 14.9% of all Fairfield residents.
| Immigration Origin | # Population | % Population |
| Afghanistan | 19 | 0.0% |
| Africa | 2,019 | 4.5% |
| Armenia | 54 | 0.1% |
| Asia | 1,665 | 3.7% |
| Australia | 20 | 0.0% |
| Belgium | 31 | 0.1% |
| Bolivia | 19 | 0.0% |
| Brazil | 28 | 0.1% |
| Cambodia | 255 | 0.6% |
| Cameroon | 135 | 0.3% |
| Canada | 21 | 0.1% |
| Caribbean | 330 | 0.7% |
| Central America | 841 | 1.9% |
| Chile | 12 | 0.0% |
| China | 238 | 0.5% |
| Congo | 29 | 0.1% |
| Cuba | 115 | 0.3% |
| Czechoslovakia | 8 | 0.0% |
| Denmark | 18 | 0.0% |
| Dominican Republic | 180 | 0.4% |
| Eastern Africa | 64 | 0.1% |
| Eastern Asia | 261 | 0.6% |
| Eastern Europe | 8 | 0.0% |
| El Salvador | 25 | 0.1% |
| England | 15 | 0.0% |
| Europe | 253 | 0.6% |
| Germany | 9 | 0.0% |
| Ghana | 704 | 1.6% |
| Greece | 42 | 0.1% |
| Guatemala | 129 | 0.3% |
| Haiti | 18 | 0.0% |
| Honduras | 20 | 0.0% |
| Hong Kong | 11 | 0.0% |
| India | 11 | 0.0% |
| Italy | 81 | 0.2% |
| Jordan | 46 | 0.1% |
| Kenya | 64 | 0.1% |
| Korea | 23 | 0.1% |
| Latin America | 1,386 | 3.1% |
| Lebanon | 32 | 0.1% |
| Liberia | 3 | 0.0% |
| Malaysia | 31 | 0.1% |
| Mexico | 632 | 1.4% |
| Middle Africa | 195 | 0.4% |
| Nepal | 448 | 1.0% |
| Nicaragua | 35 | 0.1% |
| Nigeria | 37 | 0.1% |
| Northern Europe | 82 | 0.2% |
| Oceania | 20 | 0.0% |
| Peru | 142 | 0.3% |
| Philippines | 78 | 0.2% |
| Scotland | 14 | 0.0% |
| South Africa | 216 | 0.5% |
| South America | 215 | 0.5% |
| South Central Asia | 656 | 1.5% |
| South Eastern Asia | 498 | 1.1% |
| Southern Europe | 123 | 0.3% |
| Taiwan | 21 | 0.1% |
| Trinidad and Tobago | 17 | 0.0% |
| Uruguay | 14 | 0.0% |
| Vietnam | 134 | 0.3% |
| Western Africa | 744 | 1.7% |
| Western Asia | 132 | 0.3% |
| Western Europe | 40 | 0.1% |
| Zaire | 31 | 0.1% | View All 65 Rows |
Sex and Age in Fairfield
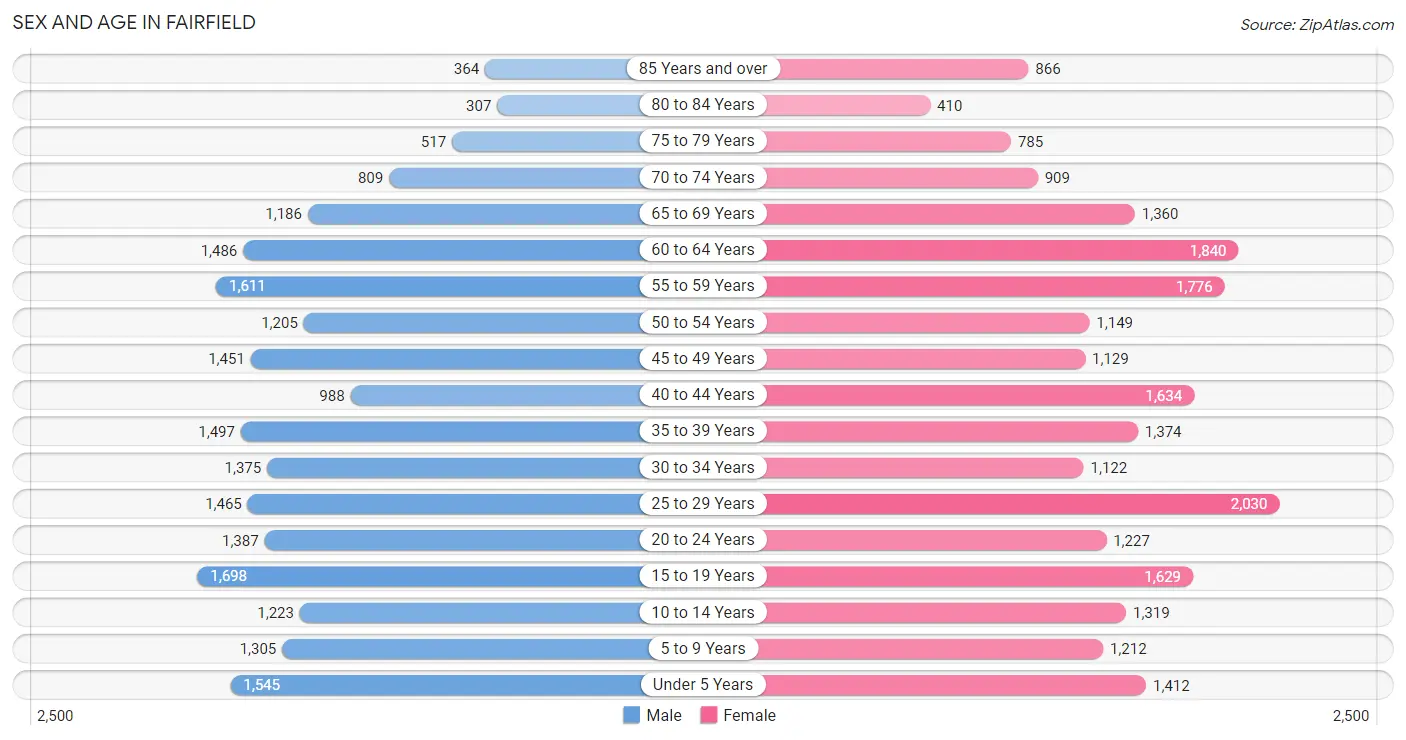
Sex and Age in Fairfield
The most populous age groups in Fairfield are 15 to 19 Years (1,698 | 7.9%) for men and 25 to 29 Years (2,030 | 8.8%) for women.
| Age Bracket | Male | Female |
| Under 5 Years | 1,545 (7.2%) | 1,412 (6.1%) |
| 5 to 9 Years | 1,305 (6.1%) | 1,212 (5.2%) |
| 10 to 14 Years | 1,223 (5.7%) | 1,319 (5.7%) |
| 15 to 19 Years | 1,698 (7.9%) | 1,629 (7.0%) |
| 20 to 24 Years | 1,387 (6.5%) | 1,227 (5.3%) |
| 25 to 29 Years | 1,465 (6.8%) | 2,030 (8.8%) |
| 30 to 34 Years | 1,375 (6.4%) | 1,122 (4.8%) |
| 35 to 39 Years | 1,497 (7.0%) | 1,374 (5.9%) |
| 40 to 44 Years | 988 (4.6%) | 1,634 (7.0%) |
| 45 to 49 Years | 1,451 (6.8%) | 1,129 (4.9%) |
| 50 to 54 Years | 1,205 (5.6%) | 1,149 (5.0%) |
| 55 to 59 Years | 1,611 (7.5%) | 1,776 (7.7%) |
| 60 to 64 Years | 1,486 (6.9%) | 1,840 (7.9%) |
| 65 to 69 Years | 1,186 (5.5%) | 1,360 (5.9%) |
| 70 to 74 Years | 809 (3.8%) | 909 (3.9%) |
| 75 to 79 Years | 517 (2.4%) | 785 (3.4%) |
| 80 to 84 Years | 307 (1.4%) | 410 (1.8%) |
| 85 Years and over | 364 (1.7%) | 866 (3.7%) |
| Total | 21,419 (100.0%) | 23,183 (100.0%) |
Families and Households in Fairfield
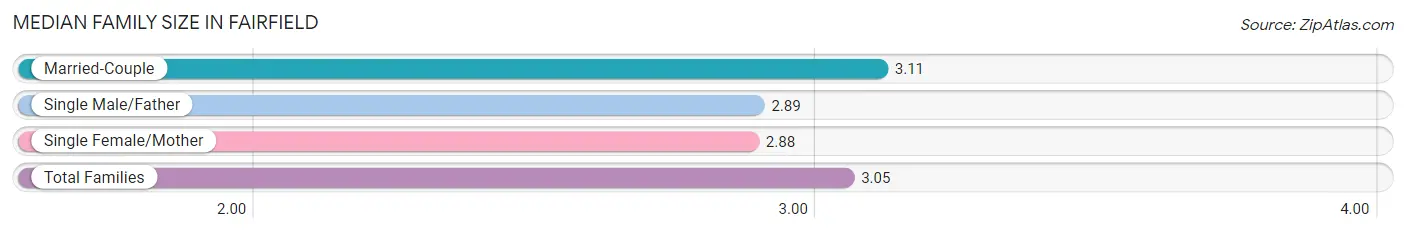
Median Family Size in Fairfield
The median family size in Fairfield is 3.05 persons per family, with married-couple families (8,379 | 72.1%) accounting for the largest median family size of 3.11 persons per family. On the other hand, single female/mother families (2,346 | 20.2%) represent the smallest median family size with 2.88 persons per family.
| Family Type | # Families | Family Size |
| Married-Couple | 8,379 (72.1%) | 3.11 |
| Single Male/Father | 892 (7.7%) | 2.89 |
| Single Female/Mother | 2,346 (20.2%) | 2.88 |
| Total Families | 11,617 (100.0%) | 3.05 |
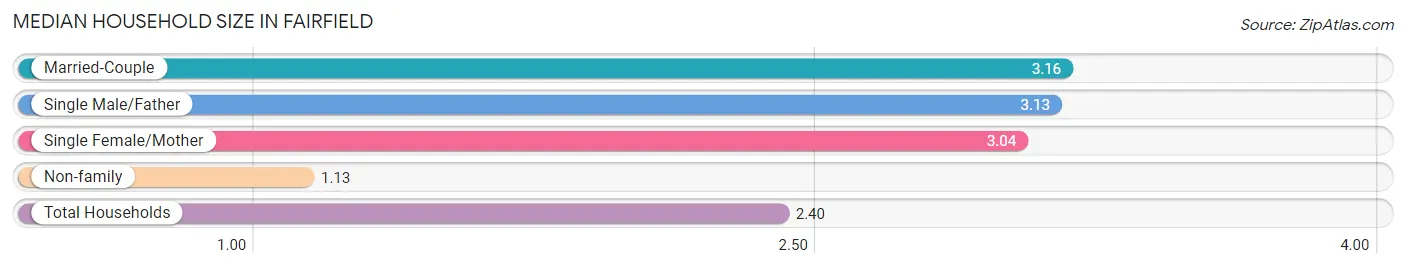
Median Household Size in Fairfield
The median household size in Fairfield is 2.40 persons per household, with married-couple households (8,379 | 45.6%) accounting for the largest median household size of 3.16 persons per household. non-family households (6,766 | 36.8%) represent the smallest median household size with 1.13 persons per household.
| Household Type | # Households | Household Size |
| Married-Couple | 8,379 (45.6%) | 3.16 |
| Single Male/Father | 892 (4.9%) | 3.13 |
| Single Female/Mother | 2,346 (12.8%) | 3.04 |
| Non-family | 6,766 (36.8%) | 1.13 |
| Total Households | 18,383 (100.0%) | 2.40 |
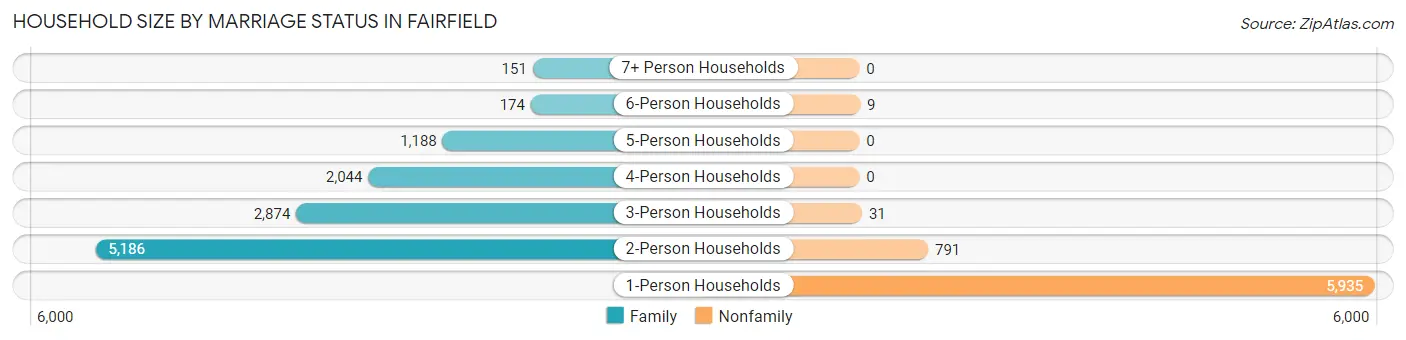
Household Size by Marriage Status in Fairfield
Out of a total of 18,383 households in Fairfield, 11,617 (63.2%) are family households, while 6,766 (36.8%) are nonfamily households. The most numerous type of family households are 2-person households, comprising 5,186, and the most common type of nonfamily households are 1-person households, comprising 5,935.
| Household Size | Family Households | Nonfamily Households |
| 1-Person Households | - | 5,935 (32.3%) |
| 2-Person Households | 5,186 (28.2%) | 791 (4.3%) |
| 3-Person Households | 2,874 (15.6%) | 31 (0.2%) |
| 4-Person Households | 2,044 (11.1%) | 0 (0.0%) |
| 5-Person Households | 1,188 (6.5%) | 0 (0.0%) |
| 6-Person Households | 174 (0.9%) | 9 (0.1%) |
| 7+ Person Households | 151 (0.8%) | 0 (0.0%) |
| Total | 11,617 (63.2%) | 6,766 (36.8%) |
Female Fertility in Fairfield
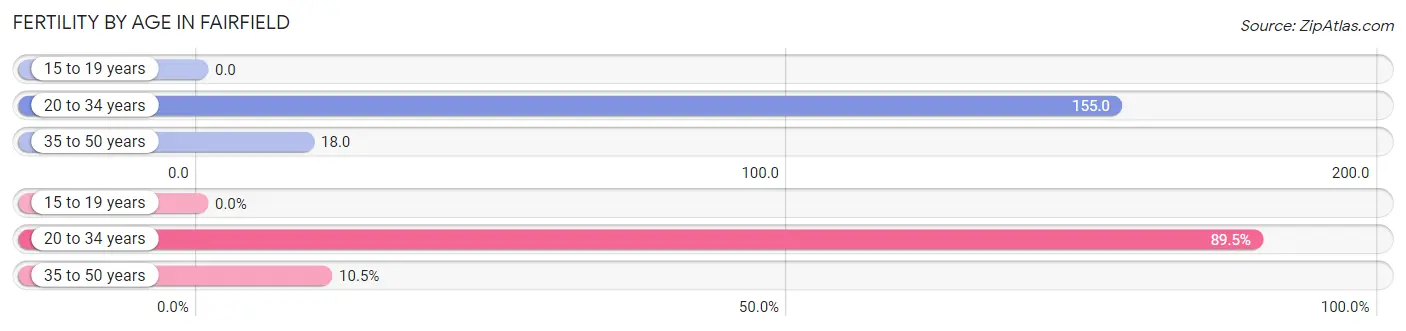
Fertility by Age in Fairfield
Average fertility rate in Fairfield is 72.0 births per 1,000 women. Women in the age bracket of 20 to 34 years have the highest fertility rate with 155.0 births per 1,000 women. Women in the age bracket of 20 to 34 years acount for 89.5% of all women with births.
| Age Bracket | Women with Births | Births / 1,000 Women |
| 15 to 19 years | 0 (0.0%) | 0.0 |
| 20 to 34 years | 680 (89.5%) | 155.0 |
| 35 to 50 years | 80 (10.5%) | 18.0 |
| Total | 760 (100.0%) | 72.0 |
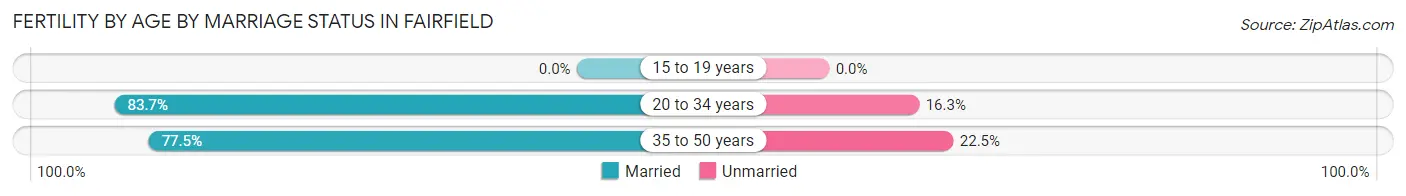
Fertility by Age by Marriage Status in Fairfield
83.0% of women with births (760) in Fairfield are married. The highest percentage of unmarried women with births falls into 35 to 50 years age bracket with 22.5% of them unmarried at the time of birth, while the lowest percentage of unmarried women with births belong to 20 to 34 years age bracket with 16.3% of them unmarried.
| Age Bracket | Married | Unmarried |
| 15 to 19 years | 0 (0.0%) | 0 (0.0%) |
| 20 to 34 years | 569 (83.7%) | 111 (16.3%) |
| 35 to 50 years | 62 (77.5%) | 18 (22.5%) |
| Total | 631 (83.0%) | 129 (17.0%) |
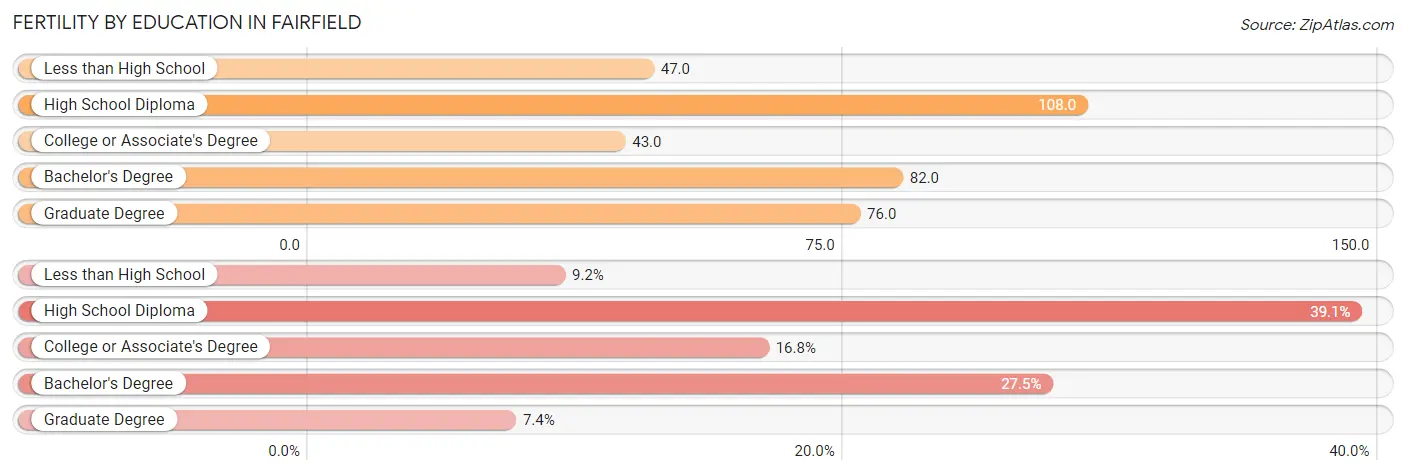
Fertility by Education in Fairfield
Average fertility rate in Fairfield is 72.0 births per 1,000 women. Women with the education attainment of high school diploma have the highest fertility rate of 108.0 births per 1,000 women, while women with the education attainment of college or associate's degree have the lowest fertility at 43.0 births per 1,000 women. Women with the education attainment of high school diploma represent 39.1% of all women with births.
| Educational Attainment | Women with Births | Births / 1,000 Women |
| Less than High School | 70 (9.2%) | 47.0 |
| High School Diploma | 297 (39.1%) | 108.0 |
| College or Associate's Degree | 128 (16.8%) | 43.0 |
| Bachelor's Degree | 209 (27.5%) | 82.0 |
| Graduate Degree | 56 (7.4%) | 76.0 |
| Total | 760 (100.0%) | 72.0 |
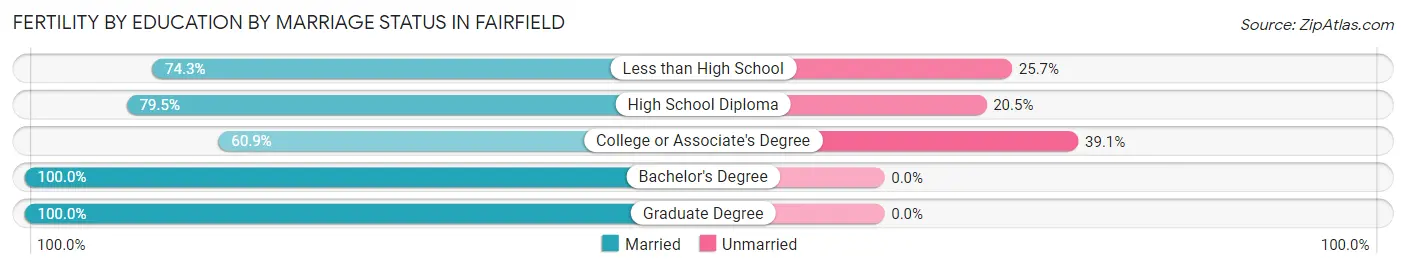
Fertility by Education by Marriage Status in Fairfield
17.0% of women with births in Fairfield are unmarried. Women with the educational attainment of bachelor's degree are most likely to be married with 100.0% of them married at childbirth, while women with the educational attainment of college or associate's degree are least likely to be married with 39.1% of them unmarried at childbirth.
| Educational Attainment | Married | Unmarried |
| Less than High School | 52 (74.3%) | 18 (25.7%) |
| High School Diploma | 236 (79.5%) | 61 (20.5%) |
| College or Associate's Degree | 78 (60.9%) | 50 (39.1%) |
| Bachelor's Degree | 209 (100.0%) | 0 (0.0%) |
| Graduate Degree | 56 (100.0%) | 0 (0.0%) |
| Total | 631 (83.0%) | 129 (17.0%) |
Income in Fairfield
Income Overview in Fairfield
Per Capita Income in Fairfield is $37,076, while median incomes of families and households are $87,350 and $67,182 respectively.
| Characteristic | Number | Measure |
| Per Capita Income | 44,602 | $37,076 |
| Median Family Income | 11,617 | $87,350 |
| Mean Family Income | 11,617 | $106,539 |
| Median Household Income | 18,383 | $67,182 |
| Mean Household Income | 18,383 | $88,767 |
| Income Deficit | 11,617 | $0 |
| Wage / Income Gap (%) | 44,602 | 21.26% |
| Wage / Income Gap ($) | 44,602 | 78.74¢ per $1 |
| Gini / Inequality Index | 44,602 | 0.43 |
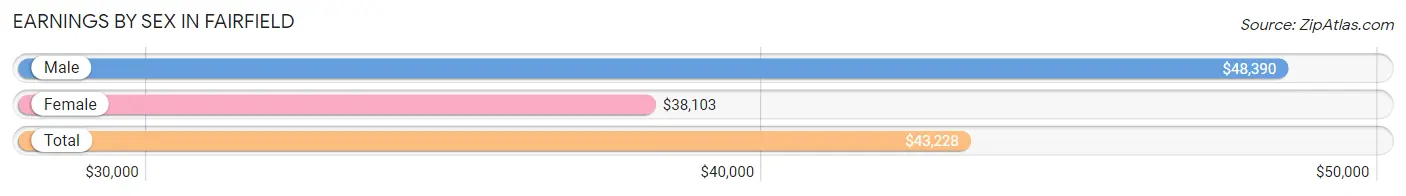
Earnings by Sex in Fairfield
Average Earnings in Fairfield are $43,228, $48,390 for men and $38,103 for women, a difference of 21.3%.
| Sex | Number | Average Earnings |
| Male | 12,448 (50.1%) | $48,390 |
| Female | 12,401 (49.9%) | $38,103 |
| Total | 24,849 (100.0%) | $43,228 |
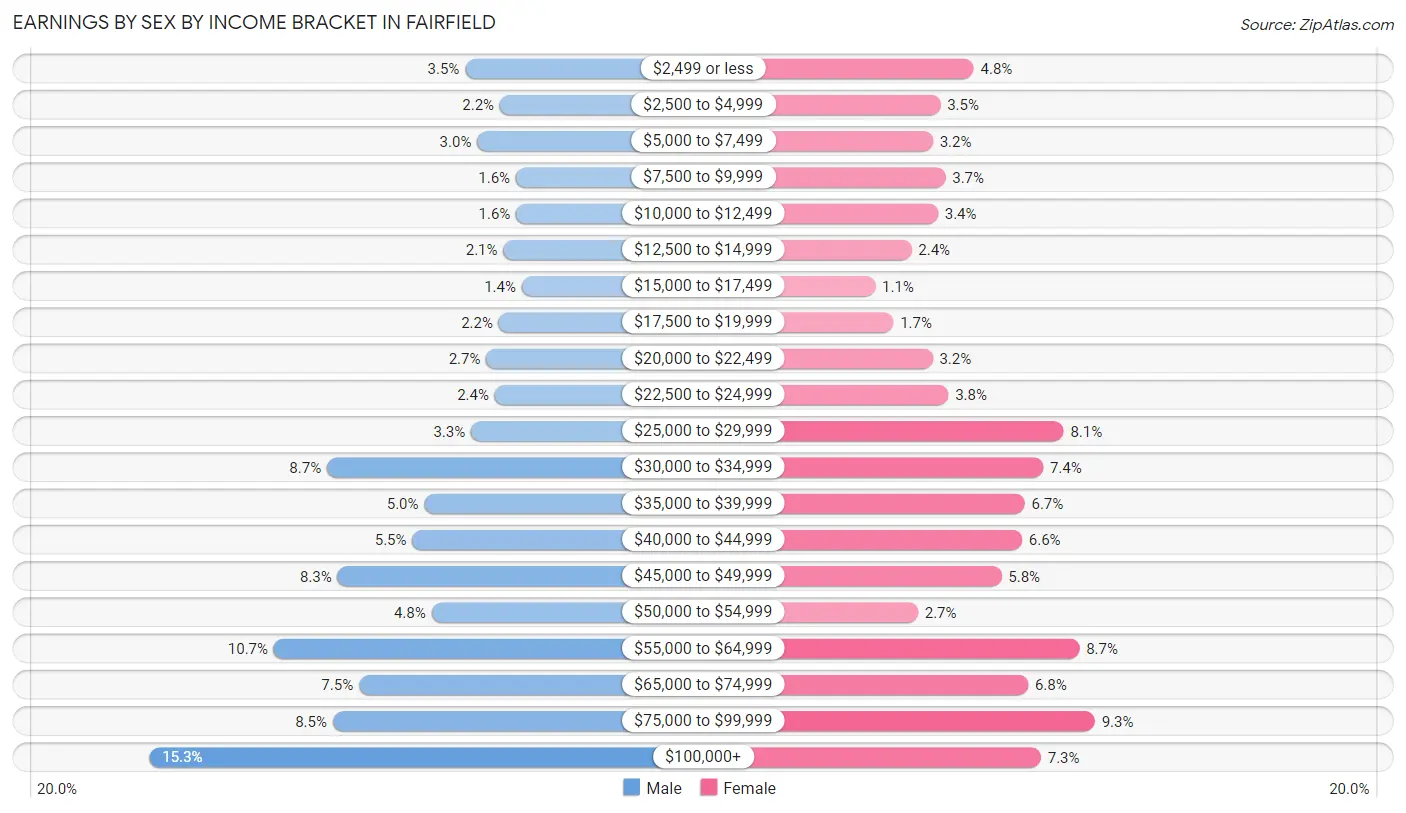
Earnings by Sex by Income Bracket in Fairfield
The most common earnings brackets in Fairfield are $100,000+ for men (1,908 | 15.3%) and $75,000 to $99,999 for women (1,152 | 9.3%).
| Income | Male | Female |
| $2,499 or less | 435 (3.5%) | 589 (4.8%) |
| $2,500 to $4,999 | 273 (2.2%) | 434 (3.5%) |
| $5,000 to $7,499 | 378 (3.0%) | 399 (3.2%) |
| $7,500 to $9,999 | 198 (1.6%) | 458 (3.7%) |
| $10,000 to $12,499 | 197 (1.6%) | 423 (3.4%) |
| $12,500 to $14,999 | 257 (2.1%) | 300 (2.4%) |
| $15,000 to $17,499 | 170 (1.4%) | 132 (1.1%) |
| $17,500 to $19,999 | 278 (2.2%) | 216 (1.7%) |
| $20,000 to $22,499 | 336 (2.7%) | 398 (3.2%) |
| $22,500 to $24,999 | 296 (2.4%) | 471 (3.8%) |
| $25,000 to $29,999 | 407 (3.3%) | 1,007 (8.1%) |
| $30,000 to $34,999 | 1,079 (8.7%) | 911 (7.3%) |
| $35,000 to $39,999 | 625 (5.0%) | 826 (6.7%) |
| $40,000 to $44,999 | 681 (5.5%) | 814 (6.6%) |
| $45,000 to $49,999 | 1,030 (8.3%) | 718 (5.8%) |
| $50,000 to $54,999 | 591 (4.8%) | 330 (2.7%) |
| $55,000 to $64,999 | 1,327 (10.7%) | 1,080 (8.7%) |
| $65,000 to $74,999 | 930 (7.5%) | 842 (6.8%) |
| $75,000 to $99,999 | 1,052 (8.5%) | 1,152 (9.3%) |
| $100,000+ | 1,908 (15.3%) | 901 (7.3%) |
| Total | 12,448 (100.0%) | 12,401 (100.0%) |
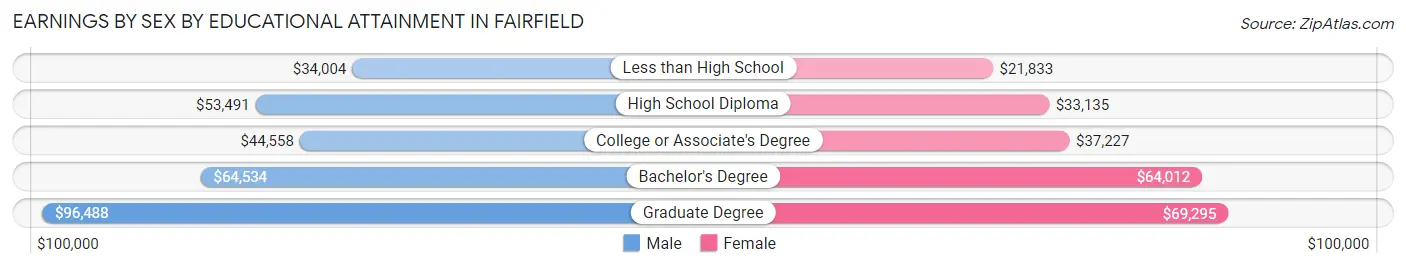
Earnings by Sex by Educational Attainment in Fairfield
Average earnings in Fairfield are $54,089 for men and $42,376 for women, a difference of 21.7%. Men with an educational attainment of graduate degree enjoy the highest average annual earnings of $96,488, while those with less than high school education earn the least with $34,004. Women with an educational attainment of graduate degree earn the most with the average annual earnings of $69,295, while those with less than high school education have the smallest earnings of $21,833.
| Educational Attainment | Male Income | Female Income |
| Less than High School | $34,004 | $21,833 |
| High School Diploma | $53,491 | $33,135 |
| College or Associate's Degree | $44,558 | $37,227 |
| Bachelor's Degree | $64,534 | $64,012 |
| Graduate Degree | $96,488 | $69,295 |
| Total | $54,089 | $42,376 |
Family Income in Fairfield
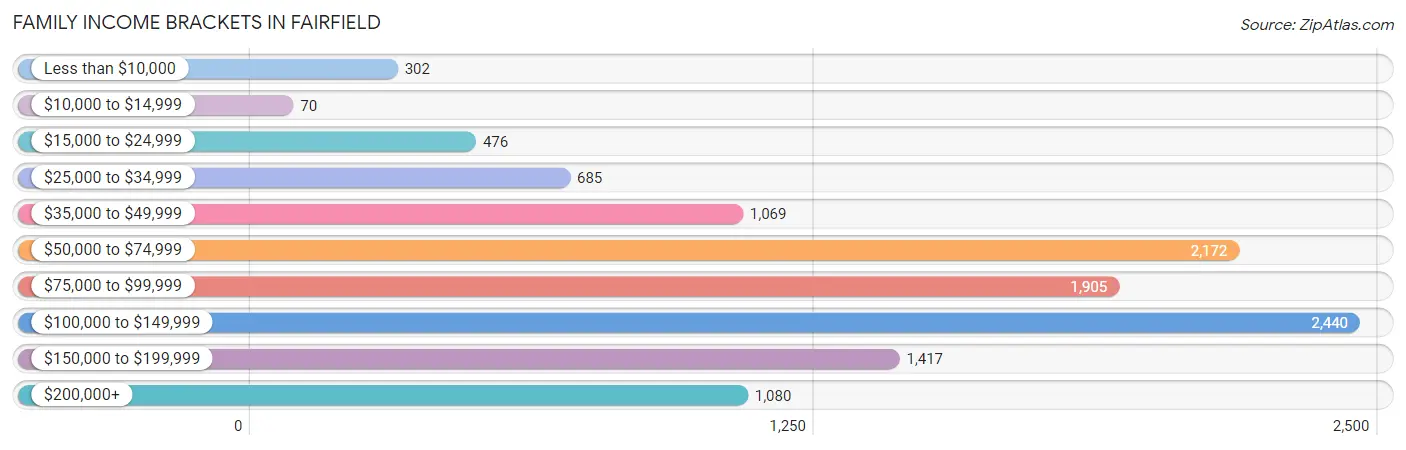
Family Income Brackets in Fairfield
According to the Fairfield family income data, there are 2,440 families falling into the $100,000 to $149,999 income range, which is the most common income bracket and makes up 21.0% of all families. Conversely, the $10,000 to $14,999 income bracket is the least frequent group with only 70 families (0.6%) belonging to this category.
| Income Bracket | # Families | % Families |
| Less than $10,000 | 302 | 2.6% |
| $10,000 to $14,999 | 70 | 0.6% |
| $15,000 to $24,999 | 476 | 4.1% |
| $25,000 to $34,999 | 685 | 5.9% |
| $35,000 to $49,999 | 1,069 | 9.2% |
| $50,000 to $74,999 | 2,172 | 18.7% |
| $75,000 to $99,999 | 1,905 | 16.4% |
| $100,000 to $149,999 | 2,440 | 21.0% |
| $150,000 to $199,999 | 1,417 | 12.2% |
| $200,000+ | 1,080 | 9.3% |
Family Income by Famaliy Size in Fairfield
5-person families (1,119 | 9.6%) account for the highest median family income in Fairfield with $115,487 per family, while 2-person families (5,593 | 48.1%) have the highest median income of $39,937 per family member.
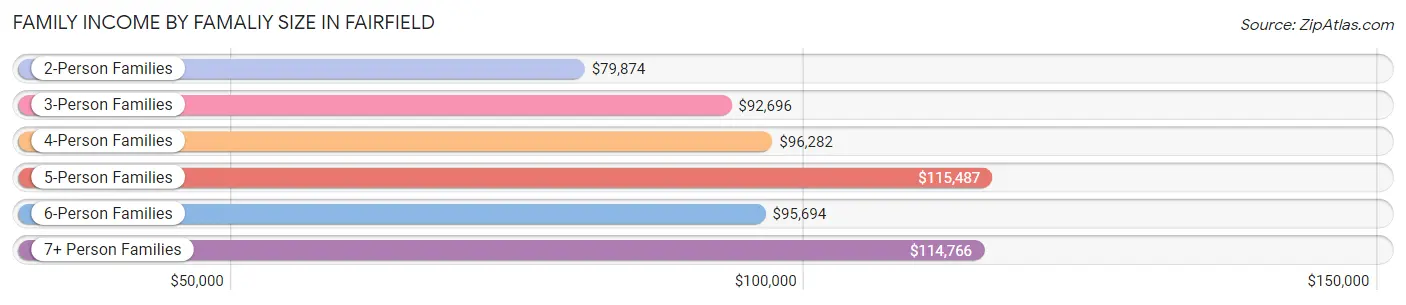
| Income Bracket | # Families | Median Income |
| 2-Person Families | 5,593 (48.1%) | $79,874 |
| 3-Person Families | 2,841 (24.5%) | $92,696 |
| 4-Person Families | 1,767 (15.2%) | $96,282 |
| 5-Person Families | 1,119 (9.6%) | $115,487 |
| 6-Person Families | 165 (1.4%) | $95,694 |
| 7+ Person Families | 132 (1.1%) | $114,766 |
| Total | 11,617 (100.0%) | $87,350 |
Family Income by Number of Earners in Fairfield
The median family income in Fairfield is $87,350, with families comprising 3+ earners (1,673) having the highest median family income of $129,911, while families with no earners (1,593) have the lowest median family income of $45,063, accounting for 14.4% and 13.7% of families, respectively.
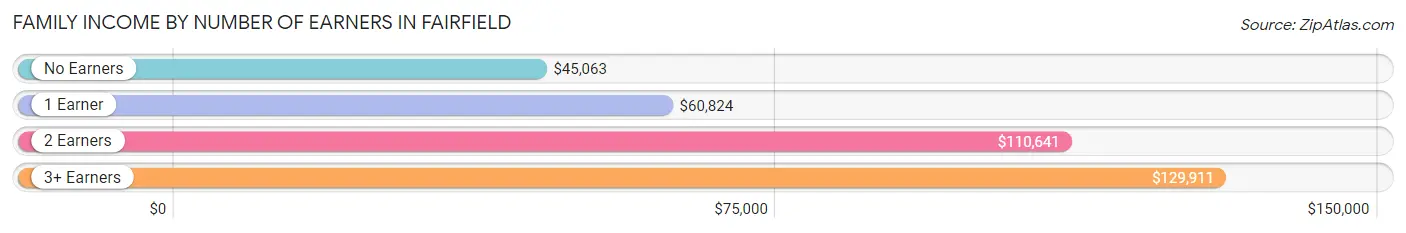
| Number of Earners | # Families | Median Income |
| No Earners | 1,593 (13.7%) | $45,063 |
| 1 Earner | 3,547 (30.5%) | $60,824 |
| 2 Earners | 4,804 (41.3%) | $110,641 |
| 3+ Earners | 1,673 (14.4%) | $129,911 |
| Total | 11,617 (100.0%) | $87,350 |
Household Income in Fairfield
Household Income Brackets in Fairfield
With 3,180 households falling in the category, the $50,000 to $74,999 income range is the most frequent in Fairfield, accounting for 17.3% of all households. In contrast, only 368 households (2.0%) fall into the $10,000 to $14,999 income bracket, making it the least populous group.
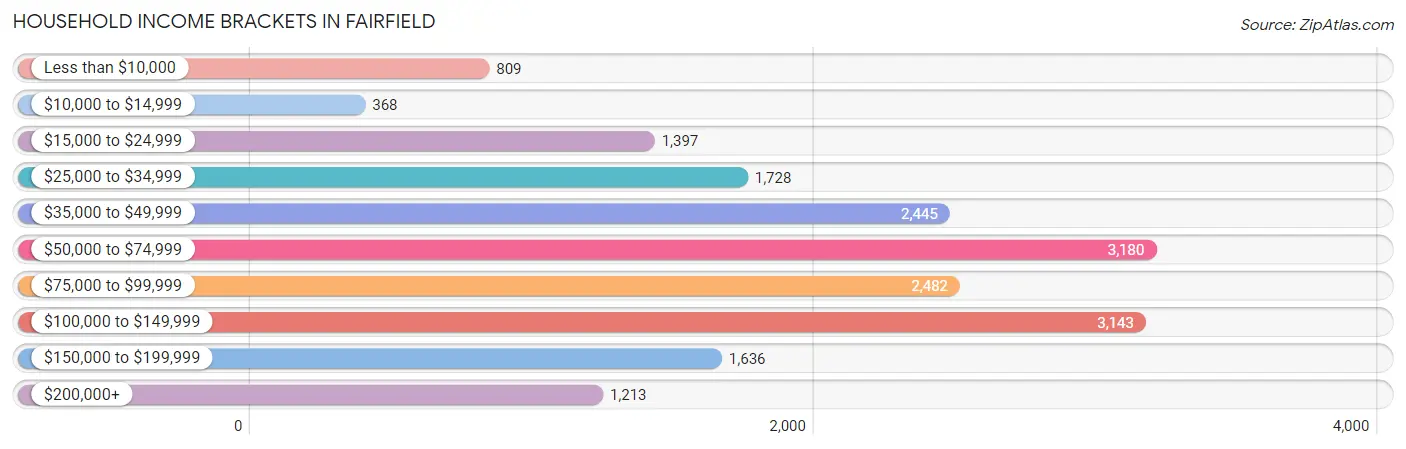
| Income Bracket | # Households | % Households |
| Less than $10,000 | 809 | 4.4% |
| $10,000 to $14,999 | 368 | 2.0% |
| $15,000 to $24,999 | 1,397 | 7.6% |
| $25,000 to $34,999 | 1,728 | 9.4% |
| $35,000 to $49,999 | 2,445 | 13.3% |
| $50,000 to $74,999 | 3,180 | 17.3% |
| $75,000 to $99,999 | 2,482 | 13.5% |
| $100,000 to $149,999 | 3,143 | 17.1% |
| $150,000 to $199,999 | 1,636 | 8.9% |
| $200,000+ | 1,213 | 6.6% |
Household Income by Householder Age in Fairfield
The median household income in Fairfield is $67,182, with the highest median household income of $89,081 found in the 45 to 64 years age bracket for the primary householder. A total of 6,809 households (37.0%) fall into this category. Meanwhile, the 15 to 24 years age bracket for the primary householder has the lowest median household income of $27,188, with 674 households (3.7%) in this group.
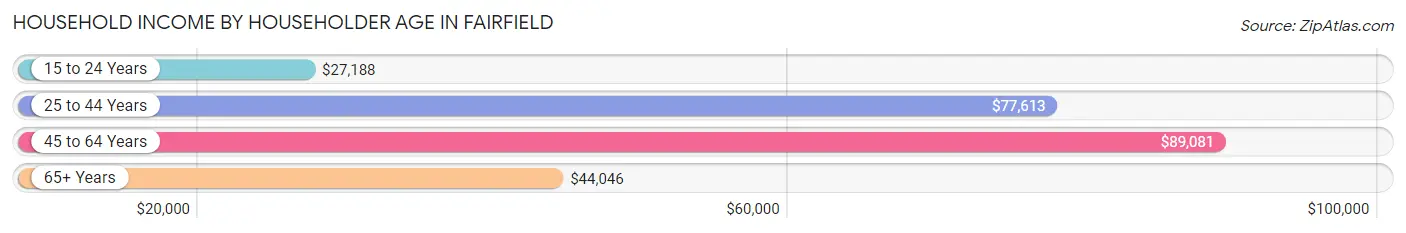
| Income Bracket | # Households | Median Income |
| 15 to 24 Years | 674 (3.7%) | $27,188 |
| 25 to 44 Years | 6,217 (33.8%) | $77,613 |
| 45 to 64 Years | 6,809 (37.0%) | $89,081 |
| 65+ Years | 4,683 (25.5%) | $44,046 |
| Total | 18,383 (100.0%) | $67,182 |
Poverty in Fairfield
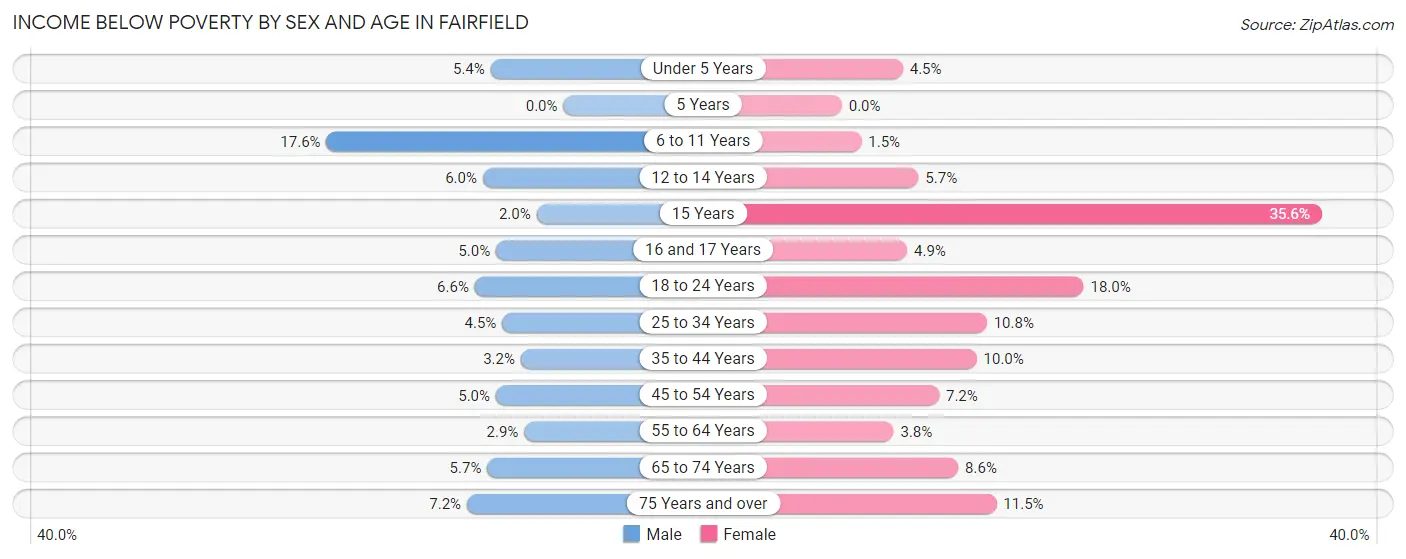
Income Below Poverty by Sex and Age in Fairfield
With 5.5% poverty level for males and 8.7% for females among the residents of Fairfield, 6 to 11 year old males and 15 year old females are the most vulnerable to poverty, with 225 males (17.6%) and 160 females (35.6%) in their respective age groups living below the poverty level.
| Age Bracket | Male | Female |
| Under 5 Years | 80 (5.4%) | 64 (4.5%) |
| 5 Years | 0 (0.0%) | 0 (0.0%) |
| 6 to 11 Years | 225 (17.6%) | 21 (1.5%) |
| 12 to 14 Years | 48 (6.0%) | 52 (5.7%) |
| 15 Years | 3 (2.0%) | 160 (35.6%) |
| 16 and 17 Years | 38 (5.0%) | 27 (4.9%) |
| 18 to 24 Years | 143 (6.6%) | 332 (17.9%) |
| 25 to 34 Years | 129 (4.5%) | 339 (10.8%) |
| 35 to 44 Years | 78 (3.2%) | 301 (10.0%) |
| 45 to 54 Years | 133 (5.0%) | 164 (7.2%) |
| 55 to 64 Years | 89 (2.9%) | 139 (3.8%) |
| 65 to 74 Years | 108 (5.7%) | 195 (8.6%) |
| 75 Years and over | 83 (7.2%) | 206 (11.5%) |
| Total | 1,157 (5.5%) | 2,000 (8.7%) |
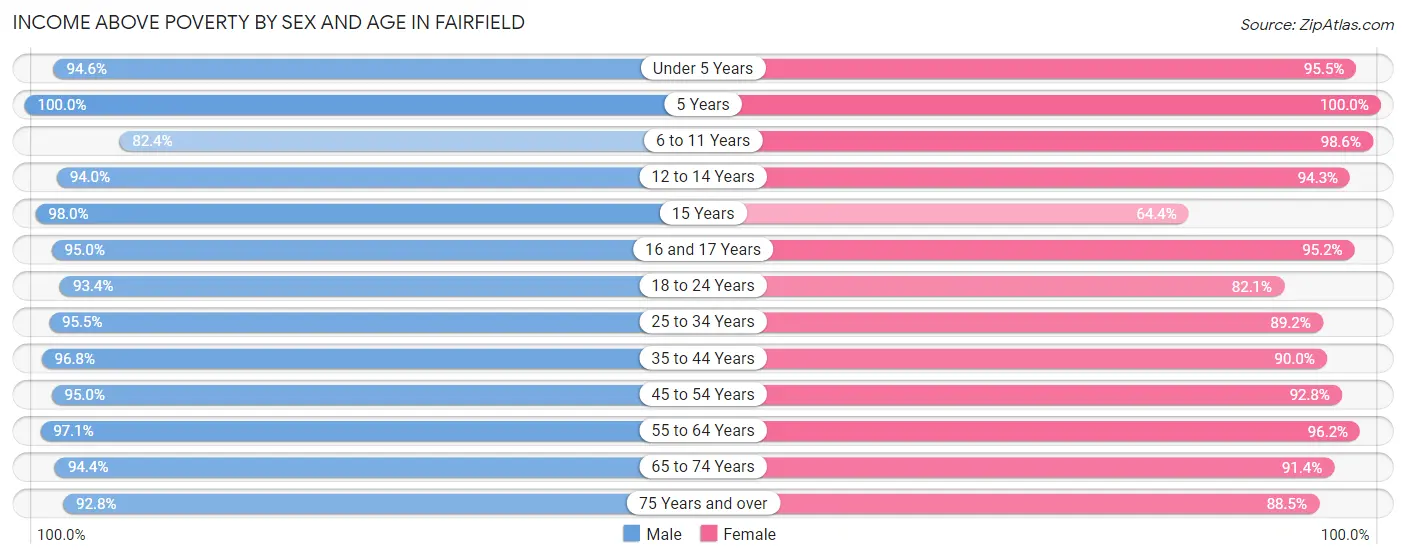
Income Above Poverty by Sex and Age in Fairfield
According to the poverty statistics in Fairfield, males aged 5 years and females aged 5 years are the age groups that are most secure financially, with 100.0% of males and 100.0% of females in these age groups living above the poverty line.
| Age Bracket | Male | Female |
| Under 5 Years | 1,401 (94.6%) | 1,348 (95.5%) |
| 5 Years | 342 (100.0%) | 141 (100.0%) |
| 6 to 11 Years | 1,054 (82.4%) | 1,428 (98.6%) |
| 12 to 14 Years | 755 (94.0%) | 862 (94.3%) |
| 15 Years | 148 (98.0%) | 289 (64.4%) |
| 16 and 17 Years | 722 (95.0%) | 530 (95.2%) |
| 18 to 24 Years | 2,031 (93.4%) | 1,518 (82.1%) |
| 25 to 34 Years | 2,711 (95.5%) | 2,813 (89.2%) |
| 35 to 44 Years | 2,392 (96.8%) | 2,707 (90.0%) |
| 45 to 54 Years | 2,523 (95.0%) | 2,108 (92.8%) |
| 55 to 64 Years | 2,967 (97.1%) | 3,477 (96.2%) |
| 65 to 74 Years | 1,803 (94.4%) | 2,063 (91.4%) |
| 75 Years and over | 1,077 (92.8%) | 1,589 (88.5%) |
| Total | 19,926 (94.5%) | 20,873 (91.3%) |
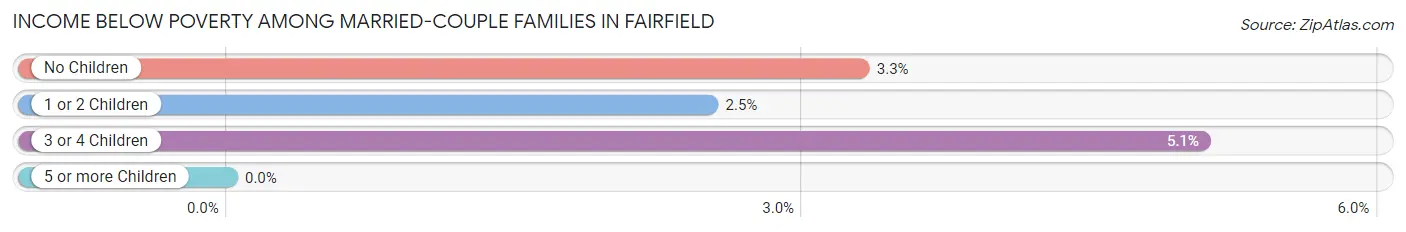
Income Below Poverty Among Married-Couple Families in Fairfield
The poverty statistics for married-couple families in Fairfield show that 3.2% or 265 of the total 8,379 families live below the poverty line. Families with 3 or 4 children have the highest poverty rate of 5.1%, comprising of 33 families. On the other hand, families with 5 or more children have the lowest poverty rate of 0.0%, which includes 0 families.
| Children | Above Poverty | Below Poverty |
| No Children | 4,776 (96.7%) | 163 (3.3%) |
| 1 or 2 Children | 2,676 (97.5%) | 69 (2.5%) |
| 3 or 4 Children | 617 (94.9%) | 33 (5.1%) |
| 5 or more Children | 45 (100.0%) | 0 (0.0%) |
| Total | 8,114 (96.8%) | 265 (3.2%) |
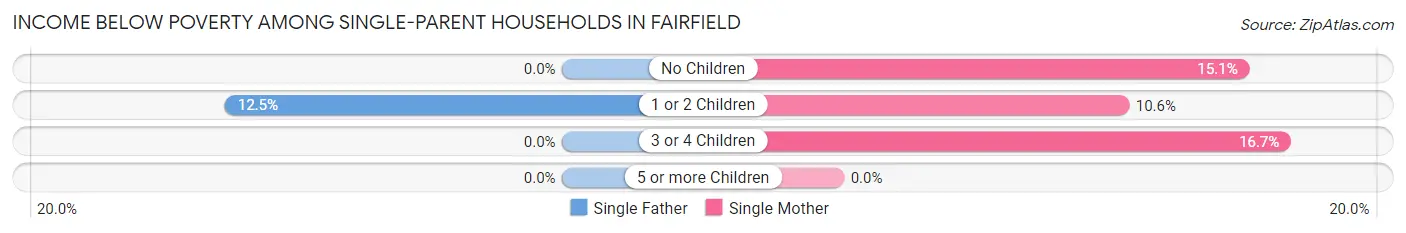
Income Below Poverty Among Single-Parent Households in Fairfield
According to the poverty data in Fairfield, 4.2% or 37 single-father households and 12.3% or 288 single-mother households are living below the poverty line. Among single-father households, those with 1 or 2 children have the highest poverty rate, with 37 households (12.5%) experiencing poverty. Likewise, among single-mother households, those with 3 or 4 children have the highest poverty rate, with 20 households (16.7%) falling below the poverty line.
| Children | Single Father | Single Mother |
| No Children | 0 (0.0%) | 106 (15.1%) |
| 1 or 2 Children | 37 (12.5%) | 162 (10.6%) |
| 3 or 4 Children | 0 (0.0%) | 20 (16.7%) |
| 5 or more Children | 0 (0.0%) | 0 (0.0%) |
| Total | 37 (4.2%) | 288 (12.3%) |
Income Below Poverty Among Married-Couple vs Single-Parent Households in Fairfield
The poverty data for Fairfield shows that 265 of the married-couple family households (3.2%) and 325 of the single-parent households (10.0%) are living below the poverty level. Within the married-couple family households, those with 3 or 4 children have the highest poverty rate, with 33 households (5.1%) falling below the poverty line. Among the single-parent households, those with 3 or 4 children have the highest poverty rate, with 20 household (12.7%) living below poverty.
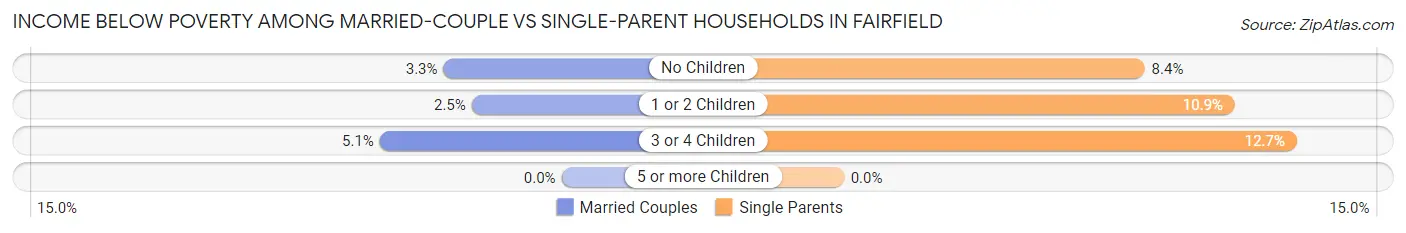
| Children | Married-Couple Families | Single-Parent Households |
| No Children | 163 (3.3%) | 106 (8.4%) |
| 1 or 2 Children | 69 (2.5%) | 199 (10.9%) |
| 3 or 4 Children | 33 (5.1%) | 20 (12.7%) |
| 5 or more Children | 0 (0.0%) | 0 (0.0%) |
| Total | 265 (3.2%) | 325 (10.0%) |
Employment Characteristics in Fairfield
Employment by Class of Employer in Fairfield
Among the 22,746 employed individuals in Fairfield, private company employees (17,918 | 78.8%), local government employees (1,337 | 5.9%), and not-for-profit organizations (1,279 | 5.6%) make up the most common classes of employment.
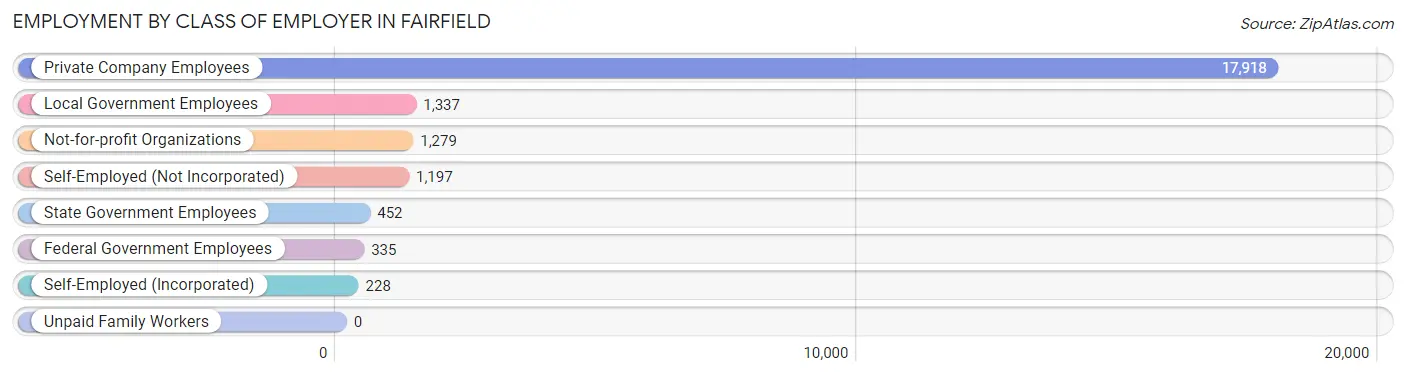
| Employer Class | # Employees | % Employees |
| Private Company Employees | 17,918 | 78.8% |
| Self-Employed (Incorporated) | 228 | 1.0% |
| Self-Employed (Not Incorporated) | 1,197 | 5.3% |
| Not-for-profit Organizations | 1,279 | 5.6% |
| Local Government Employees | 1,337 | 5.9% |
| State Government Employees | 452 | 2.0% |
| Federal Government Employees | 335 | 1.5% |
| Unpaid Family Workers | 0 | 0.0% |
| Total | 22,746 | 100.0% |
Employment Status by Age in Fairfield
According to the labor force statistics for Fairfield, out of the total population over 16 years of age (35,986), 67.6% or 24,327 individuals are in the labor force, with 5.4% or 1,314 of them unemployed. The age group with the highest labor force participation rate is 25 to 29 years, with 88.8% or 3,104 individuals in the labor force. Within the labor force, the 75 years and over age range has the highest percentage of unemployed individuals, with 39.3% or 42 of them being unemployed.
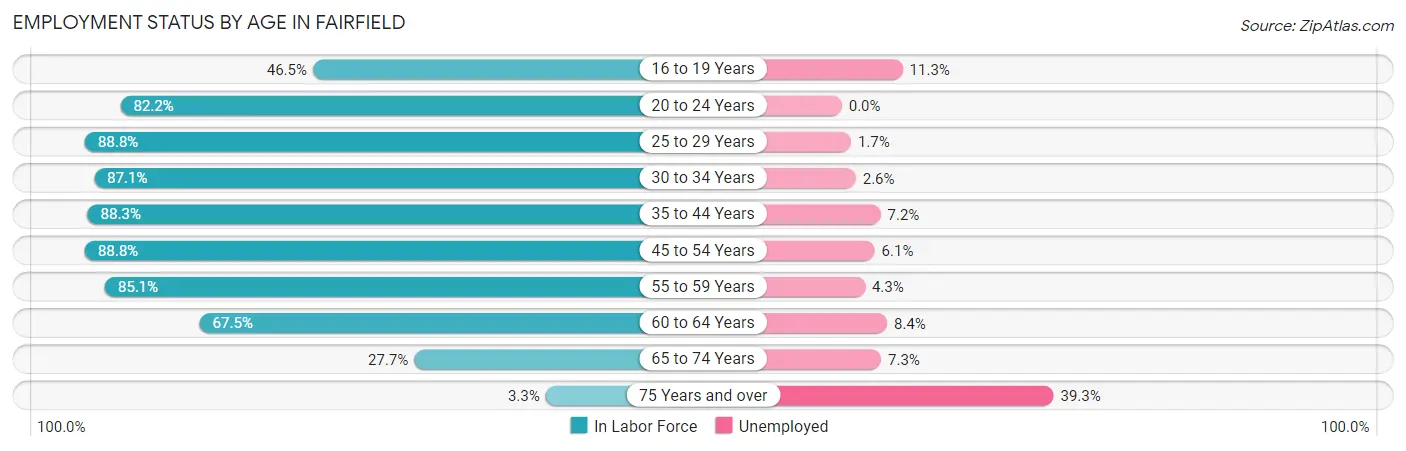
| Age Bracket | In Labor Force | Unemployed |
| 16 to 19 Years | 1,268 (46.5%) | 143 (11.3%) |
| 20 to 24 Years | 2,149 (82.2%) | 0 (0.0%) |
| 25 to 29 Years | 3,104 (88.8%) | 53 (1.7%) |
| 30 to 34 Years | 2,175 (87.1%) | 57 (2.6%) |
| 35 to 44 Years | 4,850 (88.3%) | 349 (7.2%) |
| 45 to 54 Years | 4,381 (88.8%) | 267 (6.1%) |
| 55 to 59 Years | 2,882 (85.1%) | 124 (4.3%) |
| 60 to 64 Years | 2,245 (67.5%) | 189 (8.4%) |
| 65 to 74 Years | 1,181 (27.7%) | 86 (7.3%) |
| 75 Years and over | 107 (3.3%) | 42 (39.3%) |
| Total | 24,327 (67.6%) | 1,314 (5.4%) |
Employment Status by Educational Attainment in Fairfield
According to labor force statistics for Fairfield, 84.9% of individuals (19,639) out of the total population between 25 and 64 years of age (23,132) are in the labor force, with 5.3% or 1,041 of them being unemployed. The group with the highest labor force participation rate are those with the educational attainment of bachelor's degree or higher, with 90.9% or 6,934 individuals in the labor force. Within the labor force, individuals with high school diploma education have the highest percentage of unemployment, with 8.6% or 523 of them being unemployed.
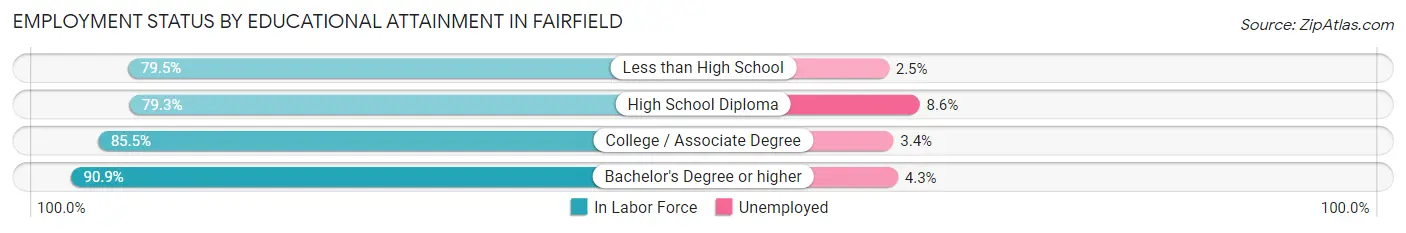
| Educational Attainment | In Labor Force | Unemployed |
| Less than High School | 1,069 (79.5%) | 34 (2.5%) |
| High School Diploma | 6,082 (79.3%) | 660 (8.6%) |
| College / Associate Degree | 5,549 (85.5%) | 221 (3.4%) |
| Bachelor's Degree or higher | 6,934 (90.9%) | 328 (4.3%) |
| Total | 19,639 (84.9%) | 1,226 (5.3%) |
Employment Occupations by Sex in Fairfield
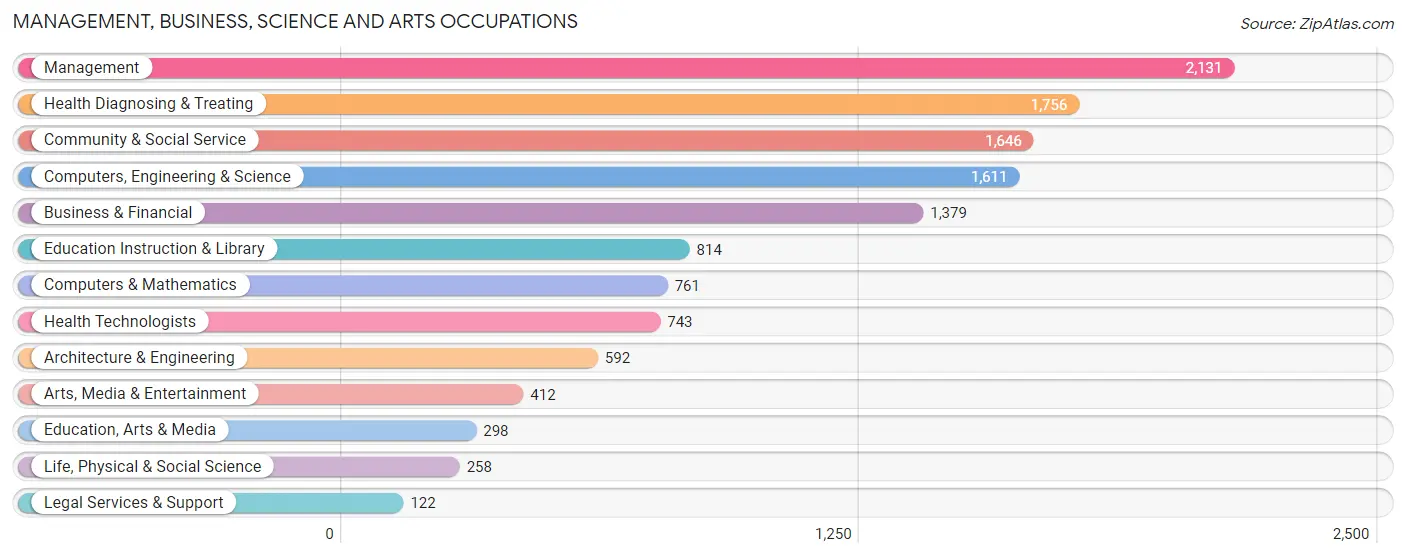
Management, Business, Science and Arts Occupations
The most common Management, Business, Science and Arts occupations in Fairfield are Management (2,131 | 9.3%), Health Diagnosing & Treating (1,756 | 7.6%), Community & Social Service (1,646 | 7.1%), Computers, Engineering & Science (1,611 | 7.0%), and Business & Financial (1,379 | 6.0%).
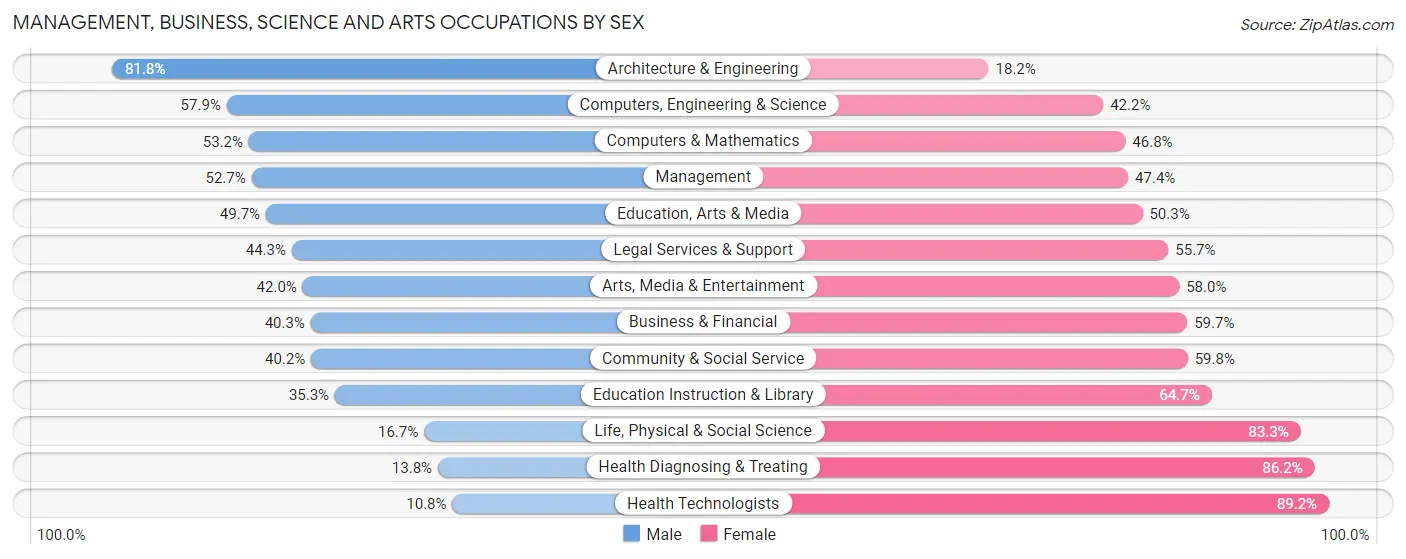
Management, Business, Science and Arts Occupations by Sex
Within the Management, Business, Science and Arts occupations in Fairfield, the most male-oriented occupations are Architecture & Engineering (81.8%), Computers, Engineering & Science (57.9%), and Computers & Mathematics (53.2%), while the most female-oriented occupations are Health Technologists (89.2%), Health Diagnosing & Treating (86.2%), and Life, Physical & Social Science (83.3%).
| Occupation | Male | Female |
| Management | 1,122 (52.6%) | 1,009 (47.3%) |
| Business & Financial | 556 (40.3%) | 823 (59.7%) |
| Computers, Engineering & Science | 932 (57.9%) | 679 (42.1%) |
| Computers & Mathematics | 405 (53.2%) | 356 (46.8%) |
| Architecture & Engineering | 484 (81.8%) | 108 (18.2%) |
| Life, Physical & Social Science | 43 (16.7%) | 215 (83.3%) |
| Community & Social Service | 662 (40.2%) | 984 (59.8%) |
| Education, Arts & Media | 148 (49.7%) | 150 (50.3%) |
| Legal Services & Support | 54 (44.3%) | 68 (55.7%) |
| Education Instruction & Library | 287 (35.3%) | 527 (64.7%) |
| Arts, Media & Entertainment | 173 (42.0%) | 239 (58.0%) |
| Health Diagnosing & Treating | 242 (13.8%) | 1,514 (86.2%) |
| Health Technologists | 80 (10.8%) | 663 (89.2%) |
| Total (Category) | 3,514 (41.2%) | 5,009 (58.8%) |
| Total (Overall) | 11,544 (50.2%) | 11,470 (49.8%) |
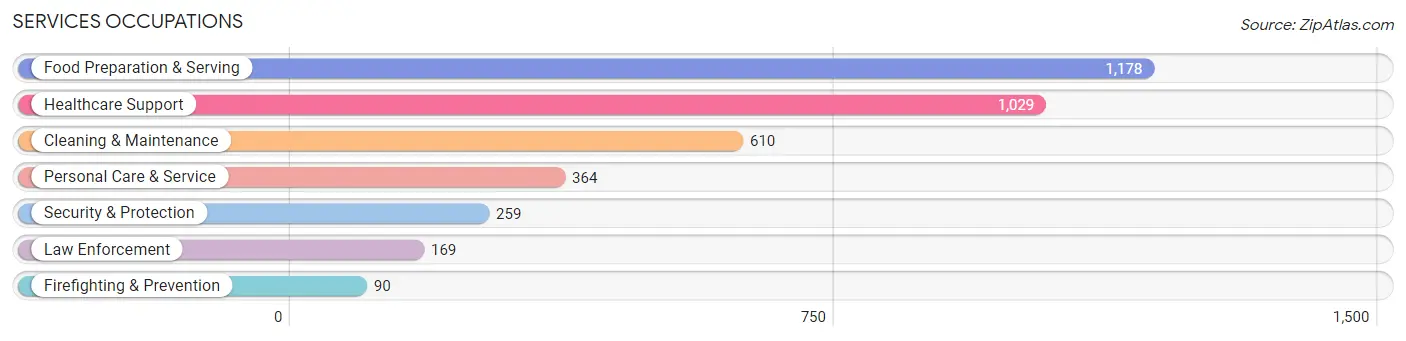
Services Occupations
The most common Services occupations in Fairfield are Food Preparation & Serving (1,178 | 5.1%), Healthcare Support (1,029 | 4.5%), Cleaning & Maintenance (610 | 2.6%), Personal Care & Service (364 | 1.6%), and Security & Protection (259 | 1.1%).
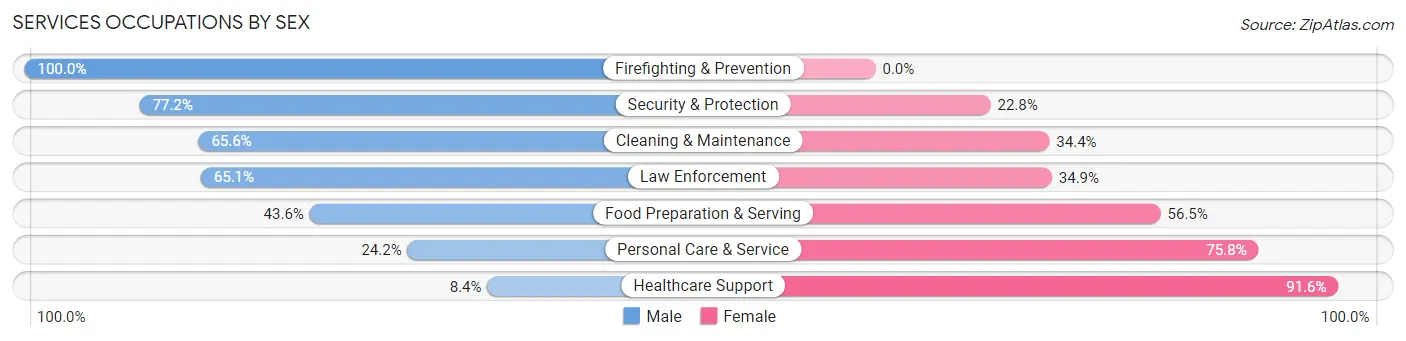
Services Occupations by Sex
Within the Services occupations in Fairfield, the most male-oriented occupations are Firefighting & Prevention (100.0%), Security & Protection (77.2%), and Cleaning & Maintenance (65.6%), while the most female-oriented occupations are Healthcare Support (91.6%), Personal Care & Service (75.8%), and Food Preparation & Serving (56.5%).
| Occupation | Male | Female |
| Healthcare Support | 86 (8.4%) | 943 (91.6%) |
| Security & Protection | 200 (77.2%) | 59 (22.8%) |
| Firefighting & Prevention | 90 (100.0%) | 0 (0.0%) |
| Law Enforcement | 110 (65.1%) | 59 (34.9%) |
| Food Preparation & Serving | 513 (43.5%) | 665 (56.5%) |
| Cleaning & Maintenance | 400 (65.6%) | 210 (34.4%) |
| Personal Care & Service | 88 (24.2%) | 276 (75.8%) |
| Total (Category) | 1,287 (37.4%) | 2,153 (62.6%) |
| Total (Overall) | 11,544 (50.2%) | 11,470 (49.8%) |
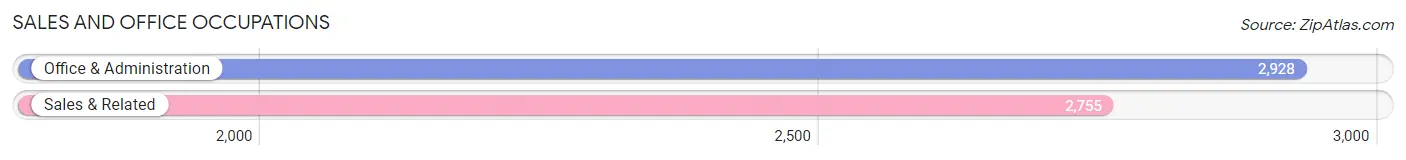
Sales and Office Occupations
The most common Sales and Office occupations in Fairfield are Office & Administration (2,928 | 12.7%), and Sales & Related (2,755 | 12.0%).
Sales and Office Occupations by Sex
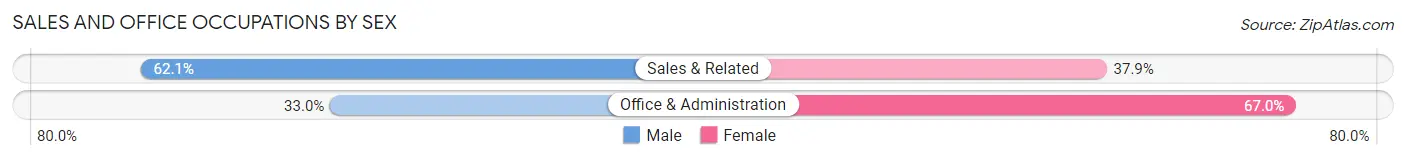
| Occupation | Male | Female |
| Sales & Related | 1,712 (62.1%) | 1,043 (37.9%) |
| Office & Administration | 966 (33.0%) | 1,962 (67.0%) |
| Total (Category) | 2,678 (47.1%) | 3,005 (52.9%) |
| Total (Overall) | 11,544 (50.2%) | 11,470 (49.8%) |
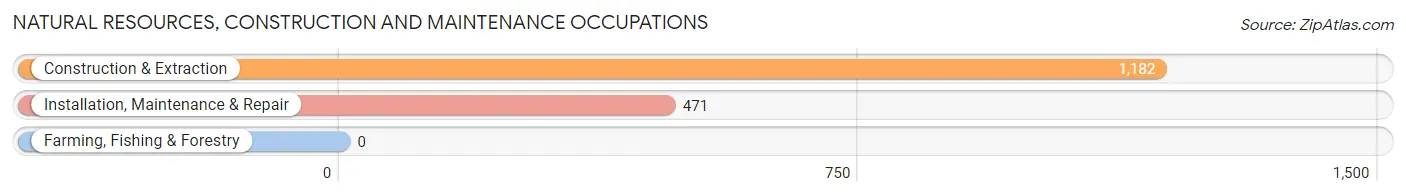
Natural Resources, Construction and Maintenance Occupations
The most common Natural Resources, Construction and Maintenance occupations in Fairfield are Construction & Extraction (1,182 | 5.1%), and Installation, Maintenance & Repair (471 | 2.1%).
Natural Resources, Construction and Maintenance Occupations by Sex
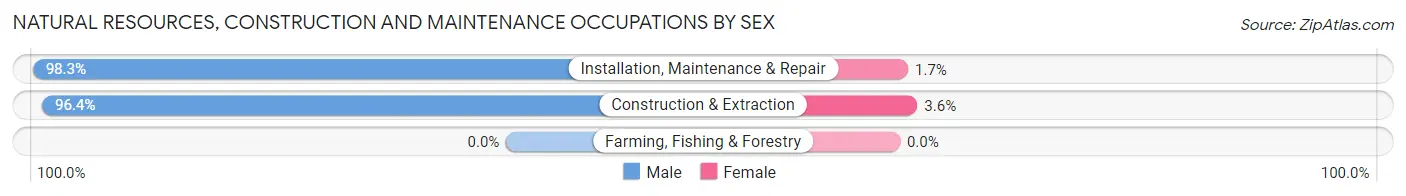
| Occupation | Male | Female |
| Farming, Fishing & Forestry | 0 (0.0%) | 0 (0.0%) |
| Construction & Extraction | 1,139 (96.4%) | 43 (3.6%) |
| Installation, Maintenance & Repair | 463 (98.3%) | 8 (1.7%) |
| Total (Category) | 1,602 (96.9%) | 51 (3.1%) |
| Total (Overall) | 11,544 (50.2%) | 11,470 (49.8%) |
Production, Transportation and Moving Occupations
The most common Production, Transportation and Moving occupations in Fairfield are Production (1,791 | 7.8%), Material Moving (1,247 | 5.4%), and Transportation (677 | 2.9%).
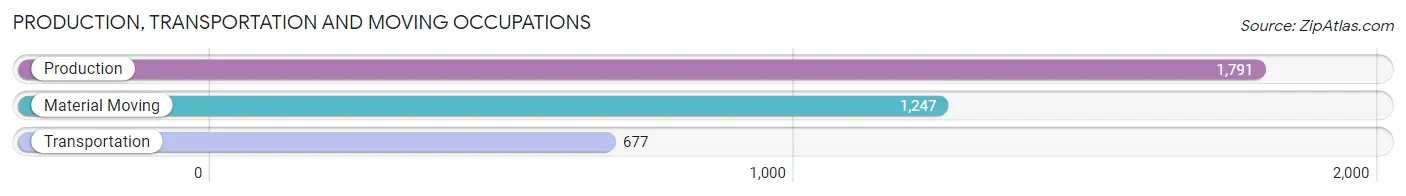
Production, Transportation and Moving Occupations by Sex
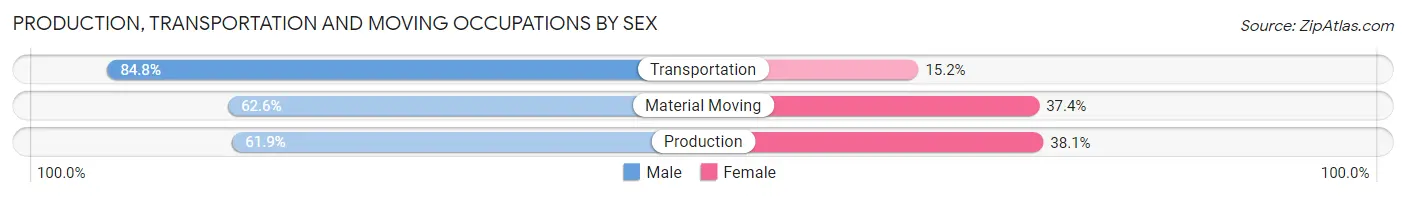
| Occupation | Male | Female |
| Production | 1,108 (61.9%) | 683 (38.1%) |
| Transportation | 574 (84.8%) | 103 (15.2%) |
| Material Moving | 781 (62.6%) | 466 (37.4%) |
| Total (Category) | 2,463 (66.3%) | 1,252 (33.7%) |
| Total (Overall) | 11,544 (50.2%) | 11,470 (49.8%) |
Employment Industries by Sex in Fairfield
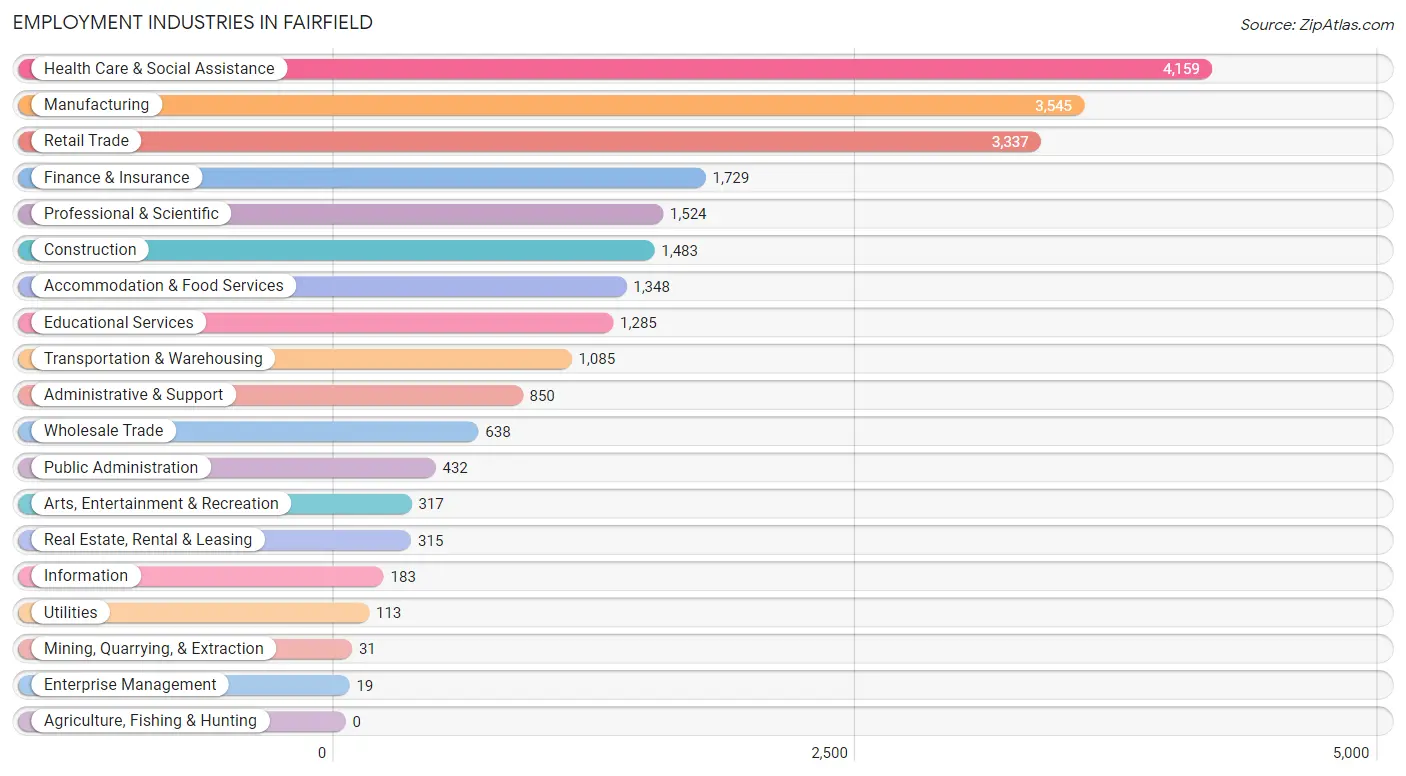
Employment Industries in Fairfield
The major employment industries in Fairfield include Health Care & Social Assistance (4,159 | 18.1%), Manufacturing (3,545 | 15.4%), Retail Trade (3,337 | 14.5%), Finance & Insurance (1,729 | 7.5%), and Professional & Scientific (1,524 | 6.6%).
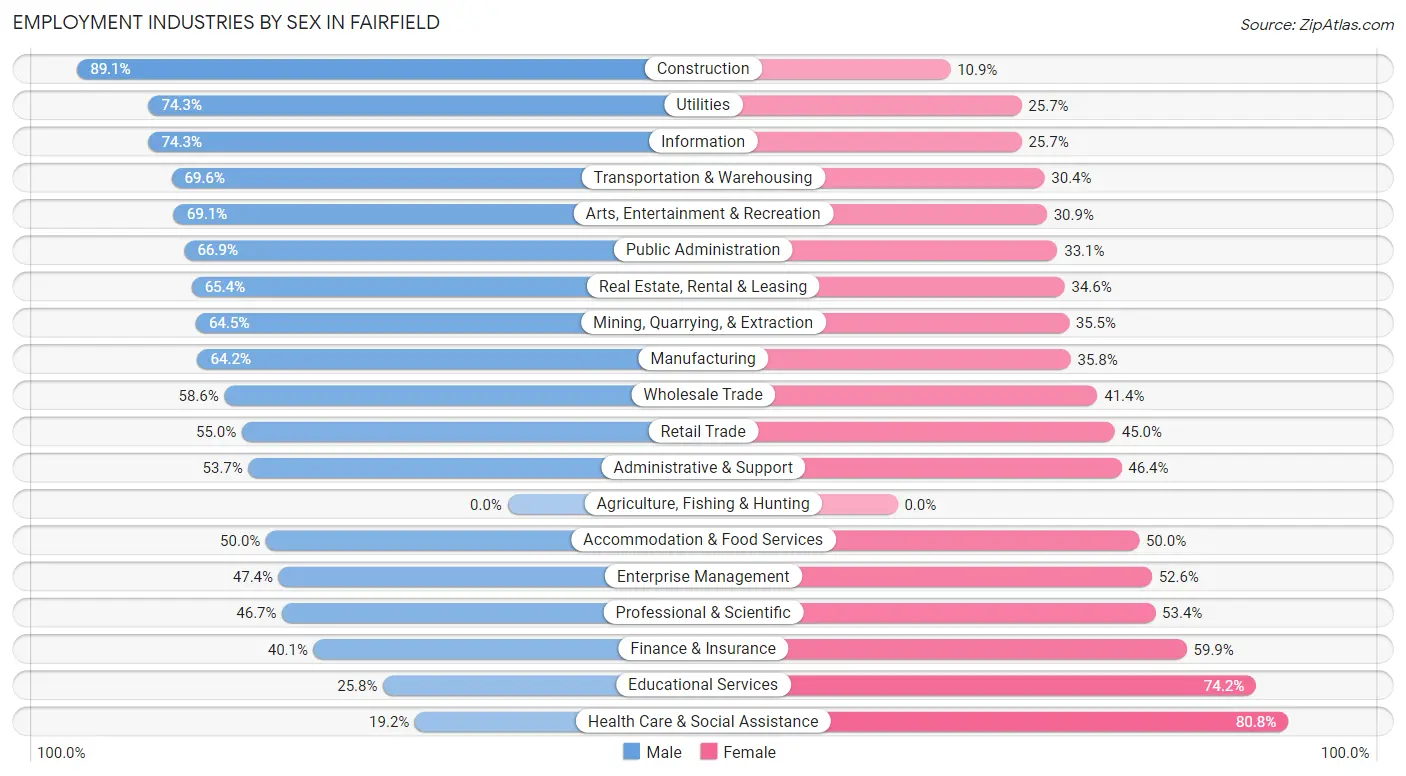
Employment Industries by Sex in Fairfield
The Fairfield industries that see more men than women are Construction (89.1%), Utilities (74.3%), and Information (74.3%), whereas the industries that tend to have a higher number of women are Health Care & Social Assistance (80.8%), Educational Services (74.2%), and Finance & Insurance (59.9%).
| Industry | Male | Female |
| Agriculture, Fishing & Hunting | 0 (0.0%) | 0 (0.0%) |
| Mining, Quarrying, & Extraction | 20 (64.5%) | 11 (35.5%) |
| Construction | 1,321 (89.1%) | 162 (10.9%) |
| Manufacturing | 2,275 (64.2%) | 1,270 (35.8%) |
| Wholesale Trade | 374 (58.6%) | 264 (41.4%) |
| Retail Trade | 1,835 (55.0%) | 1,502 (45.0%) |
| Transportation & Warehousing | 755 (69.6%) | 330 (30.4%) |
| Utilities | 84 (74.3%) | 29 (25.7%) |
| Information | 136 (74.3%) | 47 (25.7%) |
| Finance & Insurance | 694 (40.1%) | 1,035 (59.9%) |
| Real Estate, Rental & Leasing | 206 (65.4%) | 109 (34.6%) |
| Professional & Scientific | 711 (46.7%) | 813 (53.3%) |
| Enterprise Management | 9 (47.4%) | 10 (52.6%) |
| Administrative & Support | 456 (53.6%) | 394 (46.4%) |
| Educational Services | 331 (25.8%) | 954 (74.2%) |
| Health Care & Social Assistance | 797 (19.2%) | 3,362 (80.8%) |
| Arts, Entertainment & Recreation | 219 (69.1%) | 98 (30.9%) |
| Accommodation & Food Services | 674 (50.0%) | 674 (50.0%) |
| Public Administration | 289 (66.9%) | 143 (33.1%) |
| Total | 11,544 (50.2%) | 11,470 (49.8%) |
Education in Fairfield
School Enrollment in Fairfield
The most common levels of schooling among the 10,087 students in Fairfield are high school (2,940 | 29.1%), college / undergraduate (1,933 | 19.2%), and middle school (1,932 | 19.2%).
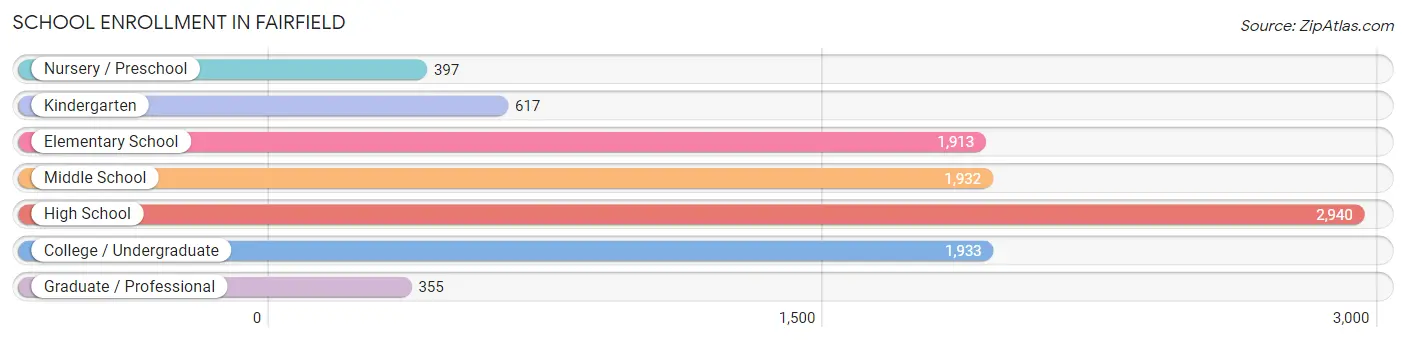
| School Level | # Students | % Students |
| Nursery / Preschool | 397 | 3.9% |
| Kindergarten | 617 | 6.1% |
| Elementary School | 1,913 | 19.0% |
| Middle School | 1,932 | 19.2% |
| High School | 2,940 | 29.1% |
| College / Undergraduate | 1,933 | 19.2% |
| Graduate / Professional | 355 | 3.5% |
| Total | 10,087 | 100.0% |
School Enrollment by Age by Funding Source in Fairfield
Out of a total of 10,087 students who are enrolled in schools in Fairfield, 1,362 (13.5%) attend a private institution, while the remaining 8,725 (86.5%) are enrolled in public schools. The age group of 35 years and over has the highest likelihood of being enrolled in private schools, with 120 (30.8% in the age bracket) enrolled. Conversely, the age group of 18 to 19 year olds has the lowest likelihood of being enrolled in a private school, with 897 (96.4% in the age bracket) attending a public institution.
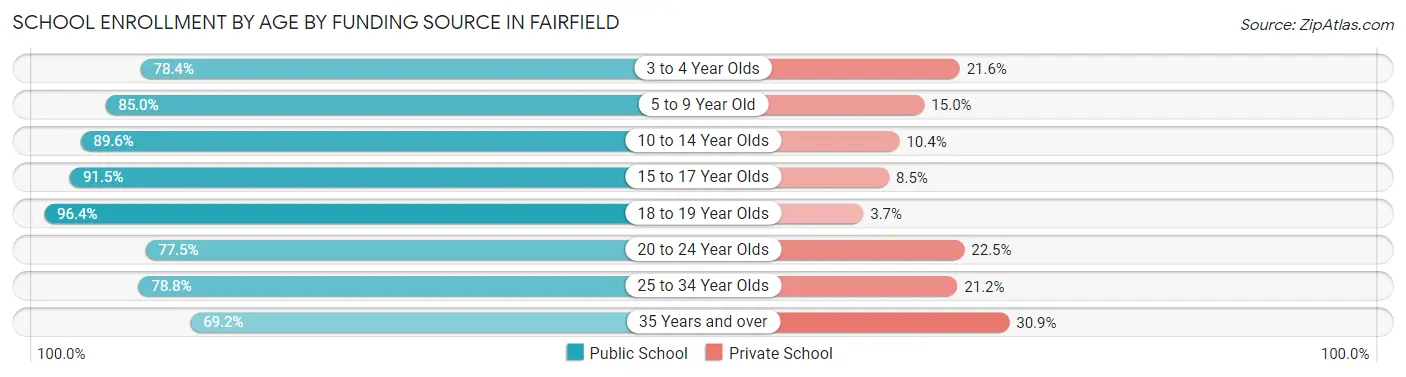
| Age Bracket | Public School | Private School |
| 3 to 4 Year Olds | 301 (78.4%) | 83 (21.6%) |
| 5 to 9 Year Old | 2,067 (85.0%) | 366 (15.0%) |
| 10 to 14 Year Olds | 2,241 (89.6%) | 260 (10.4%) |
| 15 to 17 Year Olds | 1,721 (91.5%) | 159 (8.5%) |
| 18 to 19 Year Olds | 897 (96.4%) | 34 (3.6%) |
| 20 to 24 Year Olds | 638 (77.5%) | 185 (22.5%) |
| 25 to 34 Year Olds | 588 (78.8%) | 158 (21.2%) |
| 35 Years and over | 269 (69.2%) | 120 (30.8%) |
| Total | 8,725 (86.5%) | 1,362 (13.5%) |
Educational Attainment by Field of Study in Fairfield
Business (2,246 | 23.1%), science & technology (1,257 | 12.9%), education (1,126 | 11.6%), liberal arts & history (602 | 6.2%), and bio, nature & agricultural (558 | 5.7%) are the most common fields of study among 9,724 individuals in Fairfield who have obtained a bachelor's degree or higher.
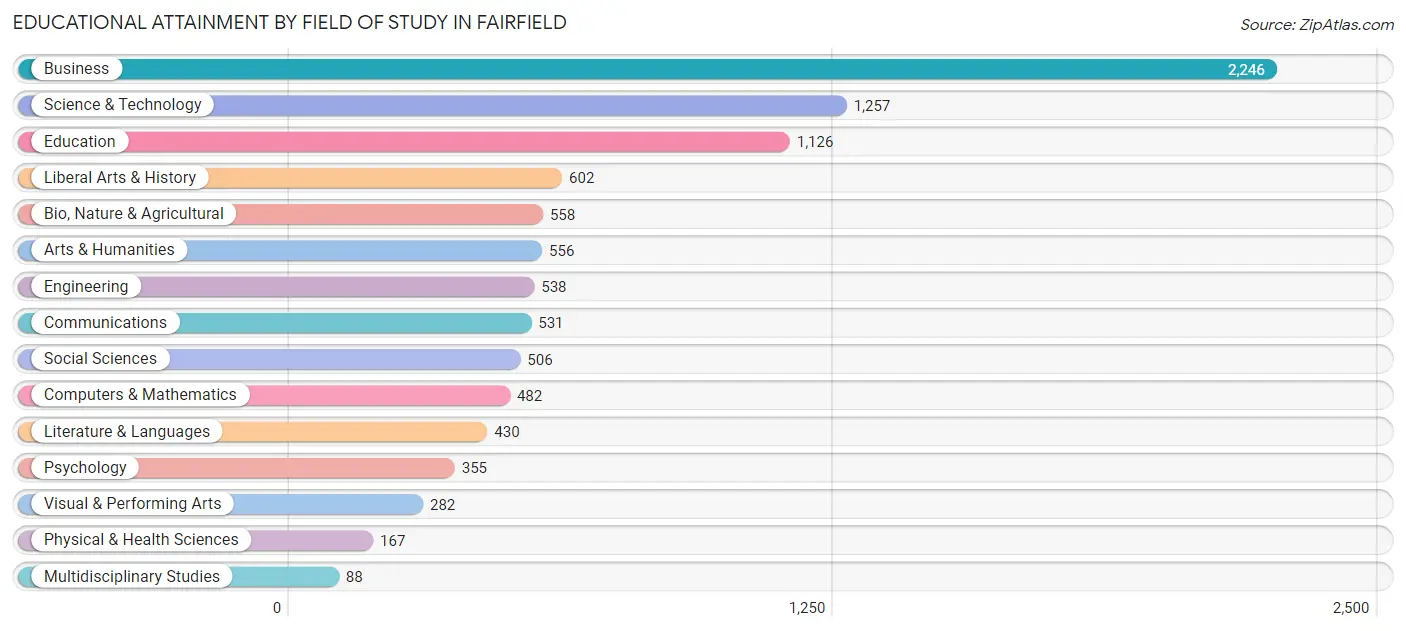
| Field of Study | # Graduates | % Graduates |
| Computers & Mathematics | 482 | 5.0% |
| Bio, Nature & Agricultural | 558 | 5.7% |
| Physical & Health Sciences | 167 | 1.7% |
| Psychology | 355 | 3.6% |
| Social Sciences | 506 | 5.2% |
| Engineering | 538 | 5.5% |
| Multidisciplinary Studies | 88 | 0.9% |
| Science & Technology | 1,257 | 12.9% |
| Business | 2,246 | 23.1% |
| Education | 1,126 | 11.6% |
| Literature & Languages | 430 | 4.4% |
| Liberal Arts & History | 602 | 6.2% |
| Visual & Performing Arts | 282 | 2.9% |
| Communications | 531 | 5.5% |
| Arts & Humanities | 556 | 5.7% |
| Total | 9,724 | 100.0% |
Transportation & Commute in Fairfield
Vehicle Availability by Sex in Fairfield
The most prevalent vehicle ownership categories in Fairfield are males with 2 vehicles (4,823, accounting for 42.2%) and females with 2 vehicles (4,698, making up 42.7%).
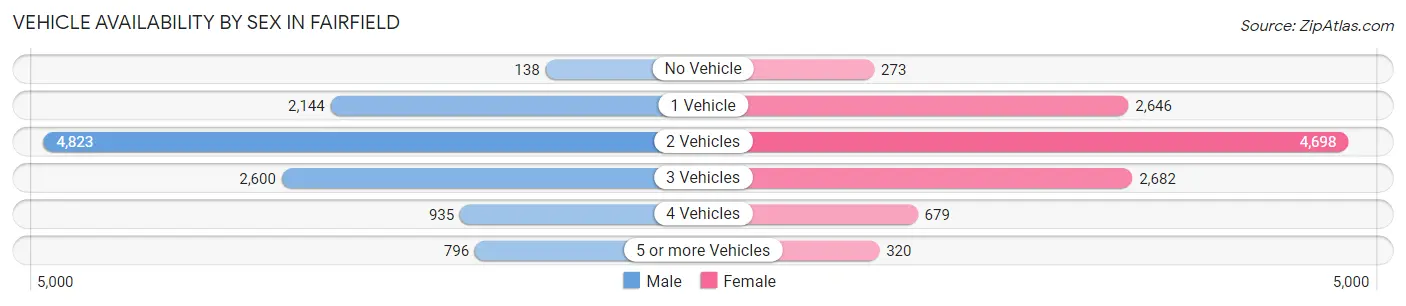
| Vehicles Available | Male | Female |
| No Vehicle | 138 (1.2%) | 273 (2.4%) |
| 1 Vehicle | 2,144 (18.8%) | 2,646 (23.4%) |
| 2 Vehicles | 4,823 (42.2%) | 4,698 (41.6%) |
| 3 Vehicles | 2,600 (22.7%) | 2,682 (23.7%) |
| 4 Vehicles | 935 (8.2%) | 679 (6.0%) |
| 5 or more Vehicles | 796 (7.0%) | 320 (2.8%) |
| Total | 11,436 (100.0%) | 11,298 (100.0%) |
Commute Time in Fairfield
The most frequently occuring commute durations in Fairfield are 20 to 24 minutes (3,456 commuters, 16.4%), 15 to 19 minutes (3,421 commuters, 16.3%), and 10 to 14 minutes (3,388 commuters, 16.1%).
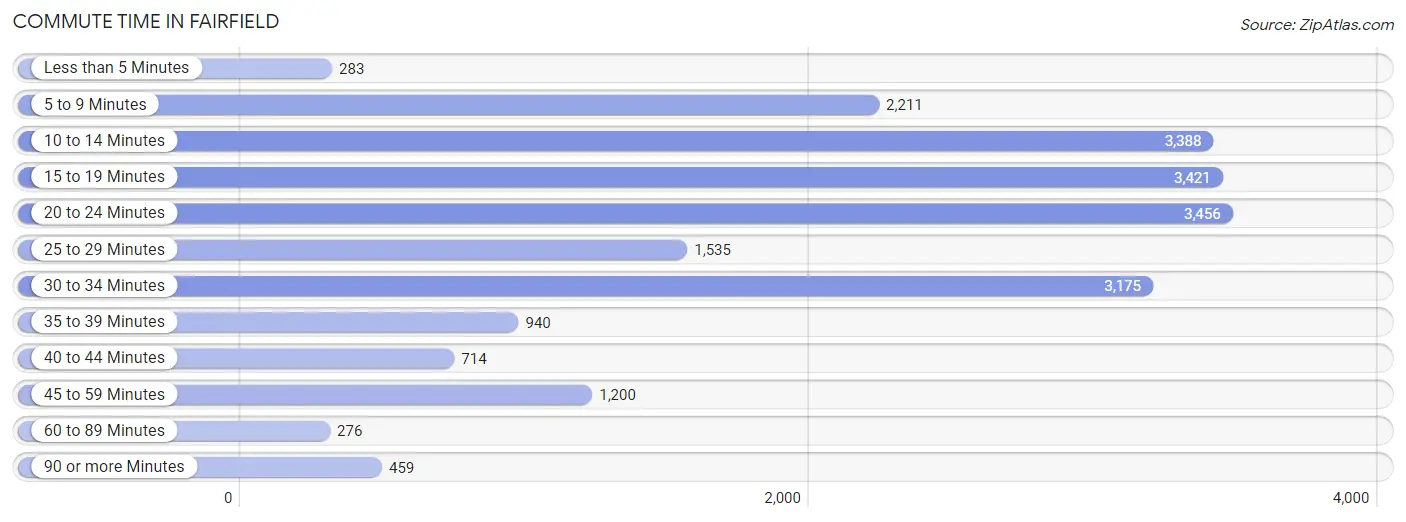
| Commute Time | # Commuters | % Commuters |
| Less than 5 Minutes | 283 | 1.3% |
| 5 to 9 Minutes | 2,211 | 10.5% |
| 10 to 14 Minutes | 3,388 | 16.1% |
| 15 to 19 Minutes | 3,421 | 16.3% |
| 20 to 24 Minutes | 3,456 | 16.4% |
| 25 to 29 Minutes | 1,535 | 7.3% |
| 30 to 34 Minutes | 3,175 | 15.1% |
| 35 to 39 Minutes | 940 | 4.5% |
| 40 to 44 Minutes | 714 | 3.4% |
| 45 to 59 Minutes | 1,200 | 5.7% |
| 60 to 89 Minutes | 276 | 1.3% |
| 90 or more Minutes | 459 | 2.2% |
Commute Time by Sex in Fairfield
The most common commute times in Fairfield are 20 to 24 minutes (2,117 commuters, 19.5%) for males and 10 to 14 minutes (1,931 commuters, 18.9%) for females.
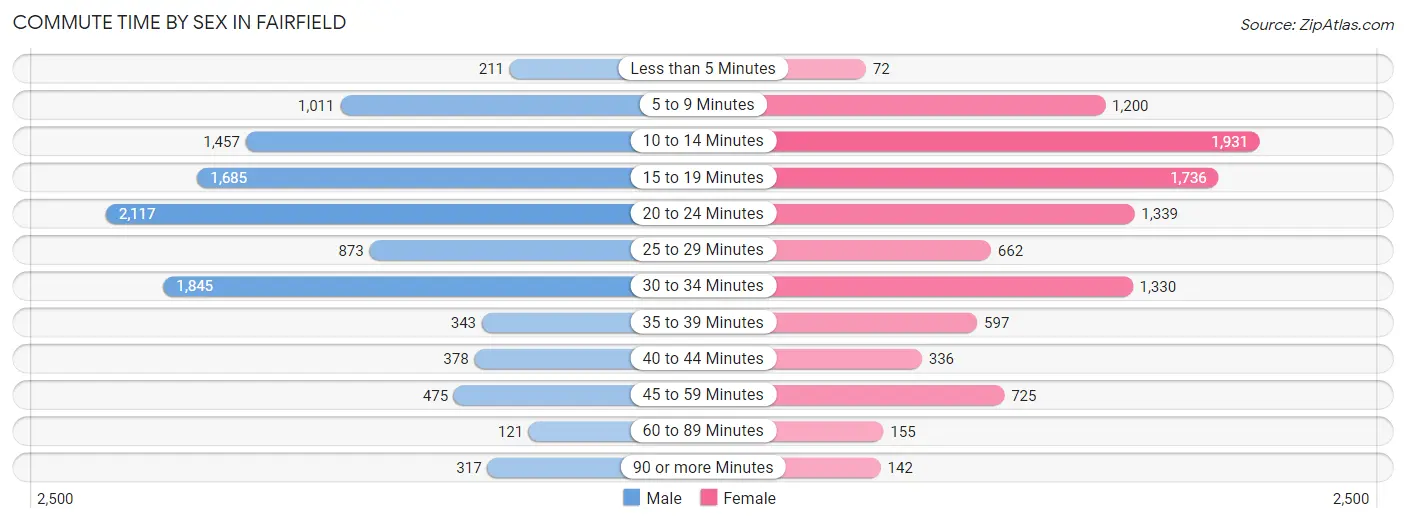
| Commute Time | Male | Female |
| Less than 5 Minutes | 211 (1.9%) | 72 (0.7%) |
| 5 to 9 Minutes | 1,011 (9.3%) | 1,200 (11.7%) |
| 10 to 14 Minutes | 1,457 (13.5%) | 1,931 (18.9%) |
| 15 to 19 Minutes | 1,685 (15.5%) | 1,736 (17.0%) |
| 20 to 24 Minutes | 2,117 (19.5%) | 1,339 (13.1%) |
| 25 to 29 Minutes | 873 (8.1%) | 662 (6.5%) |
| 30 to 34 Minutes | 1,845 (17.0%) | 1,330 (13.0%) |
| 35 to 39 Minutes | 343 (3.2%) | 597 (5.8%) |
| 40 to 44 Minutes | 378 (3.5%) | 336 (3.3%) |
| 45 to 59 Minutes | 475 (4.4%) | 725 (7.1%) |
| 60 to 89 Minutes | 121 (1.1%) | 155 (1.5%) |
| 90 or more Minutes | 317 (2.9%) | 142 (1.4%) |
Time of Departure to Work by Sex in Fairfield
The most frequent times of departure to work in Fairfield are 7:30 AM to 7:59 AM (1,544, 14.2%) for males and 7:00 AM to 7:29 AM (2,275, 22.3%) for females.
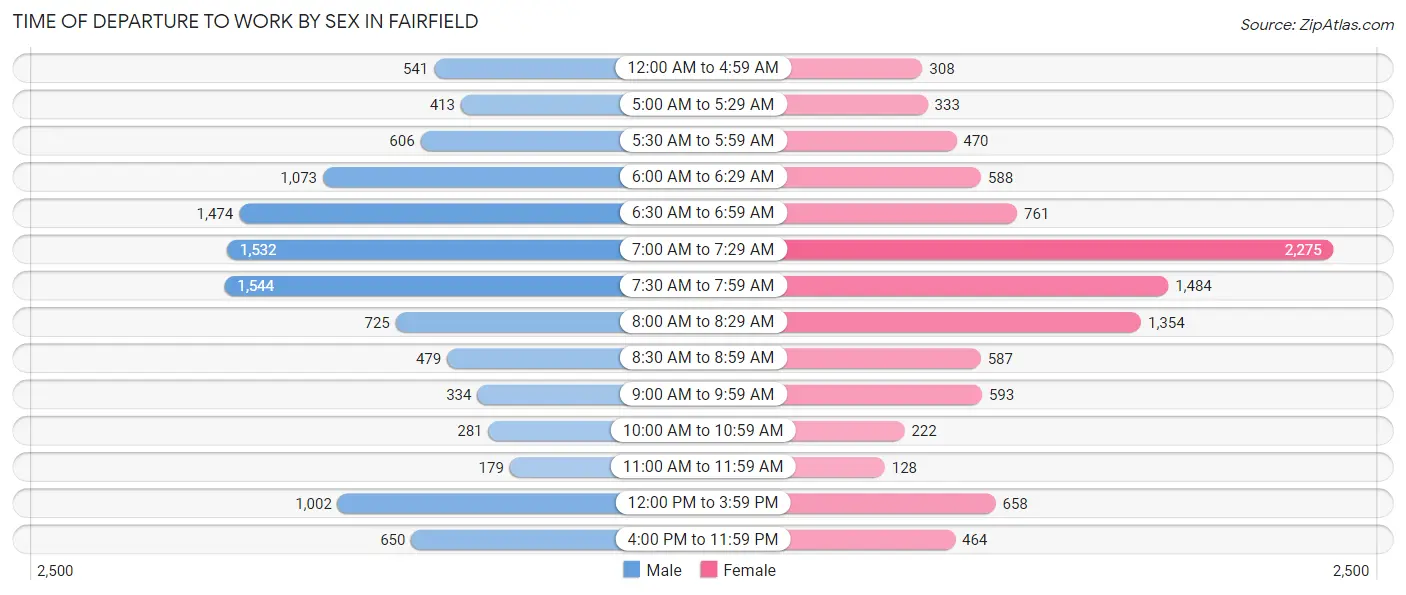
| Time of Departure | Male | Female |
| 12:00 AM to 4:59 AM | 541 (5.0%) | 308 (3.0%) |
| 5:00 AM to 5:29 AM | 413 (3.8%) | 333 (3.3%) |
| 5:30 AM to 5:59 AM | 606 (5.6%) | 470 (4.6%) |
| 6:00 AM to 6:29 AM | 1,073 (9.9%) | 588 (5.8%) |
| 6:30 AM to 6:59 AM | 1,474 (13.6%) | 761 (7.4%) |
| 7:00 AM to 7:29 AM | 1,532 (14.1%) | 2,275 (22.3%) |
| 7:30 AM to 7:59 AM | 1,544 (14.2%) | 1,484 (14.5%) |
| 8:00 AM to 8:29 AM | 725 (6.7%) | 1,354 (13.2%) |
| 8:30 AM to 8:59 AM | 479 (4.4%) | 587 (5.7%) |
| 9:00 AM to 9:59 AM | 334 (3.1%) | 593 (5.8%) |
| 10:00 AM to 10:59 AM | 281 (2.6%) | 222 (2.2%) |
| 11:00 AM to 11:59 AM | 179 (1.7%) | 128 (1.3%) |
| 12:00 PM to 3:59 PM | 1,002 (9.2%) | 658 (6.4%) |
| 4:00 PM to 11:59 PM | 650 (6.0%) | 464 (4.5%) |
| Total | 10,833 (100.0%) | 10,225 (100.0%) |
Housing Occupancy in Fairfield
Occupancy by Ownership in Fairfield
Of the total 18,383 dwellings in Fairfield, owner-occupied units account for 11,655 (63.4%), while renter-occupied units make up 6,728 (36.6%).
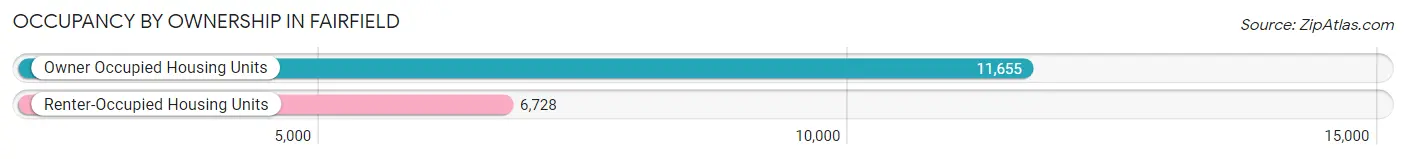
| Occupancy | # Housing Units | % Housing Units |
| Owner Occupied Housing Units | 11,655 | 63.4% |
| Renter-Occupied Housing Units | 6,728 | 36.6% |
| Total Occupied Housing Units | 18,383 | 100.0% |
Occupancy by Household Size in Fairfield
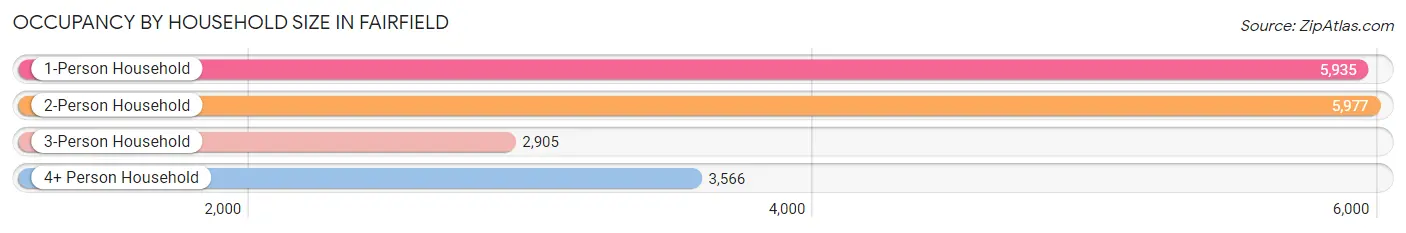
| Household Size | # Housing Units | % Housing Units |
| 1-Person Household | 5,935 | 32.3% |
| 2-Person Household | 5,977 | 32.5% |
| 3-Person Household | 2,905 | 15.8% |
| 4+ Person Household | 3,566 | 19.4% |
| Total Housing Units | 18,383 | 100.0% |
Occupancy by Ownership by Household Size in Fairfield
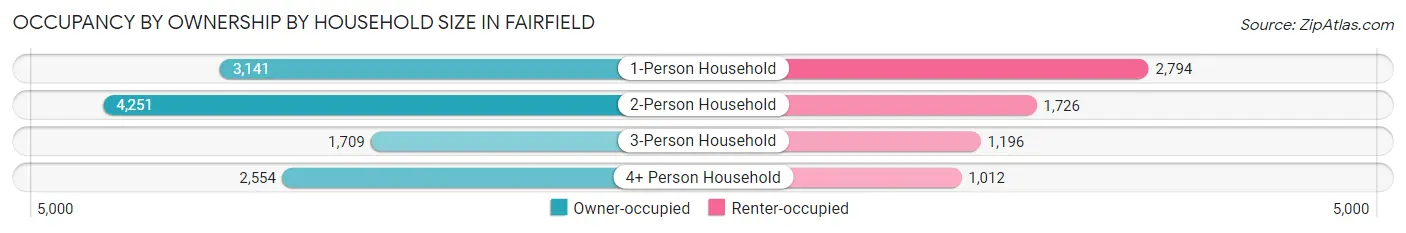
| Household Size | Owner-occupied | Renter-occupied |
| 1-Person Household | 3,141 (52.9%) | 2,794 (47.1%) |
| 2-Person Household | 4,251 (71.1%) | 1,726 (28.9%) |
| 3-Person Household | 1,709 (58.8%) | 1,196 (41.2%) |
| 4+ Person Household | 2,554 (71.6%) | 1,012 (28.4%) |
| Total Housing Units | 11,655 (63.4%) | 6,728 (36.6%) |
Occupancy by Educational Attainment in Fairfield
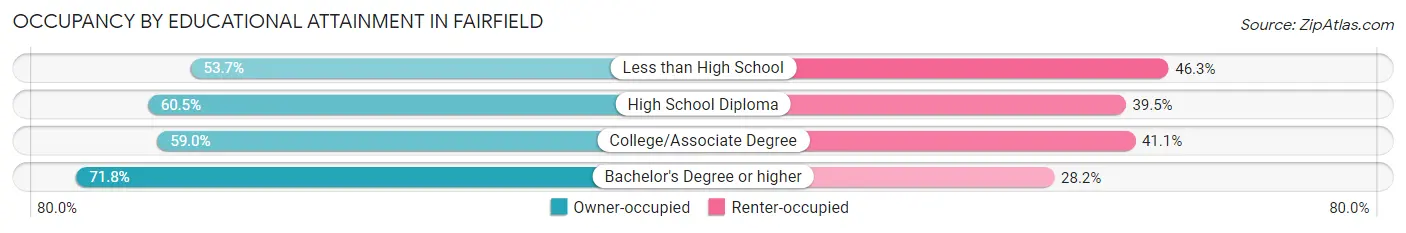
| Household Size | Owner-occupied | Renter-occupied |
| Less than High School | 659 (53.7%) | 569 (46.3%) |
| High School Diploma | 3,253 (60.5%) | 2,127 (39.5%) |
| College/Associate Degree | 3,258 (59.0%) | 2,269 (41.0%) |
| Bachelor's Degree or higher | 4,485 (71.8%) | 1,763 (28.2%) |
Occupancy by Age of Householder in Fairfield
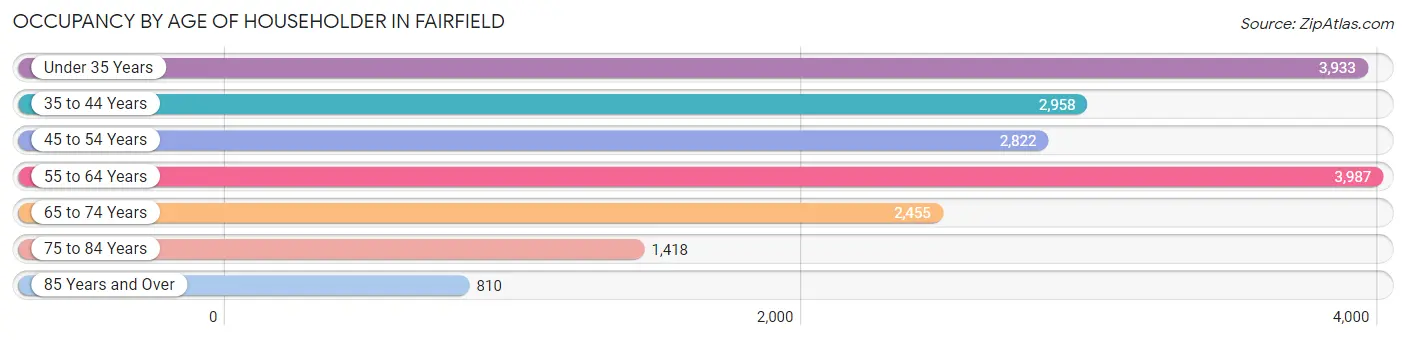
| Age Bracket | # Households | % Households |
| Under 35 Years | 3,933 | 21.4% |
| 35 to 44 Years | 2,958 | 16.1% |
| 45 to 54 Years | 2,822 | 15.3% |
| 55 to 64 Years | 3,987 | 21.7% |
| 65 to 74 Years | 2,455 | 13.4% |
| 75 to 84 Years | 1,418 | 7.7% |
| 85 Years and Over | 810 | 4.4% |
| Total | 18,383 | 100.0% |
Housing Finances in Fairfield
Median Income by Occupancy in Fairfield
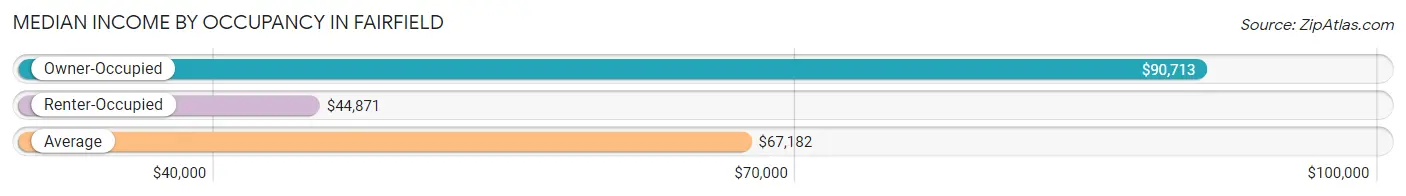
| Occupancy Type | # Households | Median Income |
| Owner-Occupied | 11,655 (63.4%) | $90,713 |
| Renter-Occupied | 6,728 (36.6%) | $44,871 |
| Average | 18,383 (100.0%) | $67,182 |
Occupancy by Householder Income Bracket in Fairfield
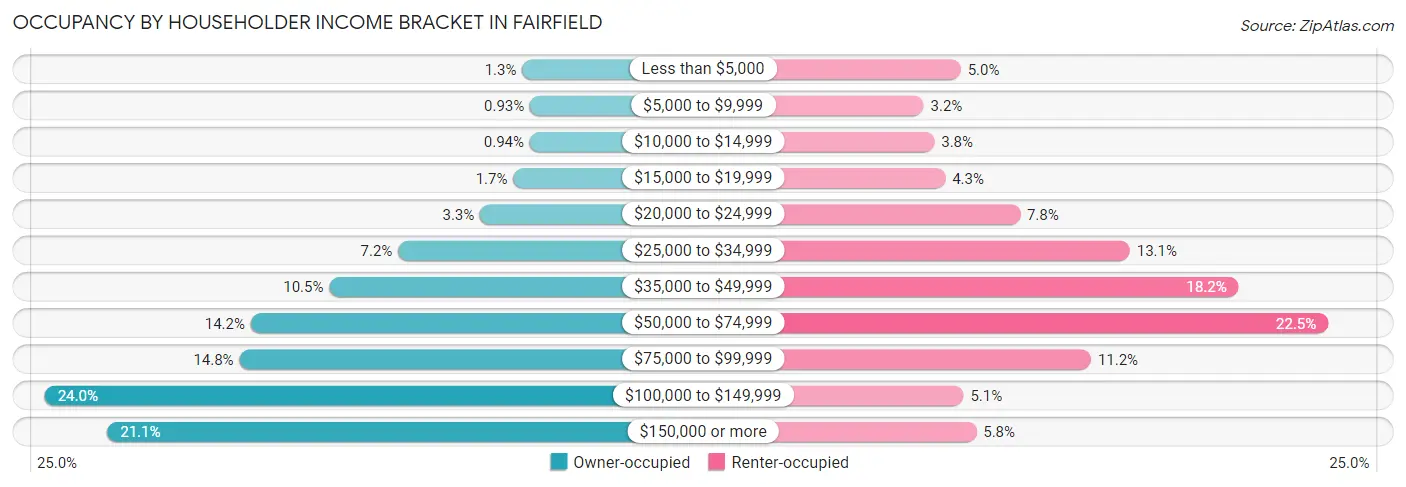
| Income Bracket | Owner-occupied | Renter-occupied |
| Less than $5,000 | 151 (1.3%) | 337 (5.0%) |
| $5,000 to $9,999 | 108 (0.9%) | 218 (3.2%) |
| $10,000 to $14,999 | 109 (0.9%) | 252 (3.7%) |
| $15,000 to $19,999 | 202 (1.7%) | 287 (4.3%) |
| $20,000 to $24,999 | 386 (3.3%) | 527 (7.8%) |
| $25,000 to $34,999 | 840 (7.2%) | 879 (13.1%) |
| $35,000 to $49,999 | 1,223 (10.5%) | 1,227 (18.2%) |
| $50,000 to $74,999 | 1,659 (14.2%) | 1,514 (22.5%) |
| $75,000 to $99,999 | 1,721 (14.8%) | 754 (11.2%) |
| $100,000 to $149,999 | 2,802 (24.0%) | 346 (5.1%) |
| $150,000 or more | 2,454 (21.1%) | 387 (5.8%) |
| Total | 11,655 (100.0%) | 6,728 (100.0%) |
Monthly Housing Cost Tiers in Fairfield
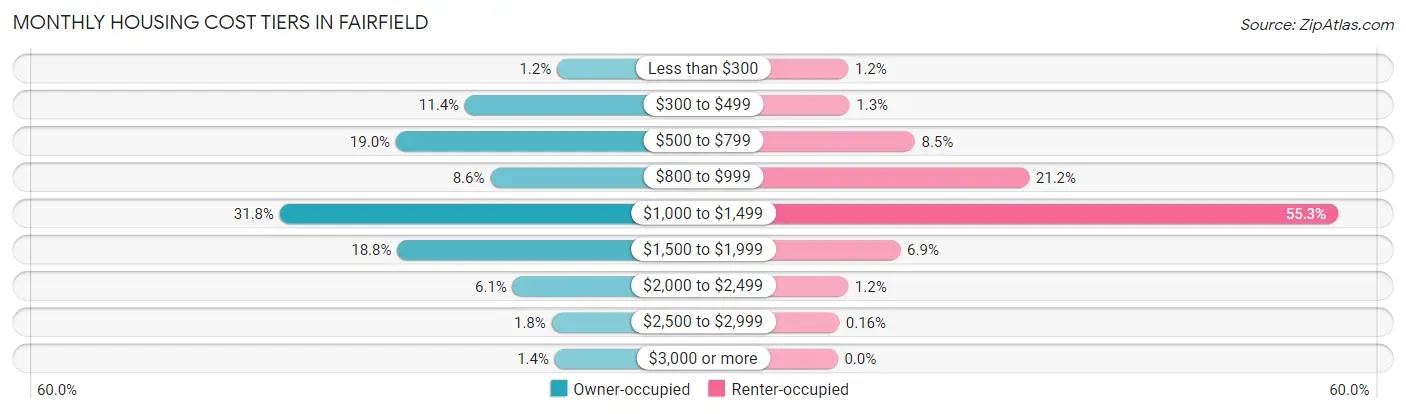
| Monthly Cost | Owner-occupied | Renter-occupied |
| Less than $300 | 137 (1.2%) | 79 (1.2%) |
| $300 to $499 | 1,324 (11.4%) | 89 (1.3%) |
| $500 to $799 | 2,212 (19.0%) | 573 (8.5%) |
| $800 to $999 | 997 (8.6%) | 1,423 (21.1%) |
| $1,000 to $1,499 | 3,706 (31.8%) | 3,719 (55.3%) |
| $1,500 to $1,999 | 2,195 (18.8%) | 466 (6.9%) |
| $2,000 to $2,499 | 709 (6.1%) | 78 (1.2%) |
| $2,500 to $2,999 | 208 (1.8%) | 11 (0.2%) |
| $3,000 or more | 167 (1.4%) | 0 (0.0%) |
| Total | 11,655 (100.0%) | 6,728 (100.0%) |
Physical Housing Characteristics in Fairfield
Housing Structures in Fairfield
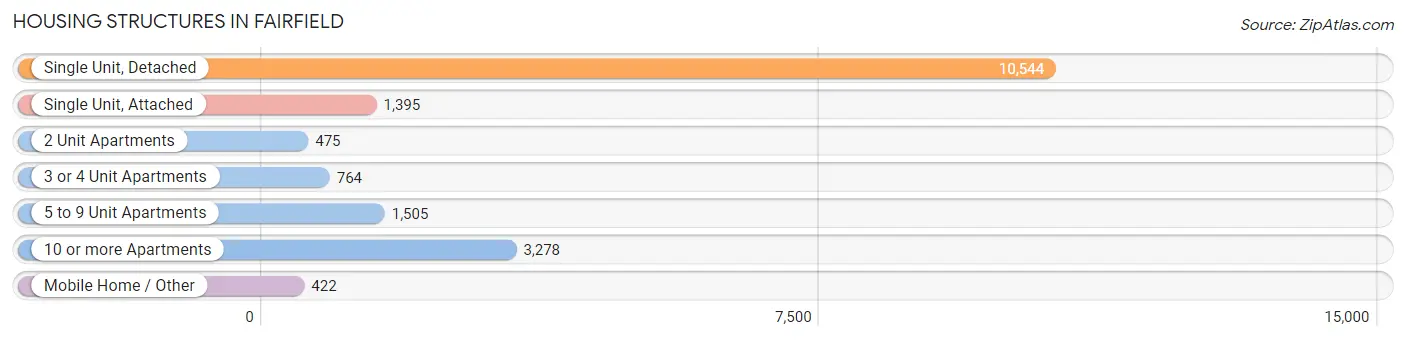
| Structure Type | # Housing Units | % Housing Units |
| Single Unit, Detached | 10,544 | 57.4% |
| Single Unit, Attached | 1,395 | 7.6% |
| 2 Unit Apartments | 475 | 2.6% |
| 3 or 4 Unit Apartments | 764 | 4.2% |
| 5 to 9 Unit Apartments | 1,505 | 8.2% |
| 10 or more Apartments | 3,278 | 17.8% |
| Mobile Home / Other | 422 | 2.3% |
| Total | 18,383 | 100.0% |
Housing Structures by Occupancy in Fairfield
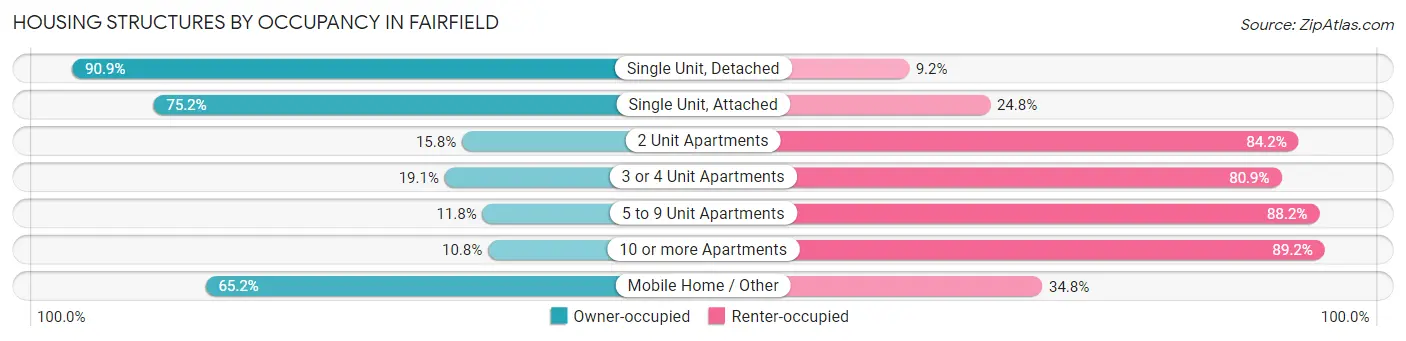
| Structure Type | Owner-occupied | Renter-occupied |
| Single Unit, Detached | 9,579 (90.8%) | 965 (9.1%) |
| Single Unit, Attached | 1,049 (75.2%) | 346 (24.8%) |
| 2 Unit Apartments | 75 (15.8%) | 400 (84.2%) |
| 3 or 4 Unit Apartments | 146 (19.1%) | 618 (80.9%) |
| 5 to 9 Unit Apartments | 178 (11.8%) | 1,327 (88.2%) |
| 10 or more Apartments | 353 (10.8%) | 2,925 (89.2%) |
| Mobile Home / Other | 275 (65.2%) | 147 (34.8%) |
| Total | 11,655 (63.4%) | 6,728 (36.6%) |
Housing Structures by Number of Rooms in Fairfield
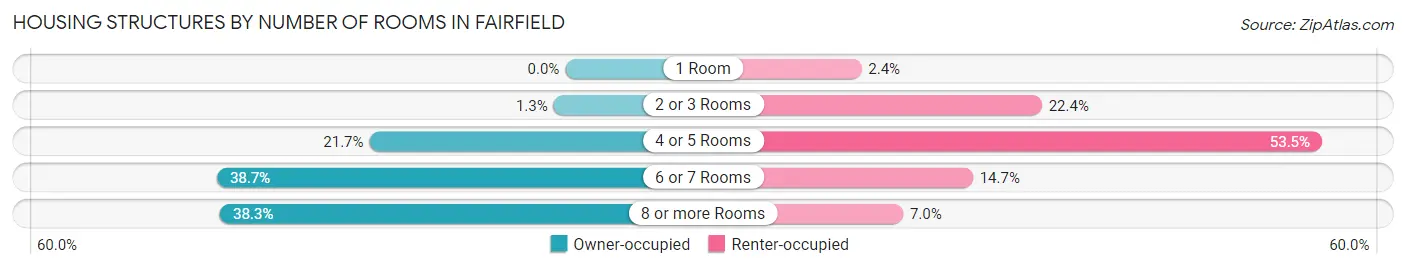
| Number of Rooms | Owner-occupied | Renter-occupied |
| 1 Room | 0 (0.0%) | 160 (2.4%) |
| 2 or 3 Rooms | 152 (1.3%) | 1,507 (22.4%) |
| 4 or 5 Rooms | 2,534 (21.7%) | 3,598 (53.5%) |
| 6 or 7 Rooms | 4,505 (38.7%) | 992 (14.7%) |
| 8 or more Rooms | 4,464 (38.3%) | 471 (7.0%) |
| Total | 11,655 (100.0%) | 6,728 (100.0%) |
Housing Structure by Heating Type in Fairfield
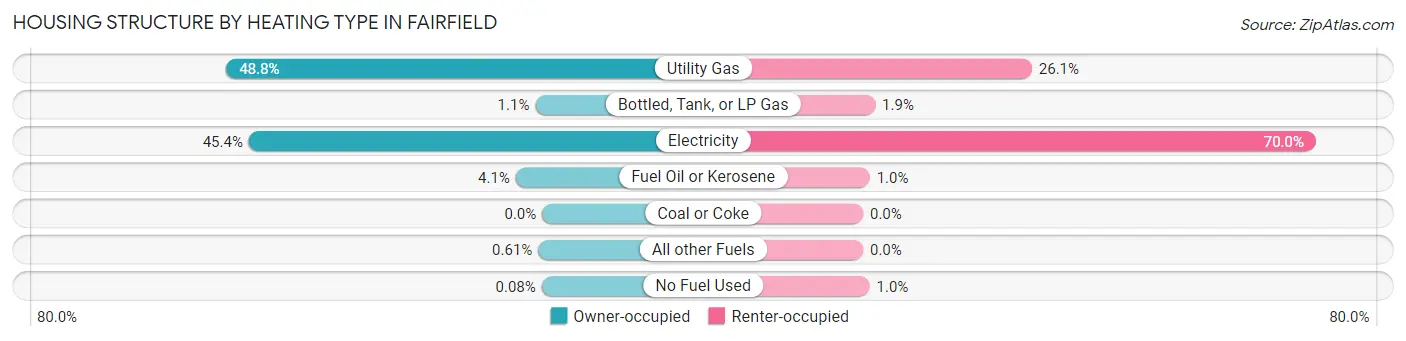
| Heating Type | Owner-occupied | Renter-occupied |
| Utility Gas | 5,691 (48.8%) | 1,756 (26.1%) |
| Bottled, Tank, or LP Gas | 123 (1.1%) | 126 (1.9%) |
| Electricity | 5,286 (45.4%) | 4,709 (70.0%) |
| Fuel Oil or Kerosene | 475 (4.1%) | 69 (1.0%) |
| Coal or Coke | 0 (0.0%) | 0 (0.0%) |
| All other Fuels | 71 (0.6%) | 0 (0.0%) |
| No Fuel Used | 9 (0.1%) | 68 (1.0%) |
| Total | 11,655 (100.0%) | 6,728 (100.0%) |
Household Vehicle Usage in Fairfield
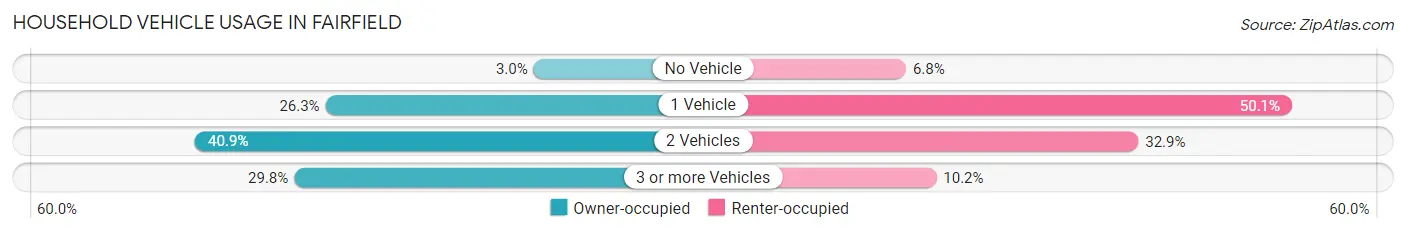
| Vehicles per Household | Owner-occupied | Renter-occupied |
| No Vehicle | 349 (3.0%) | 460 (6.8%) |
| 1 Vehicle | 3,065 (26.3%) | 3,368 (50.1%) |
| 2 Vehicles | 4,767 (40.9%) | 2,211 (32.9%) |
| 3 or more Vehicles | 3,474 (29.8%) | 689 (10.2%) |
| Total | 11,655 (100.0%) | 6,728 (100.0%) |
Real Estate & Mortgages in Fairfield
Real Estate and Mortgage Overview in Fairfield
| Characteristic | Without Mortgage | With Mortgage |
| Housing Units | 3,831 | 7,824 |
| Median Property Value | $180,200 | $204,600 |
| Median Household Income | $64,205 | $2,052 |
| Monthly Housing Costs | $556 | $167 |
| Real Estate Taxes | $2,392 | $113 |
Property Value by Mortgage Status in Fairfield
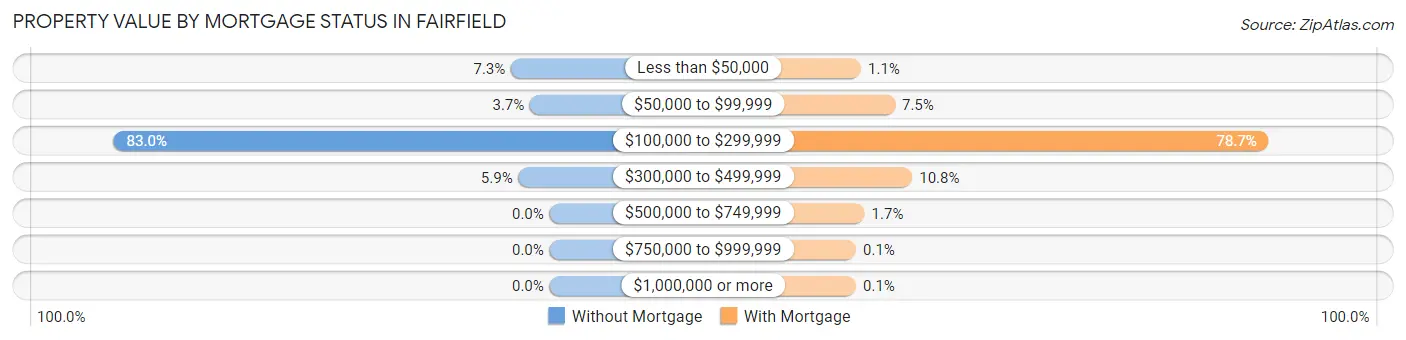
| Property Value | Without Mortgage | With Mortgage |
| Less than $50,000 | 281 (7.3%) | 82 (1.1%) |
| $50,000 to $99,999 | 142 (3.7%) | 588 (7.5%) |
| $100,000 to $299,999 | 3,181 (83.0%) | 6,156 (78.7%) |
| $300,000 to $499,999 | 227 (5.9%) | 846 (10.8%) |
| $500,000 to $749,999 | 0 (0.0%) | 136 (1.7%) |
| $750,000 to $999,999 | 0 (0.0%) | 8 (0.1%) |
| $1,000,000 or more | 0 (0.0%) | 8 (0.1%) |
| Total | 3,831 (100.0%) | 7,824 (100.0%) |
Household Income by Mortgage Status in Fairfield
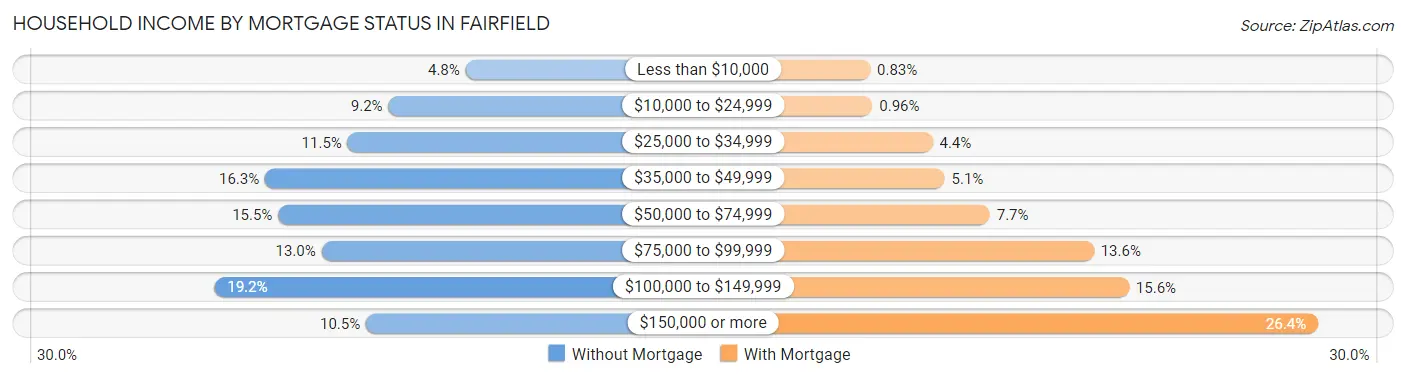
| Household Income | Without Mortgage | With Mortgage |
| Less than $10,000 | 184 (4.8%) | 65 (0.8%) |
| $10,000 to $24,999 | 353 (9.2%) | 75 (1.0%) |
| $25,000 to $34,999 | 442 (11.5%) | 344 (4.4%) |
| $35,000 to $49,999 | 623 (16.3%) | 398 (5.1%) |
| $50,000 to $74,999 | 594 (15.5%) | 600 (7.7%) |
| $75,000 to $99,999 | 499 (13.0%) | 1,065 (13.6%) |
| $100,000 to $149,999 | 734 (19.2%) | 1,222 (15.6%) |
| $150,000 or more | 402 (10.5%) | 2,068 (26.4%) |
| Total | 3,831 (100.0%) | 7,824 (100.0%) |
Property Value to Household Income Ratio in Fairfield
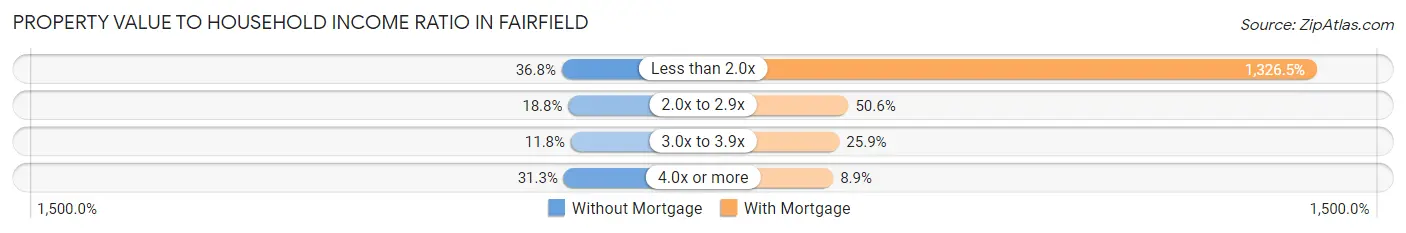
| Value-to-Income Ratio | Without Mortgage | With Mortgage |
| Less than 2.0x | 1,409 (36.8%) | 103,787 (1,326.5%) |
| 2.0x to 2.9x | 720 (18.8%) | 3,961 (50.6%) |
| 3.0x to 3.9x | 453 (11.8%) | 2,023 (25.9%) |
| 4.0x or more | 1,197 (31.2%) | 696 (8.9%) |
| Total | 3,831 (100.0%) | 7,824 (100.0%) |
Real Estate Taxes by Mortgage Status in Fairfield
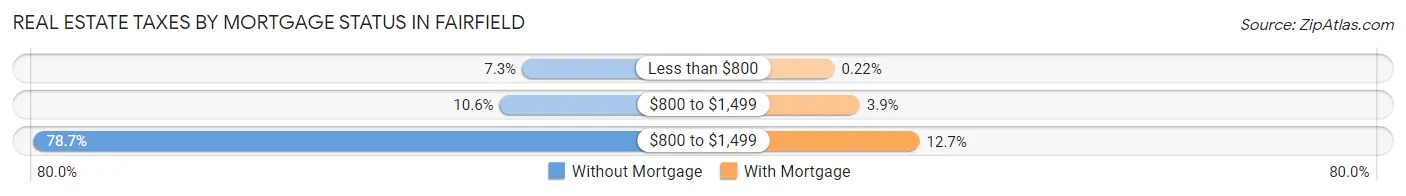
| Property Taxes | Without Mortgage | With Mortgage |
| Less than $800 | 281 (7.3%) | 17 (0.2%) |
| $800 to $1,499 | 407 (10.6%) | 306 (3.9%) |
| $800 to $1,499 | 3,014 (78.7%) | 990 (12.7%) |
| Total | 3,831 (100.0%) | 7,824 (100.0%) |
Health & Disability in Fairfield
Health Insurance Coverage by Age in Fairfield
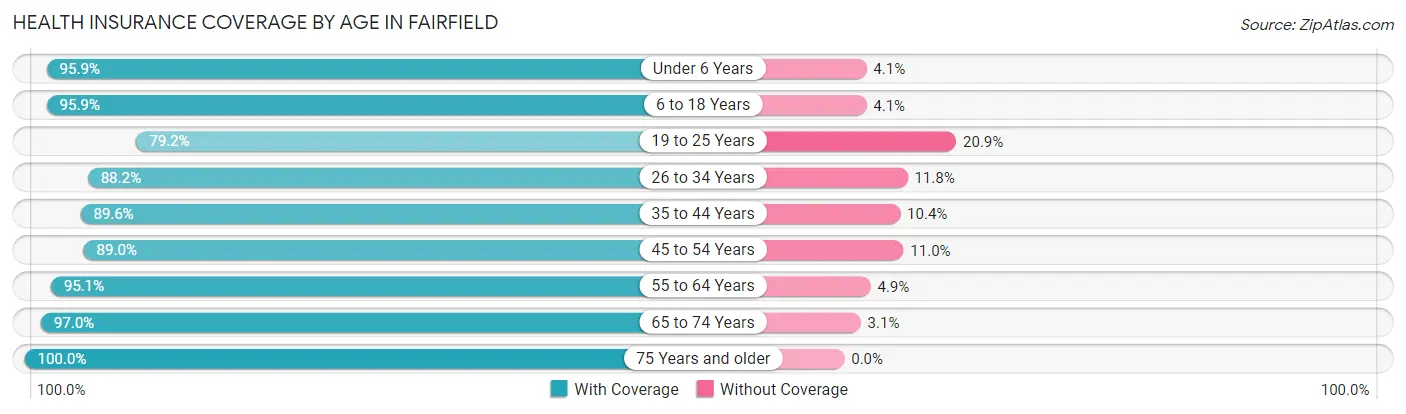
| Age Bracket | With Coverage | Without Coverage |
| Under 6 Years | 3,308 (95.9%) | 142 (4.1%) |
| 6 to 18 Years | 6,992 (95.9%) | 300 (4.1%) |
| 19 to 25 Years | 3,188 (79.1%) | 840 (20.8%) |
| 26 to 34 Years | 4,539 (88.2%) | 606 (11.8%) |
| 35 to 44 Years | 4,907 (89.6%) | 571 (10.4%) |
| 45 to 54 Years | 4,385 (89.0%) | 543 (11.0%) |
| 55 to 64 Years | 6,346 (95.1%) | 326 (4.9%) |
| 65 to 74 Years | 4,042 (97.0%) | 127 (3.0%) |
| 75 Years and older | 2,955 (100.0%) | 0 (0.0%) |
| Total | 40,662 (92.2%) | 3,455 (7.8%) |
Health Insurance Coverage by Citizenship Status in Fairfield
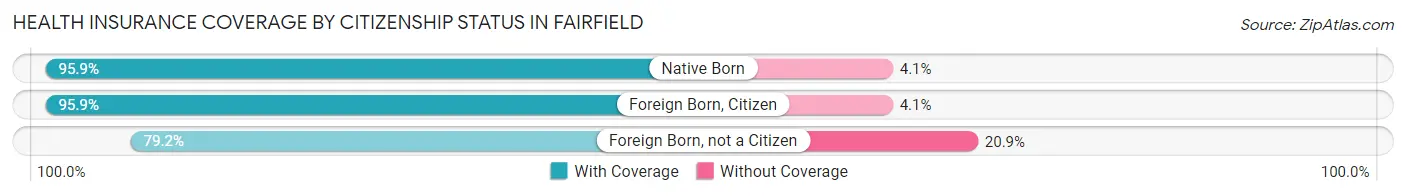
| Citizenship Status | With Coverage | Without Coverage |
| Native Born | 3,308 (95.9%) | 142 (4.1%) |
| Foreign Born, Citizen | 6,992 (95.9%) | 300 (4.1%) |
| Foreign Born, not a Citizen | 3,188 (79.1%) | 840 (20.8%) |
Health Insurance Coverage by Household Income in Fairfield
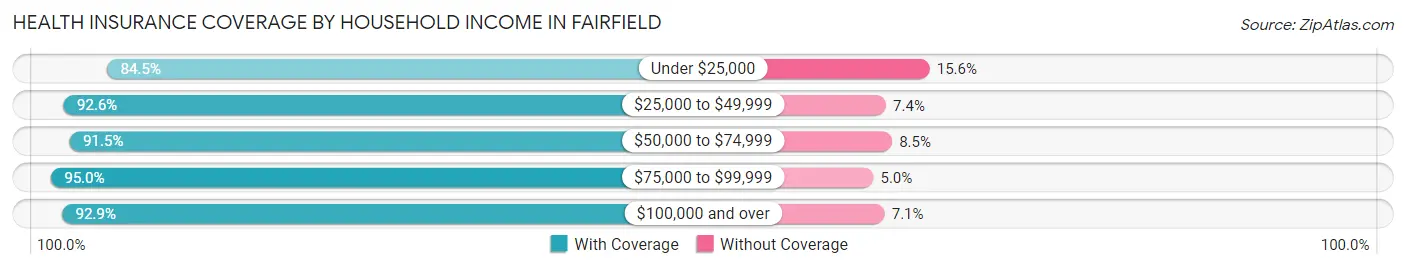
| Household Income | With Coverage | Without Coverage |
| Under $25,000 | 3,411 (84.5%) | 628 (15.5%) |
| $25,000 to $49,999 | 6,698 (92.6%) | 533 (7.4%) |
| $50,000 to $74,999 | 6,952 (91.5%) | 647 (8.5%) |
| $75,000 to $99,999 | 6,729 (95.0%) | 355 (5.0%) |
| $100,000 and over | 16,784 (92.9%) | 1,287 (7.1%) |
Public vs Private Health Insurance Coverage by Age in Fairfield
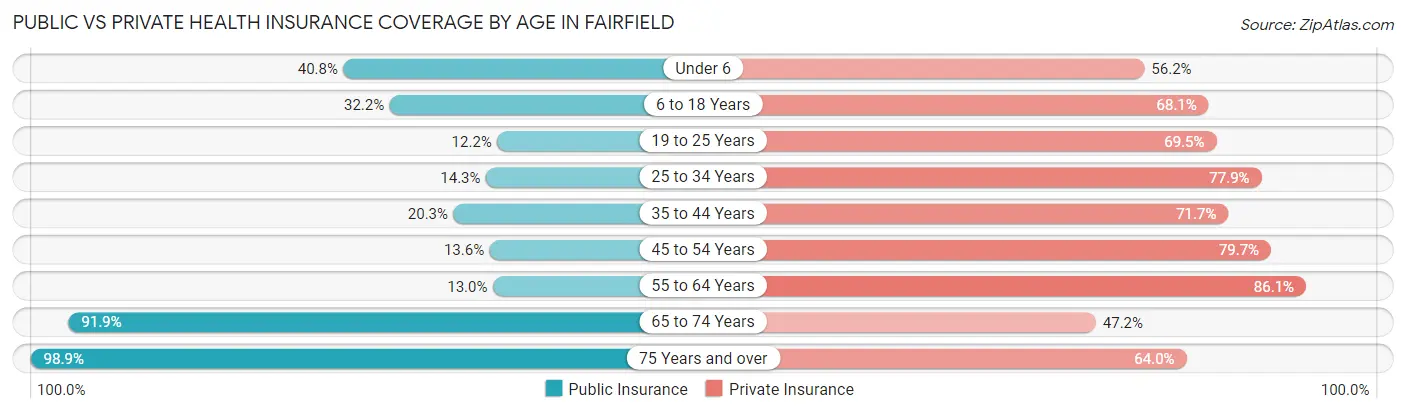
| Age Bracket | Public Insurance | Private Insurance |
| Under 6 | 1,406 (40.7%) | 1,938 (56.2%) |
| 6 to 18 Years | 2,345 (32.2%) | 4,965 (68.1%) |
| 19 to 25 Years | 491 (12.2%) | 2,800 (69.5%) |
| 25 to 34 Years | 735 (14.3%) | 4,007 (77.9%) |
| 35 to 44 Years | 1,113 (20.3%) | 3,929 (71.7%) |
| 45 to 54 Years | 671 (13.6%) | 3,925 (79.6%) |
| 55 to 64 Years | 868 (13.0%) | 5,747 (86.1%) |
| 65 to 74 Years | 3,830 (91.9%) | 1,966 (47.2%) |
| 75 Years and over | 2,922 (98.9%) | 1,890 (64.0%) |
| Total | 14,381 (32.6%) | 31,167 (70.7%) |
Disability Status by Sex by Age in Fairfield
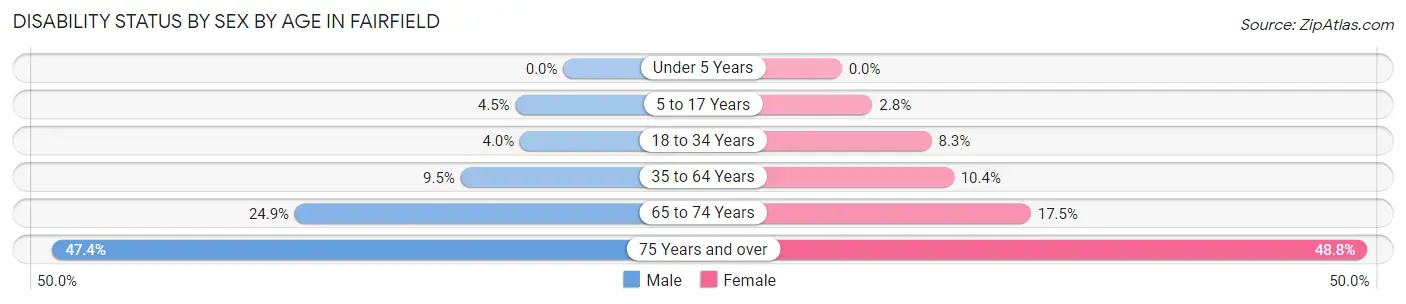
| Age Bracket | Male | Female |
| Under 5 Years | 0 (0.0%) | 0 (0.0%) |
| 5 to 17 Years | 153 (4.4%) | 100 (2.8%) |
| 18 to 34 Years | 201 (4.0%) | 415 (8.3%) |
| 35 to 64 Years | 780 (9.5%) | 924 (10.4%) |
| 65 to 74 Years | 476 (24.9%) | 396 (17.5%) |
| 75 Years and over | 550 (47.4%) | 875 (48.7%) |
Disability Class by Sex by Age in Fairfield
Disability Class: Hearing Difficulty
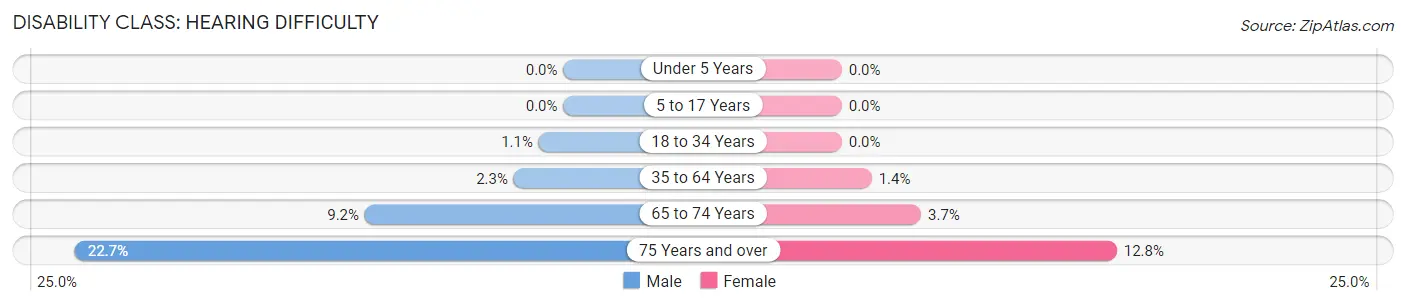
| Age Bracket | Male | Female |
| Under 5 Years | 0 (0.0%) | 0 (0.0%) |
| 5 to 17 Years | 0 (0.0%) | 0 (0.0%) |
| 18 to 34 Years | 57 (1.1%) | 0 (0.0%) |
| 35 to 64 Years | 188 (2.3%) | 124 (1.4%) |
| 65 to 74 Years | 176 (9.2%) | 83 (3.7%) |
| 75 Years and over | 263 (22.7%) | 229 (12.8%) |
Disability Class: Vision Difficulty
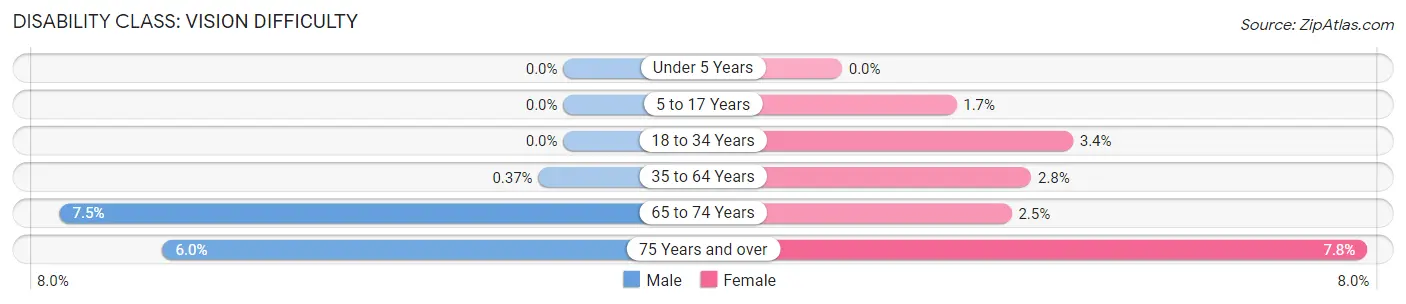
| Age Bracket | Male | Female |
| Under 5 Years | 0 (0.0%) | 0 (0.0%) |
| 5 to 17 Years | 0 (0.0%) | 60 (1.7%) |
| 18 to 34 Years | 0 (0.0%) | 171 (3.4%) |
| 35 to 64 Years | 30 (0.4%) | 250 (2.8%) |
| 65 to 74 Years | 143 (7.5%) | 57 (2.5%) |
| 75 Years and over | 69 (5.9%) | 140 (7.8%) |
Disability Class: Cognitive Difficulty
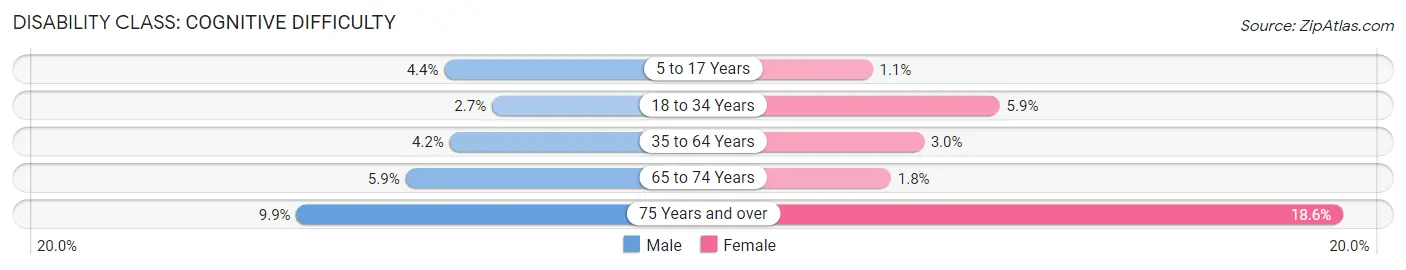
| Age Bracket | Male | Female |
| 5 to 17 Years | 152 (4.4%) | 40 (1.1%) |
| 18 to 34 Years | 133 (2.6%) | 292 (5.9%) |
| 35 to 64 Years | 345 (4.2%) | 270 (3.0%) |
| 65 to 74 Years | 112 (5.9%) | 41 (1.8%) |
| 75 Years and over | 115 (9.9%) | 334 (18.6%) |
Disability Class: Ambulatory Difficulty
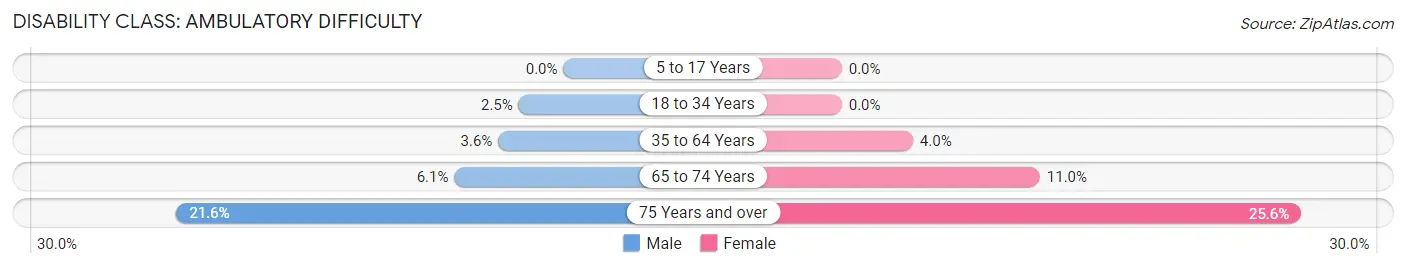
| Age Bracket | Male | Female |
| 5 to 17 Years | 0 (0.0%) | 0 (0.0%) |
| 18 to 34 Years | 125 (2.5%) | 0 (0.0%) |
| 35 to 64 Years | 297 (3.6%) | 352 (4.0%) |
| 65 to 74 Years | 116 (6.1%) | 249 (11.0%) |
| 75 Years and over | 250 (21.5%) | 459 (25.6%) |
Disability Class: Self-Care Difficulty
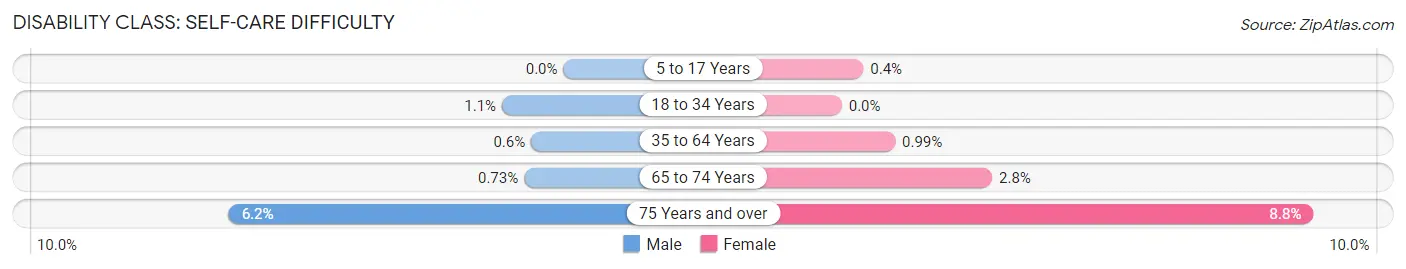
| Age Bracket | Male | Female |
| 5 to 17 Years | 0 (0.0%) | 14 (0.4%) |
| 18 to 34 Years | 57 (1.1%) | 0 (0.0%) |
| 35 to 64 Years | 49 (0.6%) | 88 (1.0%) |
| 65 to 74 Years | 14 (0.7%) | 63 (2.8%) |
| 75 Years and over | 72 (6.2%) | 157 (8.7%) |
Technology Access in Fairfield
Computing Device Access in Fairfield
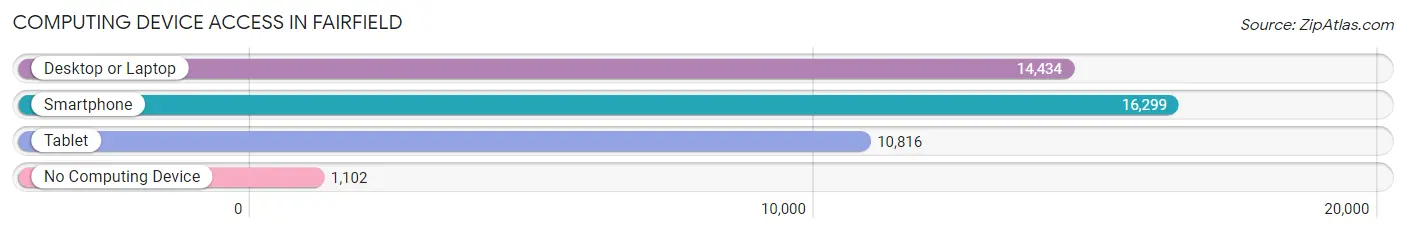
| Device Type | # Households | % Households |
| Desktop or Laptop | 14,434 | 78.5% |
| Smartphone | 16,299 | 88.7% |
| Tablet | 10,816 | 58.8% |
| No Computing Device | 1,102 | 6.0% |
| Total | 18,383 | 100.0% |
Internet Access in Fairfield
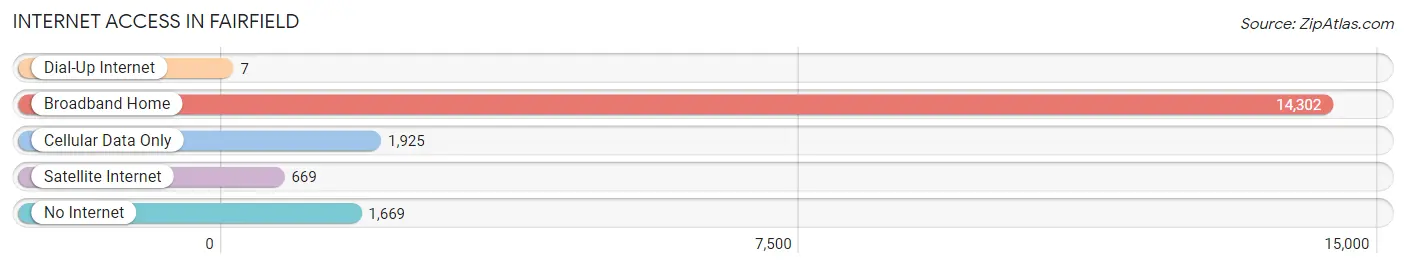
| Internet Type | # Households | % Households |
| Dial-Up Internet | 7 | 0.0% |
| Broadband Home | 14,302 | 77.8% |
| Cellular Data Only | 1,925 | 10.5% |
| Satellite Internet | 669 | 3.6% |
| No Internet | 1,669 | 9.1% |
| Total | 18,383 | 100.0% |
Fairfield Summary
Fairfield, Ohio is a city located in Butler County, Ohio, United States. It is part of the Cincinnati metropolitan area. The population was 42,510 at the 2010 census. It is the second largest city in the county, behind Hamilton.
History
Fairfield was founded in 1790 by William Henry Harrison, the ninth president of the United States. The city was named after the Fairfield Plantation, which was owned by Harrison's father-in-law, John Cleves Symmes. The plantation was located near the present-day intersection of Dixie Highway and Pleasant Avenue.
The city was incorporated in 1853 and has grown steadily since then. In the late 19th century, Fairfield was a major center for the production of agricultural products, including wheat, corn, and livestock. The city was also home to several large manufacturing companies, including the Fairfield Manufacturing Company, which produced agricultural implements, and the Fairfield Foundry, which produced cast iron products.
Geography
Fairfield is located at 39°17'N 84°37'W (39.28, -84.62). According to the United States Census Bureau, the city has a total area of 16.2 square miles (41.8 km2), of which 16.1 square miles (41.6 km2) is land and 0.1 square miles (0.2 km2) is water.
Economy
Fairfield is home to several large employers, including AK Steel, the Fairfield City School District, and the Fairfield Medical Center. The city is also home to several smaller businesses, including restaurants, retail stores, and professional services.
Demographics
As of the 2010 census, there were 42,510 people, 17,845 households, and 11,845 families residing in the city. The population density was 2,637.3 people per square mile (1,017.2/km2). There were 19,541 housing units at an average density of 1,210.3 per square mile (467.2/km2). The racial makeup of the city was 81.2% White, 11.3% African American, 0.3% Native American, 2.2% Asian, 0.1% Pacific Islander, 2.7% from other races, and 2.4% from two or more races. Hispanic or Latino of any race were 5.3% of the population.
There were 17,845 households, out of which 30.2% had children under the age of 18 living with them, 46.2% were married couples living together, 13.7% had a female householder with no husband present, and 35.3% were non-families. 29.2% of all households were made up of individuals, and 9.7% had someone living alone who was 65 years of age or older. The average household size was 2.38 and the average family size was 2.94.
In the city, the population was spread out, with 24.2% under the age of 18, 8.2% from 18 to 24, 29.2% from 25 to 44, 24.3% from 45 to 64, and 14.1% who were 65 years of age or older. The median age was 37 years. For every 100 females, there were 92.2 males. For every 100 females age 18 and over, there were 88.3 males.
The median income for a household in the city was $50,945, and the median income for a family was $62,945. Males had a median income of $45,945 versus $32,945 for females. The per capita income for the city was $25,945. About 5.2% of families and 7.2% of the population were below the poverty line, including 9.2% of those under age 18 and 6.2% of those age 65 or over.
Common Questions
What is the Total Population of Fairfield?
Total Population of Fairfield is 44,602.
What is the Total Male Population of Fairfield?
Total Male Population of Fairfield is 21,419.
What is the Total Female Population of Fairfield?
Total Female Population of Fairfield is 23,183.
What is the Ratio of Males per 100 Females in Fairfield?
There are 92.39 Males per 100 Females in Fairfield.
What is the Ratio of Females per 100 Males in Fairfield?
There are 108.24 Females per 100 Males in Fairfield.
What is the Median Population Age in Fairfield?
Median Population Age in Fairfield is 38.9 Years.
What is the Average Family Size in Fairfield
Average Family Size in Fairfield is 3.0 People.
What is the Average Household Size in Fairfield
Average Household Size in Fairfield is 2.4 People.
What is Per Capita Income in Fairfield?
Per Capita income in Fairfield is $37,076.
What is the Median Family Income in Fairfield?
Median Family Income in Fairfield is $87,350.
What is the Median Household income in Fairfield?
Median Household Income in Fairfield is $67,182.
What is Income or Wage Gap in Fairfield?
Income or Wage Gap in Fairfield is 21.3%.
Women in Fairfield earn 78.7 cents for every dollar earned by a man.
What is Inequality or Gini Index in Fairfield?
Inequality or Gini Index in Fairfield is 0.43.
How Large is the Labor Force in Fairfield?
There are 24,327 People in the Labor Forcein in Fairfield.
What is the Percentage of People in the Labor Force in Fairfield?
67.6% of People are in the Labor Force in Fairfield.
What is the Unemployment Rate in Fairfield?
Unemployment Rate in Fairfield is 5.4%.