Cities with the Lowest Poverty Level in Ohio
RELATED REPORTS & OPTIONS
Lowest Poverty
Ohio
Compare Cities
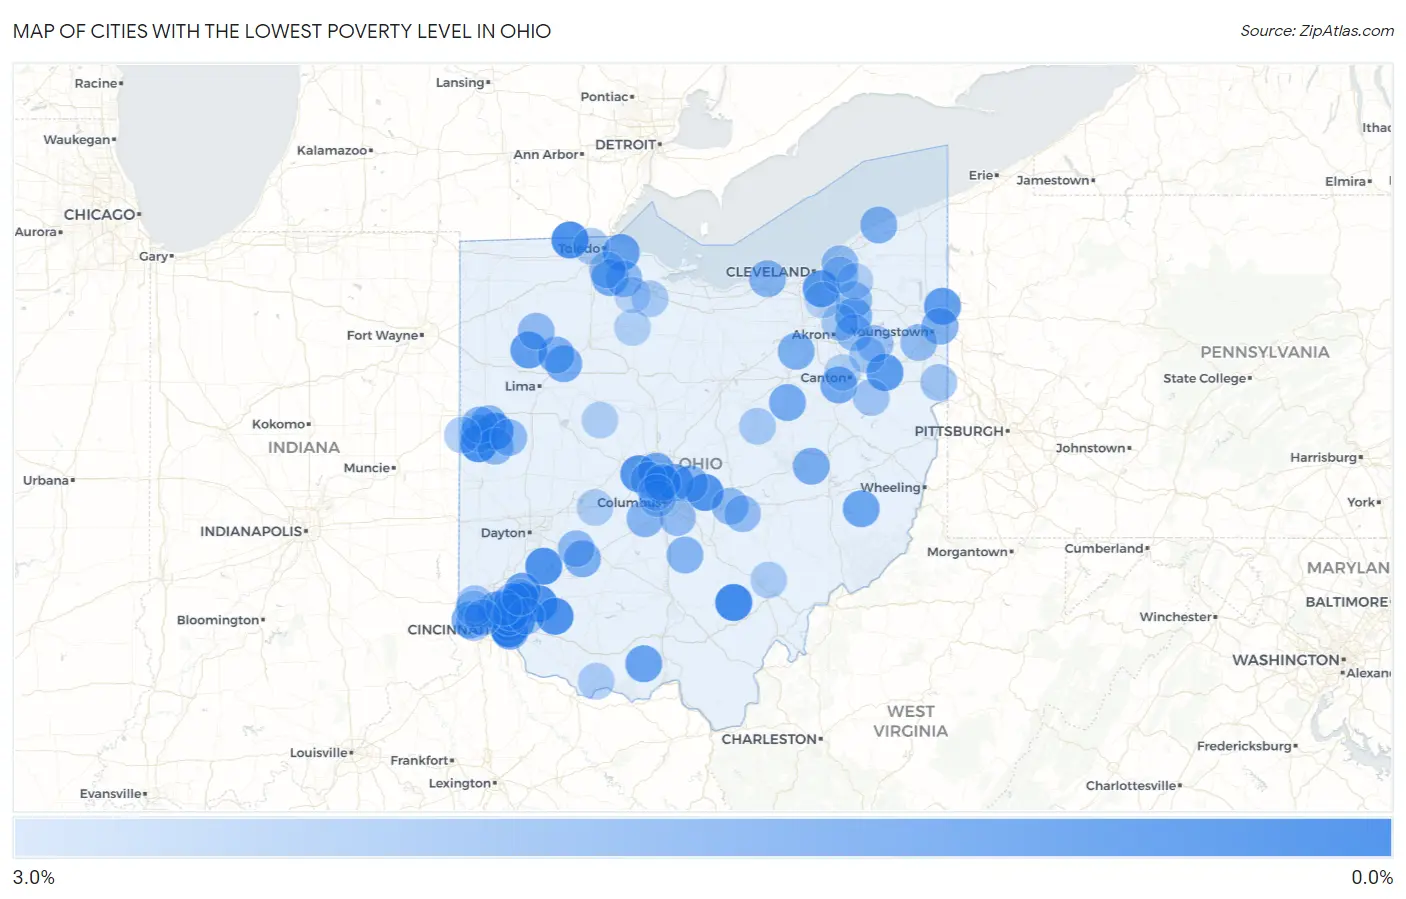
Map of Cities with the Lowest Poverty Level in Ohio
3.0%
0.0%
Cities with the Lowest Poverty Level in Ohio
| City | Poverty | vs State | vs National | |
| 1. | Loveland Park | 0.27% | 13.3%(-13.0)#1 | 12.5%(-12.3)#41 |
| 2. | Turpin Hills | 0.33% | 13.3%(-13.0)#2 | 12.5%(-12.2)#61 |
| 3. | Sharon Center | 0.37% | 13.3%(-12.9)#3 | 12.5%(-12.2)#73 |
| 4. | Zaleski | 0.48% | 13.3%(-12.8)#4 | 12.5%(-12.1)#118 |
| 5. | Pleasant Plain | 0.64% | 13.3%(-12.7)#5 | 12.5%(-11.9)#179 |
| 6. | Berkey | 0.65% | 13.3%(-12.7)#6 | 12.5%(-11.9)#181 |
| 7. | Burkettsville | 0.68% | 13.3%(-12.6)#7 | 12.5%(-11.8)#197 |
| 8. | Lake Lorelei | 0.70% | 13.3%(-12.6)#8 | 12.5%(-11.8)#203 |
| 9. | Corwin | 0.75% | 13.3%(-12.6)#9 | 12.5%(-11.8)#230 |
| 10. | Beechwood Trails | 0.86% | 13.3%(-12.4)#10 | 12.5%(-11.7)#292 |
| 11. | New California | 0.89% | 13.3%(-12.4)#11 | 12.5%(-11.6)#306 |
| 12. | Independence | 0.97% | 13.3%(-12.3)#12 | 12.5%(-11.6)#339 |
| 13. | Riverlea | 0.98% | 13.3%(-12.3)#13 | 12.5%(-11.6)#344 |
| 14. | Terrace Park | 0.98% | 13.3%(-12.3)#14 | 12.5%(-11.6)#345 |
| 15. | Montgomery | 0.99% | 13.3%(-12.3)#15 | 12.5%(-11.5)#351 |
| 16. | Chickasaw | 0.99% | 13.3%(-12.3)#16 | 12.5%(-11.5)#359 |
| 17. | Homeworth | 1.1% | 13.3%(-12.2)#17 | 12.5%(-11.5)#389 |
| 18. | Yankee Lake | 1.1% | 13.3%(-12.2)#18 | 12.5%(-11.4)#427 |
| 19. | Kalida | 1.1% | 13.3%(-12.2)#19 | 12.5%(-11.4)#438 |
| 20. | Huber Ridge | 1.1% | 13.3%(-12.2)#20 | 12.5%(-11.4)#451 |
| 21. | Amberley | 1.2% | 13.3%(-12.2)#21 | 12.5%(-11.4)#456 |
| 22. | Mariemont | 1.2% | 13.3%(-12.1)#22 | 12.5%(-11.4)#460 |
| 23. | Curtice | 1.3% | 13.3%(-12.0)#23 | 12.5%(-11.3)#527 |
| 24. | The Village Of Indian Hill | 1.3% | 13.3%(-12.0)#24 | 12.5%(-11.3)#536 |
| 25. | Wyoming | 1.3% | 13.3%(-12.0)#25 | 12.5%(-11.3)#537 |
| 26. | Kings Mills | 1.3% | 13.3%(-12.0)#26 | 12.5%(-11.2)#554 |
| 27. | Bass Lake | 1.3% | 13.3%(-12.0)#27 | 12.5%(-11.2)#573 |
| 28. | Otway | 1.3% | 13.3%(-12.0)#28 | 12.5%(-11.2)#578 |
| 29. | Batesville | 1.4% | 13.3%(-11.9)#29 | 12.5%(-11.2)#610 |
| 30. | Powell | 1.4% | 13.3%(-11.9)#30 | 12.5%(-11.1)#643 |
| 31. | Richville | 1.5% | 13.3%(-11.8)#31 | 12.5%(-11.0)#719 |
| 32. | Miami Heights | 1.5% | 13.3%(-11.8)#32 | 12.5%(-11.0)#741 |
| 33. | Bluffton | 1.5% | 13.3%(-11.8)#33 | 12.5%(-11.0)#745 |
| 34. | Luckey | 1.6% | 13.3%(-11.7)#34 | 12.5%(-11.0)#752 |
| 35. | Holmesville | 1.6% | 13.3%(-11.7)#35 | 12.5%(-10.9)#776 |
| 36. | Plainfield | 1.6% | 13.3%(-11.7)#36 | 12.5%(-10.9)#817 |
| 37. | Sherwood | 1.6% | 13.3%(-11.7)#37 | 12.5%(-10.9)#829 |
| 38. | Madeira | 1.7% | 13.3%(-11.6)#38 | 12.5%(-10.9)#863 |
| 39. | Bowersville | 1.7% | 13.3%(-11.6)#39 | 12.5%(-10.8)#881 |
| 40. | Sugar Bush Knolls | 1.7% | 13.3%(-11.6)#40 | 12.5%(-10.8)#893 |
| 41. | Lloydsville | 1.7% | 13.3%(-11.6)#41 | 12.5%(-10.8)#903 |
| 42. | Sterling | 1.7% | 13.3%(-11.6)#42 | 12.5%(-10.8)#906 |
| 43. | North Perry | 1.8% | 13.3%(-11.5)#43 | 12.5%(-10.8)#927 |
| 44. | Newport Cdp Washington County | 1.8% | 13.3%(-11.5)#44 | 12.5%(-10.8)#936 |
| 45. | Pandora | 1.8% | 13.3%(-11.5)#45 | 12.5%(-10.8)#938 |
| 46. | Maplewood Park | 1.8% | 13.3%(-11.5)#46 | 12.5%(-10.7)#968 |
| 47. | St Henry | 1.8% | 13.3%(-11.5)#47 | 12.5%(-10.7)#980 |
| 48. | Sheffield | 1.9% | 13.3%(-11.5)#48 | 12.5%(-10.7)#1,001 |
| 49. | New Albany | 1.9% | 13.3%(-11.4)#49 | 12.5%(-10.6)#1,039 |
| 50. | Montezuma | 1.9% | 13.3%(-11.4)#50 | 12.5%(-10.6)#1,063 |
| 51. | Darbydale | 1.9% | 13.3%(-11.4)#51 | 12.5%(-10.6)#1,086 |
| 52. | Stoutsville | 2.0% | 13.3%(-11.3)#52 | 12.5%(-10.6)#1,098 |
| 53. | Coldwater | 2.0% | 13.3%(-11.3)#53 | 12.5%(-10.6)#1,112 |
| 54. | Osgood | 2.0% | 13.3%(-11.3)#54 | 12.5%(-10.6)#1,118 |
| 55. | Woodville | 2.1% | 13.3%(-11.3)#55 | 12.5%(-10.5)#1,192 |
| 56. | Aurora | 2.1% | 13.3%(-11.2)#56 | 12.5%(-10.5)#1,230 |
| 57. | Miller City | 2.1% | 13.3%(-11.2)#57 | 12.5%(-10.5)#1,233 |
| 58. | Minster | 2.1% | 13.3%(-11.2)#58 | 12.5%(-10.4)#1,248 |
| 59. | Shawnee Hills | 2.1% | 13.3%(-11.2)#59 | 12.5%(-10.4)#1,249 |
| 60. | Highland Heights | 2.1% | 13.3%(-11.2)#60 | 12.5%(-10.4)#1,253 |
| 61. | Harbor Hills | 2.1% | 13.3%(-11.2)#61 | 12.5%(-10.4)#1,286 |
| 62. | Dublin | 2.1% | 13.3%(-11.2)#62 | 12.5%(-10.4)#1,292 |
| 63. | Brimfield | 2.2% | 13.3%(-11.1)#63 | 12.5%(-10.4)#1,308 |
| 64. | Canfield | 2.2% | 13.3%(-11.1)#64 | 12.5%(-10.3)#1,338 |
| 65. | Glenford | 2.2% | 13.3%(-11.1)#65 | 12.5%(-10.3)#1,363 |
| 66. | Groveport | 2.2% | 13.3%(-11.1)#66 | 12.5%(-10.3)#1,364 |
| 67. | Stony Ridge | 2.3% | 13.3%(-11.0)#67 | 12.5%(-10.3)#1,417 |
| 68. | Highpoint | 2.3% | 13.3%(-11.0)#68 | 12.5%(-10.3)#1,424 |
| 69. | Atwater | 2.3% | 13.3%(-11.0)#69 | 12.5%(-10.2)#1,436 |
| 70. | Concorde Hills | 2.3% | 13.3%(-11.0)#70 | 12.5%(-10.2)#1,461 |
| 71. | New Baltimore | 2.3% | 13.3%(-11.0)#71 | 12.5%(-10.2)#1,477 |
| 72. | Mack | 2.4% | 13.3%(-10.9)#72 | 12.5%(-10.2)#1,539 |
| 73. | Marble Cliff | 2.4% | 13.3%(-10.9)#73 | 12.5%(-10.1)#1,544 |
| 74. | Mount Repose | 2.4% | 13.3%(-10.9)#74 | 12.5%(-10.1)#1,590 |
| 75. | Lake Mohawk | 2.4% | 13.3%(-10.9)#75 | 12.5%(-10.1)#1,612 |
| 76. | Lake Tomahawk | 2.4% | 13.3%(-10.9)#76 | 12.5%(-10.1)#1,614 |
| 77. | Marlboro | 2.5% | 13.3%(-10.8)#77 | 12.5%(-10.1)#1,637 |
| 78. | Worthington | 2.5% | 13.3%(-10.8)#78 | 12.5%(-10.1)#1,649 |
| 79. | Pepper Pike | 2.5% | 13.3%(-10.8)#79 | 12.5%(-10.0)#1,692 |
| 80. | Silver Lake | 2.5% | 13.3%(-10.8)#80 | 12.5%(-10.0)#1,702 |
| 81. | Taylor Creek | 2.6% | 13.3%(-10.8)#81 | 12.5%(-9.98)#1,736 |
| 82. | Fort Recovery | 2.6% | 13.3%(-10.7)#82 | 12.5%(-9.98)#1,740 |
| 83. | Gann Brinkhaven | 2.6% | 13.3%(-10.7)#83 | 12.5%(-9.97)#1,751 |
| 84. | Ottawa Hills | 2.6% | 13.3%(-10.7)#84 | 12.5%(-9.94)#1,777 |
| 85. | Evendale | 2.6% | 13.3%(-10.7)#85 | 12.5%(-9.94)#1,781 |
| 86. | Upper Arlington | 2.6% | 13.3%(-10.7)#86 | 12.5%(-9.93)#1,785 |
| 87. | Woodsdale | 2.6% | 13.3%(-10.7)#87 | 12.5%(-9.92)#1,802 |
| 88. | Ballville | 2.6% | 13.3%(-10.7)#88 | 12.5%(-9.92)#1,803 |
| 89. | Bentonville | 2.6% | 13.3%(-10.7)#89 | 12.5%(-9.89)#1,832 |
| 90. | Landen | 2.7% | 13.3%(-10.6)#90 | 12.5%(-9.87)#1,861 |
| 91. | Monfort Heights | 2.7% | 13.3%(-10.6)#91 | 12.5%(-9.87)#1,863 |
| 92. | Millfield | 2.7% | 13.3%(-10.6)#92 | 12.5%(-9.82)#1,910 |
| 93. | South Vienna | 2.7% | 13.3%(-10.6)#93 | 12.5%(-9.82)#1,914 |
| 94. | Ridgeway | 2.7% | 13.3%(-10.6)#94 | 12.5%(-9.79)#1,954 |
| 95. | Hills And Dales | 2.8% | 13.3%(-10.5)#95 | 12.5%(-9.78)#1,963 |
| 96. | Bascom | 2.8% | 13.3%(-10.5)#96 | 12.5%(-9.75)#1,995 |
| 97. | South Russell | 2.8% | 13.3%(-10.5)#97 | 12.5%(-9.74)#2,007 |
| 98. | Ridgewood | 2.8% | 13.3%(-10.5)#98 | 12.5%(-9.69)#2,055 |
| 99. | Brecksville | 2.9% | 13.3%(-10.4)#99 | 12.5%(-9.63)#2,136 |
| 100. | Helena | 2.9% | 13.3%(-10.4)#100 | 12.5%(-9.61)#2,152 |
Common Questions
What are the Top 10 Cities with the Lowest Poverty Level in Ohio?
Top 10 Cities with the Lowest Poverty Level in Ohio are:
#1
0.27%
#2
0.33%
#3
0.48%
#4
0.64%
#5
0.65%
#6
0.68%
#7
0.70%
#8
0.75%
#9
0.86%
#10
0.89%
What city has the Lowest Poverty Level in Ohio?
Loveland Park has the Lowest Poverty Level in Ohio with 0.27%.
What is the Poverty Level in the State of Ohio?
Poverty Level in Ohio is 13.3%.
What is the Poverty Level in the United States?
Poverty Level in the United States is 12.5%.