Santa Claus, IN
Santa Claus Map
Santa Claus Overview
2,746
TOTAL POPULATION
1,475
MALE POPULATION
1,271
FEMALE POPULATION
116.05
MALES / 100 FEMALES
86.17
FEMALES / 100 MALES
42.8
MEDIAN AGE
3.2
AVG FAMILY SIZE
2.8
AVG HOUSEHOLD SIZE
$45,729
PER CAPITA INCOME
$119,464
AVG FAMILY INCOME
$107,083
AVG HOUSEHOLD INCOME
20.4%
WAGE / INCOME GAP [ % ]
79.6¢/ $1
WAGE / INCOME GAP [ $ ]
$7,527
FAMILY INCOME DEFICIT
0.42
INEQUALITY / GINI INDEX
1,447
LABOR FORCE [ PEOPLE ]
68.8%
PERCENT IN LABOR FORCE
0.8%
UNEMPLOYMENT RATE
Santa Claus Zip Codes
Santa Claus Area Codes
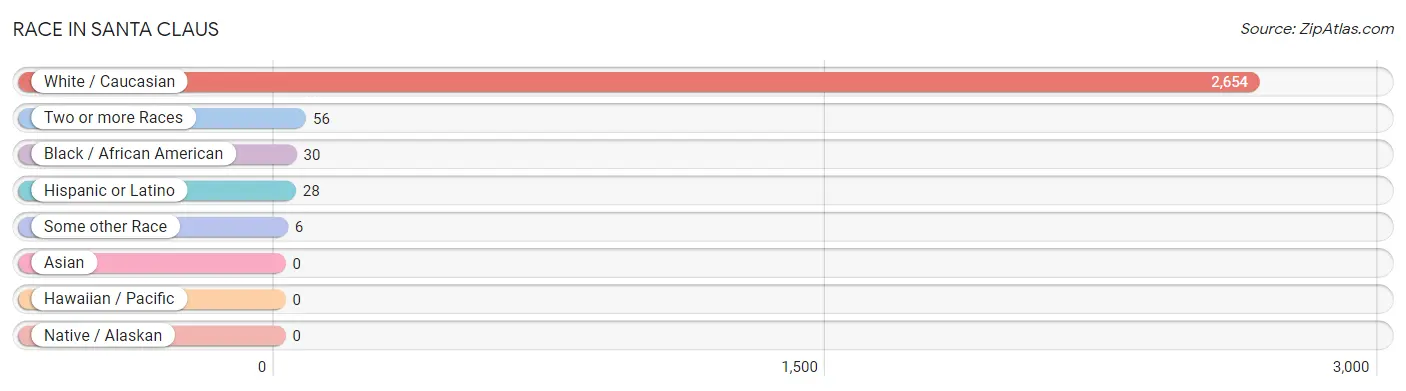
Race in Santa Claus
The most populous races in Santa Claus are White / Caucasian (2,654 | 96.7%), Two or more Races (56 | 2.0%), and Black / African American (30 | 1.1%).
| Race | # Population | % Population |
| Asian | 0 | 0.0% |
| Black / African American | 30 | 1.1% |
| Hawaiian / Pacific | 0 | 0.0% |
| Hispanic or Latino | 28 | 1.0% |
| Native / Alaskan | 0 | 0.0% |
| White / Caucasian | 2,654 | 96.7% |
| Two or more Races | 56 | 2.0% |
| Some other Race | 6 | 0.2% |
| Total | 2,746 | 100.0% |
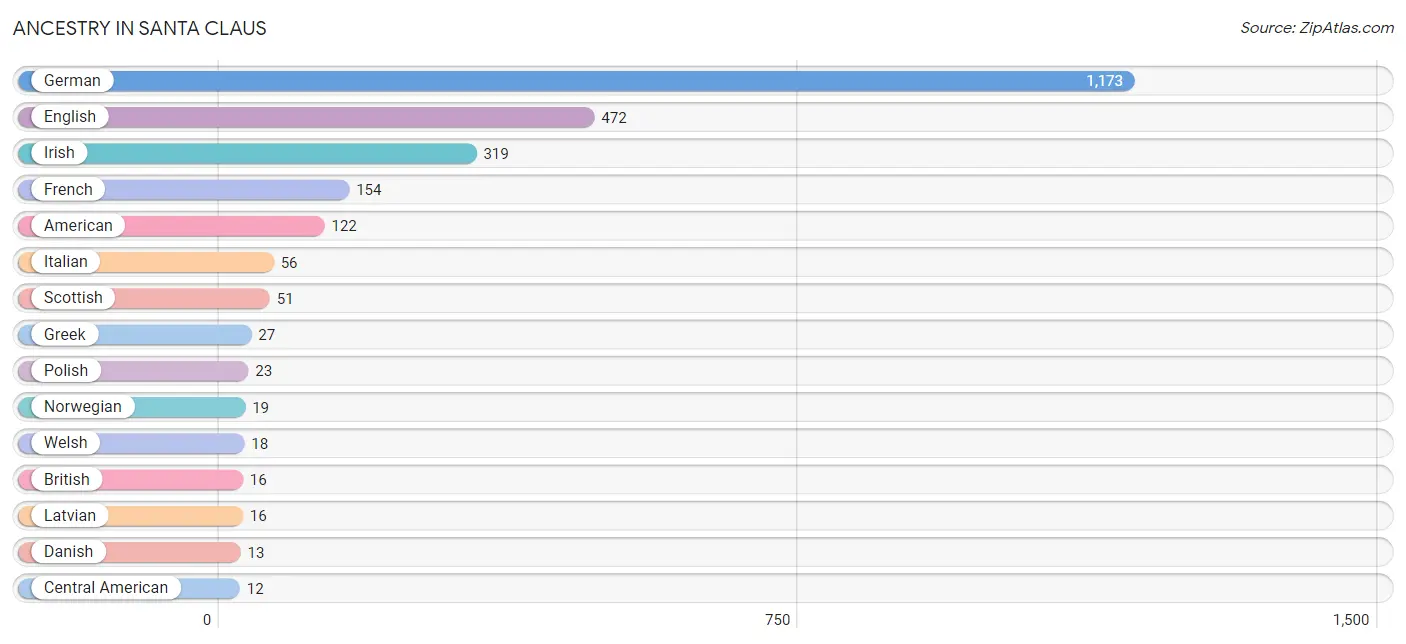
Ancestry in Santa Claus
The most populous ancestries reported in Santa Claus are German (1,173 | 42.7%), English (472 | 17.2%), Irish (319 | 11.6%), French (154 | 5.6%), and American (122 | 4.4%), together accounting for 81.6% of all Santa Claus residents.
| Ancestry | # Population | % Population |
| American | 122 | 4.4% |
| Belgian | 7 | 0.3% |
| British | 16 | 0.6% |
| Central American | 12 | 0.4% |
| Cherokee | 1 | 0.0% |
| Danish | 13 | 0.5% |
| Dutch | 11 | 0.4% |
| English | 472 | 17.2% |
| European | 7 | 0.3% |
| French | 154 | 5.6% |
| German | 1,173 | 42.7% |
| Greek | 27 | 1.0% |
| Irish | 319 | 11.6% |
| Italian | 56 | 2.0% |
| Latvian | 16 | 0.6% |
| Mexican | 10 | 0.4% |
| Northern European | 11 | 0.4% |
| Norwegian | 19 | 0.7% |
| Pennsylvania German | 7 | 0.3% |
| Polish | 23 | 0.8% |
| Puerto Rican | 6 | 0.2% |
| Salvadoran | 12 | 0.4% |
| Scotch-Irish | 6 | 0.2% |
| Scottish | 51 | 1.9% |
| Swedish | 11 | 0.4% |
| Swiss | 6 | 0.2% |
| Welsh | 18 | 0.7% | View All 27 Rows |
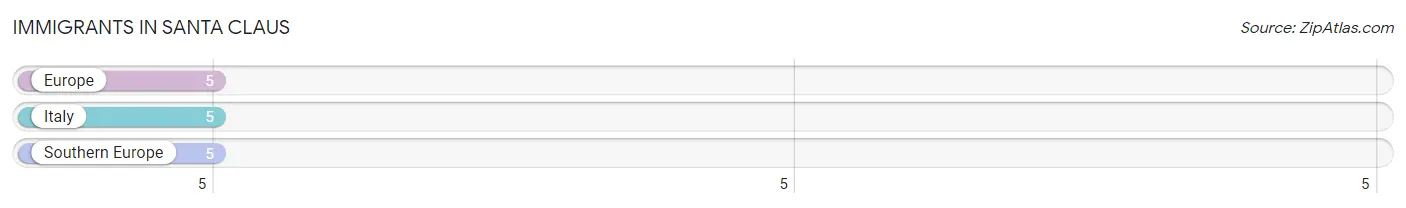
Immigrants in Santa Claus
The most numerous immigrant groups reported in Santa Claus came from Europe (5 | 0.2%), Italy (5 | 0.2%), and Southern Europe (5 | 0.2%), together accounting for 0.5% of all Santa Claus residents.
| Immigration Origin | # Population | % Population |
| Europe | 5 | 0.2% |
| Italy | 5 | 0.2% |
| Southern Europe | 5 | 0.2% | View All 3 Rows |
Sex and Age in Santa Claus
Sex and Age in Santa Claus
The most populous age groups in Santa Claus are 10 to 14 Years (137 | 9.3%) for men and 40 to 44 Years (140 | 11.0%) for women.
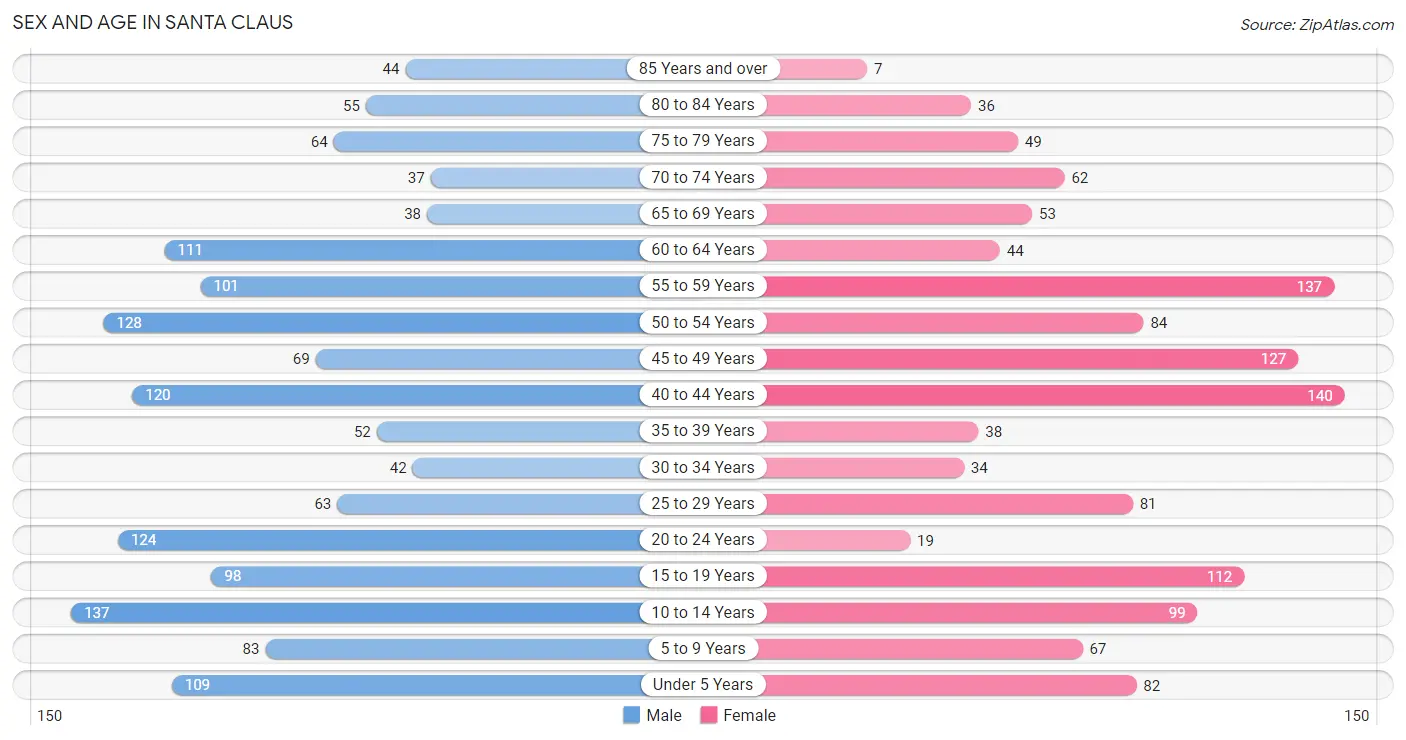
| Age Bracket | Male | Female |
| Under 5 Years | 109 (7.4%) | 82 (6.5%) |
| 5 to 9 Years | 83 (5.6%) | 67 (5.3%) |
| 10 to 14 Years | 137 (9.3%) | 99 (7.8%) |
| 15 to 19 Years | 98 (6.6%) | 112 (8.8%) |
| 20 to 24 Years | 124 (8.4%) | 19 (1.5%) |
| 25 to 29 Years | 63 (4.3%) | 81 (6.4%) |
| 30 to 34 Years | 42 (2.9%) | 34 (2.7%) |
| 35 to 39 Years | 52 (3.5%) | 38 (3.0%) |
| 40 to 44 Years | 120 (8.1%) | 140 (11.0%) |
| 45 to 49 Years | 69 (4.7%) | 127 (10.0%) |
| 50 to 54 Years | 128 (8.7%) | 84 (6.6%) |
| 55 to 59 Years | 101 (6.9%) | 137 (10.8%) |
| 60 to 64 Years | 111 (7.5%) | 44 (3.5%) |
| 65 to 69 Years | 38 (2.6%) | 53 (4.2%) |
| 70 to 74 Years | 37 (2.5%) | 62 (4.9%) |
| 75 to 79 Years | 64 (4.3%) | 49 (3.9%) |
| 80 to 84 Years | 55 (3.7%) | 36 (2.8%) |
| 85 Years and over | 44 (3.0%) | 7 (0.5%) |
| Total | 1,475 (100.0%) | 1,271 (100.0%) |
Families and Households in Santa Claus
Median Family Size in Santa Claus
The median family size in Santa Claus is 3.17 persons per family, with single male/father families (46 | 5.9%) accounting for the largest median family size of 3.89 persons per family. On the other hand, single female/mother families (53 | 6.8%) represent the smallest median family size with 2.60 persons per family.
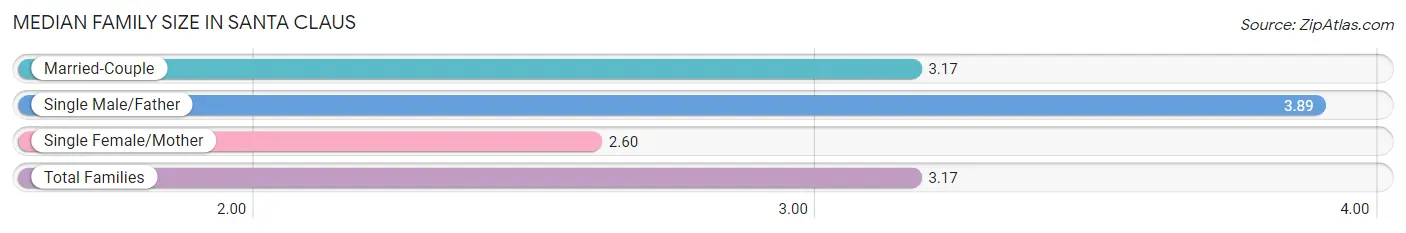
| Family Type | # Families | Family Size |
| Married-Couple | 684 (87.4%) | 3.17 |
| Single Male/Father | 46 (5.9%) | 3.89 |
| Single Female/Mother | 53 (6.8%) | 2.60 |
| Total Families | 783 (100.0%) | 3.17 |
Median Household Size in Santa Claus
The median household size in Santa Claus is 2.80 persons per household, with single male/father households (46 | 4.7%) accounting for the largest median household size of 4.74 persons per household. non-family households (197 | 20.1%) represent the smallest median household size with 1.03 persons per household.
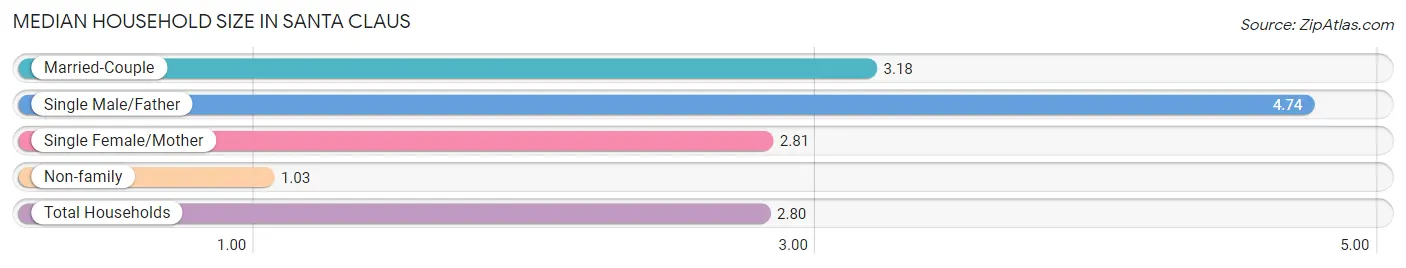
| Household Type | # Households | Household Size |
| Married-Couple | 684 (69.8%) | 3.18 |
| Single Male/Father | 46 (4.7%) | 4.74 |
| Single Female/Mother | 53 (5.4%) | 2.81 |
| Non-family | 197 (20.1%) | 1.03 |
| Total Households | 980 (100.0%) | 2.80 |
Household Size by Marriage Status in Santa Claus
Out of a total of 980 households in Santa Claus, 783 (79.9%) are family households, while 197 (20.1%) are nonfamily households. The most numerous type of family households are 2-person households, comprising 348, and the most common type of nonfamily households are 1-person households, comprising 191.
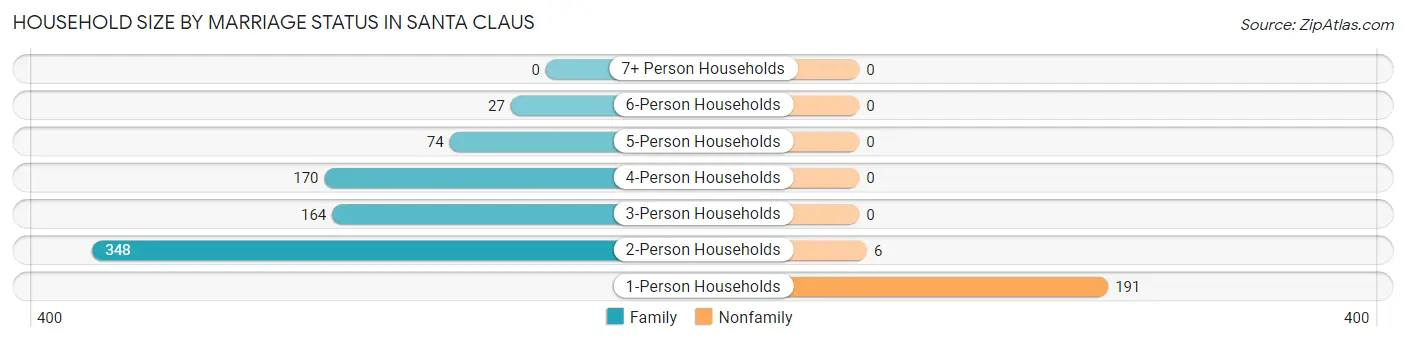
| Household Size | Family Households | Nonfamily Households |
| 1-Person Households | - | 191 (19.5%) |
| 2-Person Households | 348 (35.5%) | 6 (0.6%) |
| 3-Person Households | 164 (16.7%) | 0 (0.0%) |
| 4-Person Households | 170 (17.3%) | 0 (0.0%) |
| 5-Person Households | 74 (7.5%) | 0 (0.0%) |
| 6-Person Households | 27 (2.8%) | 0 (0.0%) |
| 7+ Person Households | 0 (0.0%) | 0 (0.0%) |
| Total | 783 (79.9%) | 197 (20.1%) |
Female Fertility in Santa Claus
Fertility by Age in Santa Claus
Average fertility rate in Santa Claus is 81.0 births per 1,000 women. Women in the age bracket of 20 to 34 years have the highest fertility rate with 261.0 births per 1,000 women. Women in the age bracket of 20 to 34 years acount for 76.1% of all women with births.
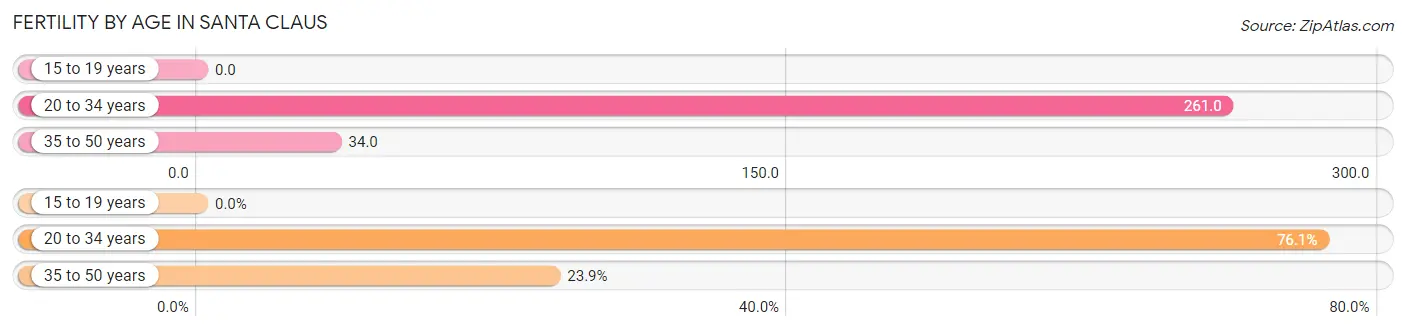
| Age Bracket | Women with Births | Births / 1,000 Women |
| 15 to 19 years | 0 (0.0%) | 0.0 |
| 20 to 34 years | 35 (76.1%) | 261.0 |
| 35 to 50 years | 11 (23.9%) | 34.0 |
| Total | 46 (100.0%) | 81.0 |
Fertility by Age by Marriage Status in Santa Claus
82.6% of women with births (46) in Santa Claus are married. The highest percentage of unmarried women with births falls into 20 to 34 years age bracket with 22.9% of them unmarried at the time of birth, while the lowest percentage of unmarried women with births belong to 35 to 50 years age bracket with 0.0% of them unmarried.
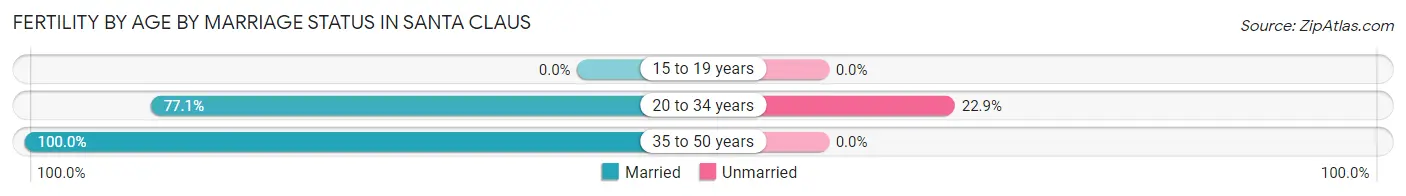
| Age Bracket | Married | Unmarried |
| 15 to 19 years | 0 (0.0%) | 0 (0.0%) |
| 20 to 34 years | 27 (77.1%) | 8 (22.9%) |
| 35 to 50 years | 11 (100.0%) | 0 (0.0%) |
| Total | 38 (82.6%) | 8 (17.4%) |
Fertility by Education in Santa Claus
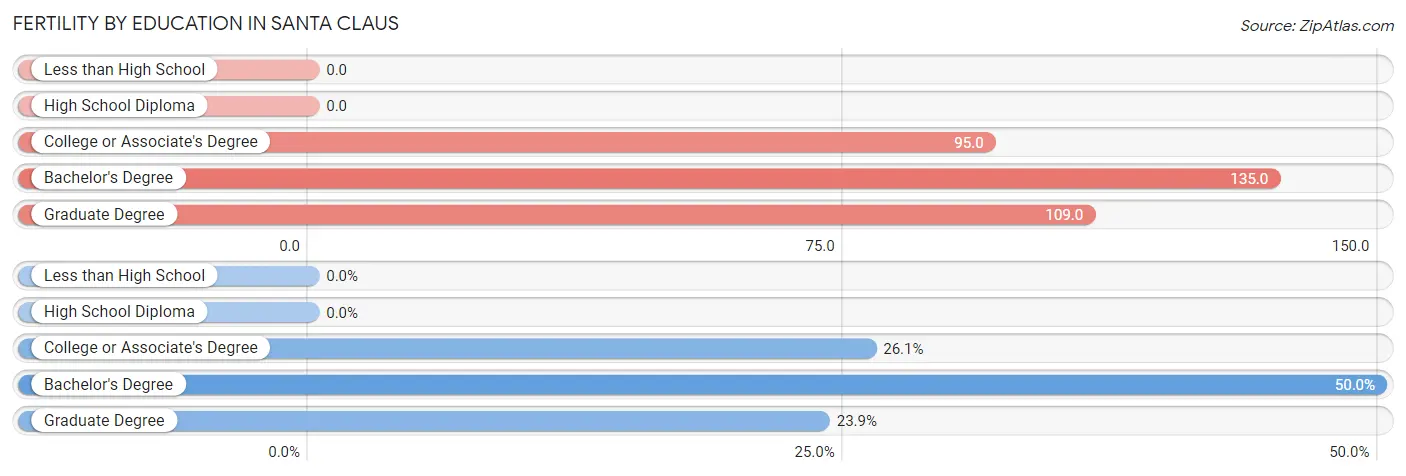
| Educational Attainment | Women with Births | Births / 1,000 Women |
| Less than High School | 0 (0.0%) | 0.0 |
| High School Diploma | 0 (0.0%) | 0.0 |
| College or Associate's Degree | 12 (26.1%) | 95.0 |
| Bachelor's Degree | 23 (50.0%) | 135.0 |
| Graduate Degree | 11 (23.9%) | 109.0 |
| Total | 46 (100.0%) | 81.0 |
Fertility by Education by Marriage Status in Santa Claus
17.4% of women with births in Santa Claus are unmarried. Women with the educational attainment of college or associate's degree are most likely to be married with 100.0% of them married at childbirth, while women with the educational attainment of bachelor's degree are least likely to be married with 34.8% of them unmarried at childbirth.
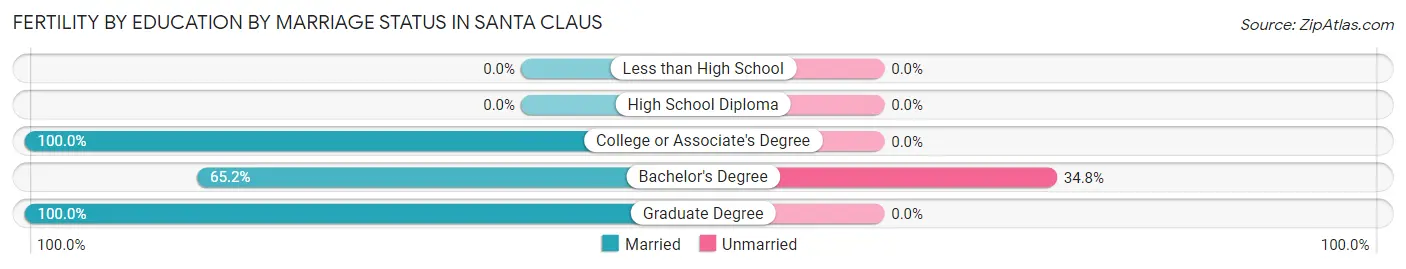
| Educational Attainment | Married | Unmarried |
| Less than High School | 0 (0.0%) | 0 (0.0%) |
| High School Diploma | 0 (0.0%) | 0 (0.0%) |
| College or Associate's Degree | 12 (100.0%) | 0 (0.0%) |
| Bachelor's Degree | 15 (65.2%) | 8 (34.8%) |
| Graduate Degree | 11 (100.0%) | 0 (0.0%) |
| Total | 38 (82.6%) | 8 (17.4%) |
Income in Santa Claus
Income Overview in Santa Claus
Per Capita Income in Santa Claus is $45,729, while median incomes of families and households are $119,464 and $107,083 respectively.
| Characteristic | Number | Measure |
| Per Capita Income | 2,746 | $45,729 |
| Median Family Income | 783 | $119,464 |
| Mean Family Income | 783 | $139,466 |
| Median Household Income | 980 | $107,083 |
| Mean Household Income | 980 | $121,080 |
| Income Deficit | 783 | $7,527 |
| Wage / Income Gap (%) | 2,746 | 20.43% |
| Wage / Income Gap ($) | 2,746 | 79.57¢ per $1 |
| Gini / Inequality Index | 2,746 | 0.42 |
Earnings by Sex in Santa Claus
Average Earnings in Santa Claus are $49,038, $52,837 for men and $42,042 for women, a difference of 20.4%.
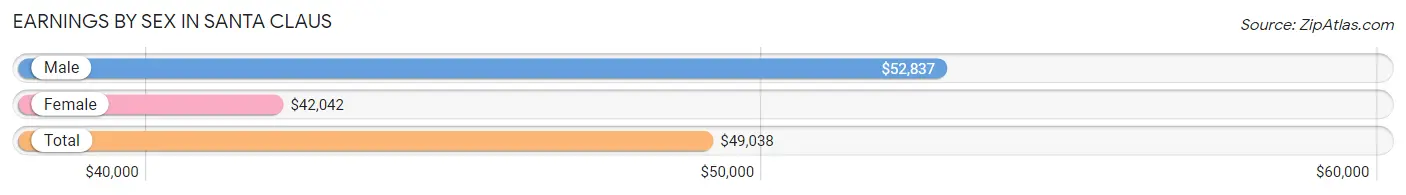
| Sex | Number | Average Earnings |
| Male | 867 (56.4%) | $52,837 |
| Female | 671 (43.6%) | $42,042 |
| Total | 1,538 (100.0%) | $49,038 |
Earnings by Sex by Income Bracket in Santa Claus
The most common earnings brackets in Santa Claus are $100,000+ for men (178 | 20.5%) and $75,000 to $99,999 for women (98 | 14.6%).
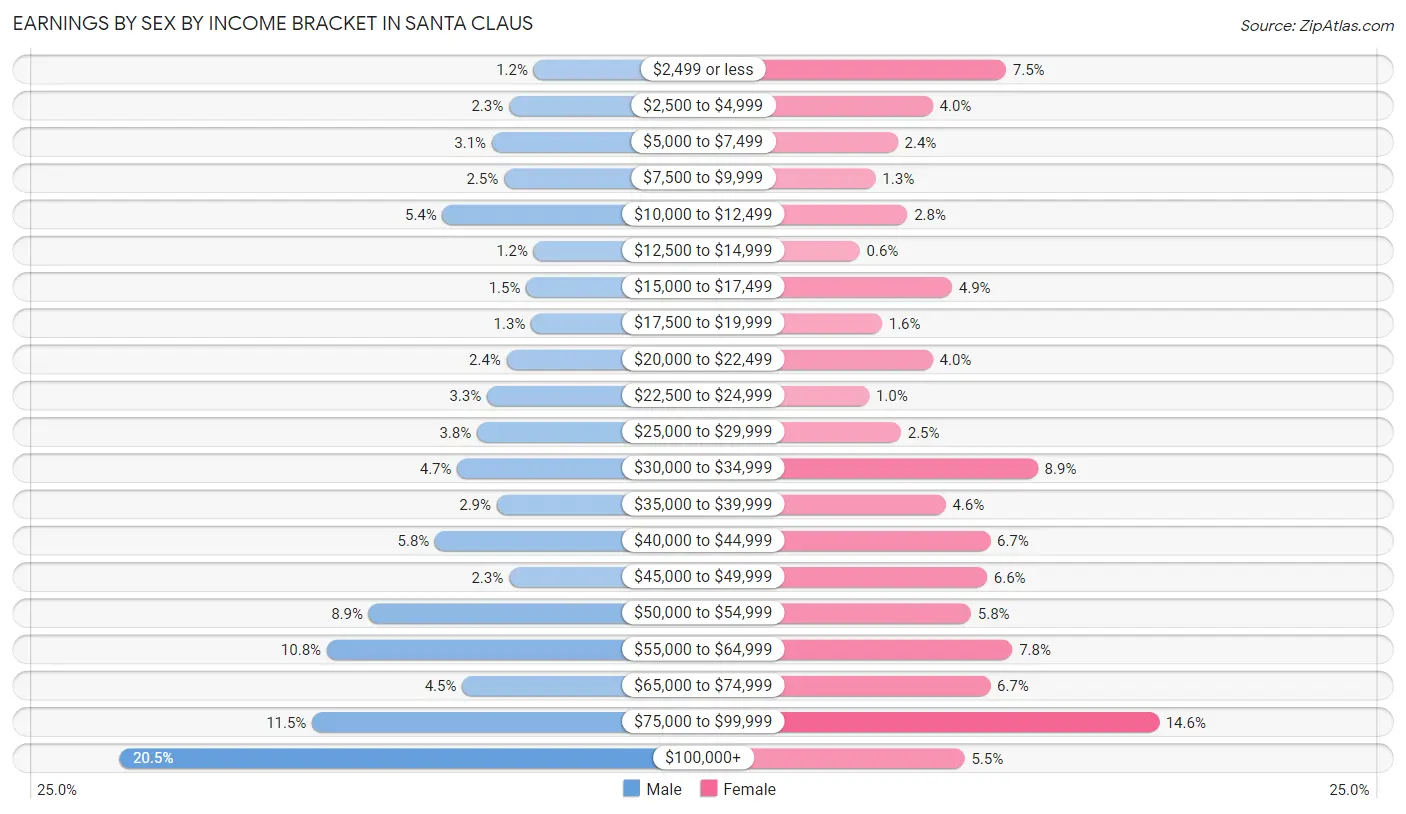
| Income | Male | Female |
| $2,499 or less | 10 (1.1%) | 50 (7.4%) |
| $2,500 to $4,999 | 20 (2.3%) | 27 (4.0%) |
| $5,000 to $7,499 | 27 (3.1%) | 16 (2.4%) |
| $7,500 to $9,999 | 22 (2.5%) | 9 (1.3%) |
| $10,000 to $12,499 | 47 (5.4%) | 19 (2.8%) |
| $12,500 to $14,999 | 10 (1.1%) | 4 (0.6%) |
| $15,000 to $17,499 | 13 (1.5%) | 33 (4.9%) |
| $17,500 to $19,999 | 11 (1.3%) | 11 (1.6%) |
| $20,000 to $22,499 | 21 (2.4%) | 27 (4.0%) |
| $22,500 to $24,999 | 29 (3.3%) | 7 (1.0%) |
| $25,000 to $29,999 | 33 (3.8%) | 17 (2.5%) |
| $30,000 to $34,999 | 41 (4.7%) | 60 (8.9%) |
| $35,000 to $39,999 | 25 (2.9%) | 31 (4.6%) |
| $40,000 to $44,999 | 50 (5.8%) | 45 (6.7%) |
| $45,000 to $49,999 | 20 (2.3%) | 44 (6.6%) |
| $50,000 to $54,999 | 77 (8.9%) | 39 (5.8%) |
| $55,000 to $64,999 | 94 (10.8%) | 52 (7.7%) |
| $65,000 to $74,999 | 39 (4.5%) | 45 (6.7%) |
| $75,000 to $99,999 | 100 (11.5%) | 98 (14.6%) |
| $100,000+ | 178 (20.5%) | 37 (5.5%) |
| Total | 867 (100.0%) | 671 (100.0%) |
Earnings by Sex by Educational Attainment in Santa Claus
Average earnings in Santa Claus are $61,281 for men and $46,300 for women, a difference of 24.4%. Men with an educational attainment of bachelor's degree enjoy the highest average annual earnings of $98,500, while those with high school diploma education earn the least with $51,583. Women with an educational attainment of bachelor's degree earn the most with the average annual earnings of $72,813, while those with high school diploma education have the smallest earnings of $34,886.
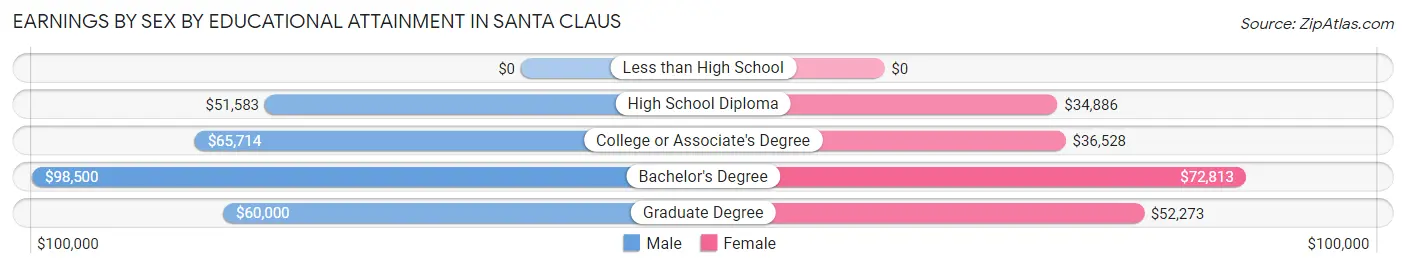
| Educational Attainment | Male Income | Female Income |
| Less than High School | - | - |
| High School Diploma | $51,583 | $34,886 |
| College or Associate's Degree | $65,714 | $36,528 |
| Bachelor's Degree | $98,500 | $72,813 |
| Graduate Degree | $60,000 | $52,273 |
| Total | $61,281 | $46,300 |
Family Income in Santa Claus
Family Income Brackets in Santa Claus
According to the Santa Claus family income data, there are 266 families falling into the $100,000 to $149,999 income range, which is the most common income bracket and makes up 34.0% of all families. Conversely, the $15,000 to $24,999 income bracket is the least frequent group with only 5 families (0.6%) belonging to this category.
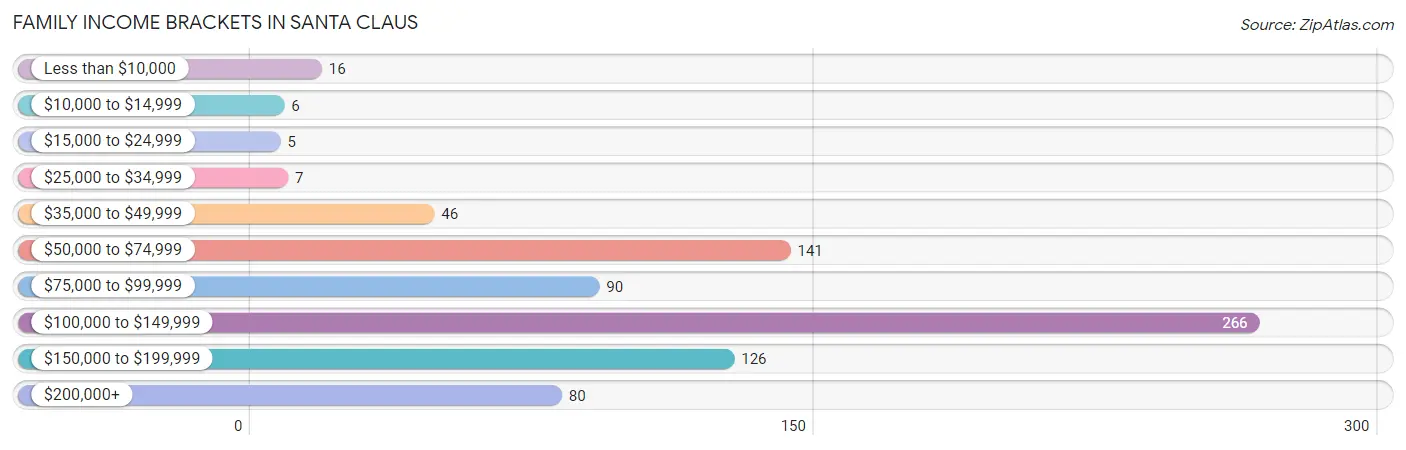
| Income Bracket | # Families | % Families |
| Less than $10,000 | 16 | 2.0% |
| $10,000 to $14,999 | 6 | 0.8% |
| $15,000 to $24,999 | 5 | 0.6% |
| $25,000 to $34,999 | 7 | 0.9% |
| $35,000 to $49,999 | 46 | 5.9% |
| $50,000 to $74,999 | 141 | 18.0% |
| $75,000 to $99,999 | 90 | 11.5% |
| $100,000 to $149,999 | 266 | 34.0% |
| $150,000 to $199,999 | 126 | 16.1% |
| $200,000+ | 80 | 10.2% |
Family Income by Famaliy Size in Santa Claus
4-person families (151 | 19.3%) account for the highest median family income in Santa Claus with $163,646 per family, while 2-person families (377 | 48.1%) have the highest median income of $48,375 per family member.
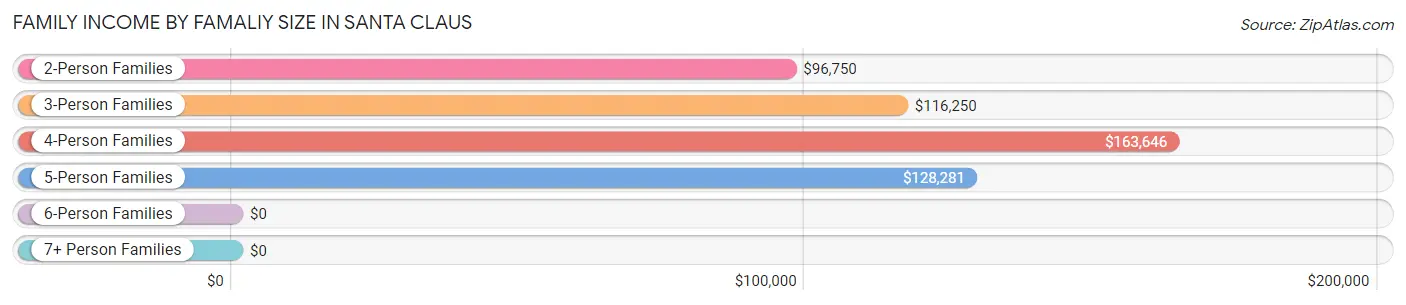
| Income Bracket | # Families | Median Income |
| 2-Person Families | 377 (48.1%) | $96,750 |
| 3-Person Families | 154 (19.7%) | $116,250 |
| 4-Person Families | 151 (19.3%) | $163,646 |
| 5-Person Families | 85 (10.9%) | $128,281 |
| 6-Person Families | 16 (2.0%) | $0 |
| 7+ Person Families | 0 (0.0%) | $0 |
| Total | 783 (100.0%) | $119,464 |
Family Income by Number of Earners in Santa Claus
The median family income in Santa Claus is $119,464, with families comprising 3+ earners (128) having the highest median family income of $144,000, while families with no earners (80) have the lowest median family income of $54,583, accounting for 16.4% and 10.2% of families, respectively.
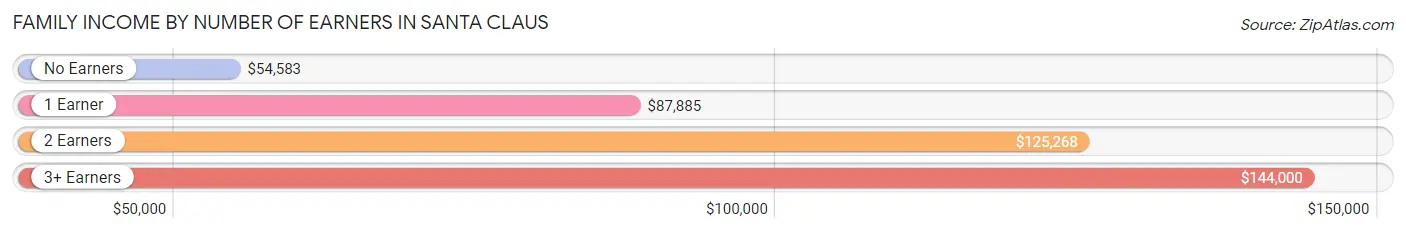
| Number of Earners | # Families | Median Income |
| No Earners | 80 (10.2%) | $54,583 |
| 1 Earner | 184 (23.5%) | $87,885 |
| 2 Earners | 391 (49.9%) | $125,268 |
| 3+ Earners | 128 (16.4%) | $144,000 |
| Total | 783 (100.0%) | $119,464 |
Household Income in Santa Claus
Household Income Brackets in Santa Claus
With 284 households falling in the category, the $100,000 to $149,999 income range is the most frequent in Santa Claus, accounting for 29.0% of all households. In contrast, only 13 households (1.3%) fall into the $10,000 to $14,999 income bracket, making it the least populous group.
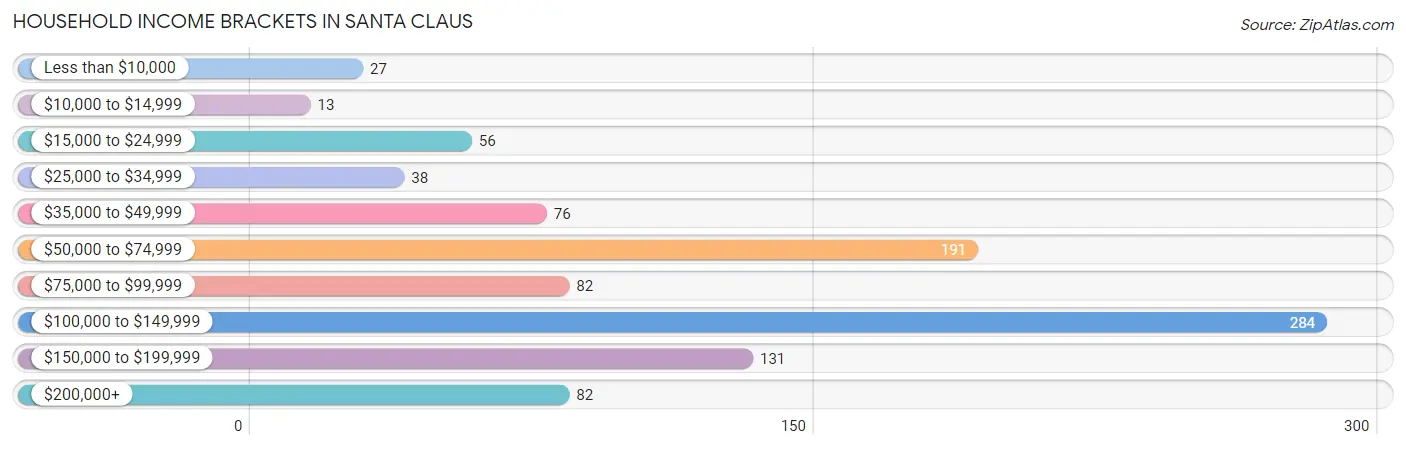
| Income Bracket | # Households | % Households |
| Less than $10,000 | 27 | 2.8% |
| $10,000 to $14,999 | 13 | 1.3% |
| $15,000 to $24,999 | 56 | 5.7% |
| $25,000 to $34,999 | 38 | 3.9% |
| $35,000 to $49,999 | 76 | 7.8% |
| $50,000 to $74,999 | 191 | 19.5% |
| $75,000 to $99,999 | 82 | 8.4% |
| $100,000 to $149,999 | 284 | 29.0% |
| $150,000 to $199,999 | 131 | 13.4% |
| $200,000+ | 82 | 8.4% |
Household Income by Householder Age in Santa Claus
The median household income in Santa Claus is $107,083, with the highest median household income of $122,813 found in the 25 to 44 years age bracket for the primary householder. A total of 275 households (28.1%) fall into this category. Meanwhile, the 15 to 24 years age bracket for the primary householder has the lowest median household income of $0, with 15 households (1.5%) in this group.
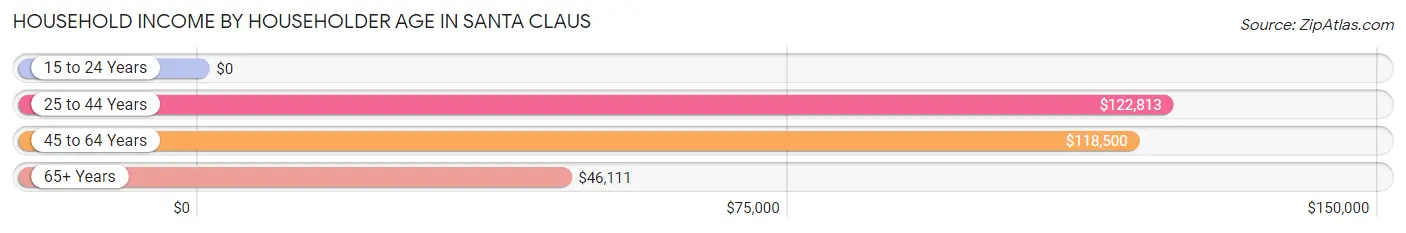
| Income Bracket | # Households | Median Income |
| 15 to 24 Years | 15 (1.5%) | $0 |
| 25 to 44 Years | 275 (28.1%) | $122,813 |
| 45 to 64 Years | 434 (44.3%) | $118,500 |
| 65+ Years | 256 (26.1%) | $46,111 |
| Total | 980 (100.0%) | $107,083 |
Poverty in Santa Claus
Income Below Poverty by Sex and Age in Santa Claus
With 1.6% poverty level for males and 4.9% for females among the residents of Santa Claus, 65 to 74 year old males and 25 to 34 year old females are the most vulnerable to poverty, with 16 males (21.3%) and 16 females (13.9%) in their respective age groups living below the poverty level.
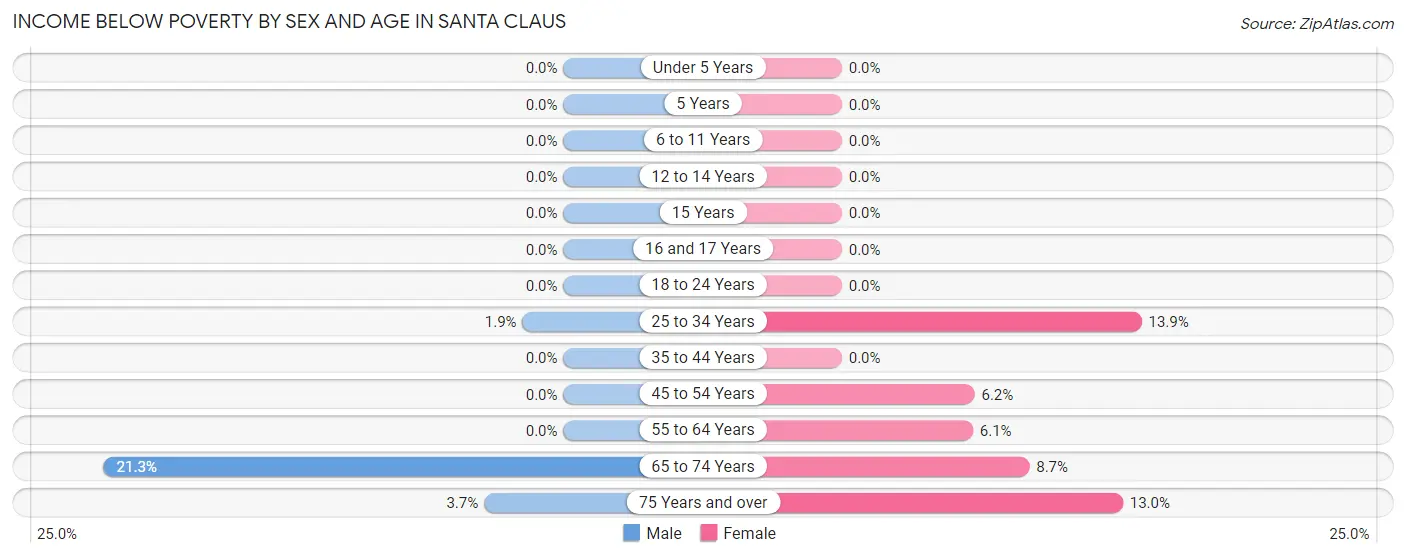
| Age Bracket | Male | Female |
| Under 5 Years | 0 (0.0%) | 0 (0.0%) |
| 5 Years | 0 (0.0%) | 0 (0.0%) |
| 6 to 11 Years | 0 (0.0%) | 0 (0.0%) |
| 12 to 14 Years | 0 (0.0%) | 0 (0.0%) |
| 15 Years | 0 (0.0%) | 0 (0.0%) |
| 16 and 17 Years | 0 (0.0%) | 0 (0.0%) |
| 18 to 24 Years | 0 (0.0%) | 0 (0.0%) |
| 25 to 34 Years | 2 (1.9%) | 16 (13.9%) |
| 35 to 44 Years | 0 (0.0%) | 0 (0.0%) |
| 45 to 54 Years | 0 (0.0%) | 13 (6.2%) |
| 55 to 64 Years | 0 (0.0%) | 11 (6.1%) |
| 65 to 74 Years | 16 (21.3%) | 10 (8.7%) |
| 75 Years and over | 6 (3.7%) | 12 (13.0%) |
| Total | 24 (1.6%) | 62 (4.9%) |
Income Above Poverty by Sex and Age in Santa Claus
According to the poverty statistics in Santa Claus, males aged under 5 years and females aged under 5 years are the age groups that are most secure financially, with 100.0% of males and 100.0% of females in these age groups living above the poverty line.
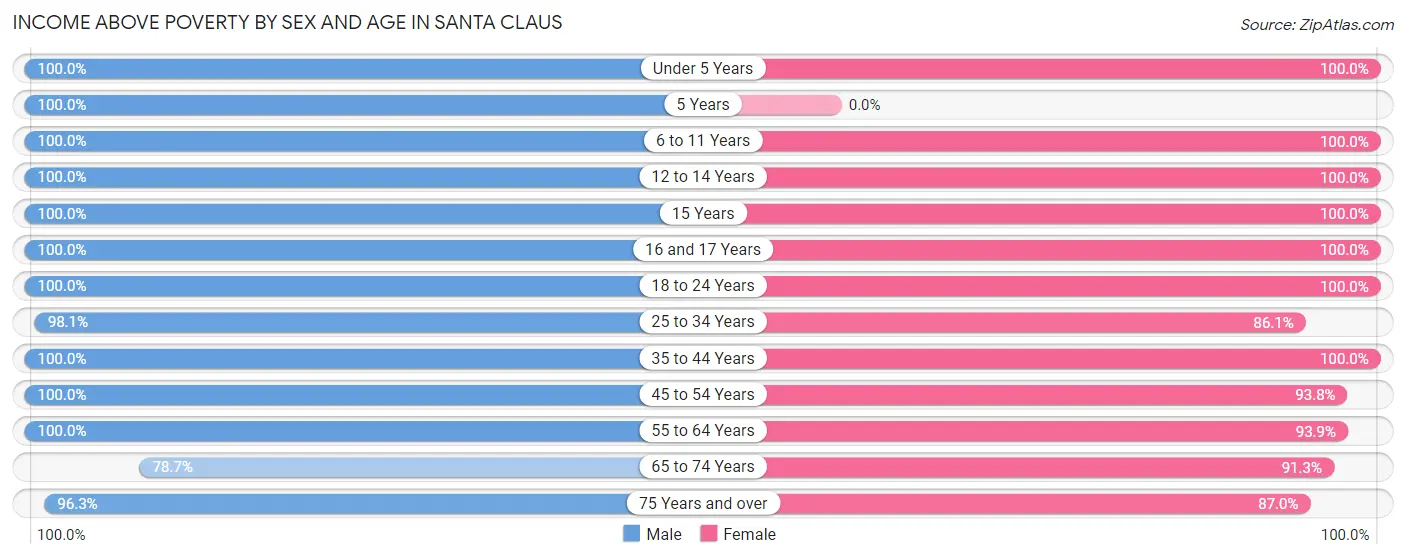
| Age Bracket | Male | Female |
| Under 5 Years | 101 (100.0%) | 82 (100.0%) |
| 5 Years | 10 (100.0%) | 0 (0.0%) |
| 6 to 11 Years | 118 (100.0%) | 73 (100.0%) |
| 12 to 14 Years | 92 (100.0%) | 86 (100.0%) |
| 15 Years | 46 (100.0%) | 20 (100.0%) |
| 16 and 17 Years | 38 (100.0%) | 71 (100.0%) |
| 18 to 24 Years | 138 (100.0%) | 40 (100.0%) |
| 25 to 34 Years | 103 (98.1%) | 99 (86.1%) |
| 35 to 44 Years | 172 (100.0%) | 178 (100.0%) |
| 45 to 54 Years | 197 (100.0%) | 198 (93.8%) |
| 55 to 64 Years | 212 (100.0%) | 170 (93.9%) |
| 65 to 74 Years | 59 (78.7%) | 105 (91.3%) |
| 75 Years and over | 157 (96.3%) | 80 (87.0%) |
| Total | 1,443 (98.4%) | 1,202 (95.1%) |
Income Below Poverty Among Married-Couple Families in Santa Claus
The poverty statistics for married-couple families in Santa Claus show that 3.2% or 22 of the total 684 families live below the poverty line. Families with no children have the highest poverty rate of 5.5%, comprising of 22 families. On the other hand, families with 1 or 2 children have the lowest poverty rate of 0.0%, which includes 0 families.
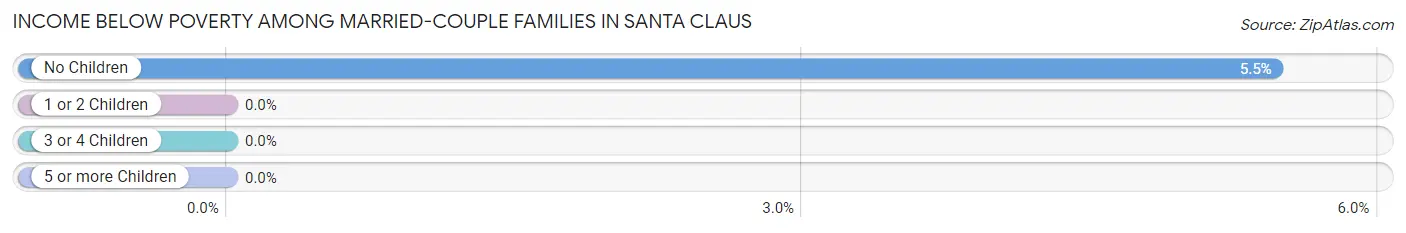
| Children | Above Poverty | Below Poverty |
| No Children | 381 (94.5%) | 22 (5.5%) |
| 1 or 2 Children | 246 (100.0%) | 0 (0.0%) |
| 3 or 4 Children | 35 (100.0%) | 0 (0.0%) |
| 5 or more Children | 0 (0.0%) | 0 (0.0%) |
| Total | 662 (96.8%) | 22 (3.2%) |
Income Below Poverty Among Single-Parent Households in Santa Claus
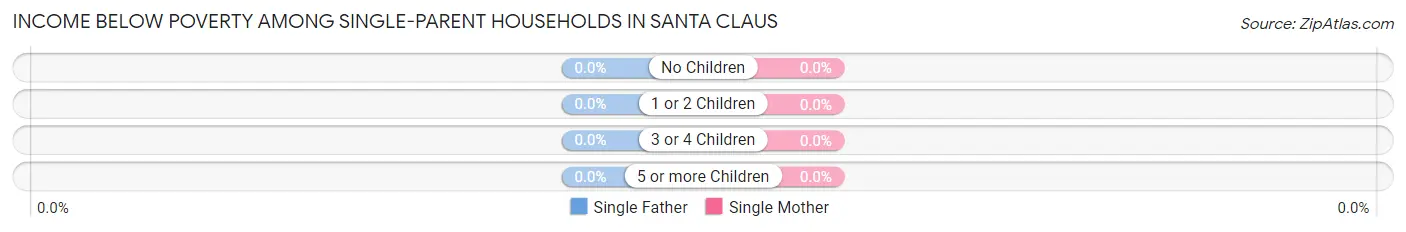
| Children | Single Father | Single Mother |
| No Children | 0 (0.0%) | 0 (0.0%) |
| 1 or 2 Children | 0 (0.0%) | 0 (0.0%) |
| 3 or 4 Children | 0 (0.0%) | 0 (0.0%) |
| 5 or more Children | 0 (0.0%) | 0 (0.0%) |
| Total | 0 (0.0%) | 0 (0.0%) |
Income Below Poverty Among Married-Couple vs Single-Parent Households in Santa Claus
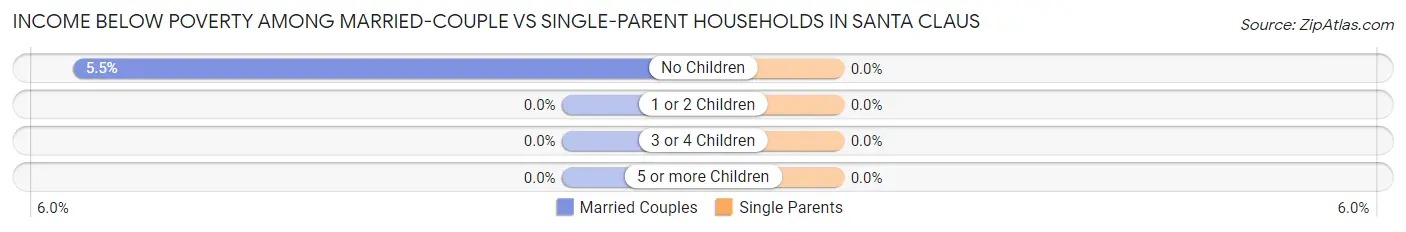
| Children | Married-Couple Families | Single-Parent Households |
| No Children | 22 (5.5%) | 0 (0.0%) |
| 1 or 2 Children | 0 (0.0%) | 0 (0.0%) |
| 3 or 4 Children | 0 (0.0%) | 0 (0.0%) |
| 5 or more Children | 0 (0.0%) | 0 (0.0%) |
| Total | 22 (3.2%) | 0 (0.0%) |
Employment Characteristics in Santa Claus
Employment by Class of Employer in Santa Claus
Among the 1,391 employed individuals in Santa Claus, private company employees (903 | 64.9%), not-for-profit organizations (169 | 12.1%), and local government employees (120 | 8.6%) make up the most common classes of employment.
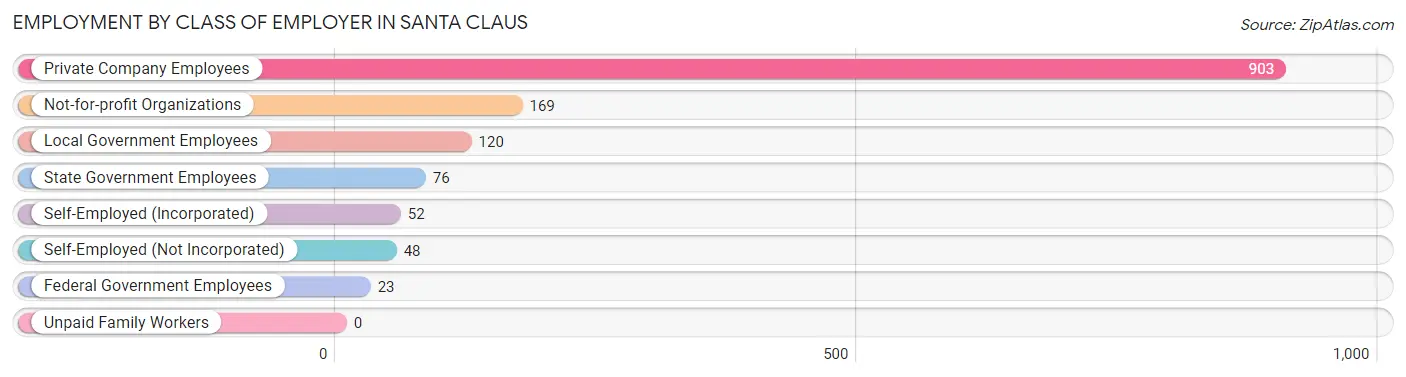
| Employer Class | # Employees | % Employees |
| Private Company Employees | 903 | 64.9% |
| Self-Employed (Incorporated) | 52 | 3.7% |
| Self-Employed (Not Incorporated) | 48 | 3.5% |
| Not-for-profit Organizations | 169 | 12.1% |
| Local Government Employees | 120 | 8.6% |
| State Government Employees | 76 | 5.5% |
| Federal Government Employees | 23 | 1.7% |
| Unpaid Family Workers | 0 | 0.0% |
| Total | 1,391 | 100.0% |
Employment Status by Age in Santa Claus
According to the labor force statistics for Santa Claus, out of the total population over 16 years of age (2,103), 68.8% or 1,447 individuals are in the labor force, with 0.8% or 12 of them unemployed. The age group with the highest labor force participation rate is 20 to 24 years, with 95.1% or 136 individuals in the labor force. Within the labor force, the 20 to 24 years age range has the highest percentage of unemployed individuals, with 8.1% or 11 of them being unemployed.
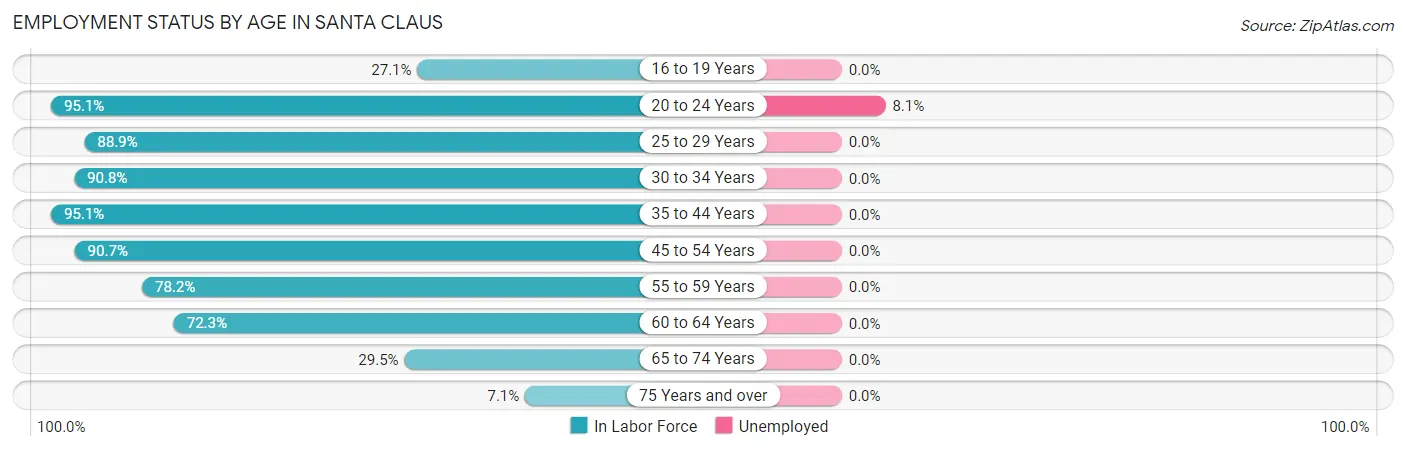
| Age Bracket | In Labor Force | Unemployed |
| 16 to 19 Years | 39 (27.1%) | 0 (0.0%) |
| 20 to 24 Years | 136 (95.1%) | 11 (8.1%) |
| 25 to 29 Years | 128 (88.9%) | 0 (0.0%) |
| 30 to 34 Years | 69 (90.8%) | 0 (0.0%) |
| 35 to 44 Years | 333 (95.1%) | 0 (0.0%) |
| 45 to 54 Years | 370 (90.7%) | 0 (0.0%) |
| 55 to 59 Years | 186 (78.2%) | 0 (0.0%) |
| 60 to 64 Years | 112 (72.3%) | 0 (0.0%) |
| 65 to 74 Years | 56 (29.5%) | 0 (0.0%) |
| 75 Years and over | 18 (7.1%) | 0 (0.0%) |
| Total | 1,447 (68.8%) | 12 (0.8%) |
Employment Status by Educational Attainment in Santa Claus
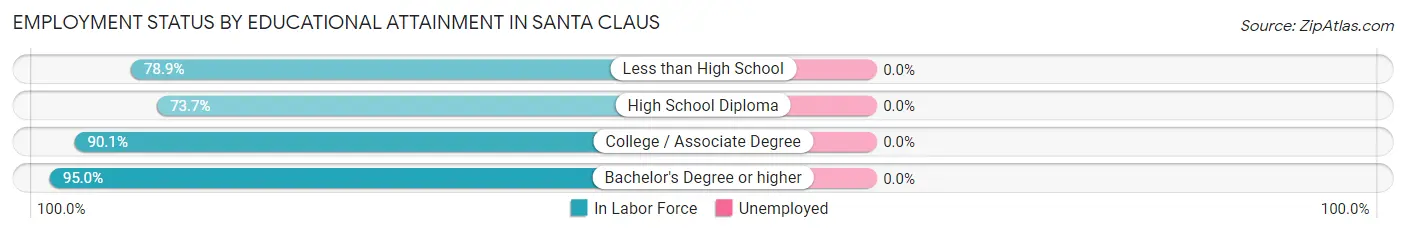
| Educational Attainment | In Labor Force | Unemployed |
| Less than High School | 15 (78.9%) | 0 (0.0%) |
| High School Diploma | 280 (73.7%) | 0 (0.0%) |
| College / Associate Degree | 372 (90.1%) | 0 (0.0%) |
| Bachelor's Degree or higher | 531 (95.0%) | 0 (0.0%) |
| Total | 1,198 (87.4%) | 0 (0.0%) |
Employment Occupations by Sex in Santa Claus
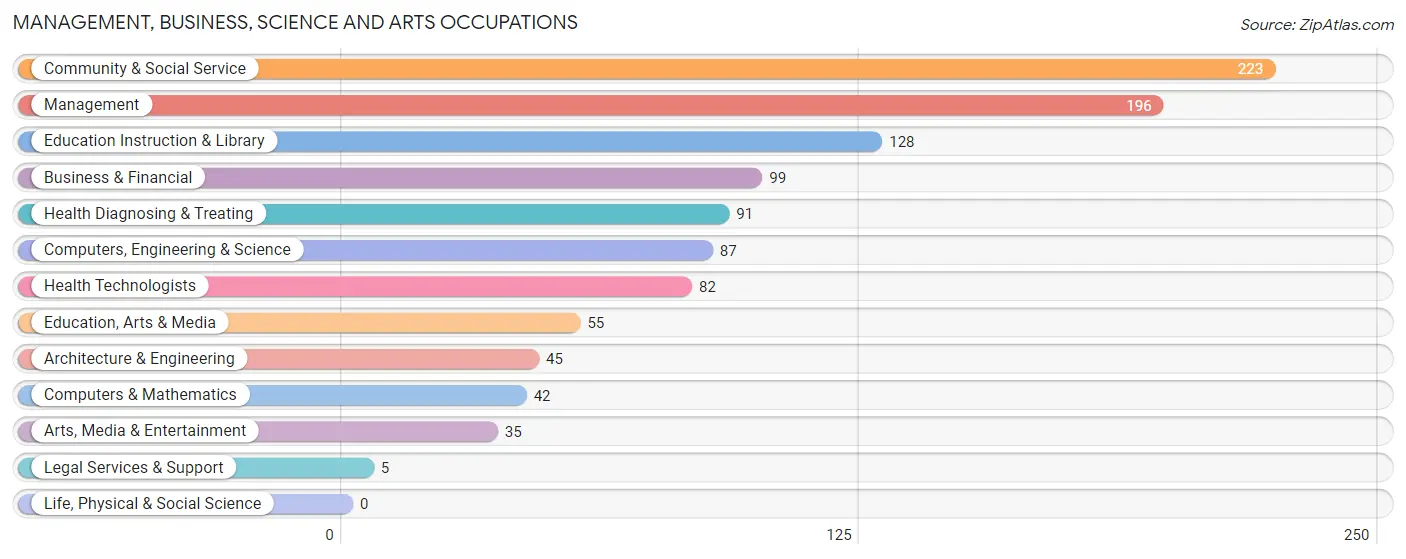
Management, Business, Science and Arts Occupations
The most common Management, Business, Science and Arts occupations in Santa Claus are Community & Social Service (223 | 15.8%), Management (196 | 13.9%), Education Instruction & Library (128 | 9.0%), Business & Financial (99 | 7.0%), and Health Diagnosing & Treating (91 | 6.4%).
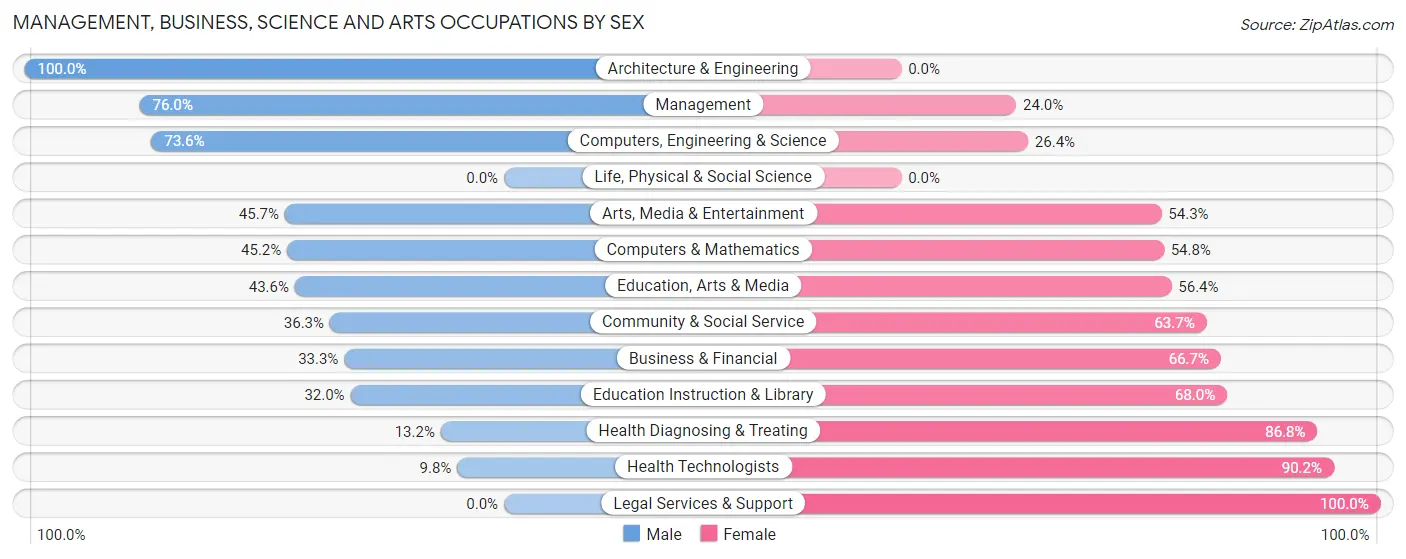
Management, Business, Science and Arts Occupations by Sex
Within the Management, Business, Science and Arts occupations in Santa Claus, the most male-oriented occupations are Architecture & Engineering (100.0%), Management (76.0%), and Computers, Engineering & Science (73.6%), while the most female-oriented occupations are Legal Services & Support (100.0%), Health Technologists (90.2%), and Health Diagnosing & Treating (86.8%).
| Occupation | Male | Female |
| Management | 149 (76.0%) | 47 (24.0%) |
| Business & Financial | 33 (33.3%) | 66 (66.7%) |
| Computers, Engineering & Science | 64 (73.6%) | 23 (26.4%) |
| Computers & Mathematics | 19 (45.2%) | 23 (54.8%) |
| Architecture & Engineering | 45 (100.0%) | 0 (0.0%) |
| Life, Physical & Social Science | 0 (0.0%) | 0 (0.0%) |
| Community & Social Service | 81 (36.3%) | 142 (63.7%) |
| Education, Arts & Media | 24 (43.6%) | 31 (56.4%) |
| Legal Services & Support | 0 (0.0%) | 5 (100.0%) |
| Education Instruction & Library | 41 (32.0%) | 87 (68.0%) |
| Arts, Media & Entertainment | 16 (45.7%) | 19 (54.3%) |
| Health Diagnosing & Treating | 12 (13.2%) | 79 (86.8%) |
| Health Technologists | 8 (9.8%) | 74 (90.2%) |
| Total (Category) | 339 (48.7%) | 357 (51.3%) |
| Total (Overall) | 810 (57.2%) | 605 (42.8%) |
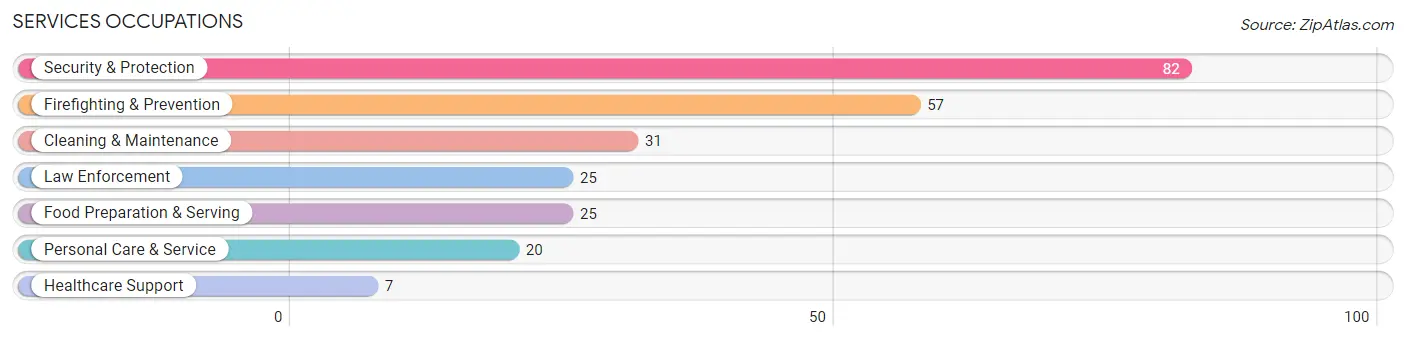
Services Occupations
The most common Services occupations in Santa Claus are Security & Protection (82 | 5.8%), Firefighting & Prevention (57 | 4.0%), Cleaning & Maintenance (31 | 2.2%), Law Enforcement (25 | 1.8%), and Food Preparation & Serving (25 | 1.8%).
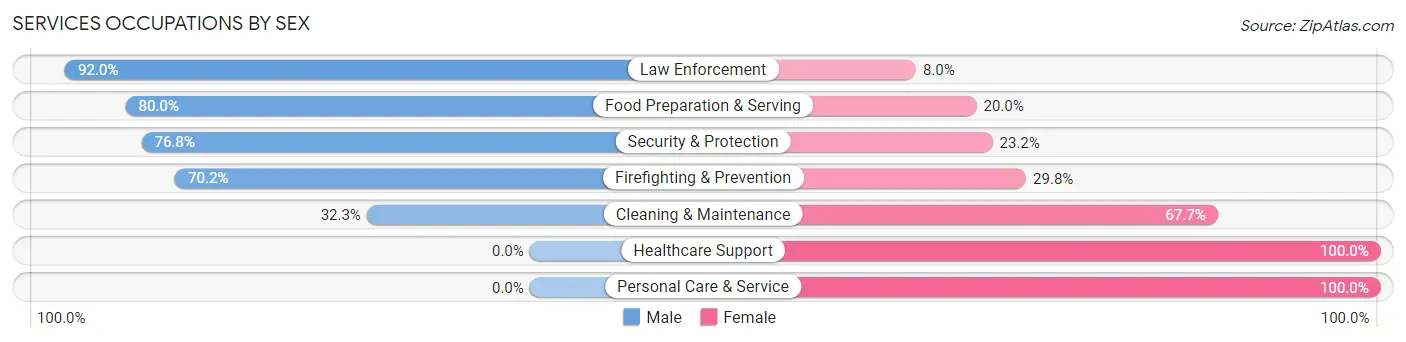
Services Occupations by Sex
Within the Services occupations in Santa Claus, the most male-oriented occupations are Law Enforcement (92.0%), Food Preparation & Serving (80.0%), and Security & Protection (76.8%), while the most female-oriented occupations are Healthcare Support (100.0%), Personal Care & Service (100.0%), and Cleaning & Maintenance (67.7%).
| Occupation | Male | Female |
| Healthcare Support | 0 (0.0%) | 7 (100.0%) |
| Security & Protection | 63 (76.8%) | 19 (23.2%) |
| Firefighting & Prevention | 40 (70.2%) | 17 (29.8%) |
| Law Enforcement | 23 (92.0%) | 2 (8.0%) |
| Food Preparation & Serving | 20 (80.0%) | 5 (20.0%) |
| Cleaning & Maintenance | 10 (32.3%) | 21 (67.7%) |
| Personal Care & Service | 0 (0.0%) | 20 (100.0%) |
| Total (Category) | 93 (56.4%) | 72 (43.6%) |
| Total (Overall) | 810 (57.2%) | 605 (42.8%) |
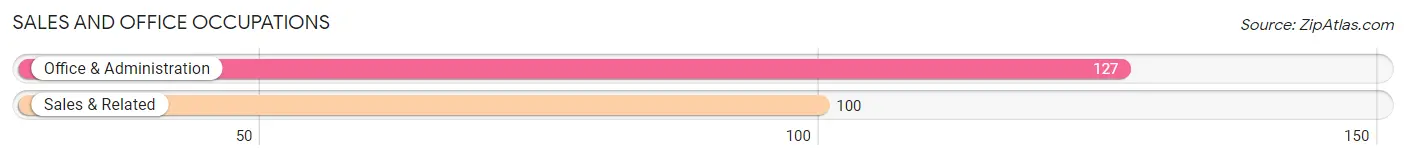
Sales and Office Occupations
The most common Sales and Office occupations in Santa Claus are Office & Administration (127 | 9.0%), and Sales & Related (100 | 7.1%).
Sales and Office Occupations by Sex
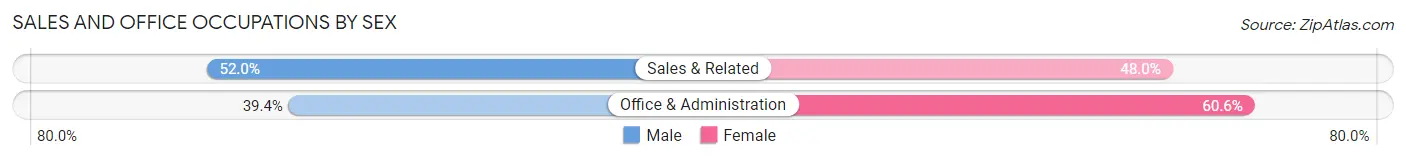
| Occupation | Male | Female |
| Sales & Related | 52 (52.0%) | 48 (48.0%) |
| Office & Administration | 50 (39.4%) | 77 (60.6%) |
| Total (Category) | 102 (44.9%) | 125 (55.1%) |
| Total (Overall) | 810 (57.2%) | 605 (42.8%) |
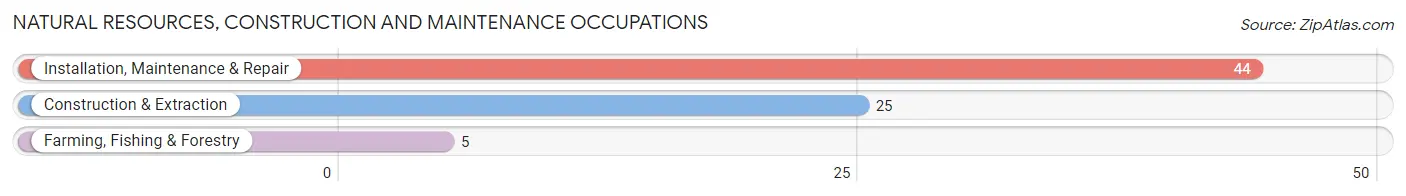
Natural Resources, Construction and Maintenance Occupations
The most common Natural Resources, Construction and Maintenance occupations in Santa Claus are Installation, Maintenance & Repair (44 | 3.1%), Construction & Extraction (25 | 1.8%), and Farming, Fishing & Forestry (5 | 0.4%).
Natural Resources, Construction and Maintenance Occupations by Sex
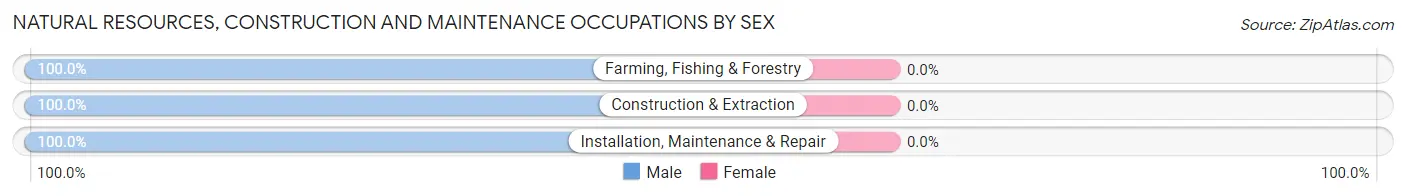
| Occupation | Male | Female |
| Farming, Fishing & Forestry | 5 (100.0%) | 0 (0.0%) |
| Construction & Extraction | 25 (100.0%) | 0 (0.0%) |
| Installation, Maintenance & Repair | 44 (100.0%) | 0 (0.0%) |
| Total (Category) | 74 (100.0%) | 0 (0.0%) |
| Total (Overall) | 810 (57.2%) | 605 (42.8%) |
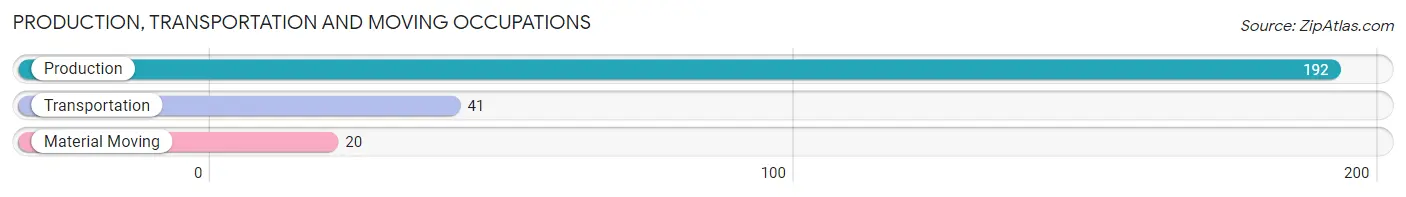
Production, Transportation and Moving Occupations
The most common Production, Transportation and Moving occupations in Santa Claus are Production (192 | 13.6%), Transportation (41 | 2.9%), and Material Moving (20 | 1.4%).
Production, Transportation and Moving Occupations by Sex
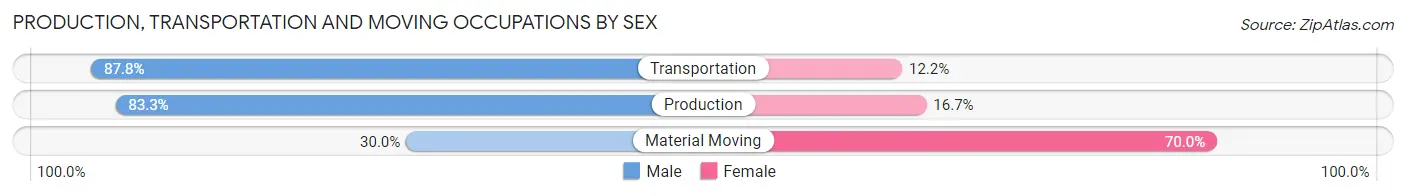
| Occupation | Male | Female |
| Production | 160 (83.3%) | 32 (16.7%) |
| Transportation | 36 (87.8%) | 5 (12.2%) |
| Material Moving | 6 (30.0%) | 14 (70.0%) |
| Total (Category) | 202 (79.8%) | 51 (20.2%) |
| Total (Overall) | 810 (57.2%) | 605 (42.8%) |
Employment Industries by Sex in Santa Claus
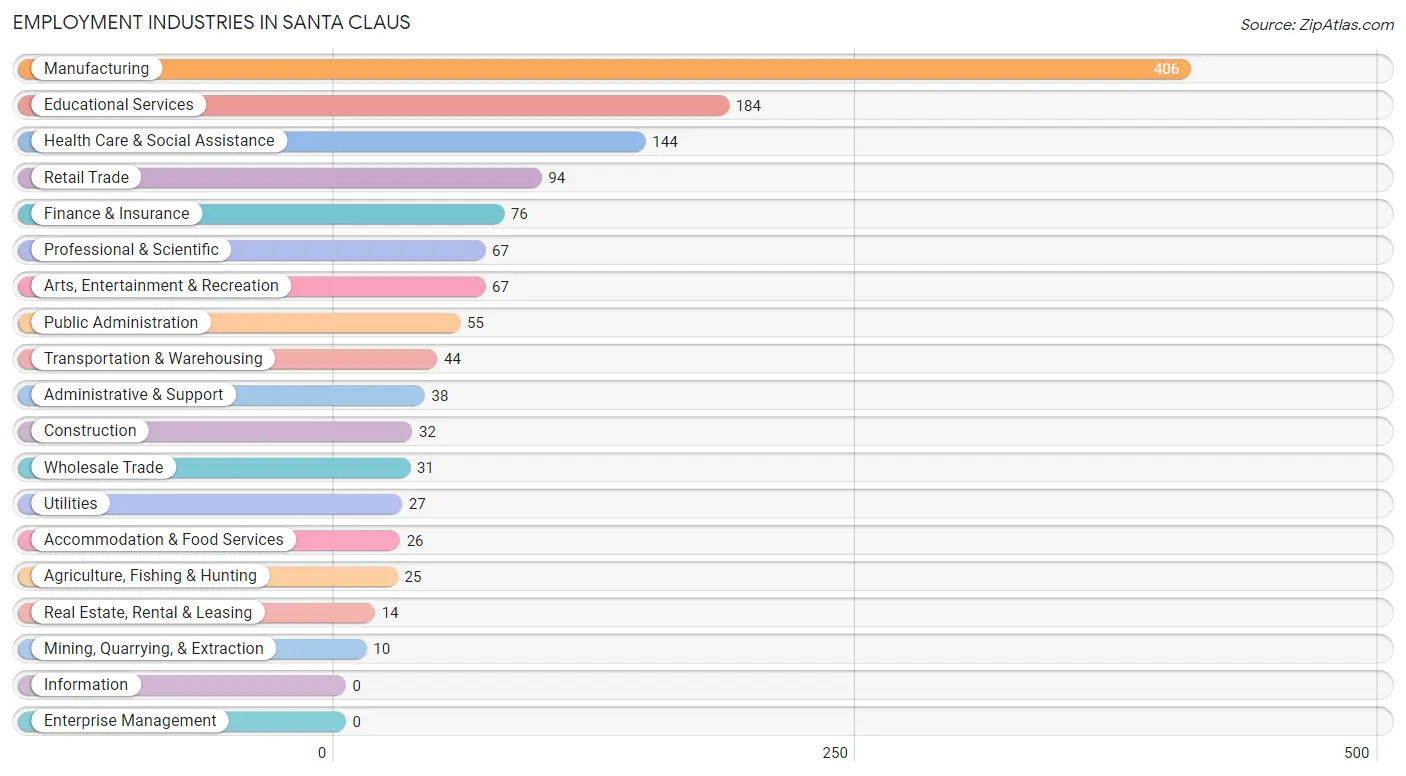
Employment Industries in Santa Claus
The major employment industries in Santa Claus include Manufacturing (406 | 28.7%), Educational Services (184 | 13.0%), Health Care & Social Assistance (144 | 10.2%), Retail Trade (94 | 6.6%), and Finance & Insurance (76 | 5.4%).
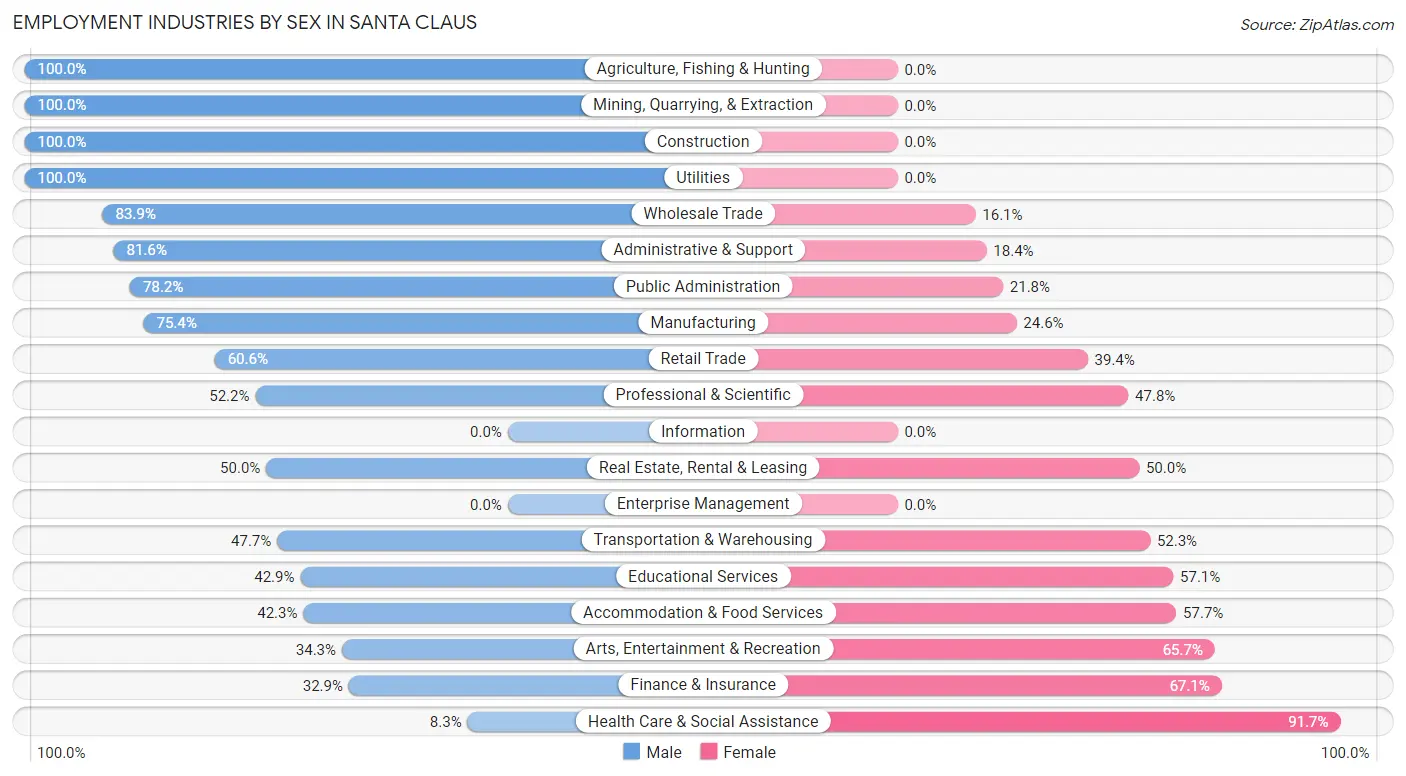
Employment Industries by Sex in Santa Claus
The Santa Claus industries that see more men than women are Agriculture, Fishing & Hunting (100.0%), Mining, Quarrying, & Extraction (100.0%), and Construction (100.0%), whereas the industries that tend to have a higher number of women are Health Care & Social Assistance (91.7%), Finance & Insurance (67.1%), and Arts, Entertainment & Recreation (65.7%).
| Industry | Male | Female |
| Agriculture, Fishing & Hunting | 25 (100.0%) | 0 (0.0%) |
| Mining, Quarrying, & Extraction | 10 (100.0%) | 0 (0.0%) |
| Construction | 32 (100.0%) | 0 (0.0%) |
| Manufacturing | 306 (75.4%) | 100 (24.6%) |
| Wholesale Trade | 26 (83.9%) | 5 (16.1%) |
| Retail Trade | 57 (60.6%) | 37 (39.4%) |
| Transportation & Warehousing | 21 (47.7%) | 23 (52.3%) |
| Utilities | 27 (100.0%) | 0 (0.0%) |
| Information | 0 (0.0%) | 0 (0.0%) |
| Finance & Insurance | 25 (32.9%) | 51 (67.1%) |
| Real Estate, Rental & Leasing | 7 (50.0%) | 7 (50.0%) |
| Professional & Scientific | 35 (52.2%) | 32 (47.8%) |
| Enterprise Management | 0 (0.0%) | 0 (0.0%) |
| Administrative & Support | 31 (81.6%) | 7 (18.4%) |
| Educational Services | 79 (42.9%) | 105 (57.1%) |
| Health Care & Social Assistance | 12 (8.3%) | 132 (91.7%) |
| Arts, Entertainment & Recreation | 23 (34.3%) | 44 (65.7%) |
| Accommodation & Food Services | 11 (42.3%) | 15 (57.7%) |
| Public Administration | 43 (78.2%) | 12 (21.8%) |
| Total | 810 (57.2%) | 605 (42.8%) |
Education in Santa Claus
School Enrollment in Santa Claus
The most common levels of schooling among the 705 students in Santa Claus are high school (215 | 30.5%), middle school (205 | 29.1%), and elementary school (145 | 20.6%).
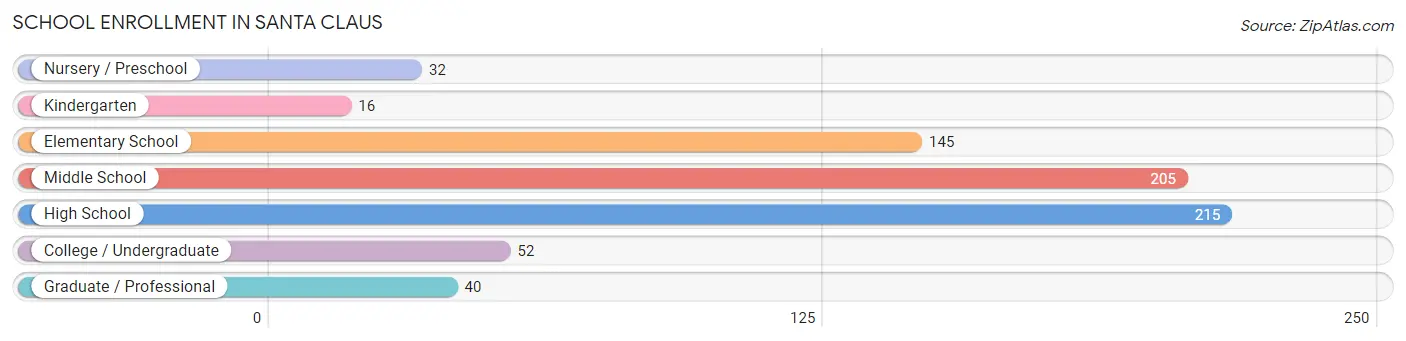
| School Level | # Students | % Students |
| Nursery / Preschool | 32 | 4.5% |
| Kindergarten | 16 | 2.3% |
| Elementary School | 145 | 20.6% |
| Middle School | 205 | 29.1% |
| High School | 215 | 30.5% |
| College / Undergraduate | 52 | 7.4% |
| Graduate / Professional | 40 | 5.7% |
| Total | 705 | 100.0% |
School Enrollment by Age by Funding Source in Santa Claus
Out of a total of 705 students who are enrolled in schools in Santa Claus, 75 (10.6%) attend a private institution, while the remaining 630 (89.4%) are enrolled in public schools. The age group of 25 to 34 year olds has the highest likelihood of being enrolled in private schools, with 8 (36.4% in the age bracket) enrolled. Conversely, the age group of 10 to 14 year olds has the lowest likelihood of being enrolled in a private school, with 236 (100.0% in the age bracket) attending a public institution.
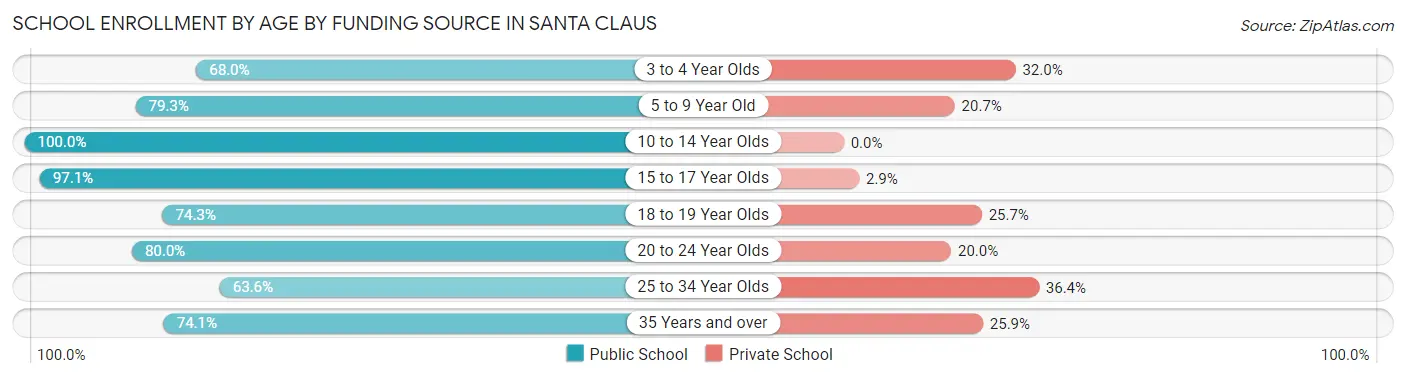
| Age Bracket | Public School | Private School |
| 3 to 4 Year Olds | 17 (68.0%) | 8 (32.0%) |
| 5 to 9 Year Old | 119 (79.3%) | 31 (20.7%) |
| 10 to 14 Year Olds | 236 (100.0%) | 0 (0.0%) |
| 15 to 17 Year Olds | 170 (97.1%) | 5 (2.9%) |
| 18 to 19 Year Olds | 26 (74.3%) | 9 (25.7%) |
| 20 to 24 Year Olds | 28 (80.0%) | 7 (20.0%) |
| 25 to 34 Year Olds | 14 (63.6%) | 8 (36.4%) |
| 35 Years and over | 20 (74.1%) | 7 (25.9%) |
| Total | 630 (89.4%) | 75 (10.6%) |
Educational Attainment by Field of Study in Santa Claus
Education (147 | 20.9%), business (124 | 17.6%), science & technology (86 | 12.2%), social sciences (51 | 7.2%), and arts & humanities (47 | 6.7%) are the most common fields of study among 704 individuals in Santa Claus who have obtained a bachelor's degree or higher.
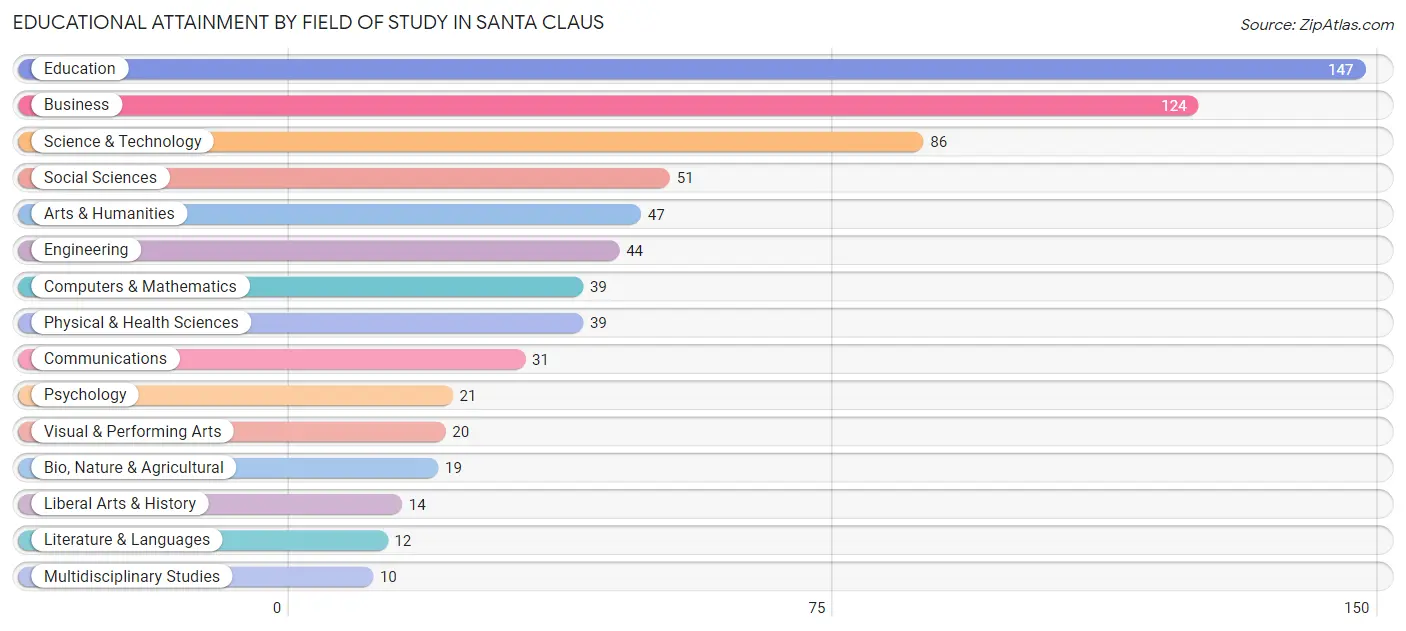
| Field of Study | # Graduates | % Graduates |
| Computers & Mathematics | 39 | 5.5% |
| Bio, Nature & Agricultural | 19 | 2.7% |
| Physical & Health Sciences | 39 | 5.5% |
| Psychology | 21 | 3.0% |
| Social Sciences | 51 | 7.2% |
| Engineering | 44 | 6.2% |
| Multidisciplinary Studies | 10 | 1.4% |
| Science & Technology | 86 | 12.2% |
| Business | 124 | 17.6% |
| Education | 147 | 20.9% |
| Literature & Languages | 12 | 1.7% |
| Liberal Arts & History | 14 | 2.0% |
| Visual & Performing Arts | 20 | 2.8% |
| Communications | 31 | 4.4% |
| Arts & Humanities | 47 | 6.7% |
| Total | 704 | 100.0% |
Transportation & Commute in Santa Claus
Vehicle Availability by Sex in Santa Claus
The most prevalent vehicle ownership categories in Santa Claus are males with 2 vehicles (277, accounting for 35.5%) and females with 2 vehicles (228, making up 45.3%).
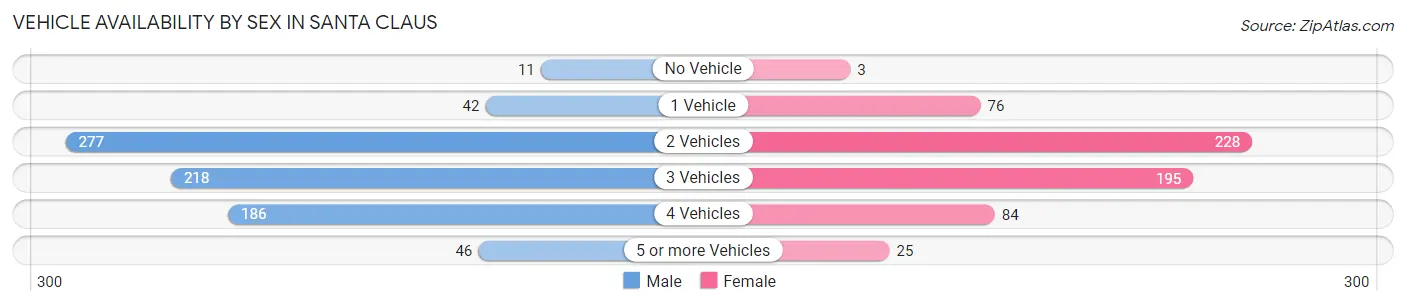
| Vehicles Available | Male | Female |
| No Vehicle | 11 (1.4%) | 3 (0.5%) |
| 1 Vehicle | 42 (5.4%) | 76 (12.4%) |
| 2 Vehicles | 277 (35.5%) | 228 (37.3%) |
| 3 Vehicles | 218 (28.0%) | 195 (31.9%) |
| 4 Vehicles | 186 (23.8%) | 84 (13.8%) |
| 5 or more Vehicles | 46 (5.9%) | 25 (4.1%) |
| Total | 780 (100.0%) | 611 (100.0%) |
Commute Time in Santa Claus
The most frequently occuring commute durations in Santa Claus are 5 to 9 minutes (208 commuters, 16.0%), 30 to 34 minutes (169 commuters, 13.0%), and 10 to 14 minutes (144 commuters, 11.1%).
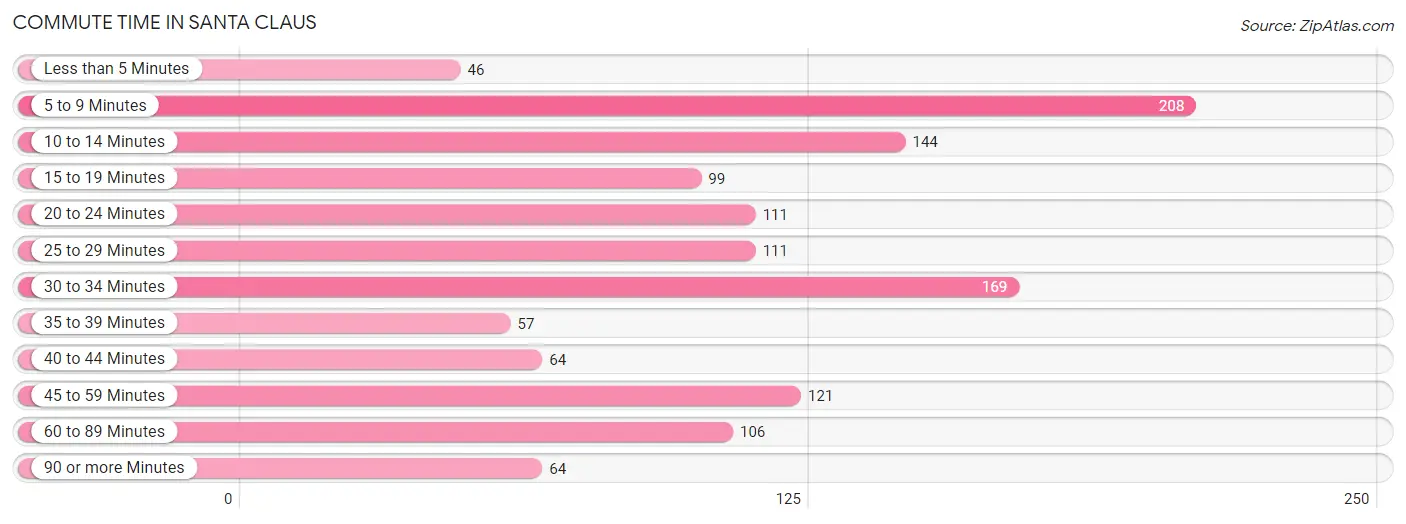
| Commute Time | # Commuters | % Commuters |
| Less than 5 Minutes | 46 | 3.5% |
| 5 to 9 Minutes | 208 | 16.0% |
| 10 to 14 Minutes | 144 | 11.1% |
| 15 to 19 Minutes | 99 | 7.6% |
| 20 to 24 Minutes | 111 | 8.5% |
| 25 to 29 Minutes | 111 | 8.5% |
| 30 to 34 Minutes | 169 | 13.0% |
| 35 to 39 Minutes | 57 | 4.4% |
| 40 to 44 Minutes | 64 | 4.9% |
| 45 to 59 Minutes | 121 | 9.3% |
| 60 to 89 Minutes | 106 | 8.2% |
| 90 or more Minutes | 64 | 4.9% |
Commute Time by Sex in Santa Claus
The most common commute times in Santa Claus are 10 to 14 minutes (97 commuters, 12.9%) for males and 5 to 9 minutes (114 commuters, 20.7%) for females.
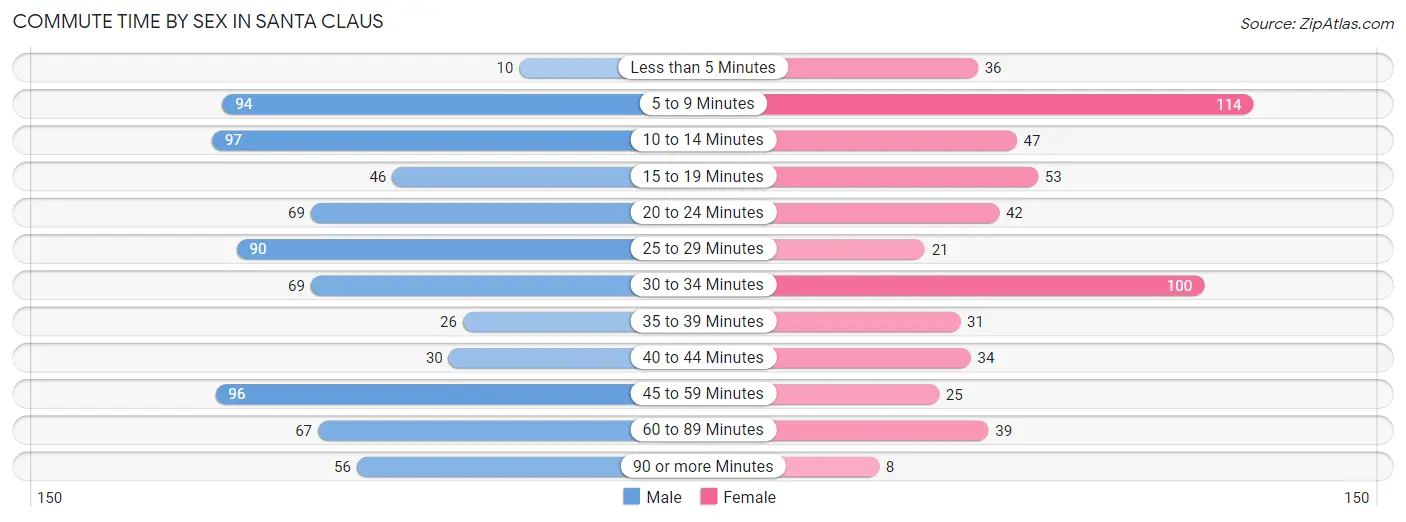
| Commute Time | Male | Female |
| Less than 5 Minutes | 10 (1.3%) | 36 (6.6%) |
| 5 to 9 Minutes | 94 (12.5%) | 114 (20.7%) |
| 10 to 14 Minutes | 97 (12.9%) | 47 (8.6%) |
| 15 to 19 Minutes | 46 (6.1%) | 53 (9.6%) |
| 20 to 24 Minutes | 69 (9.2%) | 42 (7.6%) |
| 25 to 29 Minutes | 90 (12.0%) | 21 (3.8%) |
| 30 to 34 Minutes | 69 (9.2%) | 100 (18.2%) |
| 35 to 39 Minutes | 26 (3.5%) | 31 (5.6%) |
| 40 to 44 Minutes | 30 (4.0%) | 34 (6.2%) |
| 45 to 59 Minutes | 96 (12.8%) | 25 (4.5%) |
| 60 to 89 Minutes | 67 (8.9%) | 39 (7.1%) |
| 90 or more Minutes | 56 (7.5%) | 8 (1.5%) |
Time of Departure to Work by Sex in Santa Claus
The most frequent times of departure to work in Santa Claus are 7:00 AM to 7:29 AM (128, 17.1%) for males and 6:30 AM to 6:59 AM (104, 18.9%) for females.
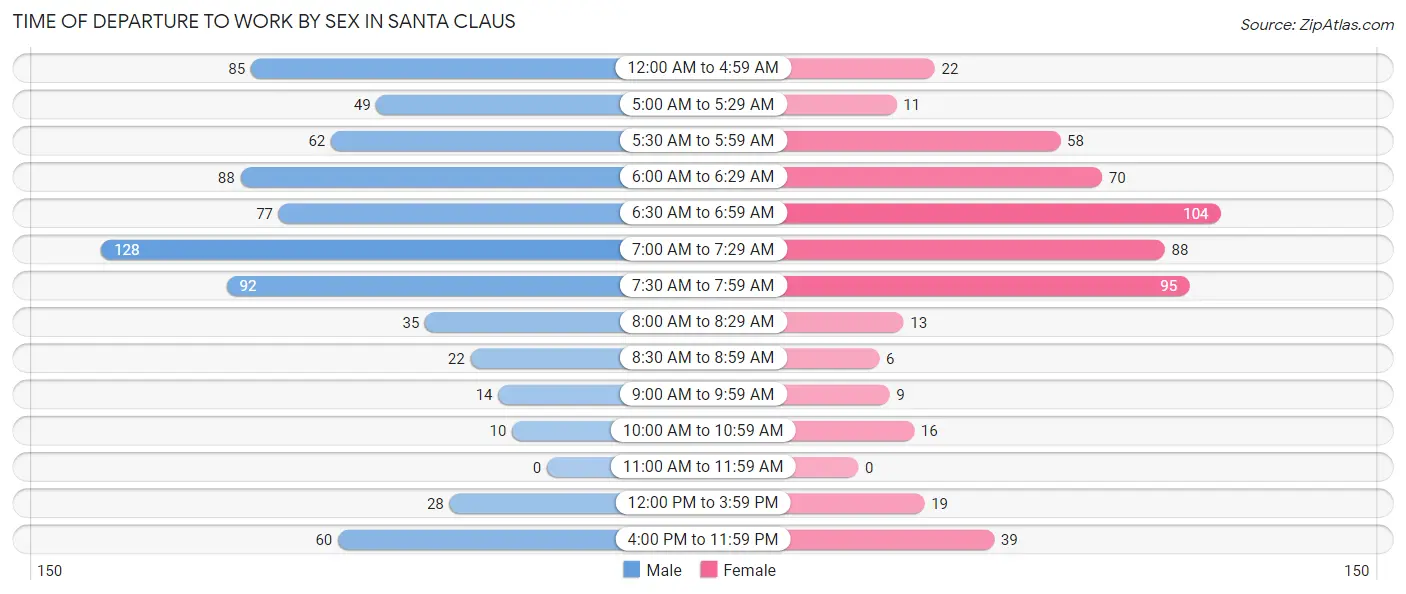
| Time of Departure | Male | Female |
| 12:00 AM to 4:59 AM | 85 (11.3%) | 22 (4.0%) |
| 5:00 AM to 5:29 AM | 49 (6.5%) | 11 (2.0%) |
| 5:30 AM to 5:59 AM | 62 (8.3%) | 58 (10.5%) |
| 6:00 AM to 6:29 AM | 88 (11.7%) | 70 (12.7%) |
| 6:30 AM to 6:59 AM | 77 (10.3%) | 104 (18.9%) |
| 7:00 AM to 7:29 AM | 128 (17.1%) | 88 (16.0%) |
| 7:30 AM to 7:59 AM | 92 (12.3%) | 95 (17.3%) |
| 8:00 AM to 8:29 AM | 35 (4.7%) | 13 (2.4%) |
| 8:30 AM to 8:59 AM | 22 (2.9%) | 6 (1.1%) |
| 9:00 AM to 9:59 AM | 14 (1.9%) | 9 (1.6%) |
| 10:00 AM to 10:59 AM | 10 (1.3%) | 16 (2.9%) |
| 11:00 AM to 11:59 AM | 0 (0.0%) | 0 (0.0%) |
| 12:00 PM to 3:59 PM | 28 (3.7%) | 19 (3.5%) |
| 4:00 PM to 11:59 PM | 60 (8.0%) | 39 (7.1%) |
| Total | 750 (100.0%) | 550 (100.0%) |
Housing Occupancy in Santa Claus
Occupancy by Ownership in Santa Claus
Of the total 980 dwellings in Santa Claus, owner-occupied units account for 908 (92.6%), while renter-occupied units make up 72 (7.3%).
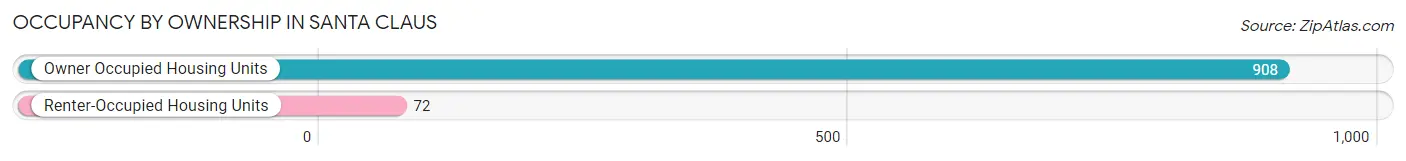
| Occupancy | # Housing Units | % Housing Units |
| Owner Occupied Housing Units | 908 | 92.6% |
| Renter-Occupied Housing Units | 72 | 7.3% |
| Total Occupied Housing Units | 980 | 100.0% |
Occupancy by Household Size in Santa Claus
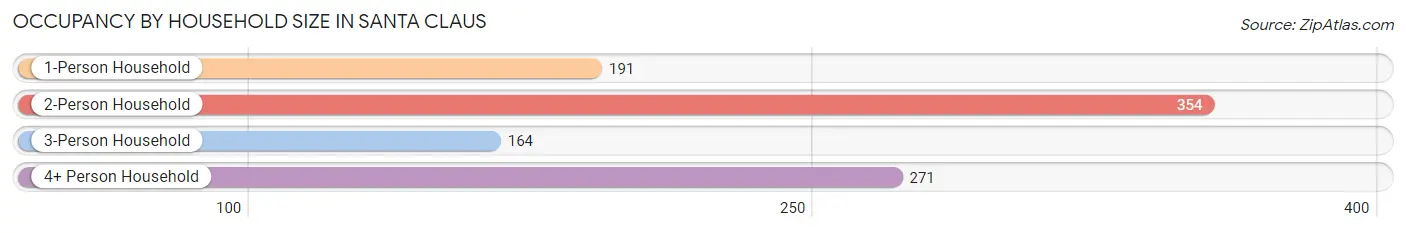
| Household Size | # Housing Units | % Housing Units |
| 1-Person Household | 191 | 19.5% |
| 2-Person Household | 354 | 36.1% |
| 3-Person Household | 164 | 16.7% |
| 4+ Person Household | 271 | 27.7% |
| Total Housing Units | 980 | 100.0% |
Occupancy by Ownership by Household Size in Santa Claus
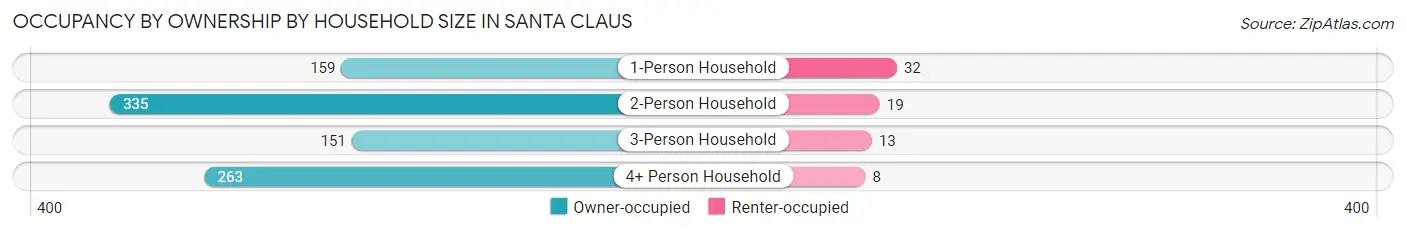
| Household Size | Owner-occupied | Renter-occupied |
| 1-Person Household | 159 (83.3%) | 32 (16.8%) |
| 2-Person Household | 335 (94.6%) | 19 (5.4%) |
| 3-Person Household | 151 (92.1%) | 13 (7.9%) |
| 4+ Person Household | 263 (97.1%) | 8 (2.9%) |
| Total Housing Units | 908 (92.6%) | 72 (7.3%) |
Occupancy by Educational Attainment in Santa Claus
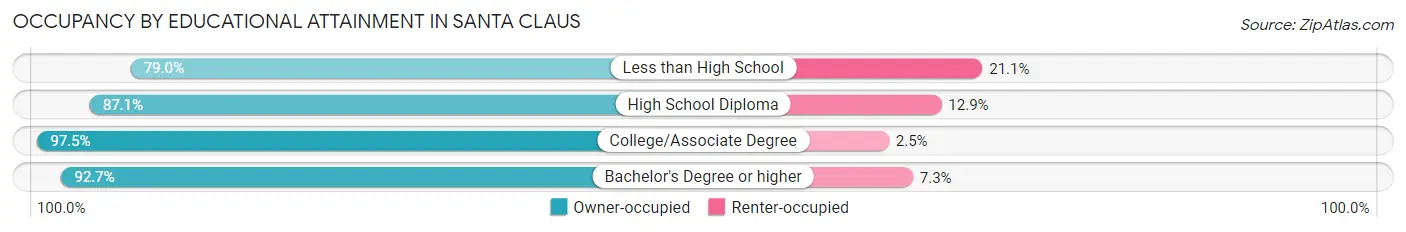
| Household Size | Owner-occupied | Renter-occupied |
| Less than High School | 15 (78.9%) | 4 (21.0%) |
| High School Diploma | 202 (87.1%) | 30 (12.9%) |
| College/Associate Degree | 309 (97.5%) | 8 (2.5%) |
| Bachelor's Degree or higher | 382 (92.7%) | 30 (7.3%) |
Occupancy by Age of Householder in Santa Claus
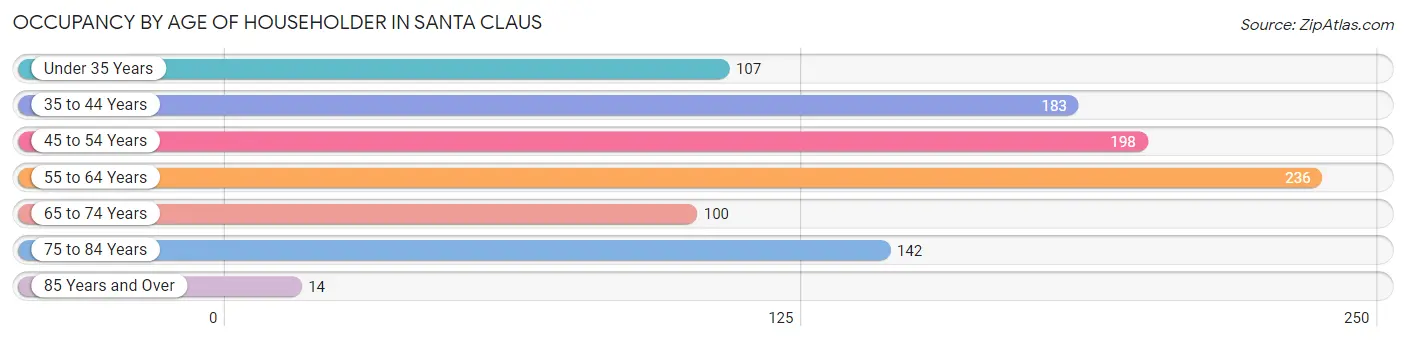
| Age Bracket | # Households | % Households |
| Under 35 Years | 107 | 10.9% |
| 35 to 44 Years | 183 | 18.7% |
| 45 to 54 Years | 198 | 20.2% |
| 55 to 64 Years | 236 | 24.1% |
| 65 to 74 Years | 100 | 10.2% |
| 75 to 84 Years | 142 | 14.5% |
| 85 Years and Over | 14 | 1.4% |
| Total | 980 | 100.0% |
Housing Finances in Santa Claus
Median Income by Occupancy in Santa Claus
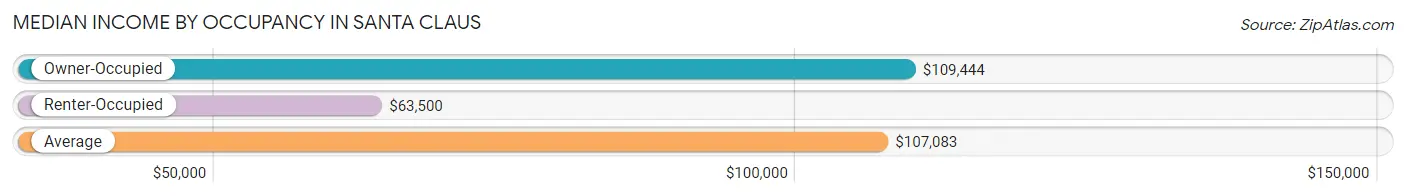
| Occupancy Type | # Households | Median Income |
| Owner-Occupied | 908 (92.6%) | $109,444 |
| Renter-Occupied | 72 (7.3%) | $63,500 |
| Average | 980 (100.0%) | $107,083 |
Occupancy by Householder Income Bracket in Santa Claus
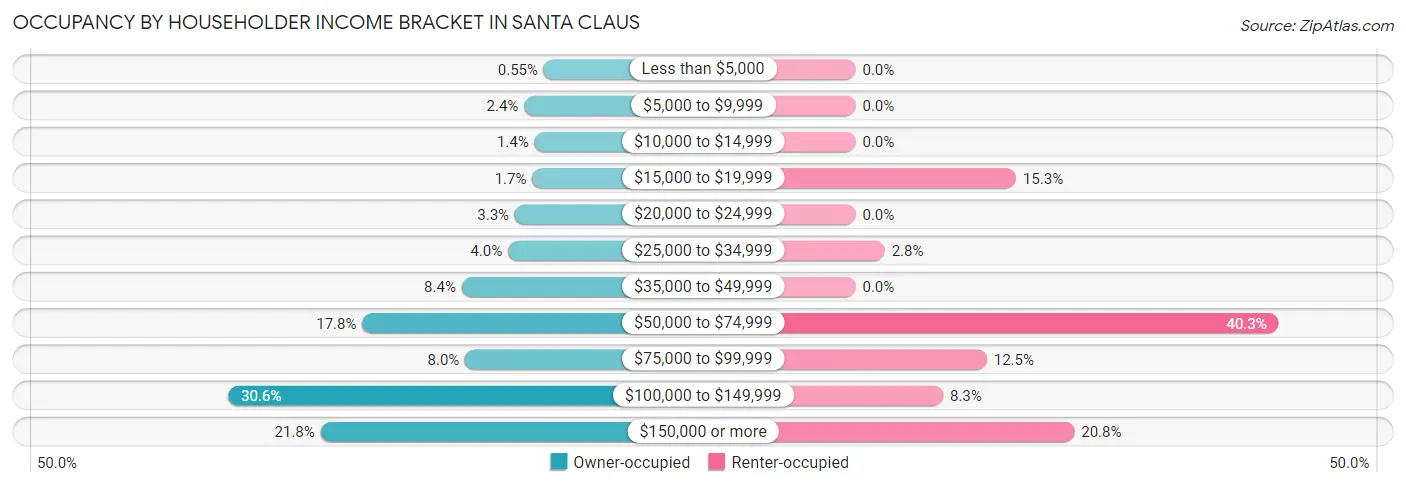
| Income Bracket | Owner-occupied | Renter-occupied |
| Less than $5,000 | 5 (0.5%) | 0 (0.0%) |
| $5,000 to $9,999 | 22 (2.4%) | 0 (0.0%) |
| $10,000 to $14,999 | 13 (1.4%) | 0 (0.0%) |
| $15,000 to $19,999 | 15 (1.7%) | 11 (15.3%) |
| $20,000 to $24,999 | 30 (3.3%) | 0 (0.0%) |
| $25,000 to $34,999 | 36 (4.0%) | 2 (2.8%) |
| $35,000 to $49,999 | 76 (8.4%) | 0 (0.0%) |
| $50,000 to $74,999 | 162 (17.8%) | 29 (40.3%) |
| $75,000 to $99,999 | 73 (8.0%) | 9 (12.5%) |
| $100,000 to $149,999 | 278 (30.6%) | 6 (8.3%) |
| $150,000 or more | 198 (21.8%) | 15 (20.8%) |
| Total | 908 (100.0%) | 72 (100.0%) |
Monthly Housing Cost Tiers in Santa Claus
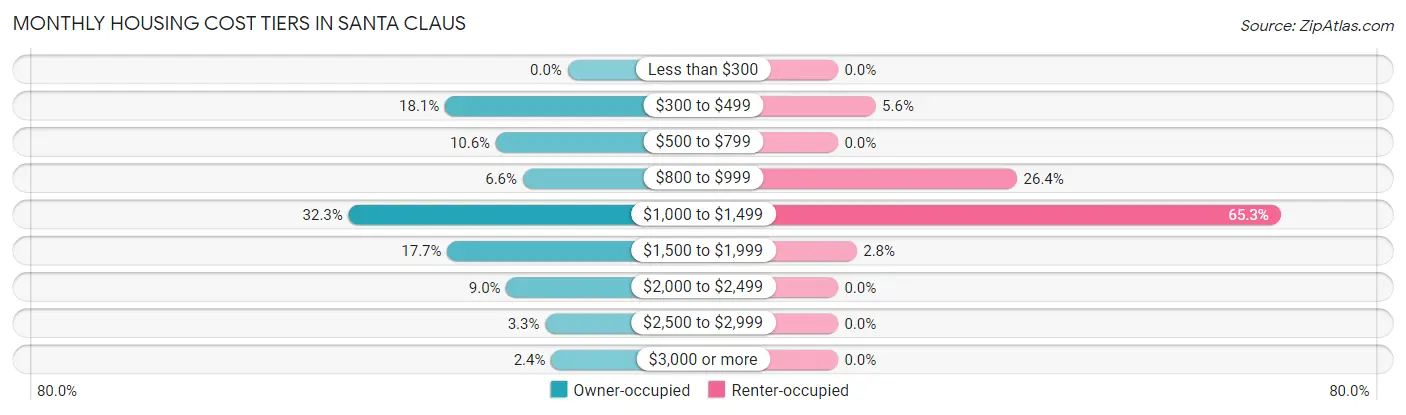
| Monthly Cost | Owner-occupied | Renter-occupied |
| Less than $300 | 0 (0.0%) | 0 (0.0%) |
| $300 to $499 | 164 (18.1%) | 4 (5.6%) |
| $500 to $799 | 96 (10.6%) | 0 (0.0%) |
| $800 to $999 | 60 (6.6%) | 19 (26.4%) |
| $1,000 to $1,499 | 293 (32.3%) | 47 (65.3%) |
| $1,500 to $1,999 | 161 (17.7%) | 2 (2.8%) |
| $2,000 to $2,499 | 82 (9.0%) | 0 (0.0%) |
| $2,500 to $2,999 | 30 (3.3%) | 0 (0.0%) |
| $3,000 or more | 22 (2.4%) | 0 (0.0%) |
| Total | 908 (100.0%) | 72 (100.0%) |
Physical Housing Characteristics in Santa Claus
Housing Structures in Santa Claus
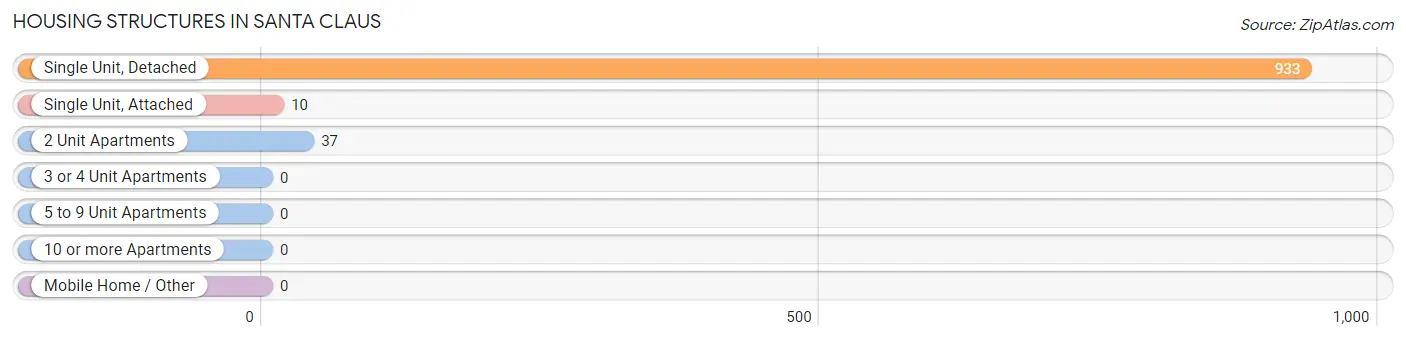
| Structure Type | # Housing Units | % Housing Units |
| Single Unit, Detached | 933 | 95.2% |
| Single Unit, Attached | 10 | 1.0% |
| 2 Unit Apartments | 37 | 3.8% |
| 3 or 4 Unit Apartments | 0 | 0.0% |
| 5 to 9 Unit Apartments | 0 | 0.0% |
| 10 or more Apartments | 0 | 0.0% |
| Mobile Home / Other | 0 | 0.0% |
| Total | 980 | 100.0% |
Housing Structures by Occupancy in Santa Claus
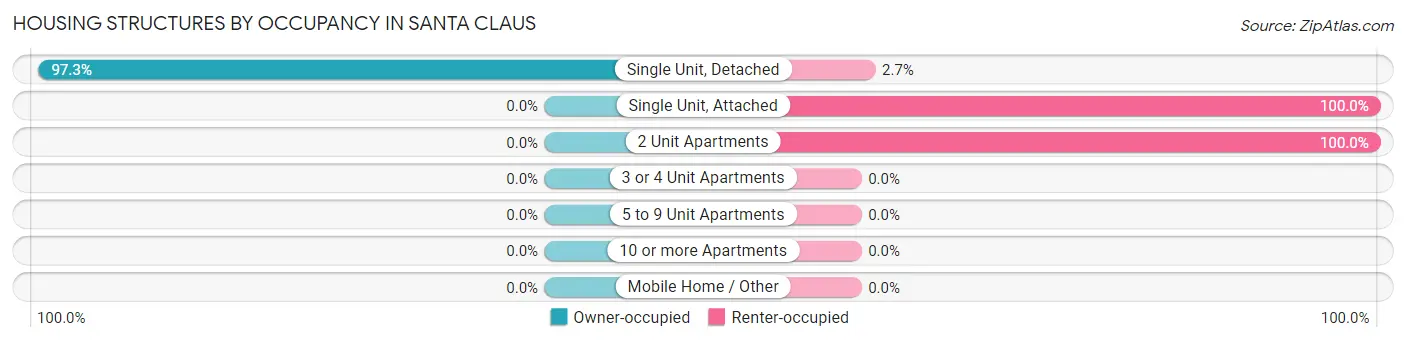
| Structure Type | Owner-occupied | Renter-occupied |
| Single Unit, Detached | 908 (97.3%) | 25 (2.7%) |
| Single Unit, Attached | 0 (0.0%) | 10 (100.0%) |
| 2 Unit Apartments | 0 (0.0%) | 37 (100.0%) |
| 3 or 4 Unit Apartments | 0 (0.0%) | 0 (0.0%) |
| 5 to 9 Unit Apartments | 0 (0.0%) | 0 (0.0%) |
| 10 or more Apartments | 0 (0.0%) | 0 (0.0%) |
| Mobile Home / Other | 0 (0.0%) | 0 (0.0%) |
| Total | 908 (92.6%) | 72 (7.3%) |
Housing Structures by Number of Rooms in Santa Claus
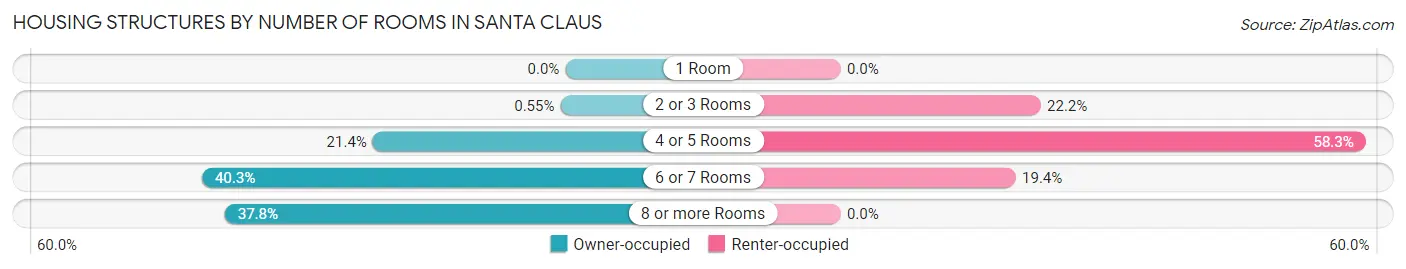
| Number of Rooms | Owner-occupied | Renter-occupied |
| 1 Room | 0 (0.0%) | 0 (0.0%) |
| 2 or 3 Rooms | 5 (0.5%) | 16 (22.2%) |
| 4 or 5 Rooms | 194 (21.4%) | 42 (58.3%) |
| 6 or 7 Rooms | 366 (40.3%) | 14 (19.4%) |
| 8 or more Rooms | 343 (37.8%) | 0 (0.0%) |
| Total | 908 (100.0%) | 72 (100.0%) |
Housing Structure by Heating Type in Santa Claus
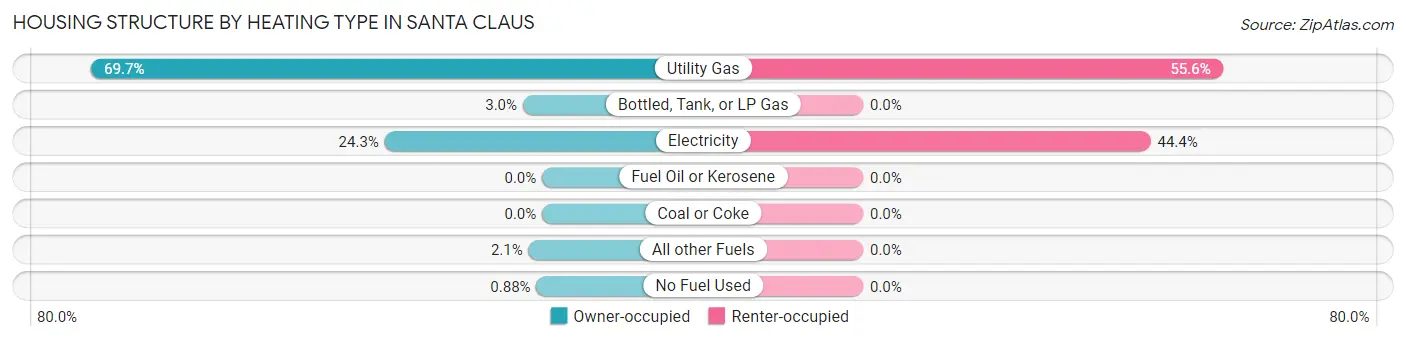
| Heating Type | Owner-occupied | Renter-occupied |
| Utility Gas | 633 (69.7%) | 40 (55.6%) |
| Bottled, Tank, or LP Gas | 27 (3.0%) | 0 (0.0%) |
| Electricity | 221 (24.3%) | 32 (44.4%) |
| Fuel Oil or Kerosene | 0 (0.0%) | 0 (0.0%) |
| Coal or Coke | 0 (0.0%) | 0 (0.0%) |
| All other Fuels | 19 (2.1%) | 0 (0.0%) |
| No Fuel Used | 8 (0.9%) | 0 (0.0%) |
| Total | 908 (100.0%) | 72 (100.0%) |
Household Vehicle Usage in Santa Claus
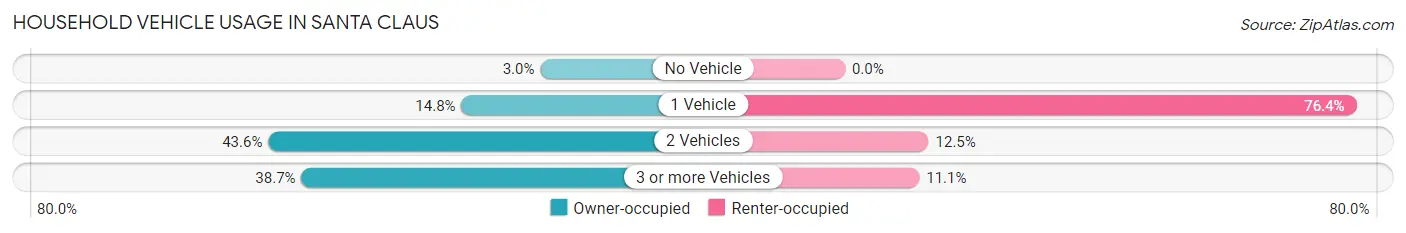
| Vehicles per Household | Owner-occupied | Renter-occupied |
| No Vehicle | 27 (3.0%) | 0 (0.0%) |
| 1 Vehicle | 134 (14.8%) | 55 (76.4%) |
| 2 Vehicles | 396 (43.6%) | 9 (12.5%) |
| 3 or more Vehicles | 351 (38.7%) | 8 (11.1%) |
| Total | 908 (100.0%) | 72 (100.0%) |
Real Estate & Mortgages in Santa Claus
Real Estate and Mortgage Overview in Santa Claus
| Characteristic | Without Mortgage | With Mortgage |
| Housing Units | 252 | 656 |
| Median Property Value | $192,900 | $223,100 |
| Median Household Income | $52,955 | $165 |
| Monthly Housing Costs | $460 | $21 |
| Real Estate Taxes | $1,371 | $0 |
Property Value by Mortgage Status in Santa Claus
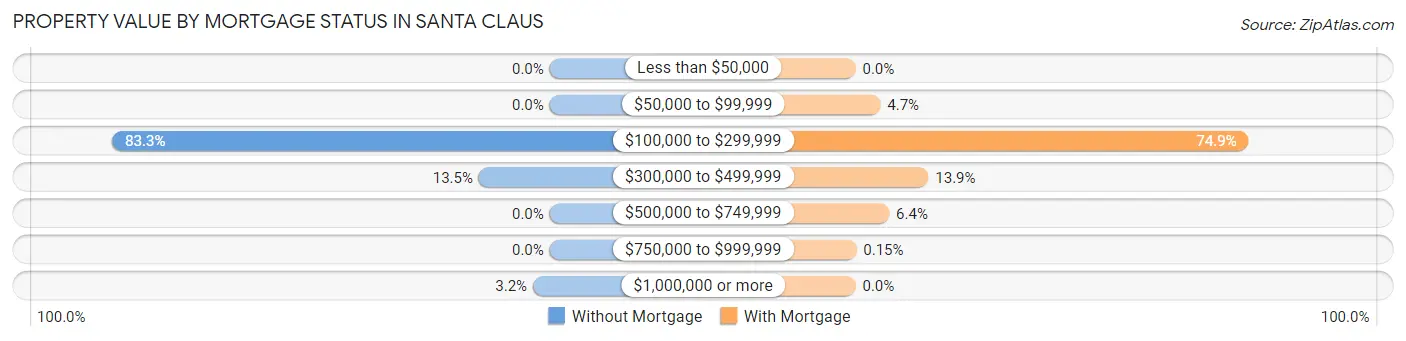
| Property Value | Without Mortgage | With Mortgage |
| Less than $50,000 | 0 (0.0%) | 0 (0.0%) |
| $50,000 to $99,999 | 0 (0.0%) | 31 (4.7%) |
| $100,000 to $299,999 | 210 (83.3%) | 491 (74.9%) |
| $300,000 to $499,999 | 34 (13.5%) | 91 (13.9%) |
| $500,000 to $749,999 | 0 (0.0%) | 42 (6.4%) |
| $750,000 to $999,999 | 0 (0.0%) | 1 (0.2%) |
| $1,000,000 or more | 8 (3.2%) | 0 (0.0%) |
| Total | 252 (100.0%) | 656 (100.0%) |
Household Income by Mortgage Status in Santa Claus
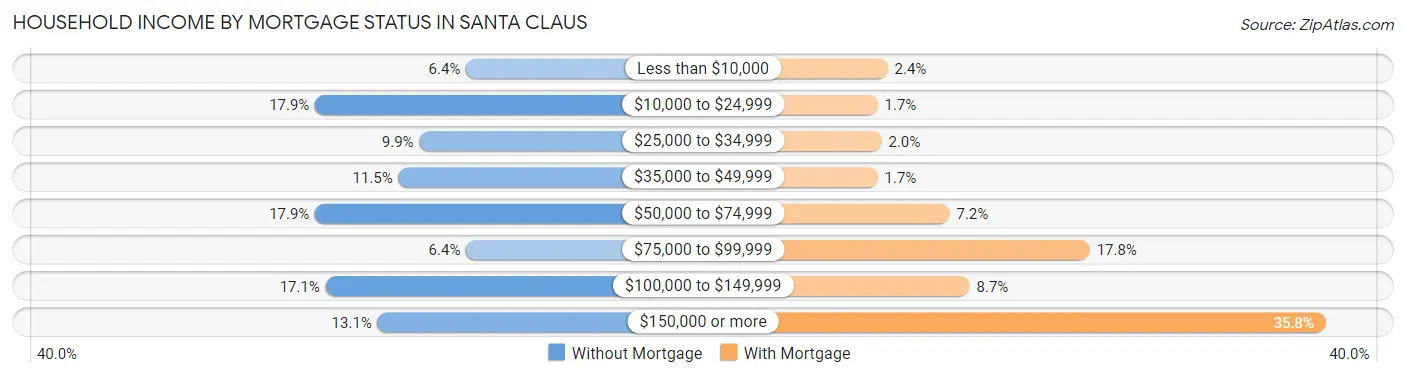
| Household Income | Without Mortgage | With Mortgage |
| Less than $10,000 | 16 (6.4%) | 16 (2.4%) |
| $10,000 to $24,999 | 45 (17.9%) | 11 (1.7%) |
| $25,000 to $34,999 | 25 (9.9%) | 13 (2.0%) |
| $35,000 to $49,999 | 29 (11.5%) | 11 (1.7%) |
| $50,000 to $74,999 | 45 (17.9%) | 47 (7.2%) |
| $75,000 to $99,999 | 16 (6.4%) | 117 (17.8%) |
| $100,000 to $149,999 | 43 (17.1%) | 57 (8.7%) |
| $150,000 or more | 33 (13.1%) | 235 (35.8%) |
| Total | 252 (100.0%) | 656 (100.0%) |
Property Value to Household Income Ratio in Santa Claus
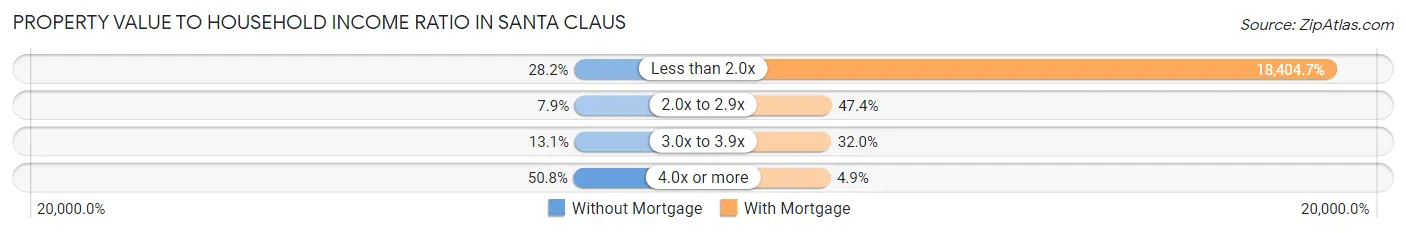
| Value-to-Income Ratio | Without Mortgage | With Mortgage |
| Less than 2.0x | 71 (28.2%) | 120,735 (18,404.7%) |
| 2.0x to 2.9x | 20 (7.9%) | 311 (47.4%) |
| 3.0x to 3.9x | 33 (13.1%) | 210 (32.0%) |
| 4.0x or more | 128 (50.8%) | 32 (4.9%) |
| Total | 252 (100.0%) | 656 (100.0%) |
Real Estate Taxes by Mortgage Status in Santa Claus
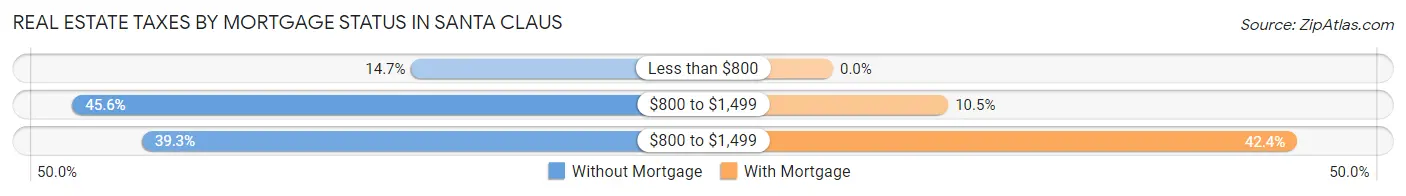
| Property Taxes | Without Mortgage | With Mortgage |
| Less than $800 | 37 (14.7%) | 0 (0.0%) |
| $800 to $1,499 | 115 (45.6%) | 69 (10.5%) |
| $800 to $1,499 | 99 (39.3%) | 278 (42.4%) |
| Total | 252 (100.0%) | 656 (100.0%) |
Health & Disability in Santa Claus
Health Insurance Coverage by Age in Santa Claus
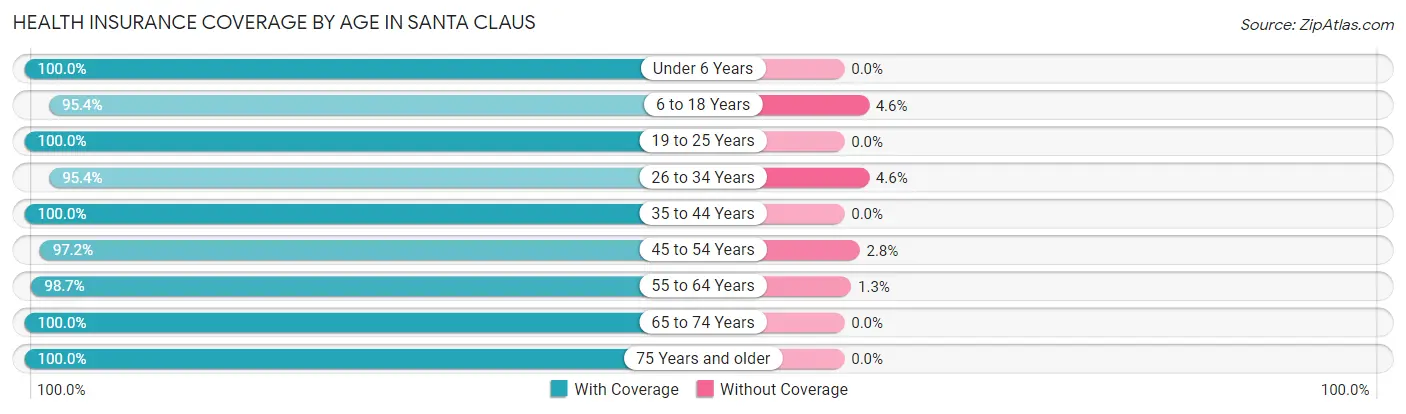
| Age Bracket | With Coverage | Without Coverage |
| Under 6 Years | 208 (100.0%) | 0 (0.0%) |
| 6 to 18 Years | 544 (95.4%) | 26 (4.6%) |
| 19 to 25 Years | 176 (100.0%) | 0 (0.0%) |
| 26 to 34 Years | 187 (95.4%) | 9 (4.6%) |
| 35 to 44 Years | 350 (100.0%) | 0 (0.0%) |
| 45 to 54 Years | 376 (97.2%) | 11 (2.8%) |
| 55 to 64 Years | 388 (98.7%) | 5 (1.3%) |
| 65 to 74 Years | 190 (100.0%) | 0 (0.0%) |
| 75 Years and older | 255 (100.0%) | 0 (0.0%) |
| Total | 2,674 (98.1%) | 51 (1.9%) |
Health Insurance Coverage by Citizenship Status in Santa Claus
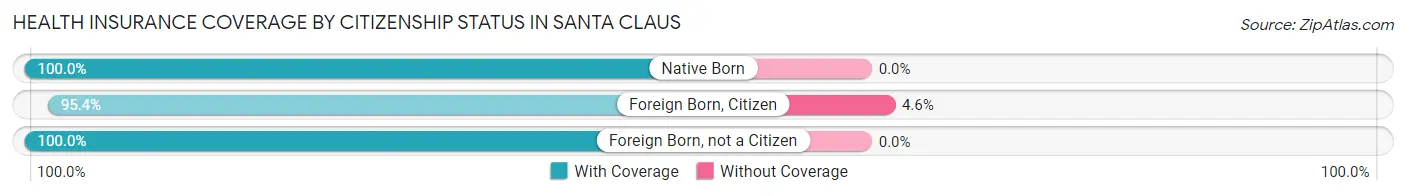
| Citizenship Status | With Coverage | Without Coverage |
| Native Born | 208 (100.0%) | 0 (0.0%) |
| Foreign Born, Citizen | 544 (95.4%) | 26 (4.6%) |
| Foreign Born, not a Citizen | 176 (100.0%) | 0 (0.0%) |
Health Insurance Coverage by Household Income in Santa Claus
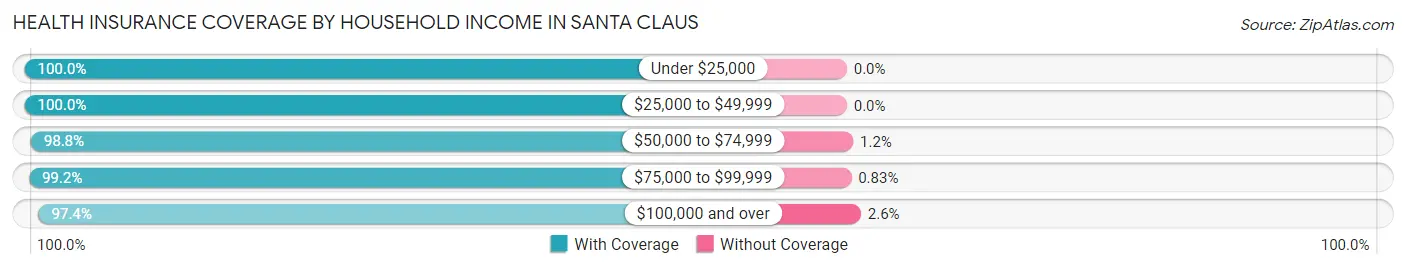
| Household Income | With Coverage | Without Coverage |
| Under $25,000 | 130 (100.0%) | 0 (0.0%) |
| $25,000 to $49,999 | 257 (100.0%) | 0 (0.0%) |
| $50,000 to $74,999 | 419 (98.8%) | 5 (1.2%) |
| $75,000 to $99,999 | 238 (99.2%) | 2 (0.8%) |
| $100,000 and over | 1,630 (97.4%) | 44 (2.6%) |
Public vs Private Health Insurance Coverage by Age in Santa Claus
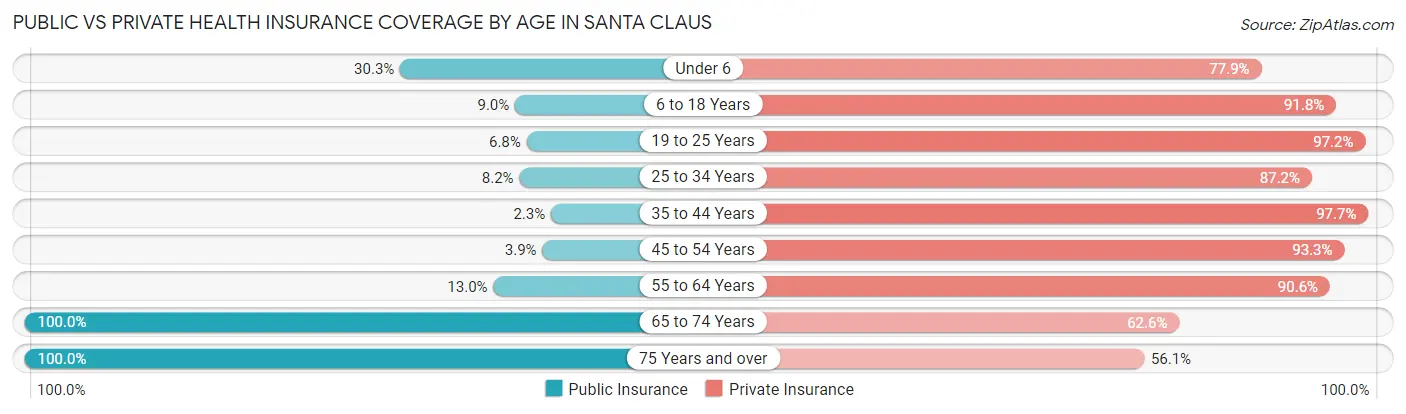
| Age Bracket | Public Insurance | Private Insurance |
| Under 6 | 63 (30.3%) | 162 (77.9%) |
| 6 to 18 Years | 51 (8.9%) | 523 (91.7%) |
| 19 to 25 Years | 12 (6.8%) | 171 (97.2%) |
| 25 to 34 Years | 16 (8.2%) | 171 (87.2%) |
| 35 to 44 Years | 8 (2.3%) | 342 (97.7%) |
| 45 to 54 Years | 15 (3.9%) | 361 (93.3%) |
| 55 to 64 Years | 51 (13.0%) | 356 (90.6%) |
| 65 to 74 Years | 190 (100.0%) | 119 (62.6%) |
| 75 Years and over | 255 (100.0%) | 143 (56.1%) |
| Total | 661 (24.3%) | 2,348 (86.2%) |
Disability Status by Sex by Age in Santa Claus
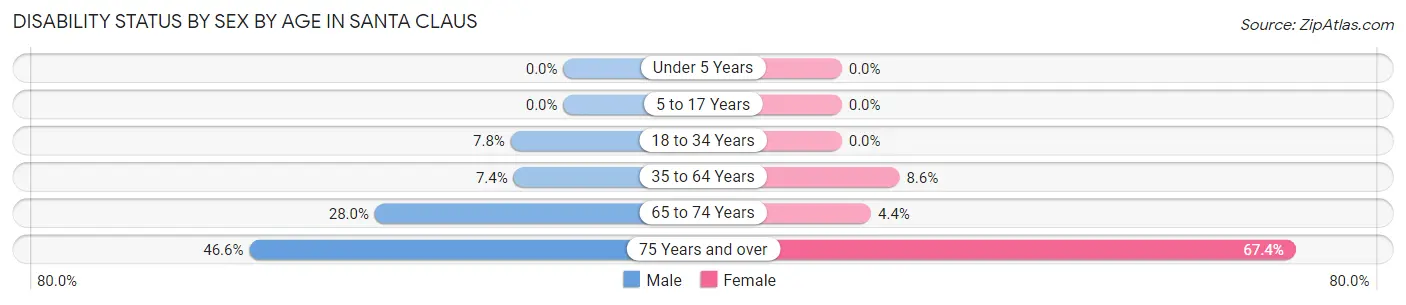
| Age Bracket | Male | Female |
| Under 5 Years | 0 (0.0%) | 0 (0.0%) |
| 5 to 17 Years | 0 (0.0%) | 0 (0.0%) |
| 18 to 34 Years | 19 (7.8%) | 0 (0.0%) |
| 35 to 64 Years | 43 (7.4%) | 47 (8.6%) |
| 65 to 74 Years | 21 (28.0%) | 5 (4.3%) |
| 75 Years and over | 76 (46.6%) | 62 (67.4%) |
Disability Class by Sex by Age in Santa Claus
Disability Class: Hearing Difficulty
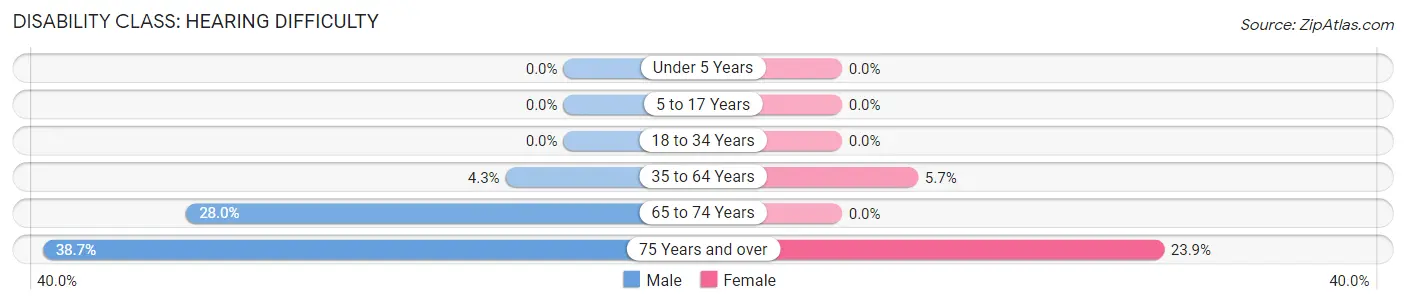
| Age Bracket | Male | Female |
| Under 5 Years | 0 (0.0%) | 0 (0.0%) |
| 5 to 17 Years | 0 (0.0%) | 0 (0.0%) |
| 18 to 34 Years | 0 (0.0%) | 0 (0.0%) |
| 35 to 64 Years | 25 (4.3%) | 31 (5.7%) |
| 65 to 74 Years | 21 (28.0%) | 0 (0.0%) |
| 75 Years and over | 63 (38.7%) | 22 (23.9%) |
Disability Class: Vision Difficulty
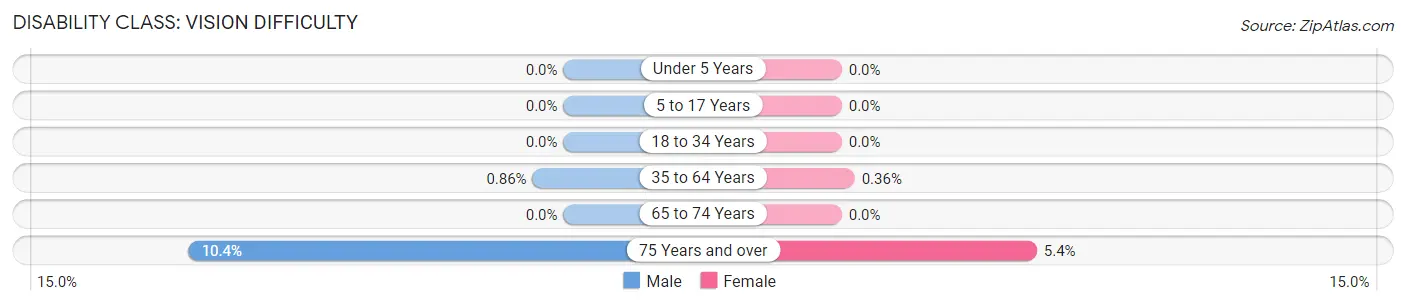
| Age Bracket | Male | Female |
| Under 5 Years | 0 (0.0%) | 0 (0.0%) |
| 5 to 17 Years | 0 (0.0%) | 0 (0.0%) |
| 18 to 34 Years | 0 (0.0%) | 0 (0.0%) |
| 35 to 64 Years | 5 (0.9%) | 2 (0.4%) |
| 65 to 74 Years | 0 (0.0%) | 0 (0.0%) |
| 75 Years and over | 17 (10.4%) | 5 (5.4%) |
Disability Class: Cognitive Difficulty
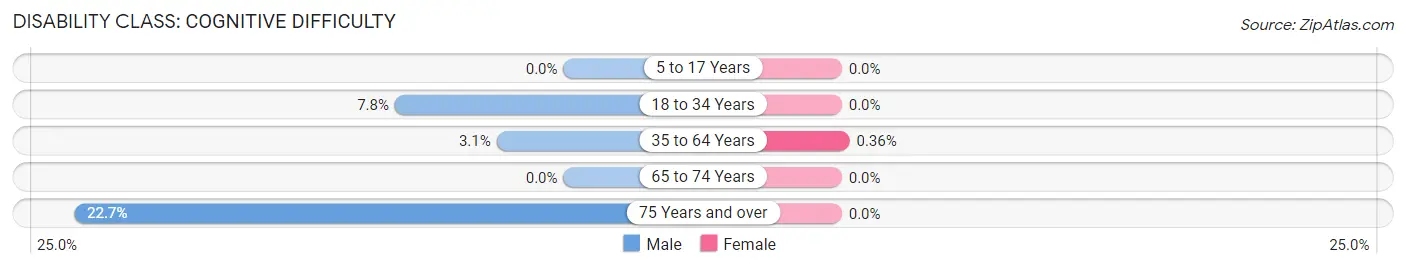
| Age Bracket | Male | Female |
| 5 to 17 Years | 0 (0.0%) | 0 (0.0%) |
| 18 to 34 Years | 19 (7.8%) | 0 (0.0%) |
| 35 to 64 Years | 18 (3.1%) | 2 (0.4%) |
| 65 to 74 Years | 0 (0.0%) | 0 (0.0%) |
| 75 Years and over | 37 (22.7%) | 0 (0.0%) |
Disability Class: Ambulatory Difficulty
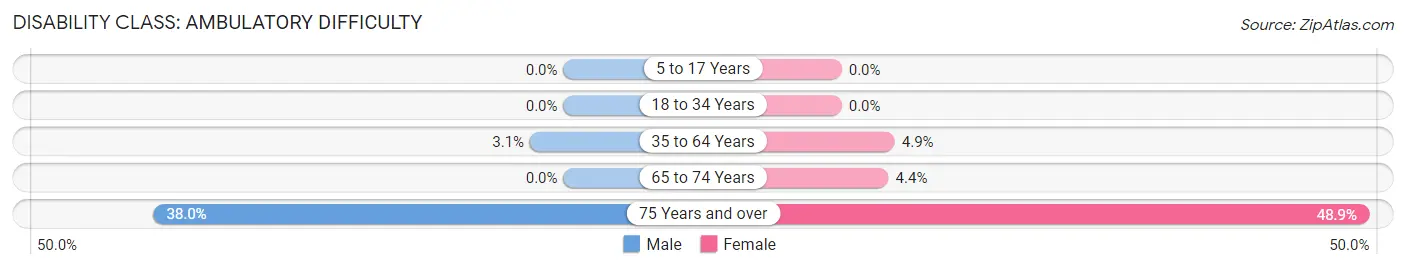
| Age Bracket | Male | Female |
| 5 to 17 Years | 0 (0.0%) | 0 (0.0%) |
| 18 to 34 Years | 0 (0.0%) | 0 (0.0%) |
| 35 to 64 Years | 18 (3.1%) | 27 (4.9%) |
| 65 to 74 Years | 0 (0.0%) | 5 (4.3%) |
| 75 Years and over | 62 (38.0%) | 45 (48.9%) |
Disability Class: Self-Care Difficulty
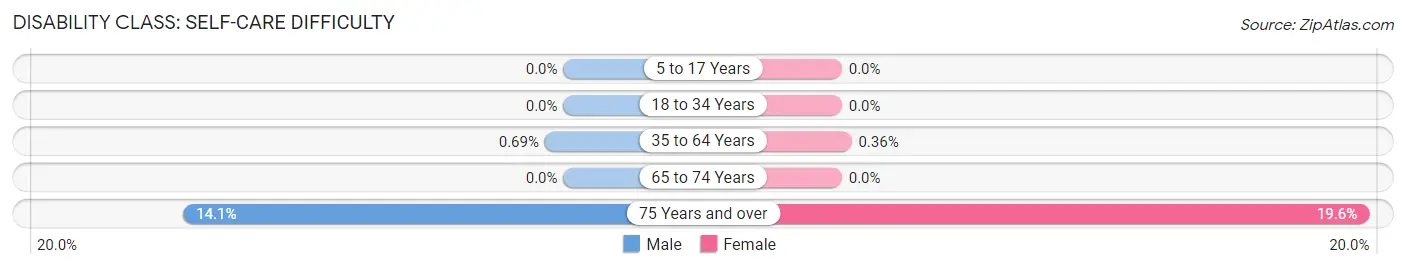
| Age Bracket | Male | Female |
| 5 to 17 Years | 0 (0.0%) | 0 (0.0%) |
| 18 to 34 Years | 0 (0.0%) | 0 (0.0%) |
| 35 to 64 Years | 4 (0.7%) | 2 (0.4%) |
| 65 to 74 Years | 0 (0.0%) | 0 (0.0%) |
| 75 Years and over | 23 (14.1%) | 18 (19.6%) |
Technology Access in Santa Claus
Computing Device Access in Santa Claus
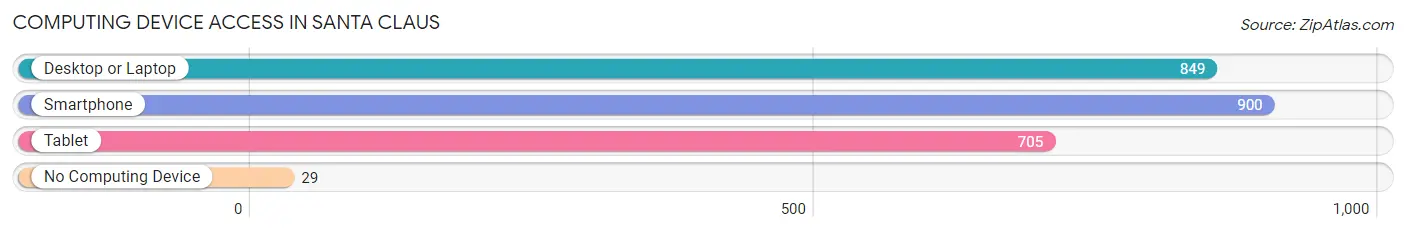
| Device Type | # Households | % Households |
| Desktop or Laptop | 849 | 86.6% |
| Smartphone | 900 | 91.8% |
| Tablet | 705 | 71.9% |
| No Computing Device | 29 | 3.0% |
| Total | 980 | 100.0% |
Internet Access in Santa Claus
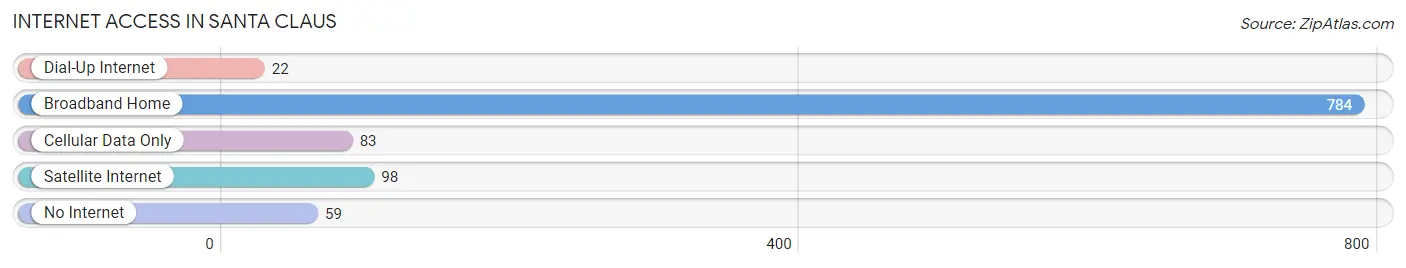
| Internet Type | # Households | % Households |
| Dial-Up Internet | 22 | 2.2% |
| Broadband Home | 784 | 80.0% |
| Cellular Data Only | 83 | 8.5% |
| Satellite Internet | 98 | 10.0% |
| No Internet | 59 | 6.0% |
| Total | 980 | 100.0% |
Santa Claus Summary
Santa Claus, Indiana is a small town located in Spencer County, Indiana. It is situated in the southwestern part of the state, about 20 miles east of Evansville. The town was founded in 1854 and is named after the legendary figure of Santa Claus. The population of Santa Claus was 2,411 in the 2010 census.
History
Santa Claus, Indiana was founded in 1854 by a group of German immigrants. The town was originally named Santa Fe, but the name was changed to Santa Claus in 1856. The town was named after the legendary figure of Santa Claus, who was said to bring gifts to children on Christmas Eve.
The town was originally a farming community, but it soon became a popular tourist destination. The first post office was established in 1858, and the first school was built in 1864. The town was incorporated in 1871.
In the late 19th century, the town became a popular destination for tourists. The Santa Claus Land amusement park opened in 1946 and was the first theme park in the United States. The park was later renamed Holiday World and is still in operation today.
Geography
Santa Claus is located in Spencer County, Indiana. It is situated in the southwestern part of the state, about 20 miles east of Evansville. The town is located on the banks of the Patoka River. The terrain is mostly flat, with some rolling hills. The climate is humid continental, with hot summers and cold winters.
Economy
The economy of Santa Claus is largely based on tourism. The town is home to Holiday World, a popular theme park that attracts visitors from all over the country. The park is the largest employer in the town, providing jobs for over 1,000 people.
The town is also home to several other businesses, including restaurants, hotels, and retail stores. The town is also home to a number of manufacturing companies, including a furniture factory and a plastics factory.
Demographics
The population of Santa Claus was 2,411 in the 2010 census. The population is mostly white (97.2%), with a small percentage of African Americans (1.2%) and Hispanics (1.1%). The median household income is $45,945, and the median age is 41.
Conclusion
Santa Claus, Indiana is a small town located in Spencer County, Indiana. It was founded in 1854 and is named after the legendary figure of Santa Claus. The town is a popular tourist destination, and is home to Holiday World, the first theme park in the United States. The economy of Santa Claus is largely based on tourism, and the town is home to several businesses and manufacturing companies. The population of Santa Claus was 2,411 in the 2010 census, and the median household income is $45,945.
Common Questions
What is the Total Population of Santa Claus?
Total Population of Santa Claus is 2,746.
What is the Total Male Population of Santa Claus?
Total Male Population of Santa Claus is 1,475.
What is the Total Female Population of Santa Claus?
Total Female Population of Santa Claus is 1,271.
What is the Ratio of Males per 100 Females in Santa Claus?
There are 116.05 Males per 100 Females in Santa Claus.
What is the Ratio of Females per 100 Males in Santa Claus?
There are 86.17 Females per 100 Males in Santa Claus.
What is the Median Population Age in Santa Claus?
Median Population Age in Santa Claus is 42.8 Years.
What is the Average Family Size in Santa Claus
Average Family Size in Santa Claus is 3.2 People.
What is the Average Household Size in Santa Claus
Average Household Size in Santa Claus is 2.8 People.
What is Per Capita Income in Santa Claus?
Per Capita income in Santa Claus is $45,729.
What is the Median Family Income in Santa Claus?
Median Family Income in Santa Claus is $119,464.
What is the Median Household income in Santa Claus?
Median Household Income in Santa Claus is $107,083.
What is Income or Wage Gap in Santa Claus?
Income or Wage Gap in Santa Claus is 20.4%.
Women in Santa Claus earn 79.6 cents for every dollar earned by a man.
What is Family Income Deficit in Santa Claus?
Family Income Deficit in Santa Claus is $7,527.
Families that are below poverty line in Santa Claus earn $7,527 less on average than the poverty threshold level.
What is Inequality or Gini Index in Santa Claus?
Inequality or Gini Index in Santa Claus is 0.42.
How Large is the Labor Force in Santa Claus?
There are 1,447 People in the Labor Forcein in Santa Claus.
What is the Percentage of People in the Labor Force in Santa Claus?
68.8% of People are in the Labor Force in Santa Claus.
What is the Unemployment Rate in Santa Claus?
Unemployment Rate in Santa Claus is 0.8%.