Town of Pines, IN
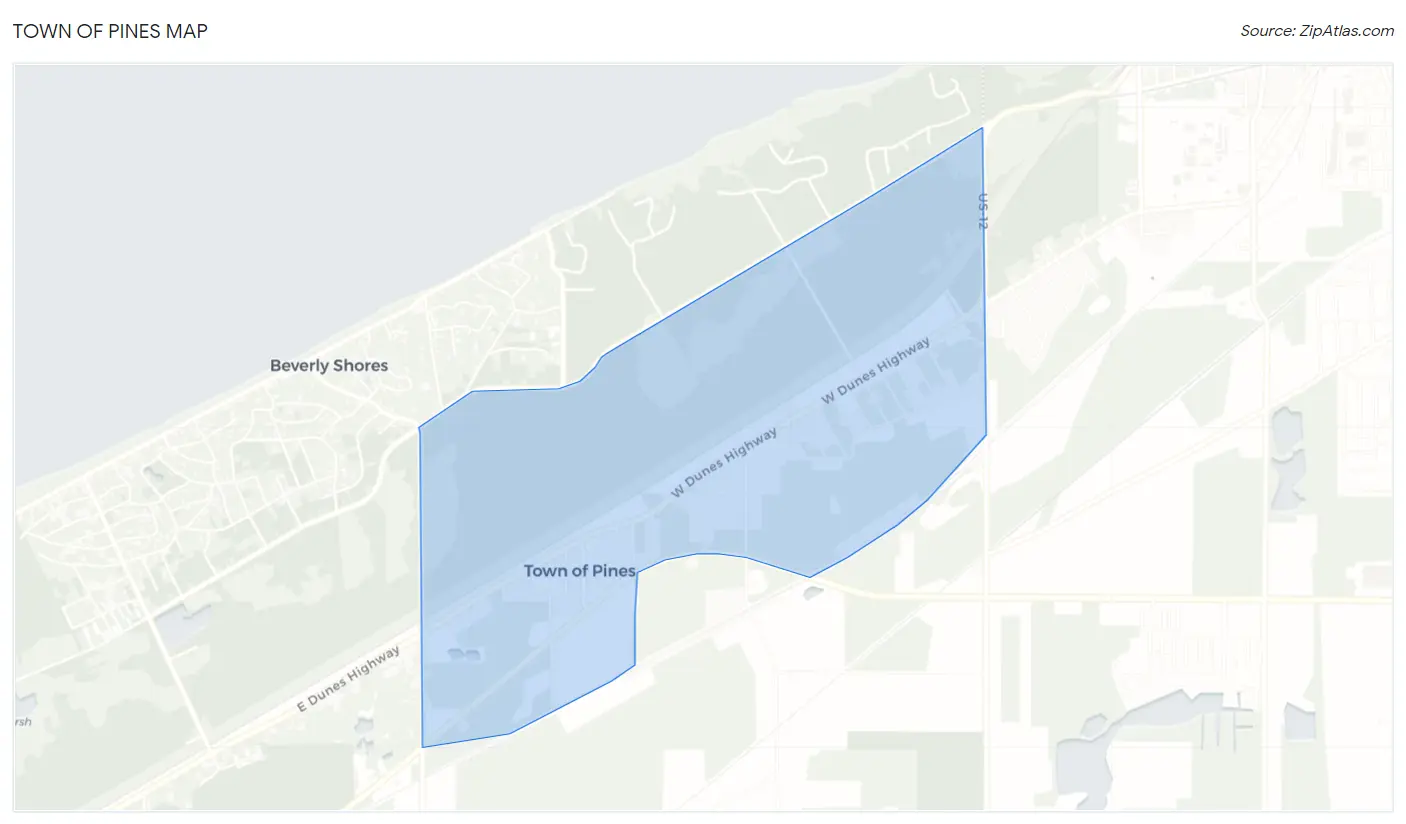
Town of Pines Map
Town of Pines Overview
651
TOTAL POPULATION
298
MALE POPULATION
353
FEMALE POPULATION
84.42
MALES / 100 FEMALES
118.46
FEMALES / 100 MALES
50.9
MEDIAN AGE
2.9
AVG FAMILY SIZE
2.1
AVG HOUSEHOLD SIZE
$33,808
PER CAPITA INCOME
$71,250
AVG FAMILY INCOME
$53,000
AVG HOUSEHOLD INCOME
7.0%
WAGE / INCOME GAP [ % ]
93.0¢/ $1
WAGE / INCOME GAP [ $ ]
0.42
INEQUALITY / GINI INDEX
310
LABOR FORCE [ PEOPLE ]
54.4%
PERCENT IN LABOR FORCE
3.5%
UNEMPLOYMENT RATE
Town of Pines Area Codes
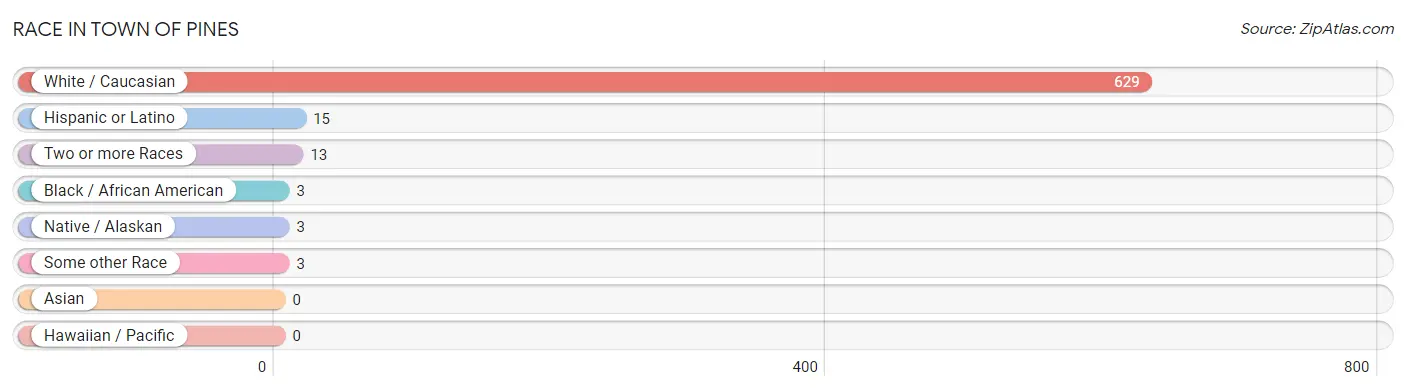
Race in Town of Pines
The most populous races in Town of Pines are White / Caucasian (629 | 96.6%), Hispanic or Latino (15 | 2.3%), and Two or more Races (13 | 2.0%).
| Race | # Population | % Population |
| Asian | 0 | 0.0% |
| Black / African American | 3 | 0.5% |
| Hawaiian / Pacific | 0 | 0.0% |
| Hispanic or Latino | 15 | 2.3% |
| Native / Alaskan | 3 | 0.5% |
| White / Caucasian | 629 | 96.6% |
| Two or more Races | 13 | 2.0% |
| Some other Race | 3 | 0.5% |
| Total | 651 | 100.0% |
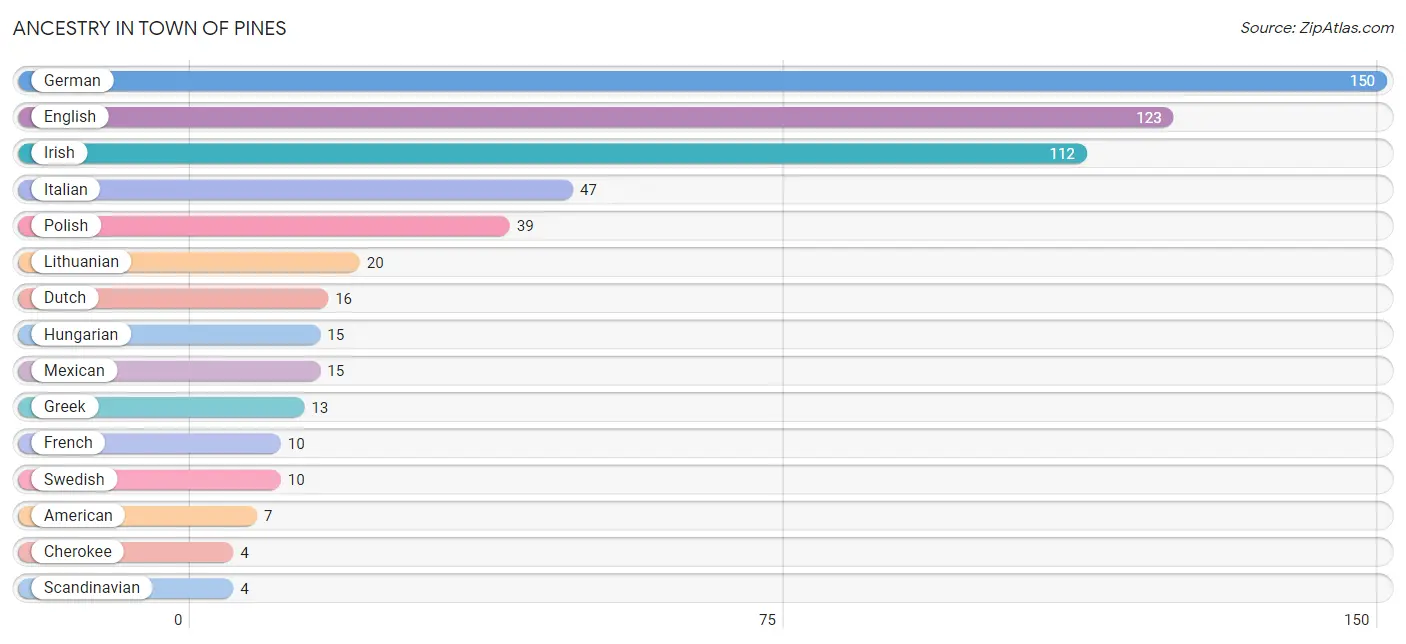
Ancestry in Town of Pines
The most populous ancestries reported in Town of Pines are German (150 | 23.0%), English (123 | 18.9%), Irish (112 | 17.2%), Italian (47 | 7.2%), and Polish (39 | 6.0%), together accounting for 72.3% of all Town of Pines residents.
| Ancestry | # Population | % Population |
| American | 7 | 1.1% |
| Cherokee | 4 | 0.6% |
| Dutch | 16 | 2.5% |
| English | 123 | 18.9% |
| European | 2 | 0.3% |
| French | 10 | 1.5% |
| German | 150 | 23.0% |
| Greek | 13 | 2.0% |
| Hungarian | 15 | 2.3% |
| Irish | 112 | 17.2% |
| Italian | 47 | 7.2% |
| Lithuanian | 20 | 3.1% |
| Mexican | 15 | 2.3% |
| Polish | 39 | 6.0% |
| Portuguese | 3 | 0.5% |
| Russian | 2 | 0.3% |
| Scandinavian | 4 | 0.6% |
| Scotch-Irish | 3 | 0.5% |
| Slovak | 4 | 0.6% |
| Swedish | 10 | 1.5% | View All 20 Rows |
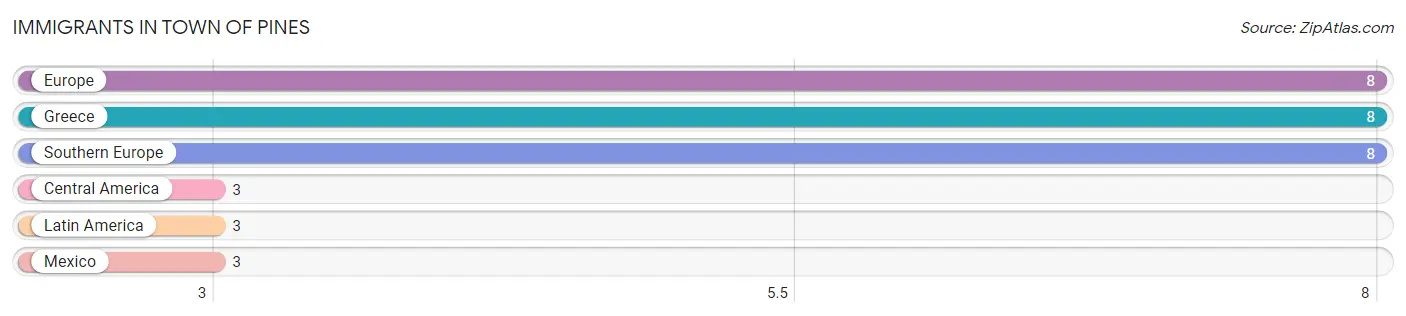
Immigrants in Town of Pines
The most numerous immigrant groups reported in Town of Pines came from Europe (8 | 1.2%), Greece (8 | 1.2%), Southern Europe (8 | 1.2%), Central America (3 | 0.5%), and Latin America (3 | 0.5%), together accounting for 4.6% of all Town of Pines residents.
| Immigration Origin | # Population | % Population |
| Central America | 3 | 0.5% |
| Europe | 8 | 1.2% |
| Greece | 8 | 1.2% |
| Latin America | 3 | 0.5% |
| Mexico | 3 | 0.5% |
| Southern Europe | 8 | 1.2% | View All 6 Rows |
Sex and Age in Town of Pines
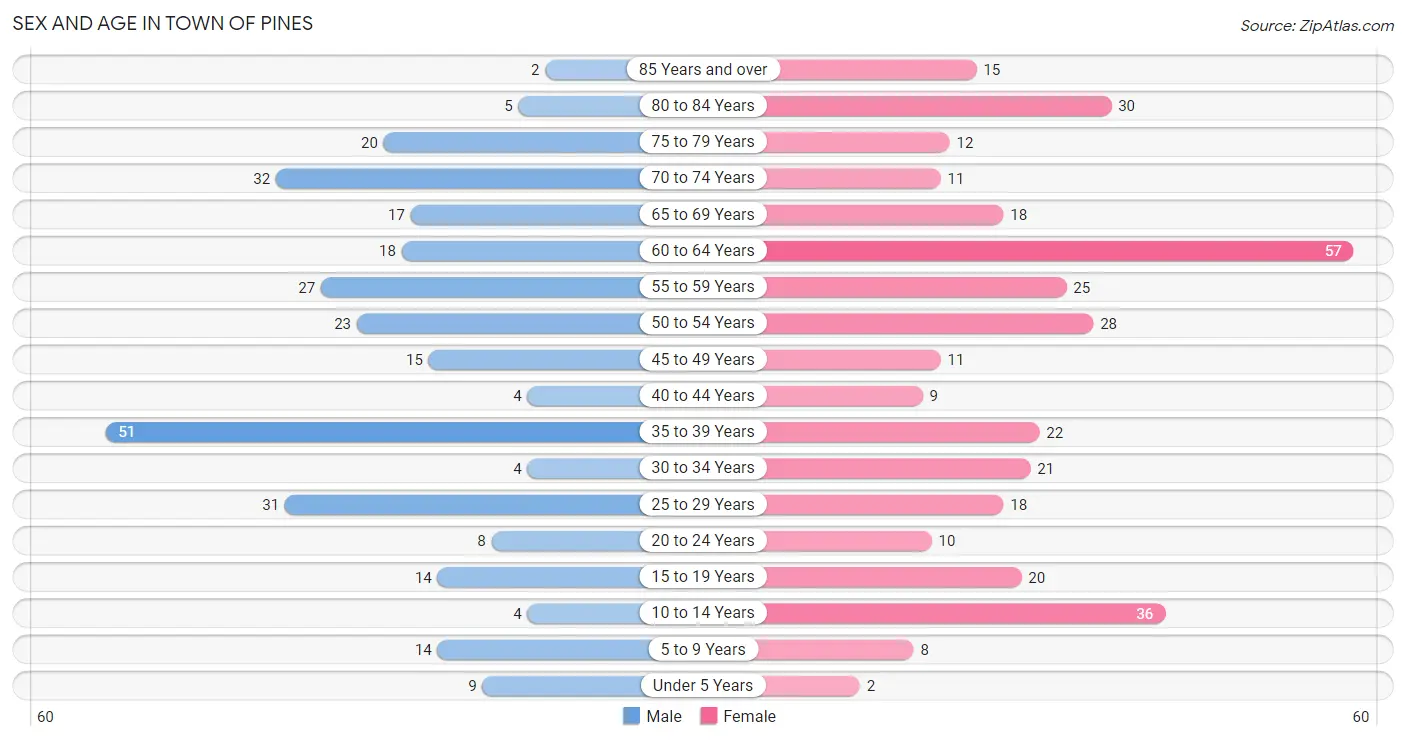
Sex and Age in Town of Pines
The most populous age groups in Town of Pines are 35 to 39 Years (51 | 17.1%) for men and 60 to 64 Years (57 | 16.2%) for women.
| Age Bracket | Male | Female |
| Under 5 Years | 9 (3.0%) | 2 (0.6%) |
| 5 to 9 Years | 14 (4.7%) | 8 (2.3%) |
| 10 to 14 Years | 4 (1.3%) | 36 (10.2%) |
| 15 to 19 Years | 14 (4.7%) | 20 (5.7%) |
| 20 to 24 Years | 8 (2.7%) | 10 (2.8%) |
| 25 to 29 Years | 31 (10.4%) | 18 (5.1%) |
| 30 to 34 Years | 4 (1.3%) | 21 (5.9%) |
| 35 to 39 Years | 51 (17.1%) | 22 (6.2%) |
| 40 to 44 Years | 4 (1.3%) | 9 (2.5%) |
| 45 to 49 Years | 15 (5.0%) | 11 (3.1%) |
| 50 to 54 Years | 23 (7.7%) | 28 (7.9%) |
| 55 to 59 Years | 27 (9.1%) | 25 (7.1%) |
| 60 to 64 Years | 18 (6.0%) | 57 (16.2%) |
| 65 to 69 Years | 17 (5.7%) | 18 (5.1%) |
| 70 to 74 Years | 32 (10.7%) | 11 (3.1%) |
| 75 to 79 Years | 20 (6.7%) | 12 (3.4%) |
| 80 to 84 Years | 5 (1.7%) | 30 (8.5%) |
| 85 Years and over | 2 (0.7%) | 15 (4.3%) |
| Total | 298 (100.0%) | 353 (100.0%) |
Families and Households in Town of Pines
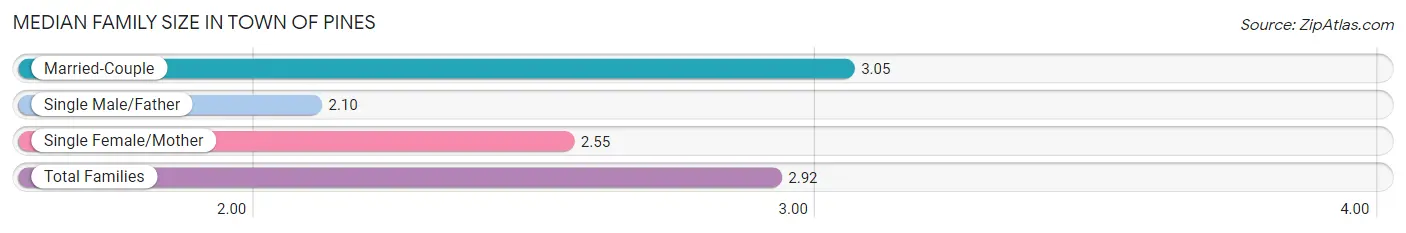
Median Family Size in Town of Pines
The median family size in Town of Pines is 2.92 persons per family, with married-couple families (128 | 80.0%) accounting for the largest median family size of 3.05 persons per family. On the other hand, single male/father families (10 | 6.2%) represent the smallest median family size with 2.10 persons per family.
| Family Type | # Families | Family Size |
| Married-Couple | 128 (80.0%) | 3.05 |
| Single Male/Father | 10 (6.2%) | 2.10 |
| Single Female/Mother | 22 (13.8%) | 2.55 |
| Total Families | 160 (100.0%) | 2.92 |
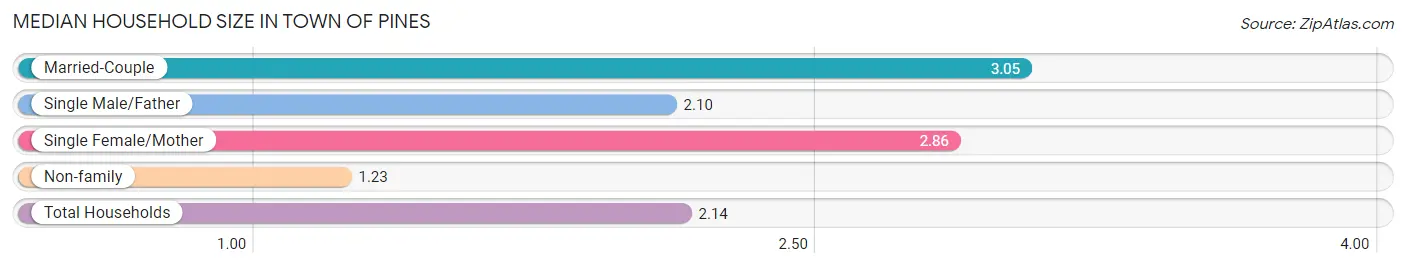
Median Household Size in Town of Pines
The median household size in Town of Pines is 2.14 persons per household, with married-couple households (128 | 42.1%) accounting for the largest median household size of 3.05 persons per household. non-family households (144 | 47.4%) represent the smallest median household size with 1.23 persons per household.
| Household Type | # Households | Household Size |
| Married-Couple | 128 (42.1%) | 3.05 |
| Single Male/Father | 10 (3.3%) | 2.10 |
| Single Female/Mother | 22 (7.2%) | 2.86 |
| Non-family | 144 (47.4%) | 1.23 |
| Total Households | 304 (100.0%) | 2.14 |
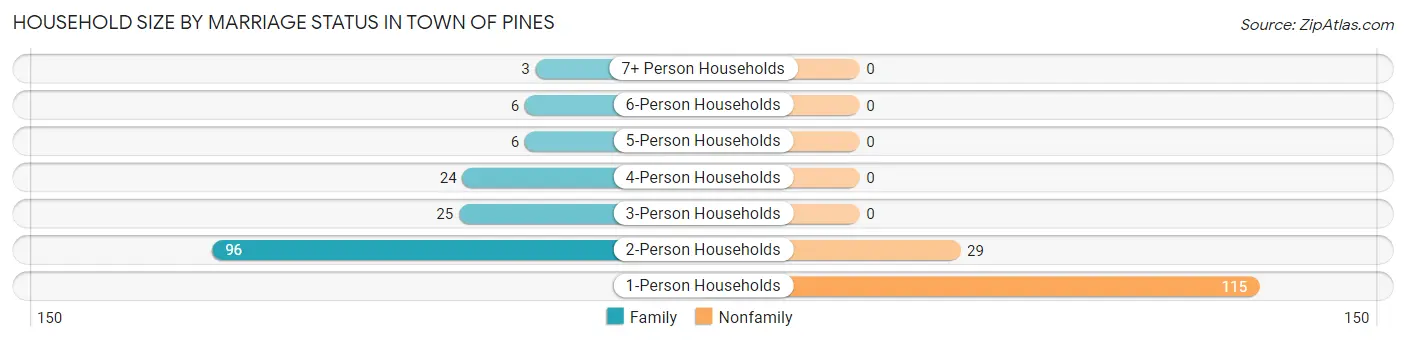
Household Size by Marriage Status in Town of Pines
Out of a total of 304 households in Town of Pines, 160 (52.6%) are family households, while 144 (47.4%) are nonfamily households. The most numerous type of family households are 2-person households, comprising 96, and the most common type of nonfamily households are 1-person households, comprising 115.
| Household Size | Family Households | Nonfamily Households |
| 1-Person Households | - | 115 (37.8%) |
| 2-Person Households | 96 (31.6%) | 29 (9.5%) |
| 3-Person Households | 25 (8.2%) | 0 (0.0%) |
| 4-Person Households | 24 (7.9%) | 0 (0.0%) |
| 5-Person Households | 6 (2.0%) | 0 (0.0%) |
| 6-Person Households | 6 (2.0%) | 0 (0.0%) |
| 7+ Person Households | 3 (1.0%) | 0 (0.0%) |
| Total | 160 (52.6%) | 144 (47.4%) |
Female Fertility in Town of Pines
Fertility by Age in Town of Pines
| Age Bracket | Women with Births | Births / 1,000 Women |
| 15 to 19 years | 0 (0.0%) | 0.0 |
| 20 to 34 years | 0 (0.0%) | 0.0 |
| 35 to 50 years | 0 (0.0%) | 0.0 |
| Total | 0 (0.0%) | 0.0 |
Fertility by Age by Marriage Status in Town of Pines
| Age Bracket | Married | Unmarried |
| 15 to 19 years | 0 (0.0%) | 0 (0.0%) |
| 20 to 34 years | 0 (0.0%) | 0 (0.0%) |
| 35 to 50 years | 0 (0.0%) | 0 (0.0%) |
| Total | 0 (0.0%) | 0 (0.0%) |
Fertility by Education in Town of Pines
| Educational Attainment | Women with Births | Births / 1,000 Women |
| Less than High School | 0 (0.0%) | 0.0 |
| High School Diploma | 0 (0.0%) | 0.0 |
| College or Associate's Degree | 0 (0.0%) | 0.0 |
| Bachelor's Degree | 0 (0.0%) | 0.0 |
| Graduate Degree | 0 (0.0%) | 0.0 |
| Total | 0 (0.0%) | 0.0 |
Fertility by Education by Marriage Status in Town of Pines
| Educational Attainment | Married | Unmarried |
| Less than High School | 0 (0.0%) | 0 (0.0%) |
| High School Diploma | 0 (0.0%) | 0 (0.0%) |
| College or Associate's Degree | 0 (0.0%) | 0 (0.0%) |
| Bachelor's Degree | 0 (0.0%) | 0 (0.0%) |
| Graduate Degree | 0 (0.0%) | 0 (0.0%) |
| Total | 0 (0.0%) | 0 (0.0%) |
Income in Town of Pines
Income Overview in Town of Pines
Per Capita Income in Town of Pines is $33,808, while median incomes of families and households are $71,250 and $53,000 respectively.
| Characteristic | Number | Measure |
| Per Capita Income | 651 | $33,808 |
| Median Family Income | 160 | $71,250 |
| Mean Family Income | 160 | $87,643 |
| Median Household Income | 304 | $53,000 |
| Mean Household Income | 304 | $70,339 |
| Income Deficit | 160 | $0 |
| Wage / Income Gap (%) | 651 | 7.04% |
| Wage / Income Gap ($) | 651 | 92.96¢ per $1 |
| Gini / Inequality Index | 651 | 0.42 |
Earnings by Sex in Town of Pines
Average Earnings in Town of Pines are $42,024, $41,833 for men and $45,000 for women, a difference of 7.0%.
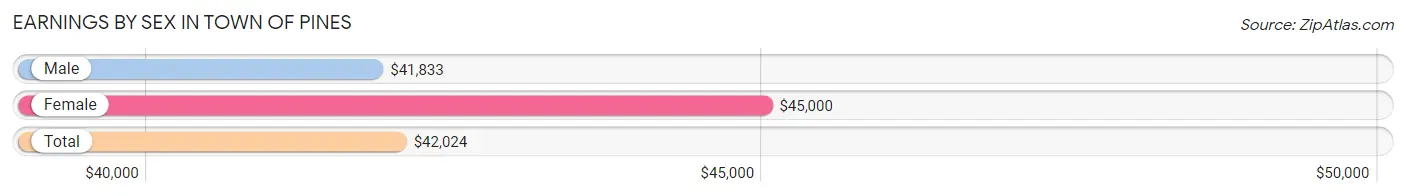
| Sex | Number | Average Earnings |
| Male | 156 (50.0%) | $41,833 |
| Female | 156 (50.0%) | $45,000 |
| Total | 312 (100.0%) | $42,024 |
Earnings by Sex by Income Bracket in Town of Pines
The most common earnings brackets in Town of Pines are $75,000 to $99,999 for men (29 | 18.6%) and $65,000 to $74,999 for women (20 | 12.8%).
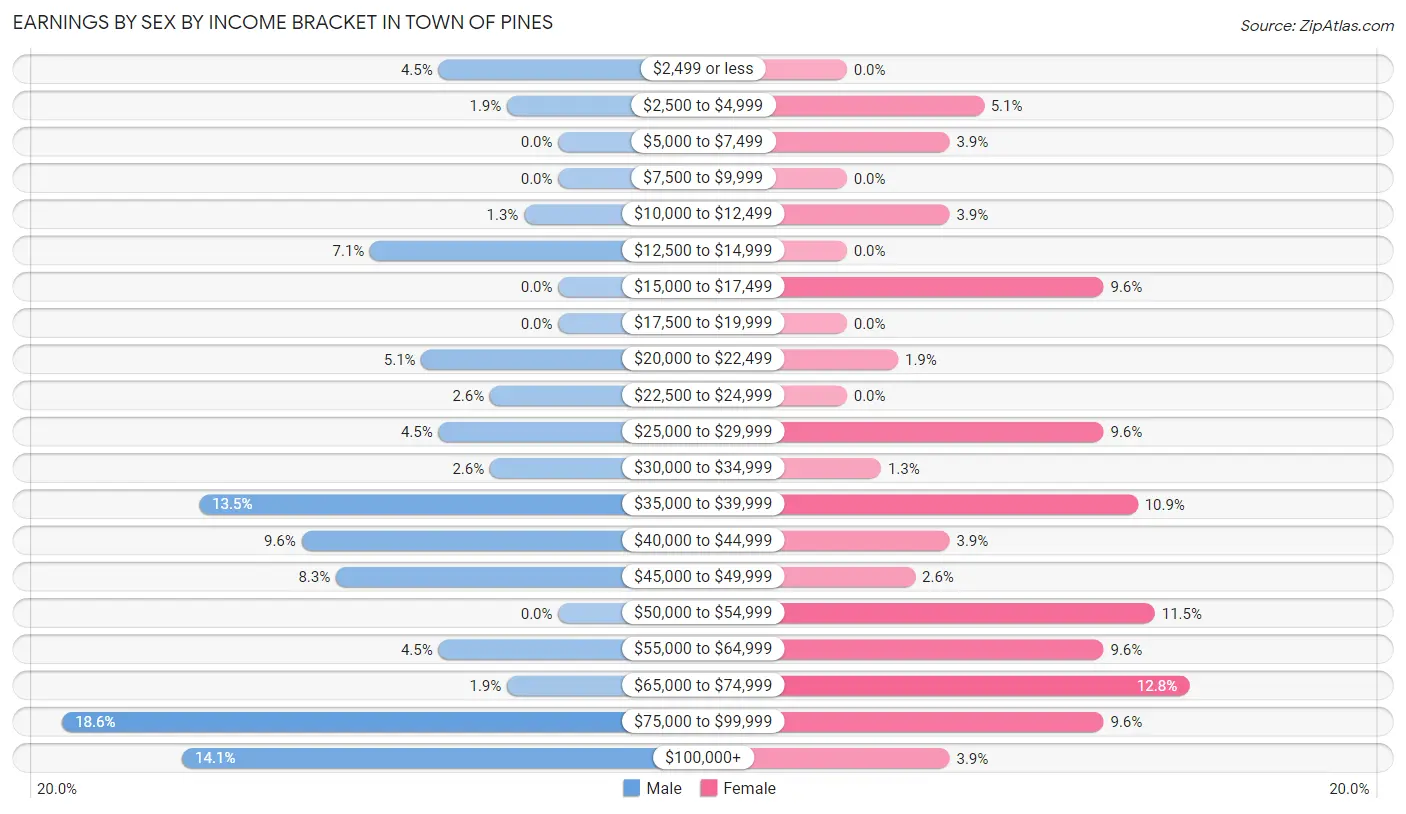
| Income | Male | Female |
| $2,499 or less | 7 (4.5%) | 0 (0.0%) |
| $2,500 to $4,999 | 3 (1.9%) | 8 (5.1%) |
| $5,000 to $7,499 | 0 (0.0%) | 6 (3.8%) |
| $7,500 to $9,999 | 0 (0.0%) | 0 (0.0%) |
| $10,000 to $12,499 | 2 (1.3%) | 6 (3.8%) |
| $12,500 to $14,999 | 11 (7.0%) | 0 (0.0%) |
| $15,000 to $17,499 | 0 (0.0%) | 15 (9.6%) |
| $17,500 to $19,999 | 0 (0.0%) | 0 (0.0%) |
| $20,000 to $22,499 | 8 (5.1%) | 3 (1.9%) |
| $22,500 to $24,999 | 4 (2.6%) | 0 (0.0%) |
| $25,000 to $29,999 | 7 (4.5%) | 15 (9.6%) |
| $30,000 to $34,999 | 4 (2.6%) | 2 (1.3%) |
| $35,000 to $39,999 | 21 (13.5%) | 17 (10.9%) |
| $40,000 to $44,999 | 15 (9.6%) | 6 (3.8%) |
| $45,000 to $49,999 | 13 (8.3%) | 4 (2.6%) |
| $50,000 to $54,999 | 0 (0.0%) | 18 (11.5%) |
| $55,000 to $64,999 | 7 (4.5%) | 15 (9.6%) |
| $65,000 to $74,999 | 3 (1.9%) | 20 (12.8%) |
| $75,000 to $99,999 | 29 (18.6%) | 15 (9.6%) |
| $100,000+ | 22 (14.1%) | 6 (3.8%) |
| Total | 156 (100.0%) | 156 (100.0%) |
Earnings by Sex by Educational Attainment in Town of Pines
Average earnings in Town of Pines are $45,577 for men and $52,614 for women, a difference of 13.4%. Men with an educational attainment of college or associate's degree enjoy the highest average annual earnings of $76,250, while those with high school diploma education earn the least with $42,273. Women with an educational attainment of bachelor's degree earn the most with the average annual earnings of $72,000, while those with college or associate's degree education have the smallest earnings of $52,143.
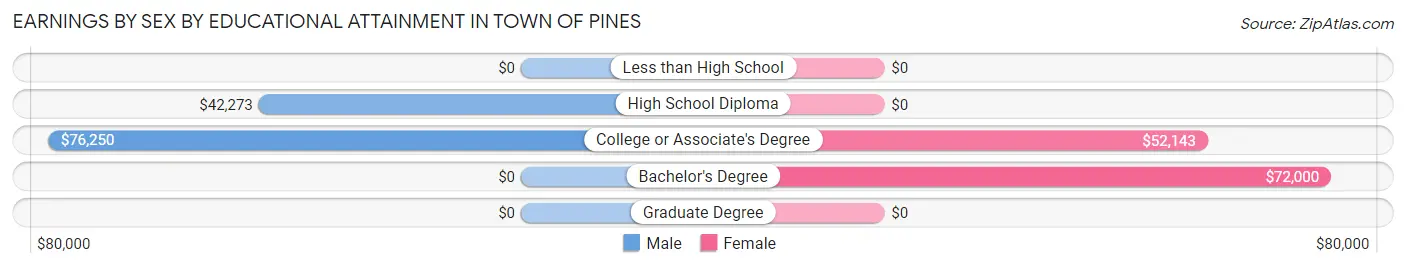
| Educational Attainment | Male Income | Female Income |
| Less than High School | - | - |
| High School Diploma | $42,273 | $0 |
| College or Associate's Degree | $76,250 | $52,143 |
| Bachelor's Degree | - | - |
| Graduate Degree | - | - |
| Total | $45,577 | $52,614 |
Family Income in Town of Pines
Family Income Brackets in Town of Pines
According to the Town of Pines family income data, there are 34 families falling into the $35,000 to $49,999 income range, which is the most common income bracket and makes up 21.2% of all families. Conversely, the $10,000 to $14,999 income bracket is the least frequent group with only 2 families (1.3%) belonging to this category.
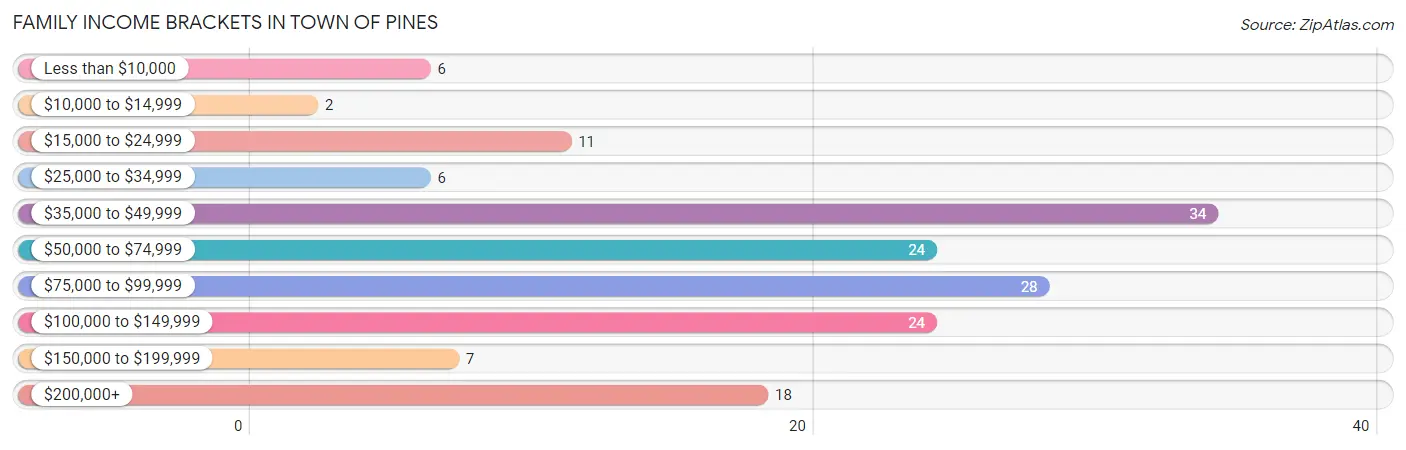
| Income Bracket | # Families | % Families |
| Less than $10,000 | 6 | 3.8% |
| $10,000 to $14,999 | 2 | 1.3% |
| $15,000 to $24,999 | 11 | 6.9% |
| $25,000 to $34,999 | 6 | 3.8% |
| $35,000 to $49,999 | 34 | 21.3% |
| $50,000 to $74,999 | 24 | 15.0% |
| $75,000 to $99,999 | 28 | 17.5% |
| $100,000 to $149,999 | 24 | 15.0% |
| $150,000 to $199,999 | 7 | 4.4% |
| $200,000+ | 18 | 11.3% |
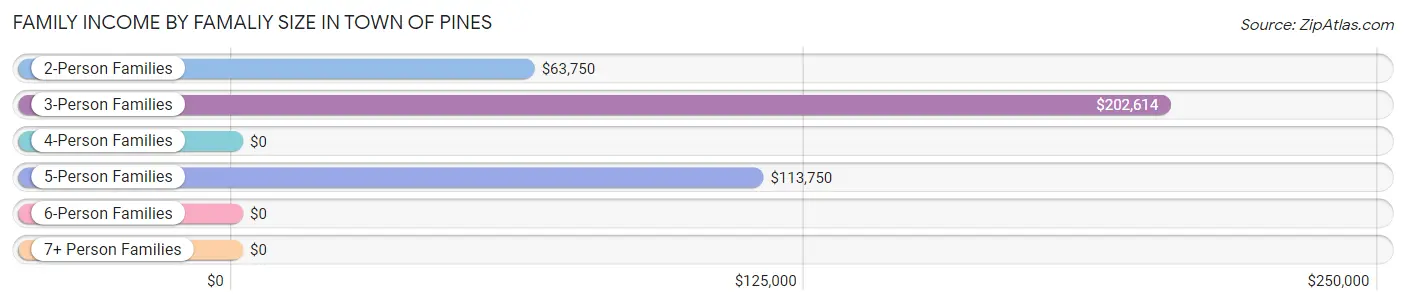
Family Income by Famaliy Size in Town of Pines
3-person families (21 | 13.1%) account for the highest median family income in Town of Pines with $202,614 per family, while 3-person families (21 | 13.1%) have the highest median income of $67,538 per family member.
| Income Bracket | # Families | Median Income |
| 2-Person Families | 100 (62.5%) | $63,750 |
| 3-Person Families | 21 (13.1%) | $202,614 |
| 4-Person Families | 24 (15.0%) | $0 |
| 5-Person Families | 8 (5.0%) | $113,750 |
| 6-Person Families | 4 (2.5%) | $0 |
| 7+ Person Families | 3 (1.9%) | $0 |
| Total | 160 (100.0%) | $71,250 |
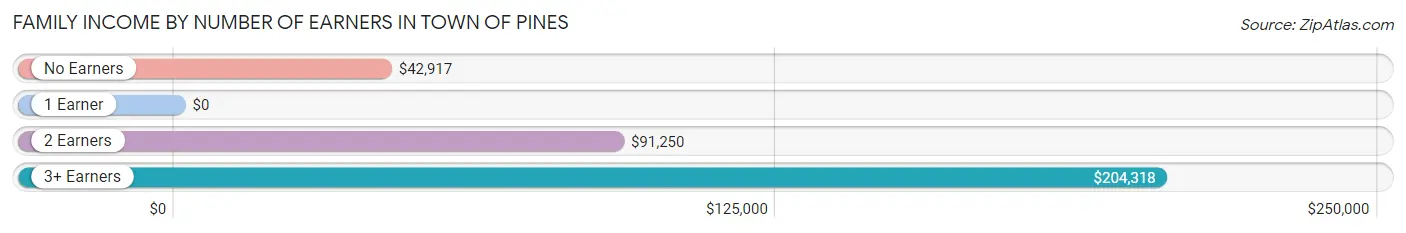
Family Income by Number of Earners in Town of Pines
| Number of Earners | # Families | Median Income |
| No Earners | 39 (24.4%) | $42,917 |
| 1 Earner | 69 (43.1%) | $0 |
| 2 Earners | 32 (20.0%) | $91,250 |
| 3+ Earners | 20 (12.5%) | $204,318 |
| Total | 160 (100.0%) | $71,250 |
Household Income in Town of Pines
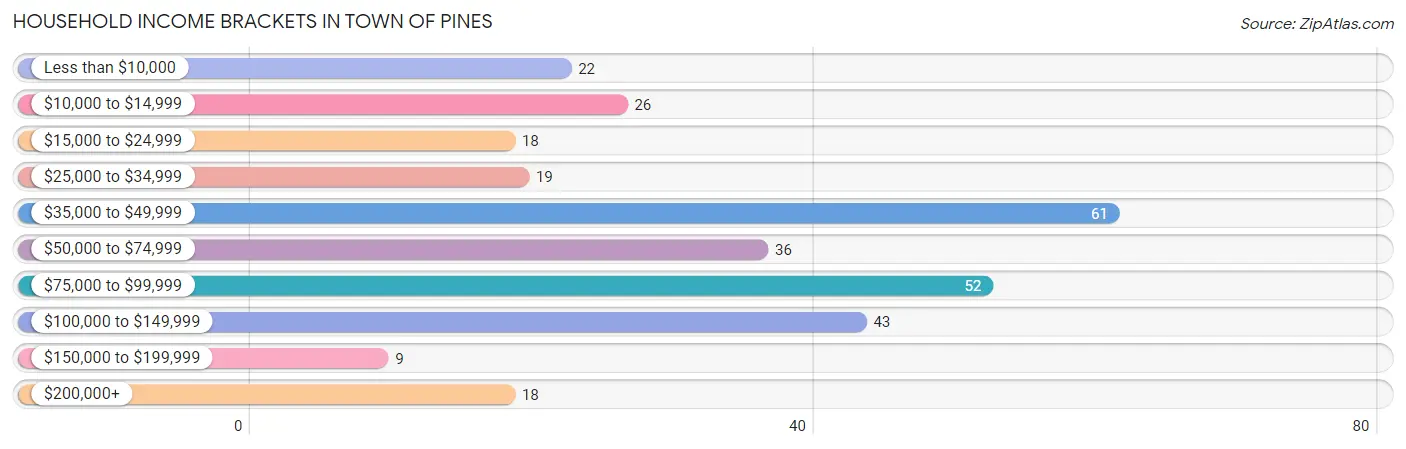
Household Income Brackets in Town of Pines
With 61 households falling in the category, the $35,000 to $49,999 income range is the most frequent in Town of Pines, accounting for 20.1% of all households. In contrast, only 9 households (3.0%) fall into the $150,000 to $199,999 income bracket, making it the least populous group.
| Income Bracket | # Households | % Households |
| Less than $10,000 | 22 | 7.2% |
| $10,000 to $14,999 | 26 | 8.6% |
| $15,000 to $24,999 | 18 | 5.9% |
| $25,000 to $34,999 | 19 | 6.3% |
| $35,000 to $49,999 | 61 | 20.1% |
| $50,000 to $74,999 | 36 | 11.8% |
| $75,000 to $99,999 | 52 | 17.1% |
| $100,000 to $149,999 | 43 | 14.1% |
| $150,000 to $199,999 | 9 | 3.0% |
| $200,000+ | 18 | 5.9% |
Household Income by Householder Age in Town of Pines
The median household income in Town of Pines is $53,000, with the highest median household income of $89,844 found in the 45 to 64 years age bracket for the primary householder. A total of 123 households (40.5%) fall into this category.

| Income Bracket | # Households | Median Income |
| 15 to 24 Years | 0 (0.0%) | $0 |
| 25 to 44 Years | 72 (23.7%) | $75,625 |
| 45 to 64 Years | 123 (40.5%) | $89,844 |
| 65+ Years | 109 (35.9%) | $32,250 |
| Total | 304 (100.0%) | $53,000 |
Poverty in Town of Pines
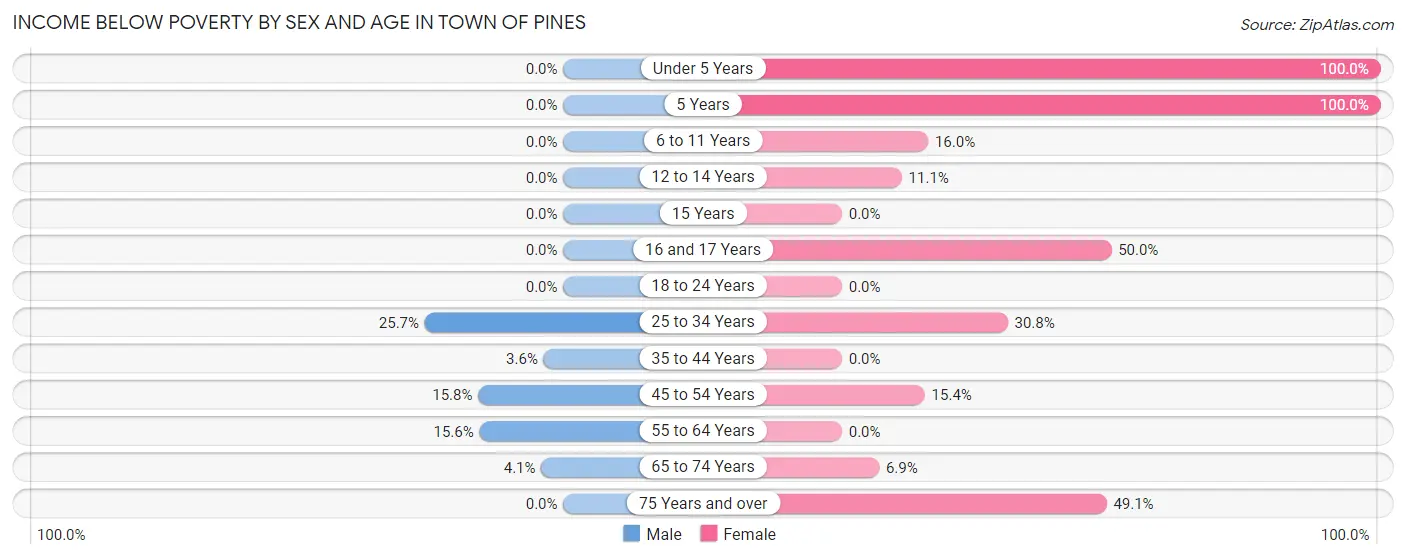
Income Below Poverty by Sex and Age in Town of Pines
With 8.7% poverty level for males and 17.0% for females among the residents of Town of Pines, 25 to 34 year old males and under 5 year old females are the most vulnerable to poverty, with 9 males (25.7%) and 2 females (100.0%) in their respective age groups living below the poverty level.
| Age Bracket | Male | Female |
| Under 5 Years | 0 (0.0%) | 2 (100.0%) |
| 5 Years | 0 (0.0%) | 1 (100.0%) |
| 6 to 11 Years | 0 (0.0%) | 4 (16.0%) |
| 12 to 14 Years | 0 (0.0%) | 2 (11.1%) |
| 15 Years | 0 (0.0%) | 0 (0.0%) |
| 16 and 17 Years | 0 (0.0%) | 3 (50.0%) |
| 18 to 24 Years | 0 (0.0%) | 0 (0.0%) |
| 25 to 34 Years | 9 (25.7%) | 12 (30.8%) |
| 35 to 44 Years | 2 (3.6%) | 0 (0.0%) |
| 45 to 54 Years | 6 (15.8%) | 6 (15.4%) |
| 55 to 64 Years | 7 (15.6%) | 0 (0.0%) |
| 65 to 74 Years | 2 (4.1%) | 2 (6.9%) |
| 75 Years and over | 0 (0.0%) | 28 (49.1%) |
| Total | 26 (8.7%) | 60 (17.0%) |
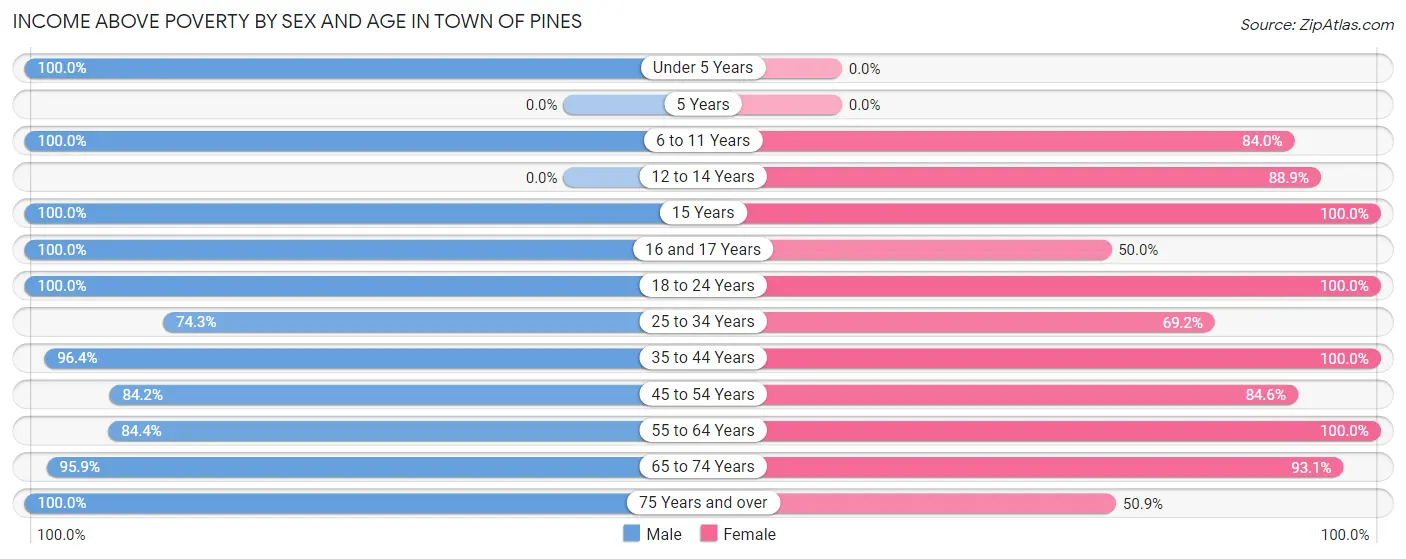
Income Above Poverty by Sex and Age in Town of Pines
According to the poverty statistics in Town of Pines, males aged under 5 years and females aged 15 years are the age groups that are most secure financially, with 100.0% of males and 100.0% of females in these age groups living above the poverty line.
| Age Bracket | Male | Female |
| Under 5 Years | 9 (100.0%) | 0 (0.0%) |
| 5 Years | 0 (0.0%) | 0 (0.0%) |
| 6 to 11 Years | 18 (100.0%) | 21 (84.0%) |
| 12 to 14 Years | 0 (0.0%) | 16 (88.9%) |
| 15 Years | 4 (100.0%) | 4 (100.0%) |
| 16 and 17 Years | 3 (100.0%) | 3 (50.0%) |
| 18 to 24 Years | 15 (100.0%) | 20 (100.0%) |
| 25 to 34 Years | 26 (74.3%) | 27 (69.2%) |
| 35 to 44 Years | 53 (96.4%) | 31 (100.0%) |
| 45 to 54 Years | 32 (84.2%) | 33 (84.6%) |
| 55 to 64 Years | 38 (84.4%) | 82 (100.0%) |
| 65 to 74 Years | 47 (95.9%) | 27 (93.1%) |
| 75 Years and over | 27 (100.0%) | 29 (50.9%) |
| Total | 272 (91.3%) | 293 (83.0%) |
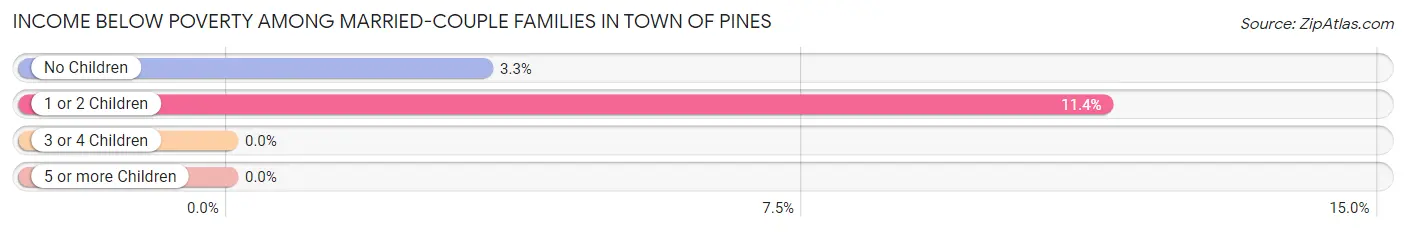
Income Below Poverty Among Married-Couple Families in Town of Pines
The poverty statistics for married-couple families in Town of Pines show that 5.5% or 7 of the total 128 families live below the poverty line. Families with 1 or 2 children have the highest poverty rate of 11.4%, comprising of 4 families. On the other hand, families with 3 or 4 children have the lowest poverty rate of 0.0%, which includes 0 families.
| Children | Above Poverty | Below Poverty |
| No Children | 87 (96.7%) | 3 (3.3%) |
| 1 or 2 Children | 31 (88.6%) | 4 (11.4%) |
| 3 or 4 Children | 3 (100.0%) | 0 (0.0%) |
| 5 or more Children | 0 (0.0%) | 0 (0.0%) |
| Total | 121 (94.5%) | 7 (5.5%) |
Income Below Poverty Among Single-Parent Households in Town of Pines
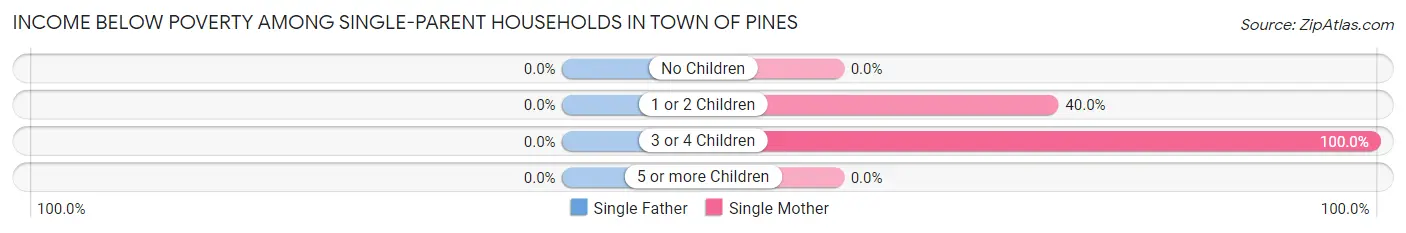
| Children | Single Father | Single Mother |
| No Children | 0 (0.0%) | 0 (0.0%) |
| 1 or 2 Children | 0 (0.0%) | 2 (40.0%) |
| 3 or 4 Children | 0 (0.0%) | 2 (100.0%) |
| 5 or more Children | 0 (0.0%) | 0 (0.0%) |
| Total | 0 (0.0%) | 4 (18.2%) |
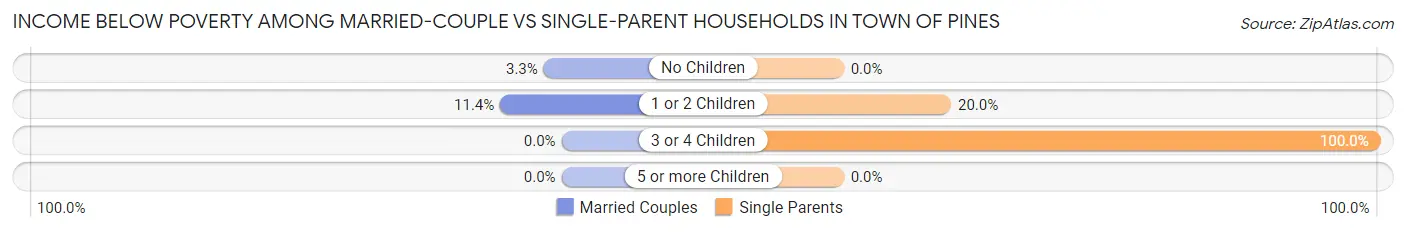
Income Below Poverty Among Married-Couple vs Single-Parent Households in Town of Pines
The poverty data for Town of Pines shows that 7 of the married-couple family households (5.5%) and 4 of the single-parent households (12.5%) are living below the poverty level. Within the married-couple family households, those with 1 or 2 children have the highest poverty rate, with 4 households (11.4%) falling below the poverty line. Among the single-parent households, those with 3 or 4 children have the highest poverty rate, with 2 household (100.0%) living below poverty.
| Children | Married-Couple Families | Single-Parent Households |
| No Children | 3 (3.3%) | 0 (0.0%) |
| 1 or 2 Children | 4 (11.4%) | 2 (20.0%) |
| 3 or 4 Children | 0 (0.0%) | 2 (100.0%) |
| 5 or more Children | 0 (0.0%) | 0 (0.0%) |
| Total | 7 (5.5%) | 4 (12.5%) |
Employment Characteristics in Town of Pines
Employment by Class of Employer in Town of Pines
Among the 291 employed individuals in Town of Pines, private company employees (209 | 71.8%), not-for-profit organizations (43 | 14.8%), and self-employed (incorporated) (13 | 4.5%) make up the most common classes of employment.
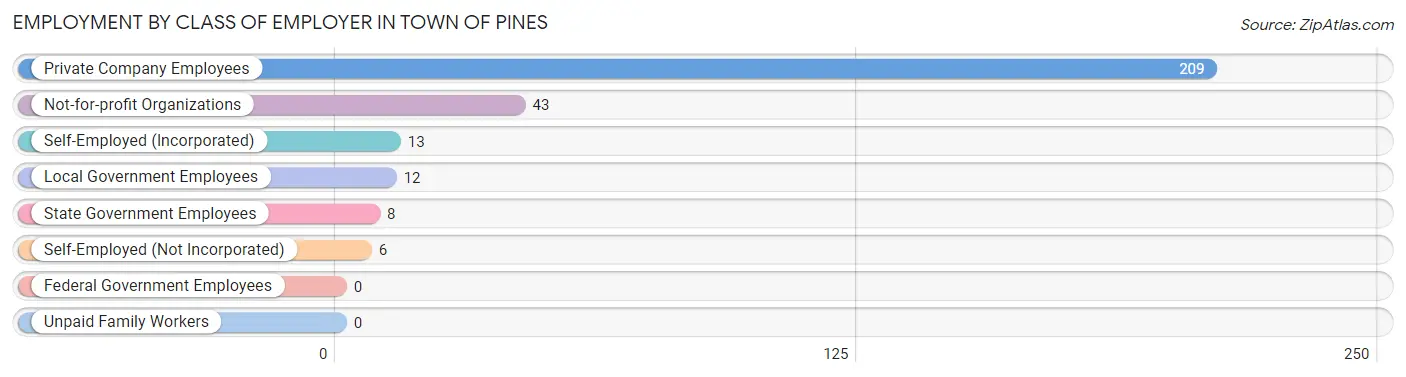
| Employer Class | # Employees | % Employees |
| Private Company Employees | 209 | 71.8% |
| Self-Employed (Incorporated) | 13 | 4.5% |
| Self-Employed (Not Incorporated) | 6 | 2.1% |
| Not-for-profit Organizations | 43 | 14.8% |
| Local Government Employees | 12 | 4.1% |
| State Government Employees | 8 | 2.8% |
| Federal Government Employees | 0 | 0.0% |
| Unpaid Family Workers | 0 | 0.0% |
| Total | 291 | 100.0% |
Employment Status by Age in Town of Pines
According to the labor force statistics for Town of Pines, out of the total population over 16 years of age (570), 54.4% or 310 individuals are in the labor force, with 3.5% or 11 of them unemployed. The age group with the highest labor force participation rate is 30 to 34 years, with 92.0% or 23 individuals in the labor force. Within the labor force, the 35 to 44 years age range has the highest percentage of unemployed individuals, with 13.6% or 9 of them being unemployed.
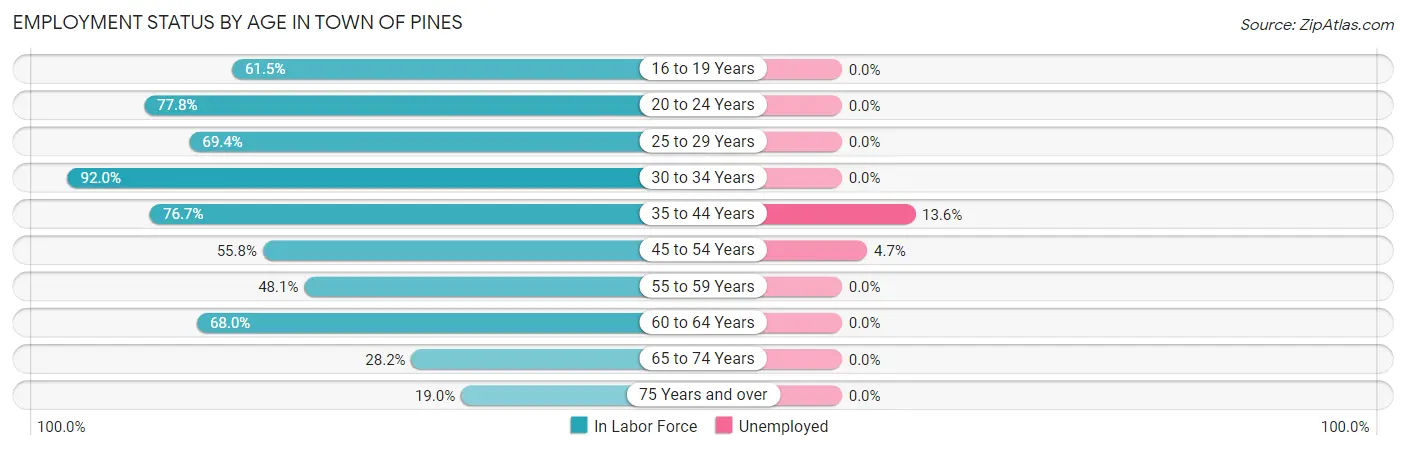
| Age Bracket | In Labor Force | Unemployed |
| 16 to 19 Years | 16 (61.5%) | 0 (0.0%) |
| 20 to 24 Years | 14 (77.8%) | 0 (0.0%) |
| 25 to 29 Years | 34 (69.4%) | 0 (0.0%) |
| 30 to 34 Years | 23 (92.0%) | 0 (0.0%) |
| 35 to 44 Years | 66 (76.7%) | 9 (13.6%) |
| 45 to 54 Years | 43 (55.8%) | 2 (4.7%) |
| 55 to 59 Years | 25 (48.1%) | 0 (0.0%) |
| 60 to 64 Years | 51 (68.0%) | 0 (0.0%) |
| 65 to 74 Years | 22 (28.2%) | 0 (0.0%) |
| 75 Years and over | 16 (19.0%) | 0 (0.0%) |
| Total | 310 (54.4%) | 11 (3.5%) |
Employment Status by Educational Attainment in Town of Pines
According to labor force statistics for Town of Pines, 66.5% of individuals (242) out of the total population between 25 and 64 years of age (364) are in the labor force, with 4.5% or 11 of them being unemployed. The group with the highest labor force participation rate are those with the educational attainment of bachelor's degree or higher, with 90.0% or 54 individuals in the labor force. Within the labor force, individuals with high school diploma education have the highest percentage of unemployment, with 10.5% or 9 of them being unemployed.
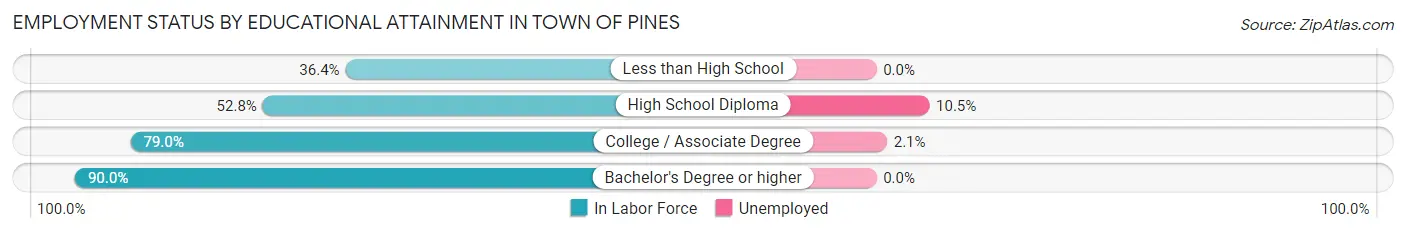
| Educational Attainment | In Labor Force | Unemployed |
| Less than High School | 8 (36.4%) | 0 (0.0%) |
| High School Diploma | 86 (52.8%) | 17 (10.5%) |
| College / Associate Degree | 94 (79.0%) | 2 (2.1%) |
| Bachelor's Degree or higher | 54 (90.0%) | 0 (0.0%) |
| Total | 242 (66.5%) | 16 (4.5%) |
Employment Occupations by Sex in Town of Pines
Management, Business, Science and Arts Occupations
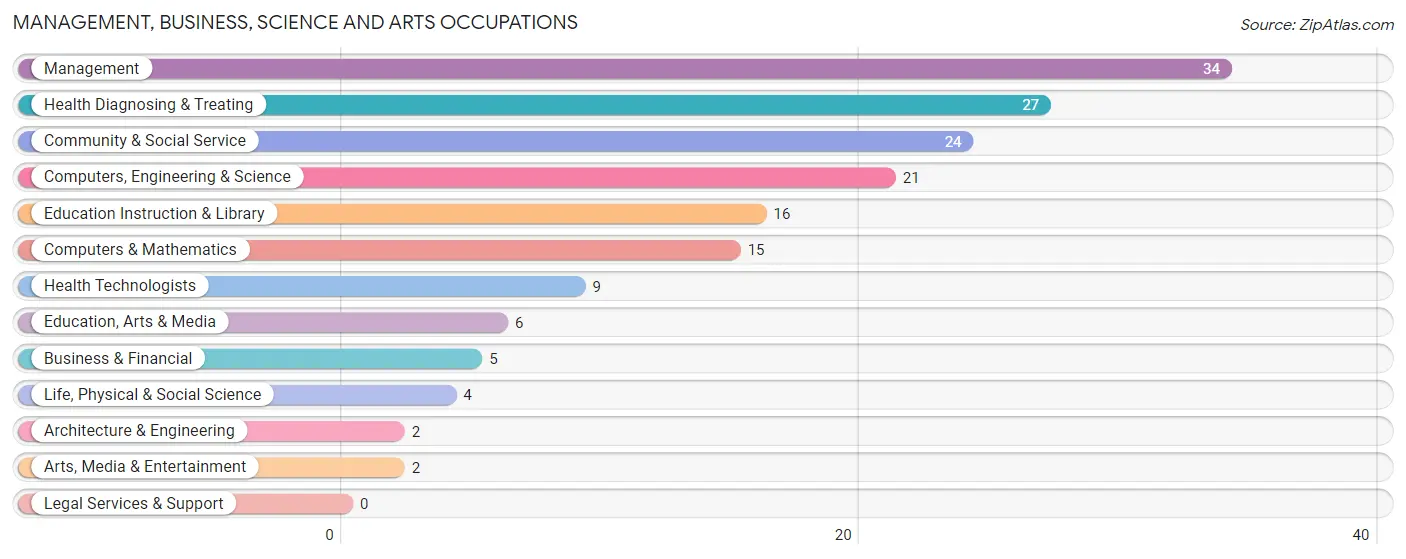
The most common Management, Business, Science and Arts occupations in Town of Pines are Management (34 | 11.4%), Health Diagnosing & Treating (27 | 9.0%), Community & Social Service (24 | 8.0%), Computers, Engineering & Science (21 | 7.0%), and Education Instruction & Library (16 | 5.3%).
Management, Business, Science and Arts Occupations by Sex
Within the Management, Business, Science and Arts occupations in Town of Pines, the most male-oriented occupations are Architecture & Engineering (100.0%), Life, Physical & Social Science (100.0%), and Education, Arts & Media (100.0%), while the most female-oriented occupations are Computers & Mathematics (100.0%), Health Technologists (100.0%), and Health Diagnosing & Treating (96.3%).
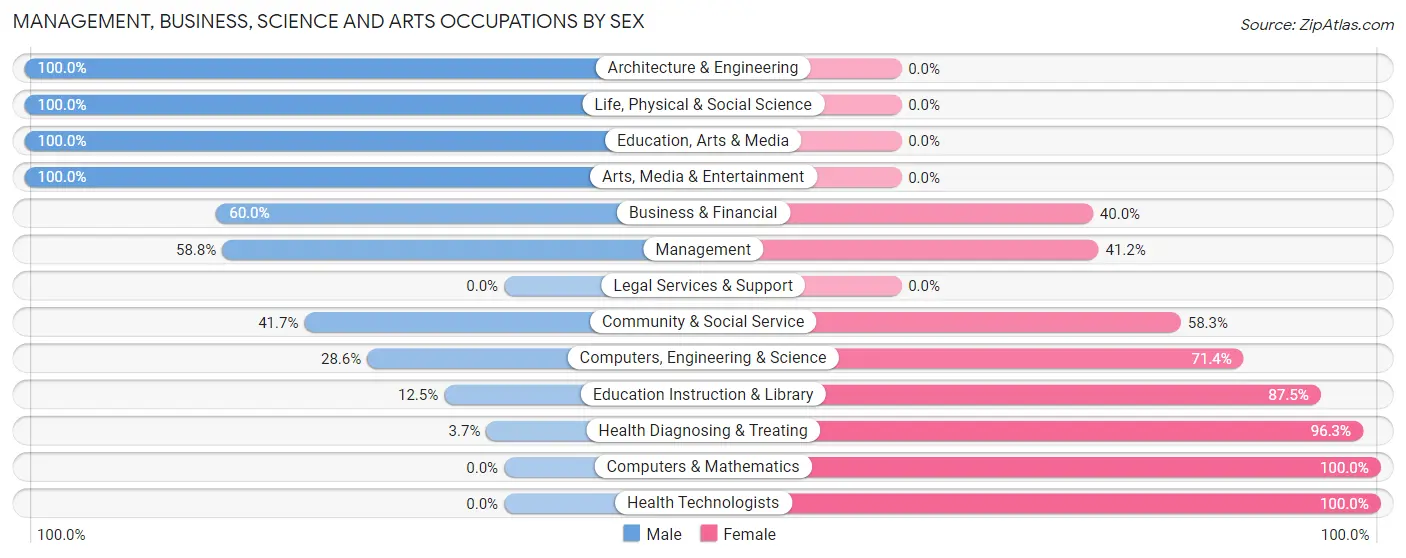
| Occupation | Male | Female |
| Management | 20 (58.8%) | 14 (41.2%) |
| Business & Financial | 3 (60.0%) | 2 (40.0%) |
| Computers, Engineering & Science | 6 (28.6%) | 15 (71.4%) |
| Computers & Mathematics | 0 (0.0%) | 15 (100.0%) |
| Architecture & Engineering | 2 (100.0%) | 0 (0.0%) |
| Life, Physical & Social Science | 4 (100.0%) | 0 (0.0%) |
| Community & Social Service | 10 (41.7%) | 14 (58.3%) |
| Education, Arts & Media | 6 (100.0%) | 0 (0.0%) |
| Legal Services & Support | 0 (0.0%) | 0 (0.0%) |
| Education Instruction & Library | 2 (12.5%) | 14 (87.5%) |
| Arts, Media & Entertainment | 2 (100.0%) | 0 (0.0%) |
| Health Diagnosing & Treating | 1 (3.7%) | 26 (96.3%) |
| Health Technologists | 0 (0.0%) | 9 (100.0%) |
| Total (Category) | 40 (36.0%) | 71 (64.0%) |
| Total (Overall) | 146 (48.8%) | 153 (51.2%) |
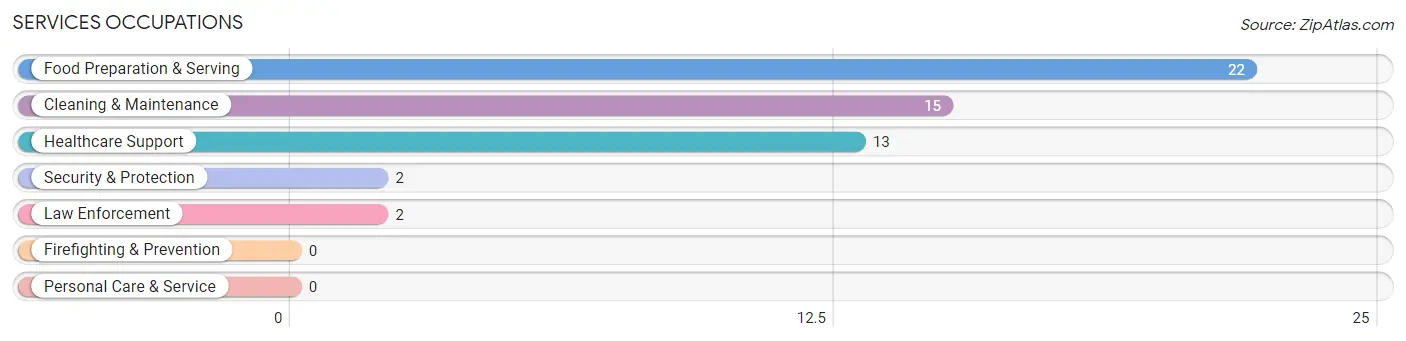
Services Occupations
The most common Services occupations in Town of Pines are Food Preparation & Serving (22 | 7.4%), Cleaning & Maintenance (15 | 5.0%), Healthcare Support (13 | 4.3%), Security & Protection (2 | 0.7%), and Law Enforcement (2 | 0.7%).
Services Occupations by Sex
Within the Services occupations in Town of Pines, the most male-oriented occupations are Security & Protection (100.0%), Law Enforcement (100.0%), and Cleaning & Maintenance (53.3%), while the most female-oriented occupations are Healthcare Support (100.0%), Food Preparation & Serving (50.0%), and Cleaning & Maintenance (46.7%).
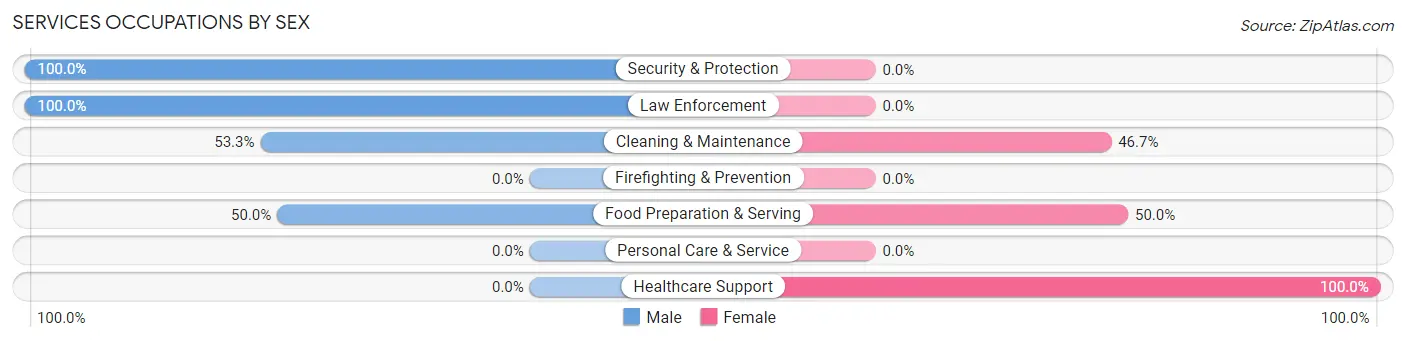
| Occupation | Male | Female |
| Healthcare Support | 0 (0.0%) | 13 (100.0%) |
| Security & Protection | 2 (100.0%) | 0 (0.0%) |
| Firefighting & Prevention | 0 (0.0%) | 0 (0.0%) |
| Law Enforcement | 2 (100.0%) | 0 (0.0%) |
| Food Preparation & Serving | 11 (50.0%) | 11 (50.0%) |
| Cleaning & Maintenance | 8 (53.3%) | 7 (46.7%) |
| Personal Care & Service | 0 (0.0%) | 0 (0.0%) |
| Total (Category) | 21 (40.4%) | 31 (59.6%) |
| Total (Overall) | 146 (48.8%) | 153 (51.2%) |
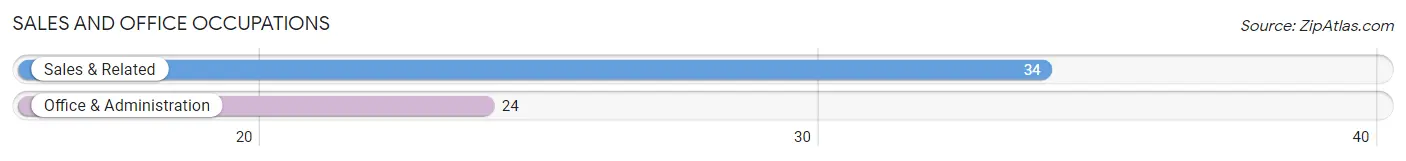
Sales and Office Occupations
The most common Sales and Office occupations in Town of Pines are Sales & Related (34 | 11.4%), and Office & Administration (24 | 8.0%).
Sales and Office Occupations by Sex
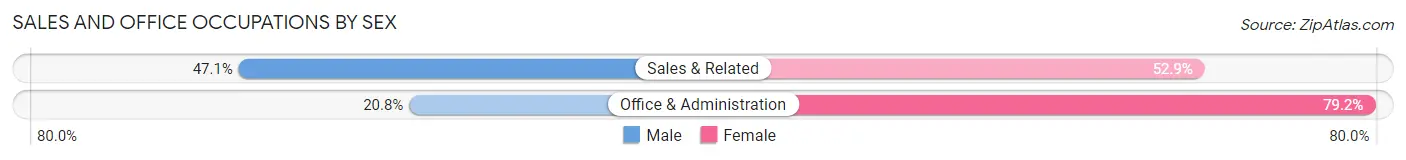
| Occupation | Male | Female |
| Sales & Related | 16 (47.1%) | 18 (52.9%) |
| Office & Administration | 5 (20.8%) | 19 (79.2%) |
| Total (Category) | 21 (36.2%) | 37 (63.8%) |
| Total (Overall) | 146 (48.8%) | 153 (51.2%) |
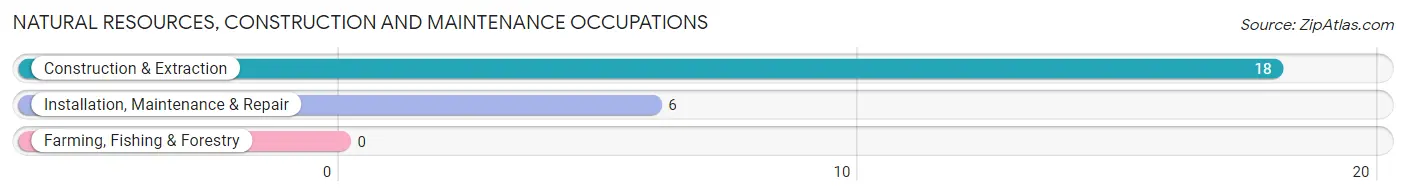
Natural Resources, Construction and Maintenance Occupations
The most common Natural Resources, Construction and Maintenance occupations in Town of Pines are Construction & Extraction (18 | 6.0%), and Installation, Maintenance & Repair (6 | 2.0%).
Natural Resources, Construction and Maintenance Occupations by Sex
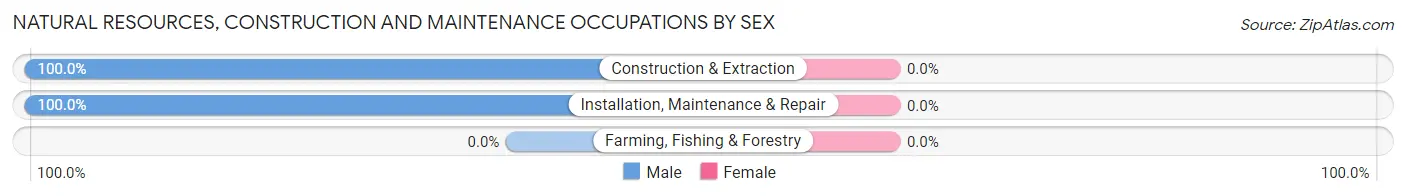
| Occupation | Male | Female |
| Farming, Fishing & Forestry | 0 (0.0%) | 0 (0.0%) |
| Construction & Extraction | 18 (100.0%) | 0 (0.0%) |
| Installation, Maintenance & Repair | 6 (100.0%) | 0 (0.0%) |
| Total (Category) | 24 (100.0%) | 0 (0.0%) |
| Total (Overall) | 146 (48.8%) | 153 (51.2%) |
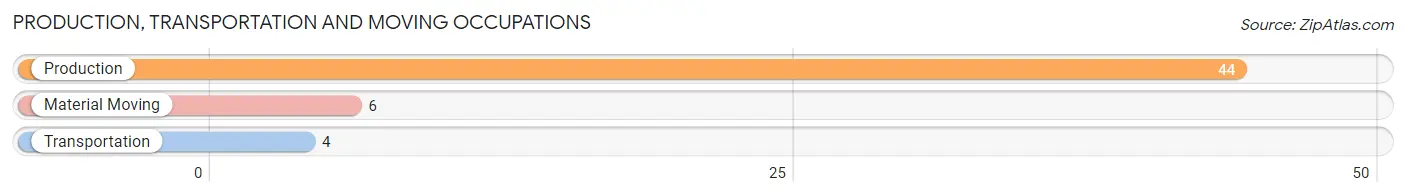
Production, Transportation and Moving Occupations
The most common Production, Transportation and Moving occupations in Town of Pines are Production (44 | 14.7%), Material Moving (6 | 2.0%), and Transportation (4 | 1.3%).
Production, Transportation and Moving Occupations by Sex
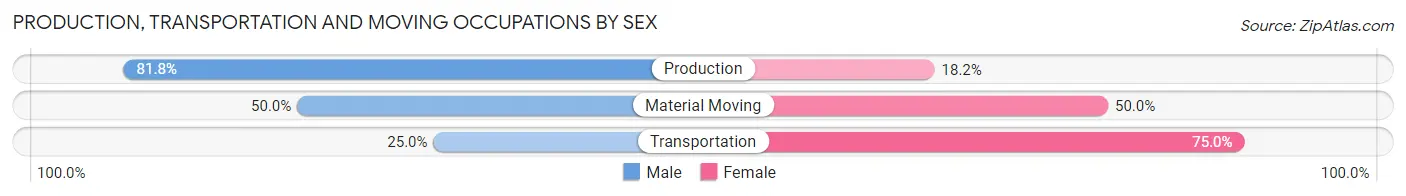
| Occupation | Male | Female |
| Production | 36 (81.8%) | 8 (18.2%) |
| Transportation | 1 (25.0%) | 3 (75.0%) |
| Material Moving | 3 (50.0%) | 3 (50.0%) |
| Total (Category) | 40 (74.1%) | 14 (25.9%) |
| Total (Overall) | 146 (48.8%) | 153 (51.2%) |
Employment Industries by Sex in Town of Pines
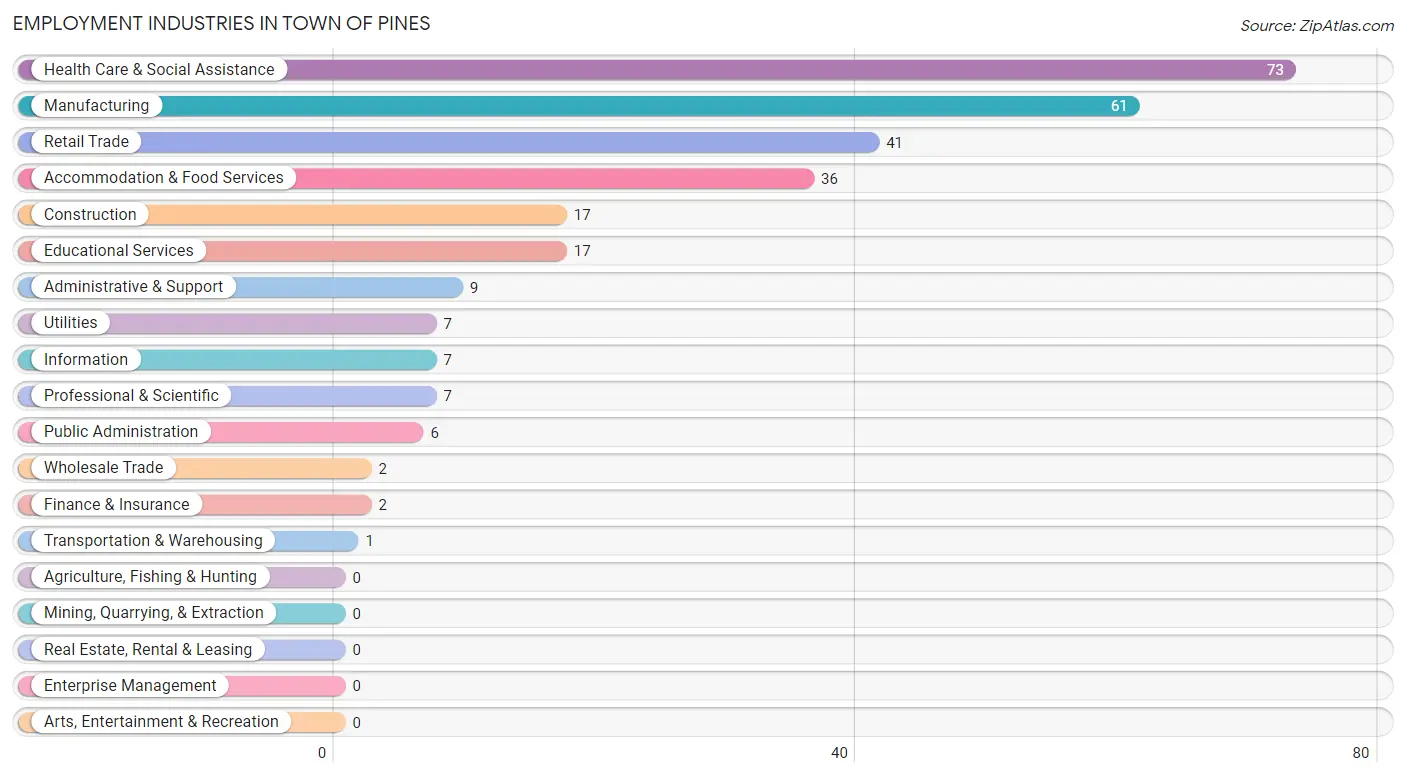
Employment Industries in Town of Pines
The major employment industries in Town of Pines include Health Care & Social Assistance (73 | 24.4%), Manufacturing (61 | 20.4%), Retail Trade (41 | 13.7%), Accommodation & Food Services (36 | 12.0%), and Construction (17 | 5.7%).
Employment Industries by Sex in Town of Pines
The Town of Pines industries that see more men than women are Construction (100.0%), Wholesale Trade (100.0%), and Transportation & Warehousing (100.0%), whereas the industries that tend to have a higher number of women are Finance & Insurance (100.0%), Administrative & Support (100.0%), and Health Care & Social Assistance (90.4%).
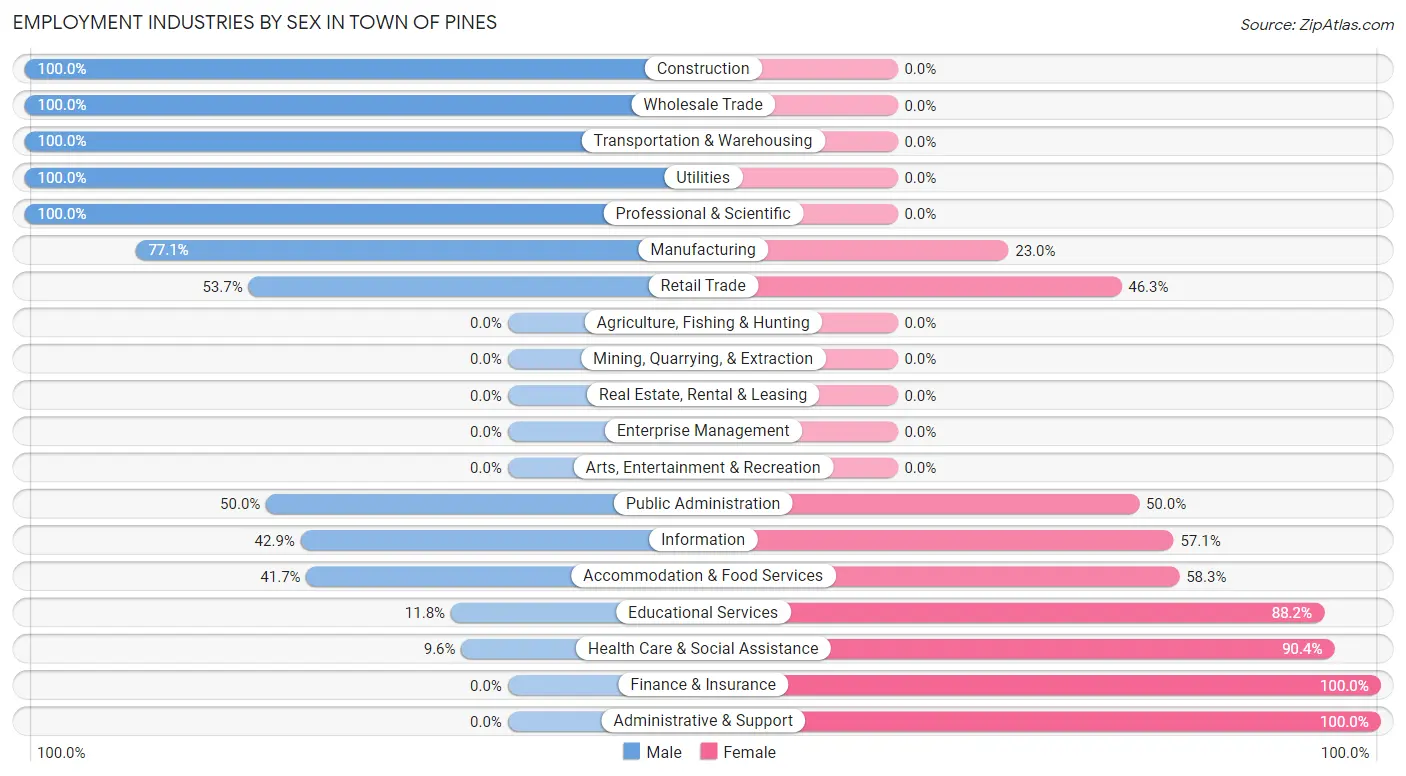
| Industry | Male | Female |
| Agriculture, Fishing & Hunting | 0 (0.0%) | 0 (0.0%) |
| Mining, Quarrying, & Extraction | 0 (0.0%) | 0 (0.0%) |
| Construction | 17 (100.0%) | 0 (0.0%) |
| Manufacturing | 47 (77.0%) | 14 (23.0%) |
| Wholesale Trade | 2 (100.0%) | 0 (0.0%) |
| Retail Trade | 22 (53.7%) | 19 (46.3%) |
| Transportation & Warehousing | 1 (100.0%) | 0 (0.0%) |
| Utilities | 7 (100.0%) | 0 (0.0%) |
| Information | 3 (42.9%) | 4 (57.1%) |
| Finance & Insurance | 0 (0.0%) | 2 (100.0%) |
| Real Estate, Rental & Leasing | 0 (0.0%) | 0 (0.0%) |
| Professional & Scientific | 7 (100.0%) | 0 (0.0%) |
| Enterprise Management | 0 (0.0%) | 0 (0.0%) |
| Administrative & Support | 0 (0.0%) | 9 (100.0%) |
| Educational Services | 2 (11.8%) | 15 (88.2%) |
| Health Care & Social Assistance | 7 (9.6%) | 66 (90.4%) |
| Arts, Entertainment & Recreation | 0 (0.0%) | 0 (0.0%) |
| Accommodation & Food Services | 15 (41.7%) | 21 (58.3%) |
| Public Administration | 3 (50.0%) | 3 (50.0%) |
| Total | 146 (48.8%) | 153 (51.2%) |
Education in Town of Pines
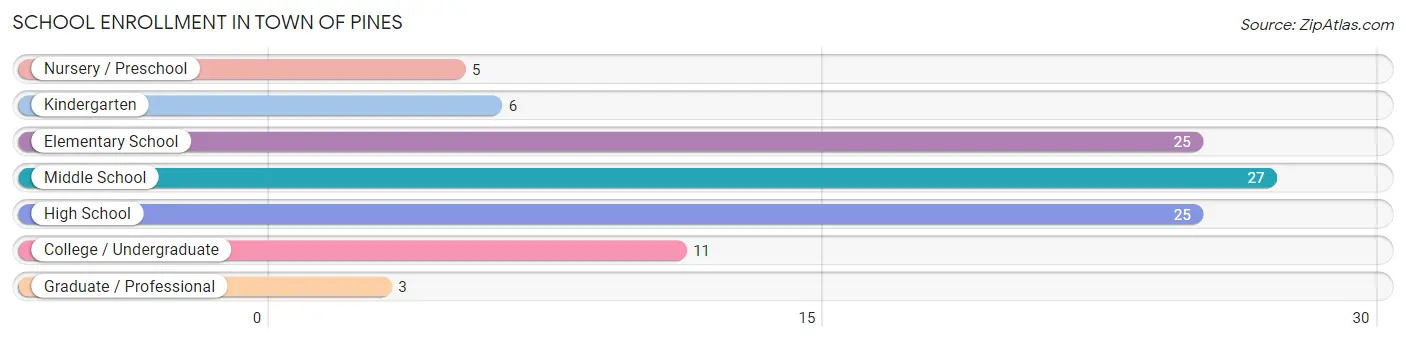
School Enrollment in Town of Pines
The most common levels of schooling among the 102 students in Town of Pines are middle school (27 | 26.5%), elementary school (25 | 24.5%), and high school (25 | 24.5%).
| School Level | # Students | % Students |
| Nursery / Preschool | 5 | 4.9% |
| Kindergarten | 6 | 5.9% |
| Elementary School | 25 | 24.5% |
| Middle School | 27 | 26.5% |
| High School | 25 | 24.5% |
| College / Undergraduate | 11 | 10.8% |
| Graduate / Professional | 3 | 2.9% |
| Total | 102 | 100.0% |
School Enrollment by Age by Funding Source in Town of Pines
Out of a total of 102 students who are enrolled in schools in Town of Pines, 26 (25.5%) attend a private institution, while the remaining 76 (74.5%) are enrolled in public schools. The age group of 3 to 4 year olds has the highest likelihood of being enrolled in private schools, with 4 (100.0% in the age bracket) enrolled. Conversely, the age group of 20 to 24 year olds has the lowest likelihood of being enrolled in a private school, with 4 (100.0% in the age bracket) attending a public institution.
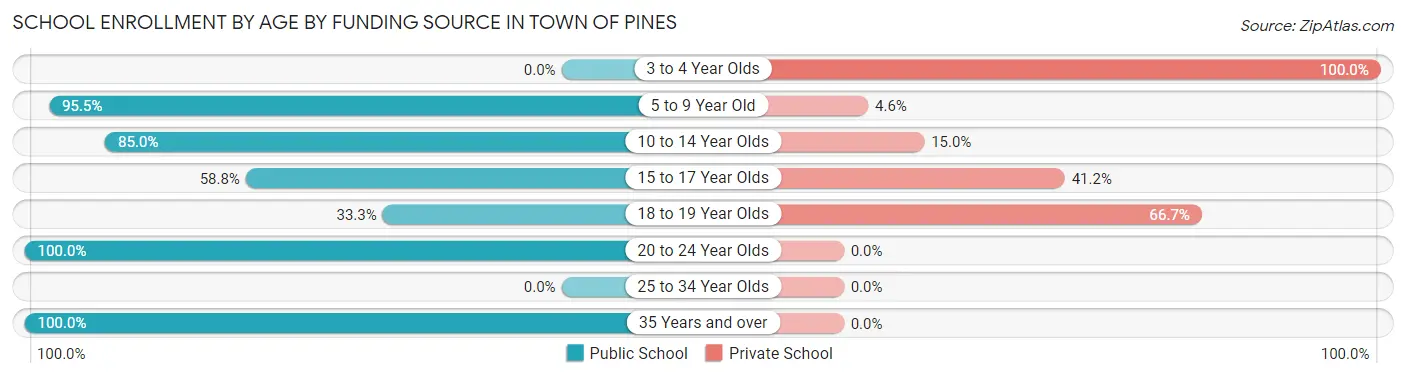
| Age Bracket | Public School | Private School |
| 3 to 4 Year Olds | 0 (0.0%) | 4 (100.0%) |
| 5 to 9 Year Old | 21 (95.5%) | 1 (4.5%) |
| 10 to 14 Year Olds | 34 (85.0%) | 6 (15.0%) |
| 15 to 17 Year Olds | 10 (58.8%) | 7 (41.2%) |
| 18 to 19 Year Olds | 4 (33.3%) | 8 (66.7%) |
| 20 to 24 Year Olds | 4 (100.0%) | 0 (0.0%) |
| 25 to 34 Year Olds | 0 (0.0%) | 0 (0.0%) |
| 35 Years and over | 3 (100.0%) | 0 (0.0%) |
| Total | 76 (74.5%) | 26 (25.5%) |
Educational Attainment by Field of Study in Town of Pines
Science & technology (26 | 29.2%), education (16 | 18.0%), business (7 | 7.9%), literature & languages (7 | 7.9%), and bio, nature & agricultural (6 | 6.7%) are the most common fields of study among 89 individuals in Town of Pines who have obtained a bachelor's degree or higher.
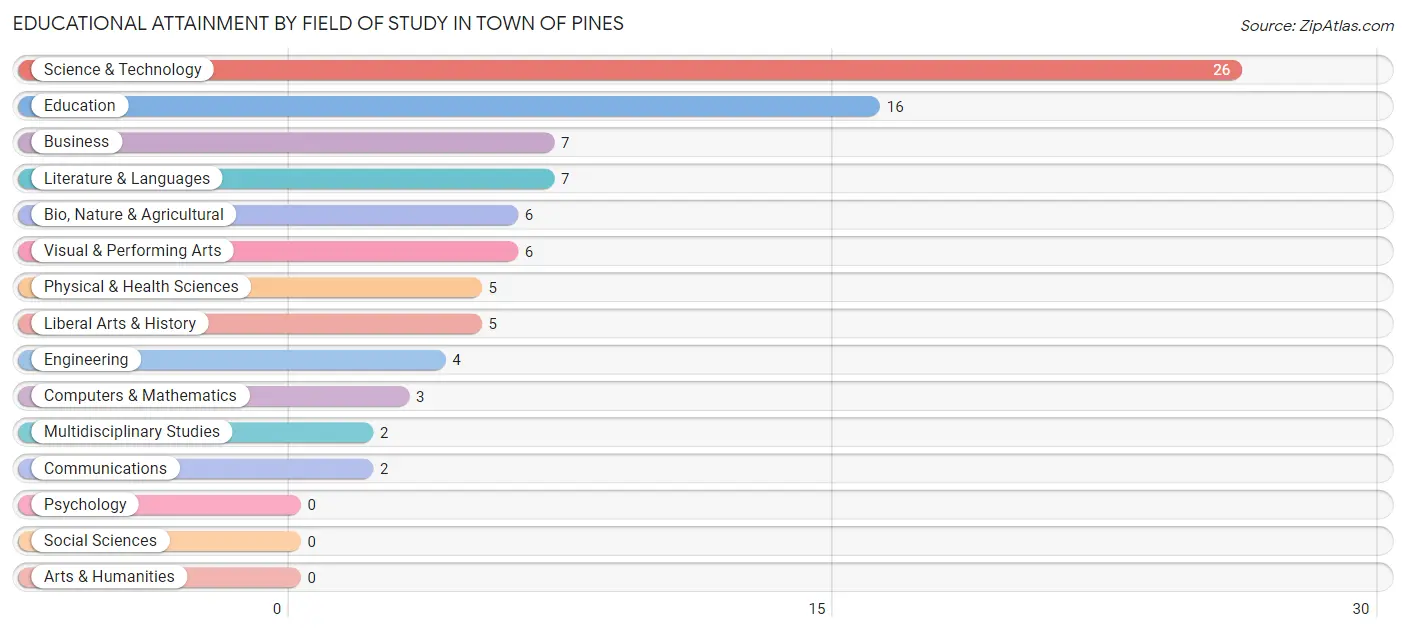
| Field of Study | # Graduates | % Graduates |
| Computers & Mathematics | 3 | 3.4% |
| Bio, Nature & Agricultural | 6 | 6.7% |
| Physical & Health Sciences | 5 | 5.6% |
| Psychology | 0 | 0.0% |
| Social Sciences | 0 | 0.0% |
| Engineering | 4 | 4.5% |
| Multidisciplinary Studies | 2 | 2.2% |
| Science & Technology | 26 | 29.2% |
| Business | 7 | 7.9% |
| Education | 16 | 18.0% |
| Literature & Languages | 7 | 7.9% |
| Liberal Arts & History | 5 | 5.6% |
| Visual & Performing Arts | 6 | 6.7% |
| Communications | 2 | 2.2% |
| Arts & Humanities | 0 | 0.0% |
| Total | 89 | 100.0% |
Transportation & Commute in Town of Pines
Vehicle Availability by Sex in Town of Pines
The most prevalent vehicle ownership categories in Town of Pines are males with 3 vehicles (66, accounting for 45.2%) and females with 3 vehicles (59, making up 45.5%).
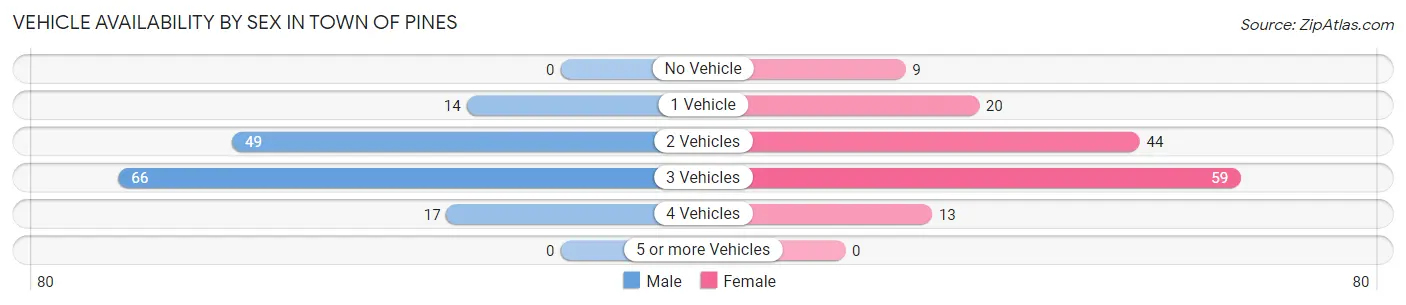
| Vehicles Available | Male | Female |
| No Vehicle | 0 (0.0%) | 9 (6.2%) |
| 1 Vehicle | 14 (9.6%) | 20 (13.8%) |
| 2 Vehicles | 49 (33.6%) | 44 (30.3%) |
| 3 Vehicles | 66 (45.2%) | 59 (40.7%) |
| 4 Vehicles | 17 (11.6%) | 13 (9.0%) |
| 5 or more Vehicles | 0 (0.0%) | 0 (0.0%) |
| Total | 146 (100.0%) | 145 (100.0%) |
Commute Time in Town of Pines
The most frequently occuring commute durations in Town of Pines are 10 to 14 minutes (92 commuters, 31.6%), 20 to 24 minutes (61 commuters, 21.0%), and 5 to 9 minutes (24 commuters, 8.3%).
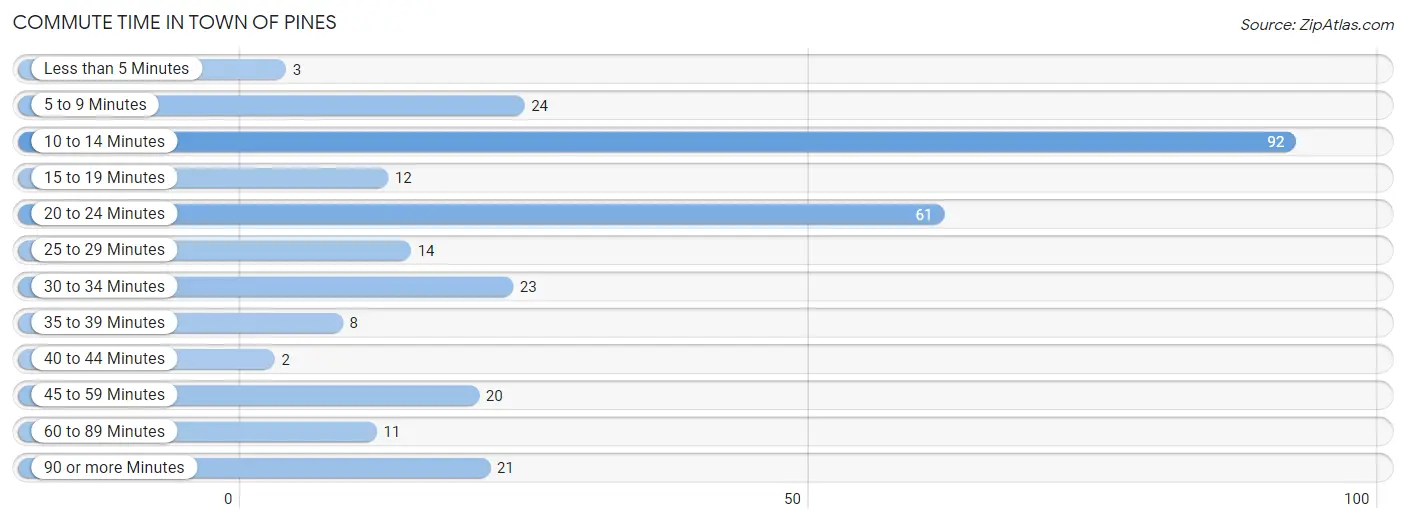
| Commute Time | # Commuters | % Commuters |
| Less than 5 Minutes | 3 | 1.0% |
| 5 to 9 Minutes | 24 | 8.3% |
| 10 to 14 Minutes | 92 | 31.6% |
| 15 to 19 Minutes | 12 | 4.1% |
| 20 to 24 Minutes | 61 | 21.0% |
| 25 to 29 Minutes | 14 | 4.8% |
| 30 to 34 Minutes | 23 | 7.9% |
| 35 to 39 Minutes | 8 | 2.8% |
| 40 to 44 Minutes | 2 | 0.7% |
| 45 to 59 Minutes | 20 | 6.9% |
| 60 to 89 Minutes | 11 | 3.8% |
| 90 or more Minutes | 21 | 7.2% |
Commute Time by Sex in Town of Pines
The most common commute times in Town of Pines are 20 to 24 minutes (30 commuters, 20.5%) for males and 10 to 14 minutes (75 commuters, 51.7%) for females.
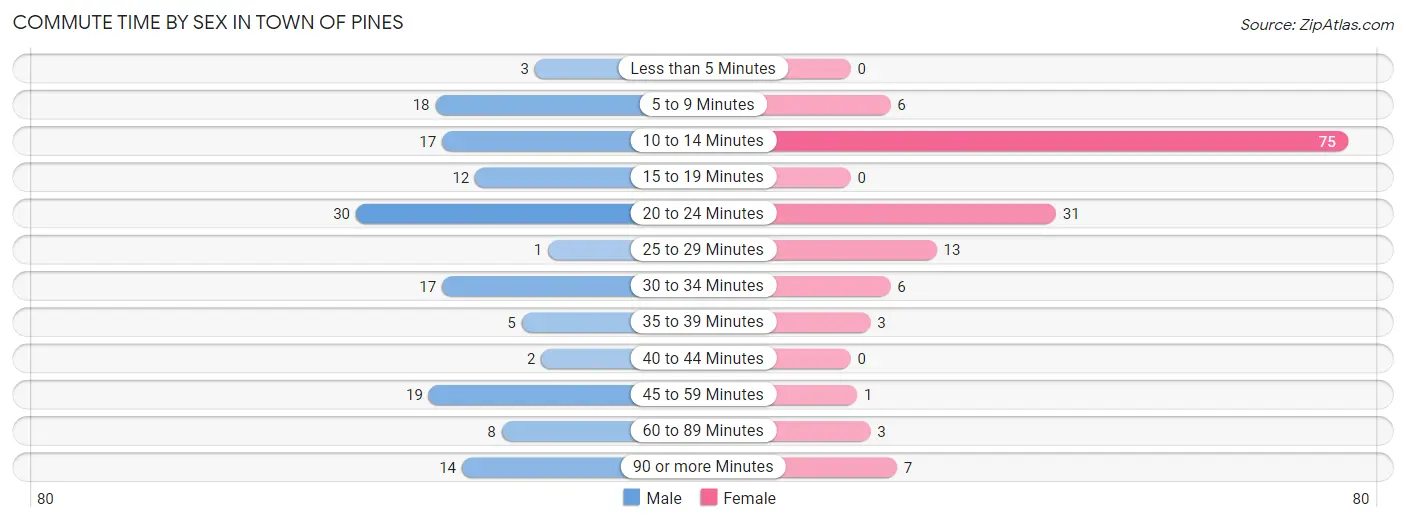
| Commute Time | Male | Female |
| Less than 5 Minutes | 3 (2.1%) | 0 (0.0%) |
| 5 to 9 Minutes | 18 (12.3%) | 6 (4.1%) |
| 10 to 14 Minutes | 17 (11.6%) | 75 (51.7%) |
| 15 to 19 Minutes | 12 (8.2%) | 0 (0.0%) |
| 20 to 24 Minutes | 30 (20.5%) | 31 (21.4%) |
| 25 to 29 Minutes | 1 (0.7%) | 13 (9.0%) |
| 30 to 34 Minutes | 17 (11.6%) | 6 (4.1%) |
| 35 to 39 Minutes | 5 (3.4%) | 3 (2.1%) |
| 40 to 44 Minutes | 2 (1.4%) | 0 (0.0%) |
| 45 to 59 Minutes | 19 (13.0%) | 1 (0.7%) |
| 60 to 89 Minutes | 8 (5.5%) | 3 (2.1%) |
| 90 or more Minutes | 14 (9.6%) | 7 (4.8%) |
Time of Departure to Work by Sex in Town of Pines
The most frequent times of departure to work in Town of Pines are 5:30 AM to 5:59 AM (36, 24.7%) for males and 7:00 AM to 7:29 AM (33, 22.8%) for females.
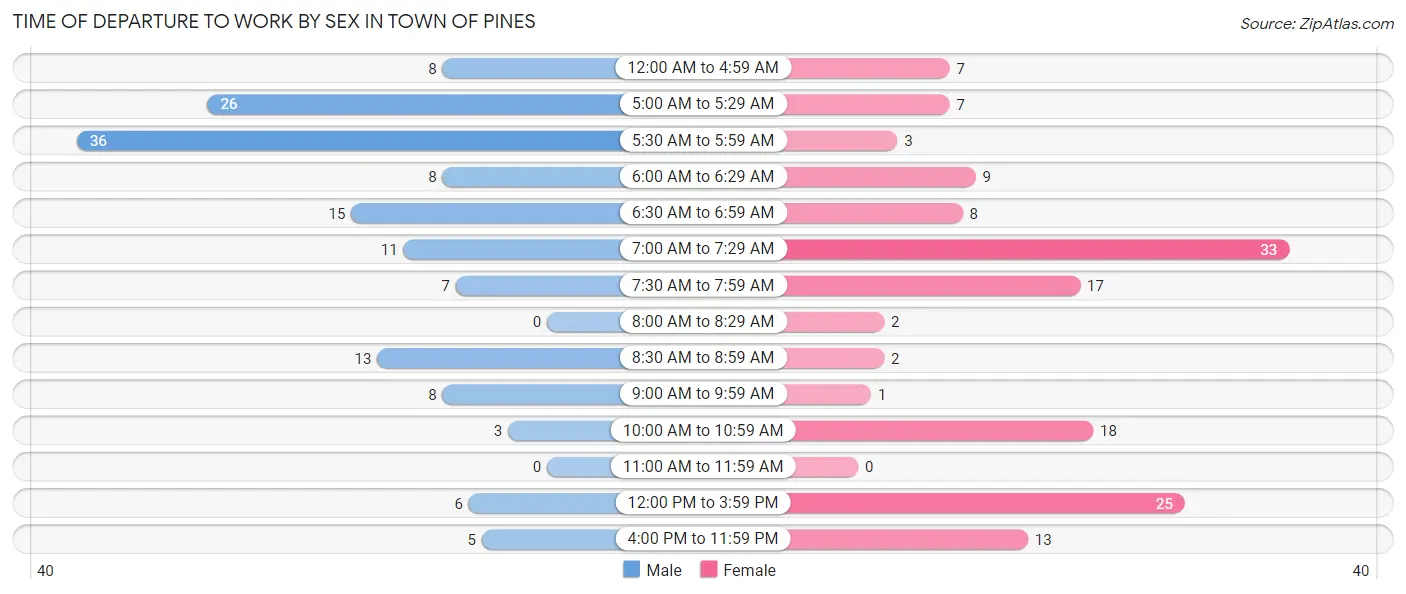
| Time of Departure | Male | Female |
| 12:00 AM to 4:59 AM | 8 (5.5%) | 7 (4.8%) |
| 5:00 AM to 5:29 AM | 26 (17.8%) | 7 (4.8%) |
| 5:30 AM to 5:59 AM | 36 (24.7%) | 3 (2.1%) |
| 6:00 AM to 6:29 AM | 8 (5.5%) | 9 (6.2%) |
| 6:30 AM to 6:59 AM | 15 (10.3%) | 8 (5.5%) |
| 7:00 AM to 7:29 AM | 11 (7.5%) | 33 (22.8%) |
| 7:30 AM to 7:59 AM | 7 (4.8%) | 17 (11.7%) |
| 8:00 AM to 8:29 AM | 0 (0.0%) | 2 (1.4%) |
| 8:30 AM to 8:59 AM | 13 (8.9%) | 2 (1.4%) |
| 9:00 AM to 9:59 AM | 8 (5.5%) | 1 (0.7%) |
| 10:00 AM to 10:59 AM | 3 (2.1%) | 18 (12.4%) |
| 11:00 AM to 11:59 AM | 0 (0.0%) | 0 (0.0%) |
| 12:00 PM to 3:59 PM | 6 (4.1%) | 25 (17.2%) |
| 4:00 PM to 11:59 PM | 5 (3.4%) | 13 (9.0%) |
| Total | 146 (100.0%) | 145 (100.0%) |
Housing Occupancy in Town of Pines
Occupancy by Ownership in Town of Pines
Of the total 304 dwellings in Town of Pines, owner-occupied units account for 253 (83.2%), while renter-occupied units make up 51 (16.8%).
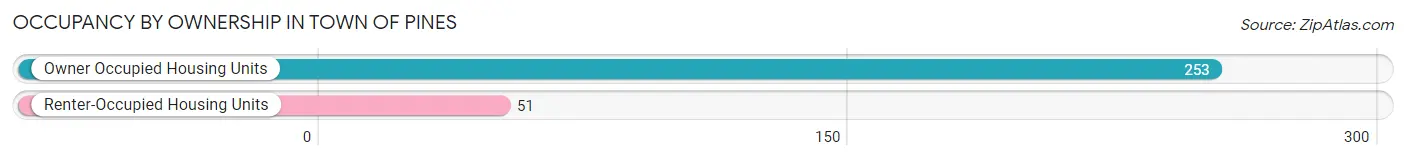
| Occupancy | # Housing Units | % Housing Units |
| Owner Occupied Housing Units | 253 | 83.2% |
| Renter-Occupied Housing Units | 51 | 16.8% |
| Total Occupied Housing Units | 304 | 100.0% |
Occupancy by Household Size in Town of Pines
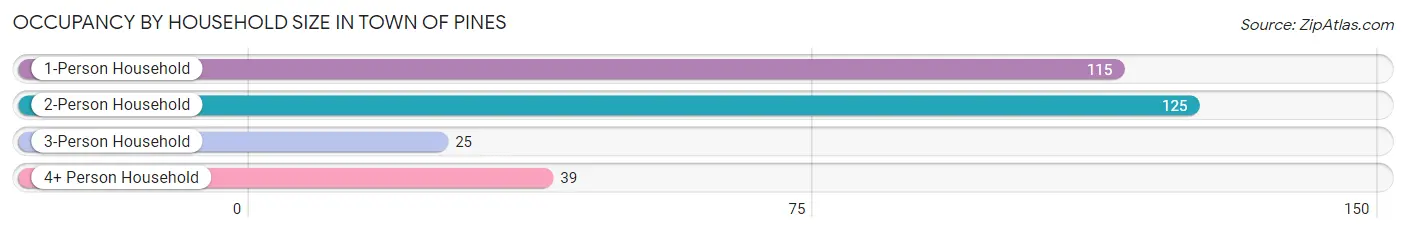
| Household Size | # Housing Units | % Housing Units |
| 1-Person Household | 115 | 37.8% |
| 2-Person Household | 125 | 41.1% |
| 3-Person Household | 25 | 8.2% |
| 4+ Person Household | 39 | 12.8% |
| Total Housing Units | 304 | 100.0% |
Occupancy by Ownership by Household Size in Town of Pines
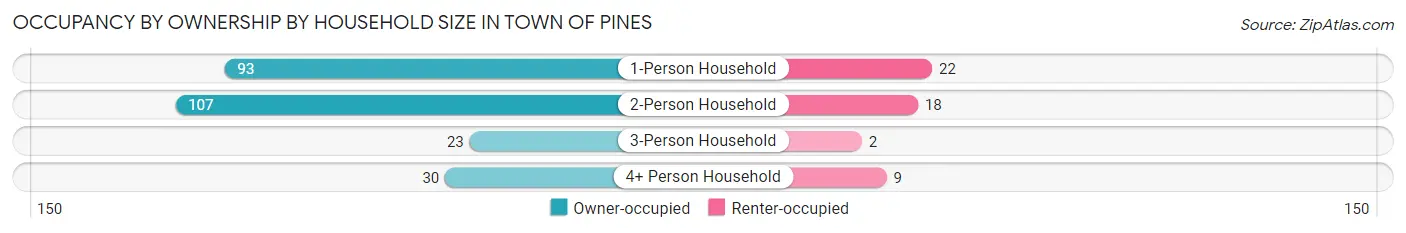
| Household Size | Owner-occupied | Renter-occupied |
| 1-Person Household | 93 (80.9%) | 22 (19.1%) |
| 2-Person Household | 107 (85.6%) | 18 (14.4%) |
| 3-Person Household | 23 (92.0%) | 2 (8.0%) |
| 4+ Person Household | 30 (76.9%) | 9 (23.1%) |
| Total Housing Units | 253 (83.2%) | 51 (16.8%) |
Occupancy by Educational Attainment in Town of Pines
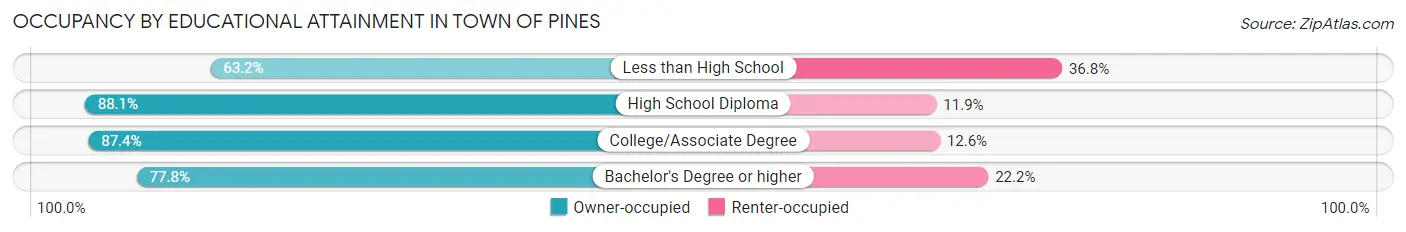
| Household Size | Owner-occupied | Renter-occupied |
| Less than High School | 24 (63.2%) | 14 (36.8%) |
| High School Diploma | 118 (88.1%) | 16 (11.9%) |
| College/Associate Degree | 76 (87.4%) | 11 (12.6%) |
| Bachelor's Degree or higher | 35 (77.8%) | 10 (22.2%) |
Occupancy by Age of Householder in Town of Pines
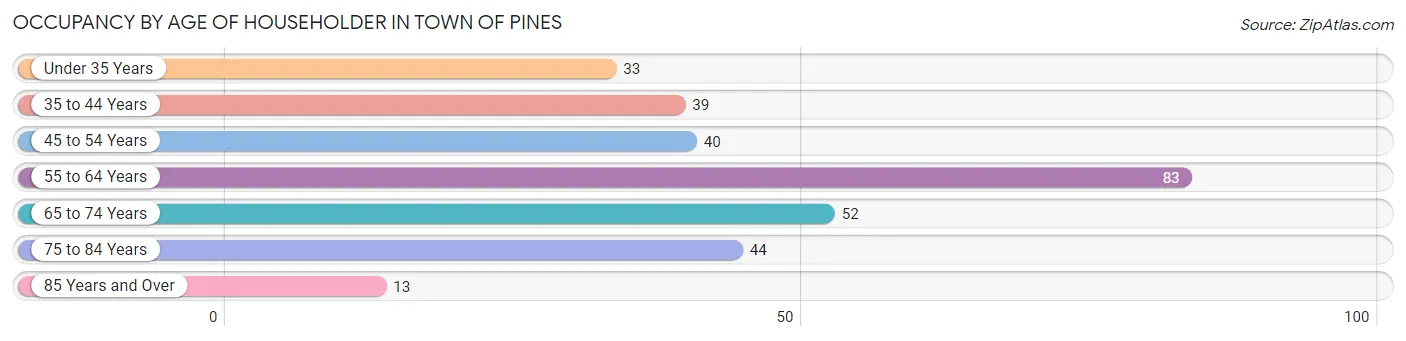
| Age Bracket | # Households | % Households |
| Under 35 Years | 33 | 10.9% |
| 35 to 44 Years | 39 | 12.8% |
| 45 to 54 Years | 40 | 13.2% |
| 55 to 64 Years | 83 | 27.3% |
| 65 to 74 Years | 52 | 17.1% |
| 75 to 84 Years | 44 | 14.5% |
| 85 Years and Over | 13 | 4.3% |
| Total | 304 | 100.0% |
Housing Finances in Town of Pines
Median Income by Occupancy in Town of Pines
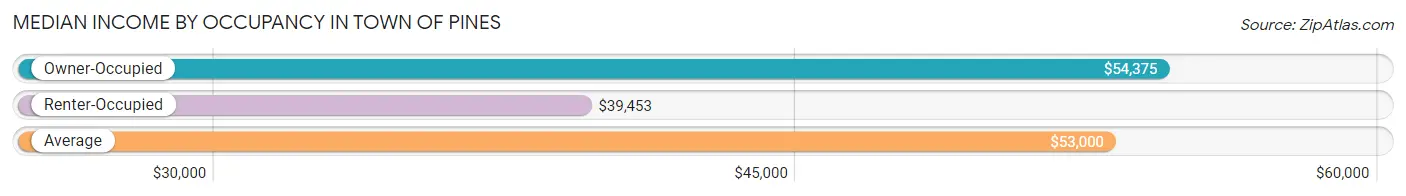
| Occupancy Type | # Households | Median Income |
| Owner-Occupied | 253 (83.2%) | $54,375 |
| Renter-Occupied | 51 (16.8%) | $39,453 |
| Average | 304 (100.0%) | $53,000 |
Occupancy by Householder Income Bracket in Town of Pines
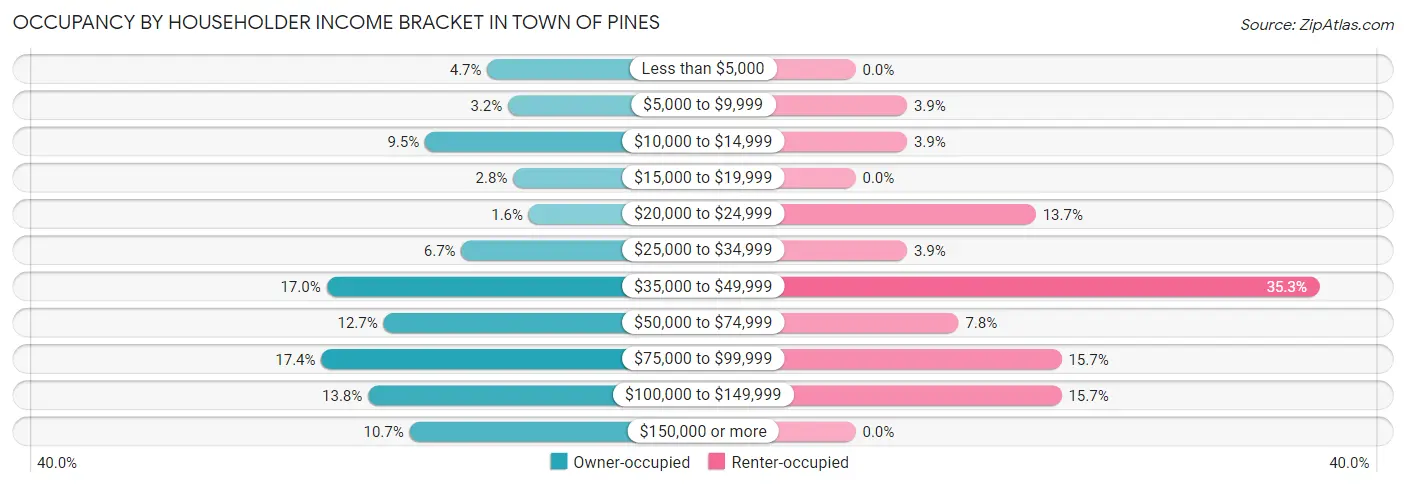
| Income Bracket | Owner-occupied | Renter-occupied |
| Less than $5,000 | 12 (4.7%) | 0 (0.0%) |
| $5,000 to $9,999 | 8 (3.2%) | 2 (3.9%) |
| $10,000 to $14,999 | 24 (9.5%) | 2 (3.9%) |
| $15,000 to $19,999 | 7 (2.8%) | 0 (0.0%) |
| $20,000 to $24,999 | 4 (1.6%) | 7 (13.7%) |
| $25,000 to $34,999 | 17 (6.7%) | 2 (3.9%) |
| $35,000 to $49,999 | 43 (17.0%) | 18 (35.3%) |
| $50,000 to $74,999 | 32 (12.7%) | 4 (7.8%) |
| $75,000 to $99,999 | 44 (17.4%) | 8 (15.7%) |
| $100,000 to $149,999 | 35 (13.8%) | 8 (15.7%) |
| $150,000 or more | 27 (10.7%) | 0 (0.0%) |
| Total | 253 (100.0%) | 51 (100.0%) |
Monthly Housing Cost Tiers in Town of Pines
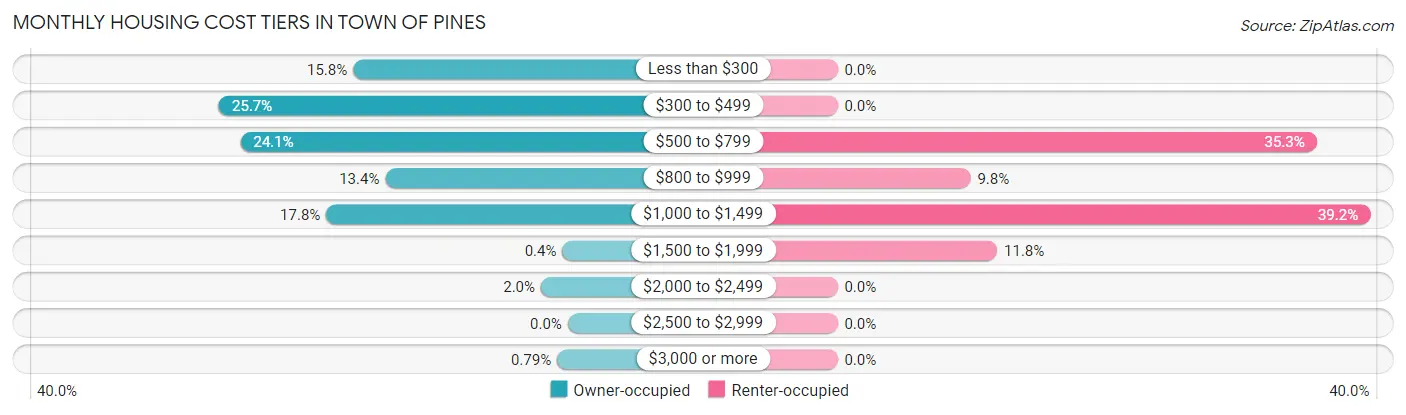
| Monthly Cost | Owner-occupied | Renter-occupied |
| Less than $300 | 40 (15.8%) | 0 (0.0%) |
| $300 to $499 | 65 (25.7%) | 0 (0.0%) |
| $500 to $799 | 61 (24.1%) | 18 (35.3%) |
| $800 to $999 | 34 (13.4%) | 5 (9.8%) |
| $1,000 to $1,499 | 45 (17.8%) | 20 (39.2%) |
| $1,500 to $1,999 | 1 (0.4%) | 6 (11.8%) |
| $2,000 to $2,499 | 5 (2.0%) | 0 (0.0%) |
| $2,500 to $2,999 | 0 (0.0%) | 0 (0.0%) |
| $3,000 or more | 2 (0.8%) | 0 (0.0%) |
| Total | 253 (100.0%) | 51 (100.0%) |
Physical Housing Characteristics in Town of Pines
Housing Structures in Town of Pines
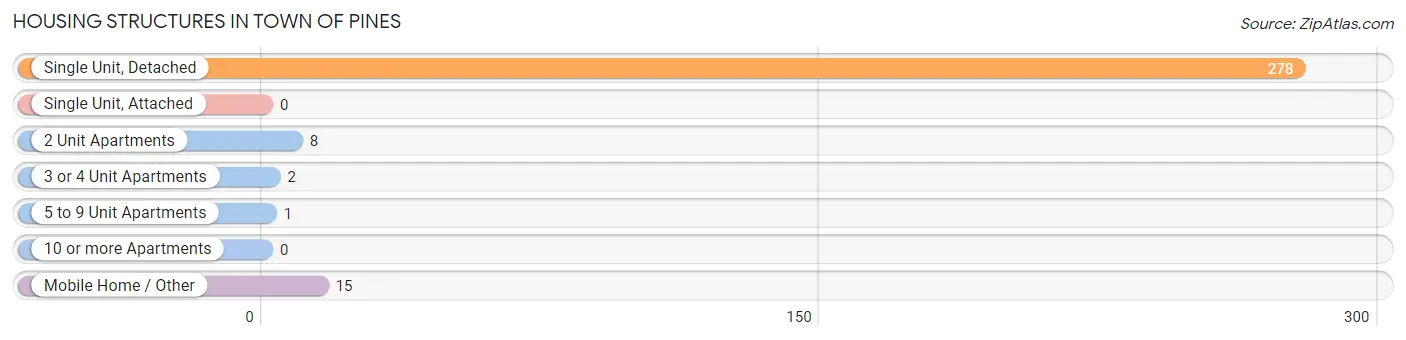
| Structure Type | # Housing Units | % Housing Units |
| Single Unit, Detached | 278 | 91.4% |
| Single Unit, Attached | 0 | 0.0% |
| 2 Unit Apartments | 8 | 2.6% |
| 3 or 4 Unit Apartments | 2 | 0.7% |
| 5 to 9 Unit Apartments | 1 | 0.3% |
| 10 or more Apartments | 0 | 0.0% |
| Mobile Home / Other | 15 | 4.9% |
| Total | 304 | 100.0% |
Housing Structures by Occupancy in Town of Pines
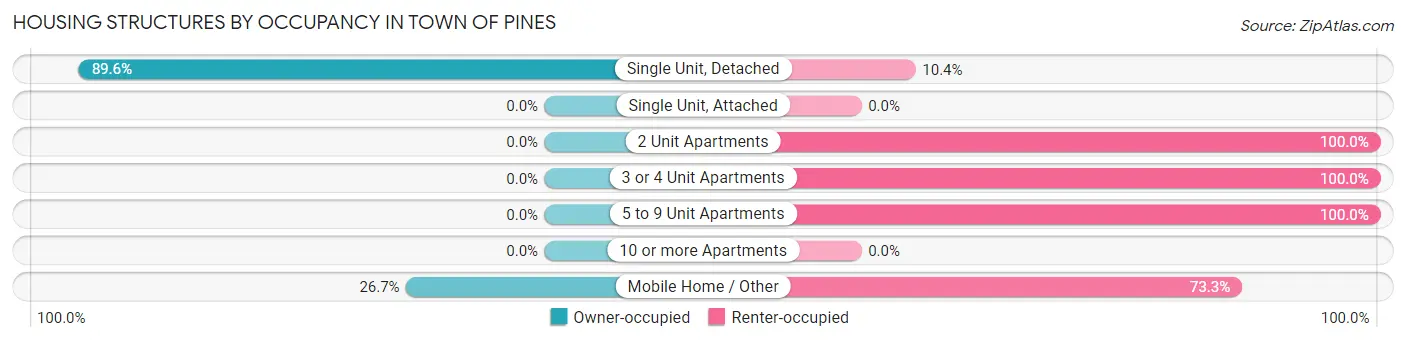
| Structure Type | Owner-occupied | Renter-occupied |
| Single Unit, Detached | 249 (89.6%) | 29 (10.4%) |
| Single Unit, Attached | 0 (0.0%) | 0 (0.0%) |
| 2 Unit Apartments | 0 (0.0%) | 8 (100.0%) |
| 3 or 4 Unit Apartments | 0 (0.0%) | 2 (100.0%) |
| 5 to 9 Unit Apartments | 0 (0.0%) | 1 (100.0%) |
| 10 or more Apartments | 0 (0.0%) | 0 (0.0%) |
| Mobile Home / Other | 4 (26.7%) | 11 (73.3%) |
| Total | 253 (83.2%) | 51 (16.8%) |
Housing Structures by Number of Rooms in Town of Pines
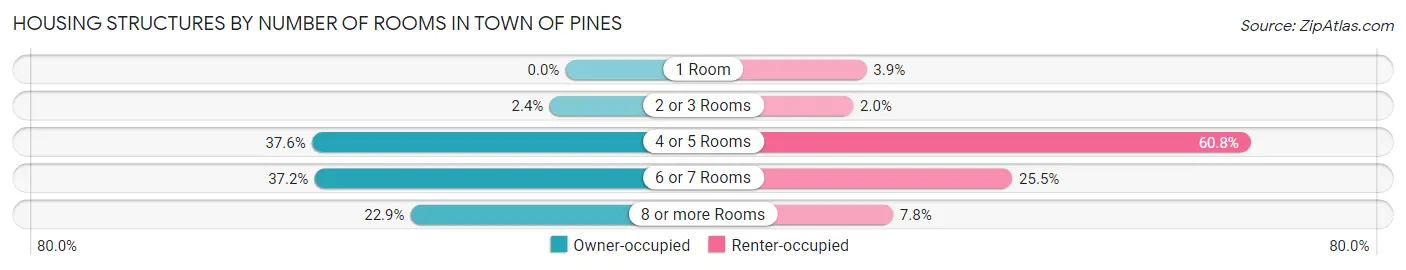
| Number of Rooms | Owner-occupied | Renter-occupied |
| 1 Room | 0 (0.0%) | 2 (3.9%) |
| 2 or 3 Rooms | 6 (2.4%) | 1 (2.0%) |
| 4 or 5 Rooms | 95 (37.6%) | 31 (60.8%) |
| 6 or 7 Rooms | 94 (37.1%) | 13 (25.5%) |
| 8 or more Rooms | 58 (22.9%) | 4 (7.8%) |
| Total | 253 (100.0%) | 51 (100.0%) |
Housing Structure by Heating Type in Town of Pines
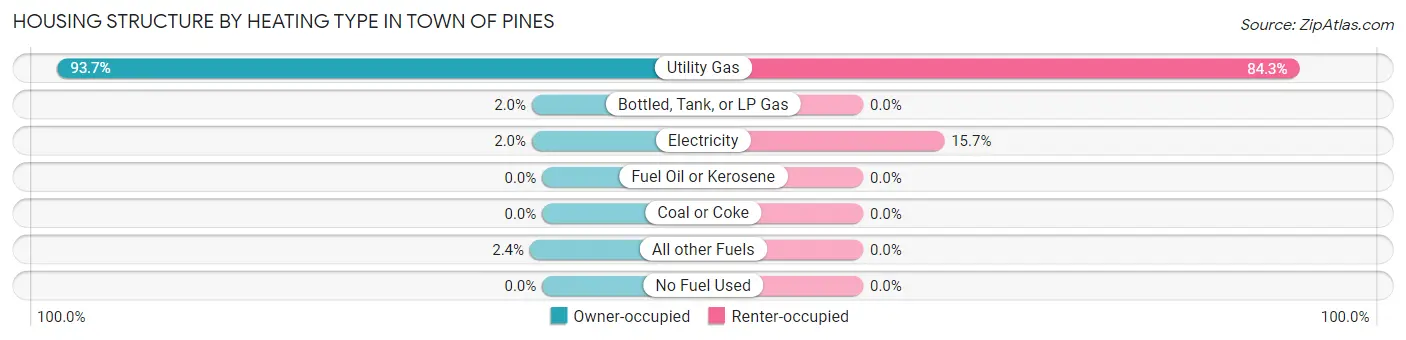
| Heating Type | Owner-occupied | Renter-occupied |
| Utility Gas | 237 (93.7%) | 43 (84.3%) |
| Bottled, Tank, or LP Gas | 5 (2.0%) | 0 (0.0%) |
| Electricity | 5 (2.0%) | 8 (15.7%) |
| Fuel Oil or Kerosene | 0 (0.0%) | 0 (0.0%) |
| Coal or Coke | 0 (0.0%) | 0 (0.0%) |
| All other Fuels | 6 (2.4%) | 0 (0.0%) |
| No Fuel Used | 0 (0.0%) | 0 (0.0%) |
| Total | 253 (100.0%) | 51 (100.0%) |
Household Vehicle Usage in Town of Pines
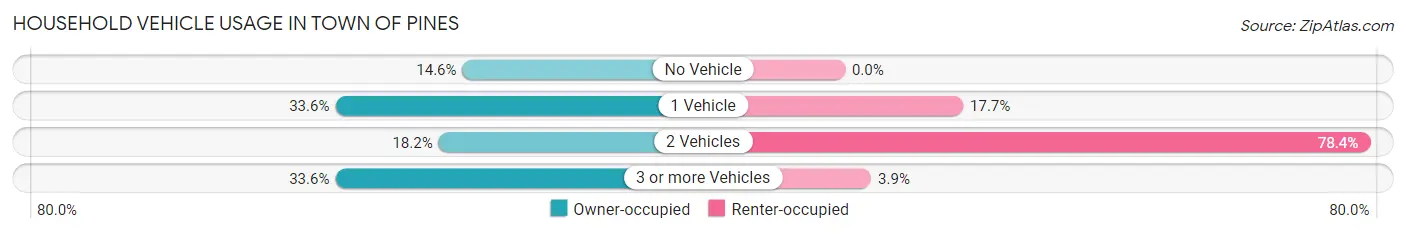
| Vehicles per Household | Owner-occupied | Renter-occupied |
| No Vehicle | 37 (14.6%) | 0 (0.0%) |
| 1 Vehicle | 85 (33.6%) | 9 (17.6%) |
| 2 Vehicles | 46 (18.2%) | 40 (78.4%) |
| 3 or more Vehicles | 85 (33.6%) | 2 (3.9%) |
| Total | 253 (100.0%) | 51 (100.0%) |
Real Estate & Mortgages in Town of Pines
Real Estate and Mortgage Overview in Town of Pines
| Characteristic | Without Mortgage | With Mortgage |
| Housing Units | 127 | 126 |
| Median Property Value | $128,400 | $140,900 |
| Median Household Income | $47,917 | $11 |
| Monthly Housing Costs | $373 | $2 |
| Real Estate Taxes | $988 | $0 |
Property Value by Mortgage Status in Town of Pines
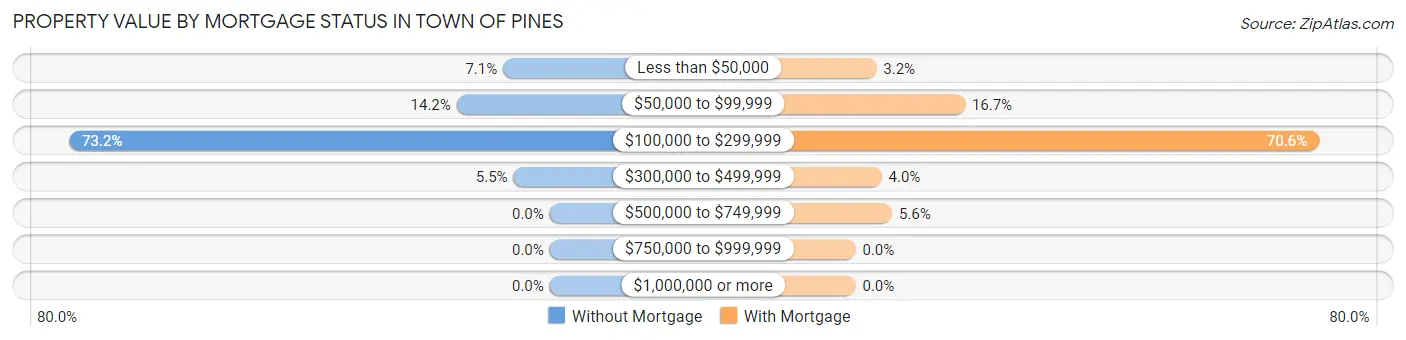
| Property Value | Without Mortgage | With Mortgage |
| Less than $50,000 | 9 (7.1%) | 4 (3.2%) |
| $50,000 to $99,999 | 18 (14.2%) | 21 (16.7%) |
| $100,000 to $299,999 | 93 (73.2%) | 89 (70.6%) |
| $300,000 to $499,999 | 7 (5.5%) | 5 (4.0%) |
| $500,000 to $749,999 | 0 (0.0%) | 7 (5.6%) |
| $750,000 to $999,999 | 0 (0.0%) | 0 (0.0%) |
| $1,000,000 or more | 0 (0.0%) | 0 (0.0%) |
| Total | 127 (100.0%) | 126 (100.0%) |
Household Income by Mortgage Status in Town of Pines
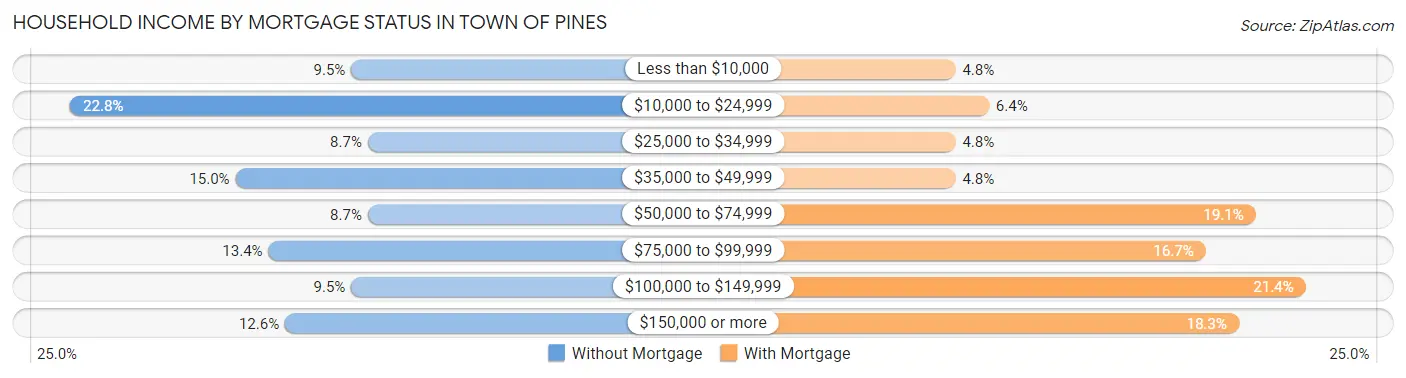
| Household Income | Without Mortgage | With Mortgage |
| Less than $10,000 | 12 (9.5%) | 6 (4.8%) |
| $10,000 to $24,999 | 29 (22.8%) | 8 (6.4%) |
| $25,000 to $34,999 | 11 (8.7%) | 6 (4.8%) |
| $35,000 to $49,999 | 19 (15.0%) | 6 (4.8%) |
| $50,000 to $74,999 | 11 (8.7%) | 24 (19.1%) |
| $75,000 to $99,999 | 17 (13.4%) | 21 (16.7%) |
| $100,000 to $149,999 | 12 (9.5%) | 27 (21.4%) |
| $150,000 or more | 16 (12.6%) | 23 (18.2%) |
| Total | 127 (100.0%) | 126 (100.0%) |
Property Value to Household Income Ratio in Town of Pines
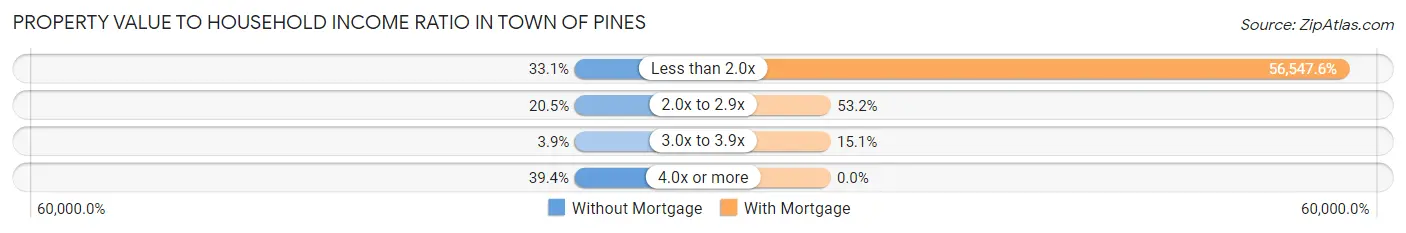
| Value-to-Income Ratio | Without Mortgage | With Mortgage |
| Less than 2.0x | 42 (33.1%) | 71,250 (56,547.6%) |
| 2.0x to 2.9x | 26 (20.5%) | 67 (53.2%) |
| 3.0x to 3.9x | 5 (3.9%) | 19 (15.1%) |
| 4.0x or more | 50 (39.4%) | 0 (0.0%) |
| Total | 127 (100.0%) | 126 (100.0%) |
Real Estate Taxes by Mortgage Status in Town of Pines
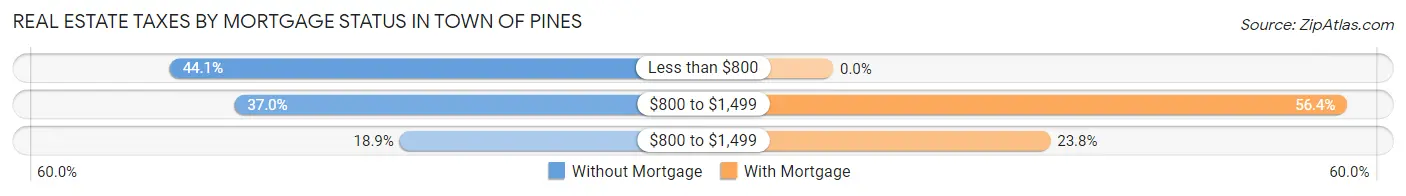
| Property Taxes | Without Mortgage | With Mortgage |
| Less than $800 | 56 (44.1%) | 0 (0.0%) |
| $800 to $1,499 | 47 (37.0%) | 71 (56.4%) |
| $800 to $1,499 | 24 (18.9%) | 30 (23.8%) |
| Total | 127 (100.0%) | 126 (100.0%) |
Health & Disability in Town of Pines
Health Insurance Coverage by Age in Town of Pines
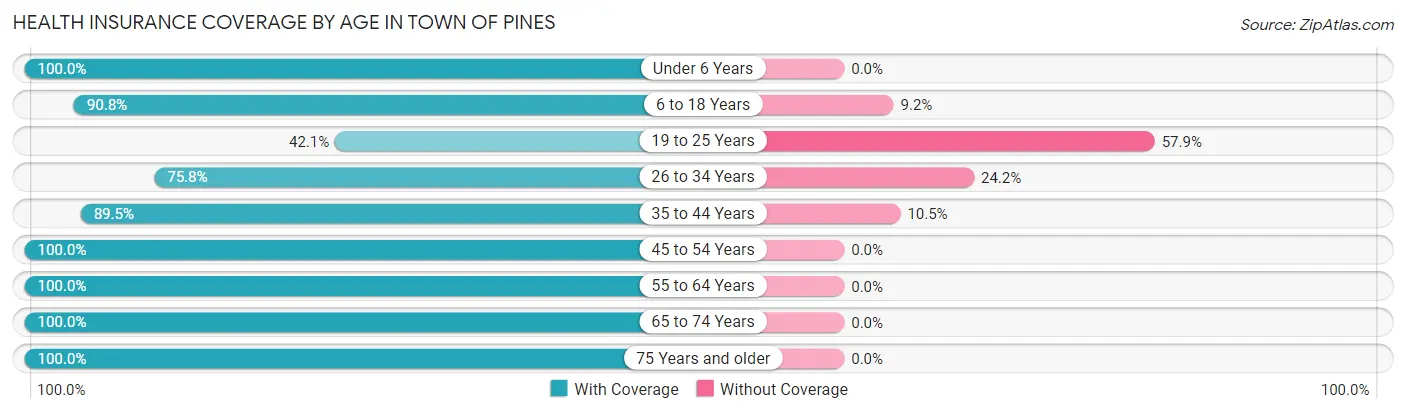
| Age Bracket | With Coverage | Without Coverage |
| Under 6 Years | 12 (100.0%) | 0 (0.0%) |
| 6 to 18 Years | 79 (90.8%) | 8 (9.2%) |
| 19 to 25 Years | 16 (42.1%) | 22 (57.9%) |
| 26 to 34 Years | 47 (75.8%) | 15 (24.2%) |
| 35 to 44 Years | 77 (89.5%) | 9 (10.5%) |
| 45 to 54 Years | 77 (100.0%) | 0 (0.0%) |
| 55 to 64 Years | 127 (100.0%) | 0 (0.0%) |
| 65 to 74 Years | 78 (100.0%) | 0 (0.0%) |
| 75 Years and older | 84 (100.0%) | 0 (0.0%) |
| Total | 597 (91.7%) | 54 (8.3%) |
Health Insurance Coverage by Citizenship Status in Town of Pines

| Citizenship Status | With Coverage | Without Coverage |
| Native Born | 12 (100.0%) | 0 (0.0%) |
| Foreign Born, Citizen | 79 (90.8%) | 8 (9.2%) |
| Foreign Born, not a Citizen | 16 (42.1%) | 22 (57.9%) |
Health Insurance Coverage by Household Income in Town of Pines
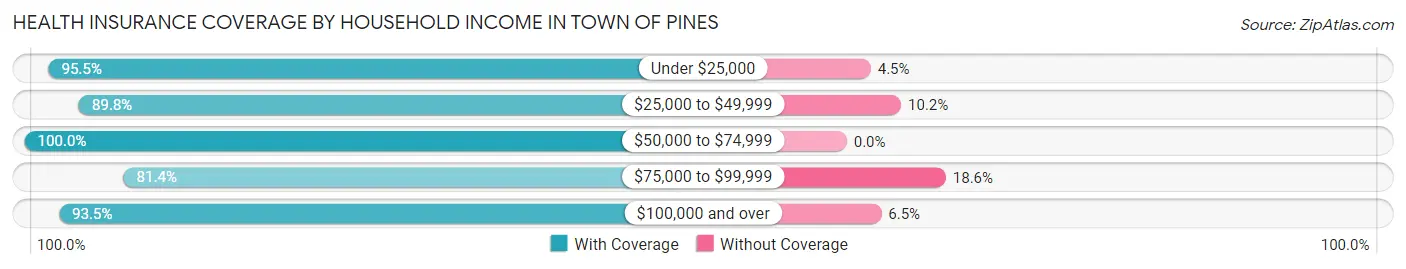
| Household Income | With Coverage | Without Coverage |
| Under $25,000 | 85 (95.5%) | 4 (4.5%) |
| $25,000 to $49,999 | 150 (89.8%) | 17 (10.2%) |
| $50,000 to $74,999 | 66 (100.0%) | 0 (0.0%) |
| $75,000 to $99,999 | 79 (81.4%) | 18 (18.6%) |
| $100,000 and over | 217 (93.5%) | 15 (6.5%) |
Public vs Private Health Insurance Coverage by Age in Town of Pines
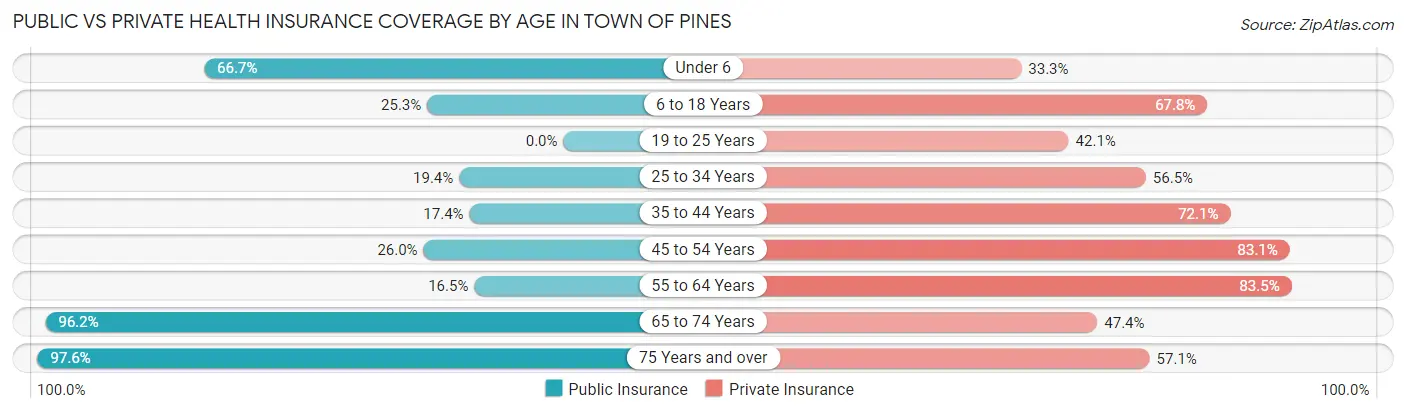
| Age Bracket | Public Insurance | Private Insurance |
| Under 6 | 8 (66.7%) | 4 (33.3%) |
| 6 to 18 Years | 22 (25.3%) | 59 (67.8%) |
| 19 to 25 Years | 0 (0.0%) | 16 (42.1%) |
| 25 to 34 Years | 12 (19.4%) | 35 (56.5%) |
| 35 to 44 Years | 15 (17.4%) | 62 (72.1%) |
| 45 to 54 Years | 20 (26.0%) | 64 (83.1%) |
| 55 to 64 Years | 21 (16.5%) | 106 (83.5%) |
| 65 to 74 Years | 75 (96.2%) | 37 (47.4%) |
| 75 Years and over | 82 (97.6%) | 48 (57.1%) |
| Total | 255 (39.2%) | 431 (66.2%) |
Disability Status by Sex by Age in Town of Pines
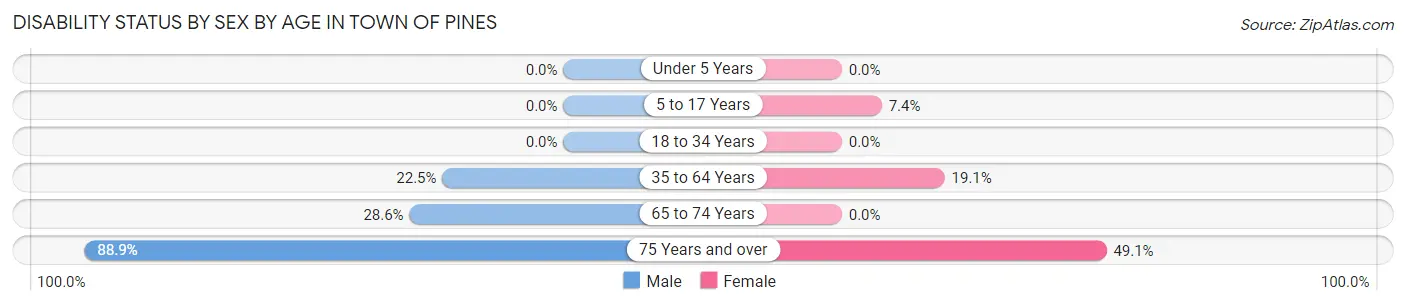
| Age Bracket | Male | Female |
| Under 5 Years | 0 (0.0%) | 0 (0.0%) |
| 5 to 17 Years | 0 (0.0%) | 4 (7.4%) |
| 18 to 34 Years | 0 (0.0%) | 0 (0.0%) |
| 35 to 64 Years | 31 (22.5%) | 29 (19.1%) |
| 65 to 74 Years | 14 (28.6%) | 0 (0.0%) |
| 75 Years and over | 24 (88.9%) | 28 (49.1%) |
Disability Class by Sex by Age in Town of Pines
Disability Class: Hearing Difficulty

| Age Bracket | Male | Female |
| Under 5 Years | 0 (0.0%) | 0 (0.0%) |
| 5 to 17 Years | 0 (0.0%) | 0 (0.0%) |
| 18 to 34 Years | 0 (0.0%) | 0 (0.0%) |
| 35 to 64 Years | 5 (3.6%) | 14 (9.2%) |
| 65 to 74 Years | 6 (12.2%) | 0 (0.0%) |
| 75 Years and over | 16 (59.3%) | 10 (17.5%) |
Disability Class: Vision Difficulty
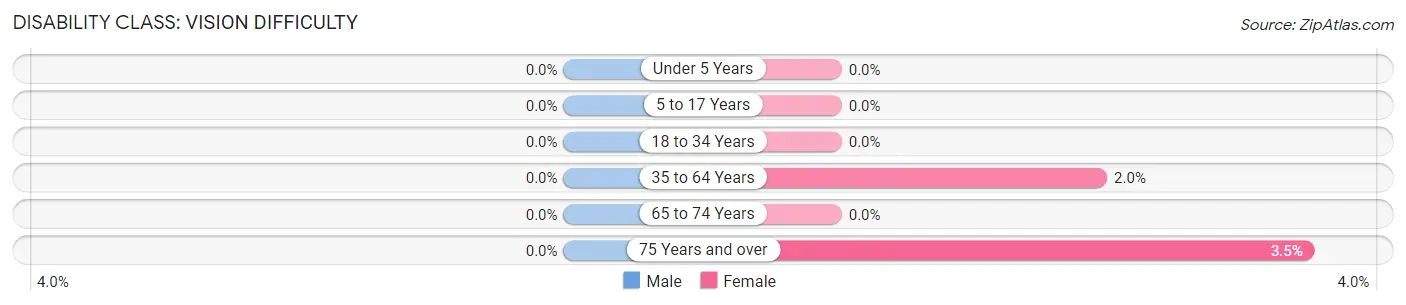
| Age Bracket | Male | Female |
| Under 5 Years | 0 (0.0%) | 0 (0.0%) |
| 5 to 17 Years | 0 (0.0%) | 0 (0.0%) |
| 18 to 34 Years | 0 (0.0%) | 0 (0.0%) |
| 35 to 64 Years | 0 (0.0%) | 3 (2.0%) |
| 65 to 74 Years | 0 (0.0%) | 0 (0.0%) |
| 75 Years and over | 0 (0.0%) | 2 (3.5%) |
Disability Class: Cognitive Difficulty
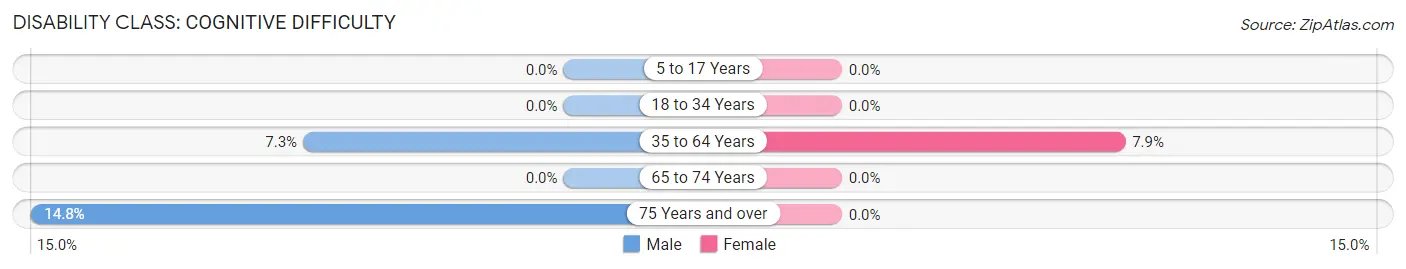
| Age Bracket | Male | Female |
| 5 to 17 Years | 0 (0.0%) | 0 (0.0%) |
| 18 to 34 Years | 0 (0.0%) | 0 (0.0%) |
| 35 to 64 Years | 10 (7.2%) | 12 (7.9%) |
| 65 to 74 Years | 0 (0.0%) | 0 (0.0%) |
| 75 Years and over | 4 (14.8%) | 0 (0.0%) |
Disability Class: Ambulatory Difficulty
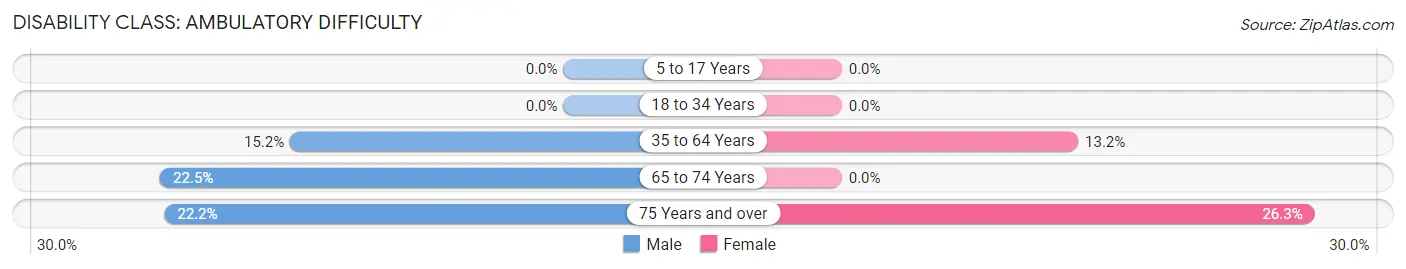
| Age Bracket | Male | Female |
| 5 to 17 Years | 0 (0.0%) | 0 (0.0%) |
| 18 to 34 Years | 0 (0.0%) | 0 (0.0%) |
| 35 to 64 Years | 21 (15.2%) | 20 (13.2%) |
| 65 to 74 Years | 11 (22.5%) | 0 (0.0%) |
| 75 Years and over | 6 (22.2%) | 15 (26.3%) |
Disability Class: Self-Care Difficulty
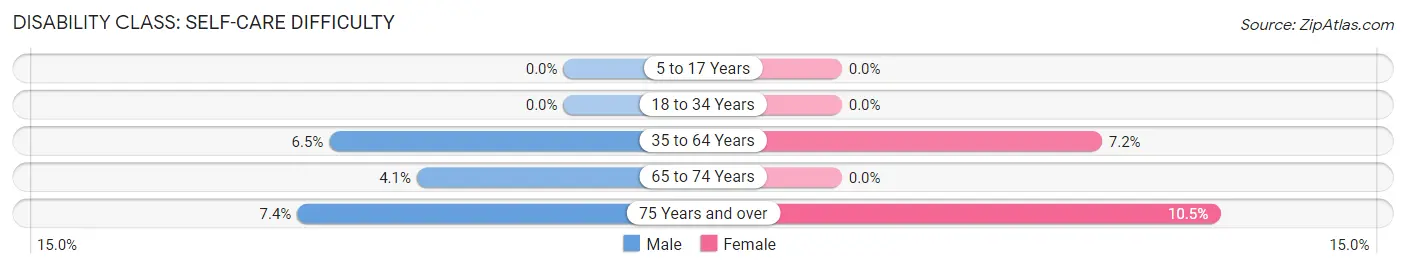
| Age Bracket | Male | Female |
| 5 to 17 Years | 0 (0.0%) | 0 (0.0%) |
| 18 to 34 Years | 0 (0.0%) | 0 (0.0%) |
| 35 to 64 Years | 9 (6.5%) | 11 (7.2%) |
| 65 to 74 Years | 2 (4.1%) | 0 (0.0%) |
| 75 Years and over | 2 (7.4%) | 6 (10.5%) |
Technology Access in Town of Pines
Computing Device Access in Town of Pines
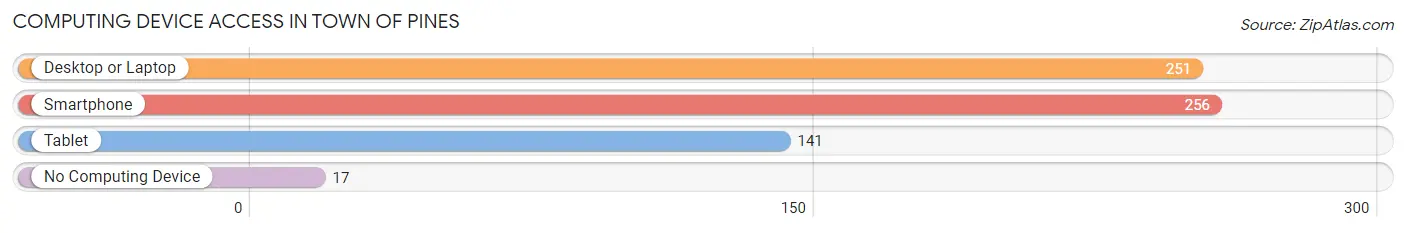
| Device Type | # Households | % Households |
| Desktop or Laptop | 251 | 82.6% |
| Smartphone | 256 | 84.2% |
| Tablet | 141 | 46.4% |
| No Computing Device | 17 | 5.6% |
| Total | 304 | 100.0% |
Internet Access in Town of Pines
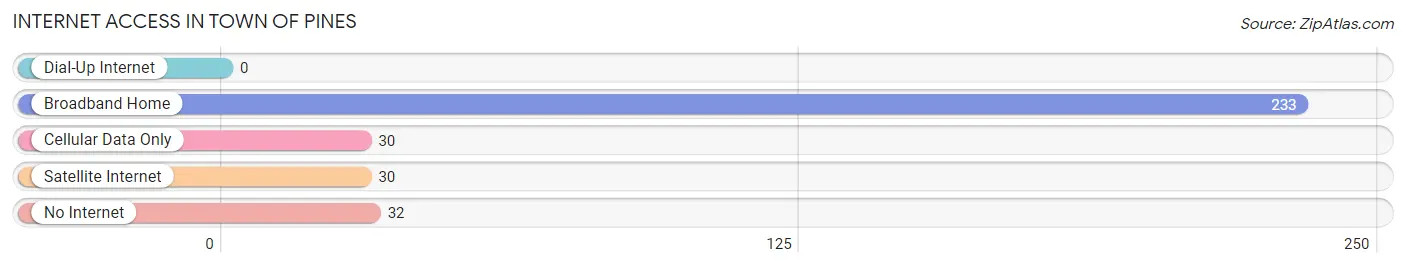
| Internet Type | # Households | % Households |
| Dial-Up Internet | 0 | 0.0% |
| Broadband Home | 233 | 76.6% |
| Cellular Data Only | 30 | 9.9% |
| Satellite Internet | 30 | 9.9% |
| No Internet | 32 | 10.5% |
| Total | 304 | 100.0% |
Town of Pines Summary
Town of Pines, Indiana is a small town located in the northwest corner of the state. It is situated in the heart of the Hoosier National Forest, and is surrounded by rolling hills and lush forests. The town is home to a population of just over 1,000 people, and is known for its rural charm and peaceful atmosphere.
History
The Town of Pines was founded in 1837 by a group of settlers from Ohio. The settlers were looking for a place to settle and start a new life, and the area around the Town of Pines seemed to fit the bill. The town was named after the abundance of pine trees in the area, and the settlers quickly began to build homes and businesses.
The town grew slowly but steadily over the years, and by the turn of the 20th century, it had become a thriving community. The town was home to a variety of businesses, including a sawmill, a grist mill, a general store, and a blacksmith shop. The town also had a school, a post office, and a church.
The Town of Pines was also home to a number of notable people, including the famous Hoosier poet James Whitcomb Riley, who was born in the town in 1849. The town was also home to the first African-American doctor in the state of Indiana, Dr. William H. Stewart.
Geography
The Town of Pines is located in the northwest corner of Indiana, in the heart of the Hoosier National Forest. The town is situated on the banks of the White River, and is surrounded by rolling hills and lush forests. The town is located about 30 miles from the state capital of Indianapolis, and is about an hour and a half drive from Chicago.
The town is located in a temperate climate, with hot summers and cold winters. The average temperature in the summer is around 75 degrees Fahrenheit, and the average temperature in the winter is around 25 degrees Fahrenheit. The town receives an average of 40 inches of rain per year, and an average of 30 inches of snow per year.
Economy
The Town of Pines is a small, rural community, and the economy is largely based on agriculture and forestry. The town is home to a number of farms, and the surrounding area is home to a variety of timber companies. The town is also home to a number of small businesses, including a general store, a hardware store, and a few restaurants.
The town is also home to a number of tourist attractions, including the Hoosier National Forest, the White River, and the nearby town of French Lick. The town is also home to a number of festivals and events throughout the year, including the annual Pines Festival, which is held in the summer.
Demographics
As of the 2010 census, the Town of Pines had a population of 1,072 people. The population is largely white, with a small percentage of African-Americans and Hispanics. The median age of the population is 44 years old, and the median household income is $41,000. The town has a low unemployment rate, and the majority of the population is employed in the agricultural and forestry industries.
Conclusion
The Town of Pines is a small, rural community located in the northwest corner of Indiana. The town is surrounded by rolling hills and lush forests, and is home to a population of just over 1,000 people. The town is known for its rural charm and peaceful atmosphere, and is home to a variety of businesses and tourist attractions. The town is largely supported by the agricultural and forestry industries, and has a low unemployment rate.
Common Questions
What is the Total Population of Town of Pines?
Total Population of Town of Pines is 651.
What is the Total Male Population of Town of Pines?
Total Male Population of Town of Pines is 298.
What is the Total Female Population of Town of Pines?
Total Female Population of Town of Pines is 353.
What is the Ratio of Males per 100 Females in Town of Pines?
There are 84.42 Males per 100 Females in Town of Pines.
What is the Ratio of Females per 100 Males in Town of Pines?
There are 118.46 Females per 100 Males in Town of Pines.
What is the Median Population Age in Town of Pines?
Median Population Age in Town of Pines is 50.9 Years.
What is the Average Family Size in Town of Pines
Average Family Size in Town of Pines is 2.9 People.
What is the Average Household Size in Town of Pines
Average Household Size in Town of Pines is 2.1 People.
What is Per Capita Income in Town of Pines?
Per Capita income in Town of Pines is $33,808.
What is the Median Family Income in Town of Pines?
Median Family Income in Town of Pines is $71,250.
What is the Median Household income in Town of Pines?
Median Household Income in Town of Pines is $53,000.
What is Income or Wage Gap in Town of Pines?
Income or Wage Gap in Town of Pines is 7.0%.
Women in Town of Pines earn 93.0 cents for every dollar earned by a man.
What is Inequality or Gini Index in Town of Pines?
Inequality or Gini Index in Town of Pines is 0.42.
How Large is the Labor Force in Town of Pines?
There are 310 People in the Labor Forcein in Town of Pines.
What is the Percentage of People in the Labor Force in Town of Pines?
54.4% of People are in the Labor Force in Town of Pines.
What is the Unemployment Rate in Town of Pines?
Unemployment Rate in Town of Pines is 3.5%.