Newberry, SC
Newberry Map
Newberry Overview
10,682
TOTAL POPULATION
4,945
MALE POPULATION
5,737
FEMALE POPULATION
86.19
MALES / 100 FEMALES
116.02
FEMALES / 100 MALES
31.8
MEDIAN AGE
3.0
AVG FAMILY SIZE
2.4
AVG HOUSEHOLD SIZE
$21,791
PER CAPITA INCOME
$55,072
AVG FAMILY INCOME
$47,565
AVG HOUSEHOLD INCOME
5.2%
WAGE / INCOME GAP [ % ]
94.8¢/ $1
WAGE / INCOME GAP [ $ ]
0.40
INEQUALITY / GINI INDEX
4,572
LABOR FORCE [ PEOPLE ]
54.4%
PERCENT IN LABOR FORCE
7.6%
UNEMPLOYMENT RATE
Newberry Zip Codes
Newberry Area Codes
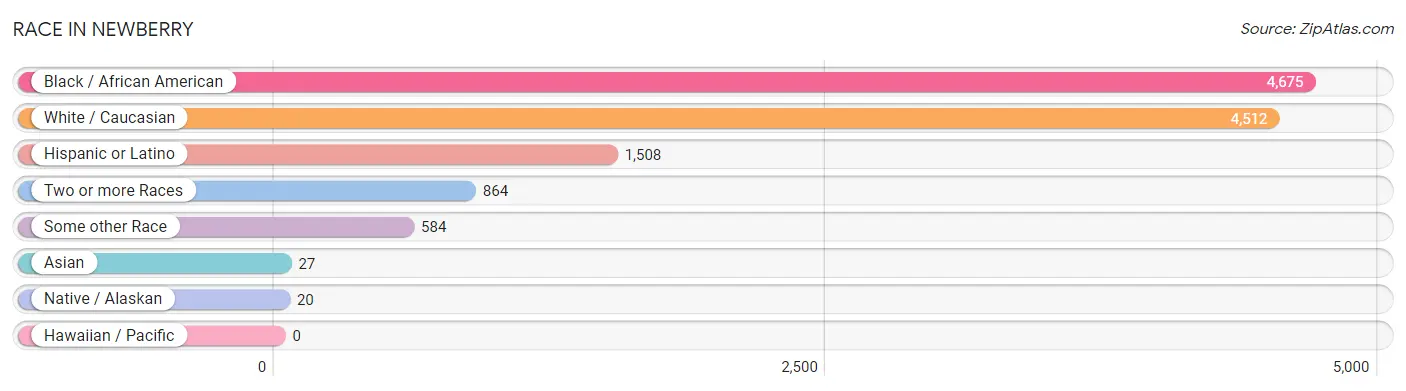
Race in Newberry
The most populous races in Newberry are Black / African American (4,675 | 43.8%), White / Caucasian (4,512 | 42.2%), and Hispanic or Latino (1,508 | 14.1%).
| Race | # Population | % Population |
| Asian | 27 | 0.3% |
| Black / African American | 4,675 | 43.8% |
| Hawaiian / Pacific | 0 | 0.0% |
| Hispanic or Latino | 1,508 | 14.1% |
| Native / Alaskan | 20 | 0.2% |
| White / Caucasian | 4,512 | 42.2% |
| Two or more Races | 864 | 8.1% |
| Some other Race | 584 | 5.5% |
| Total | 10,682 | 100.0% |
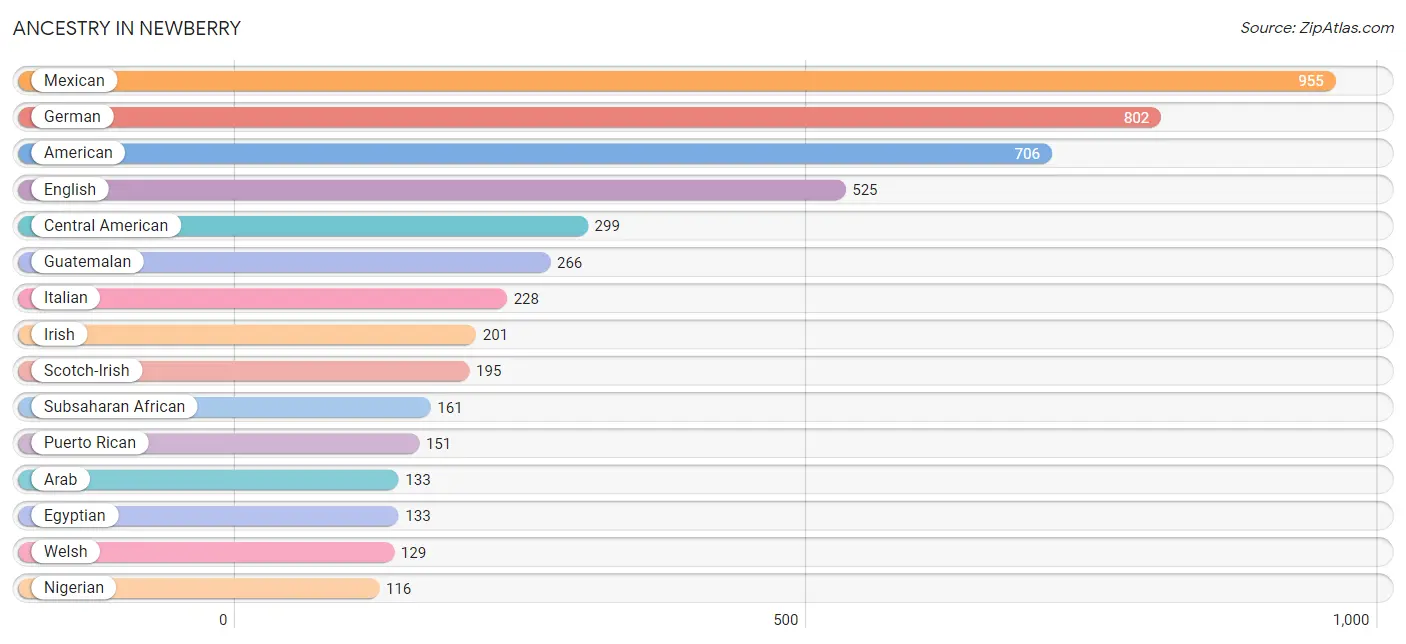
Ancestry in Newberry
The most populous ancestries reported in Newberry are Mexican (955 | 8.9%), German (802 | 7.5%), American (706 | 6.6%), English (525 | 4.9%), and Central American (299 | 2.8%), together accounting for 30.8% of all Newberry residents.
| Ancestry | # Population | % Population |
| African | 45 | 0.4% |
| American | 706 | 6.6% |
| Arab | 133 | 1.3% |
| Australian | 25 | 0.2% |
| Austrian | 6 | 0.1% |
| Bangladeshi | 16 | 0.2% |
| Brazilian | 77 | 0.7% |
| British | 79 | 0.7% |
| Cape Verdean | 18 | 0.2% |
| Central American | 299 | 2.8% |
| Chippewa | 20 | 0.2% |
| Dutch | 35 | 0.3% |
| Egyptian | 133 | 1.3% |
| English | 525 | 4.9% |
| European | 25 | 0.2% |
| French | 65 | 0.6% |
| French Canadian | 64 | 0.6% |
| German | 802 | 7.5% |
| Greek | 17 | 0.2% |
| Guatemalan | 266 | 2.5% |
| Hungarian | 14 | 0.1% |
| Indian (Asian) | 8 | 0.1% |
| Irish | 201 | 1.9% |
| Italian | 228 | 2.1% |
| Korean | 28 | 0.3% |
| Mexican | 955 | 8.9% |
| Navajo | 3 | 0.0% |
| Nigerian | 116 | 1.1% |
| Norwegian | 26 | 0.2% |
| Polish | 38 | 0.4% |
| Portuguese | 77 | 0.7% |
| Puerto Rican | 151 | 1.4% |
| Russian | 20 | 0.2% |
| Salvadoran | 33 | 0.3% |
| Samoan | 15 | 0.1% |
| Scandinavian | 14 | 0.1% |
| Scotch-Irish | 195 | 1.8% |
| Scottish | 52 | 0.5% |
| Spaniard | 19 | 0.2% |
| Spanish | 9 | 0.1% |
| Sri Lankan | 3 | 0.0% |
| Subsaharan African | 161 | 1.5% |
| Swiss | 14 | 0.1% |
| Welsh | 129 | 1.2% |
| Yugoslavian | 6 | 0.1% | View All 45 Rows |
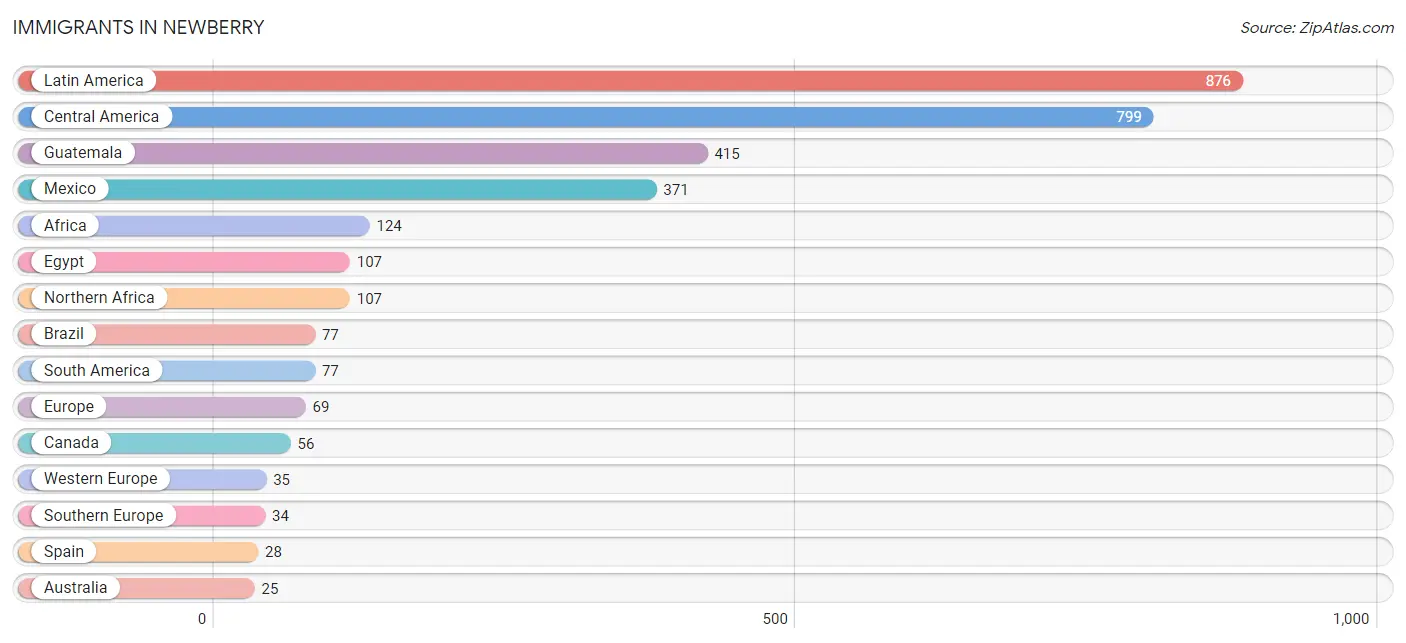
Immigrants in Newberry
The most numerous immigrant groups reported in Newberry came from Latin America (876 | 8.2%), Central America (799 | 7.5%), Guatemala (415 | 3.9%), Mexico (371 | 3.5%), and Africa (124 | 1.2%), together accounting for 24.2% of all Newberry residents.
| Immigration Origin | # Population | % Population |
| Africa | 124 | 1.2% |
| Asia | 8 | 0.1% |
| Australia | 25 | 0.2% |
| Brazil | 77 | 0.7% |
| Canada | 56 | 0.5% |
| Central America | 799 | 7.5% |
| China | 8 | 0.1% |
| Eastern Asia | 8 | 0.1% |
| Egypt | 107 | 1.0% |
| El Salvador | 13 | 0.1% |
| Europe | 69 | 0.6% |
| Germany | 20 | 0.2% |
| Greece | 6 | 0.1% |
| Guatemala | 415 | 3.9% |
| Latin America | 876 | 8.2% |
| Mexico | 371 | 3.5% |
| Netherlands | 15 | 0.1% |
| Nigeria | 17 | 0.2% |
| Northern Africa | 107 | 1.0% |
| Oceania | 25 | 0.2% |
| South America | 77 | 0.7% |
| Southern Europe | 34 | 0.3% |
| Spain | 28 | 0.3% |
| Western Africa | 17 | 0.2% |
| Western Europe | 35 | 0.3% | View All 25 Rows |
Sex and Age in Newberry
Sex and Age in Newberry
The most populous age groups in Newberry are 20 to 24 Years (621 | 12.6%) for men and 5 to 9 Years (565 | 9.9%) for women.
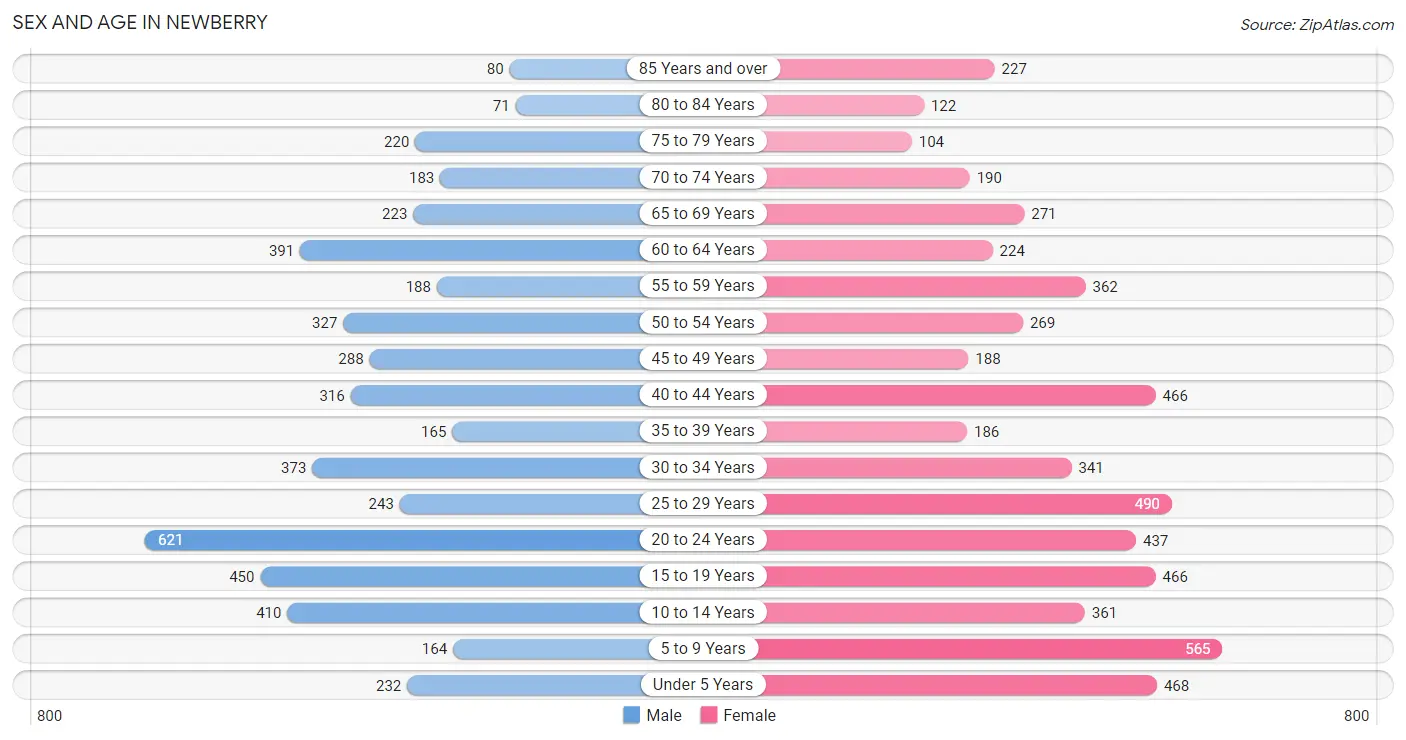
| Age Bracket | Male | Female |
| Under 5 Years | 232 (4.7%) | 468 (8.2%) |
| 5 to 9 Years | 164 (3.3%) | 565 (9.9%) |
| 10 to 14 Years | 410 (8.3%) | 361 (6.3%) |
| 15 to 19 Years | 450 (9.1%) | 466 (8.1%) |
| 20 to 24 Years | 621 (12.6%) | 437 (7.6%) |
| 25 to 29 Years | 243 (4.9%) | 490 (8.5%) |
| 30 to 34 Years | 373 (7.5%) | 341 (5.9%) |
| 35 to 39 Years | 165 (3.3%) | 186 (3.2%) |
| 40 to 44 Years | 316 (6.4%) | 466 (8.1%) |
| 45 to 49 Years | 288 (5.8%) | 188 (3.3%) |
| 50 to 54 Years | 327 (6.6%) | 269 (4.7%) |
| 55 to 59 Years | 188 (3.8%) | 362 (6.3%) |
| 60 to 64 Years | 391 (7.9%) | 224 (3.9%) |
| 65 to 69 Years | 223 (4.5%) | 271 (4.7%) |
| 70 to 74 Years | 183 (3.7%) | 190 (3.3%) |
| 75 to 79 Years | 220 (4.4%) | 104 (1.8%) |
| 80 to 84 Years | 71 (1.4%) | 122 (2.1%) |
| 85 Years and over | 80 (1.6%) | 227 (4.0%) |
| Total | 4,945 (100.0%) | 5,737 (100.0%) |
Families and Households in Newberry
Median Family Size in Newberry
The median family size in Newberry is 3.01 persons per family, with single female/mother families (852 | 35.3%) accounting for the largest median family size of 3.66 persons per family. On the other hand, single male/father families (275 | 11.4%) represent the smallest median family size with 1.93 persons per family.
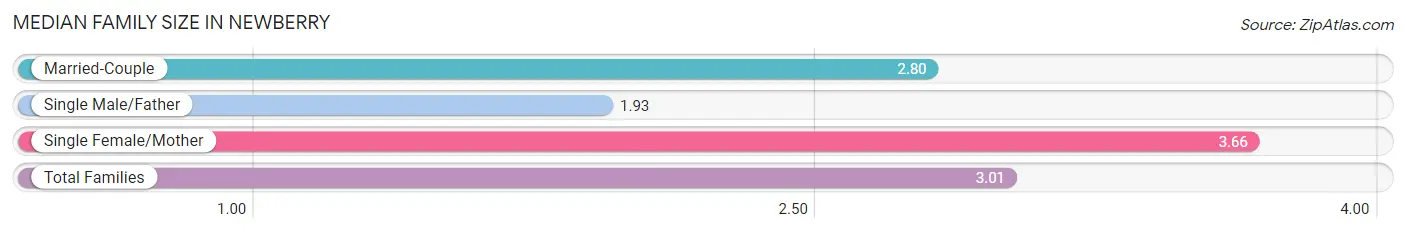
| Family Type | # Families | Family Size |
| Married-Couple | 1,284 (53.3%) | 2.80 |
| Single Male/Father | 275 (11.4%) | 1.93 |
| Single Female/Mother | 852 (35.3%) | 3.66 |
| Total Families | 2,411 (100.0%) | 3.01 |
Median Household Size in Newberry
The median household size in Newberry is 2.41 persons per household, with single female/mother households (852 | 21.8%) accounting for the largest median household size of 3.89 persons per household. non-family households (1,505 | 38.4%) represent the smallest median household size with 1.28 persons per household.
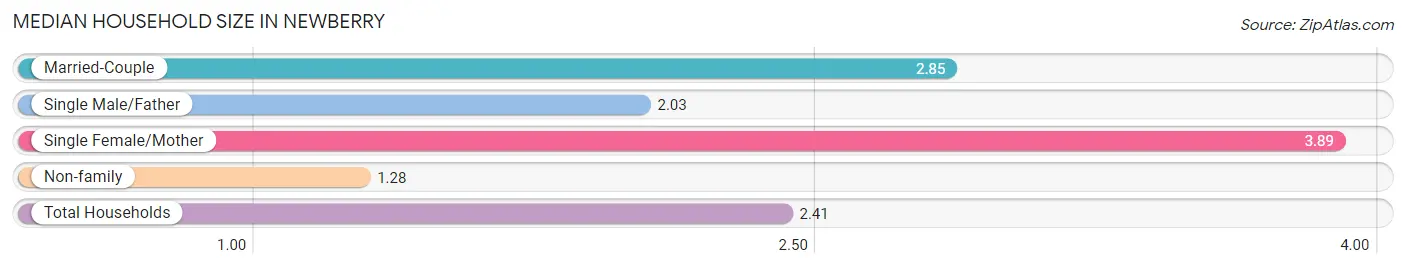
| Household Type | # Households | Household Size |
| Married-Couple | 1,284 (32.8%) | 2.85 |
| Single Male/Father | 275 (7.0%) | 2.03 |
| Single Female/Mother | 852 (21.8%) | 3.89 |
| Non-family | 1,505 (38.4%) | 1.28 |
| Total Households | 3,916 (100.0%) | 2.41 |
Household Size by Marriage Status in Newberry
Out of a total of 3,916 households in Newberry, 2,411 (61.6%) are family households, while 1,505 (38.4%) are nonfamily households. The most numerous type of family households are 2-person households, comprising 938, and the most common type of nonfamily households are 1-person households, comprising 1,095.
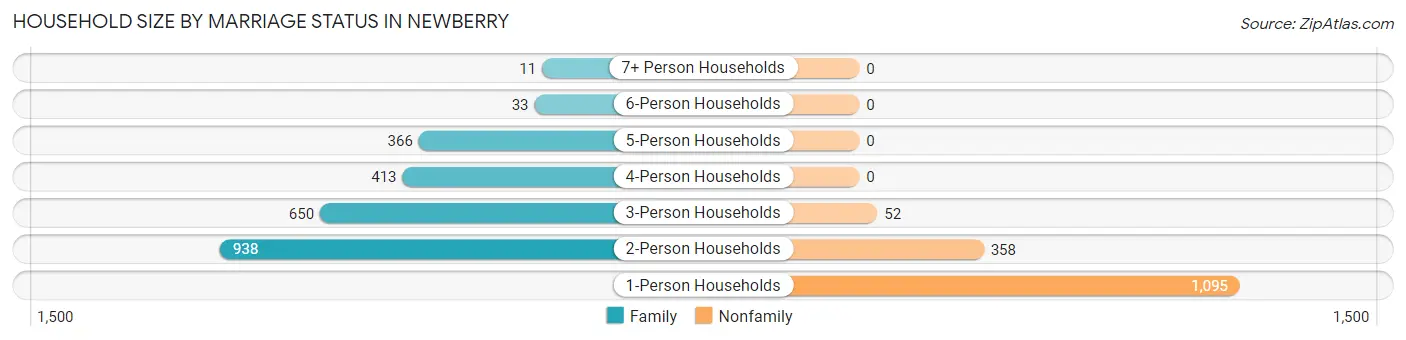
| Household Size | Family Households | Nonfamily Households |
| 1-Person Households | - | 1,095 (28.0%) |
| 2-Person Households | 938 (23.9%) | 358 (9.1%) |
| 3-Person Households | 650 (16.6%) | 52 (1.3%) |
| 4-Person Households | 413 (10.5%) | 0 (0.0%) |
| 5-Person Households | 366 (9.3%) | 0 (0.0%) |
| 6-Person Households | 33 (0.8%) | 0 (0.0%) |
| 7+ Person Households | 11 (0.3%) | 0 (0.0%) |
| Total | 2,411 (61.6%) | 1,505 (38.4%) |
Female Fertility in Newberry
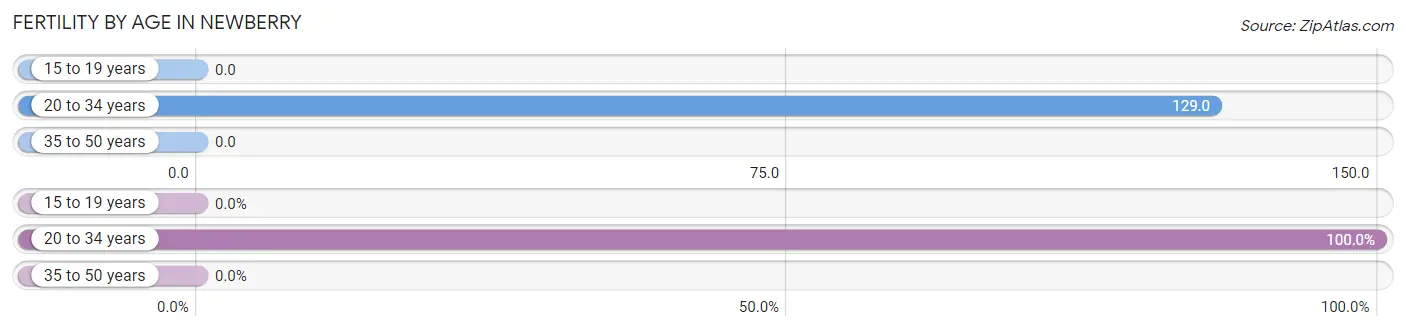
Fertility by Age in Newberry
Average fertility rate in Newberry is 62.0 births per 1,000 women. Women in the age bracket of 20 to 34 years have the highest fertility rate with 129.0 births per 1,000 women. Women in the age bracket of 20 to 34 years acount for 100.0% of all women with births.
| Age Bracket | Women with Births | Births / 1,000 Women |
| 15 to 19 years | 0 (0.0%) | 0.0 |
| 20 to 34 years | 164 (100.0%) | 129.0 |
| 35 to 50 years | 0 (0.0%) | 0.0 |
| Total | 164 (100.0%) | 62.0 |
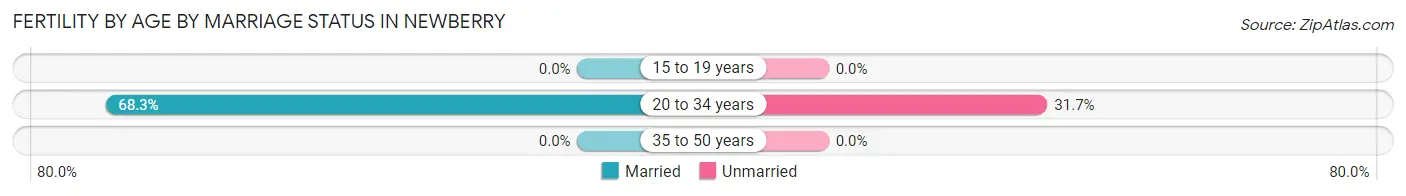
Fertility by Age by Marriage Status in Newberry
68.3% of women with births (164) in Newberry are married. The highest percentage of unmarried women with births falls into 20 to 34 years age bracket with 31.7% of them unmarried at the time of birth, while the lowest percentage of unmarried women with births belong to 20 to 34 years age bracket with 31.7% of them unmarried.
| Age Bracket | Married | Unmarried |
| 15 to 19 years | 0 (0.0%) | 0 (0.0%) |
| 20 to 34 years | 112 (68.3%) | 52 (31.7%) |
| 35 to 50 years | 0 (0.0%) | 0 (0.0%) |
| Total | 112 (68.3%) | 52 (31.7%) |
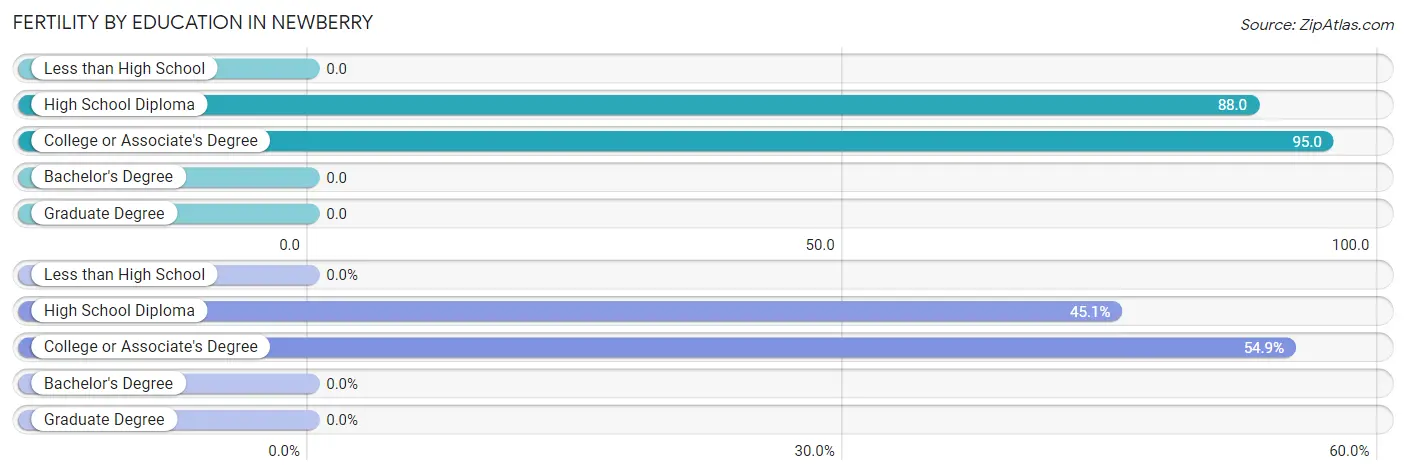
Fertility by Education in Newberry
| Educational Attainment | Women with Births | Births / 1,000 Women |
| Less than High School | 0 (0.0%) | 0.0 |
| High School Diploma | 74 (45.1%) | 88.0 |
| College or Associate's Degree | 90 (54.9%) | 95.0 |
| Bachelor's Degree | 0 (0.0%) | 0.0 |
| Graduate Degree | 0 (0.0%) | 0.0 |
| Total | 164 (100.0%) | 62.0 |
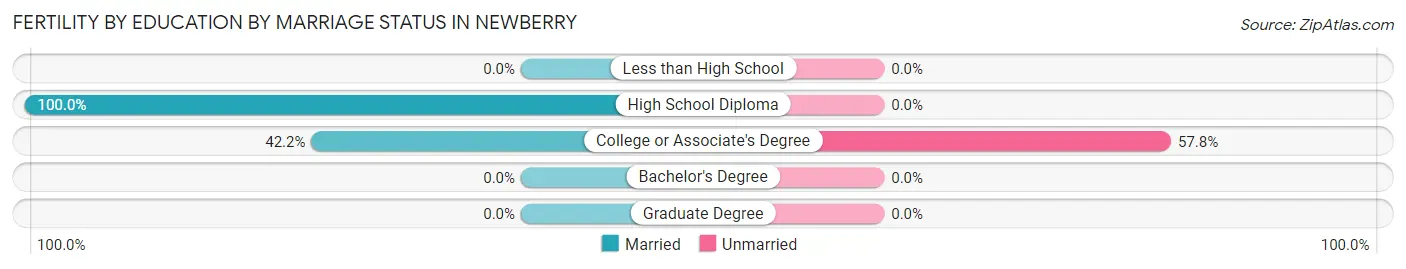
Fertility by Education by Marriage Status in Newberry
31.7% of women with births in Newberry are unmarried. Women with the educational attainment of high school diploma are most likely to be married with 100.0% of them married at childbirth, while women with the educational attainment of college or associate's degree are least likely to be married with 57.8% of them unmarried at childbirth.
| Educational Attainment | Married | Unmarried |
| Less than High School | 0 (0.0%) | 0 (0.0%) |
| High School Diploma | 74 (100.0%) | 0 (0.0%) |
| College or Associate's Degree | 38 (42.2%) | 52 (57.8%) |
| Bachelor's Degree | 0 (0.0%) | 0 (0.0%) |
| Graduate Degree | 0 (0.0%) | 0 (0.0%) |
| Total | 112 (68.3%) | 52 (31.7%) |
Income in Newberry
Income Overview in Newberry
Per Capita Income in Newberry is $21,791, while median incomes of families and households are $55,072 and $47,565 respectively.
| Characteristic | Number | Measure |
| Per Capita Income | 10,682 | $21,791 |
| Median Family Income | 2,411 | $55,072 |
| Mean Family Income | 2,411 | $64,222 |
| Median Household Income | 3,916 | $47,565 |
| Mean Household Income | 3,916 | $56,135 |
| Income Deficit | 2,411 | $0 |
| Wage / Income Gap (%) | 10,682 | 5.25% |
| Wage / Income Gap ($) | 10,682 | 94.75¢ per $1 |
| Gini / Inequality Index | 10,682 | 0.40 |
Earnings by Sex in Newberry
Average Earnings in Newberry are $26,006, $26,288 for men and $24,909 for women, a difference of 5.2%.
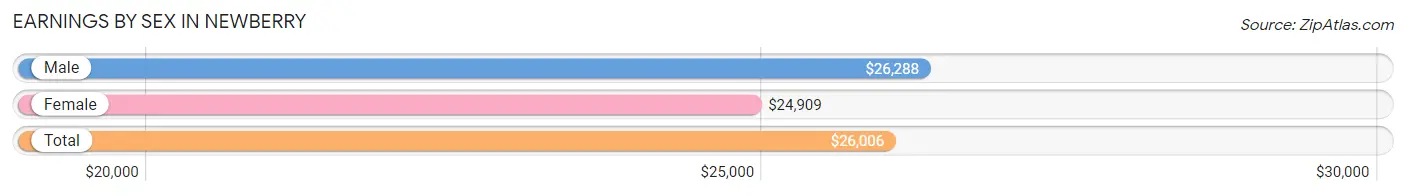
| Sex | Number | Average Earnings |
| Male | 2,856 (53.6%) | $26,288 |
| Female | 2,475 (46.4%) | $24,909 |
| Total | 5,331 (100.0%) | $26,006 |
Earnings by Sex by Income Bracket in Newberry
The most common earnings brackets in Newberry are $25,000 to $29,999 for men (519 | 18.2%) and $35,000 to $39,999 for women (211 | 8.5%).
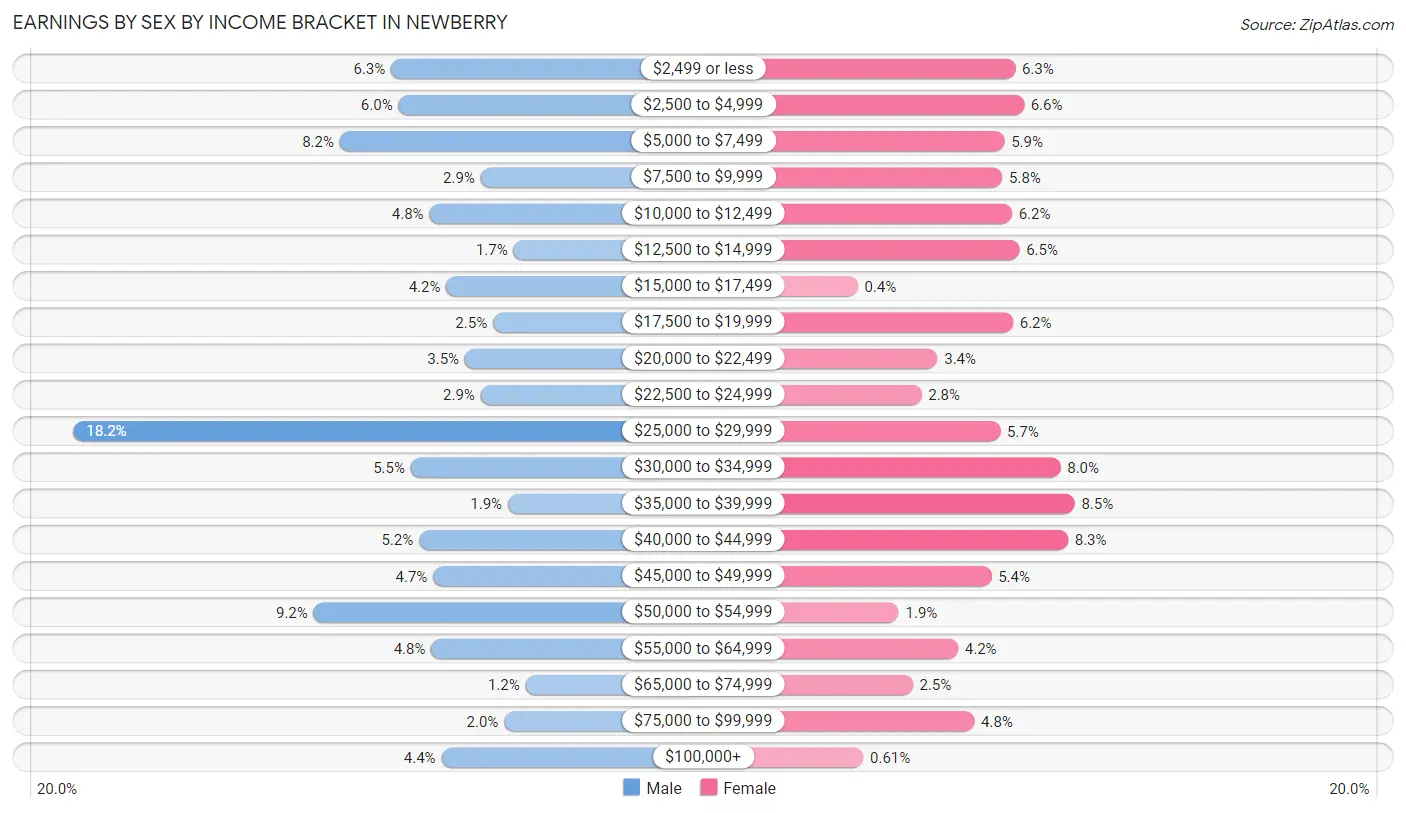
| Income | Male | Female |
| $2,499 or less | 179 (6.3%) | 156 (6.3%) |
| $2,500 to $4,999 | 171 (6.0%) | 164 (6.6%) |
| $5,000 to $7,499 | 234 (8.2%) | 146 (5.9%) |
| $7,500 to $9,999 | 83 (2.9%) | 144 (5.8%) |
| $10,000 to $12,499 | 138 (4.8%) | 153 (6.2%) |
| $12,500 to $14,999 | 48 (1.7%) | 160 (6.5%) |
| $15,000 to $17,499 | 120 (4.2%) | 10 (0.4%) |
| $17,500 to $19,999 | 70 (2.5%) | 154 (6.2%) |
| $20,000 to $22,499 | 100 (3.5%) | 84 (3.4%) |
| $22,500 to $24,999 | 83 (2.9%) | 69 (2.8%) |
| $25,000 to $29,999 | 519 (18.2%) | 142 (5.7%) |
| $30,000 to $34,999 | 158 (5.5%) | 198 (8.0%) |
| $35,000 to $39,999 | 54 (1.9%) | 211 (8.5%) |
| $40,000 to $44,999 | 149 (5.2%) | 205 (8.3%) |
| $45,000 to $49,999 | 134 (4.7%) | 134 (5.4%) |
| $50,000 to $54,999 | 262 (9.2%) | 48 (1.9%) |
| $55,000 to $64,999 | 136 (4.8%) | 103 (4.2%) |
| $65,000 to $74,999 | 35 (1.2%) | 61 (2.5%) |
| $75,000 to $99,999 | 58 (2.0%) | 118 (4.8%) |
| $100,000+ | 125 (4.4%) | 15 (0.6%) |
| Total | 2,856 (100.0%) | 2,475 (100.0%) |
Earnings by Sex by Educational Attainment in Newberry
Average earnings in Newberry are $28,826 for men and $30,491 for women, a difference of 5.5%. Men with an educational attainment of bachelor's degree enjoy the highest average annual earnings of $58,443, while those with college or associate's degree education earn the least with $26,489. Women with an educational attainment of graduate degree earn the most with the average annual earnings of $78,125, while those with less than high school education have the smallest earnings of $18,077.
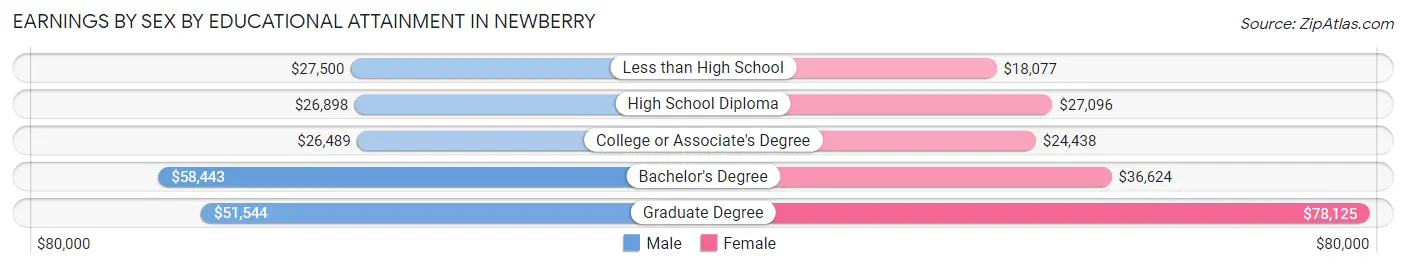
| Educational Attainment | Male Income | Female Income |
| Less than High School | $27,500 | $18,077 |
| High School Diploma | $26,898 | $27,096 |
| College or Associate's Degree | $26,489 | $24,438 |
| Bachelor's Degree | $58,443 | $36,624 |
| Graduate Degree | $51,544 | $78,125 |
| Total | $28,826 | $30,491 |
Family Income in Newberry
Family Income Brackets in Newberry
According to the Newberry family income data, there are 699 families falling into the $50,000 to $74,999 income range, which is the most common income bracket and makes up 29.0% of all families. Conversely, the $200,000+ income bracket is the least frequent group with only 84 families (3.5%) belonging to this category.
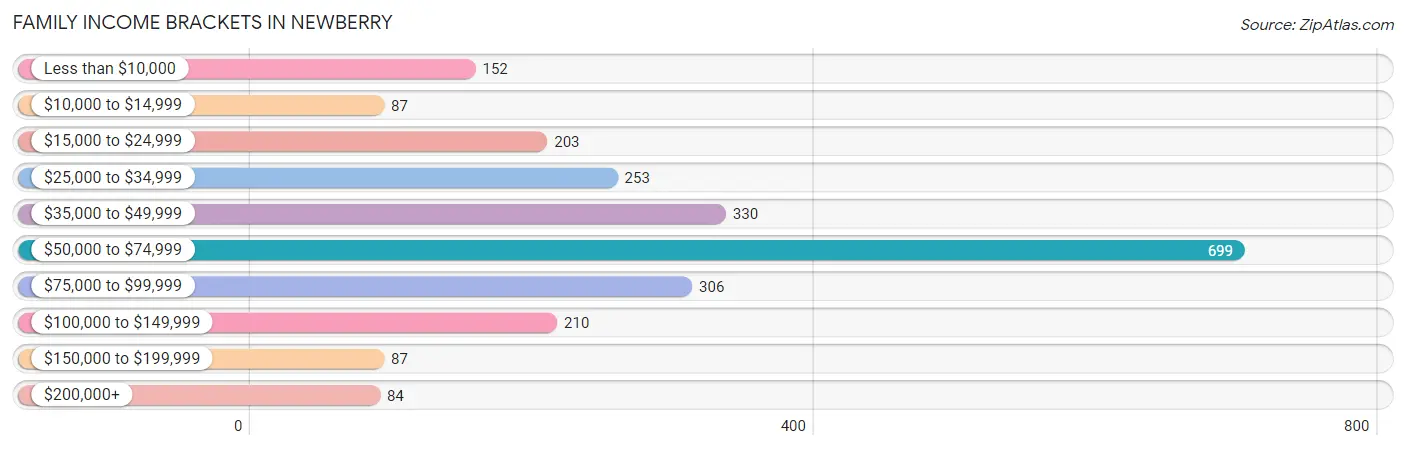
| Income Bracket | # Families | % Families |
| Less than $10,000 | 152 | 6.3% |
| $10,000 to $14,999 | 87 | 3.6% |
| $15,000 to $24,999 | 203 | 8.4% |
| $25,000 to $34,999 | 253 | 10.5% |
| $35,000 to $49,999 | 330 | 13.7% |
| $50,000 to $74,999 | 699 | 29.0% |
| $75,000 to $99,999 | 306 | 12.7% |
| $100,000 to $149,999 | 210 | 8.7% |
| $150,000 to $199,999 | 87 | 3.6% |
| $200,000+ | 84 | 3.5% |
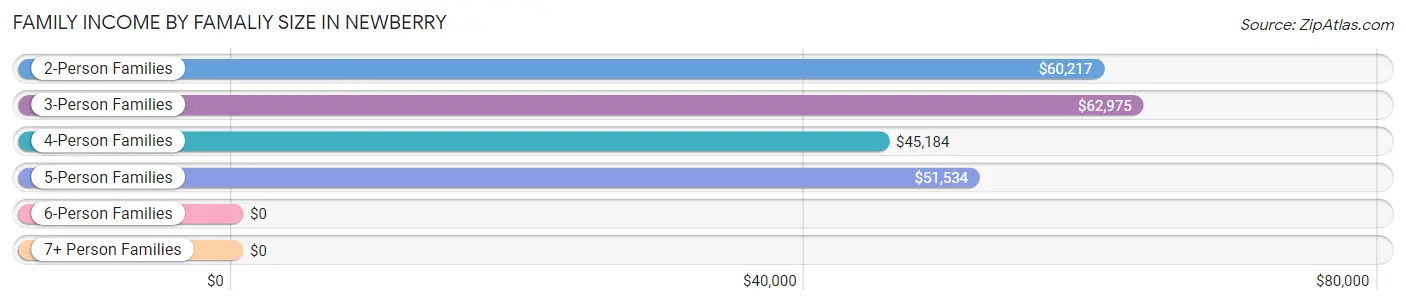
Family Income by Famaliy Size in Newberry
3-person families (620 | 25.7%) account for the highest median family income in Newberry with $62,975 per family, while 2-person families (1,034 | 42.9%) have the highest median income of $30,108 per family member.
| Income Bracket | # Families | Median Income |
| 2-Person Families | 1,034 (42.9%) | $60,217 |
| 3-Person Families | 620 (25.7%) | $62,975 |
| 4-Person Families | 415 (17.2%) | $45,184 |
| 5-Person Families | 311 (12.9%) | $51,534 |
| 6-Person Families | 20 (0.8%) | $0 |
| 7+ Person Families | 11 (0.5%) | $0 |
| Total | 2,411 (100.0%) | $55,072 |
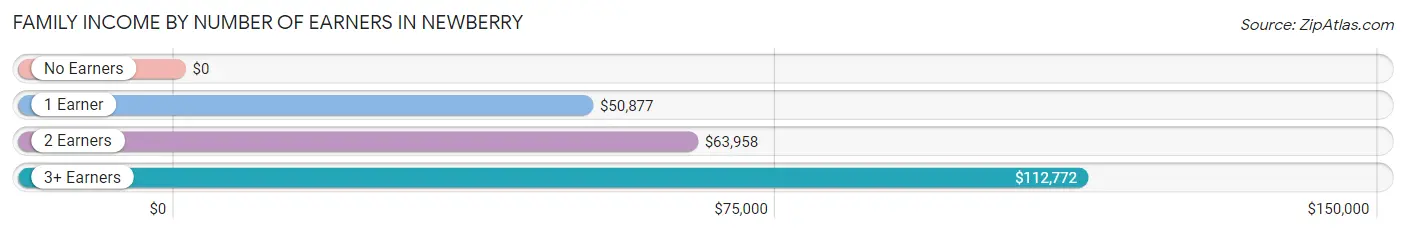
Family Income by Number of Earners in Newberry
| Number of Earners | # Families | Median Income |
| No Earners | 365 (15.1%) | $0 |
| 1 Earner | 1,016 (42.1%) | $50,877 |
| 2 Earners | 895 (37.1%) | $63,958 |
| 3+ Earners | 135 (5.6%) | $112,772 |
| Total | 2,411 (100.0%) | $55,072 |
Household Income in Newberry
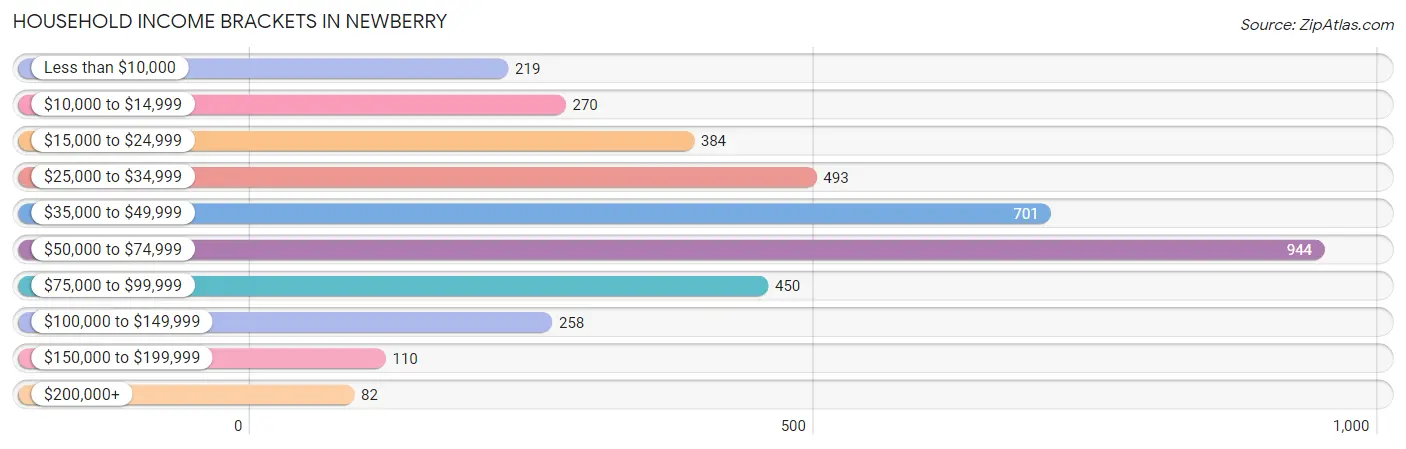
Household Income Brackets in Newberry
With 944 households falling in the category, the $50,000 to $74,999 income range is the most frequent in Newberry, accounting for 24.1% of all households. In contrast, only 82 households (2.1%) fall into the $200,000+ income bracket, making it the least populous group.
| Income Bracket | # Households | % Households |
| Less than $10,000 | 219 | 5.6% |
| $10,000 to $14,999 | 270 | 6.9% |
| $15,000 to $24,999 | 384 | 9.8% |
| $25,000 to $34,999 | 493 | 12.6% |
| $35,000 to $49,999 | 701 | 17.9% |
| $50,000 to $74,999 | 944 | 24.1% |
| $75,000 to $99,999 | 450 | 11.5% |
| $100,000 to $149,999 | 258 | 6.6% |
| $150,000 to $199,999 | 110 | 2.8% |
| $200,000+ | 82 | 2.1% |
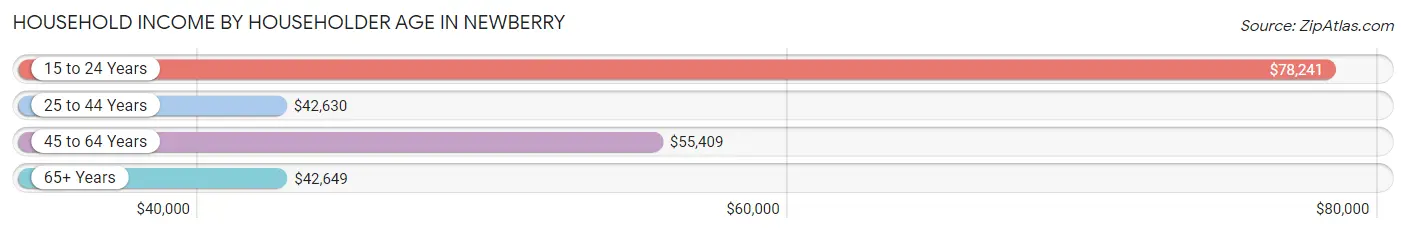
Household Income by Householder Age in Newberry
The median household income in Newberry is $47,565, with the highest median household income of $78,241 found in the 15 to 24 years age bracket for the primary householder. A total of 194 households (5.0%) fall into this category. Meanwhile, the 25 to 44 years age bracket for the primary householder has the lowest median household income of $42,630, with 1,529 households (39.0%) in this group.
| Income Bracket | # Households | Median Income |
| 15 to 24 Years | 194 (5.0%) | $78,241 |
| 25 to 44 Years | 1,529 (39.0%) | $42,630 |
| 45 to 64 Years | 1,088 (27.8%) | $55,409 |
| 65+ Years | 1,105 (28.2%) | $42,649 |
| Total | 3,916 (100.0%) | $47,565 |
Poverty in Newberry
Income Below Poverty by Sex and Age in Newberry
With 22.0% poverty level for males and 30.6% for females among the residents of Newberry, 6 to 11 year old males and 16 and 17 year old females are the most vulnerable to poverty, with 215 males (58.7%) and 86 females (66.7%) in their respective age groups living below the poverty level.
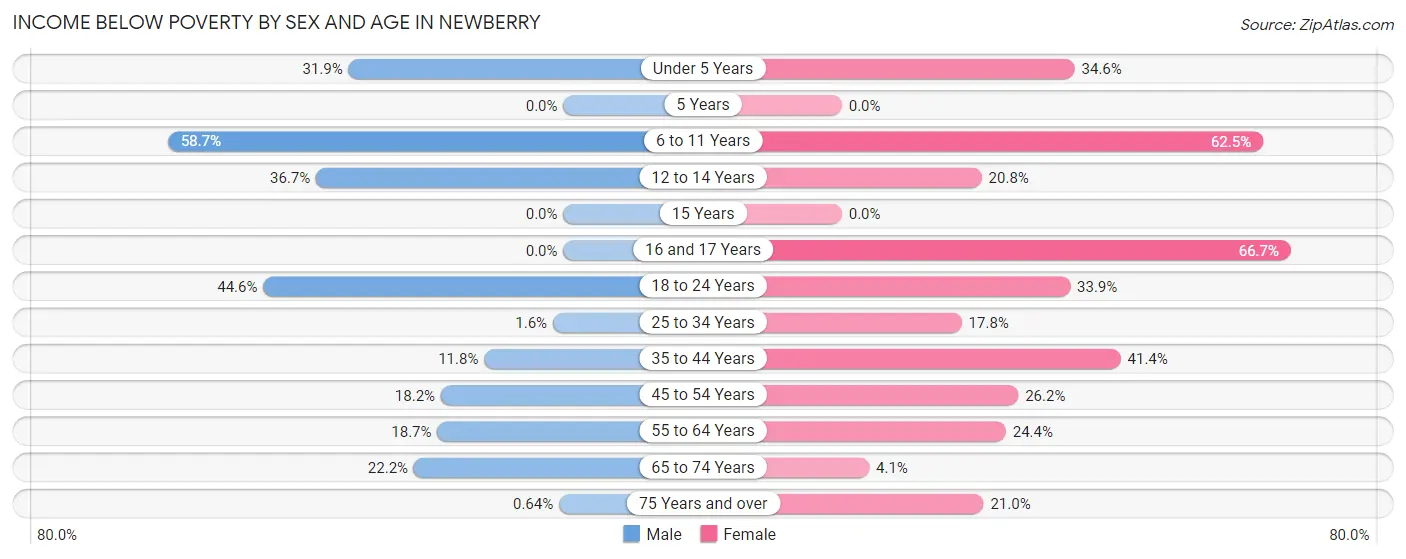
| Age Bracket | Male | Female |
| Under 5 Years | 74 (31.9%) | 158 (34.6%) |
| 5 Years | 0 (0.0%) | 0 (0.0%) |
| 6 to 11 Years | 215 (58.7%) | 394 (62.5%) |
| 12 to 14 Years | 76 (36.7%) | 54 (20.8%) |
| 15 Years | 0 (0.0%) | 0 (0.0%) |
| 16 and 17 Years | 0 (0.0%) | 86 (66.7%) |
| 18 to 24 Years | 217 (44.6%) | 140 (33.9%) |
| 25 to 34 Years | 9 (1.5%) | 147 (17.8%) |
| 35 to 44 Years | 53 (11.7%) | 267 (41.4%) |
| 45 to 54 Years | 110 (18.2%) | 115 (26.2%) |
| 55 to 64 Years | 104 (18.7%) | 140 (24.3%) |
| 65 to 74 Years | 87 (22.2%) | 18 (4.1%) |
| 75 Years and over | 2 (0.6%) | 65 (21.0%) |
| Total | 947 (22.0%) | 1,584 (30.6%) |
Income Above Poverty by Sex and Age in Newberry
According to the poverty statistics in Newberry, males aged 15 years and females aged 5 years are the age groups that are most secure financially, with 100.0% of males and 100.0% of females in these age groups living above the poverty line.
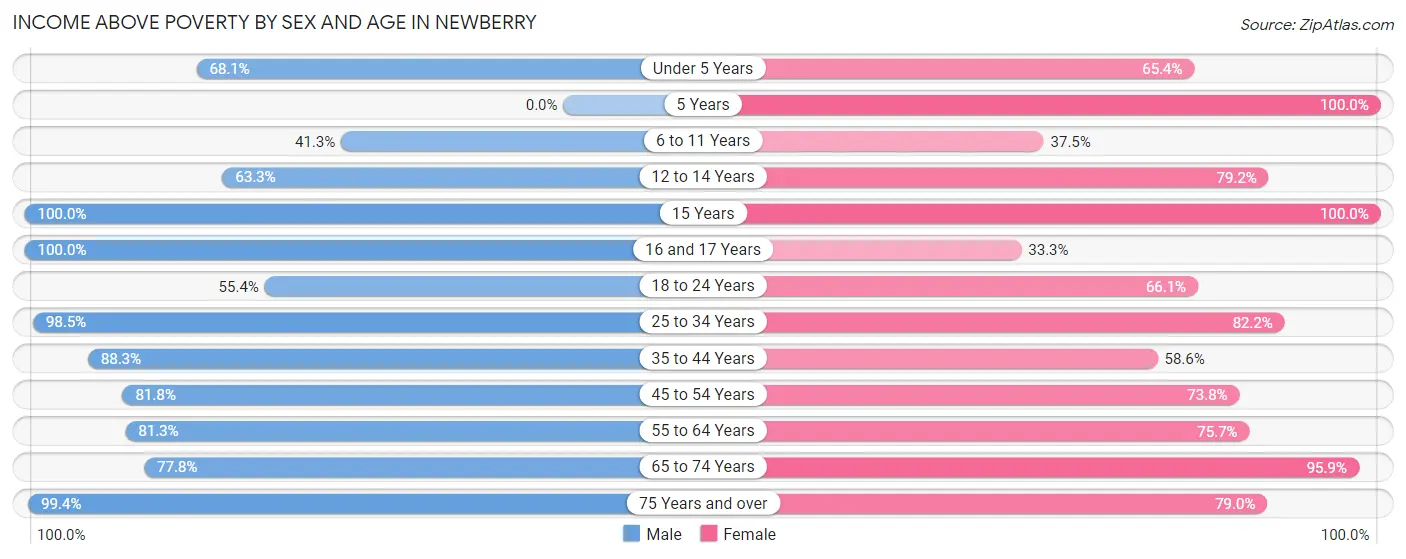
| Age Bracket | Male | Female |
| Under 5 Years | 158 (68.1%) | 299 (65.4%) |
| 5 Years | 0 (0.0%) | 36 (100.0%) |
| 6 to 11 Years | 151 (41.3%) | 236 (37.5%) |
| 12 to 14 Years | 131 (63.3%) | 206 (79.2%) |
| 15 Years | 60 (100.0%) | 17 (100.0%) |
| 16 and 17 Years | 51 (100.0%) | 43 (33.3%) |
| 18 to 24 Years | 270 (55.4%) | 273 (66.1%) |
| 25 to 34 Years | 573 (98.5%) | 679 (82.2%) |
| 35 to 44 Years | 398 (88.2%) | 378 (58.6%) |
| 45 to 54 Years | 495 (81.8%) | 324 (73.8%) |
| 55 to 64 Years | 452 (81.3%) | 435 (75.6%) |
| 65 to 74 Years | 305 (77.8%) | 425 (95.9%) |
| 75 Years and over | 312 (99.4%) | 244 (79.0%) |
| Total | 3,356 (78.0%) | 3,595 (69.4%) |
Income Below Poverty Among Married-Couple Families in Newberry
The poverty statistics for married-couple families in Newberry show that 3.5% or 45 of the total 1,284 families live below the poverty line. Families with 1 or 2 children have the highest poverty rate of 20.2%, comprising of 45 families. On the other hand, families with no children have the lowest poverty rate of 0.0%, which includes 0 families.
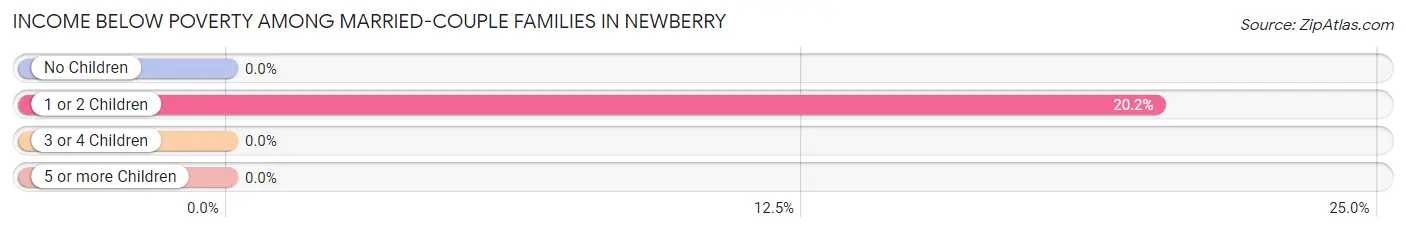
| Children | Above Poverty | Below Poverty |
| No Children | 858 (100.0%) | 0 (0.0%) |
| 1 or 2 Children | 178 (79.8%) | 45 (20.2%) |
| 3 or 4 Children | 203 (100.0%) | 0 (0.0%) |
| 5 or more Children | 0 (0.0%) | 0 (0.0%) |
| Total | 1,239 (96.5%) | 45 (3.5%) |
Income Below Poverty Among Single-Parent Households in Newberry
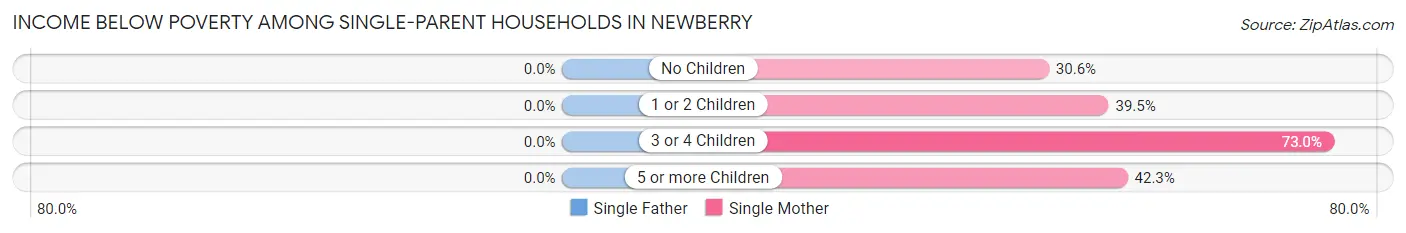
| Children | Single Father | Single Mother |
| No Children | 0 (0.0%) | 37 (30.6%) |
| 1 or 2 Children | 0 (0.0%) | 208 (39.5%) |
| 3 or 4 Children | 0 (0.0%) | 130 (73.0%) |
| 5 or more Children | 0 (0.0%) | 11 (42.3%) |
| Total | 0 (0.0%) | 386 (45.3%) |
Income Below Poverty Among Married-Couple vs Single-Parent Households in Newberry
The poverty data for Newberry shows that 45 of the married-couple family households (3.5%) and 386 of the single-parent households (34.3%) are living below the poverty level. Within the married-couple family households, those with 1 or 2 children have the highest poverty rate, with 45 households (20.2%) falling below the poverty line. Among the single-parent households, those with 3 or 4 children have the highest poverty rate, with 130 household (73.0%) living below poverty.
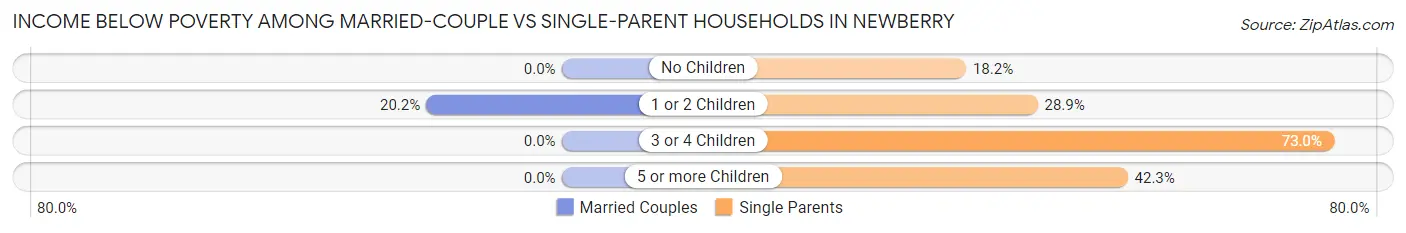
| Children | Married-Couple Families | Single-Parent Households |
| No Children | 0 (0.0%) | 37 (18.2%) |
| 1 or 2 Children | 45 (20.2%) | 208 (28.9%) |
| 3 or 4 Children | 0 (0.0%) | 130 (73.0%) |
| 5 or more Children | 0 (0.0%) | 11 (42.3%) |
| Total | 45 (3.5%) | 386 (34.3%) |
Employment Characteristics in Newberry
Employment by Class of Employer in Newberry
Among the 3,960 employed individuals in Newberry, private company employees (2,472 | 62.4%), not-for-profit organizations (565 | 14.3%), and self-employed (not incorporated) (304 | 7.7%) make up the most common classes of employment.
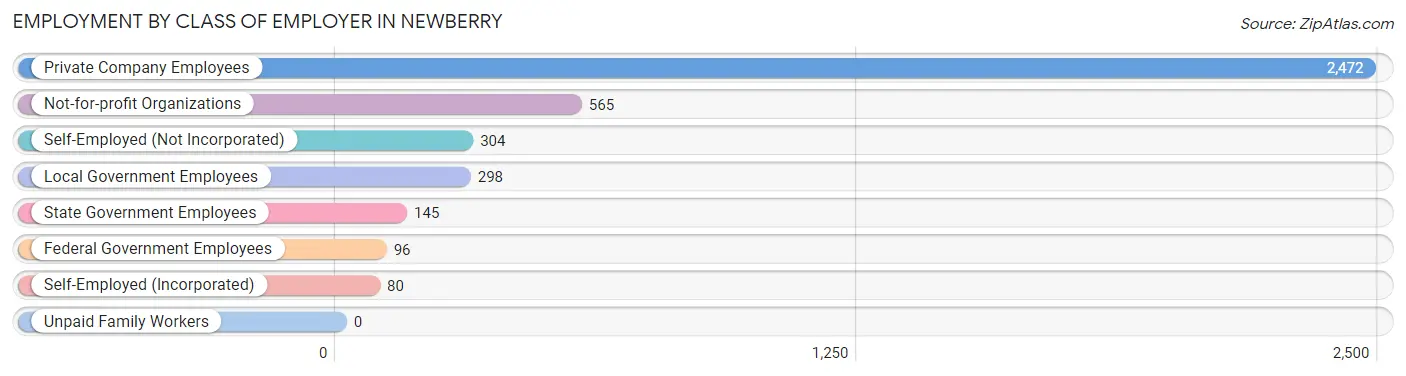
| Employer Class | # Employees | % Employees |
| Private Company Employees | 2,472 | 62.4% |
| Self-Employed (Incorporated) | 80 | 2.0% |
| Self-Employed (Not Incorporated) | 304 | 7.7% |
| Not-for-profit Organizations | 565 | 14.3% |
| Local Government Employees | 298 | 7.5% |
| State Government Employees | 145 | 3.7% |
| Federal Government Employees | 96 | 2.4% |
| Unpaid Family Workers | 0 | 0.0% |
| Total | 3,960 | 100.0% |
Employment Status by Age in Newberry
According to the labor force statistics for Newberry, out of the total population over 16 years of age (8,405), 54.4% or 4,572 individuals are in the labor force, with 7.6% or 347 of them unemployed. The age group with the highest labor force participation rate is 30 to 34 years, with 85.3% or 609 individuals in the labor force. Within the labor force, the 75 years and over age range has the highest percentage of unemployed individuals, with 100.0% or 19 of them being unemployed.
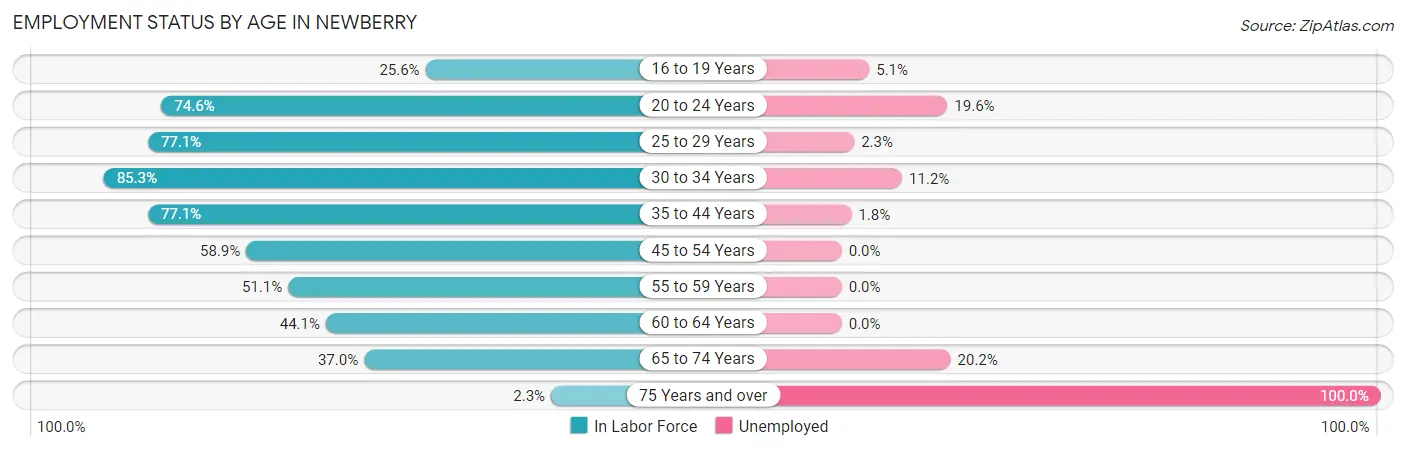
| Age Bracket | In Labor Force | Unemployed |
| 16 to 19 Years | 215 (25.6%) | 11 (5.1%) |
| 20 to 24 Years | 789 (74.6%) | 155 (19.6%) |
| 25 to 29 Years | 565 (77.1%) | 13 (2.3%) |
| 30 to 34 Years | 609 (85.3%) | 68 (11.2%) |
| 35 to 44 Years | 874 (77.1%) | 16 (1.8%) |
| 45 to 54 Years | 631 (58.9%) | 0 (0.0%) |
| 55 to 59 Years | 281 (51.1%) | 0 (0.0%) |
| 60 to 64 Years | 271 (44.1%) | 0 (0.0%) |
| 65 to 74 Years | 321 (37.0%) | 65 (20.2%) |
| 75 Years and over | 19 (2.3%) | 19 (100.0%) |
| Total | 4,572 (54.4%) | 347 (7.6%) |
Employment Status by Educational Attainment in Newberry
According to labor force statistics for Newberry, 67.1% of individuals (3,232) out of the total population between 25 and 64 years of age (4,817) are in the labor force, with 3.0% or 97 of them being unemployed. The group with the highest labor force participation rate are those with the educational attainment of college / associate degree, with 76.8% or 1,064 individuals in the labor force. Within the labor force, individuals with high school diploma education have the highest percentage of unemployment, with 7.8% or 82 of them being unemployed.
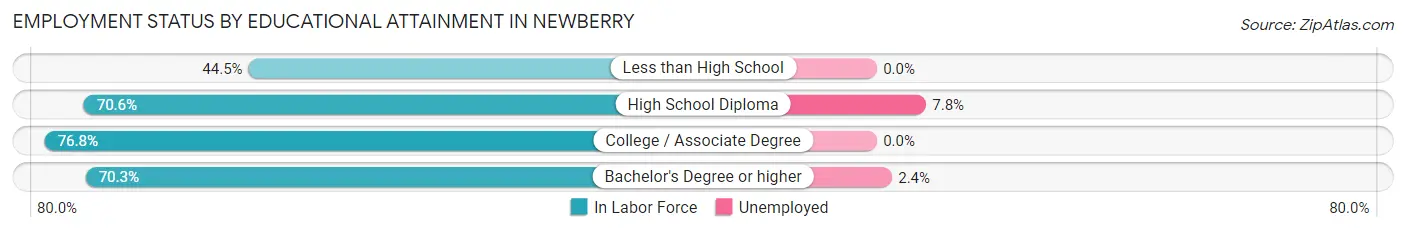
| Educational Attainment | In Labor Force | Unemployed |
| Less than High School | 433 (44.5%) | 0 (0.0%) |
| High School Diploma | 1,055 (70.6%) | 117 (7.8%) |
| College / Associate Degree | 1,064 (76.8%) | 0 (0.0%) |
| Bachelor's Degree or higher | 677 (70.3%) | 23 (2.4%) |
| Total | 3,232 (67.1%) | 145 (3.0%) |
Employment Occupations by Sex in Newberry
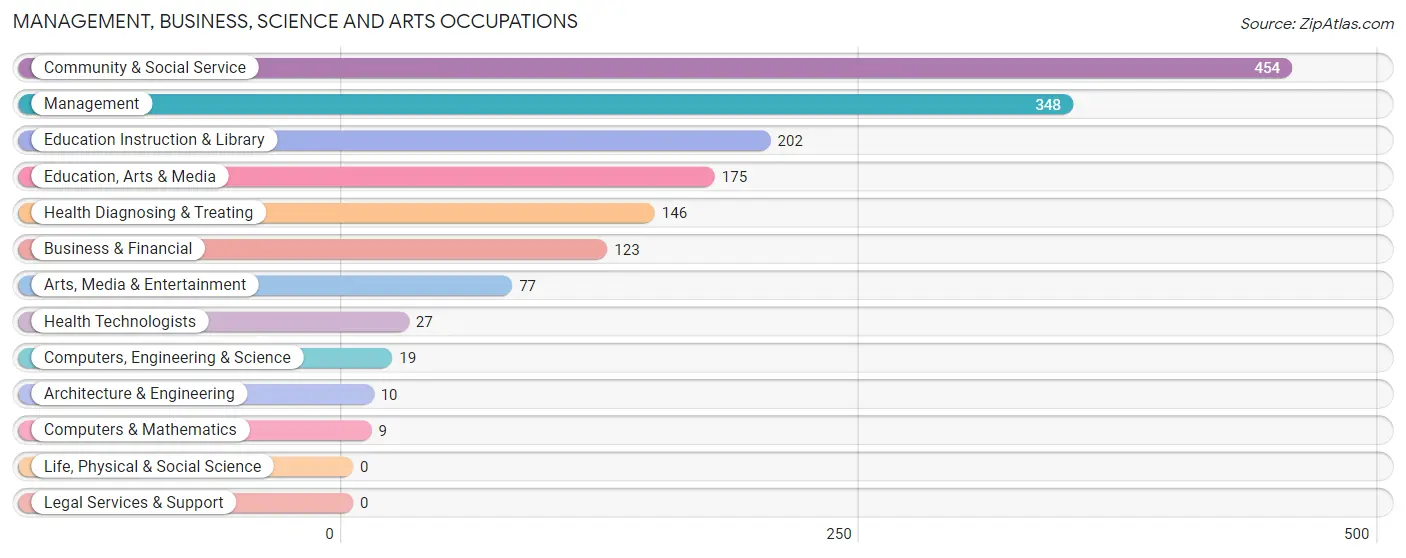
Management, Business, Science and Arts Occupations
The most common Management, Business, Science and Arts occupations in Newberry are Community & Social Service (454 | 10.8%), Management (348 | 8.3%), Education Instruction & Library (202 | 4.8%), Education, Arts & Media (175 | 4.2%), and Health Diagnosing & Treating (146 | 3.5%).
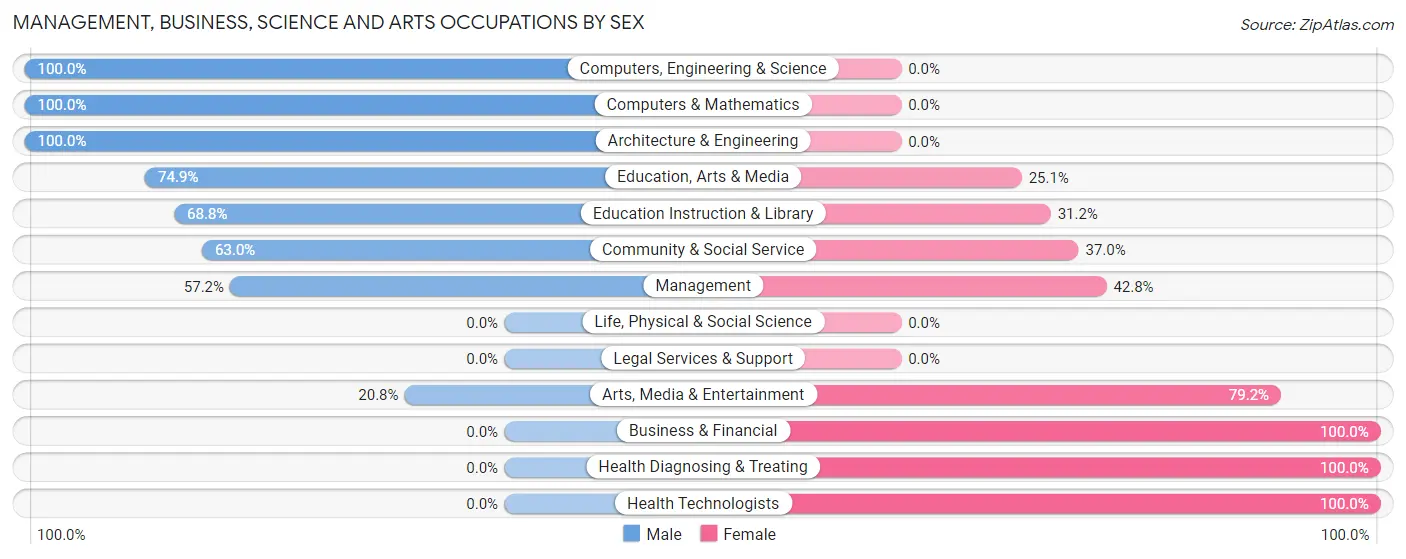
Management, Business, Science and Arts Occupations by Sex
Within the Management, Business, Science and Arts occupations in Newberry, the most male-oriented occupations are Computers, Engineering & Science (100.0%), Computers & Mathematics (100.0%), and Architecture & Engineering (100.0%), while the most female-oriented occupations are Business & Financial (100.0%), Health Diagnosing & Treating (100.0%), and Health Technologists (100.0%).
| Occupation | Male | Female |
| Management | 199 (57.2%) | 149 (42.8%) |
| Business & Financial | 0 (0.0%) | 123 (100.0%) |
| Computers, Engineering & Science | 19 (100.0%) | 0 (0.0%) |
| Computers & Mathematics | 9 (100.0%) | 0 (0.0%) |
| Architecture & Engineering | 10 (100.0%) | 0 (0.0%) |
| Life, Physical & Social Science | 0 (0.0%) | 0 (0.0%) |
| Community & Social Service | 286 (63.0%) | 168 (37.0%) |
| Education, Arts & Media | 131 (74.9%) | 44 (25.1%) |
| Legal Services & Support | 0 (0.0%) | 0 (0.0%) |
| Education Instruction & Library | 139 (68.8%) | 63 (31.2%) |
| Arts, Media & Entertainment | 16 (20.8%) | 61 (79.2%) |
| Health Diagnosing & Treating | 0 (0.0%) | 146 (100.0%) |
| Health Technologists | 0 (0.0%) | 27 (100.0%) |
| Total (Category) | 504 (46.2%) | 586 (53.8%) |
| Total (Overall) | 2,242 (53.5%) | 1,952 (46.5%) |
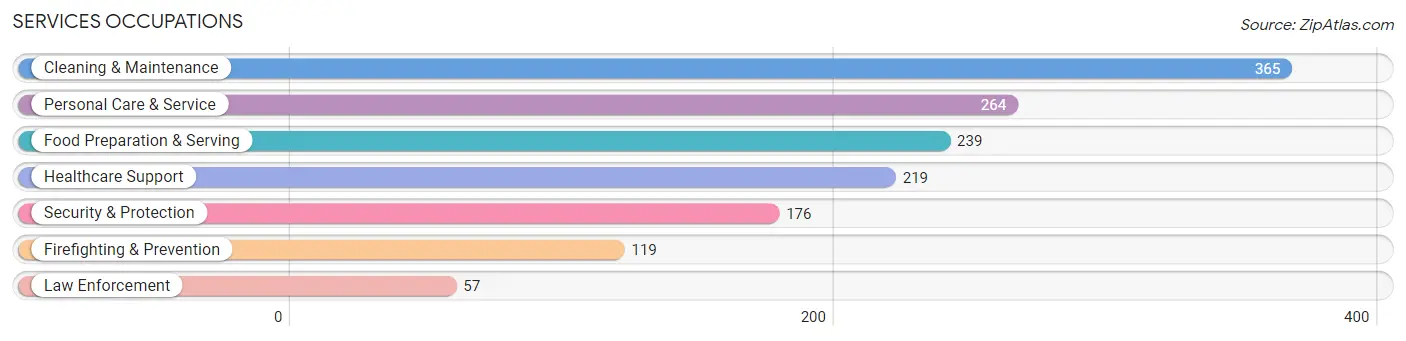
Services Occupations
The most common Services occupations in Newberry are Cleaning & Maintenance (365 | 8.7%), Personal Care & Service (264 | 6.3%), Food Preparation & Serving (239 | 5.7%), Healthcare Support (219 | 5.2%), and Security & Protection (176 | 4.2%).
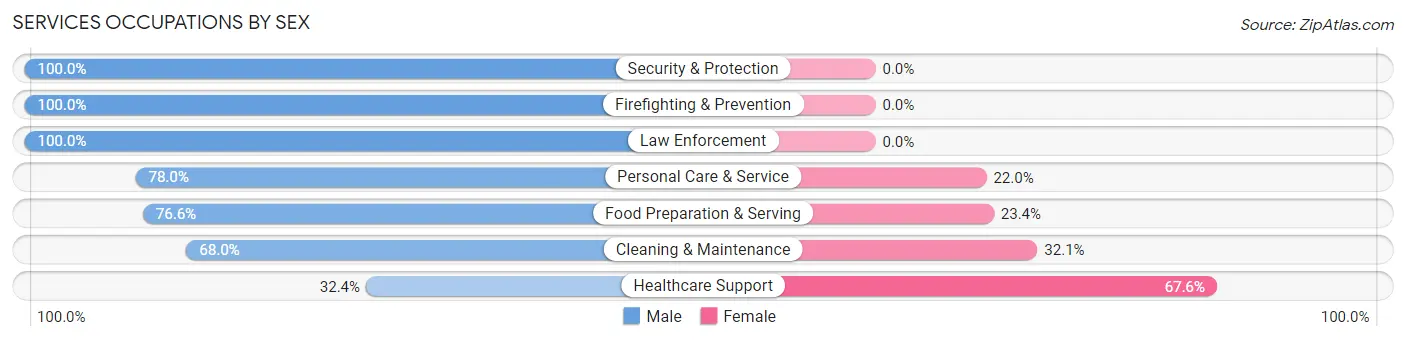
Services Occupations by Sex
Within the Services occupations in Newberry, the most male-oriented occupations are Security & Protection (100.0%), Firefighting & Prevention (100.0%), and Law Enforcement (100.0%), while the most female-oriented occupations are Healthcare Support (67.6%), Cleaning & Maintenance (32.1%), and Food Preparation & Serving (23.4%).
| Occupation | Male | Female |
| Healthcare Support | 71 (32.4%) | 148 (67.6%) |
| Security & Protection | 176 (100.0%) | 0 (0.0%) |
| Firefighting & Prevention | 119 (100.0%) | 0 (0.0%) |
| Law Enforcement | 57 (100.0%) | 0 (0.0%) |
| Food Preparation & Serving | 183 (76.6%) | 56 (23.4%) |
| Cleaning & Maintenance | 248 (67.9%) | 117 (32.1%) |
| Personal Care & Service | 206 (78.0%) | 58 (22.0%) |
| Total (Category) | 884 (70.0%) | 379 (30.0%) |
| Total (Overall) | 2,242 (53.5%) | 1,952 (46.5%) |
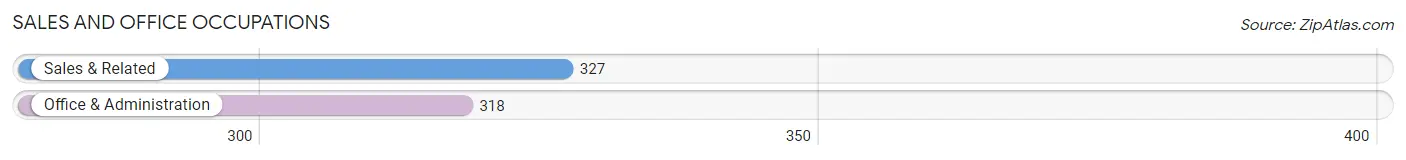
Sales and Office Occupations
The most common Sales and Office occupations in Newberry are Sales & Related (327 | 7.8%), and Office & Administration (318 | 7.6%).
Sales and Office Occupations by Sex
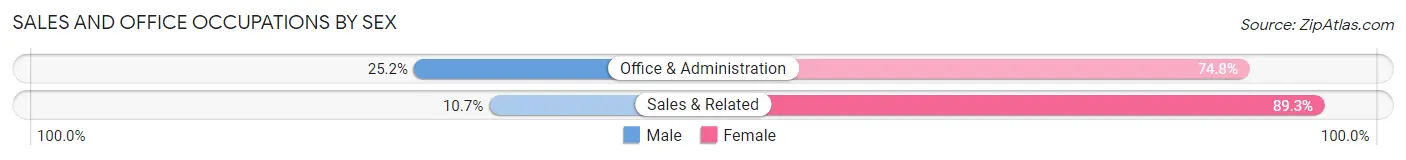
| Occupation | Male | Female |
| Sales & Related | 35 (10.7%) | 292 (89.3%) |
| Office & Administration | 80 (25.2%) | 238 (74.8%) |
| Total (Category) | 115 (17.8%) | 530 (82.2%) |
| Total (Overall) | 2,242 (53.5%) | 1,952 (46.5%) |
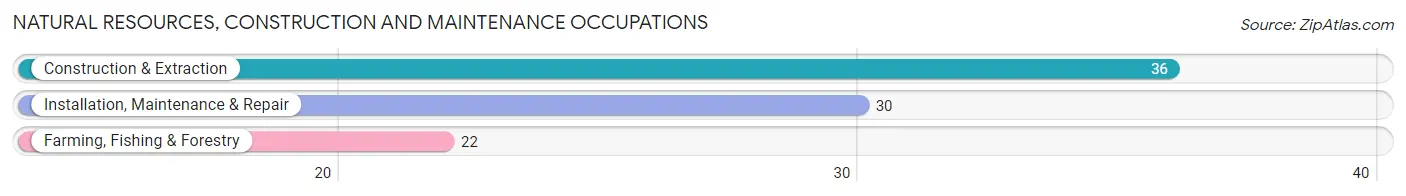
Natural Resources, Construction and Maintenance Occupations
The most common Natural Resources, Construction and Maintenance occupations in Newberry are Construction & Extraction (36 | 0.9%), Installation, Maintenance & Repair (30 | 0.7%), and Farming, Fishing & Forestry (22 | 0.5%).
Natural Resources, Construction and Maintenance Occupations by Sex
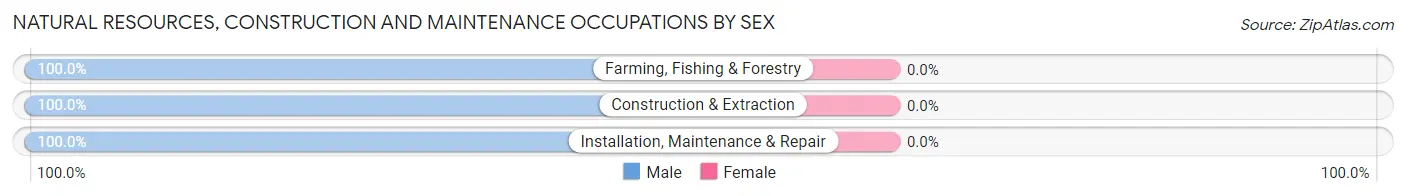
| Occupation | Male | Female |
| Farming, Fishing & Forestry | 22 (100.0%) | 0 (0.0%) |
| Construction & Extraction | 36 (100.0%) | 0 (0.0%) |
| Installation, Maintenance & Repair | 30 (100.0%) | 0 (0.0%) |
| Total (Category) | 88 (100.0%) | 0 (0.0%) |
| Total (Overall) | 2,242 (53.5%) | 1,952 (46.5%) |
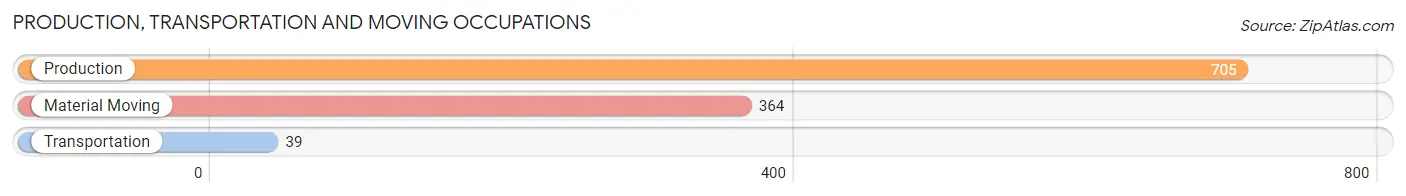
Production, Transportation and Moving Occupations
The most common Production, Transportation and Moving occupations in Newberry are Production (705 | 16.8%), Material Moving (364 | 8.7%), and Transportation (39 | 0.9%).
Production, Transportation and Moving Occupations by Sex
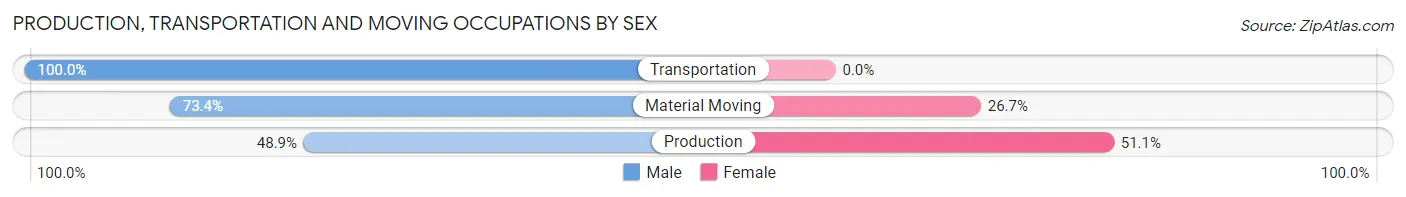
| Occupation | Male | Female |
| Production | 345 (48.9%) | 360 (51.1%) |
| Transportation | 39 (100.0%) | 0 (0.0%) |
| Material Moving | 267 (73.4%) | 97 (26.7%) |
| Total (Category) | 651 (58.8%) | 457 (41.2%) |
| Total (Overall) | 2,242 (53.5%) | 1,952 (46.5%) |
Employment Industries by Sex in Newberry
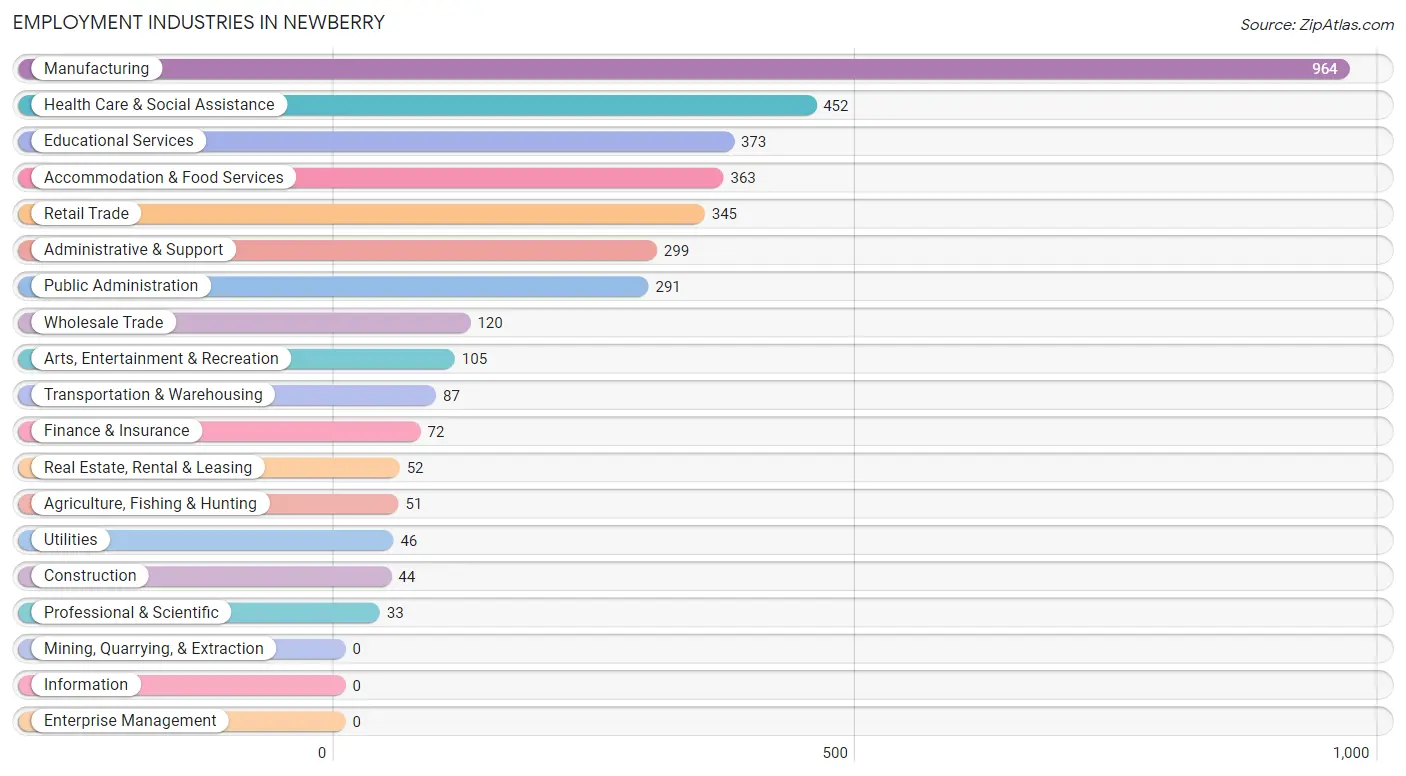
Employment Industries in Newberry
The major employment industries in Newberry include Manufacturing (964 | 23.0%), Health Care & Social Assistance (452 | 10.8%), Educational Services (373 | 8.9%), Accommodation & Food Services (363 | 8.7%), and Retail Trade (345 | 8.2%).
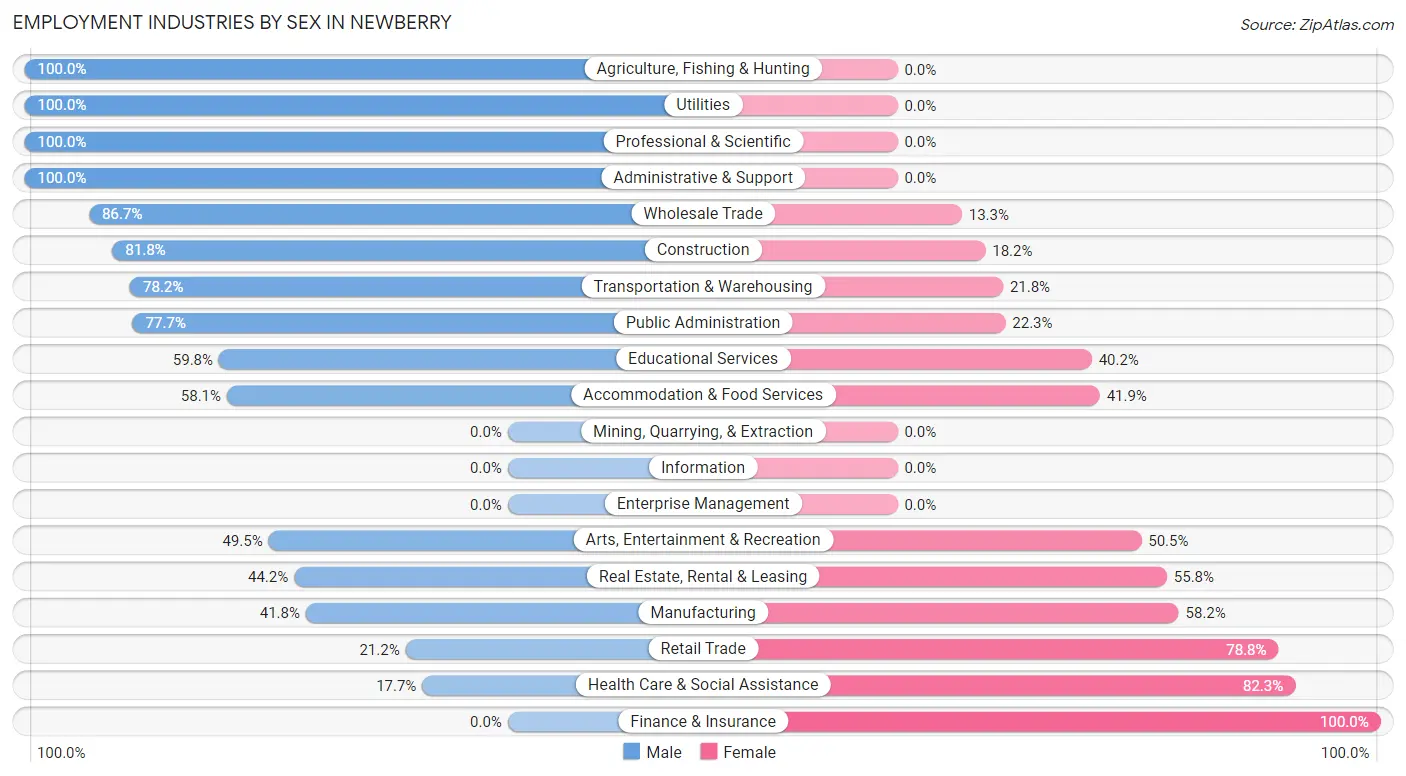
Employment Industries by Sex in Newberry
The Newberry industries that see more men than women are Agriculture, Fishing & Hunting (100.0%), Utilities (100.0%), and Professional & Scientific (100.0%), whereas the industries that tend to have a higher number of women are Finance & Insurance (100.0%), Health Care & Social Assistance (82.3%), and Retail Trade (78.8%).
| Industry | Male | Female |
| Agriculture, Fishing & Hunting | 51 (100.0%) | 0 (0.0%) |
| Mining, Quarrying, & Extraction | 0 (0.0%) | 0 (0.0%) |
| Construction | 36 (81.8%) | 8 (18.2%) |
| Manufacturing | 403 (41.8%) | 561 (58.2%) |
| Wholesale Trade | 104 (86.7%) | 16 (13.3%) |
| Retail Trade | 73 (21.2%) | 272 (78.8%) |
| Transportation & Warehousing | 68 (78.2%) | 19 (21.8%) |
| Utilities | 46 (100.0%) | 0 (0.0%) |
| Information | 0 (0.0%) | 0 (0.0%) |
| Finance & Insurance | 0 (0.0%) | 72 (100.0%) |
| Real Estate, Rental & Leasing | 23 (44.2%) | 29 (55.8%) |
| Professional & Scientific | 33 (100.0%) | 0 (0.0%) |
| Enterprise Management | 0 (0.0%) | 0 (0.0%) |
| Administrative & Support | 299 (100.0%) | 0 (0.0%) |
| Educational Services | 223 (59.8%) | 150 (40.2%) |
| Health Care & Social Assistance | 80 (17.7%) | 372 (82.3%) |
| Arts, Entertainment & Recreation | 52 (49.5%) | 53 (50.5%) |
| Accommodation & Food Services | 211 (58.1%) | 152 (41.9%) |
| Public Administration | 226 (77.7%) | 65 (22.3%) |
| Total | 2,242 (53.5%) | 1,952 (46.5%) |
Education in Newberry
School Enrollment in Newberry
The most common levels of schooling among the 2,867 students in Newberry are college / undergraduate (1,033 | 36.0%), middle school (678 | 23.6%), and elementary school (519 | 18.1%).
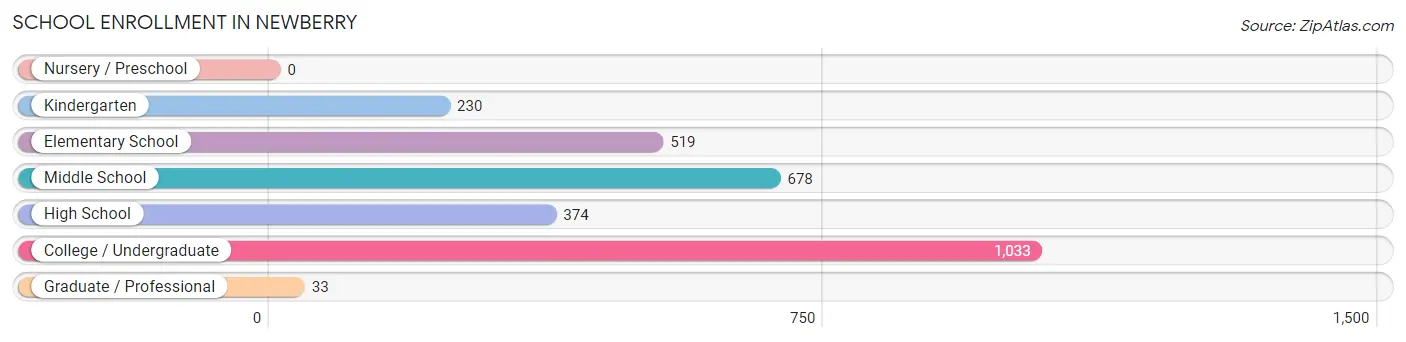
| School Level | # Students | % Students |
| Nursery / Preschool | 0 | 0.0% |
| Kindergarten | 230 | 8.0% |
| Elementary School | 519 | 18.1% |
| Middle School | 678 | 23.6% |
| High School | 374 | 13.0% |
| College / Undergraduate | 1,033 | 36.0% |
| Graduate / Professional | 33 | 1.1% |
| Total | 2,867 | 100.0% |
School Enrollment by Age by Funding Source in Newberry
Out of a total of 2,867 students who are enrolled in schools in Newberry, 960 (33.5%) attend a private institution, while the remaining 1,907 (66.5%) are enrolled in public schools. The age group of 18 to 19 year olds has the highest likelihood of being enrolled in private schools, with 484 (90.1% in the age bracket) enrolled. Conversely, the age group of 25 to 34 year olds has the lowest likelihood of being enrolled in a private school, with 30 (100.0% in the age bracket) attending a public institution.
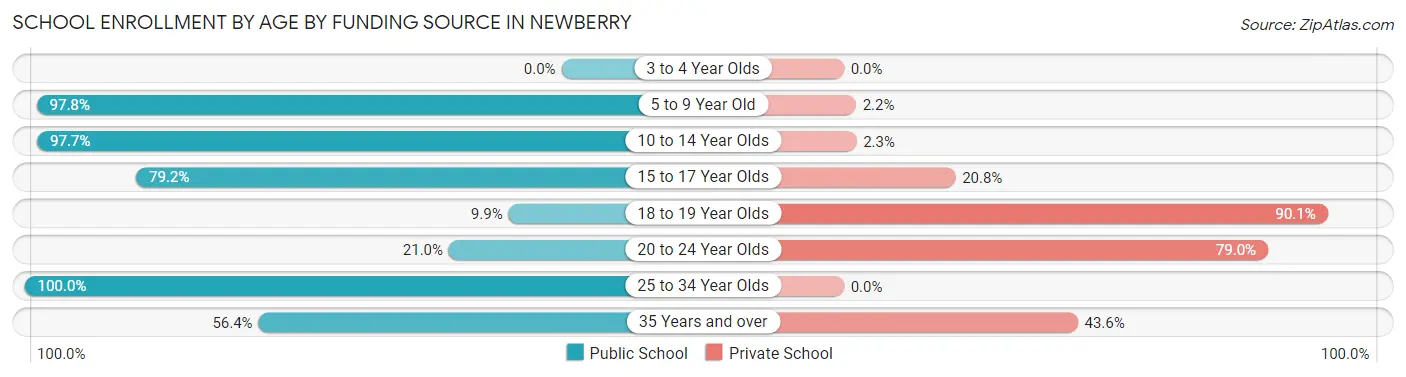
| Age Bracket | Public School | Private School |
| 3 to 4 Year Olds | 0 (0.0%) | 0 (0.0%) |
| 5 to 9 Year Old | 699 (97.8%) | 16 (2.2%) |
| 10 to 14 Year Olds | 753 (97.7%) | 18 (2.3%) |
| 15 to 17 Year Olds | 225 (79.2%) | 59 (20.8%) |
| 18 to 19 Year Olds | 53 (9.9%) | 484 (90.1%) |
| 20 to 24 Year Olds | 90 (21.0%) | 339 (79.0%) |
| 25 to 34 Year Olds | 30 (100.0%) | 0 (0.0%) |
| 35 Years and over | 57 (56.4%) | 44 (43.6%) |
| Total | 1,907 (66.5%) | 960 (33.5%) |
Educational Attainment by Field of Study in Newberry
Business (243 | 16.0%), education (235 | 15.5%), arts & humanities (232 | 15.3%), social sciences (162 | 10.7%), and science & technology (124 | 8.2%) are the most common fields of study among 1,518 individuals in Newberry who have obtained a bachelor's degree or higher.
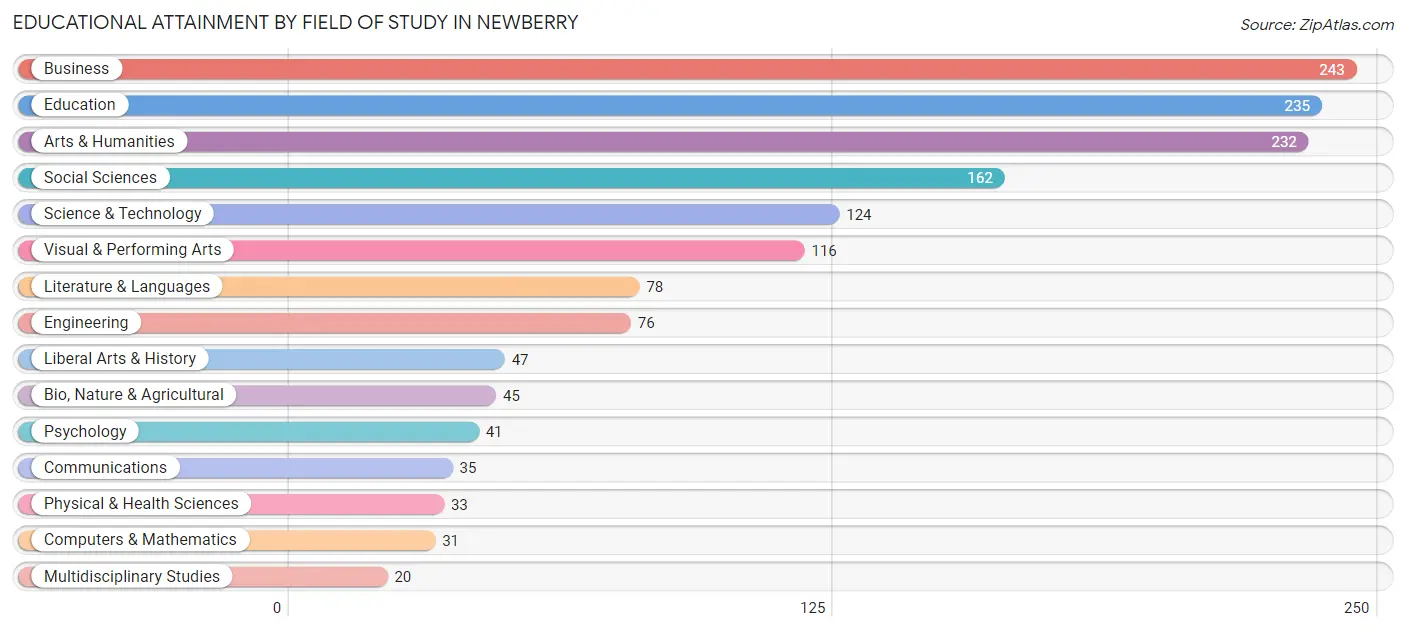
| Field of Study | # Graduates | % Graduates |
| Computers & Mathematics | 31 | 2.0% |
| Bio, Nature & Agricultural | 45 | 3.0% |
| Physical & Health Sciences | 33 | 2.2% |
| Psychology | 41 | 2.7% |
| Social Sciences | 162 | 10.7% |
| Engineering | 76 | 5.0% |
| Multidisciplinary Studies | 20 | 1.3% |
| Science & Technology | 124 | 8.2% |
| Business | 243 | 16.0% |
| Education | 235 | 15.5% |
| Literature & Languages | 78 | 5.1% |
| Liberal Arts & History | 47 | 3.1% |
| Visual & Performing Arts | 116 | 7.6% |
| Communications | 35 | 2.3% |
| Arts & Humanities | 232 | 15.3% |
| Total | 1,518 | 100.0% |
Transportation & Commute in Newberry
Vehicle Availability by Sex in Newberry
The most prevalent vehicle ownership categories in Newberry are males with 2 vehicles (1,019, accounting for 48.5%) and females with 2 vehicles (571, making up 61.1%).
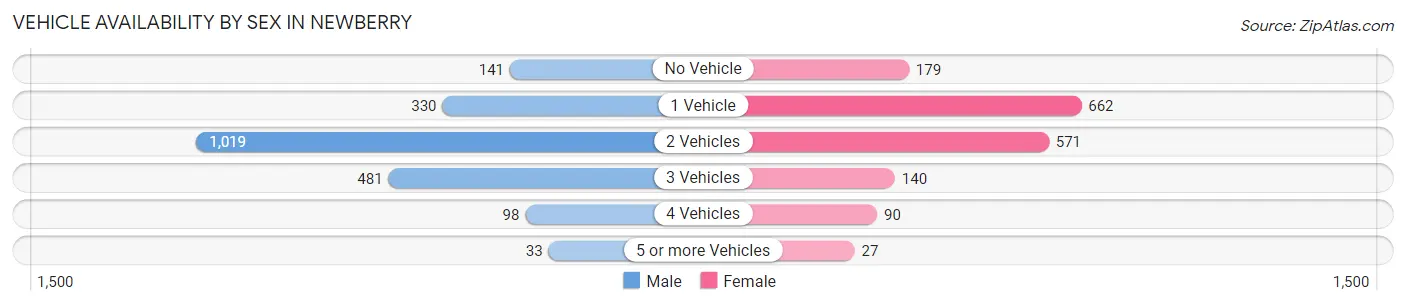
| Vehicles Available | Male | Female |
| No Vehicle | 141 (6.7%) | 179 (10.7%) |
| 1 Vehicle | 330 (15.7%) | 662 (39.7%) |
| 2 Vehicles | 1,019 (48.5%) | 571 (34.2%) |
| 3 Vehicles | 481 (22.9%) | 140 (8.4%) |
| 4 Vehicles | 98 (4.7%) | 90 (5.4%) |
| 5 or more Vehicles | 33 (1.6%) | 27 (1.6%) |
| Total | 2,102 (100.0%) | 1,669 (100.0%) |
Commute Time in Newberry
The most frequently occuring commute durations in Newberry are 10 to 14 minutes (894 commuters, 22.8%), 5 to 9 minutes (769 commuters, 19.7%), and 45 to 59 minutes (478 commuters, 12.2%).
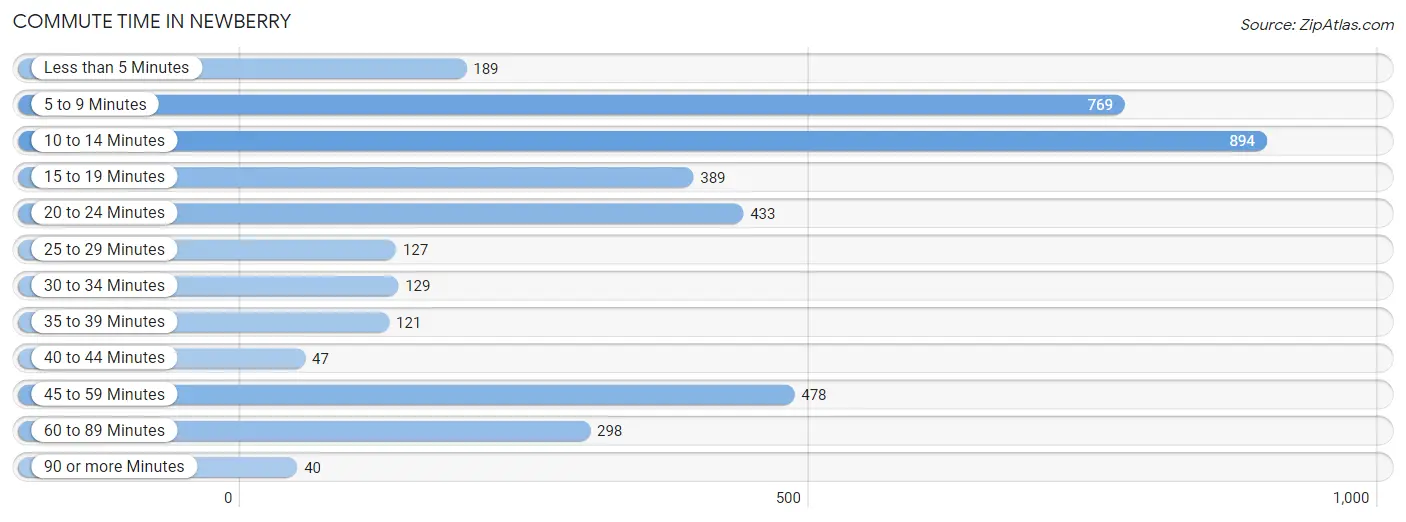
| Commute Time | # Commuters | % Commuters |
| Less than 5 Minutes | 189 | 4.8% |
| 5 to 9 Minutes | 769 | 19.7% |
| 10 to 14 Minutes | 894 | 22.8% |
| 15 to 19 Minutes | 389 | 9.9% |
| 20 to 24 Minutes | 433 | 11.1% |
| 25 to 29 Minutes | 127 | 3.2% |
| 30 to 34 Minutes | 129 | 3.3% |
| 35 to 39 Minutes | 121 | 3.1% |
| 40 to 44 Minutes | 47 | 1.2% |
| 45 to 59 Minutes | 478 | 12.2% |
| 60 to 89 Minutes | 298 | 7.6% |
| 90 or more Minutes | 40 | 1.0% |
Commute Time by Sex in Newberry
The most common commute times in Newberry are 10 to 14 minutes (568 commuters, 26.0%) for males and 5 to 9 minutes (444 commuters, 25.7%) for females.
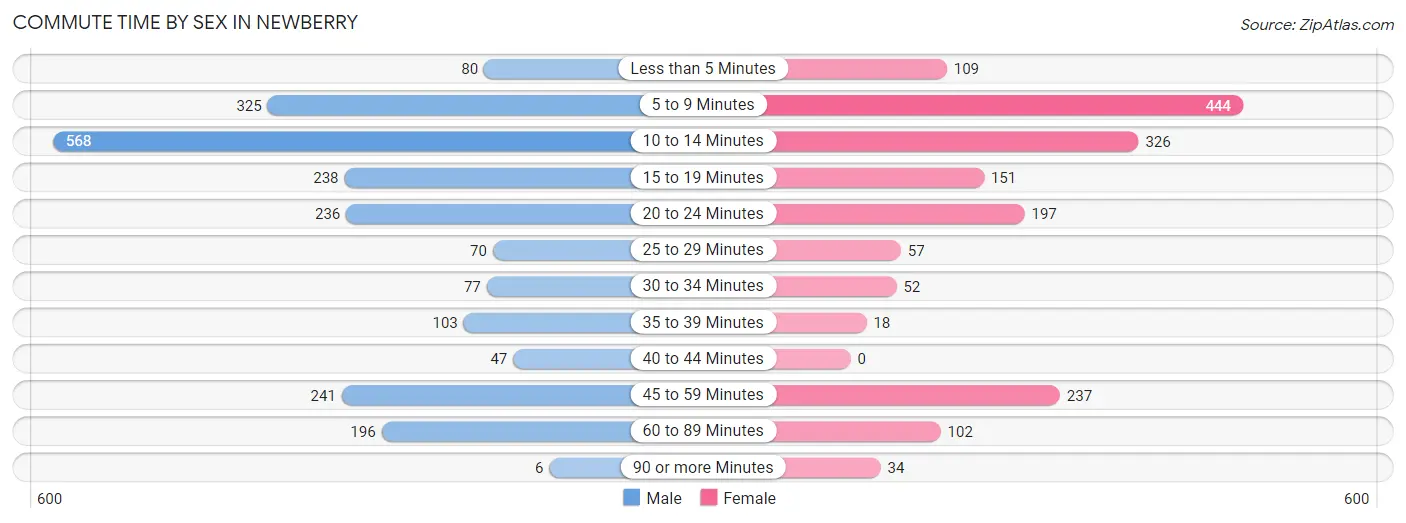
| Commute Time | Male | Female |
| Less than 5 Minutes | 80 (3.7%) | 109 (6.3%) |
| 5 to 9 Minutes | 325 (14.9%) | 444 (25.7%) |
| 10 to 14 Minutes | 568 (26.0%) | 326 (18.9%) |
| 15 to 19 Minutes | 238 (10.9%) | 151 (8.7%) |
| 20 to 24 Minutes | 236 (10.8%) | 197 (11.4%) |
| 25 to 29 Minutes | 70 (3.2%) | 57 (3.3%) |
| 30 to 34 Minutes | 77 (3.5%) | 52 (3.0%) |
| 35 to 39 Minutes | 103 (4.7%) | 18 (1.0%) |
| 40 to 44 Minutes | 47 (2.1%) | 0 (0.0%) |
| 45 to 59 Minutes | 241 (11.0%) | 237 (13.7%) |
| 60 to 89 Minutes | 196 (9.0%) | 102 (5.9%) |
| 90 or more Minutes | 6 (0.3%) | 34 (2.0%) |
Time of Departure to Work by Sex in Newberry
The most frequent times of departure to work in Newberry are 7:00 AM to 7:29 AM (375, 17.2%) for males and 7:00 AM to 7:29 AM (300, 17.4%) for females.
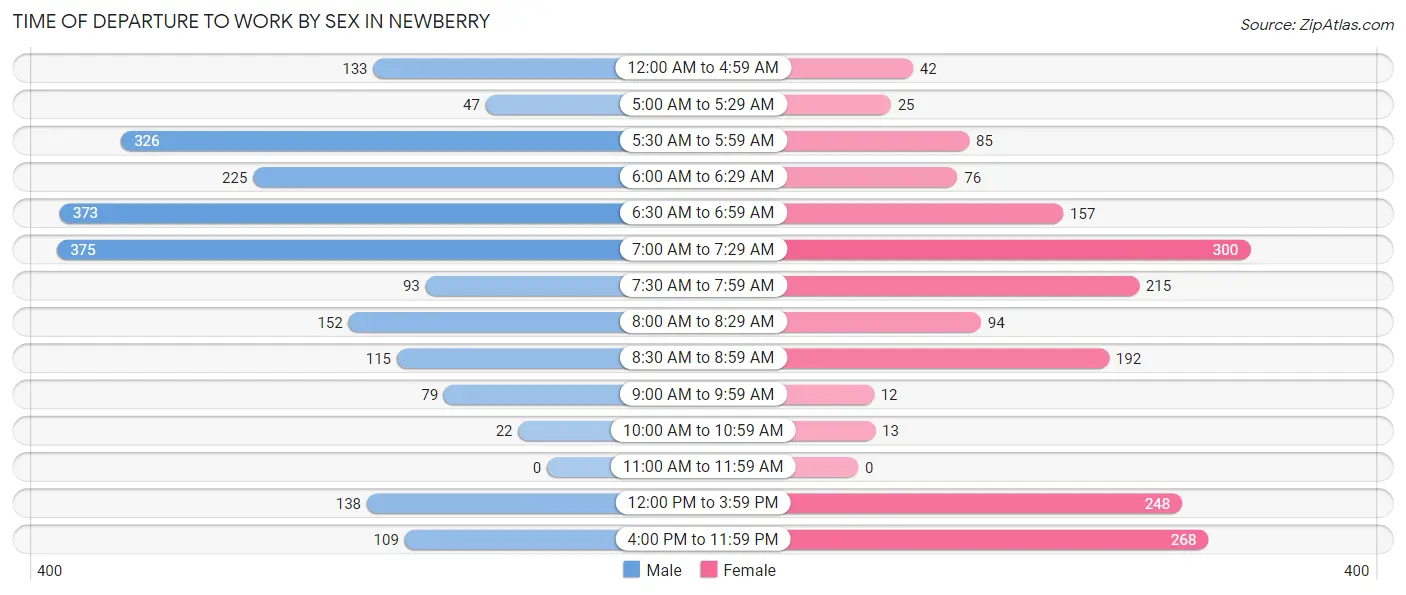
| Time of Departure | Male | Female |
| 12:00 AM to 4:59 AM | 133 (6.1%) | 42 (2.4%) |
| 5:00 AM to 5:29 AM | 47 (2.1%) | 25 (1.5%) |
| 5:30 AM to 5:59 AM | 326 (14.9%) | 85 (4.9%) |
| 6:00 AM to 6:29 AM | 225 (10.3%) | 76 (4.4%) |
| 6:30 AM to 6:59 AM | 373 (17.1%) | 157 (9.1%) |
| 7:00 AM to 7:29 AM | 375 (17.2%) | 300 (17.4%) |
| 7:30 AM to 7:59 AM | 93 (4.3%) | 215 (12.4%) |
| 8:00 AM to 8:29 AM | 152 (7.0%) | 94 (5.4%) |
| 8:30 AM to 8:59 AM | 115 (5.3%) | 192 (11.1%) |
| 9:00 AM to 9:59 AM | 79 (3.6%) | 12 (0.7%) |
| 10:00 AM to 10:59 AM | 22 (1.0%) | 13 (0.7%) |
| 11:00 AM to 11:59 AM | 0 (0.0%) | 0 (0.0%) |
| 12:00 PM to 3:59 PM | 138 (6.3%) | 248 (14.4%) |
| 4:00 PM to 11:59 PM | 109 (5.0%) | 268 (15.5%) |
| Total | 2,187 (100.0%) | 1,727 (100.0%) |
Housing Occupancy in Newberry
Occupancy by Ownership in Newberry
Of the total 3,916 dwellings in Newberry, owner-occupied units account for 2,080 (53.1%), while renter-occupied units make up 1,836 (46.9%).
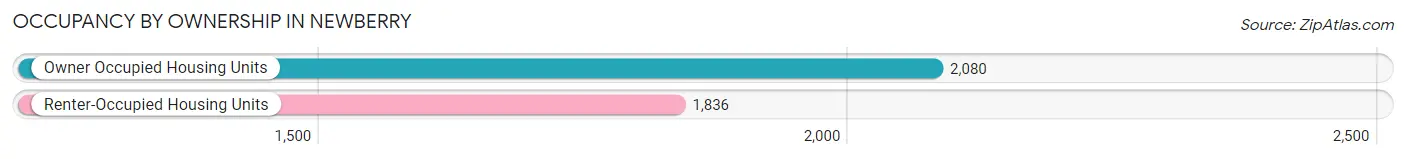
| Occupancy | # Housing Units | % Housing Units |
| Owner Occupied Housing Units | 2,080 | 53.1% |
| Renter-Occupied Housing Units | 1,836 | 46.9% |
| Total Occupied Housing Units | 3,916 | 100.0% |
Occupancy by Household Size in Newberry
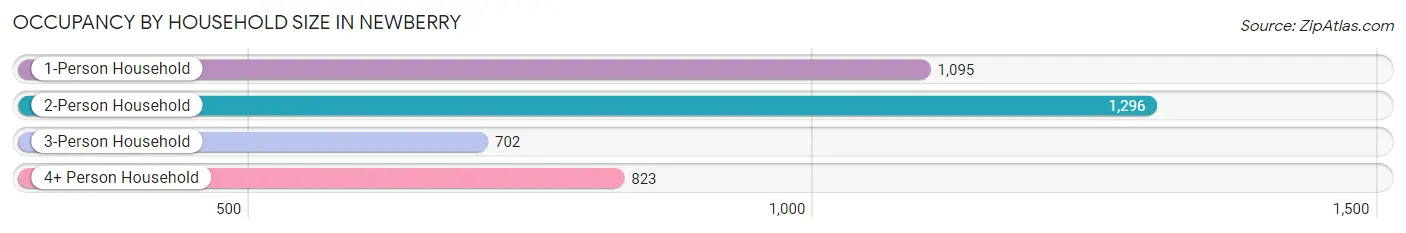
| Household Size | # Housing Units | % Housing Units |
| 1-Person Household | 1,095 | 28.0% |
| 2-Person Household | 1,296 | 33.1% |
| 3-Person Household | 702 | 17.9% |
| 4+ Person Household | 823 | 21.0% |
| Total Housing Units | 3,916 | 100.0% |
Occupancy by Ownership by Household Size in Newberry
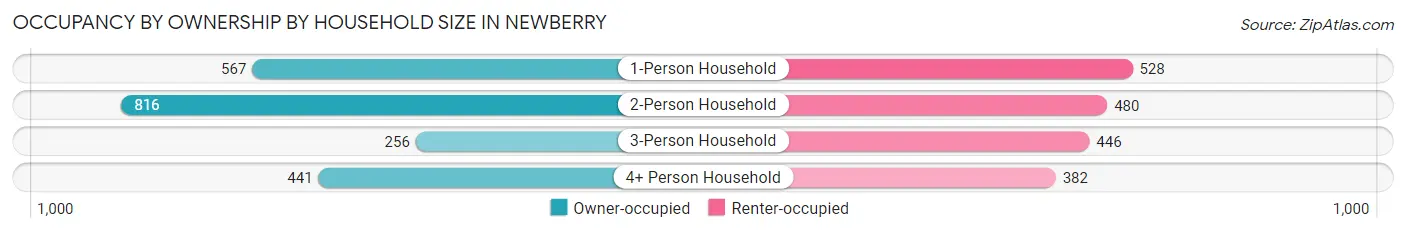
| Household Size | Owner-occupied | Renter-occupied |
| 1-Person Household | 567 (51.8%) | 528 (48.2%) |
| 2-Person Household | 816 (63.0%) | 480 (37.0%) |
| 3-Person Household | 256 (36.5%) | 446 (63.5%) |
| 4+ Person Household | 441 (53.6%) | 382 (46.4%) |
| Total Housing Units | 2,080 (53.1%) | 1,836 (46.9%) |
Occupancy by Educational Attainment in Newberry
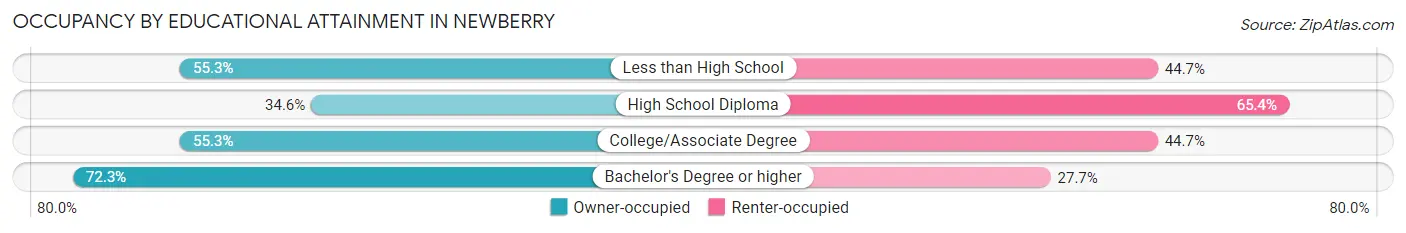
| Household Size | Owner-occupied | Renter-occupied |
| Less than High School | 421 (55.3%) | 340 (44.7%) |
| High School Diploma | 356 (34.6%) | 674 (65.4%) |
| College/Associate Degree | 762 (55.3%) | 615 (44.7%) |
| Bachelor's Degree or higher | 541 (72.3%) | 207 (27.7%) |
Occupancy by Age of Householder in Newberry
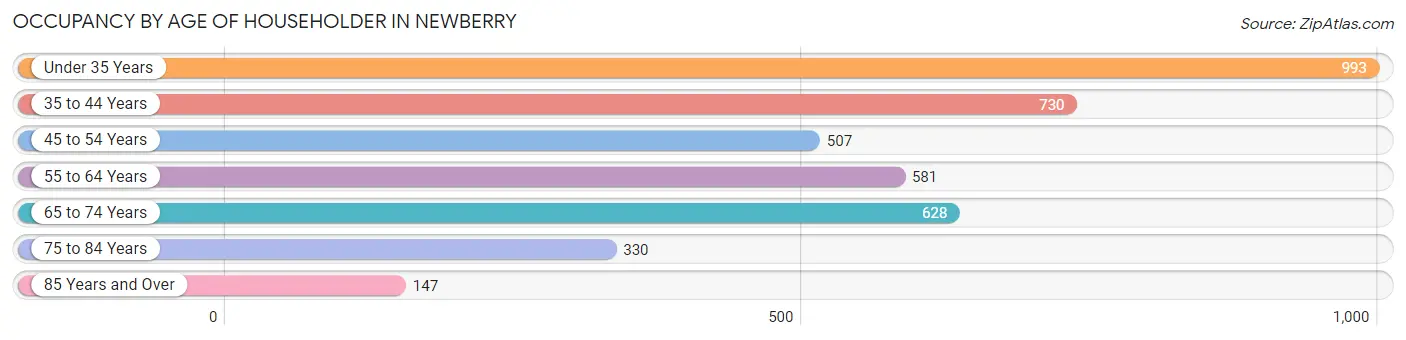
| Age Bracket | # Households | % Households |
| Under 35 Years | 993 | 25.4% |
| 35 to 44 Years | 730 | 18.6% |
| 45 to 54 Years | 507 | 13.0% |
| 55 to 64 Years | 581 | 14.8% |
| 65 to 74 Years | 628 | 16.0% |
| 75 to 84 Years | 330 | 8.4% |
| 85 Years and Over | 147 | 3.7% |
| Total | 3,916 | 100.0% |
Housing Finances in Newberry
Median Income by Occupancy in Newberry
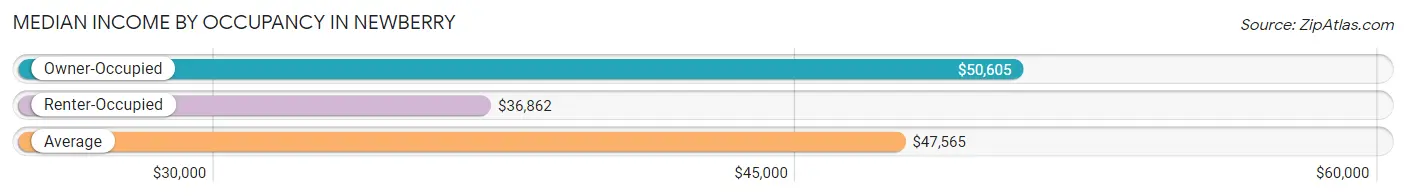
| Occupancy Type | # Households | Median Income |
| Owner-Occupied | 2,080 (53.1%) | $50,605 |
| Renter-Occupied | 1,836 (46.9%) | $36,862 |
| Average | 3,916 (100.0%) | $47,565 |
Occupancy by Householder Income Bracket in Newberry
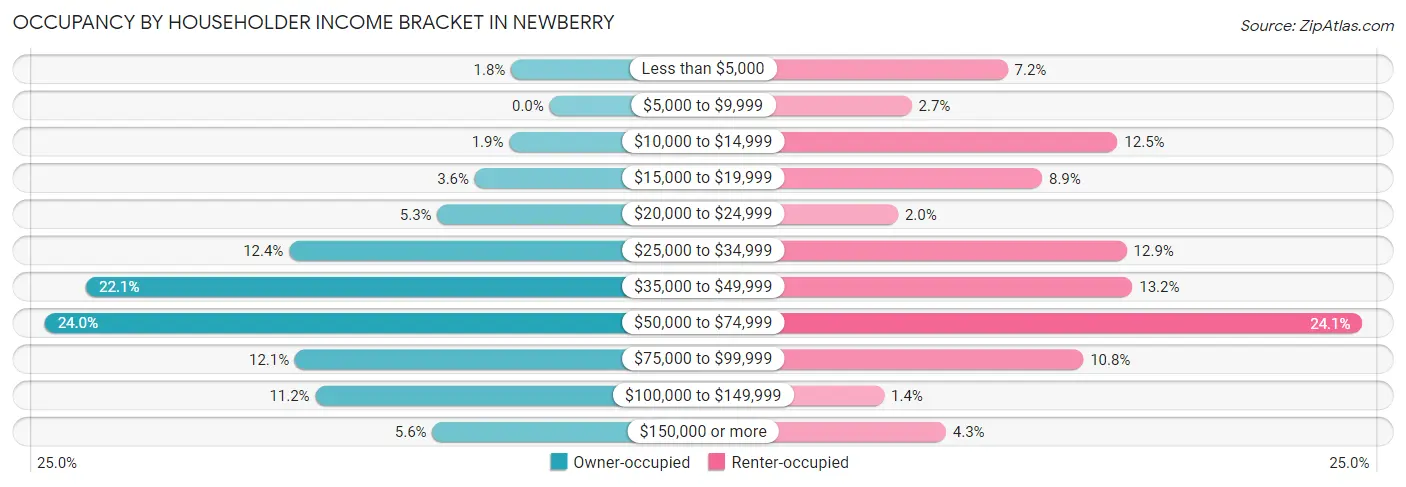
| Income Bracket | Owner-occupied | Renter-occupied |
| Less than $5,000 | 38 (1.8%) | 133 (7.2%) |
| $5,000 to $9,999 | 0 (0.0%) | 49 (2.7%) |
| $10,000 to $14,999 | 40 (1.9%) | 229 (12.5%) |
| $15,000 to $19,999 | 74 (3.6%) | 163 (8.9%) |
| $20,000 to $24,999 | 111 (5.3%) | 37 (2.0%) |
| $25,000 to $34,999 | 258 (12.4%) | 237 (12.9%) |
| $35,000 to $49,999 | 459 (22.1%) | 242 (13.2%) |
| $50,000 to $74,999 | 500 (24.0%) | 443 (24.1%) |
| $75,000 to $99,999 | 252 (12.1%) | 199 (10.8%) |
| $100,000 to $149,999 | 232 (11.2%) | 25 (1.4%) |
| $150,000 or more | 116 (5.6%) | 79 (4.3%) |
| Total | 2,080 (100.0%) | 1,836 (100.0%) |
Monthly Housing Cost Tiers in Newberry
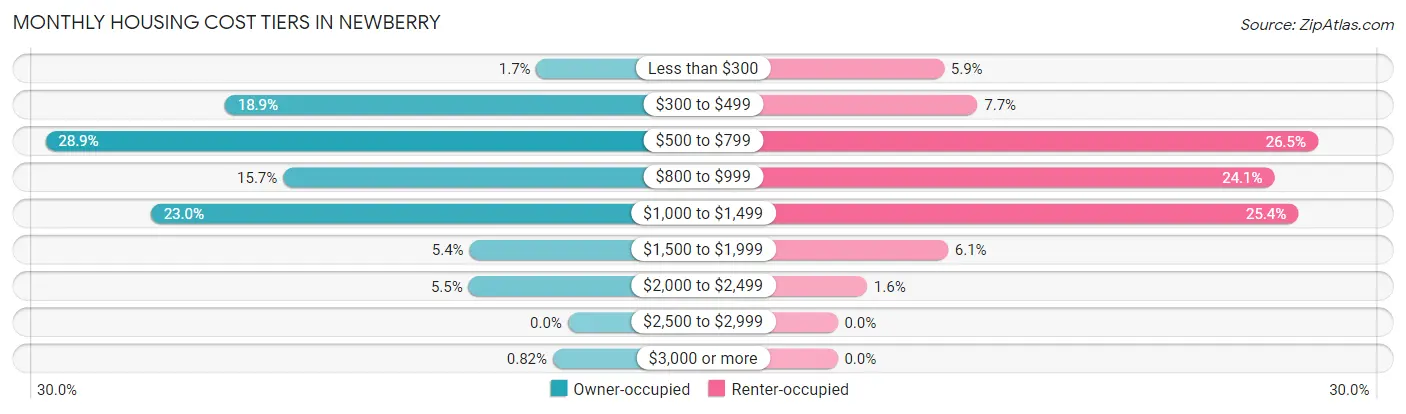
| Monthly Cost | Owner-occupied | Renter-occupied |
| Less than $300 | 36 (1.7%) | 108 (5.9%) |
| $300 to $499 | 394 (18.9%) | 142 (7.7%) |
| $500 to $799 | 600 (28.8%) | 487 (26.5%) |
| $800 to $999 | 327 (15.7%) | 443 (24.1%) |
| $1,000 to $1,499 | 479 (23.0%) | 467 (25.4%) |
| $1,500 to $1,999 | 113 (5.4%) | 112 (6.1%) |
| $2,000 to $2,499 | 114 (5.5%) | 30 (1.6%) |
| $2,500 to $2,999 | 0 (0.0%) | 0 (0.0%) |
| $3,000 or more | 17 (0.8%) | 0 (0.0%) |
| Total | 2,080 (100.0%) | 1,836 (100.0%) |
Physical Housing Characteristics in Newberry
Housing Structures in Newberry
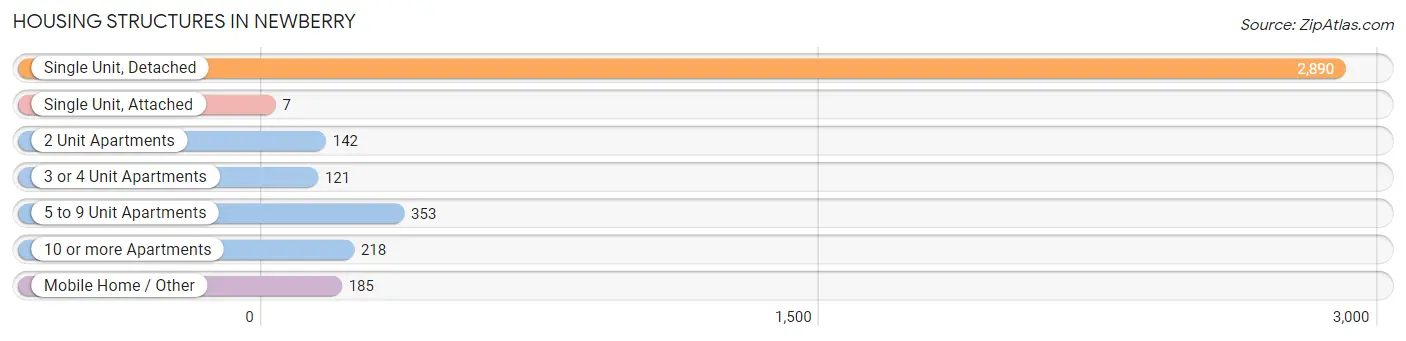
| Structure Type | # Housing Units | % Housing Units |
| Single Unit, Detached | 2,890 | 73.8% |
| Single Unit, Attached | 7 | 0.2% |
| 2 Unit Apartments | 142 | 3.6% |
| 3 or 4 Unit Apartments | 121 | 3.1% |
| 5 to 9 Unit Apartments | 353 | 9.0% |
| 10 or more Apartments | 218 | 5.6% |
| Mobile Home / Other | 185 | 4.7% |
| Total | 3,916 | 100.0% |
Housing Structures by Occupancy in Newberry
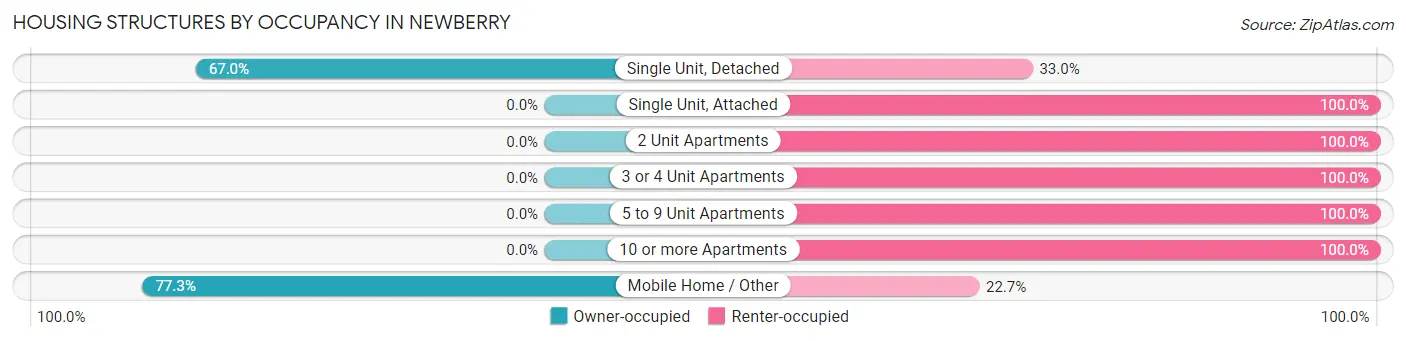
| Structure Type | Owner-occupied | Renter-occupied |
| Single Unit, Detached | 1,937 (67.0%) | 953 (33.0%) |
| Single Unit, Attached | 0 (0.0%) | 7 (100.0%) |
| 2 Unit Apartments | 0 (0.0%) | 142 (100.0%) |
| 3 or 4 Unit Apartments | 0 (0.0%) | 121 (100.0%) |
| 5 to 9 Unit Apartments | 0 (0.0%) | 353 (100.0%) |
| 10 or more Apartments | 0 (0.0%) | 218 (100.0%) |
| Mobile Home / Other | 143 (77.3%) | 42 (22.7%) |
| Total | 2,080 (53.1%) | 1,836 (46.9%) |
Housing Structures by Number of Rooms in Newberry
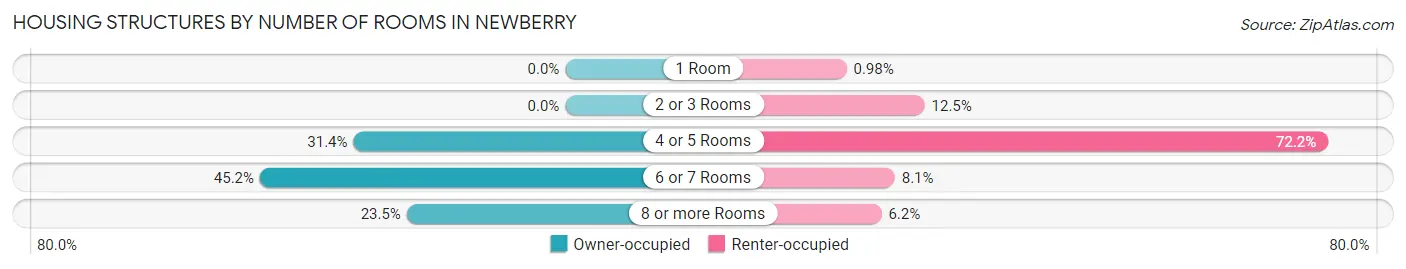
| Number of Rooms | Owner-occupied | Renter-occupied |
| 1 Room | 0 (0.0%) | 18 (1.0%) |
| 2 or 3 Rooms | 0 (0.0%) | 230 (12.5%) |
| 4 or 5 Rooms | 652 (31.4%) | 1,326 (72.2%) |
| 6 or 7 Rooms | 940 (45.2%) | 149 (8.1%) |
| 8 or more Rooms | 488 (23.5%) | 113 (6.1%) |
| Total | 2,080 (100.0%) | 1,836 (100.0%) |
Housing Structure by Heating Type in Newberry
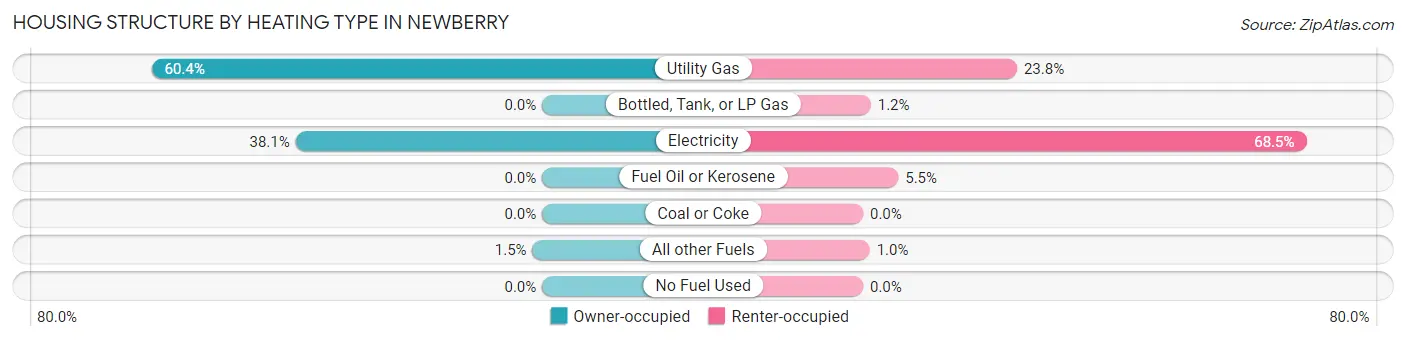
| Heating Type | Owner-occupied | Renter-occupied |
| Utility Gas | 1,256 (60.4%) | 437 (23.8%) |
| Bottled, Tank, or LP Gas | 0 (0.0%) | 22 (1.2%) |
| Electricity | 793 (38.1%) | 1,258 (68.5%) |
| Fuel Oil or Kerosene | 0 (0.0%) | 100 (5.4%) |
| Coal or Coke | 0 (0.0%) | 0 (0.0%) |
| All other Fuels | 31 (1.5%) | 19 (1.0%) |
| No Fuel Used | 0 (0.0%) | 0 (0.0%) |
| Total | 2,080 (100.0%) | 1,836 (100.0%) |
Household Vehicle Usage in Newberry
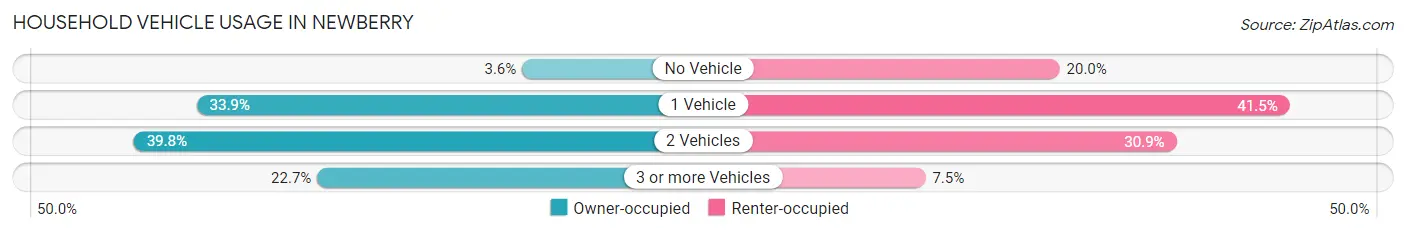
| Vehicles per Household | Owner-occupied | Renter-occupied |
| No Vehicle | 74 (3.6%) | 368 (20.0%) |
| 1 Vehicle | 706 (33.9%) | 762 (41.5%) |
| 2 Vehicles | 828 (39.8%) | 568 (30.9%) |
| 3 or more Vehicles | 472 (22.7%) | 138 (7.5%) |
| Total | 2,080 (100.0%) | 1,836 (100.0%) |
Real Estate & Mortgages in Newberry
Real Estate and Mortgage Overview in Newberry
| Characteristic | Without Mortgage | With Mortgage |
| Housing Units | 978 | 1,102 |
| Median Property Value | $116,800 | $102,300 |
| Median Household Income | $46,809 | $106 |
| Monthly Housing Costs | $518 | $17 |
| Real Estate Taxes | $1,070 | $117 |
Property Value by Mortgage Status in Newberry
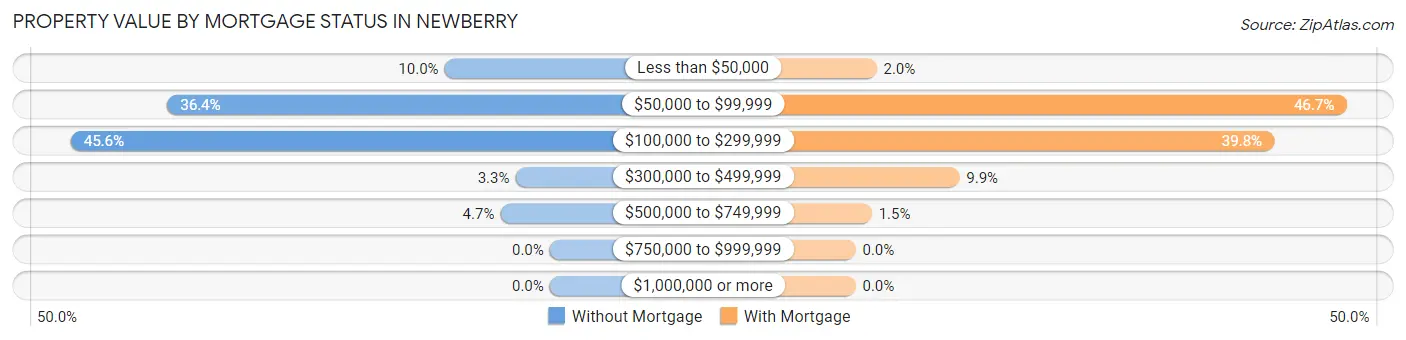
| Property Value | Without Mortgage | With Mortgage |
| Less than $50,000 | 98 (10.0%) | 22 (2.0%) |
| $50,000 to $99,999 | 356 (36.4%) | 515 (46.7%) |
| $100,000 to $299,999 | 446 (45.6%) | 439 (39.8%) |
| $300,000 to $499,999 | 32 (3.3%) | 109 (9.9%) |
| $500,000 to $749,999 | 46 (4.7%) | 17 (1.5%) |
| $750,000 to $999,999 | 0 (0.0%) | 0 (0.0%) |
| $1,000,000 or more | 0 (0.0%) | 0 (0.0%) |
| Total | 978 (100.0%) | 1,102 (100.0%) |
Household Income by Mortgage Status in Newberry
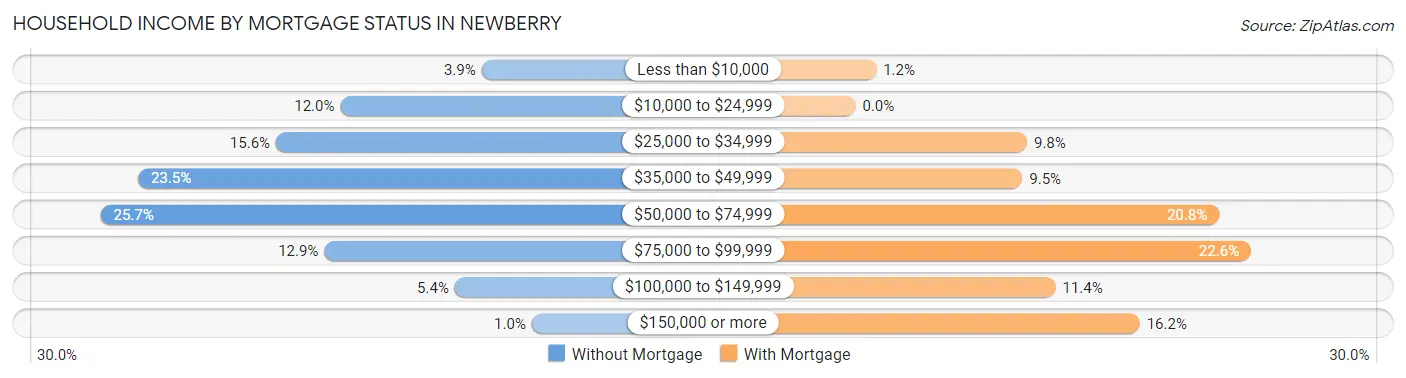
| Household Income | Without Mortgage | With Mortgage |
| Less than $10,000 | 38 (3.9%) | 13 (1.2%) |
| $10,000 to $24,999 | 117 (12.0%) | 0 (0.0%) |
| $25,000 to $34,999 | 153 (15.6%) | 108 (9.8%) |
| $35,000 to $49,999 | 230 (23.5%) | 105 (9.5%) |
| $50,000 to $74,999 | 251 (25.7%) | 229 (20.8%) |
| $75,000 to $99,999 | 126 (12.9%) | 249 (22.6%) |
| $100,000 to $149,999 | 53 (5.4%) | 126 (11.4%) |
| $150,000 or more | 10 (1.0%) | 179 (16.2%) |
| Total | 978 (100.0%) | 1,102 (100.0%) |
Property Value to Household Income Ratio in Newberry
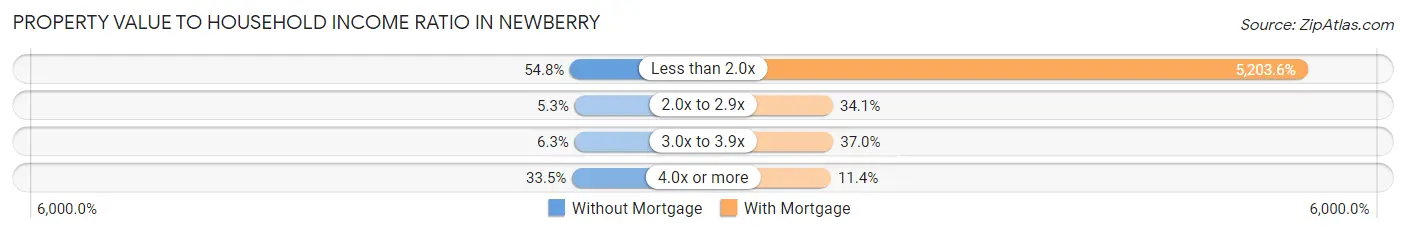
| Value-to-Income Ratio | Without Mortgage | With Mortgage |
| Less than 2.0x | 536 (54.8%) | 57,344 (5,203.6%) |
| 2.0x to 2.9x | 52 (5.3%) | 376 (34.1%) |
| 3.0x to 3.9x | 62 (6.3%) | 408 (37.0%) |
| 4.0x or more | 328 (33.5%) | 126 (11.4%) |
| Total | 978 (100.0%) | 1,102 (100.0%) |
Real Estate Taxes by Mortgage Status in Newberry
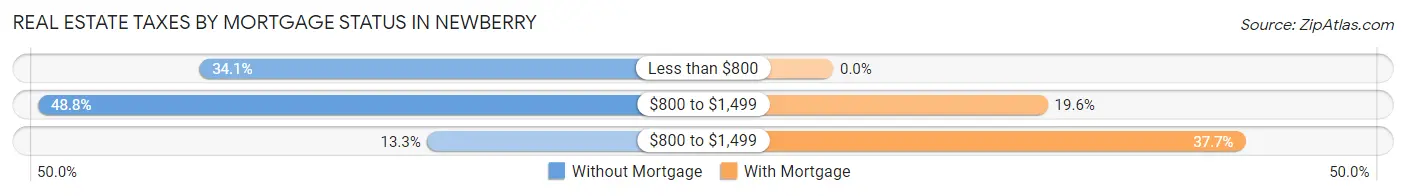
| Property Taxes | Without Mortgage | With Mortgage |
| Less than $800 | 333 (34.1%) | 0 (0.0%) |
| $800 to $1,499 | 477 (48.8%) | 216 (19.6%) |
| $800 to $1,499 | 130 (13.3%) | 415 (37.7%) |
| Total | 978 (100.0%) | 1,102 (100.0%) |
Health & Disability in Newberry
Health Insurance Coverage by Age in Newberry
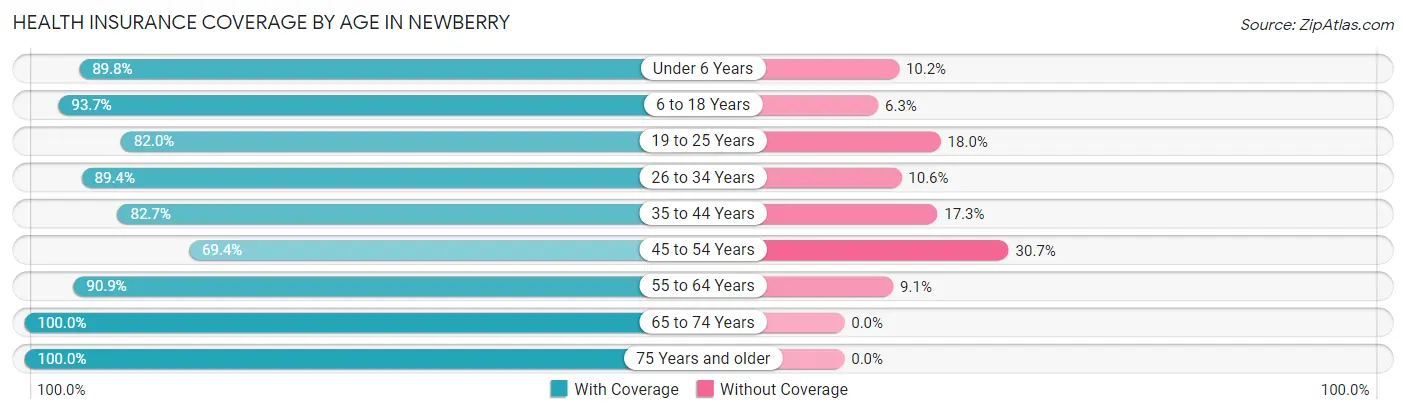
| Age Bracket | With Coverage | Without Coverage |
| Under 6 Years | 661 (89.8%) | 75 (10.2%) |
| 6 to 18 Years | 1,900 (93.7%) | 128 (6.3%) |
| 19 to 25 Years | 1,296 (82.0%) | 284 (18.0%) |
| 26 to 34 Years | 1,067 (89.4%) | 127 (10.6%) |
| 35 to 44 Years | 906 (82.7%) | 190 (17.3%) |
| 45 to 54 Years | 724 (69.4%) | 320 (30.6%) |
| 55 to 64 Years | 1,028 (90.9%) | 103 (9.1%) |
| 65 to 74 Years | 835 (100.0%) | 0 (0.0%) |
| 75 Years and older | 623 (100.0%) | 0 (0.0%) |
| Total | 9,040 (88.0%) | 1,227 (11.9%) |
Health Insurance Coverage by Citizenship Status in Newberry
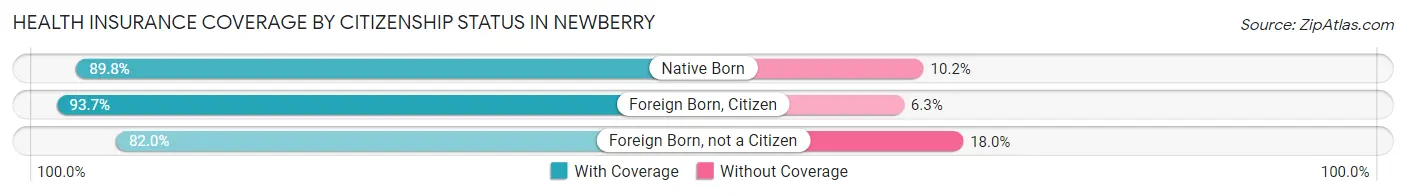
| Citizenship Status | With Coverage | Without Coverage |
| Native Born | 661 (89.8%) | 75 (10.2%) |
| Foreign Born, Citizen | 1,900 (93.7%) | 128 (6.3%) |
| Foreign Born, not a Citizen | 1,296 (82.0%) | 284 (18.0%) |
Health Insurance Coverage by Household Income in Newberry
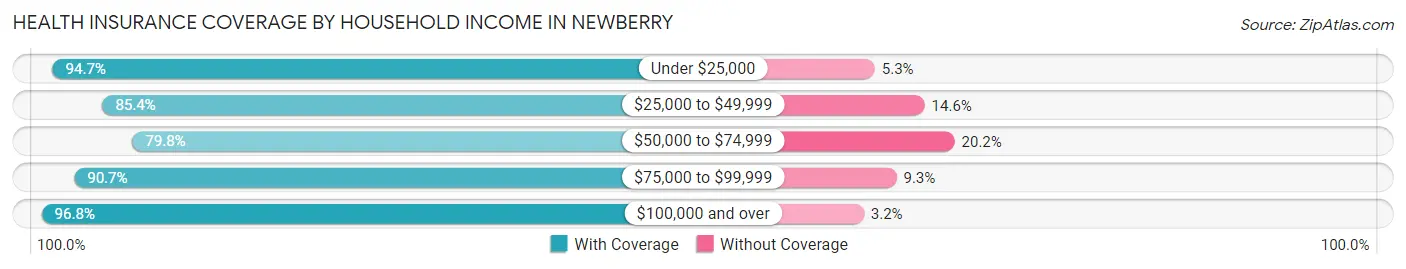
| Household Income | With Coverage | Without Coverage |
| Under $25,000 | 1,836 (94.7%) | 102 (5.3%) |
| $25,000 to $49,999 | 2,278 (85.4%) | 389 (14.6%) |
| $50,000 to $74,999 | 1,971 (79.8%) | 499 (20.2%) |
| $75,000 to $99,999 | 1,041 (90.7%) | 107 (9.3%) |
| $100,000 and over | 1,151 (96.8%) | 38 (3.2%) |
Public vs Private Health Insurance Coverage by Age in Newberry
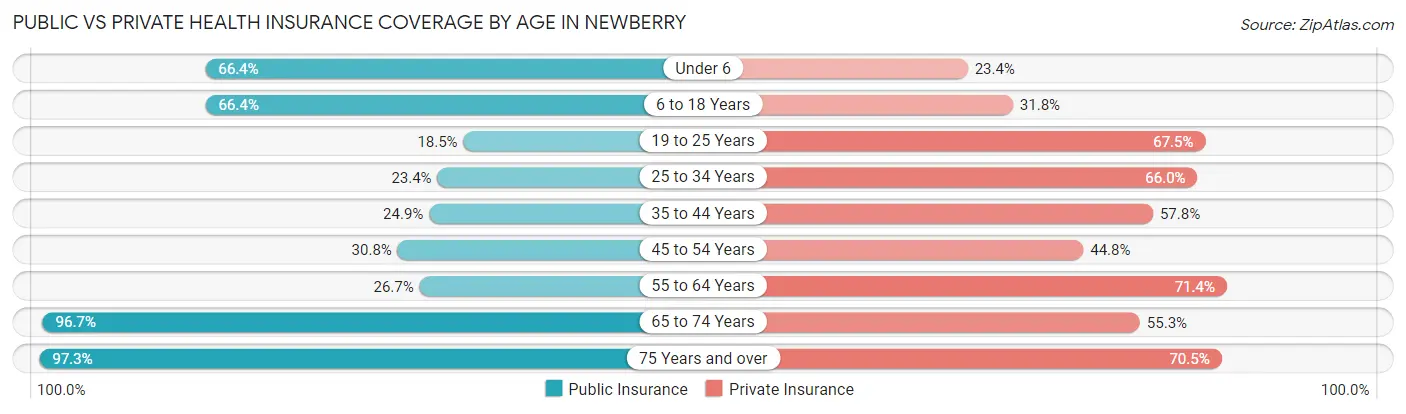
| Age Bracket | Public Insurance | Private Insurance |
| Under 6 | 489 (66.4%) | 172 (23.4%) |
| 6 to 18 Years | 1,347 (66.4%) | 644 (31.8%) |
| 19 to 25 Years | 293 (18.5%) | 1,066 (67.5%) |
| 25 to 34 Years | 279 (23.4%) | 788 (66.0%) |
| 35 to 44 Years | 273 (24.9%) | 633 (57.8%) |
| 45 to 54 Years | 321 (30.7%) | 468 (44.8%) |
| 55 to 64 Years | 302 (26.7%) | 808 (71.4%) |
| 65 to 74 Years | 807 (96.7%) | 462 (55.3%) |
| 75 Years and over | 606 (97.3%) | 439 (70.5%) |
| Total | 4,717 (45.9%) | 5,480 (53.4%) |
Disability Status by Sex by Age in Newberry
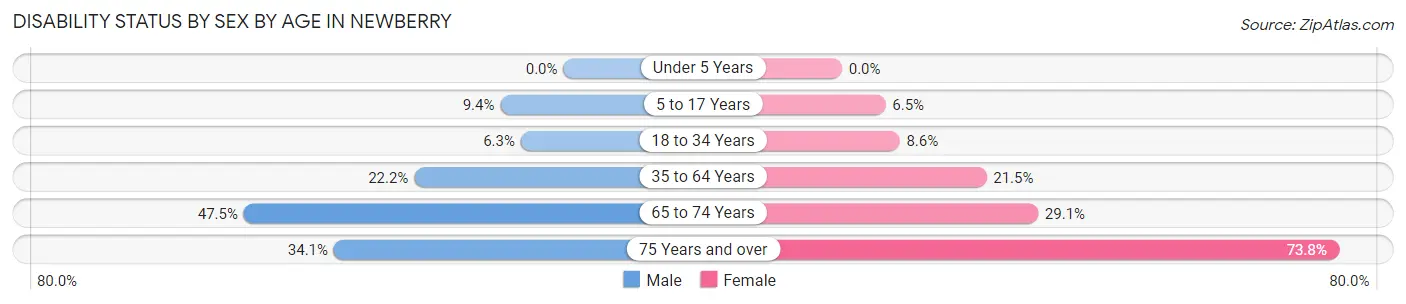
| Age Bracket | Male | Female |
| Under 5 Years | 0 (0.0%) | 0 (0.0%) |
| 5 to 17 Years | 64 (9.4%) | 71 (6.5%) |
| 18 to 34 Years | 95 (6.3%) | 133 (8.6%) |
| 35 to 64 Years | 357 (22.2%) | 356 (21.5%) |
| 65 to 74 Years | 186 (47.4%) | 129 (29.1%) |
| 75 Years and over | 107 (34.1%) | 228 (73.8%) |
Disability Class by Sex by Age in Newberry
Disability Class: Hearing Difficulty
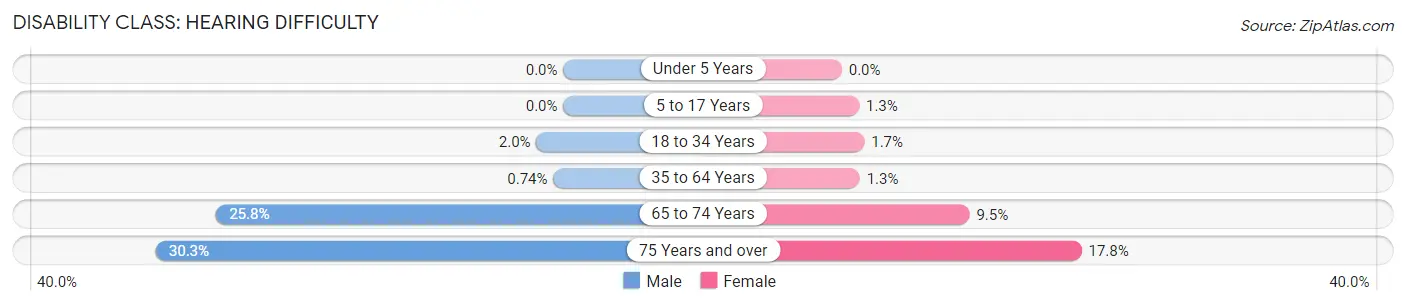
| Age Bracket | Male | Female |
| Under 5 Years | 0 (0.0%) | 0 (0.0%) |
| 5 to 17 Years | 0 (0.0%) | 14 (1.3%) |
| 18 to 34 Years | 30 (2.0%) | 26 (1.7%) |
| 35 to 64 Years | 12 (0.7%) | 22 (1.3%) |
| 65 to 74 Years | 101 (25.8%) | 42 (9.5%) |
| 75 Years and over | 95 (30.2%) | 55 (17.8%) |
Disability Class: Vision Difficulty
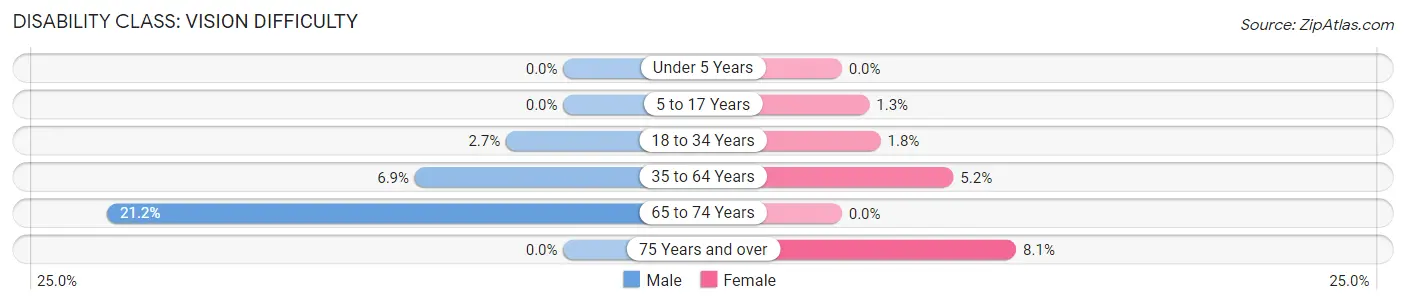
| Age Bracket | Male | Female |
| Under 5 Years | 0 (0.0%) | 0 (0.0%) |
| 5 to 17 Years | 0 (0.0%) | 14 (1.3%) |
| 18 to 34 Years | 40 (2.7%) | 28 (1.8%) |
| 35 to 64 Years | 111 (6.9%) | 86 (5.2%) |
| 65 to 74 Years | 83 (21.2%) | 0 (0.0%) |
| 75 Years and over | 0 (0.0%) | 25 (8.1%) |
Disability Class: Cognitive Difficulty
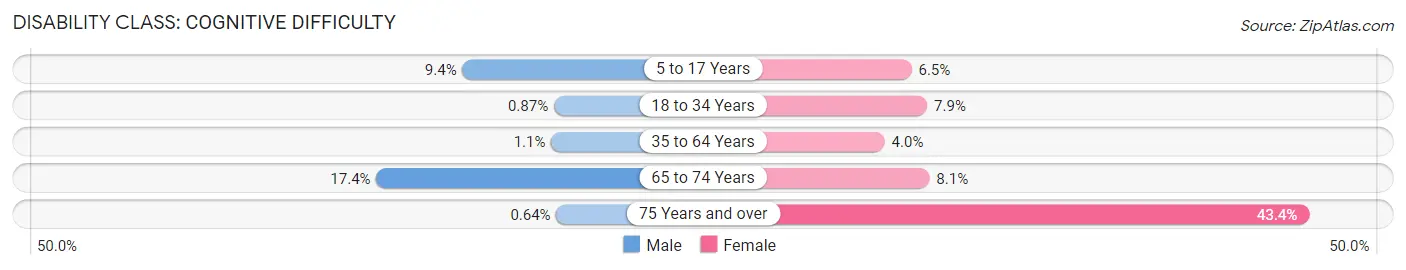
| Age Bracket | Male | Female |
| 5 to 17 Years | 64 (9.4%) | 71 (6.5%) |
| 18 to 34 Years | 13 (0.9%) | 123 (7.9%) |
| 35 to 64 Years | 18 (1.1%) | 66 (4.0%) |
| 65 to 74 Years | 68 (17.3%) | 36 (8.1%) |
| 75 Years and over | 2 (0.6%) | 134 (43.4%) |
Disability Class: Ambulatory Difficulty
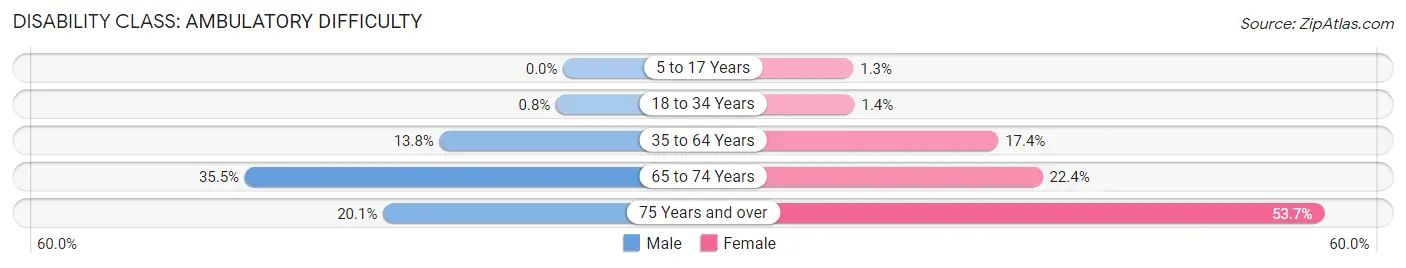
| Age Bracket | Male | Female |
| 5 to 17 Years | 0 (0.0%) | 14 (1.3%) |
| 18 to 34 Years | 12 (0.8%) | 22 (1.4%) |
| 35 to 64 Years | 222 (13.8%) | 289 (17.4%) |
| 65 to 74 Years | 139 (35.5%) | 99 (22.4%) |
| 75 Years and over | 63 (20.1%) | 166 (53.7%) |
Disability Class: Self-Care Difficulty
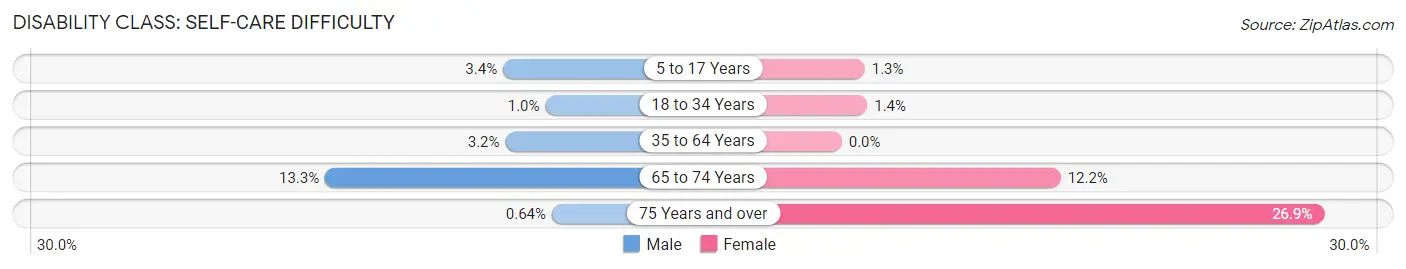
| Age Bracket | Male | Female |
| 5 to 17 Years | 23 (3.4%) | 14 (1.3%) |
| 18 to 34 Years | 15 (1.0%) | 22 (1.4%) |
| 35 to 64 Years | 52 (3.2%) | 0 (0.0%) |
| 65 to 74 Years | 52 (13.3%) | 54 (12.2%) |
| 75 Years and over | 2 (0.6%) | 83 (26.9%) |
Technology Access in Newberry
Computing Device Access in Newberry
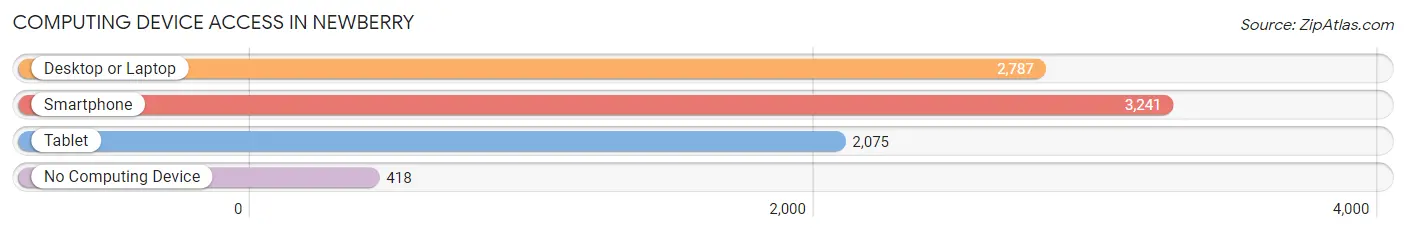
| Device Type | # Households | % Households |
| Desktop or Laptop | 2,787 | 71.2% |
| Smartphone | 3,241 | 82.8% |
| Tablet | 2,075 | 53.0% |
| No Computing Device | 418 | 10.7% |
| Total | 3,916 | 100.0% |
Internet Access in Newberry
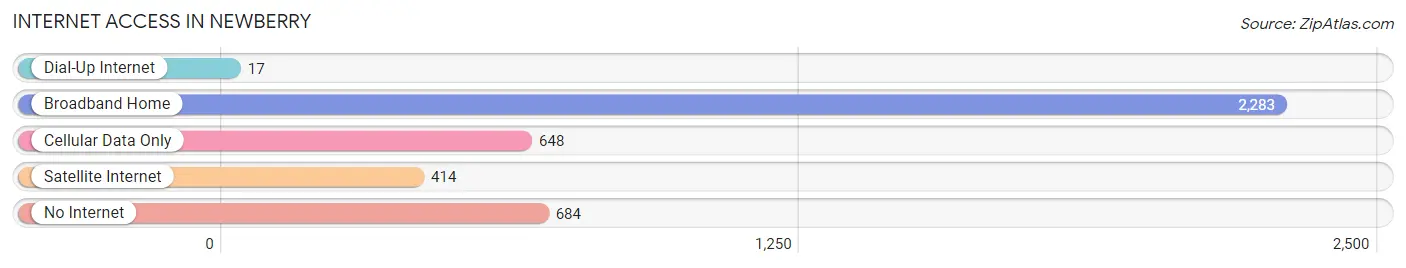
| Internet Type | # Households | % Households |
| Dial-Up Internet | 17 | 0.4% |
| Broadband Home | 2,283 | 58.3% |
| Cellular Data Only | 648 | 16.6% |
| Satellite Internet | 414 | 10.6% |
| No Internet | 684 | 17.5% |
| Total | 3,916 | 100.0% |
Newberry Summary
Newberry, South Carolina is a small city located in the Midlands region of the state. It is the county seat of Newberry County and is situated between the cities of Columbia and Greenville. The city has a population of 10,277 as of the 2010 census and is the home of Newberry College, a private liberal arts college.
History
The area that is now Newberry was first settled in 1751 by German and Swiss immigrants. The town was originally known as Newberry Court House and was established in 1789. It was named after the prominent Newberry family who had settled in the area in the late 1700s. The town was officially incorporated in 1894.
During the Civil War, Newberry was the site of several battles, including the Battle of Newberry Court House in 1865. The town was also the site of a major Confederate victory in the Battle of Newberry in 1864.
Geography
Newberry is located in the Midlands region of South Carolina, approximately halfway between the cities of Columbia and Greenville. The city is situated in the foothills of the Blue Ridge Mountains and is surrounded by rolling hills and forests. The city is located at an elevation of 845 feet above sea level.
The city covers an area of 8.3 square miles and is located in Newberry County. The city is bordered by the towns of Whitmire, Little Mountain, and Prosperity. The city is also located near the Broad River, which flows through the city.
Economy
The economy of Newberry is largely based on agriculture and manufacturing. The city is home to several large manufacturing companies, including Newberry Mills, which produces textiles, and Newberry Industries, which produces automotive parts. The city is also home to several agricultural businesses, including a large poultry farm and several dairy farms.
The city is also home to several retail stores, restaurants, and other businesses. The city is also home to Newberry College, a private liberal arts college, which provides a significant economic boost to the city.
Demographics
As of the 2010 census, the population of Newberry was 10,277. The racial makeup of the city was 68.3% White, 28.2% African American, 0.3% Native American, 0.7% Asian, 0.1% Pacific Islander, and 2.4% from other races. Hispanic or Latino of any race were 2.7% of the population.
The median household income in Newberry was $35,945, and the median family income was $45,945. The per capita income for the city was $19,945. About 17.3% of the population was below the poverty line.
Newberry is a small city with a rich history and a diverse economy. The city is home to several large manufacturing companies and agricultural businesses, as well as Newberry College. The city has a population of 10,277 and a median household income of $35,945. The city is also home to a diverse population, with a racial makeup of 68.3% White, 28.2% African American, 0.3% Native American, 0.7% Asian, 0.1% Pacific Islander, and 2.4% from other races.
Common Questions
What is the Total Population of Newberry?
Total Population of Newberry is 10,682.
What is the Total Male Population of Newberry?
Total Male Population of Newberry is 4,945.
What is the Total Female Population of Newberry?
Total Female Population of Newberry is 5,737.
What is the Ratio of Males per 100 Females in Newberry?
There are 86.19 Males per 100 Females in Newberry.
What is the Ratio of Females per 100 Males in Newberry?
There are 116.02 Females per 100 Males in Newberry.
What is the Median Population Age in Newberry?
Median Population Age in Newberry is 31.8 Years.
What is the Average Family Size in Newberry
Average Family Size in Newberry is 3.0 People.
What is the Average Household Size in Newberry
Average Household Size in Newberry is 2.4 People.
What is Per Capita Income in Newberry?
Per Capita income in Newberry is $21,791.
What is the Median Family Income in Newberry?
Median Family Income in Newberry is $55,072.
What is the Median Household income in Newberry?
Median Household Income in Newberry is $47,565.
What is Income or Wage Gap in Newberry?
Income or Wage Gap in Newberry is 5.2%.
Women in Newberry earn 94.8 cents for every dollar earned by a man.
What is Inequality or Gini Index in Newberry?
Inequality or Gini Index in Newberry is 0.40.
How Large is the Labor Force in Newberry?
There are 4,572 People in the Labor Forcein in Newberry.
What is the Percentage of People in the Labor Force in Newberry?
54.4% of People are in the Labor Force in Newberry.
What is the Unemployment Rate in Newberry?
Unemployment Rate in Newberry is 7.6%.