Geneva, NY
Geneva Map
Geneva Overview
12,670
TOTAL POPULATION
6,272
MALE POPULATION
6,398
FEMALE POPULATION
98.03
MALES / 100 FEMALES
102.01
FEMALES / 100 MALES
31.2
MEDIAN AGE
2.9
AVG FAMILY SIZE
2.2
AVG HOUSEHOLD SIZE
$30,090
PER CAPITA INCOME
$79,075
AVG FAMILY INCOME
$63,602
AVG HOUSEHOLD INCOME
29.9%
WAGE / INCOME GAP [ % ]
70.1¢/ $1
WAGE / INCOME GAP [ $ ]
$11,359
FAMILY INCOME DEFICIT
0.45
INEQUALITY / GINI INDEX
6,424
LABOR FORCE [ PEOPLE ]
59.8%
PERCENT IN LABOR FORCE
3.1%
UNEMPLOYMENT RATE
Geneva Zip Codes
Geneva Area Codes
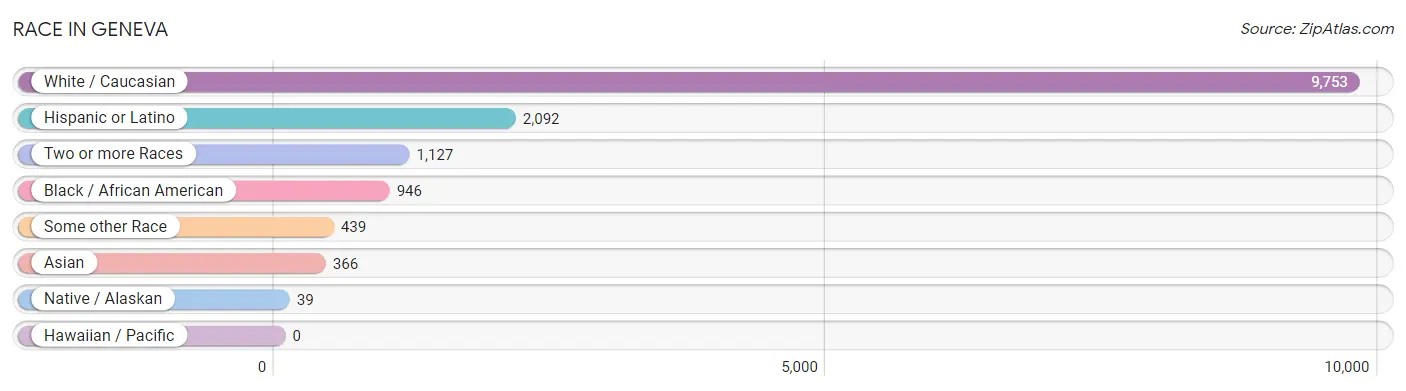
Race in Geneva
The most populous races in Geneva are White / Caucasian (9,753 | 77.0%), Hispanic or Latino (2,092 | 16.5%), and Two or more Races (1,127 | 8.9%).
| Race | # Population | % Population |
| Asian | 366 | 2.9% |
| Black / African American | 946 | 7.5% |
| Hawaiian / Pacific | 0 | 0.0% |
| Hispanic or Latino | 2,092 | 16.5% |
| Native / Alaskan | 39 | 0.3% |
| White / Caucasian | 9,753 | 77.0% |
| Two or more Races | 1,127 | 8.9% |
| Some other Race | 439 | 3.5% |
| Total | 12,670 | 100.0% |
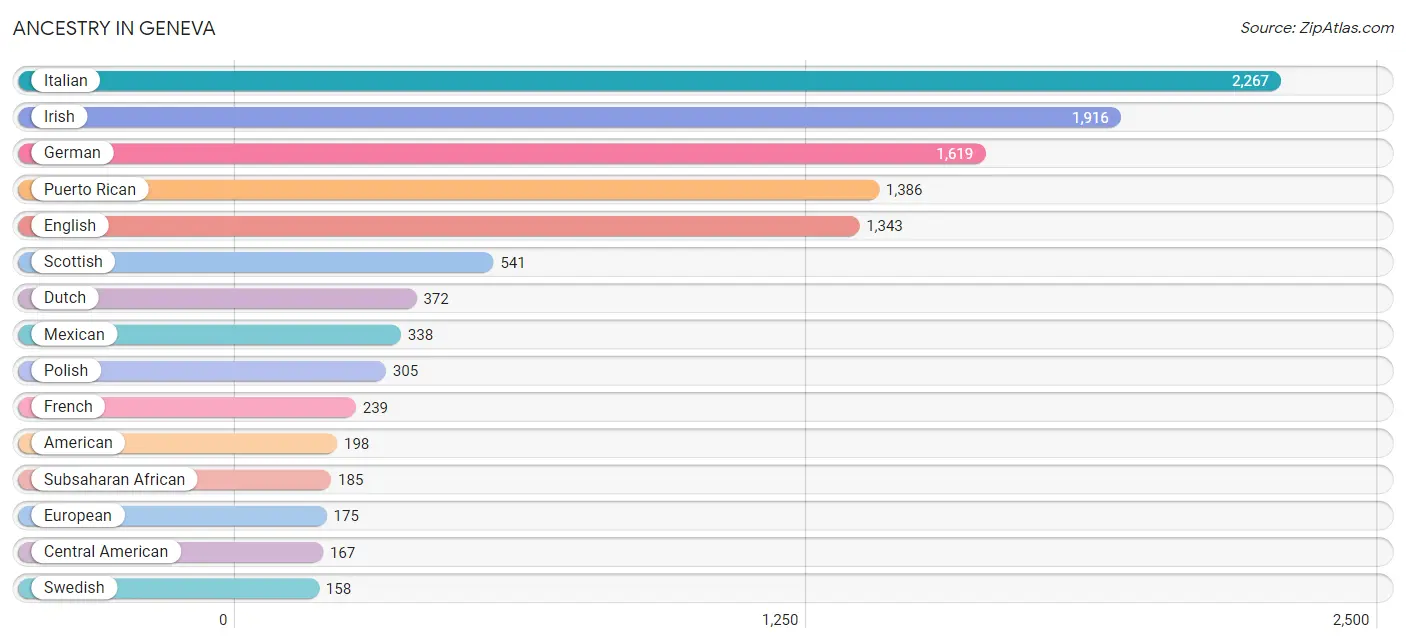
Ancestry in Geneva
The most populous ancestries reported in Geneva are Italian (2,267 | 17.9%), Irish (1,916 | 15.1%), German (1,619 | 12.8%), Puerto Rican (1,386 | 10.9%), and English (1,343 | 10.6%), together accounting for 67.3% of all Geneva residents.
| Ancestry | # Population | % Population |
| African | 149 | 1.2% |
| American | 198 | 1.6% |
| Arab | 56 | 0.4% |
| Armenian | 11 | 0.1% |
| Australian | 18 | 0.1% |
| Austrian | 16 | 0.1% |
| Belgian | 10 | 0.1% |
| Bhutanese | 13 | 0.1% |
| Blackfeet | 33 | 0.3% |
| Bolivian | 10 | 0.1% |
| British | 126 | 1.0% |
| Burmese | 15 | 0.1% |
| Canadian | 46 | 0.4% |
| Cape Verdean | 10 | 0.1% |
| Central American | 167 | 1.3% |
| Cherokee | 33 | 0.3% |
| Chilean | 24 | 0.2% |
| Colombian | 22 | 0.2% |
| Croatian | 21 | 0.2% |
| Cuban | 21 | 0.2% |
| Czech | 18 | 0.1% |
| Danish | 114 | 0.9% |
| Dominican | 54 | 0.4% |
| Dutch | 372 | 2.9% |
| Eastern European | 14 | 0.1% |
| Egyptian | 10 | 0.1% |
| English | 1,343 | 10.6% |
| European | 175 | 1.4% |
| Finnish | 30 | 0.2% |
| French | 239 | 1.9% |
| French Canadian | 104 | 0.8% |
| German | 1,619 | 12.8% |
| Greek | 70 | 0.5% |
| Guatemalan | 39 | 0.3% |
| Guyanese | 13 | 0.1% |
| Honduran | 18 | 0.1% |
| Hungarian | 37 | 0.3% |
| Indian (Asian) | 113 | 0.9% |
| Iranian | 9 | 0.1% |
| Irish | 1,916 | 15.1% |
| Iroquois | 8 | 0.1% |
| Italian | 2,267 | 17.9% |
| Japanese | 25 | 0.2% |
| Kenyan | 1 | 0.0% |
| Kiowa | 24 | 0.2% |
| Lebanese | 16 | 0.1% |
| Lithuanian | 85 | 0.7% |
| Mexican | 338 | 2.7% |
| Mongolian | 2 | 0.0% |
| Nigerian | 20 | 0.2% |
| Northern European | 9 | 0.1% |
| Norwegian | 19 | 0.2% |
| Pakistani | 95 | 0.7% |
| Pennsylvania German | 18 | 0.1% |
| Polish | 305 | 2.4% |
| Portuguese | 32 | 0.3% |
| Puerto Rican | 1,386 | 10.9% |
| Romanian | 53 | 0.4% |
| Russian | 64 | 0.5% |
| Salvadoran | 110 | 0.9% |
| Scotch-Irish | 49 | 0.4% |
| Scottish | 541 | 4.3% |
| Slovak | 11 | 0.1% |
| South American | 56 | 0.4% |
| Spaniard | 41 | 0.3% |
| Subsaharan African | 185 | 1.5% |
| Swedish | 158 | 1.3% |
| Swiss | 91 | 0.7% |
| Syrian | 30 | 0.2% |
| Thai | 92 | 0.7% |
| Turkish | 2 | 0.0% |
| Ukrainian | 28 | 0.2% |
| Vietnamese | 12 | 0.1% |
| Welsh | 98 | 0.8% | View All 74 Rows |
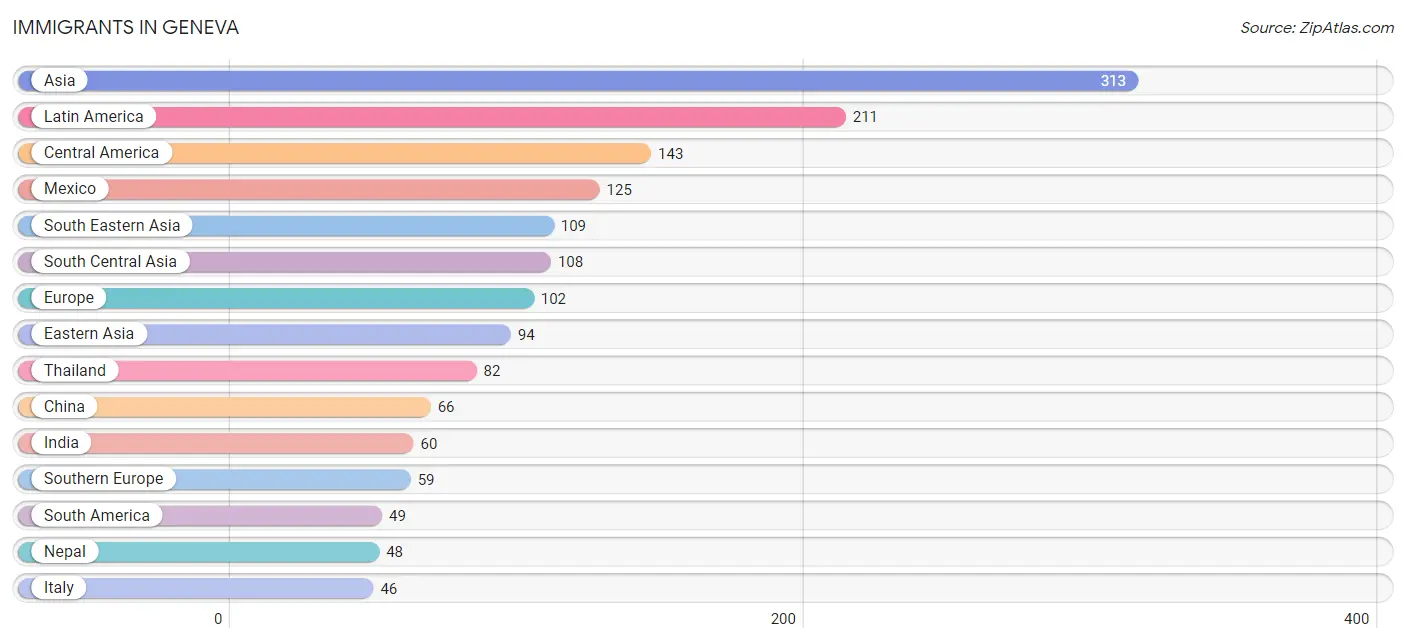
Immigrants in Geneva
The most numerous immigrant groups reported in Geneva came from Asia (313 | 2.5%), Latin America (211 | 1.7%), Central America (143 | 1.1%), Mexico (125 | 1.0%), and South Eastern Asia (109 | 0.9%), together accounting for 7.1% of all Geneva residents.
| Immigration Origin | # Population | % Population |
| Africa | 29 | 0.2% |
| Asia | 313 | 2.5% |
| Australia | 18 | 0.1% |
| Bolivia | 10 | 0.1% |
| Brazil | 26 | 0.2% |
| Cambodia | 25 | 0.2% |
| Canada | 29 | 0.2% |
| Caribbean | 19 | 0.2% |
| Central America | 143 | 1.1% |
| Chile | 6 | 0.1% |
| China | 66 | 0.5% |
| Colombia | 7 | 0.1% |
| Cuba | 5 | 0.0% |
| Eastern Africa | 1 | 0.0% |
| Eastern Asia | 94 | 0.7% |
| Eastern Europe | 7 | 0.1% |
| Egypt | 8 | 0.1% |
| England | 9 | 0.1% |
| Europe | 102 | 0.8% |
| Honduras | 18 | 0.1% |
| India | 60 | 0.5% |
| Italy | 46 | 0.4% |
| Jamaica | 14 | 0.1% |
| Japan | 13 | 0.1% |
| Kenya | 1 | 0.0% |
| Korea | 15 | 0.1% |
| Latin America | 211 | 1.7% |
| Mexico | 125 | 1.0% |
| Nepal | 48 | 0.4% |
| Netherlands | 10 | 0.1% |
| Nigeria | 20 | 0.2% |
| Northern Africa | 8 | 0.1% |
| Northern Europe | 9 | 0.1% |
| Oceania | 18 | 0.1% |
| Poland | 7 | 0.1% |
| Singapore | 2 | 0.0% |
| South America | 49 | 0.4% |
| South Central Asia | 108 | 0.9% |
| South Eastern Asia | 109 | 0.9% |
| Southern Europe | 59 | 0.5% |
| Spain | 13 | 0.1% |
| Switzerland | 17 | 0.1% |
| Thailand | 82 | 0.6% |
| Turkey | 2 | 0.0% |
| Western Africa | 20 | 0.2% |
| Western Asia | 2 | 0.0% |
| Western Europe | 27 | 0.2% | View All 47 Rows |
Sex and Age in Geneva
Sex and Age in Geneva
The most populous age groups in Geneva are 20 to 24 Years (1,103 | 17.6%) for men and 15 to 19 Years (1,024 | 16.0%) for women.
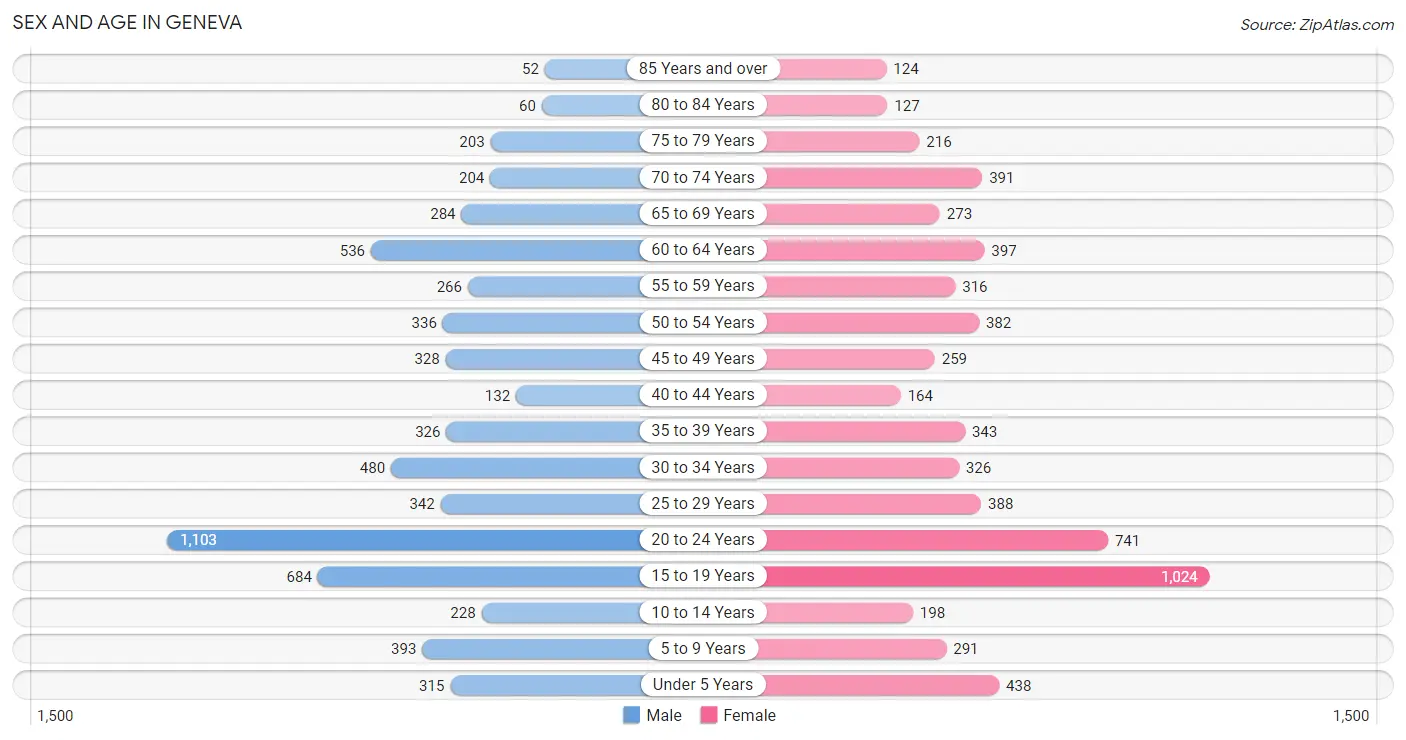
| Age Bracket | Male | Female |
| Under 5 Years | 315 (5.0%) | 438 (6.9%) |
| 5 to 9 Years | 393 (6.3%) | 291 (4.5%) |
| 10 to 14 Years | 228 (3.6%) | 198 (3.1%) |
| 15 to 19 Years | 684 (10.9%) | 1,024 (16.0%) |
| 20 to 24 Years | 1,103 (17.6%) | 741 (11.6%) |
| 25 to 29 Years | 342 (5.4%) | 388 (6.1%) |
| 30 to 34 Years | 480 (7.6%) | 326 (5.1%) |
| 35 to 39 Years | 326 (5.2%) | 343 (5.4%) |
| 40 to 44 Years | 132 (2.1%) | 164 (2.6%) |
| 45 to 49 Years | 328 (5.2%) | 259 (4.1%) |
| 50 to 54 Years | 336 (5.4%) | 382 (6.0%) |
| 55 to 59 Years | 266 (4.2%) | 316 (4.9%) |
| 60 to 64 Years | 536 (8.6%) | 397 (6.2%) |
| 65 to 69 Years | 284 (4.5%) | 273 (4.3%) |
| 70 to 74 Years | 204 (3.3%) | 391 (6.1%) |
| 75 to 79 Years | 203 (3.2%) | 216 (3.4%) |
| 80 to 84 Years | 60 (1.0%) | 127 (2.0%) |
| 85 Years and over | 52 (0.8%) | 124 (1.9%) |
| Total | 6,272 (100.0%) | 6,398 (100.0%) |
Families and Households in Geneva
Median Family Size in Geneva
The median family size in Geneva is 2.88 persons per family, with single female/mother families (777 | 31.6%) accounting for the largest median family size of 3.11 persons per family. On the other hand, single male/father families (246 | 10.0%) represent the smallest median family size with 2.48 persons per family.
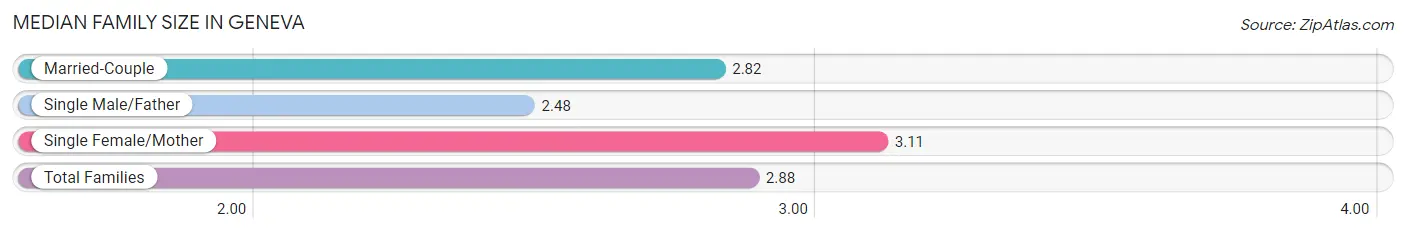
| Family Type | # Families | Family Size |
| Married-Couple | 1,436 (58.4%) | 2.82 |
| Single Male/Father | 246 (10.0%) | 2.48 |
| Single Female/Mother | 777 (31.6%) | 3.11 |
| Total Families | 2,459 (100.0%) | 2.88 |
Median Household Size in Geneva
The median household size in Geneva is 2.19 persons per household, with single female/mother households (777 | 16.3%) accounting for the largest median household size of 3.41 persons per household. non-family households (2,300 | 48.3%) represent the smallest median household size with 1.32 persons per household.
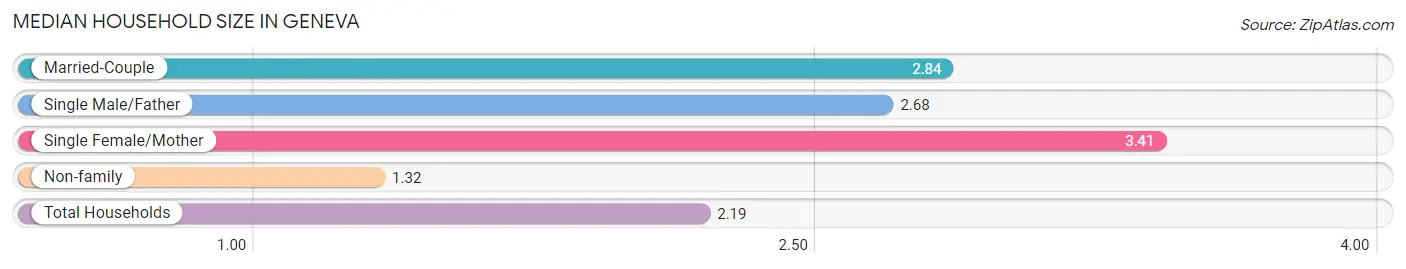
| Household Type | # Households | Household Size |
| Married-Couple | 1,436 (30.2%) | 2.84 |
| Single Male/Father | 246 (5.2%) | 2.68 |
| Single Female/Mother | 777 (16.3%) | 3.41 |
| Non-family | 2,300 (48.3%) | 1.32 |
| Total Households | 4,759 (100.0%) | 2.19 |
Household Size by Marriage Status in Geneva
Out of a total of 4,759 households in Geneva, 2,459 (51.7%) are family households, while 2,300 (48.3%) are nonfamily households. The most numerous type of family households are 2-person households, comprising 1,250, and the most common type of nonfamily households are 1-person households, comprising 1,852.
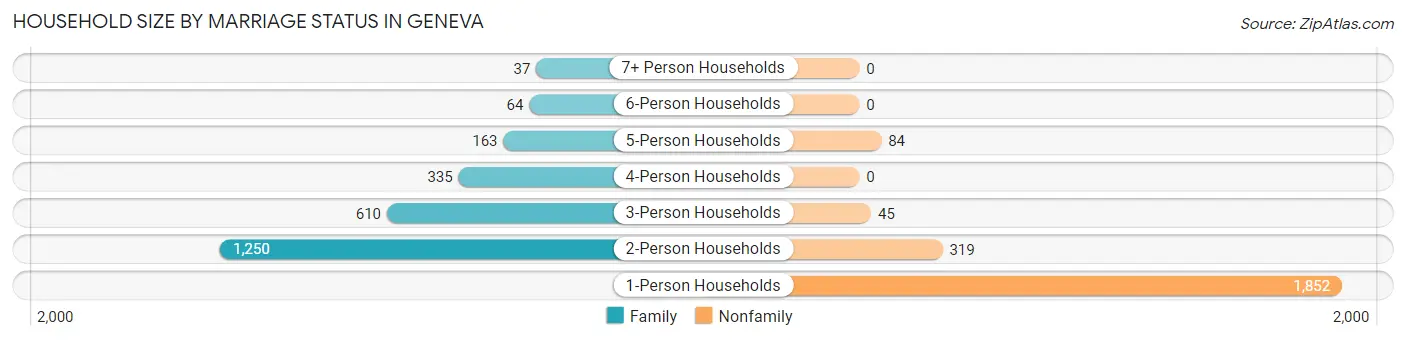
| Household Size | Family Households | Nonfamily Households |
| 1-Person Households | - | 1,852 (38.9%) |
| 2-Person Households | 1,250 (26.3%) | 319 (6.7%) |
| 3-Person Households | 610 (12.8%) | 45 (0.9%) |
| 4-Person Households | 335 (7.0%) | 0 (0.0%) |
| 5-Person Households | 163 (3.4%) | 84 (1.8%) |
| 6-Person Households | 64 (1.3%) | 0 (0.0%) |
| 7+ Person Households | 37 (0.8%) | 0 (0.0%) |
| Total | 2,459 (51.7%) | 2,300 (48.3%) |
Female Fertility in Geneva
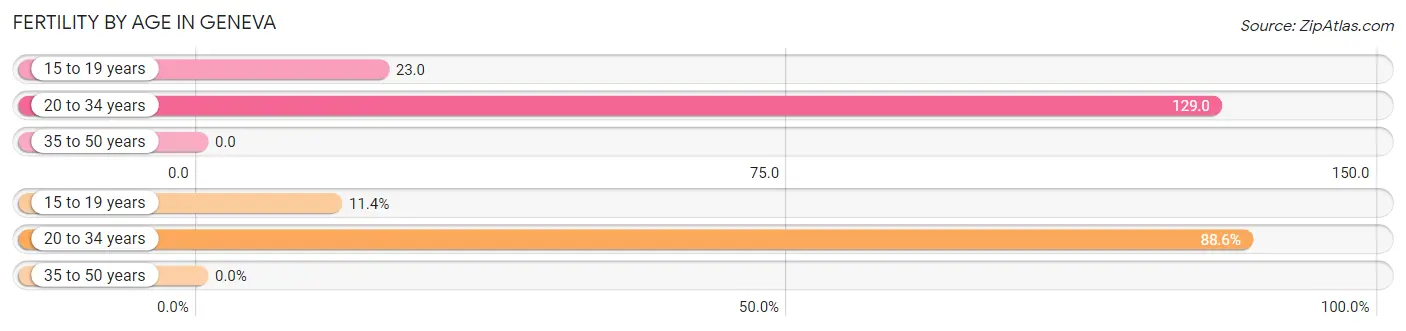
Fertility by Age in Geneva
Average fertility rate in Geneva is 65.0 births per 1,000 women. Women in the age bracket of 20 to 34 years have the highest fertility rate with 129.0 births per 1,000 women. Women in the age bracket of 20 to 34 years acount for 88.6% of all women with births.
| Age Bracket | Women with Births | Births / 1,000 Women |
| 15 to 19 years | 24 (11.4%) | 23.0 |
| 20 to 34 years | 187 (88.6%) | 129.0 |
| 35 to 50 years | 0 (0.0%) | 0.0 |
| Total | 211 (100.0%) | 65.0 |
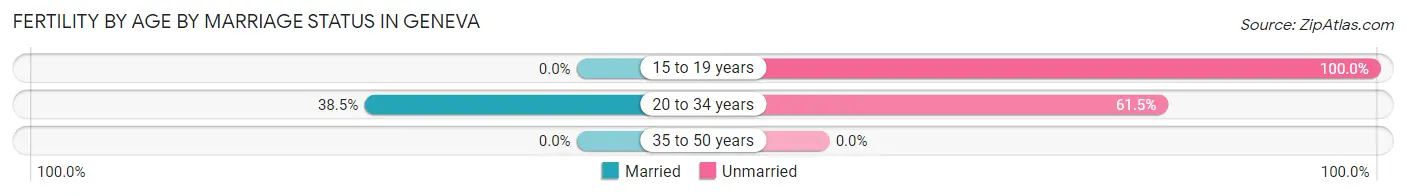
Fertility by Age by Marriage Status in Geneva
34.1% of women with births (211) in Geneva are married. The highest percentage of unmarried women with births falls into 15 to 19 years age bracket with 100.0% of them unmarried at the time of birth, while the lowest percentage of unmarried women with births belong to 20 to 34 years age bracket with 61.5% of them unmarried.
| Age Bracket | Married | Unmarried |
| 15 to 19 years | 0 (0.0%) | 24 (100.0%) |
| 20 to 34 years | 72 (38.5%) | 115 (61.5%) |
| 35 to 50 years | 0 (0.0%) | 0 (0.0%) |
| Total | 72 (34.1%) | 139 (65.9%) |
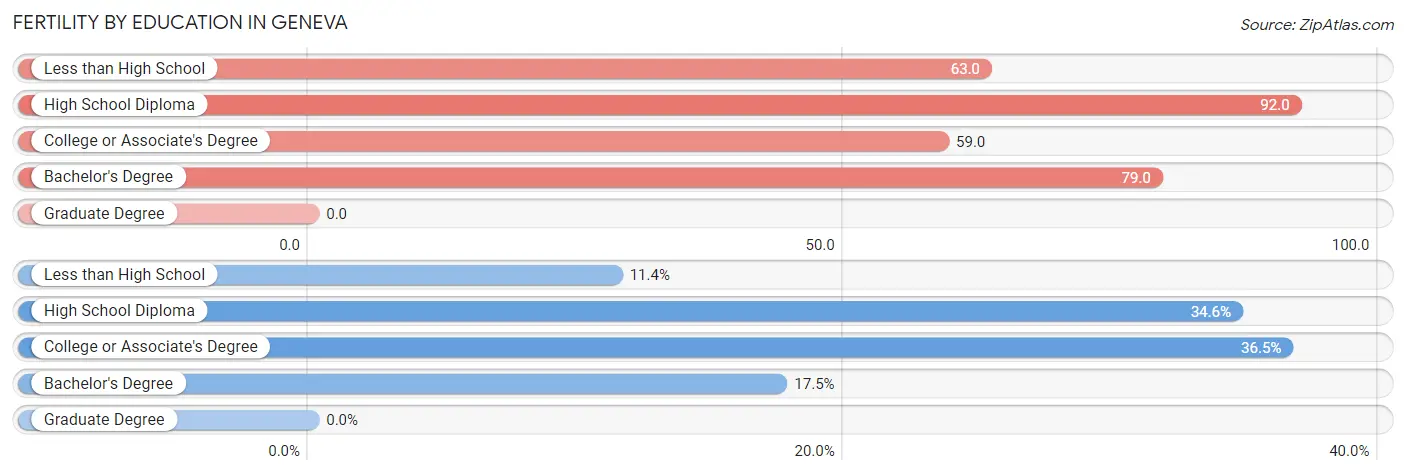
Fertility by Education in Geneva
| Educational Attainment | Women with Births | Births / 1,000 Women |
| Less than High School | 24 (11.4%) | 63.0 |
| High School Diploma | 73 (34.6%) | 92.0 |
| College or Associate's Degree | 77 (36.5%) | 59.0 |
| Bachelor's Degree | 37 (17.5%) | 79.0 |
| Graduate Degree | 0 (0.0%) | 0.0 |
| Total | 211 (100.0%) | 65.0 |
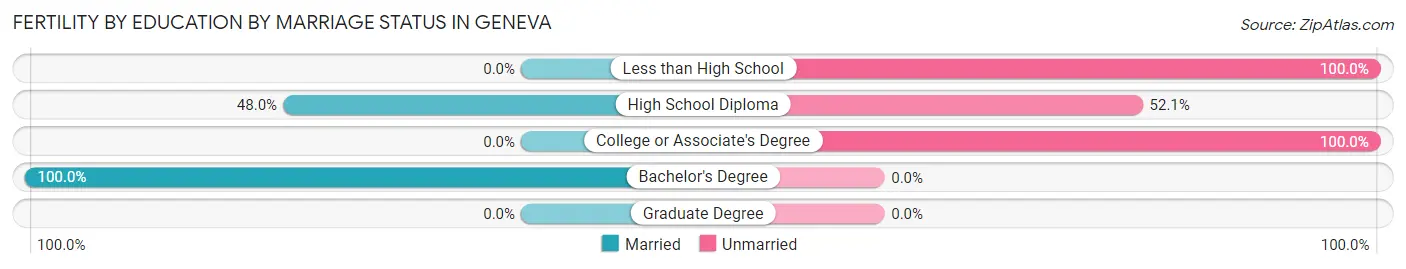
Fertility by Education by Marriage Status in Geneva
65.9% of women with births in Geneva are unmarried. Women with the educational attainment of bachelor's degree are most likely to be married with 100.0% of them married at childbirth, while women with the educational attainment of less than high school are least likely to be married with 100.0% of them unmarried at childbirth.
| Educational Attainment | Married | Unmarried |
| Less than High School | 0 (0.0%) | 24 (100.0%) |
| High School Diploma | 35 (47.9%) | 38 (52.0%) |
| College or Associate's Degree | 0 (0.0%) | 77 (100.0%) |
| Bachelor's Degree | 37 (100.0%) | 0 (0.0%) |
| Graduate Degree | 0 (0.0%) | 0 (0.0%) |
| Total | 72 (34.1%) | 139 (65.9%) |
Income in Geneva
Income Overview in Geneva
Per Capita Income in Geneva is $30,090, while median incomes of families and households are $79,075 and $63,602 respectively.
| Characteristic | Number | Measure |
| Per Capita Income | 12,670 | $30,090 |
| Median Family Income | 2,459 | $79,075 |
| Mean Family Income | 2,459 | $95,605 |
| Median Household Income | 4,759 | $63,602 |
| Mean Household Income | 4,759 | $76,620 |
| Income Deficit | 2,459 | $11,359 |
| Wage / Income Gap (%) | 12,670 | 29.87% |
| Wage / Income Gap ($) | 12,670 | 70.13¢ per $1 |
| Gini / Inequality Index | 12,670 | 0.45 |
Earnings by Sex in Geneva
Average Earnings in Geneva are $25,110, $28,714 for men and $20,137 for women, a difference of 29.9%.
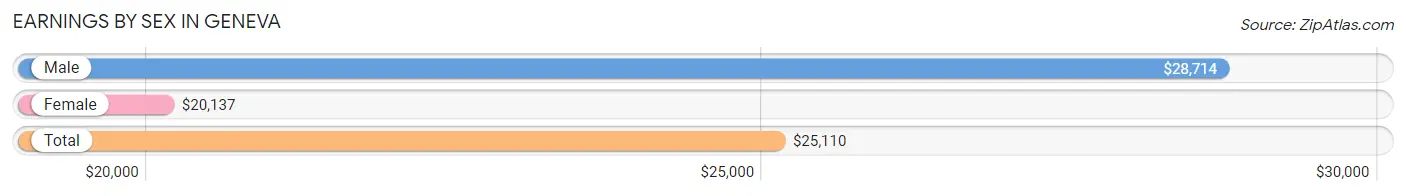
| Sex | Number | Average Earnings |
| Male | 3,873 (49.9%) | $28,714 |
| Female | 3,881 (50.0%) | $20,137 |
| Total | 7,754 (100.0%) | $25,110 |
Earnings by Sex by Income Bracket in Geneva
The most common earnings brackets in Geneva are $2,499 or less for men (489 | 12.6%) and $2,499 or less for women (649 | 16.7%).
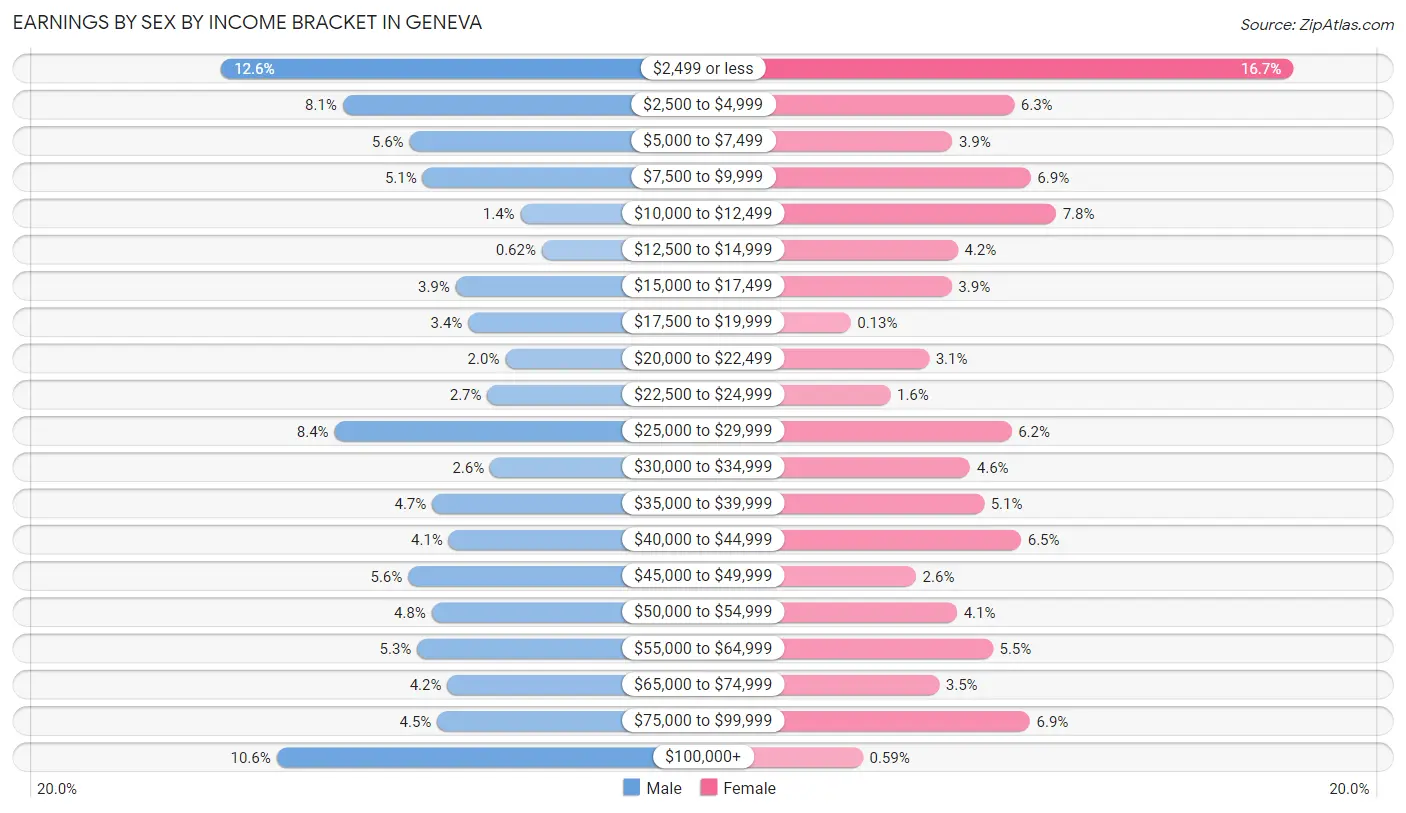
| Income | Male | Female |
| $2,499 or less | 489 (12.6%) | 649 (16.7%) |
| $2,500 to $4,999 | 313 (8.1%) | 243 (6.3%) |
| $5,000 to $7,499 | 216 (5.6%) | 153 (3.9%) |
| $7,500 to $9,999 | 197 (5.1%) | 267 (6.9%) |
| $10,000 to $12,499 | 55 (1.4%) | 304 (7.8%) |
| $12,500 to $14,999 | 24 (0.6%) | 161 (4.2%) |
| $15,000 to $17,499 | 149 (3.8%) | 152 (3.9%) |
| $17,500 to $19,999 | 131 (3.4%) | 5 (0.1%) |
| $20,000 to $22,499 | 77 (2.0%) | 119 (3.1%) |
| $22,500 to $24,999 | 103 (2.7%) | 63 (1.6%) |
| $25,000 to $29,999 | 325 (8.4%) | 239 (6.2%) |
| $30,000 to $34,999 | 99 (2.6%) | 179 (4.6%) |
| $35,000 to $39,999 | 183 (4.7%) | 199 (5.1%) |
| $40,000 to $44,999 | 159 (4.1%) | 253 (6.5%) |
| $45,000 to $49,999 | 218 (5.6%) | 100 (2.6%) |
| $50,000 to $54,999 | 184 (4.8%) | 160 (4.1%) |
| $55,000 to $64,999 | 205 (5.3%) | 212 (5.5%) |
| $65,000 to $74,999 | 161 (4.2%) | 134 (3.5%) |
| $75,000 to $99,999 | 176 (4.5%) | 266 (6.9%) |
| $100,000+ | 409 (10.6%) | 23 (0.6%) |
| Total | 3,873 (100.0%) | 3,881 (100.0%) |
Earnings by Sex by Educational Attainment in Geneva
Average earnings in Geneva are $46,828 for men and $37,821 for women, a difference of 19.2%. Men with an educational attainment of graduate degree enjoy the highest average annual earnings of $81,786, while those with less than high school education earn the least with $21,809. Women with an educational attainment of graduate degree earn the most with the average annual earnings of $57,679, while those with less than high school education have the smallest earnings of $25,787.
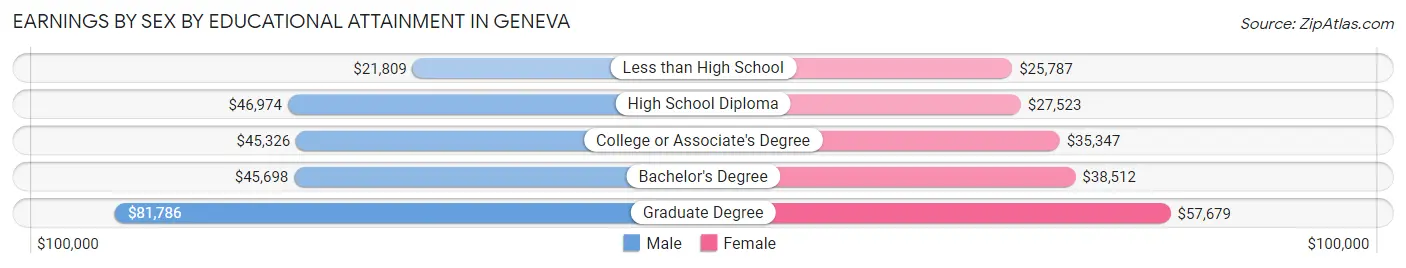
| Educational Attainment | Male Income | Female Income |
| Less than High School | $21,809 | $25,787 |
| High School Diploma | $46,974 | $27,523 |
| College or Associate's Degree | $45,326 | $35,347 |
| Bachelor's Degree | $45,698 | $38,512 |
| Graduate Degree | $81,786 | $57,679 |
| Total | $46,828 | $37,821 |
Family Income in Geneva
Family Income Brackets in Geneva
According to the Geneva family income data, there are 561 families falling into the $100,000 to $149,999 income range, which is the most common income bracket and makes up 22.8% of all families. Conversely, the $10,000 to $14,999 income bracket is the least frequent group with only 64 families (2.6%) belonging to this category.
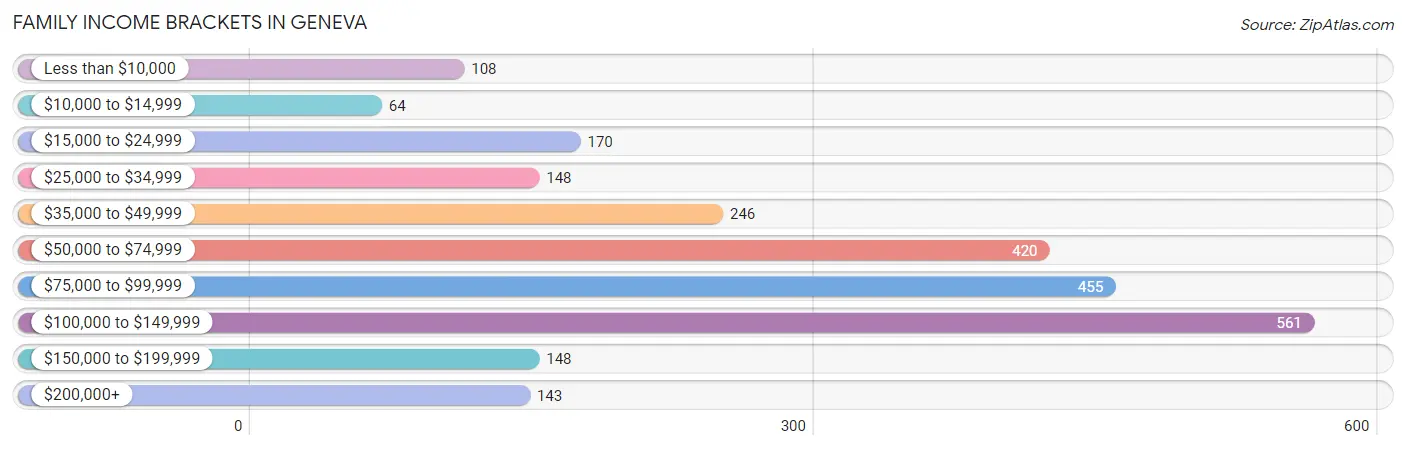
| Income Bracket | # Families | % Families |
| Less than $10,000 | 108 | 4.4% |
| $10,000 to $14,999 | 64 | 2.6% |
| $15,000 to $24,999 | 170 | 6.9% |
| $25,000 to $34,999 | 148 | 6.0% |
| $35,000 to $49,999 | 246 | 10.0% |
| $50,000 to $74,999 | 420 | 17.1% |
| $75,000 to $99,999 | 455 | 18.5% |
| $100,000 to $149,999 | 561 | 22.8% |
| $150,000 to $199,999 | 148 | 6.0% |
| $200,000+ | 143 | 5.8% |
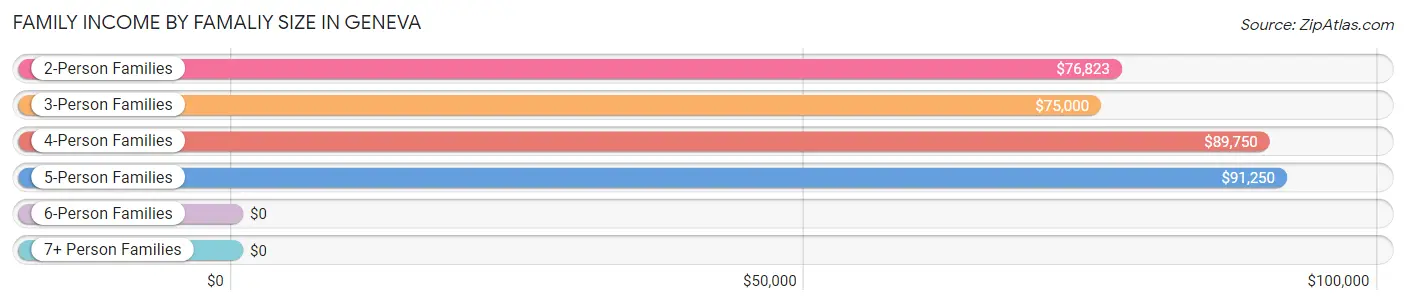
Family Income by Famaliy Size in Geneva
5-person families (141 | 5.7%) account for the highest median family income in Geneva with $91,250 per family, while 2-person families (1,353 | 55.0%) have the highest median income of $38,412 per family member.
| Income Bracket | # Families | Median Income |
| 2-Person Families | 1,353 (55.0%) | $76,823 |
| 3-Person Families | 600 (24.4%) | $75,000 |
| 4-Person Families | 288 (11.7%) | $89,750 |
| 5-Person Families | 141 (5.7%) | $91,250 |
| 6-Person Families | 40 (1.6%) | $0 |
| 7+ Person Families | 37 (1.5%) | $0 |
| Total | 2,459 (100.0%) | $79,075 |
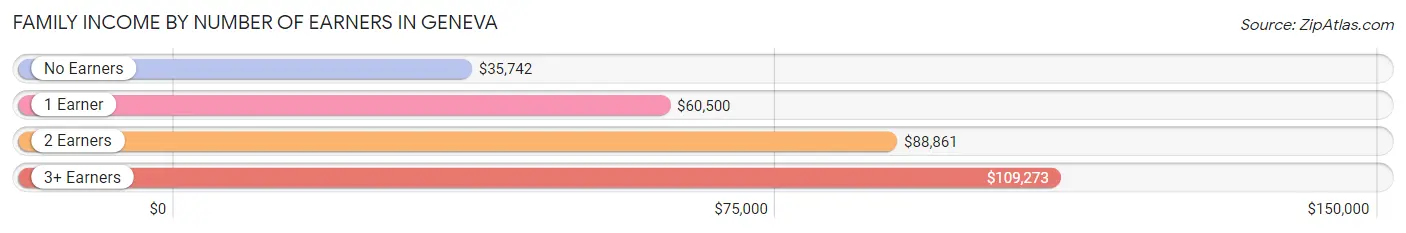
Family Income by Number of Earners in Geneva
The median family income in Geneva is $79,075, with families comprising 3+ earners (217) having the highest median family income of $109,273, while families with no earners (421) have the lowest median family income of $35,742, accounting for 8.8% and 17.1% of families, respectively.
| Number of Earners | # Families | Median Income |
| No Earners | 421 (17.1%) | $35,742 |
| 1 Earner | 616 (25.1%) | $60,500 |
| 2 Earners | 1,205 (49.0%) | $88,861 |
| 3+ Earners | 217 (8.8%) | $109,273 |
| Total | 2,459 (100.0%) | $79,075 |
Household Income in Geneva
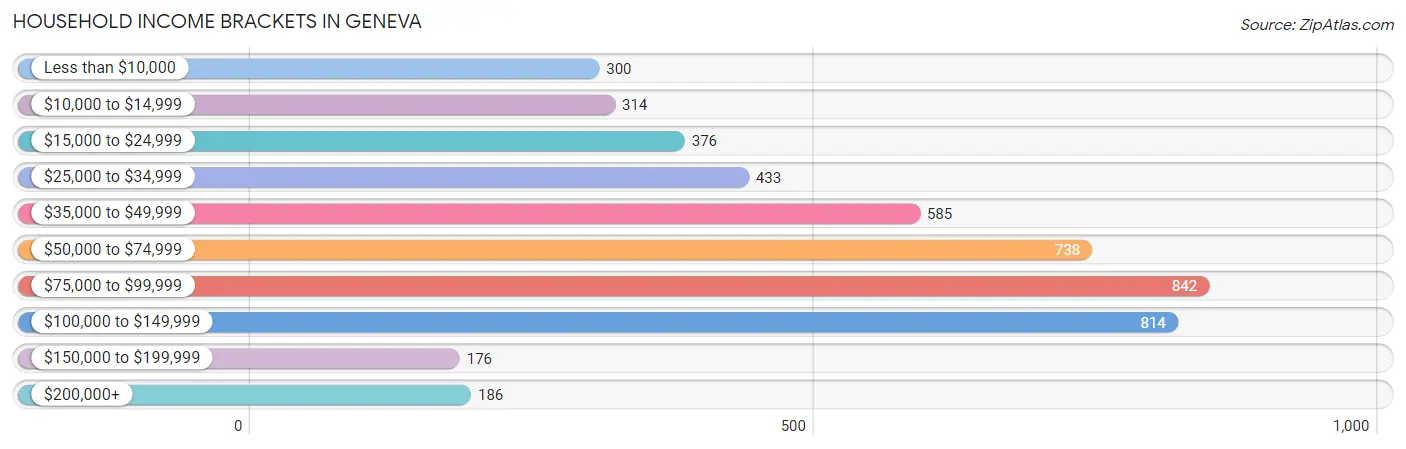
Household Income Brackets in Geneva
With 842 households falling in the category, the $75,000 to $99,999 income range is the most frequent in Geneva, accounting for 17.7% of all households. In contrast, only 176 households (3.7%) fall into the $150,000 to $199,999 income bracket, making it the least populous group.
| Income Bracket | # Households | % Households |
| Less than $10,000 | 300 | 6.3% |
| $10,000 to $14,999 | 314 | 6.6% |
| $15,000 to $24,999 | 376 | 7.9% |
| $25,000 to $34,999 | 433 | 9.1% |
| $35,000 to $49,999 | 585 | 12.3% |
| $50,000 to $74,999 | 738 | 15.5% |
| $75,000 to $99,999 | 842 | 17.7% |
| $100,000 to $149,999 | 814 | 17.1% |
| $150,000 to $199,999 | 176 | 3.7% |
| $200,000+ | 186 | 3.9% |
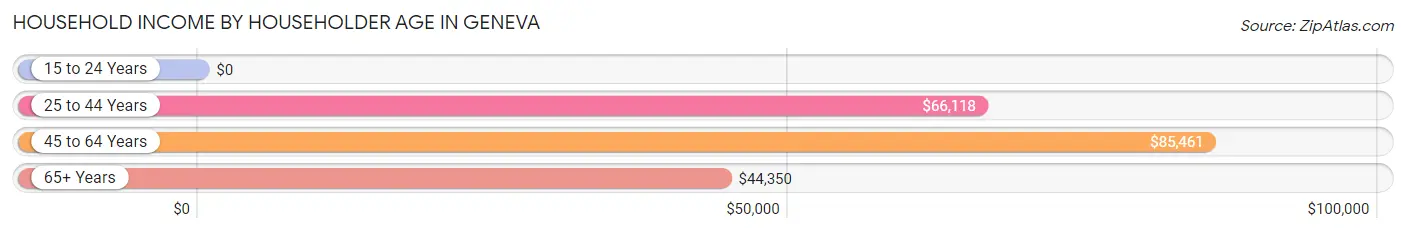
Household Income by Householder Age in Geneva
The median household income in Geneva is $63,602, with the highest median household income of $85,461 found in the 45 to 64 years age bracket for the primary householder. A total of 1,661 households (34.9%) fall into this category. Meanwhile, the 15 to 24 years age bracket for the primary householder has the lowest median household income of $0, with 376 households (7.9%) in this group.
| Income Bracket | # Households | Median Income |
| 15 to 24 Years | 376 (7.9%) | $0 |
| 25 to 44 Years | 1,371 (28.8%) | $66,118 |
| 45 to 64 Years | 1,661 (34.9%) | $85,461 |
| 65+ Years | 1,351 (28.4%) | $44,350 |
| Total | 4,759 (100.0%) | $63,602 |
Poverty in Geneva
Income Below Poverty by Sex and Age in Geneva
With 18.0% poverty level for males and 19.1% for females among the residents of Geneva, under 5 year old males and 5 year old females are the most vulnerable to poverty, with 158 males (50.2%) and 51 females (63.0%) in their respective age groups living below the poverty level.
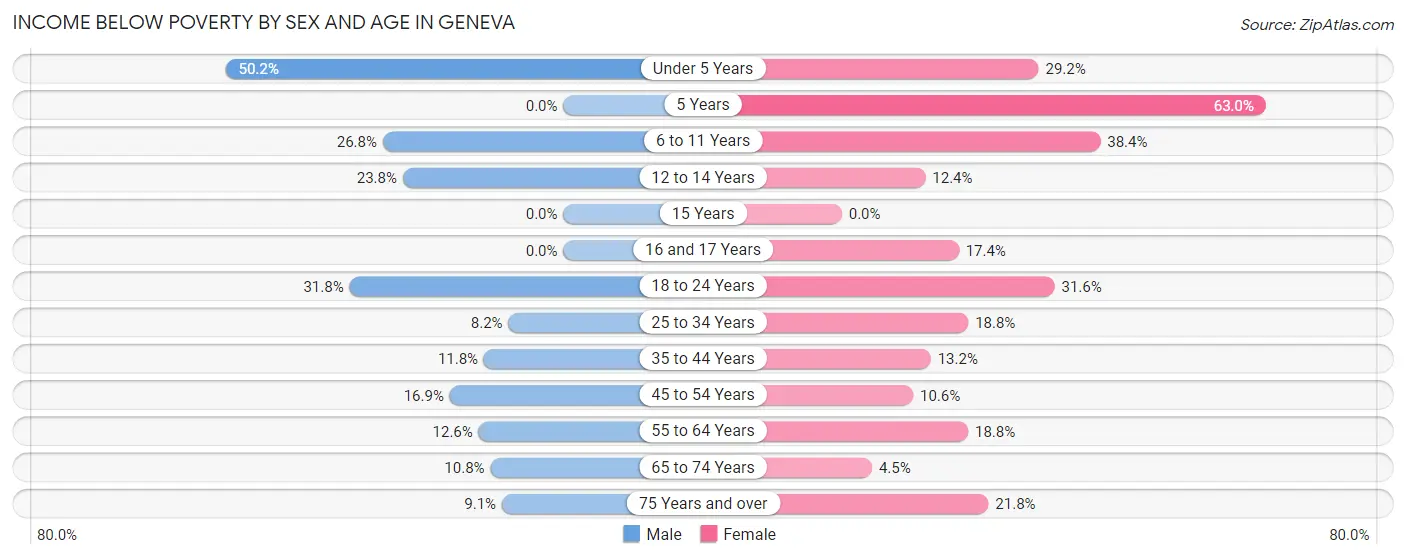
| Age Bracket | Male | Female |
| Under 5 Years | 158 (50.2%) | 128 (29.2%) |
| 5 Years | 0 (0.0%) | 51 (63.0%) |
| 6 to 11 Years | 85 (26.8%) | 104 (38.4%) |
| 12 to 14 Years | 41 (23.8%) | 17 (12.4%) |
| 15 Years | 0 (0.0%) | 0 (0.0%) |
| 16 and 17 Years | 0 (0.0%) | 25 (17.4%) |
| 18 to 24 Years | 235 (31.8%) | 163 (31.6%) |
| 25 to 34 Years | 67 (8.2%) | 134 (18.8%) |
| 35 to 44 Years | 54 (11.8%) | 67 (13.2%) |
| 45 to 54 Years | 112 (16.9%) | 67 (10.6%) |
| 55 to 64 Years | 100 (12.6%) | 132 (18.8%) |
| 65 to 74 Years | 52 (10.8%) | 29 (4.5%) |
| 75 Years and over | 26 (9.1%) | 91 (21.8%) |
| Total | 930 (18.0%) | 1,008 (19.1%) |
Income Above Poverty by Sex and Age in Geneva
According to the poverty statistics in Geneva, males aged 5 years and females aged 15 years are the age groups that are most secure financially, with 100.0% of males and 100.0% of females in these age groups living above the poverty line.
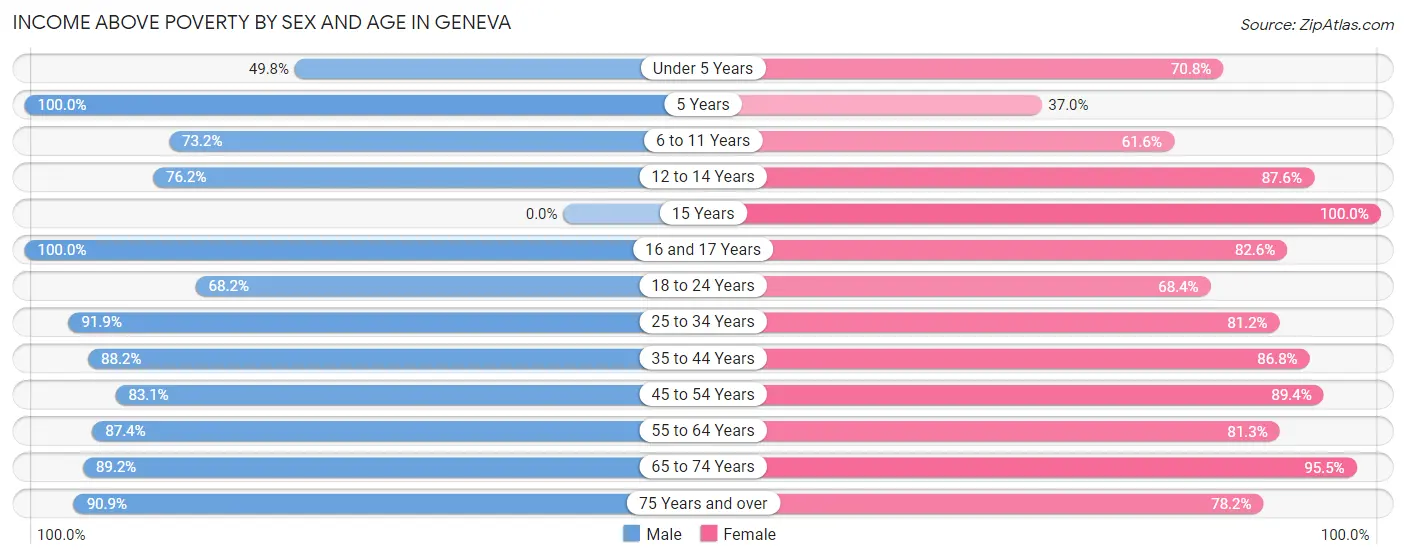
| Age Bracket | Male | Female |
| Under 5 Years | 157 (49.8%) | 310 (70.8%) |
| 5 Years | 60 (100.0%) | 30 (37.0%) |
| 6 to 11 Years | 232 (73.2%) | 167 (61.6%) |
| 12 to 14 Years | 131 (76.2%) | 120 (87.6%) |
| 15 Years | 0 (0.0%) | 64 (100.0%) |
| 16 and 17 Years | 54 (100.0%) | 119 (82.6%) |
| 18 to 24 Years | 505 (68.2%) | 353 (68.4%) |
| 25 to 34 Years | 755 (91.8%) | 580 (81.2%) |
| 35 to 44 Years | 404 (88.2%) | 440 (86.8%) |
| 45 to 54 Years | 552 (83.1%) | 566 (89.4%) |
| 55 to 64 Years | 695 (87.4%) | 572 (81.2%) |
| 65 to 74 Years | 428 (89.2%) | 619 (95.5%) |
| 75 Years and over | 259 (90.9%) | 327 (78.2%) |
| Total | 4,232 (82.0%) | 4,267 (80.9%) |
Income Below Poverty Among Married-Couple Families in Geneva
The poverty statistics for married-couple families in Geneva show that 4.5% or 65 of the total 1,436 families live below the poverty line. Families with 1 or 2 children have the highest poverty rate of 5.0%, comprising of 21 families. On the other hand, families with 3 or 4 children have the lowest poverty rate of 0.0%, which includes 0 families.
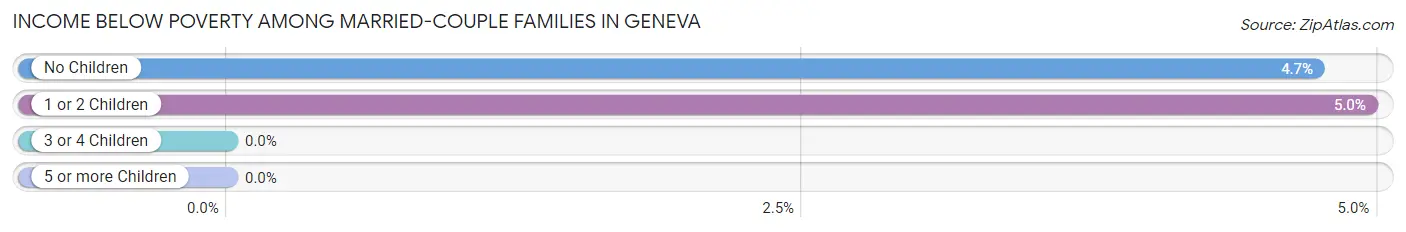
| Children | Above Poverty | Below Poverty |
| No Children | 886 (95.3%) | 44 (4.7%) |
| 1 or 2 Children | 402 (95.0%) | 21 (5.0%) |
| 3 or 4 Children | 83 (100.0%) | 0 (0.0%) |
| 5 or more Children | 0 (0.0%) | 0 (0.0%) |
| Total | 1,371 (95.5%) | 65 (4.5%) |
Income Below Poverty Among Single-Parent Households in Geneva
According to the poverty data in Geneva, 27.6% or 68 single-father households and 24.4% or 190 single-mother households are living below the poverty line. Among single-father households, those with 3 or 4 children have the highest poverty rate, with 20 households (100.0%) experiencing poverty. Likewise, among single-mother households, those with 3 or 4 children have the highest poverty rate, with 41 households (100.0%) falling below the poverty line.
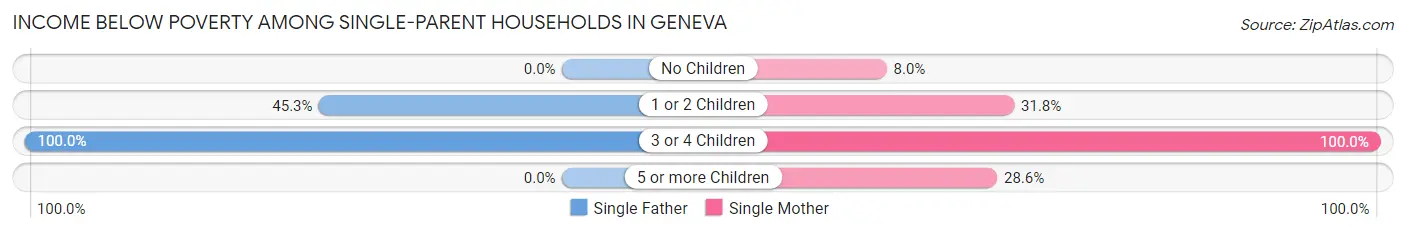
| Children | Single Father | Single Mother |
| No Children | 0 (0.0%) | 28 (8.0%) |
| 1 or 2 Children | 48 (45.3%) | 107 (31.8%) |
| 3 or 4 Children | 20 (100.0%) | 41 (100.0%) |
| 5 or more Children | 0 (0.0%) | 14 (28.6%) |
| Total | 68 (27.6%) | 190 (24.4%) |
Income Below Poverty Among Married-Couple vs Single-Parent Households in Geneva
The poverty data for Geneva shows that 65 of the married-couple family households (4.5%) and 258 of the single-parent households (25.2%) are living below the poverty level. Within the married-couple family households, those with 1 or 2 children have the highest poverty rate, with 21 households (5.0%) falling below the poverty line. Among the single-parent households, those with 3 or 4 children have the highest poverty rate, with 61 household (100.0%) living below poverty.
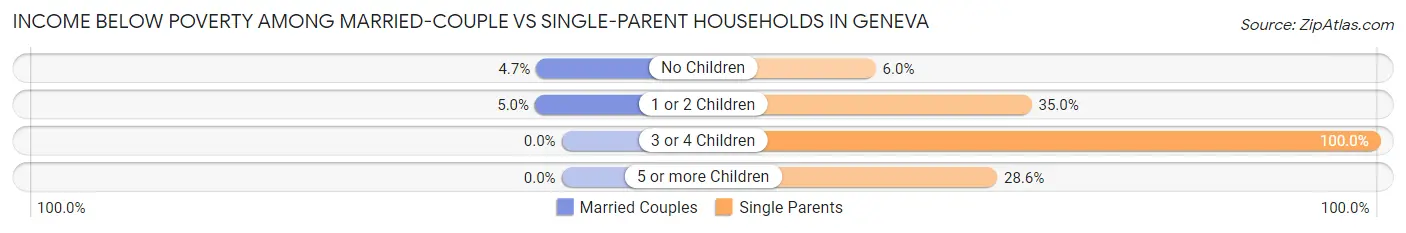
| Children | Married-Couple Families | Single-Parent Households |
| No Children | 44 (4.7%) | 28 (6.0%) |
| 1 or 2 Children | 21 (5.0%) | 155 (35.0%) |
| 3 or 4 Children | 0 (0.0%) | 61 (100.0%) |
| 5 or more Children | 0 (0.0%) | 14 (28.6%) |
| Total | 65 (4.5%) | 258 (25.2%) |
Employment Characteristics in Geneva
Employment by Class of Employer in Geneva
Among the 6,117 employed individuals in Geneva, private company employees (3,454 | 56.5%), not-for-profit organizations (1,486 | 24.3%), and local government employees (488 | 8.0%) make up the most common classes of employment.
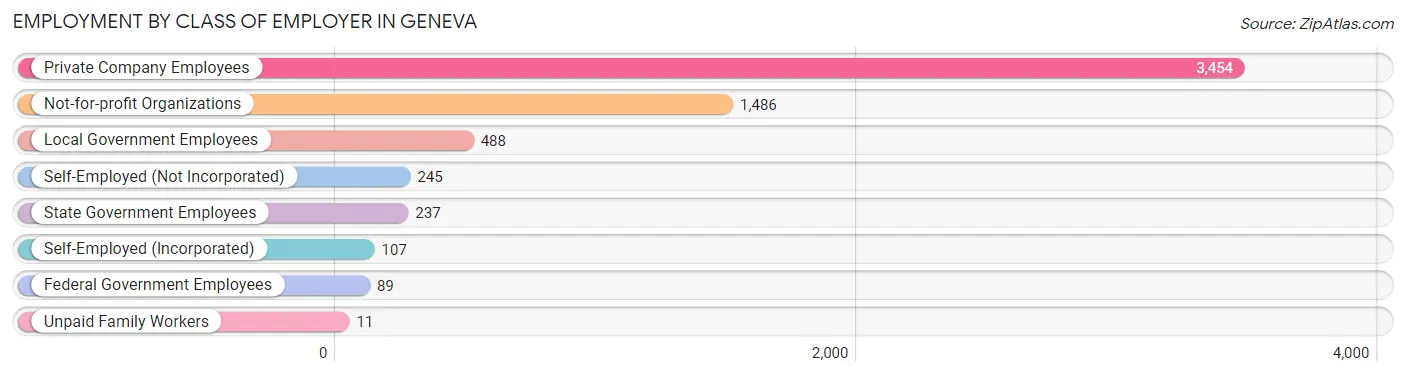
| Employer Class | # Employees | % Employees |
| Private Company Employees | 3,454 | 56.5% |
| Self-Employed (Incorporated) | 107 | 1.8% |
| Self-Employed (Not Incorporated) | 245 | 4.0% |
| Not-for-profit Organizations | 1,486 | 24.3% |
| Local Government Employees | 488 | 8.0% |
| State Government Employees | 237 | 3.9% |
| Federal Government Employees | 89 | 1.5% |
| Unpaid Family Workers | 11 | 0.2% |
| Total | 6,117 | 100.0% |
Employment Status by Age in Geneva
According to the labor force statistics for Geneva, out of the total population over 16 years of age (10,743), 59.8% or 6,424 individuals are in the labor force, with 3.1% or 199 of them unemployed. The age group with the highest labor force participation rate is 25 to 29 years, with 93.7% or 684 individuals in the labor force. Within the labor force, the 60 to 64 years age range has the highest percentage of unemployed individuals, with 5.4% or 29 of them being unemployed.
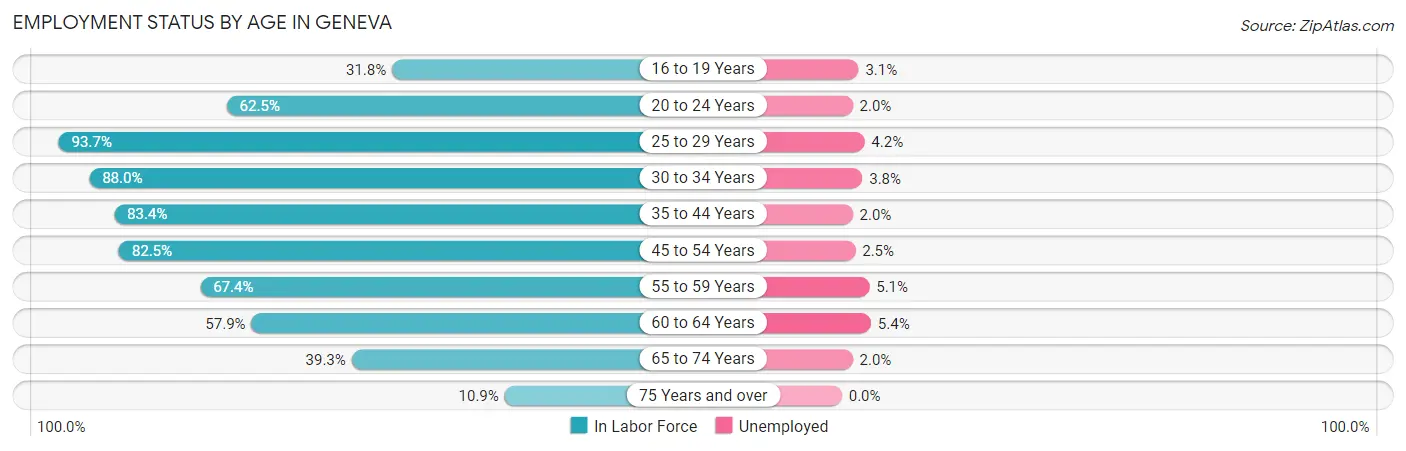
| Age Bracket | In Labor Force | Unemployed |
| 16 to 19 Years | 523 (31.8%) | 16 (3.1%) |
| 20 to 24 Years | 1,152 (62.5%) | 23 (2.0%) |
| 25 to 29 Years | 684 (93.7%) | 29 (4.2%) |
| 30 to 34 Years | 709 (88.0%) | 27 (3.8%) |
| 35 to 44 Years | 805 (83.4%) | 16 (2.0%) |
| 45 to 54 Years | 1,077 (82.5%) | 27 (2.5%) |
| 55 to 59 Years | 392 (67.4%) | 20 (5.1%) |
| 60 to 64 Years | 540 (57.9%) | 29 (5.4%) |
| 65 to 74 Years | 453 (39.3%) | 9 (2.0%) |
| 75 Years and over | 85 (10.9%) | 0 (0.0%) |
| Total | 6,424 (59.8%) | 199 (3.1%) |
Employment Status by Educational Attainment in Geneva
According to labor force statistics for Geneva, 79.0% of individuals (4,204) out of the total population between 25 and 64 years of age (5,321) are in the labor force, with 3.5% or 147 of them being unemployed. The group with the highest labor force participation rate are those with the educational attainment of bachelor's degree or higher, with 89.8% or 1,721 individuals in the labor force. Within the labor force, individuals with high school diploma education have the highest percentage of unemployment, with 10.1% or 83 of them being unemployed.
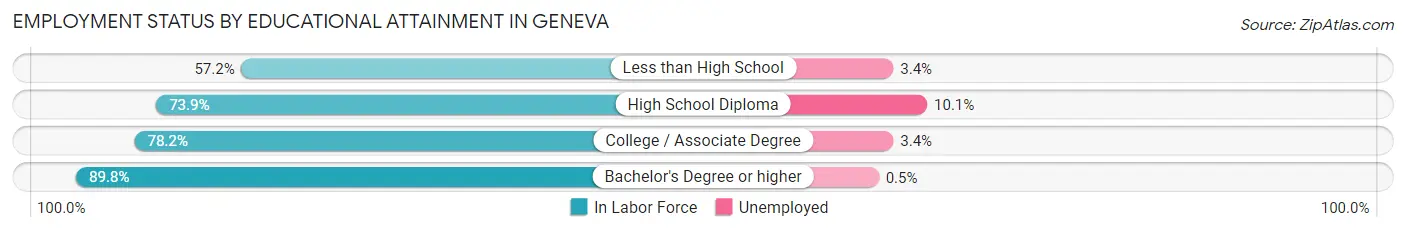
| Educational Attainment | In Labor Force | Unemployed |
| Less than High School | 353 (57.2%) | 21 (3.4%) |
| High School Diploma | 818 (73.9%) | 112 (10.1%) |
| College / Associate Degree | 1,315 (78.2%) | 57 (3.4%) |
| Bachelor's Degree or higher | 1,721 (89.8%) | 10 (0.5%) |
| Total | 4,204 (79.0%) | 186 (3.5%) |
Employment Occupations by Sex in Geneva
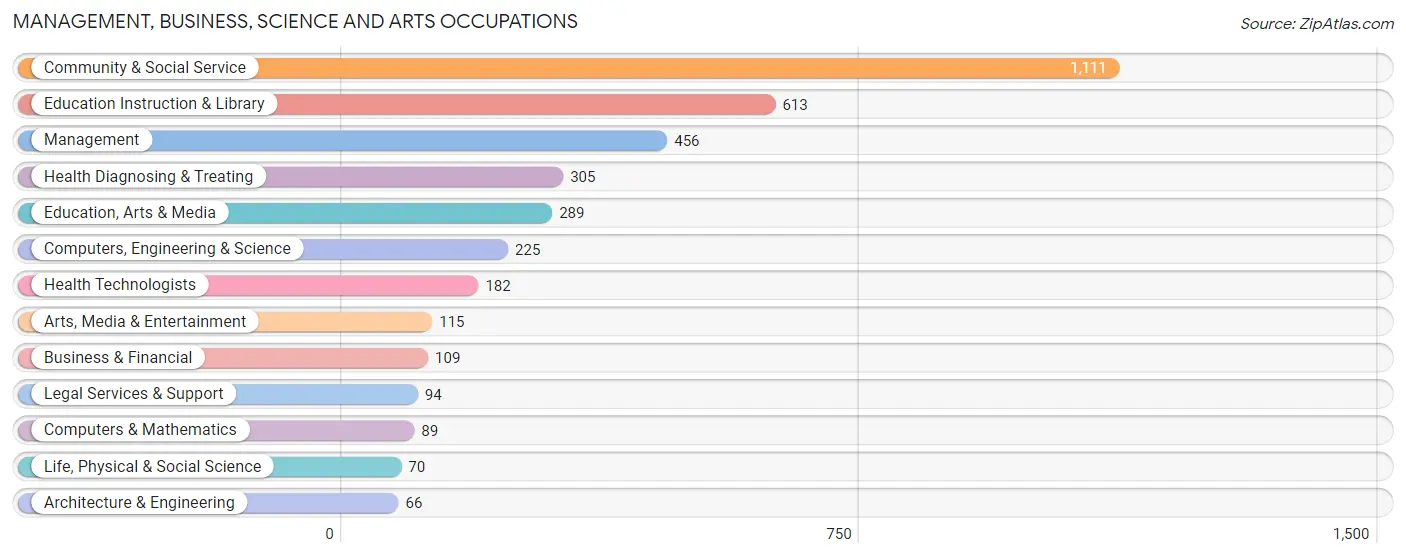
Management, Business, Science and Arts Occupations
The most common Management, Business, Science and Arts occupations in Geneva are Community & Social Service (1,111 | 17.8%), Education Instruction & Library (613 | 9.9%), Management (456 | 7.3%), Health Diagnosing & Treating (305 | 4.9%), and Education, Arts & Media (289 | 4.6%).
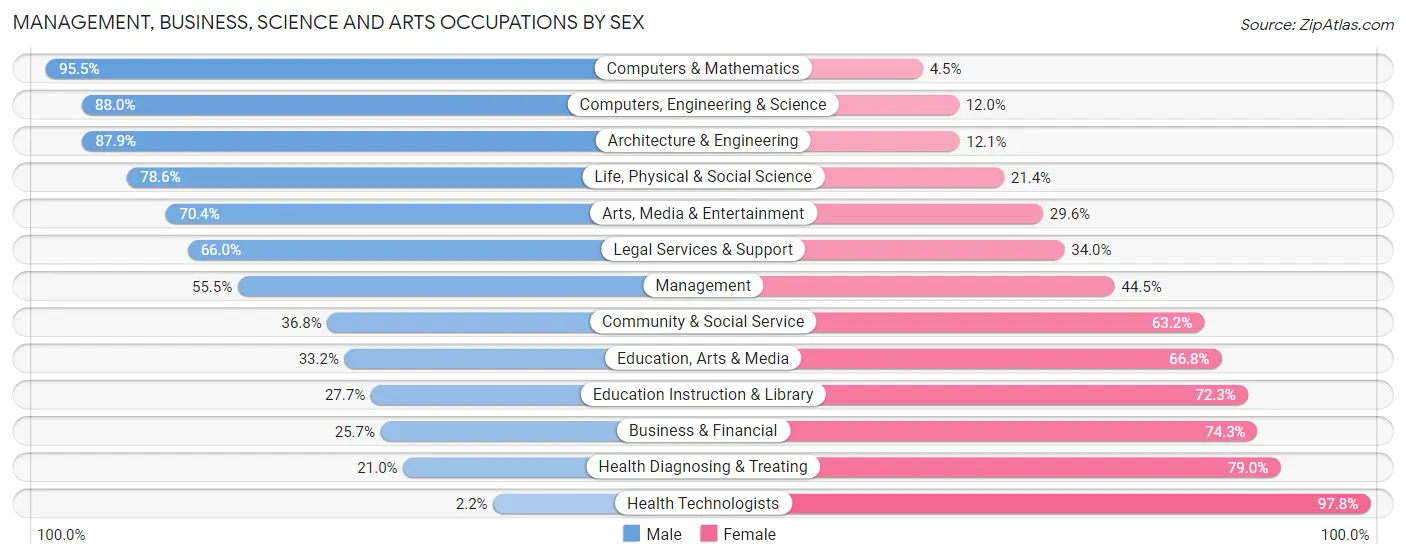
Management, Business, Science and Arts Occupations by Sex
Within the Management, Business, Science and Arts occupations in Geneva, the most male-oriented occupations are Computers & Mathematics (95.5%), Computers, Engineering & Science (88.0%), and Architecture & Engineering (87.9%), while the most female-oriented occupations are Health Technologists (97.8%), Health Diagnosing & Treating (79.0%), and Business & Financial (74.3%).
| Occupation | Male | Female |
| Management | 253 (55.5%) | 203 (44.5%) |
| Business & Financial | 28 (25.7%) | 81 (74.3%) |
| Computers, Engineering & Science | 198 (88.0%) | 27 (12.0%) |
| Computers & Mathematics | 85 (95.5%) | 4 (4.5%) |
| Architecture & Engineering | 58 (87.9%) | 8 (12.1%) |
| Life, Physical & Social Science | 55 (78.6%) | 15 (21.4%) |
| Community & Social Service | 409 (36.8%) | 702 (63.2%) |
| Education, Arts & Media | 96 (33.2%) | 193 (66.8%) |
| Legal Services & Support | 62 (66.0%) | 32 (34.0%) |
| Education Instruction & Library | 170 (27.7%) | 443 (72.3%) |
| Arts, Media & Entertainment | 81 (70.4%) | 34 (29.6%) |
| Health Diagnosing & Treating | 64 (21.0%) | 241 (79.0%) |
| Health Technologists | 4 (2.2%) | 178 (97.8%) |
| Total (Category) | 952 (43.2%) | 1,254 (56.8%) |
| Total (Overall) | 2,966 (47.6%) | 3,258 (52.3%) |
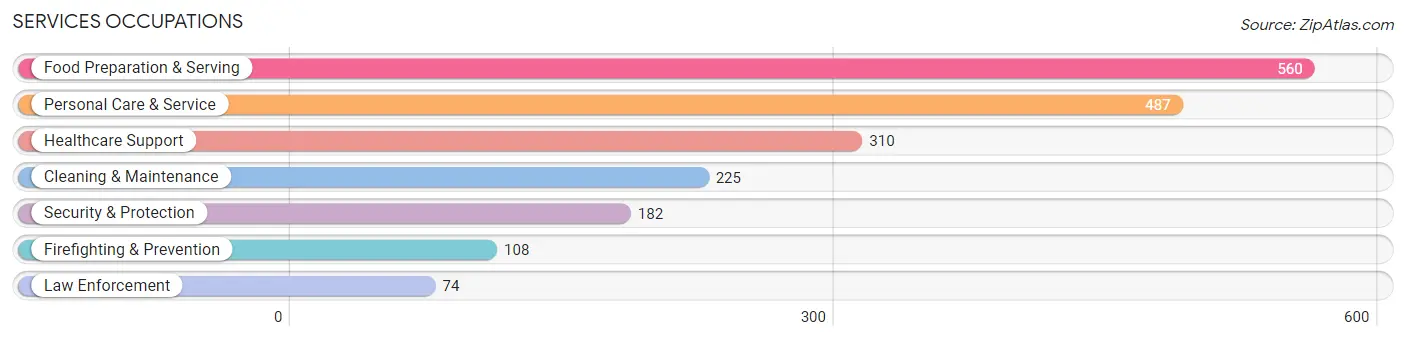
Services Occupations
The most common Services occupations in Geneva are Food Preparation & Serving (560 | 9.0%), Personal Care & Service (487 | 7.8%), Healthcare Support (310 | 5.0%), Cleaning & Maintenance (225 | 3.6%), and Security & Protection (182 | 2.9%).
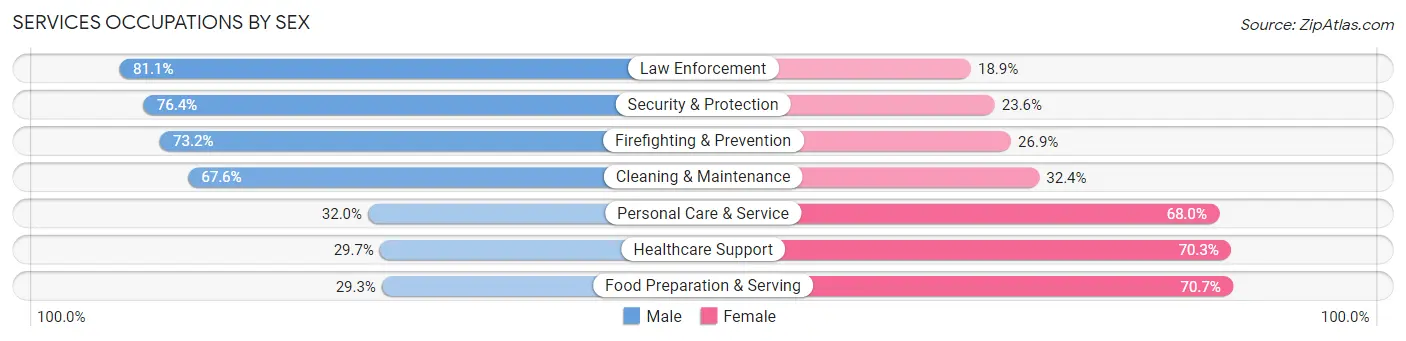
Services Occupations by Sex
Within the Services occupations in Geneva, the most male-oriented occupations are Law Enforcement (81.1%), Security & Protection (76.4%), and Firefighting & Prevention (73.2%), while the most female-oriented occupations are Food Preparation & Serving (70.7%), Healthcare Support (70.3%), and Personal Care & Service (68.0%).
| Occupation | Male | Female |
| Healthcare Support | 92 (29.7%) | 218 (70.3%) |
| Security & Protection | 139 (76.4%) | 43 (23.6%) |
| Firefighting & Prevention | 79 (73.2%) | 29 (26.9%) |
| Law Enforcement | 60 (81.1%) | 14 (18.9%) |
| Food Preparation & Serving | 164 (29.3%) | 396 (70.7%) |
| Cleaning & Maintenance | 152 (67.6%) | 73 (32.4%) |
| Personal Care & Service | 156 (32.0%) | 331 (68.0%) |
| Total (Category) | 703 (39.9%) | 1,061 (60.2%) |
| Total (Overall) | 2,966 (47.6%) | 3,258 (52.3%) |
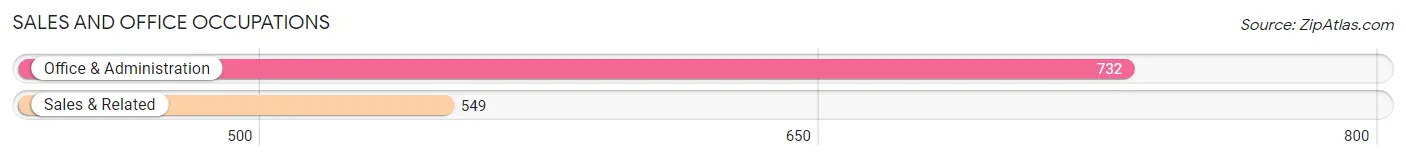
Sales and Office Occupations
The most common Sales and Office occupations in Geneva are Office & Administration (732 | 11.8%), and Sales & Related (549 | 8.8%).
Sales and Office Occupations by Sex
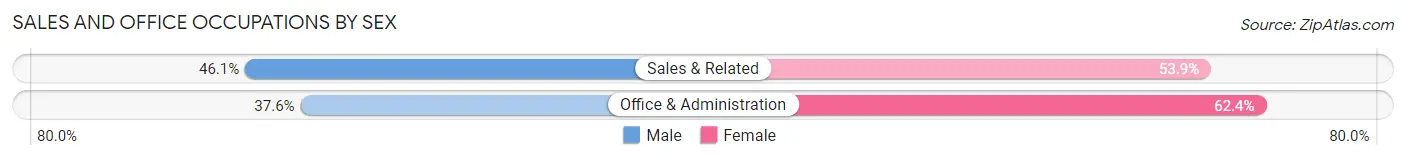
| Occupation | Male | Female |
| Sales & Related | 253 (46.1%) | 296 (53.9%) |
| Office & Administration | 275 (37.6%) | 457 (62.4%) |
| Total (Category) | 528 (41.2%) | 753 (58.8%) |
| Total (Overall) | 2,966 (47.6%) | 3,258 (52.3%) |
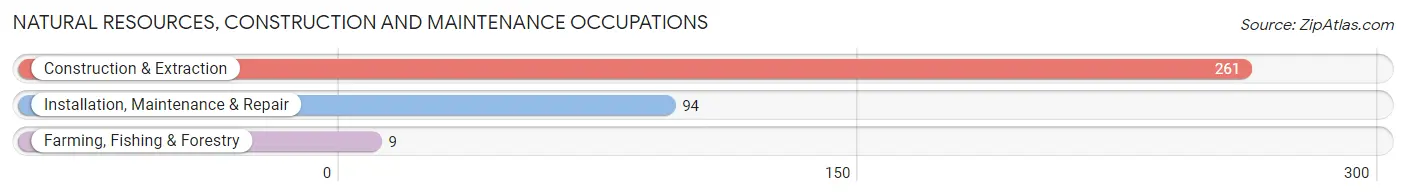
Natural Resources, Construction and Maintenance Occupations
The most common Natural Resources, Construction and Maintenance occupations in Geneva are Construction & Extraction (261 | 4.2%), Installation, Maintenance & Repair (94 | 1.5%), and Farming, Fishing & Forestry (9 | 0.1%).
Natural Resources, Construction and Maintenance Occupations by Sex
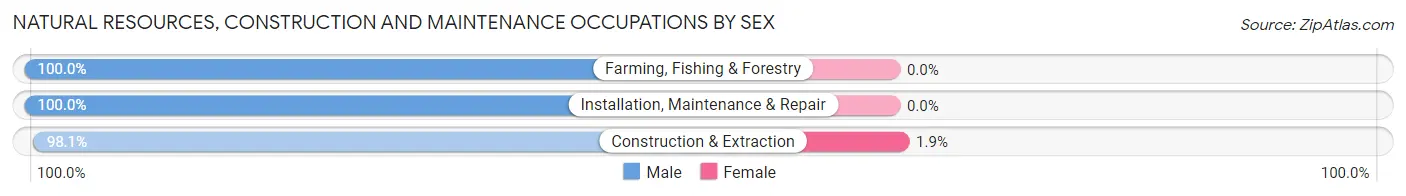
| Occupation | Male | Female |
| Farming, Fishing & Forestry | 9 (100.0%) | 0 (0.0%) |
| Construction & Extraction | 256 (98.1%) | 5 (1.9%) |
| Installation, Maintenance & Repair | 94 (100.0%) | 0 (0.0%) |
| Total (Category) | 359 (98.6%) | 5 (1.4%) |
| Total (Overall) | 2,966 (47.6%) | 3,258 (52.3%) |
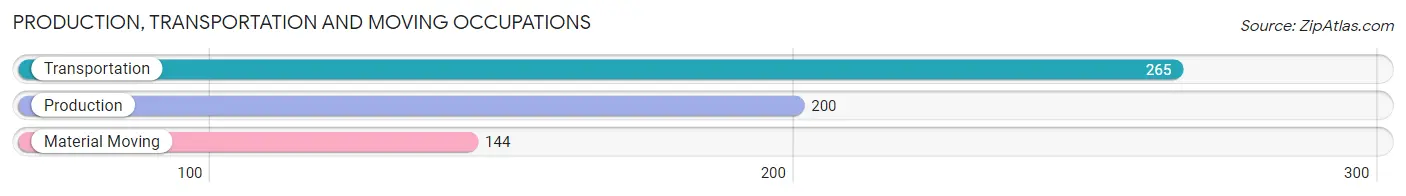
Production, Transportation and Moving Occupations
The most common Production, Transportation and Moving occupations in Geneva are Transportation (265 | 4.3%), Production (200 | 3.2%), and Material Moving (144 | 2.3%).
Production, Transportation and Moving Occupations by Sex
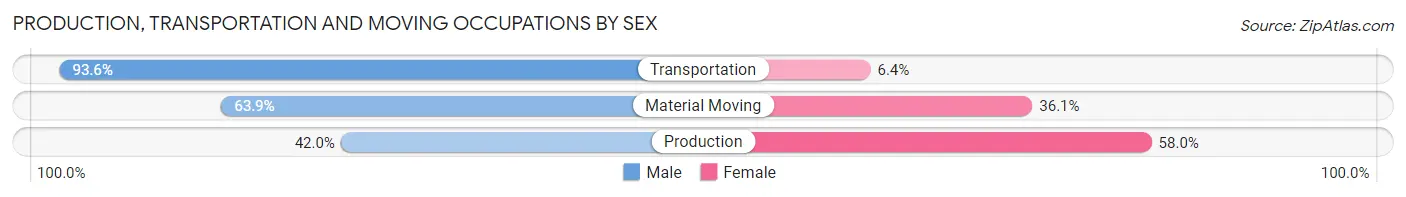
| Occupation | Male | Female |
| Production | 84 (42.0%) | 116 (58.0%) |
| Transportation | 248 (93.6%) | 17 (6.4%) |
| Material Moving | 92 (63.9%) | 52 (36.1%) |
| Total (Category) | 424 (69.6%) | 185 (30.4%) |
| Total (Overall) | 2,966 (47.6%) | 3,258 (52.3%) |
Employment Industries by Sex in Geneva
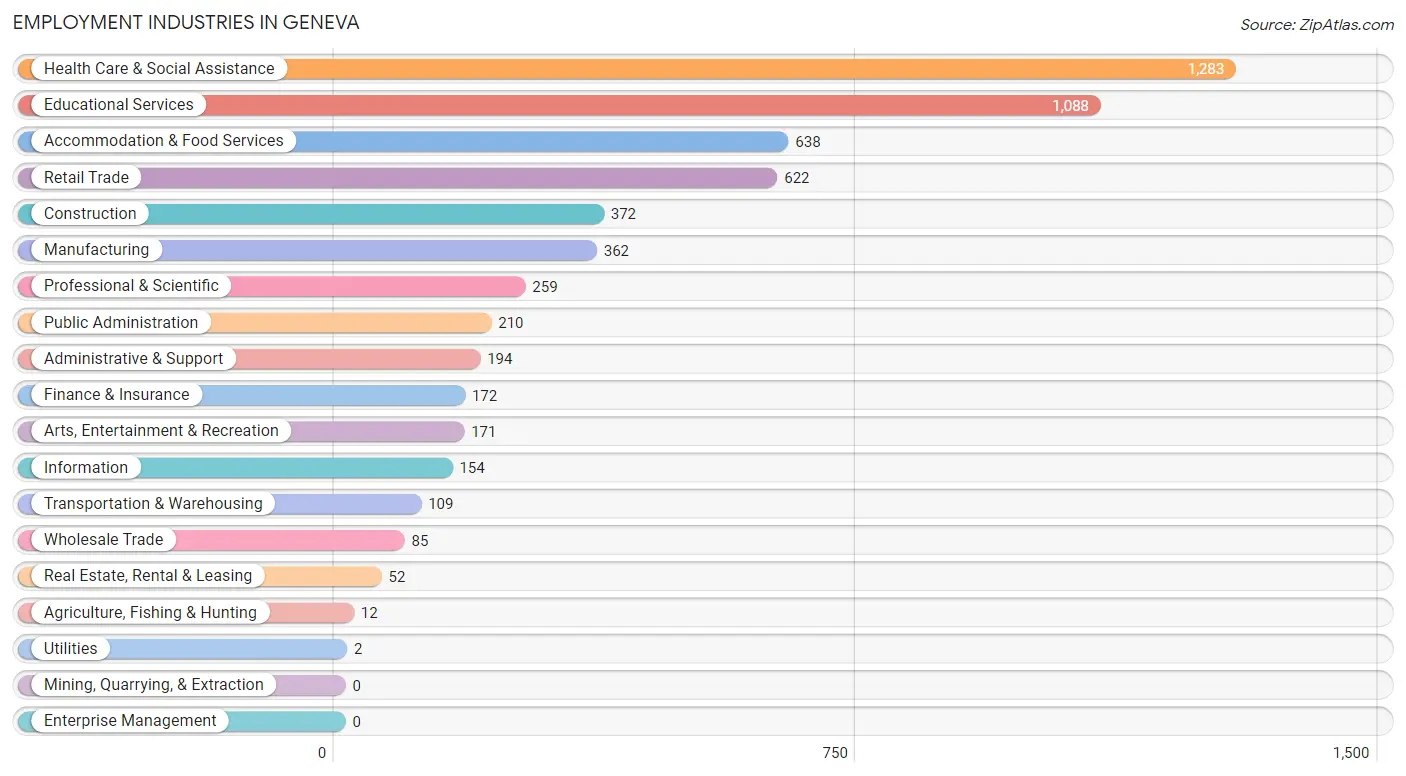
Employment Industries in Geneva
The major employment industries in Geneva include Health Care & Social Assistance (1,283 | 20.6%), Educational Services (1,088 | 17.5%), Accommodation & Food Services (638 | 10.2%), Retail Trade (622 | 10.0%), and Construction (372 | 6.0%).
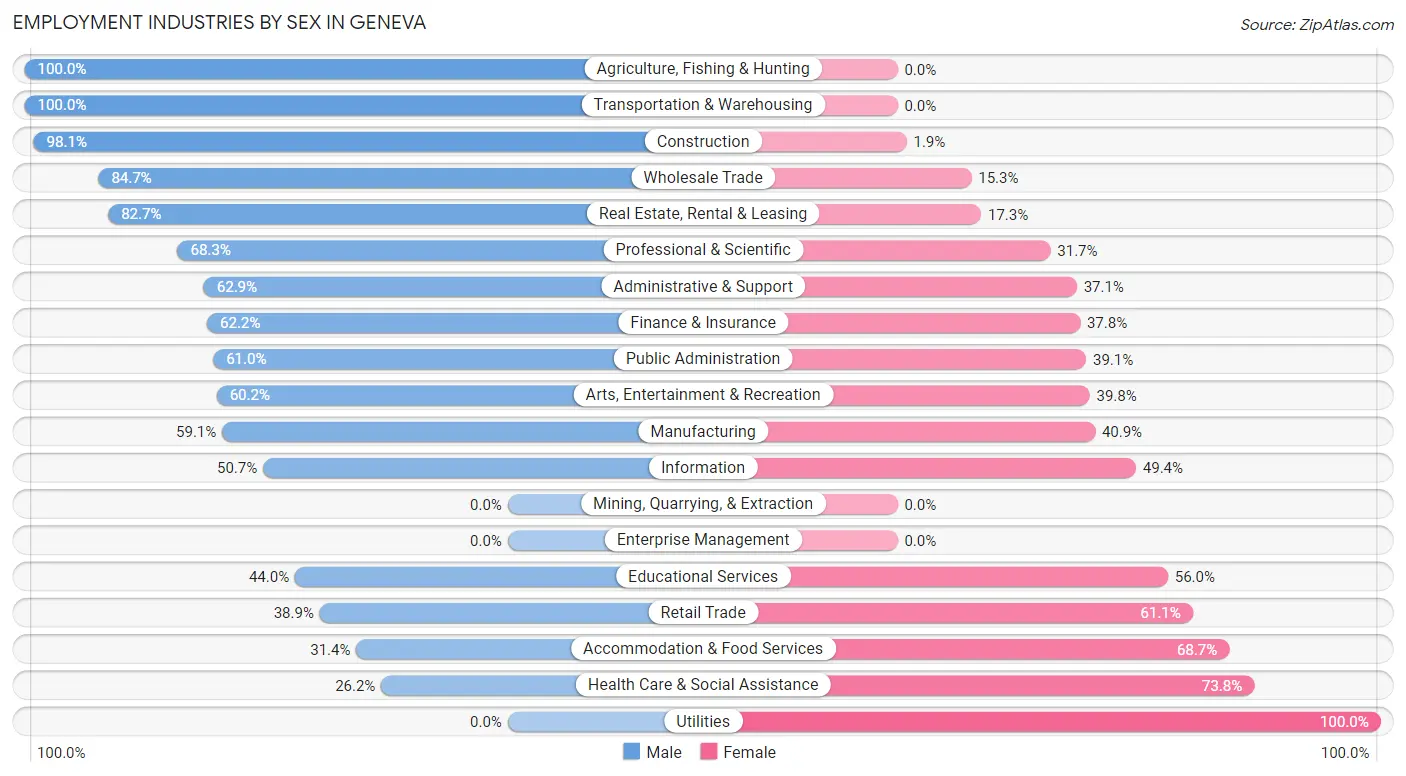
Employment Industries by Sex in Geneva
The Geneva industries that see more men than women are Agriculture, Fishing & Hunting (100.0%), Transportation & Warehousing (100.0%), and Construction (98.1%), whereas the industries that tend to have a higher number of women are Utilities (100.0%), Health Care & Social Assistance (73.8%), and Accommodation & Food Services (68.6%).
| Industry | Male | Female |
| Agriculture, Fishing & Hunting | 12 (100.0%) | 0 (0.0%) |
| Mining, Quarrying, & Extraction | 0 (0.0%) | 0 (0.0%) |
| Construction | 365 (98.1%) | 7 (1.9%) |
| Manufacturing | 214 (59.1%) | 148 (40.9%) |
| Wholesale Trade | 72 (84.7%) | 13 (15.3%) |
| Retail Trade | 242 (38.9%) | 380 (61.1%) |
| Transportation & Warehousing | 109 (100.0%) | 0 (0.0%) |
| Utilities | 0 (0.0%) | 2 (100.0%) |
| Information | 78 (50.6%) | 76 (49.3%) |
| Finance & Insurance | 107 (62.2%) | 65 (37.8%) |
| Real Estate, Rental & Leasing | 43 (82.7%) | 9 (17.3%) |
| Professional & Scientific | 177 (68.3%) | 82 (31.7%) |
| Enterprise Management | 0 (0.0%) | 0 (0.0%) |
| Administrative & Support | 122 (62.9%) | 72 (37.1%) |
| Educational Services | 479 (44.0%) | 609 (56.0%) |
| Health Care & Social Assistance | 336 (26.2%) | 947 (73.8%) |
| Arts, Entertainment & Recreation | 103 (60.2%) | 68 (39.8%) |
| Accommodation & Food Services | 200 (31.4%) | 438 (68.6%) |
| Public Administration | 128 (61.0%) | 82 (39.1%) |
| Total | 2,966 (47.6%) | 3,258 (52.3%) |
Education in Geneva
School Enrollment in Geneva
The most common levels of schooling among the 4,474 students in Geneva are college / undergraduate (2,705 | 60.5%), elementary school (472 | 10.5%), and high school (411 | 9.2%).
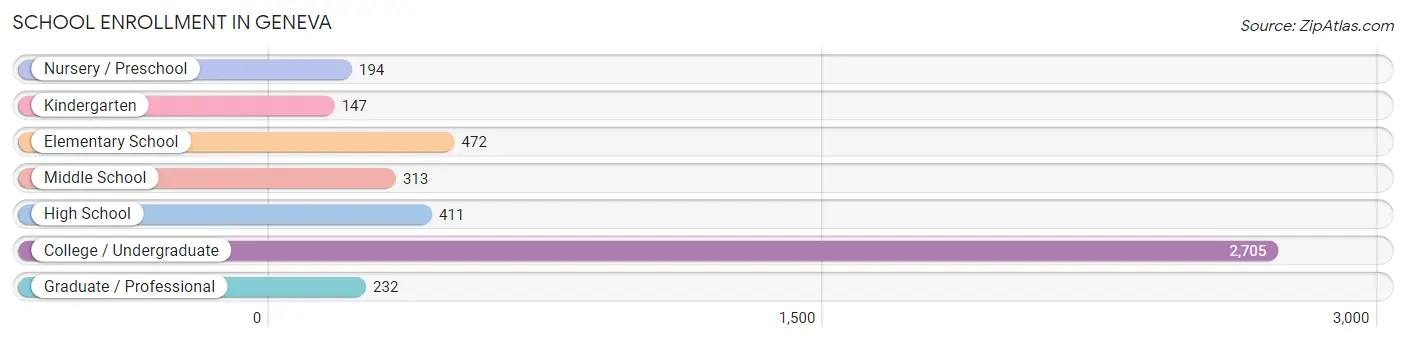
| School Level | # Students | % Students |
| Nursery / Preschool | 194 | 4.3% |
| Kindergarten | 147 | 3.3% |
| Elementary School | 472 | 10.5% |
| Middle School | 313 | 7.0% |
| High School | 411 | 9.2% |
| College / Undergraduate | 2,705 | 60.5% |
| Graduate / Professional | 232 | 5.2% |
| Total | 4,474 | 100.0% |
School Enrollment by Age by Funding Source in Geneva
Out of a total of 4,474 students who are enrolled in schools in Geneva, 2,295 (51.3%) attend a private institution, while the remaining 2,179 (48.7%) are enrolled in public schools. The age group of 20 to 24 year olds has the highest likelihood of being enrolled in private schools, with 987 (81.5% in the age bracket) enrolled. Conversely, the age group of 10 to 14 year olds has the lowest likelihood of being enrolled in a private school, with 411 (96.5% in the age bracket) attending a public institution.
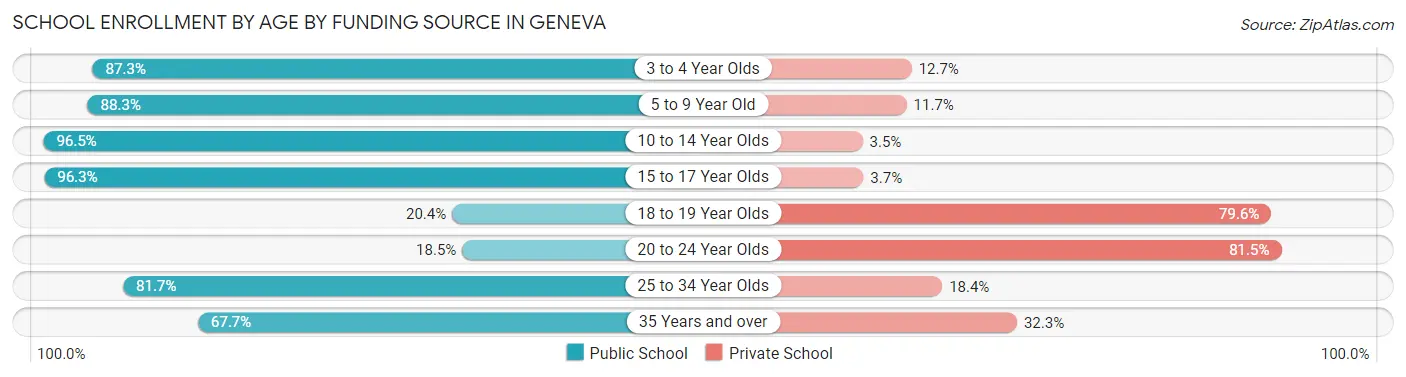
| Age Bracket | Public School | Private School |
| 3 to 4 Year Olds | 131 (87.3%) | 19 (12.7%) |
| 5 to 9 Year Old | 587 (88.3%) | 78 (11.7%) |
| 10 to 14 Year Olds | 411 (96.5%) | 15 (3.5%) |
| 15 to 17 Year Olds | 262 (96.3%) | 10 (3.7%) |
| 18 to 19 Year Olds | 280 (20.4%) | 1,094 (79.6%) |
| 20 to 24 Year Olds | 224 (18.5%) | 987 (81.5%) |
| 25 to 34 Year Olds | 178 (81.7%) | 40 (18.3%) |
| 35 Years and over | 107 (67.7%) | 51 (32.3%) |
| Total | 2,179 (48.7%) | 2,295 (51.3%) |
Educational Attainment by Field of Study in Geneva
Science & technology (274 | 9.9%), education (271 | 9.7%), liberal arts & history (266 | 9.6%), social sciences (255 | 9.2%), and literature & languages (225 | 8.1%) are the most common fields of study among 2,783 individuals in Geneva who have obtained a bachelor's degree or higher.
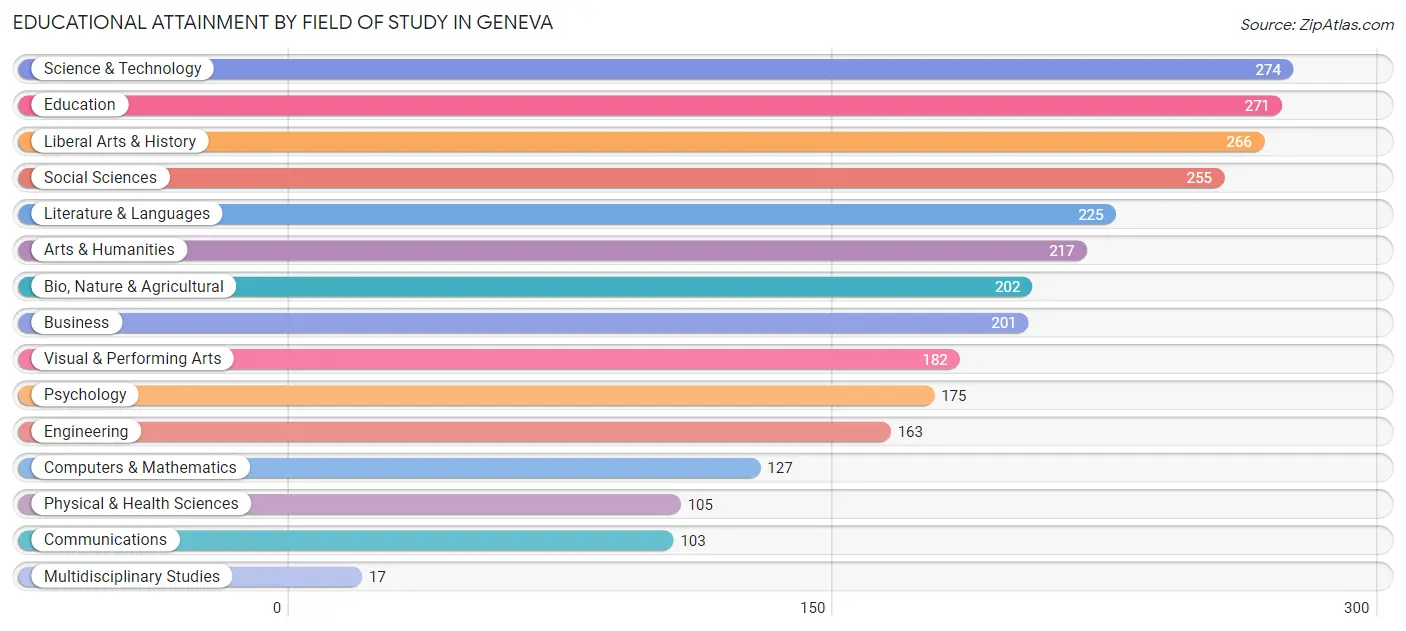
| Field of Study | # Graduates | % Graduates |
| Computers & Mathematics | 127 | 4.6% |
| Bio, Nature & Agricultural | 202 | 7.3% |
| Physical & Health Sciences | 105 | 3.8% |
| Psychology | 175 | 6.3% |
| Social Sciences | 255 | 9.2% |
| Engineering | 163 | 5.9% |
| Multidisciplinary Studies | 17 | 0.6% |
| Science & Technology | 274 | 9.9% |
| Business | 201 | 7.2% |
| Education | 271 | 9.7% |
| Literature & Languages | 225 | 8.1% |
| Liberal Arts & History | 266 | 9.6% |
| Visual & Performing Arts | 182 | 6.5% |
| Communications | 103 | 3.7% |
| Arts & Humanities | 217 | 7.8% |
| Total | 2,783 | 100.0% |
Transportation & Commute in Geneva
Vehicle Availability by Sex in Geneva
The most prevalent vehicle ownership categories in Geneva are males with 1 vehicle (1,084, accounting for 38.9%) and females with 1 vehicle (1,104, making up 38.8%).
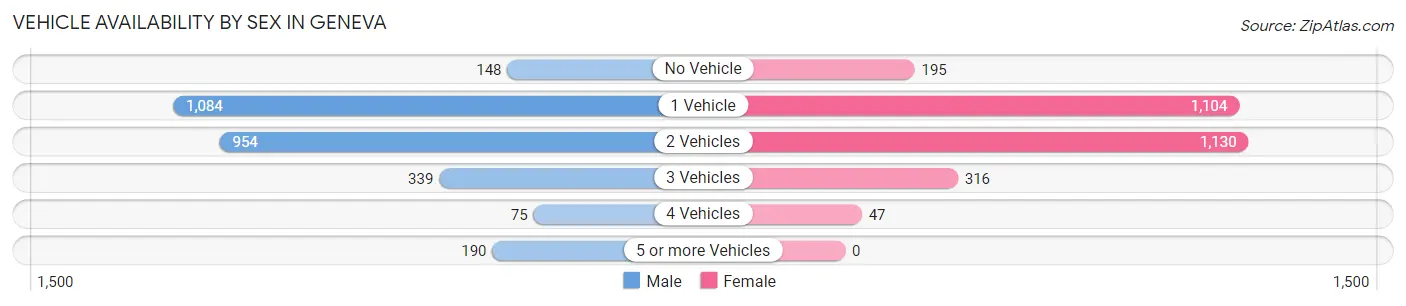
| Vehicles Available | Male | Female |
| No Vehicle | 148 (5.3%) | 195 (7.0%) |
| 1 Vehicle | 1,084 (38.9%) | 1,104 (39.5%) |
| 2 Vehicles | 954 (34.2%) | 1,130 (40.5%) |
| 3 Vehicles | 339 (12.1%) | 316 (11.3%) |
| 4 Vehicles | 75 (2.7%) | 47 (1.7%) |
| 5 or more Vehicles | 190 (6.8%) | 0 (0.0%) |
| Total | 2,790 (100.0%) | 2,792 (100.0%) |
Commute Time in Geneva
The most frequently occuring commute durations in Geneva are 5 to 9 minutes (1,803 commuters, 31.6%), 10 to 14 minutes (778 commuters, 13.6%), and 15 to 19 minutes (776 commuters, 13.6%).
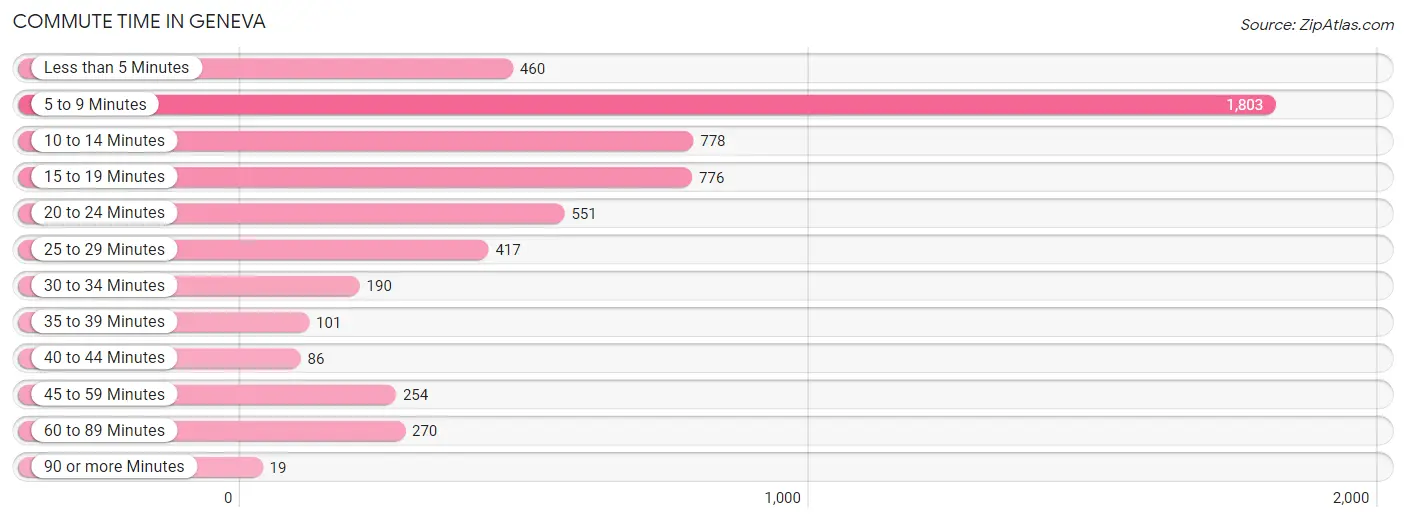
| Commute Time | # Commuters | % Commuters |
| Less than 5 Minutes | 460 | 8.1% |
| 5 to 9 Minutes | 1,803 | 31.6% |
| 10 to 14 Minutes | 778 | 13.6% |
| 15 to 19 Minutes | 776 | 13.6% |
| 20 to 24 Minutes | 551 | 9.7% |
| 25 to 29 Minutes | 417 | 7.3% |
| 30 to 34 Minutes | 190 | 3.3% |
| 35 to 39 Minutes | 101 | 1.8% |
| 40 to 44 Minutes | 86 | 1.5% |
| 45 to 59 Minutes | 254 | 4.4% |
| 60 to 89 Minutes | 270 | 4.7% |
| 90 or more Minutes | 19 | 0.3% |
Commute Time by Sex in Geneva
The most common commute times in Geneva are 5 to 9 minutes (797 commuters, 29.4%) for males and 5 to 9 minutes (1,006 commuters, 33.6%) for females.
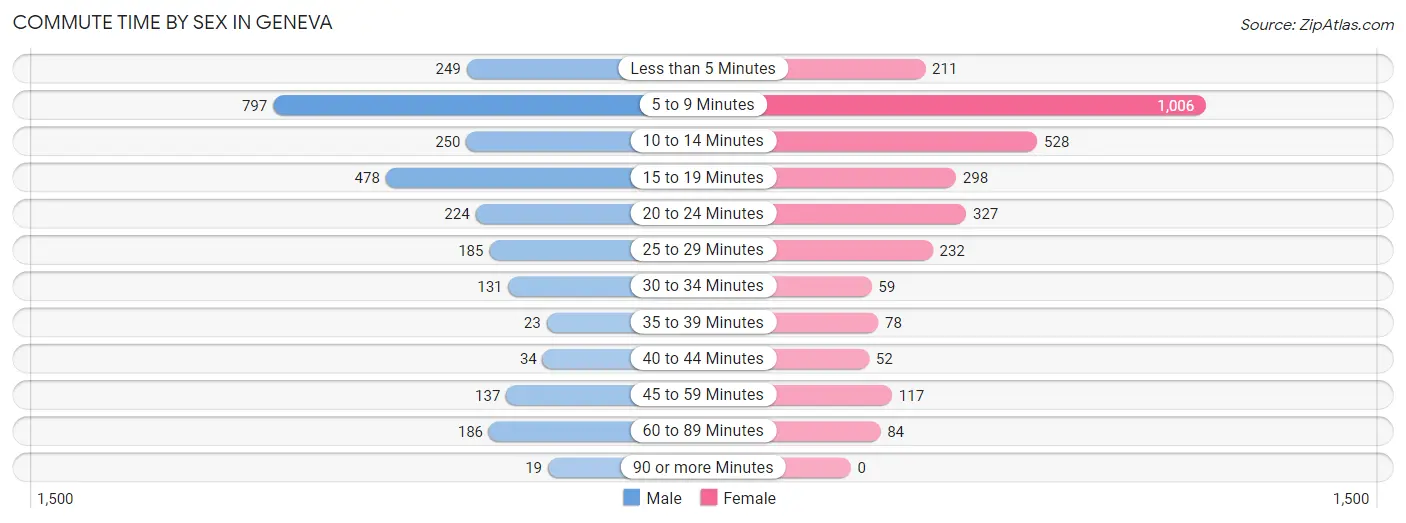
| Commute Time | Male | Female |
| Less than 5 Minutes | 249 (9.2%) | 211 (7.0%) |
| 5 to 9 Minutes | 797 (29.4%) | 1,006 (33.6%) |
| 10 to 14 Minutes | 250 (9.2%) | 528 (17.6%) |
| 15 to 19 Minutes | 478 (17.6%) | 298 (10.0%) |
| 20 to 24 Minutes | 224 (8.3%) | 327 (10.9%) |
| 25 to 29 Minutes | 185 (6.8%) | 232 (7.7%) |
| 30 to 34 Minutes | 131 (4.8%) | 59 (2.0%) |
| 35 to 39 Minutes | 23 (0.9%) | 78 (2.6%) |
| 40 to 44 Minutes | 34 (1.3%) | 52 (1.7%) |
| 45 to 59 Minutes | 137 (5.1%) | 117 (3.9%) |
| 60 to 89 Minutes | 186 (6.9%) | 84 (2.8%) |
| 90 or more Minutes | 19 (0.7%) | 0 (0.0%) |
Time of Departure to Work by Sex in Geneva
The most frequent times of departure to work in Geneva are 6:30 AM to 6:59 AM (404, 14.9%) for males and 12:00 PM to 3:59 PM (543, 18.1%) for females.
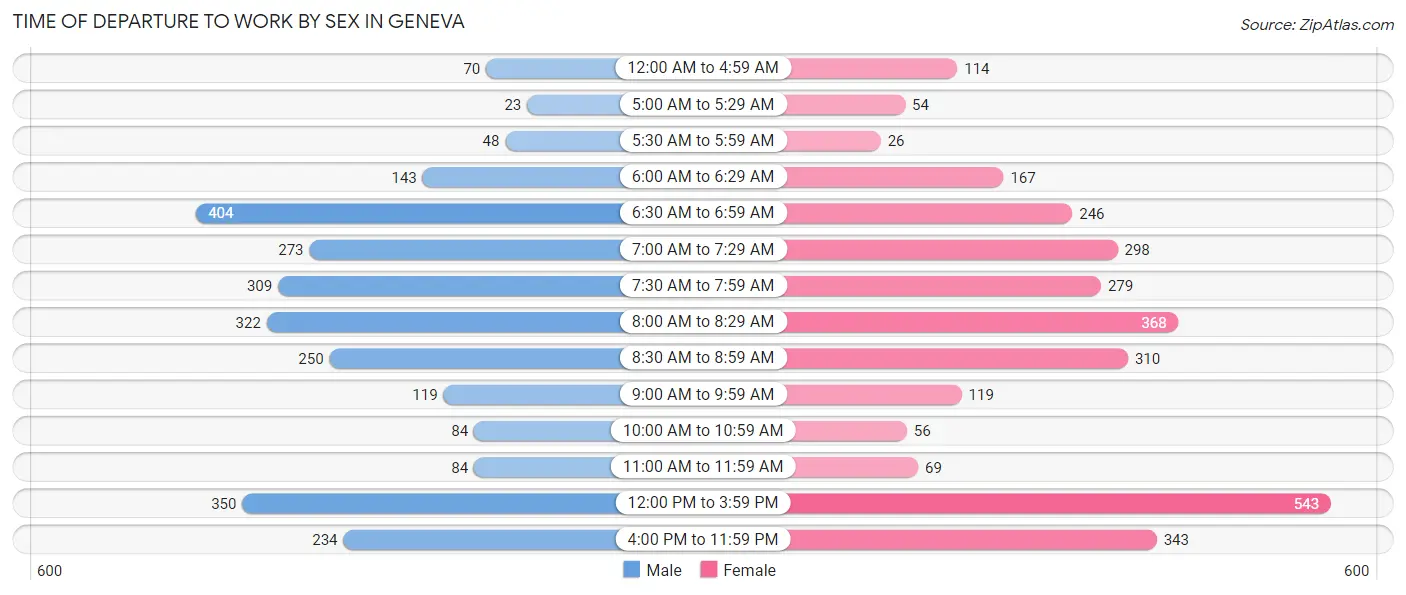
| Time of Departure | Male | Female |
| 12:00 AM to 4:59 AM | 70 (2.6%) | 114 (3.8%) |
| 5:00 AM to 5:29 AM | 23 (0.9%) | 54 (1.8%) |
| 5:30 AM to 5:59 AM | 48 (1.8%) | 26 (0.9%) |
| 6:00 AM to 6:29 AM | 143 (5.3%) | 167 (5.6%) |
| 6:30 AM to 6:59 AM | 404 (14.9%) | 246 (8.2%) |
| 7:00 AM to 7:29 AM | 273 (10.1%) | 298 (10.0%) |
| 7:30 AM to 7:59 AM | 309 (11.4%) | 279 (9.3%) |
| 8:00 AM to 8:29 AM | 322 (11.9%) | 368 (12.3%) |
| 8:30 AM to 8:59 AM | 250 (9.2%) | 310 (10.4%) |
| 9:00 AM to 9:59 AM | 119 (4.4%) | 119 (4.0%) |
| 10:00 AM to 10:59 AM | 84 (3.1%) | 56 (1.9%) |
| 11:00 AM to 11:59 AM | 84 (3.1%) | 69 (2.3%) |
| 12:00 PM to 3:59 PM | 350 (12.9%) | 543 (18.1%) |
| 4:00 PM to 11:59 PM | 234 (8.6%) | 343 (11.5%) |
| Total | 2,713 (100.0%) | 2,992 (100.0%) |
Housing Occupancy in Geneva
Occupancy by Ownership in Geneva
Of the total 4,759 dwellings in Geneva, owner-occupied units account for 2,303 (48.4%), while renter-occupied units make up 2,456 (51.6%).
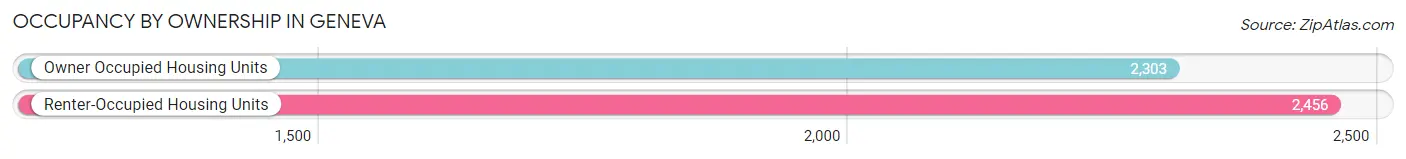
| Occupancy | # Housing Units | % Housing Units |
| Owner Occupied Housing Units | 2,303 | 48.4% |
| Renter-Occupied Housing Units | 2,456 | 51.6% |
| Total Occupied Housing Units | 4,759 | 100.0% |
Occupancy by Household Size in Geneva
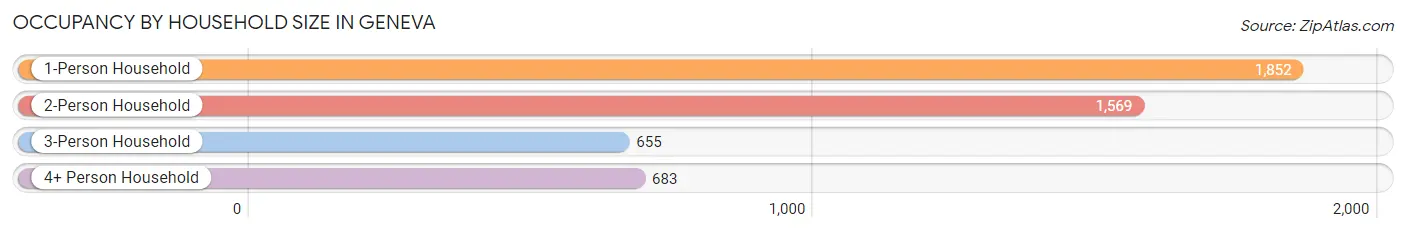
| Household Size | # Housing Units | % Housing Units |
| 1-Person Household | 1,852 | 38.9% |
| 2-Person Household | 1,569 | 33.0% |
| 3-Person Household | 655 | 13.8% |
| 4+ Person Household | 683 | 14.3% |
| Total Housing Units | 4,759 | 100.0% |
Occupancy by Ownership by Household Size in Geneva
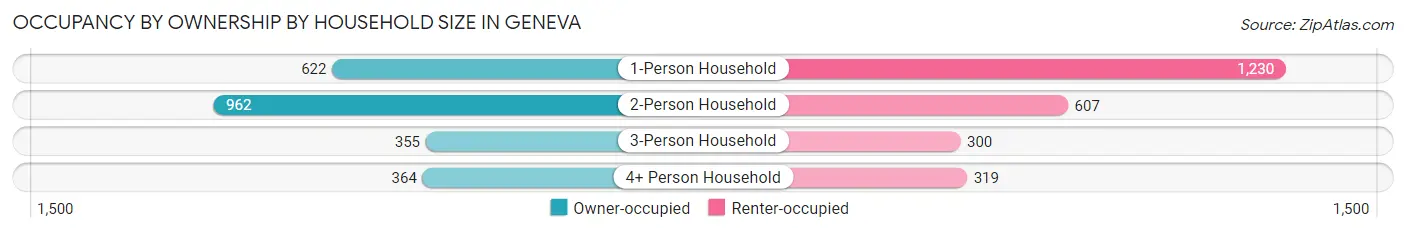
| Household Size | Owner-occupied | Renter-occupied |
| 1-Person Household | 622 (33.6%) | 1,230 (66.4%) |
| 2-Person Household | 962 (61.3%) | 607 (38.7%) |
| 3-Person Household | 355 (54.2%) | 300 (45.8%) |
| 4+ Person Household | 364 (53.3%) | 319 (46.7%) |
| Total Housing Units | 2,303 (48.4%) | 2,456 (51.6%) |
Occupancy by Educational Attainment in Geneva
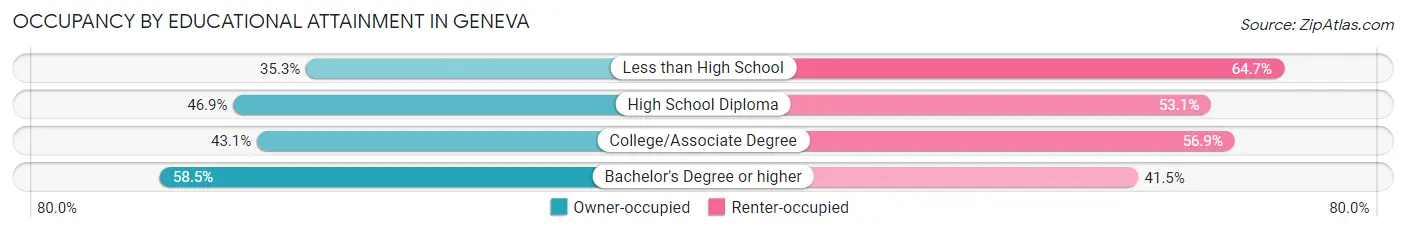
| Household Size | Owner-occupied | Renter-occupied |
| Less than High School | 147 (35.3%) | 269 (64.7%) |
| High School Diploma | 544 (46.9%) | 616 (53.1%) |
| College/Associate Degree | 703 (43.1%) | 927 (56.9%) |
| Bachelor's Degree or higher | 909 (58.5%) | 644 (41.5%) |
Occupancy by Age of Householder in Geneva
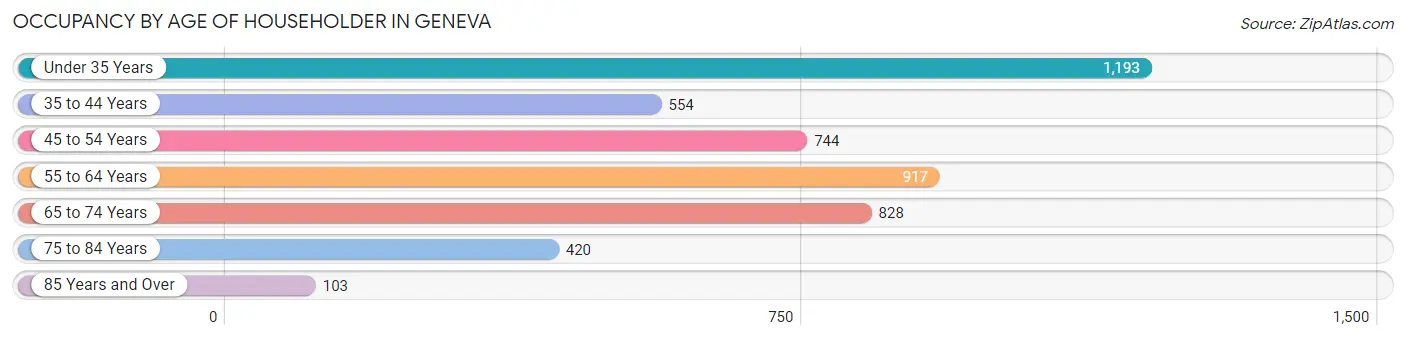
| Age Bracket | # Households | % Households |
| Under 35 Years | 1,193 | 25.1% |
| 35 to 44 Years | 554 | 11.6% |
| 45 to 54 Years | 744 | 15.6% |
| 55 to 64 Years | 917 | 19.3% |
| 65 to 74 Years | 828 | 17.4% |
| 75 to 84 Years | 420 | 8.8% |
| 85 Years and Over | 103 | 2.2% |
| Total | 4,759 | 100.0% |
Housing Finances in Geneva
Median Income by Occupancy in Geneva
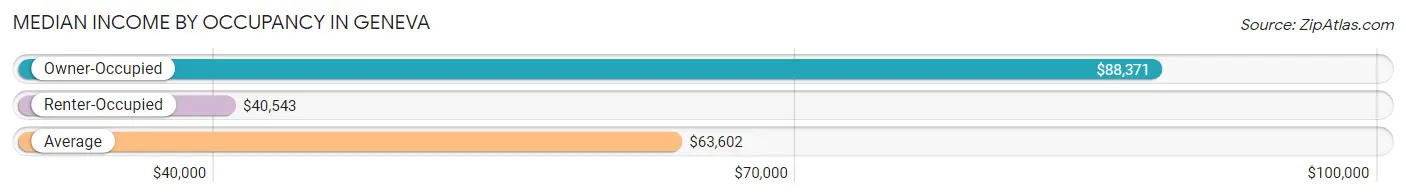
| Occupancy Type | # Households | Median Income |
| Owner-Occupied | 2,303 (48.4%) | $88,371 |
| Renter-Occupied | 2,456 (51.6%) | $40,543 |
| Average | 4,759 (100.0%) | $63,602 |
Occupancy by Householder Income Bracket in Geneva
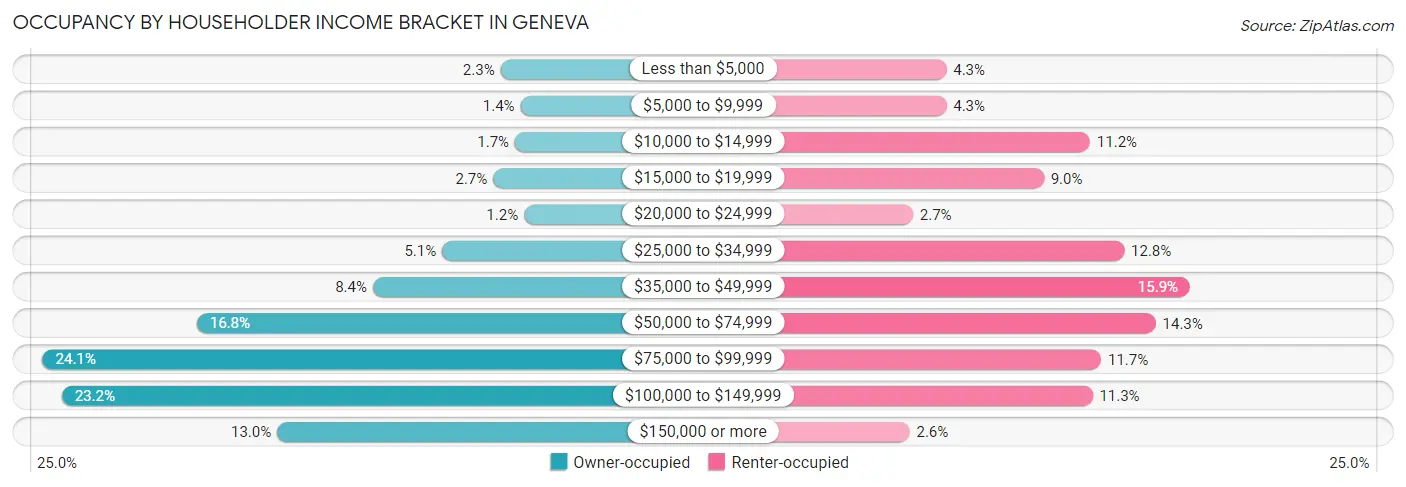
| Income Bracket | Owner-occupied | Renter-occupied |
| Less than $5,000 | 54 (2.3%) | 106 (4.3%) |
| $5,000 to $9,999 | 32 (1.4%) | 106 (4.3%) |
| $10,000 to $14,999 | 38 (1.7%) | 274 (11.2%) |
| $15,000 to $19,999 | 62 (2.7%) | 220 (9.0%) |
| $20,000 to $24,999 | 28 (1.2%) | 67 (2.7%) |
| $25,000 to $34,999 | 118 (5.1%) | 314 (12.8%) |
| $35,000 to $49,999 | 194 (8.4%) | 391 (15.9%) |
| $50,000 to $74,999 | 387 (16.8%) | 351 (14.3%) |
| $75,000 to $99,999 | 556 (24.1%) | 287 (11.7%) |
| $100,000 to $149,999 | 535 (23.2%) | 277 (11.3%) |
| $150,000 or more | 299 (13.0%) | 63 (2.6%) |
| Total | 2,303 (100.0%) | 2,456 (100.0%) |
Monthly Housing Cost Tiers in Geneva
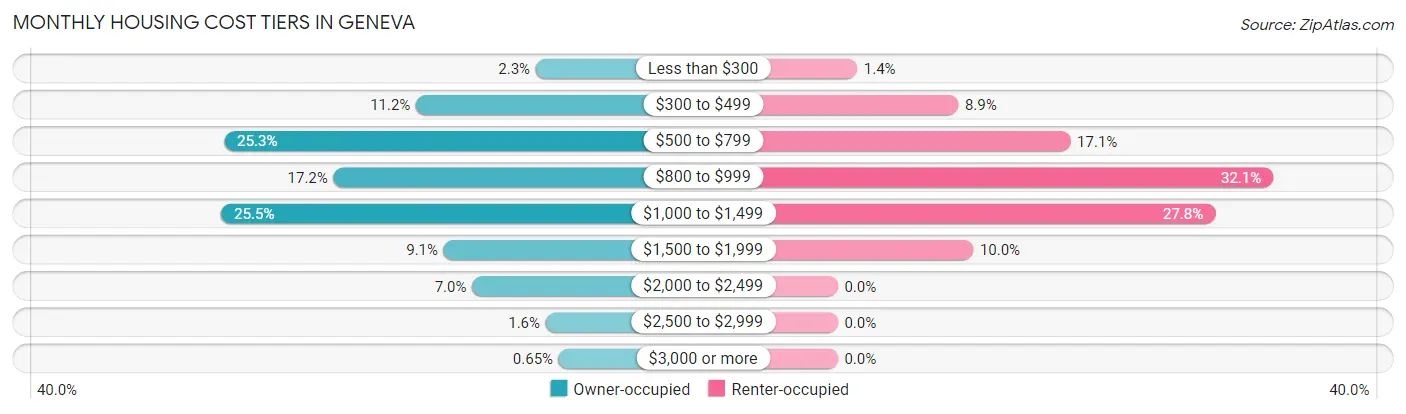
| Monthly Cost | Owner-occupied | Renter-occupied |
| Less than $300 | 54 (2.3%) | 35 (1.4%) |
| $300 to $499 | 257 (11.2%) | 218 (8.9%) |
| $500 to $799 | 583 (25.3%) | 421 (17.1%) |
| $800 to $999 | 397 (17.2%) | 788 (32.1%) |
| $1,000 to $1,499 | 588 (25.5%) | 683 (27.8%) |
| $1,500 to $1,999 | 210 (9.1%) | 245 (10.0%) |
| $2,000 to $2,499 | 162 (7.0%) | 0 (0.0%) |
| $2,500 to $2,999 | 37 (1.6%) | 0 (0.0%) |
| $3,000 or more | 15 (0.6%) | 0 (0.0%) |
| Total | 2,303 (100.0%) | 2,456 (100.0%) |
Physical Housing Characteristics in Geneva
Housing Structures in Geneva
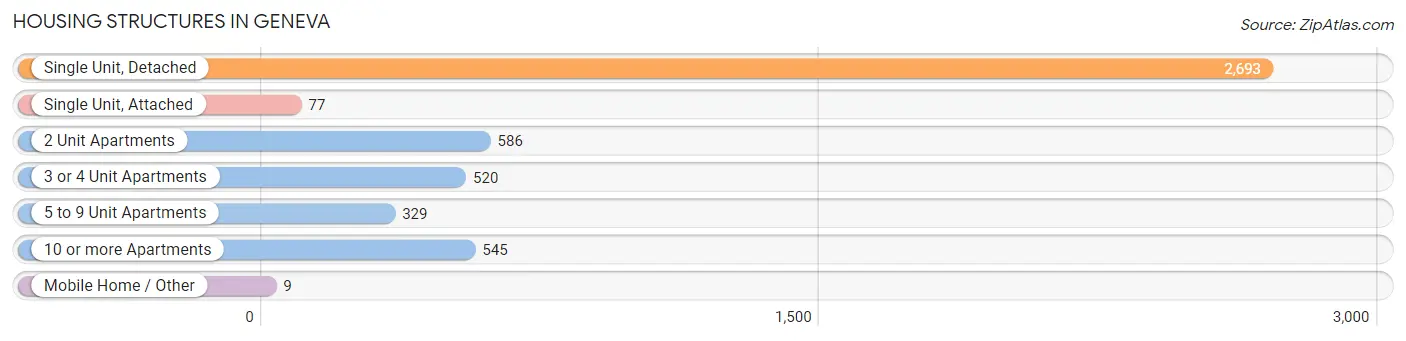
| Structure Type | # Housing Units | % Housing Units |
| Single Unit, Detached | 2,693 | 56.6% |
| Single Unit, Attached | 77 | 1.6% |
| 2 Unit Apartments | 586 | 12.3% |
| 3 or 4 Unit Apartments | 520 | 10.9% |
| 5 to 9 Unit Apartments | 329 | 6.9% |
| 10 or more Apartments | 545 | 11.5% |
| Mobile Home / Other | 9 | 0.2% |
| Total | 4,759 | 100.0% |
Housing Structures by Occupancy in Geneva
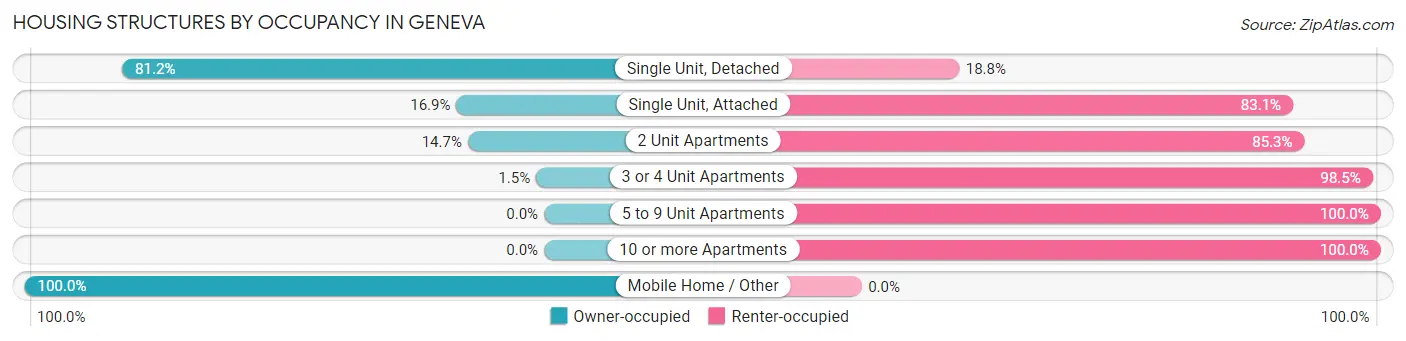
| Structure Type | Owner-occupied | Renter-occupied |
| Single Unit, Detached | 2,187 (81.2%) | 506 (18.8%) |
| Single Unit, Attached | 13 (16.9%) | 64 (83.1%) |
| 2 Unit Apartments | 86 (14.7%) | 500 (85.3%) |
| 3 or 4 Unit Apartments | 8 (1.5%) | 512 (98.5%) |
| 5 to 9 Unit Apartments | 0 (0.0%) | 329 (100.0%) |
| 10 or more Apartments | 0 (0.0%) | 545 (100.0%) |
| Mobile Home / Other | 9 (100.0%) | 0 (0.0%) |
| Total | 2,303 (48.4%) | 2,456 (51.6%) |
Housing Structures by Number of Rooms in Geneva
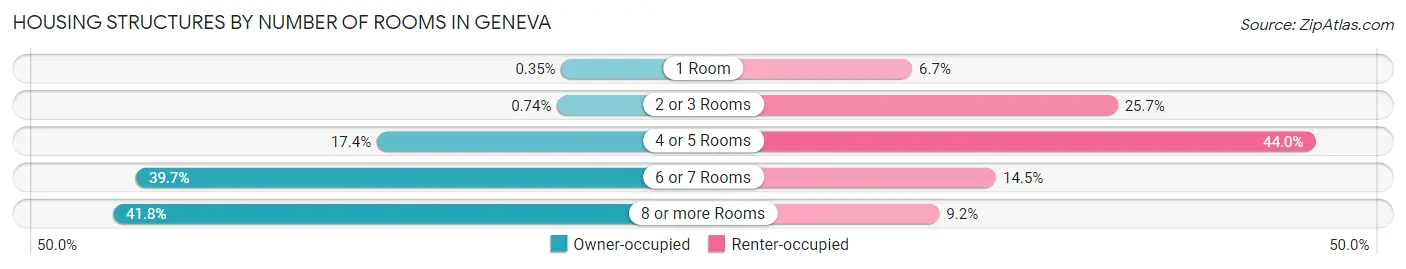
| Number of Rooms | Owner-occupied | Renter-occupied |
| 1 Room | 8 (0.4%) | 164 (6.7%) |
| 2 or 3 Rooms | 17 (0.7%) | 631 (25.7%) |
| 4 or 5 Rooms | 401 (17.4%) | 1,080 (44.0%) |
| 6 or 7 Rooms | 914 (39.7%) | 355 (14.4%) |
| 8 or more Rooms | 963 (41.8%) | 226 (9.2%) |
| Total | 2,303 (100.0%) | 2,456 (100.0%) |
Housing Structure by Heating Type in Geneva
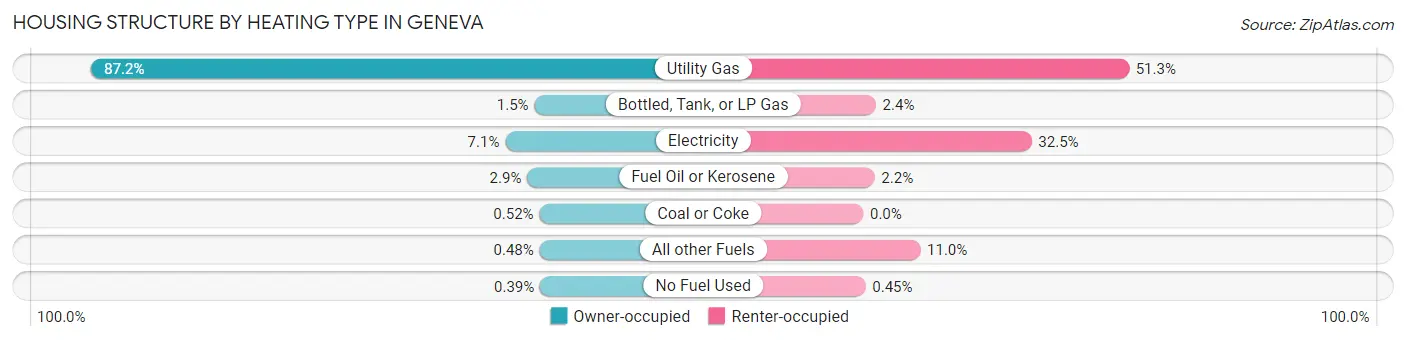
| Heating Type | Owner-occupied | Renter-occupied |
| Utility Gas | 2,007 (87.2%) | 1,261 (51.3%) |
| Bottled, Tank, or LP Gas | 34 (1.5%) | 60 (2.4%) |
| Electricity | 164 (7.1%) | 799 (32.5%) |
| Fuel Oil or Kerosene | 66 (2.9%) | 54 (2.2%) |
| Coal or Coke | 12 (0.5%) | 0 (0.0%) |
| All other Fuels | 11 (0.5%) | 271 (11.0%) |
| No Fuel Used | 9 (0.4%) | 11 (0.4%) |
| Total | 2,303 (100.0%) | 2,456 (100.0%) |
Household Vehicle Usage in Geneva
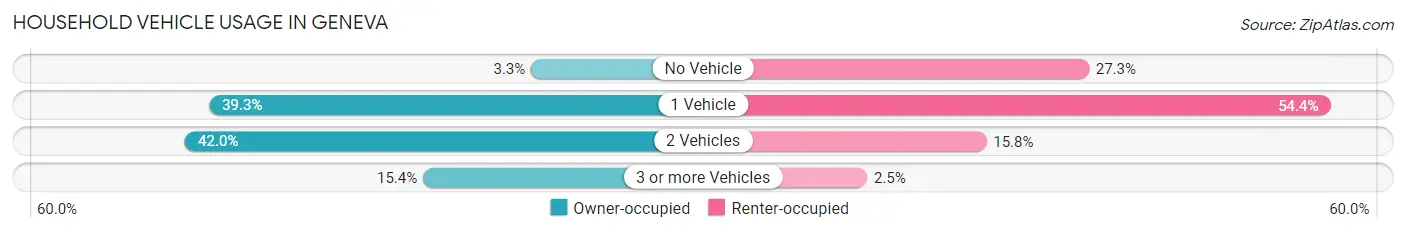
| Vehicles per Household | Owner-occupied | Renter-occupied |
| No Vehicle | 75 (3.3%) | 671 (27.3%) |
| 1 Vehicle | 906 (39.3%) | 1,335 (54.4%) |
| 2 Vehicles | 968 (42.0%) | 389 (15.8%) |
| 3 or more Vehicles | 354 (15.4%) | 61 (2.5%) |
| Total | 2,303 (100.0%) | 2,456 (100.0%) |
Real Estate & Mortgages in Geneva
Real Estate and Mortgage Overview in Geneva
| Characteristic | Without Mortgage | With Mortgage |
| Housing Units | 1,051 | 1,252 |
| Median Property Value | $117,400 | $130,100 |
| Median Household Income | $80,043 | $215 |
| Monthly Housing Costs | $652 | $15 |
| Real Estate Taxes | $3,428 | $29 |
Property Value by Mortgage Status in Geneva
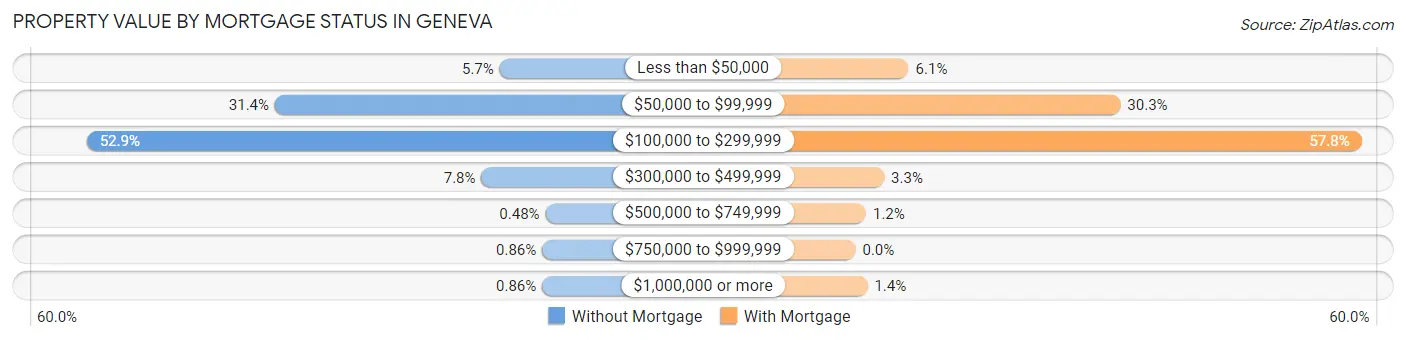
| Property Value | Without Mortgage | With Mortgage |
| Less than $50,000 | 60 (5.7%) | 76 (6.1%) |
| $50,000 to $99,999 | 330 (31.4%) | 379 (30.3%) |
| $100,000 to $299,999 | 556 (52.9%) | 724 (57.8%) |
| $300,000 to $499,999 | 82 (7.8%) | 41 (3.3%) |
| $500,000 to $749,999 | 5 (0.5%) | 15 (1.2%) |
| $750,000 to $999,999 | 9 (0.9%) | 0 (0.0%) |
| $1,000,000 or more | 9 (0.9%) | 17 (1.4%) |
| Total | 1,051 (100.0%) | 1,252 (100.0%) |
Household Income by Mortgage Status in Geneva
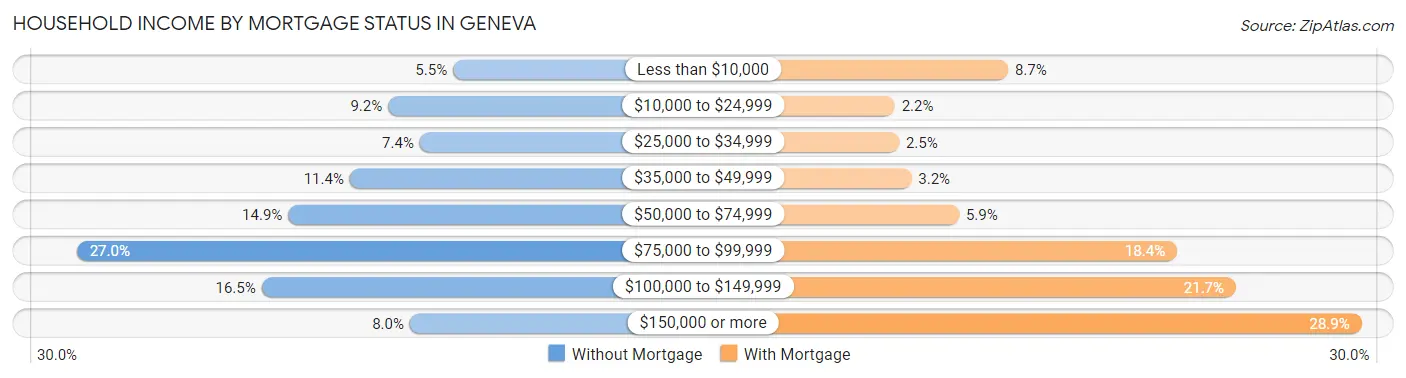
| Household Income | Without Mortgage | With Mortgage |
| Less than $10,000 | 58 (5.5%) | 109 (8.7%) |
| $10,000 to $24,999 | 97 (9.2%) | 28 (2.2%) |
| $25,000 to $34,999 | 78 (7.4%) | 31 (2.5%) |
| $35,000 to $49,999 | 120 (11.4%) | 40 (3.2%) |
| $50,000 to $74,999 | 157 (14.9%) | 74 (5.9%) |
| $75,000 to $99,999 | 284 (27.0%) | 230 (18.4%) |
| $100,000 to $149,999 | 173 (16.5%) | 272 (21.7%) |
| $150,000 or more | 84 (8.0%) | 362 (28.9%) |
| Total | 1,051 (100.0%) | 1,252 (100.0%) |
Property Value to Household Income Ratio in Geneva
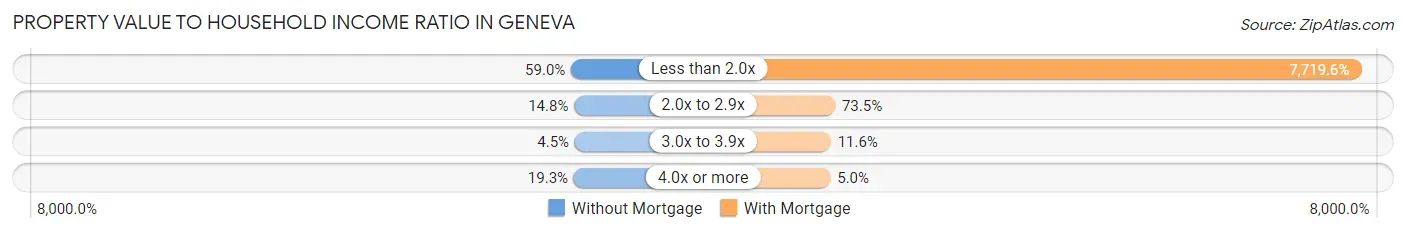
| Value-to-Income Ratio | Without Mortgage | With Mortgage |
| Less than 2.0x | 620 (59.0%) | 96,649 (7,719.6%) |
| 2.0x to 2.9x | 155 (14.7%) | 920 (73.5%) |
| 3.0x to 3.9x | 47 (4.5%) | 145 (11.6%) |
| 4.0x or more | 203 (19.3%) | 62 (5.0%) |
| Total | 1,051 (100.0%) | 1,252 (100.0%) |
Real Estate Taxes by Mortgage Status in Geneva
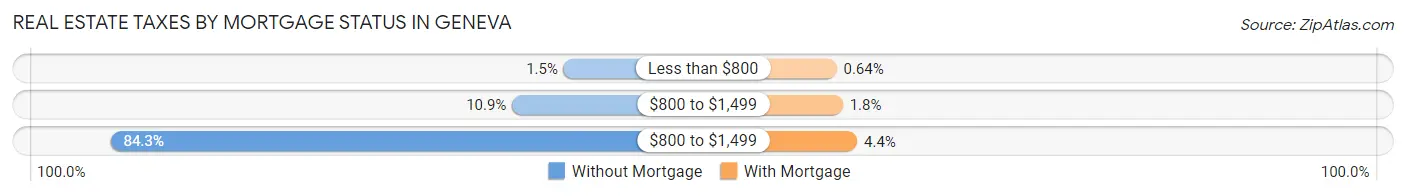
| Property Taxes | Without Mortgage | With Mortgage |
| Less than $800 | 16 (1.5%) | 8 (0.6%) |
| $800 to $1,499 | 115 (10.9%) | 22 (1.8%) |
| $800 to $1,499 | 886 (84.3%) | 55 (4.4%) |
| Total | 1,051 (100.0%) | 1,252 (100.0%) |
Health & Disability in Geneva
Health Insurance Coverage by Age in Geneva
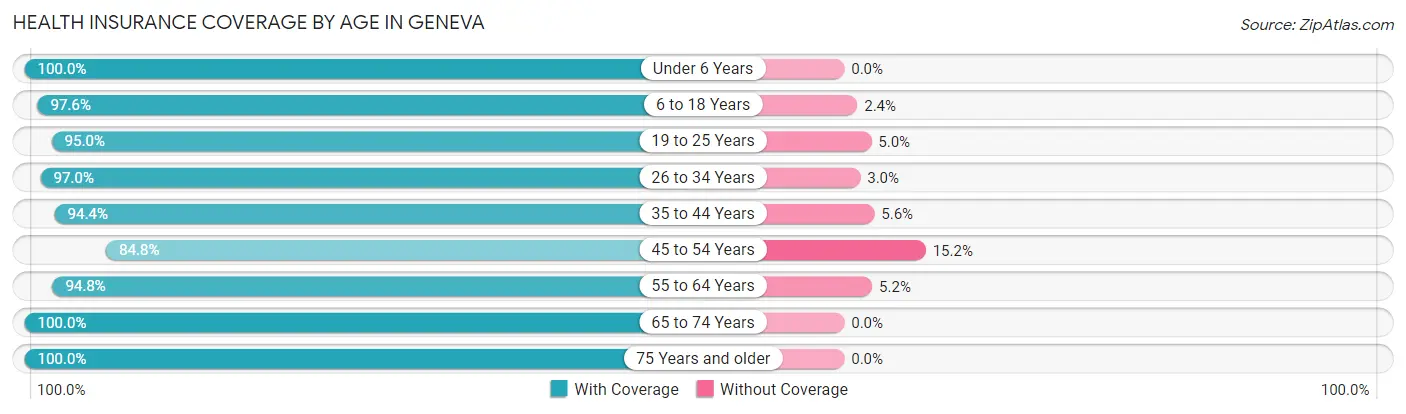
| Age Bracket | With Coverage | Without Coverage |
| Under 6 Years | 916 (100.0%) | 0 (0.0%) |
| 6 to 18 Years | 1,653 (97.6%) | 41 (2.4%) |
| 19 to 25 Years | 2,846 (95.0%) | 151 (5.0%) |
| 26 to 34 Years | 1,304 (97.0%) | 40 (3.0%) |
| 35 to 44 Years | 911 (94.4%) | 54 (5.6%) |
| 45 to 54 Years | 1,100 (84.8%) | 197 (15.2%) |
| 55 to 64 Years | 1,421 (94.8%) | 78 (5.2%) |
| 65 to 74 Years | 1,128 (100.0%) | 0 (0.0%) |
| 75 Years and older | 703 (100.0%) | 0 (0.0%) |
| Total | 11,982 (95.5%) | 561 (4.5%) |
Health Insurance Coverage by Citizenship Status in Geneva
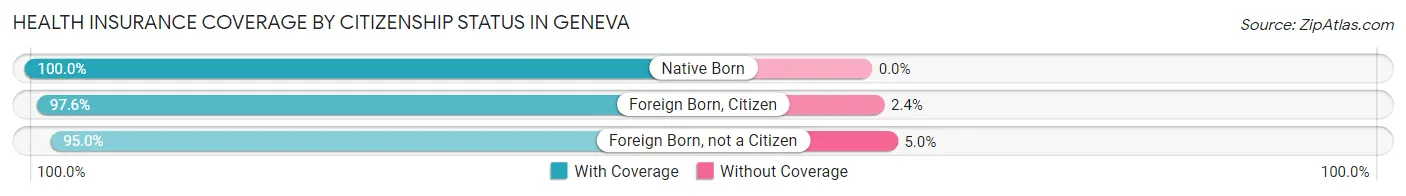
| Citizenship Status | With Coverage | Without Coverage |
| Native Born | 916 (100.0%) | 0 (0.0%) |
| Foreign Born, Citizen | 1,653 (97.6%) | 41 (2.4%) |
| Foreign Born, not a Citizen | 2,846 (95.0%) | 151 (5.0%) |
Health Insurance Coverage by Household Income in Geneva
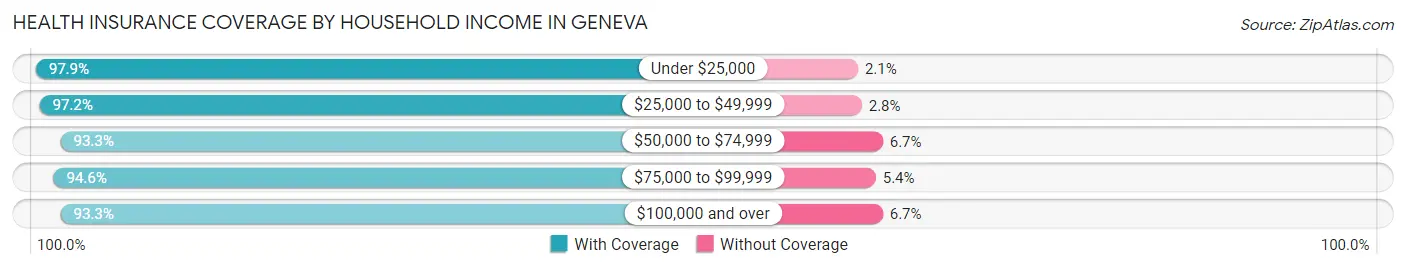
| Household Income | With Coverage | Without Coverage |
| Under $25,000 | 1,675 (97.9%) | 36 (2.1%) |
| $25,000 to $49,999 | 1,696 (97.2%) | 49 (2.8%) |
| $50,000 to $74,999 | 1,440 (93.3%) | 104 (6.7%) |
| $75,000 to $99,999 | 2,021 (94.6%) | 116 (5.4%) |
| $100,000 and over | 3,056 (93.3%) | 221 (6.7%) |
Public vs Private Health Insurance Coverage by Age in Geneva
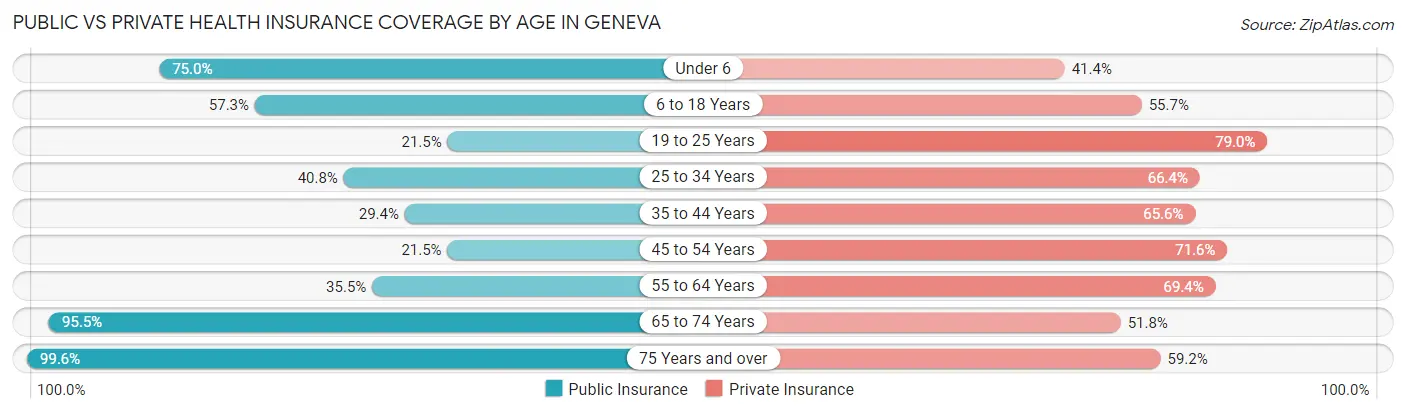
| Age Bracket | Public Insurance | Private Insurance |
| Under 6 | 687 (75.0%) | 379 (41.4%) |
| 6 to 18 Years | 970 (57.3%) | 943 (55.7%) |
| 19 to 25 Years | 644 (21.5%) | 2,367 (79.0%) |
| 25 to 34 Years | 548 (40.8%) | 893 (66.4%) |
| 35 to 44 Years | 284 (29.4%) | 633 (65.6%) |
| 45 to 54 Years | 279 (21.5%) | 928 (71.6%) |
| 55 to 64 Years | 532 (35.5%) | 1,040 (69.4%) |
| 65 to 74 Years | 1,077 (95.5%) | 584 (51.8%) |
| 75 Years and over | 700 (99.6%) | 416 (59.2%) |
| Total | 5,721 (45.6%) | 8,183 (65.2%) |
Disability Status by Sex by Age in Geneva
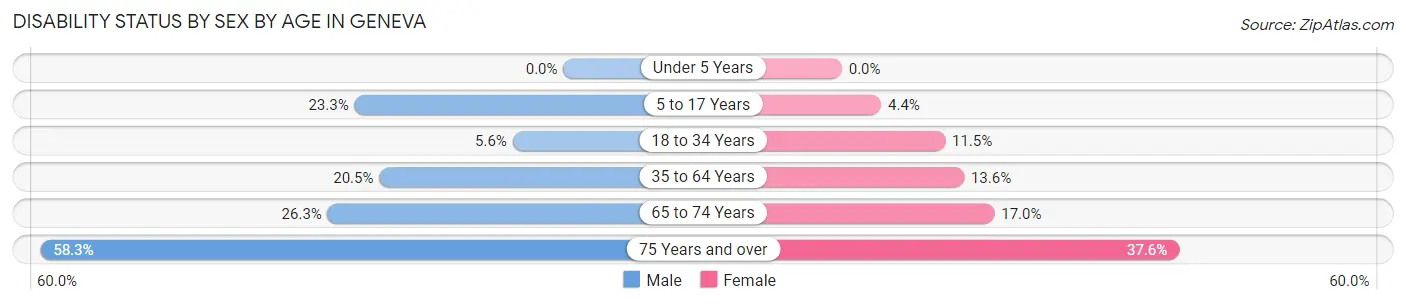
| Age Bracket | Male | Female |
| Under 5 Years | 0 (0.0%) | 0 (0.0%) |
| 5 to 17 Years | 157 (23.3%) | 31 (4.4%) |
| 18 to 34 Years | 144 (5.6%) | 260 (11.5%) |
| 35 to 64 Years | 393 (20.5%) | 251 (13.6%) |
| 65 to 74 Years | 126 (26.3%) | 110 (17.0%) |
| 75 Years and over | 166 (58.3%) | 157 (37.6%) |
Disability Class by Sex by Age in Geneva
Disability Class: Hearing Difficulty
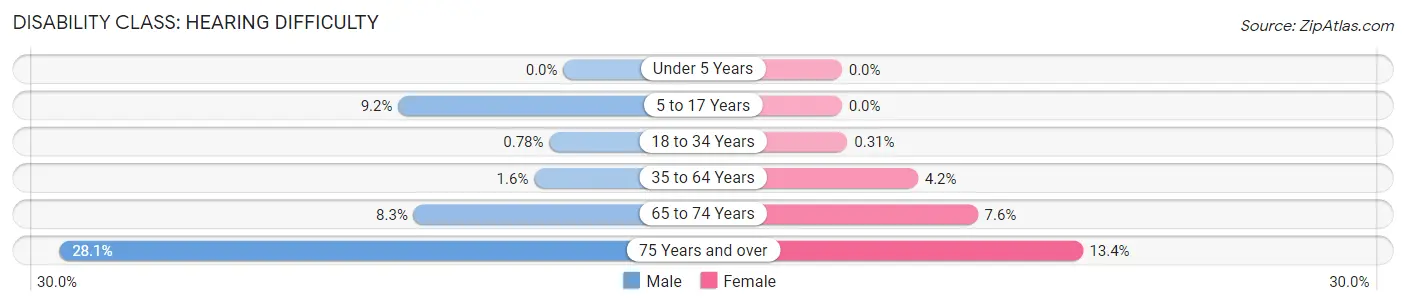
| Age Bracket | Male | Female |
| Under 5 Years | 0 (0.0%) | 0 (0.0%) |
| 5 to 17 Years | 62 (9.2%) | 0 (0.0%) |
| 18 to 34 Years | 20 (0.8%) | 7 (0.3%) |
| 35 to 64 Years | 31 (1.6%) | 78 (4.2%) |
| 65 to 74 Years | 40 (8.3%) | 49 (7.6%) |
| 75 Years and over | 80 (28.1%) | 56 (13.4%) |
Disability Class: Vision Difficulty
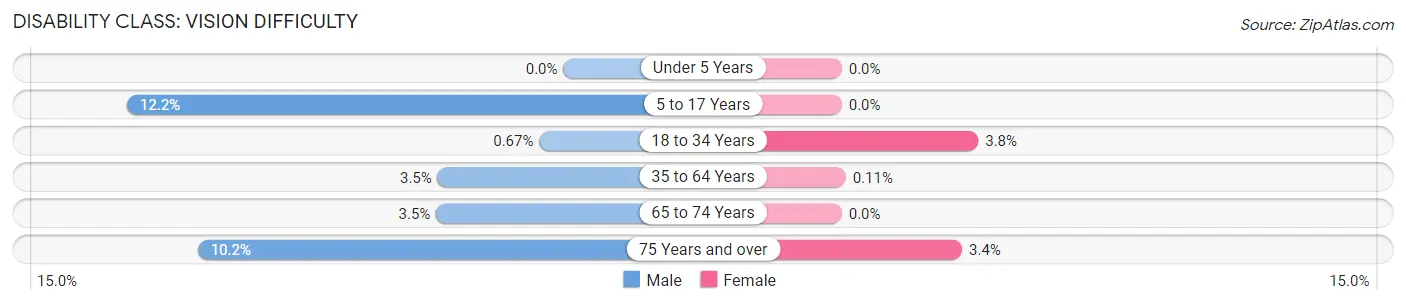
| Age Bracket | Male | Female |
| Under 5 Years | 0 (0.0%) | 0 (0.0%) |
| 5 to 17 Years | 82 (12.1%) | 0 (0.0%) |
| 18 to 34 Years | 17 (0.7%) | 86 (3.8%) |
| 35 to 64 Years | 67 (3.5%) | 2 (0.1%) |
| 65 to 74 Years | 17 (3.5%) | 0 (0.0%) |
| 75 Years and over | 29 (10.2%) | 14 (3.4%) |
Disability Class: Cognitive Difficulty
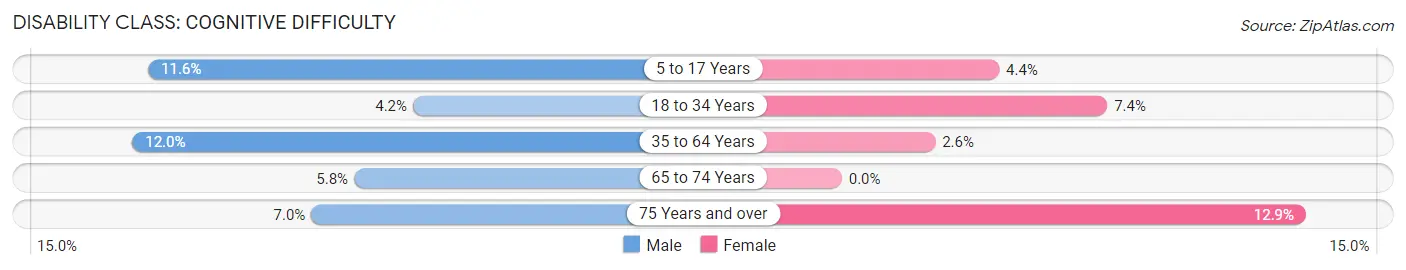
| Age Bracket | Male | Female |
| 5 to 17 Years | 78 (11.6%) | 31 (4.4%) |
| 18 to 34 Years | 107 (4.2%) | 167 (7.4%) |
| 35 to 64 Years | 230 (12.0%) | 48 (2.6%) |
| 65 to 74 Years | 28 (5.8%) | 0 (0.0%) |
| 75 Years and over | 20 (7.0%) | 54 (12.9%) |
Disability Class: Ambulatory Difficulty
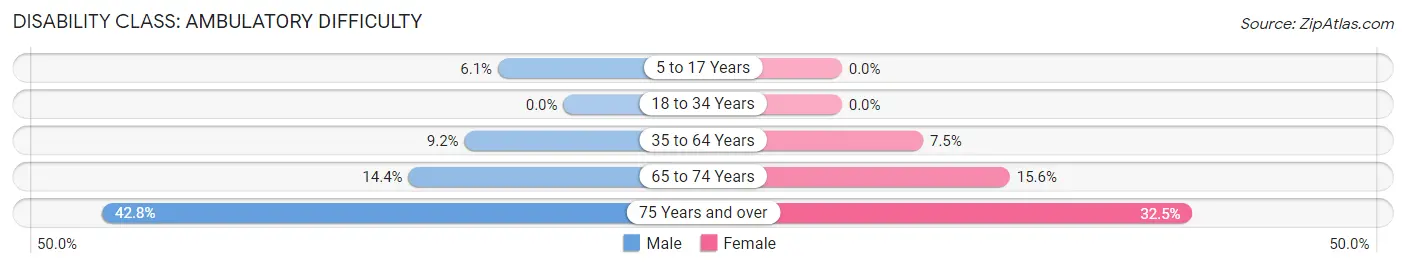
| Age Bracket | Male | Female |
| 5 to 17 Years | 41 (6.1%) | 0 (0.0%) |
| 18 to 34 Years | 0 (0.0%) | 0 (0.0%) |
| 35 to 64 Years | 176 (9.2%) | 139 (7.5%) |
| 65 to 74 Years | 69 (14.4%) | 101 (15.6%) |
| 75 Years and over | 122 (42.8%) | 136 (32.5%) |
Disability Class: Self-Care Difficulty
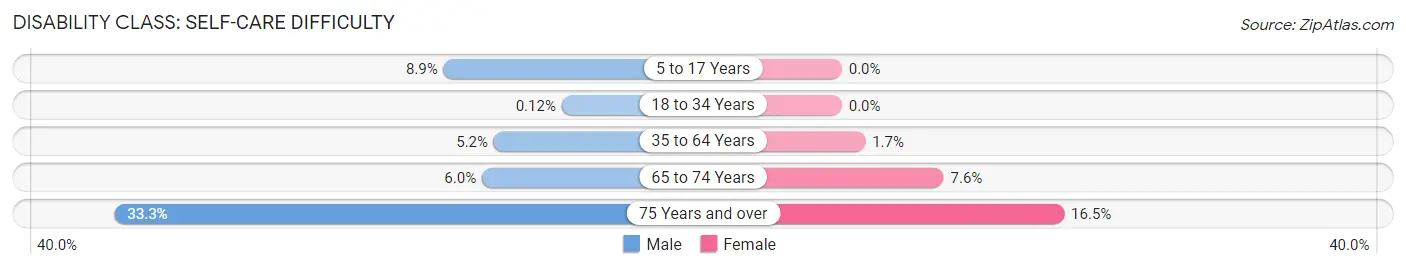
| Age Bracket | Male | Female |
| 5 to 17 Years | 60 (8.9%) | 0 (0.0%) |
| 18 to 34 Years | 3 (0.1%) | 0 (0.0%) |
| 35 to 64 Years | 99 (5.2%) | 32 (1.7%) |
| 65 to 74 Years | 29 (6.0%) | 49 (7.6%) |
| 75 Years and over | 95 (33.3%) | 69 (16.5%) |
Technology Access in Geneva
Computing Device Access in Geneva
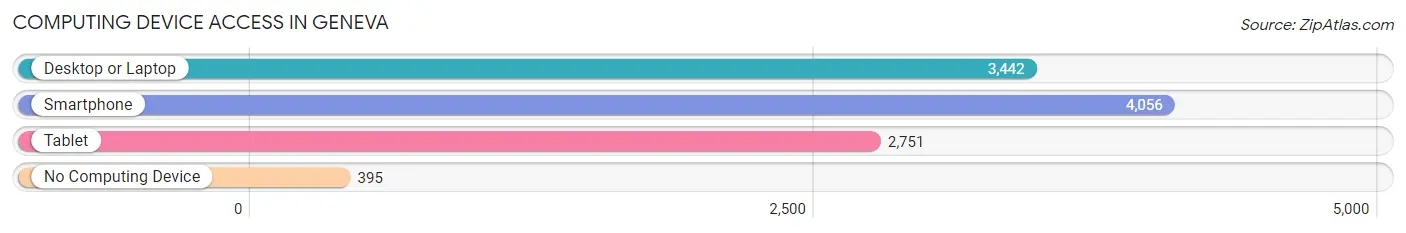
| Device Type | # Households | % Households |
| Desktop or Laptop | 3,442 | 72.3% |
| Smartphone | 4,056 | 85.2% |
| Tablet | 2,751 | 57.8% |
| No Computing Device | 395 | 8.3% |
| Total | 4,759 | 100.0% |
Internet Access in Geneva
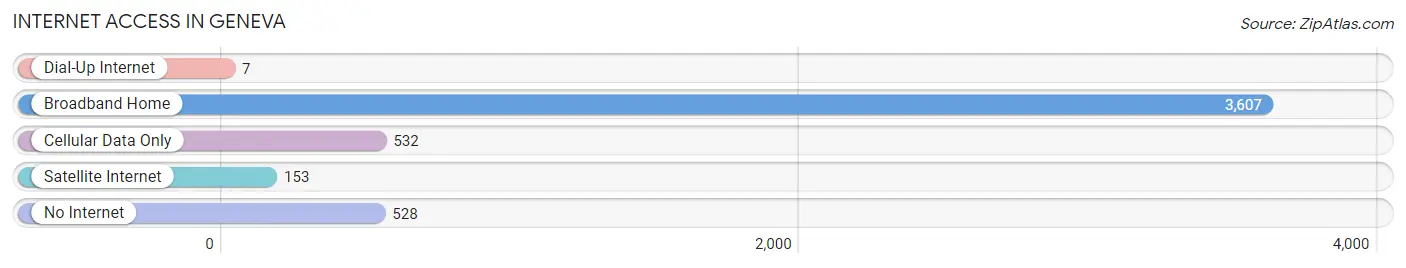
| Internet Type | # Households | % Households |
| Dial-Up Internet | 7 | 0.2% |
| Broadband Home | 3,607 | 75.8% |
| Cellular Data Only | 532 | 11.2% |
| Satellite Internet | 153 | 3.2% |
| No Internet | 528 | 11.1% |
| Total | 4,759 | 100.0% |
Geneva Summary
Geneva, New York is a city located in Ontario County, New York, United States. It is located on the northern shore of Seneca Lake, the largest of the Finger Lakes. As of the 2010 census, the city had a population of 13,261. The city is named after the city and canton of Geneva in Switzerland. It is part of the Rochester Metropolitan Statistical Area.
History
The area that is now Geneva was first settled in 1787 by pioneers from New England. The first settlers were mostly of English and Scottish descent. The area was part of the Central New York Military Tract, which was used to pay soldiers of the American Revolution. The first permanent settlement was established in 1793 by William Watkins and his family. The area was known as "Watkins Settlement" until 1806, when it was renamed "Geneva" after the city and canton of Geneva in Switzerland.
The city was officially incorporated in 1806. In the early 19th century, Geneva was an important stop on the Underground Railroad, as many escaped slaves passed through the city on their way to freedom in Canada.
Geography
Geneva is located at 42°54′N 76°59′W (42.9000, -76.9833). According to the United States Census Bureau, the city has a total area of 4.2 square miles (10.8 km2), of which 4.1 square miles (10.6 km2) is land and 0.1 square miles (0.2 km2) is water.
The city is located on the northern shore of Seneca Lake, the largest of the Finger Lakes. The city is bordered to the north by the town of Seneca Falls, to the east by the town of Waterloo, to the south by the town of Geneva, and to the west by the town of Phelps.
Economy
Geneva is a major center for the wine industry in the Finger Lakes region. The city is home to several wineries, including the award-winning Glenora Wine Cellars. The city is also home to several breweries, including the popular Three Brothers Brewing Company.
The city is also home to several large employers, including Hobart and William Smith Colleges, Finger Lakes Health, and Geneva General Hospital. The city is also home to several small businesses, including restaurants, shops, and galleries.
Demographics
As of the 2010 census, there were 13,261 people, 5,717 households, and 2,945 families residing in the city. The population density was 3,219.2 people per square mile (1,241.3/km2). There were 6,093 housing units at an average density of 1,485.2 per square mile (573.3/km2). The racial makeup of the city was 90.2% White, 4.2% African American, 0.3% Native American, 2.2% Asian, 0.7% from other races, and 2.4% from two or more races. Hispanic or Latino of any race were 3.2% of the population.
There were 5,717 households, out of which 22.2% had children under the age of 18 living with them, 38.2% were married couples living together, 11.2% had a female householder with no husband present, and 46.7% were non-families. 36.7% of all households were made up of individuals, and 13.2% had someone living alone who was 65 years of age or older. The average household size was 2.19 and the average family size was 2.86.
In the city, the population was spread out, with 19.2% under the age of 18, 20.2% from 18 to 24, 22.7% from 25 to 44, 22.2% from 45 to 64, and 15.7% who were 65 years of age or older. The median age was 33 years. For every 100 females, there were 87.2 males. For every 100 females age 18 and over, there were 83.3 males.
The median income for a household in the city was $37,813, and the median income for a family was $50,919. Males had a median income of $36,813 versus $30,917 for females. The per capita income for the city was $21,945. About 8.2% of families and 14.2% of the population were below the poverty line, including 15.2% of those under age 18 and 8.2% of those age 65 or over.
Common Questions
What is the Total Population of Geneva?
Total Population of Geneva is 12,670.
What is the Total Male Population of Geneva?
Total Male Population of Geneva is 6,272.
What is the Total Female Population of Geneva?
Total Female Population of Geneva is 6,398.
What is the Ratio of Males per 100 Females in Geneva?
There are 98.03 Males per 100 Females in Geneva.
What is the Ratio of Females per 100 Males in Geneva?
There are 102.01 Females per 100 Males in Geneva.
What is the Median Population Age in Geneva?
Median Population Age in Geneva is 31.2 Years.
What is the Average Family Size in Geneva
Average Family Size in Geneva is 2.9 People.
What is the Average Household Size in Geneva
Average Household Size in Geneva is 2.2 People.
What is Per Capita Income in Geneva?
Per Capita income in Geneva is $30,090.
What is the Median Family Income in Geneva?
Median Family Income in Geneva is $79,075.
What is the Median Household income in Geneva?
Median Household Income in Geneva is $63,602.
What is Income or Wage Gap in Geneva?
Income or Wage Gap in Geneva is 29.9%.
Women in Geneva earn 70.1 cents for every dollar earned by a man.
What is Family Income Deficit in Geneva?
Family Income Deficit in Geneva is $11,359.
Families that are below poverty line in Geneva earn $11,359 less on average than the poverty threshold level.
What is Inequality or Gini Index in Geneva?
Inequality or Gini Index in Geneva is 0.45.
How Large is the Labor Force in Geneva?
There are 6,424 People in the Labor Forcein in Geneva.
What is the Percentage of People in the Labor Force in Geneva?
59.8% of People are in the Labor Force in Geneva.
What is the Unemployment Rate in Geneva?
Unemployment Rate in Geneva is 3.1%.