Pleasant Valley, NY
Pleasant Valley Map
Pleasant Valley Overview
1,848
TOTAL POPULATION
1,042
MALE POPULATION
806
FEMALE POPULATION
129.28
MALES / 100 FEMALES
77.35
FEMALES / 100 MALES
33.3
MEDIAN AGE
3.1
AVG FAMILY SIZE
2.3
AVG HOUSEHOLD SIZE
$43,758
PER CAPITA INCOME
$109,628
AVG FAMILY INCOME
$96,510
AVG HOUSEHOLD INCOME
0.34
INEQUALITY / GINI INDEX
1,174
LABOR FORCE [ PEOPLE ]
82.8%
PERCENT IN LABOR FORCE
1.5%
UNEMPLOYMENT RATE
Pleasant Valley Zip Codes
Pleasant Valley Area Codes
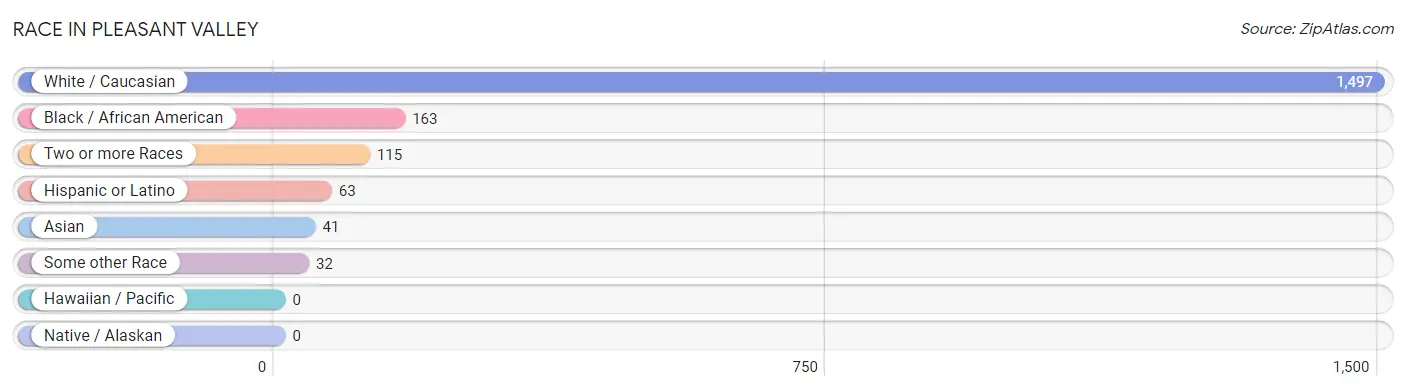
Race in Pleasant Valley
The most populous races in Pleasant Valley are White / Caucasian (1,497 | 81.0%), Black / African American (163 | 8.8%), and Two or more Races (115 | 6.2%).
| Race | # Population | % Population |
| Asian | 41 | 2.2% |
| Black / African American | 163 | 8.8% |
| Hawaiian / Pacific | 0 | 0.0% |
| Hispanic or Latino | 63 | 3.4% |
| Native / Alaskan | 0 | 0.0% |
| White / Caucasian | 1,497 | 81.0% |
| Two or more Races | 115 | 6.2% |
| Some other Race | 32 | 1.7% |
| Total | 1,848 | 100.0% |
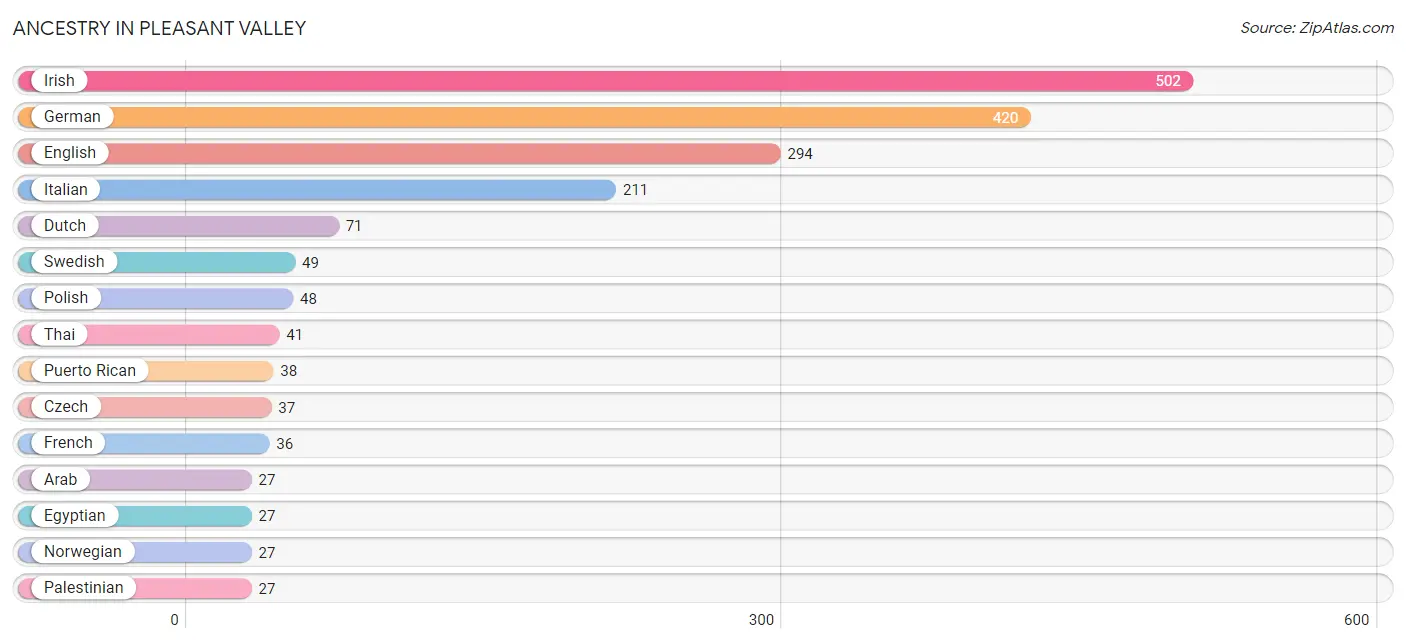
Ancestry in Pleasant Valley
The most populous ancestries reported in Pleasant Valley are Irish (502 | 27.2%), German (420 | 22.7%), English (294 | 15.9%), Italian (211 | 11.4%), and Dutch (71 | 3.8%), together accounting for 81.1% of all Pleasant Valley residents.
| Ancestry | # Population | % Population |
| American | 12 | 0.6% |
| Arab | 27 | 1.5% |
| Austrian | 14 | 0.8% |
| British West Indian | 18 | 1.0% |
| Czech | 37 | 2.0% |
| Dutch | 71 | 3.8% |
| Ecuadorian | 12 | 0.6% |
| Egyptian | 27 | 1.5% |
| English | 294 | 15.9% |
| French | 36 | 1.9% |
| German | 420 | 22.7% |
| Irish | 502 | 27.2% |
| Italian | 211 | 11.4% |
| Jamaican | 21 | 1.1% |
| Norwegian | 27 | 1.5% |
| Palestinian | 27 | 1.5% |
| Peruvian | 13 | 0.7% |
| Polish | 48 | 2.6% |
| Puerto Rican | 38 | 2.1% |
| South American | 25 | 1.3% |
| Swedish | 49 | 2.6% |
| Thai | 41 | 2.2% |
| Ukrainian | 20 | 1.1% | View All 23 Rows |
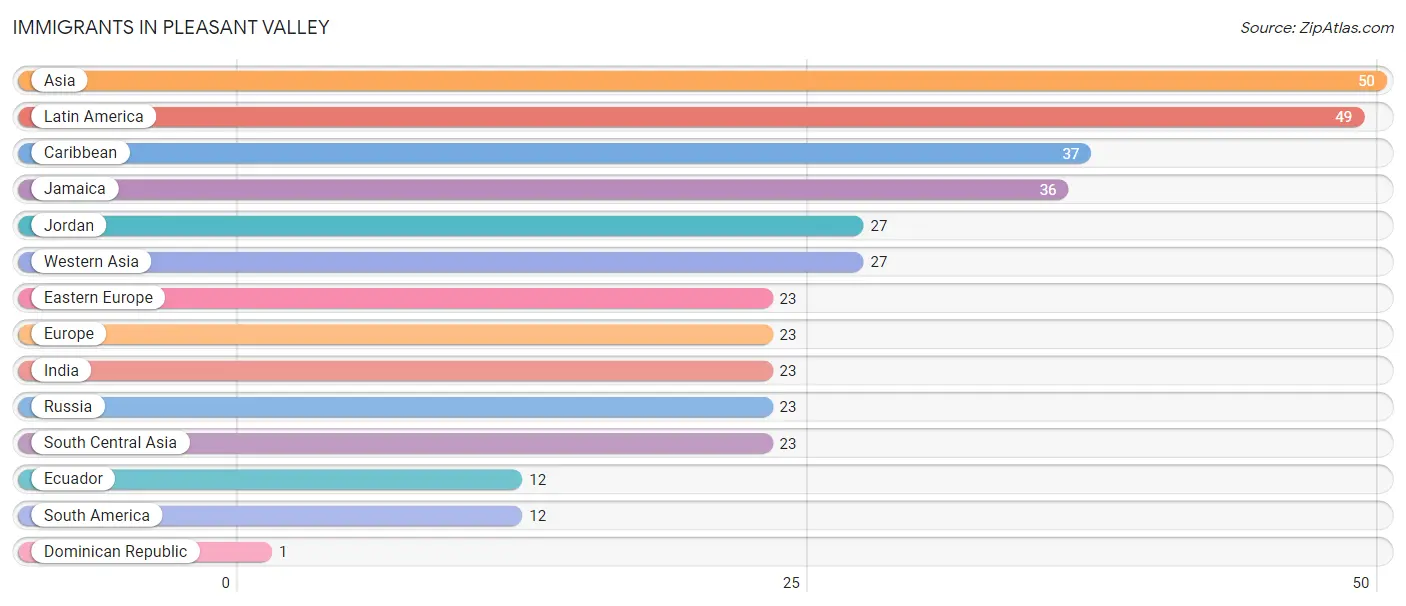
Immigrants in Pleasant Valley
The most numerous immigrant groups reported in Pleasant Valley came from Asia (50 | 2.7%), Latin America (49 | 2.6%), Caribbean (37 | 2.0%), Jamaica (36 | 1.9%), and Jordan (27 | 1.5%), together accounting for 10.8% of all Pleasant Valley residents.
| Immigration Origin | # Population | % Population |
| Asia | 50 | 2.7% |
| Caribbean | 37 | 2.0% |
| Dominican Republic | 1 | 0.1% |
| Eastern Europe | 23 | 1.2% |
| Ecuador | 12 | 0.6% |
| Europe | 23 | 1.2% |
| India | 23 | 1.2% |
| Jamaica | 36 | 1.9% |
| Jordan | 27 | 1.5% |
| Latin America | 49 | 2.6% |
| Russia | 23 | 1.2% |
| South America | 12 | 0.6% |
| South Central Asia | 23 | 1.2% |
| Western Asia | 27 | 1.5% | View All 14 Rows |
Sex and Age in Pleasant Valley
Sex and Age in Pleasant Valley
The most populous age groups in Pleasant Valley are 20 to 24 Years (315 | 30.2%) for men and 45 to 49 Years (118 | 14.6%) for women.

| Age Bracket | Male | Female |
| Under 5 Years | 69 (6.6%) | 80 (9.9%) |
| 5 to 9 Years | 39 (3.7%) | 48 (6.0%) |
| 10 to 14 Years | 76 (7.3%) | 42 (5.2%) |
| 15 to 19 Years | 0 (0.0%) | 76 (9.4%) |
| 20 to 24 Years | 315 (30.2%) | 72 (8.9%) |
| 25 to 29 Years | 42 (4.0%) | 0 (0.0%) |
| 30 to 34 Years | 60 (5.8%) | 63 (7.8%) |
| 35 to 39 Years | 35 (3.4%) | 54 (6.7%) |
| 40 to 44 Years | 58 (5.6%) | 56 (7.0%) |
| 45 to 49 Years | 48 (4.6%) | 118 (14.6%) |
| 50 to 54 Years | 60 (5.8%) | 54 (6.7%) |
| 55 to 59 Years | 74 (7.1%) | 45 (5.6%) |
| 60 to 64 Years | 32 (3.1%) | 22 (2.7%) |
| 65 to 69 Years | 30 (2.9%) | 31 (3.8%) |
| 70 to 74 Years | 45 (4.3%) | 23 (2.9%) |
| 75 to 79 Years | 51 (4.9%) | 7 (0.9%) |
| 80 to 84 Years | 0 (0.0%) | 15 (1.9%) |
| 85 Years and over | 8 (0.8%) | 0 (0.0%) |
| Total | 1,042 (100.0%) | 806 (100.0%) |
Families and Households in Pleasant Valley
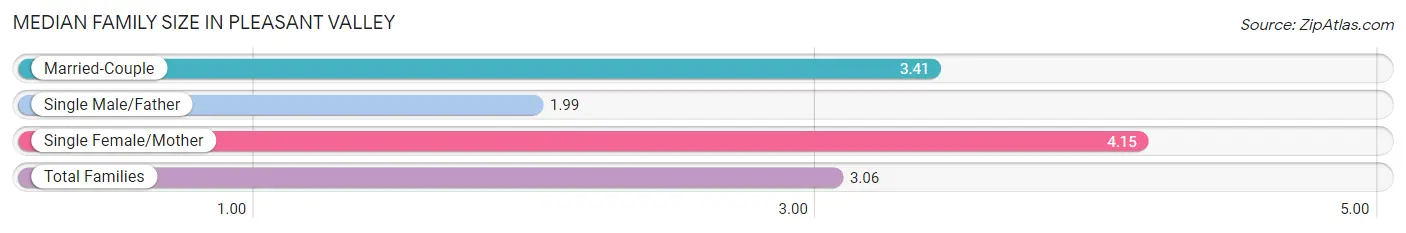
Median Family Size in Pleasant Valley
The median family size in Pleasant Valley is 3.06 persons per family, with single female/mother families (54 | 11.1%) accounting for the largest median family size of 4.15 persons per family. On the other hand, single male/father families (147 | 30.2%) represent the smallest median family size with 1.99 persons per family.
| Family Type | # Families | Family Size |
| Married-Couple | 286 (58.7%) | 3.41 |
| Single Male/Father | 147 (30.2%) | 1.99 |
| Single Female/Mother | 54 (11.1%) | 4.15 |
| Total Families | 487 (100.0%) | 3.06 |
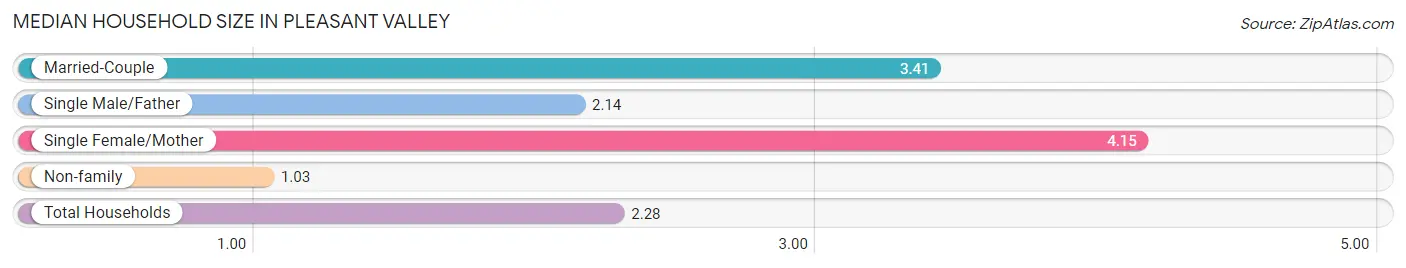
Median Household Size in Pleasant Valley
The median household size in Pleasant Valley is 2.28 persons per household, with single female/mother households (54 | 6.7%) accounting for the largest median household size of 4.15 persons per household. non-family households (325 | 40.0%) represent the smallest median household size with 1.03 persons per household.
| Household Type | # Households | Household Size |
| Married-Couple | 286 (35.2%) | 3.41 |
| Single Male/Father | 147 (18.1%) | 2.14 |
| Single Female/Mother | 54 (6.7%) | 4.15 |
| Non-family | 325 (40.0%) | 1.03 |
| Total Households | 812 (100.0%) | 2.28 |
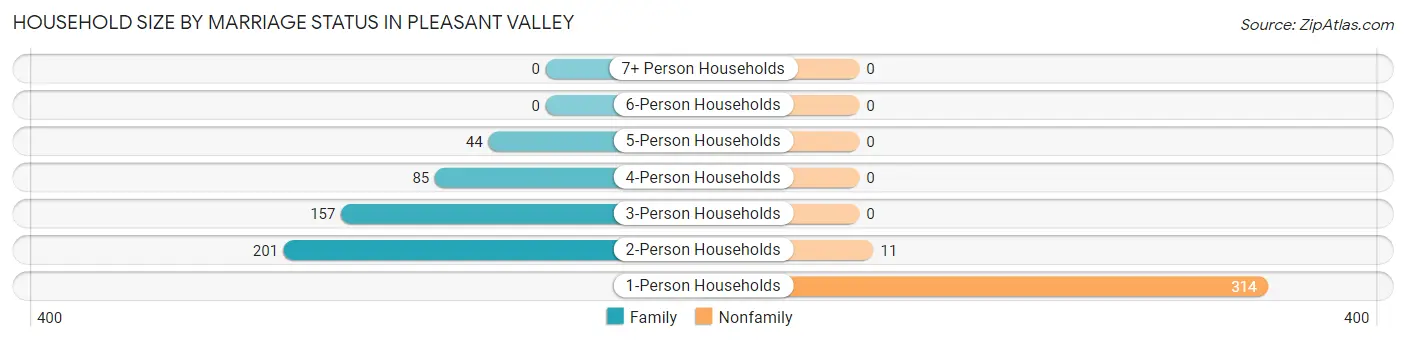
Household Size by Marriage Status in Pleasant Valley
Out of a total of 812 households in Pleasant Valley, 487 (60.0%) are family households, while 325 (40.0%) are nonfamily households. The most numerous type of family households are 2-person households, comprising 201, and the most common type of nonfamily households are 1-person households, comprising 314.
| Household Size | Family Households | Nonfamily Households |
| 1-Person Households | - | 314 (38.7%) |
| 2-Person Households | 201 (24.7%) | 11 (1.3%) |
| 3-Person Households | 157 (19.3%) | 0 (0.0%) |
| 4-Person Households | 85 (10.5%) | 0 (0.0%) |
| 5-Person Households | 44 (5.4%) | 0 (0.0%) |
| 6-Person Households | 0 (0.0%) | 0 (0.0%) |
| 7+ Person Households | 0 (0.0%) | 0 (0.0%) |
| Total | 487 (60.0%) | 325 (40.0%) |
Female Fertility in Pleasant Valley
Fertility by Age in Pleasant Valley
| Age Bracket | Women with Births | Births / 1,000 Women |
| 15 to 19 years | 0 (0.0%) | 0.0 |
| 20 to 34 years | 0 (0.0%) | 0.0 |
| 35 to 50 years | 0 (0.0%) | 0.0 |
| Total | 0 (0.0%) | 0.0 |
Fertility by Age by Marriage Status in Pleasant Valley
| Age Bracket | Married | Unmarried |
| 15 to 19 years | 0 (0.0%) | 0 (0.0%) |
| 20 to 34 years | 0 (0.0%) | 0 (0.0%) |
| 35 to 50 years | 0 (0.0%) | 0 (0.0%) |
| Total | 0 (0.0%) | 0 (0.0%) |
Fertility by Education in Pleasant Valley
| Educational Attainment | Women with Births | Births / 1,000 Women |
| Less than High School | 0 (0.0%) | 0.0 |
| High School Diploma | 0 (0.0%) | 0.0 |
| College or Associate's Degree | 0 (0.0%) | 0.0 |
| Bachelor's Degree | 0 (0.0%) | 0.0 |
| Graduate Degree | 0 (0.0%) | 0.0 |
| Total | 0 (0.0%) | 0.0 |
Fertility by Education by Marriage Status in Pleasant Valley
| Educational Attainment | Married | Unmarried |
| Less than High School | 0 (0.0%) | 0 (0.0%) |
| High School Diploma | 0 (0.0%) | 0 (0.0%) |
| College or Associate's Degree | 0 (0.0%) | 0 (0.0%) |
| Bachelor's Degree | 0 (0.0%) | 0 (0.0%) |
| Graduate Degree | 0 (0.0%) | 0 (0.0%) |
| Total | 0 (0.0%) | 0 (0.0%) |
Income in Pleasant Valley
Income Overview in Pleasant Valley
Per Capita Income in Pleasant Valley is $43,758, while median incomes of families and households are $109,628 and $96,510 respectively.
| Characteristic | Number | Measure |
| Per Capita Income | 1,848 | $43,758 |
| Median Family Income | 487 | $109,628 |
| Mean Family Income | 487 | $117,090 |
| Median Household Income | 812 | $96,510 |
| Mean Household Income | 812 | $98,787 |
| Income Deficit | 487 | $0 |
| Wage / Income Gap (%) | 1,848 | 0.00% |
| Wage / Income Gap ($) | 1,848 | 100.00¢ per $1 |
| Gini / Inequality Index | 1,848 | 0.34 |
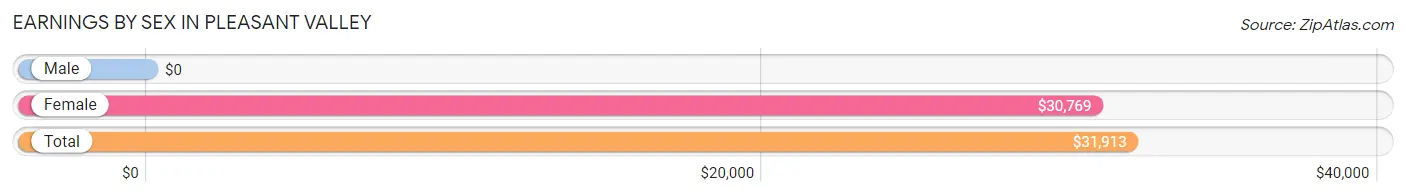
Earnings by Sex in Pleasant Valley
| Sex | Number | Average Earnings |
| Male | 714 (61.5%) | $0 |
| Female | 448 (38.6%) | $30,769 |
| Total | 1,162 (100.0%) | $31,913 |
Earnings by Sex by Income Bracket in Pleasant Valley
The most common earnings brackets in Pleasant Valley are $100,000+ for men (200 | 28.0%) and $5,000 to $7,499 for women (101 | 22.5%).
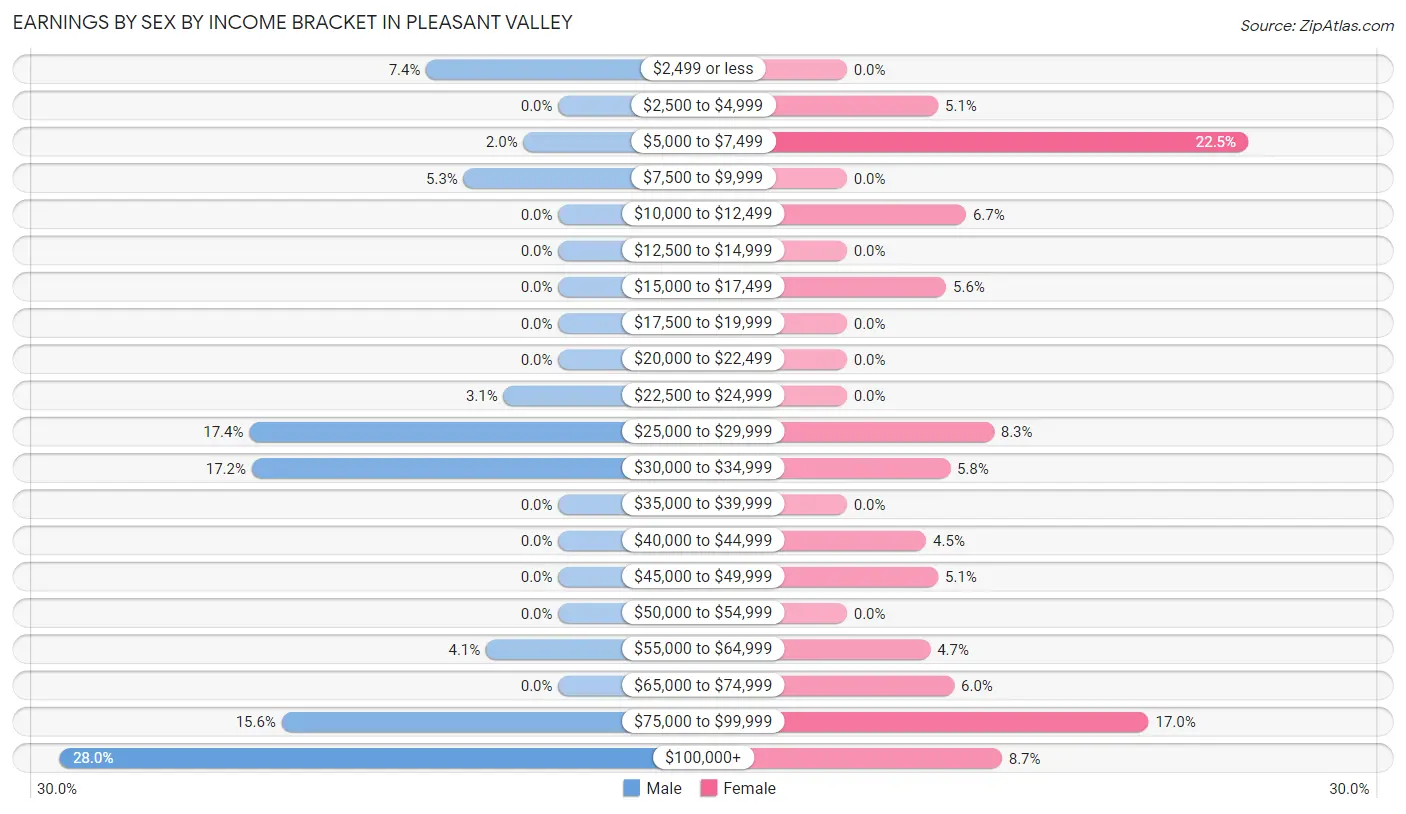
| Income | Male | Female |
| $2,499 or less | 53 (7.4%) | 0 (0.0%) |
| $2,500 to $4,999 | 0 (0.0%) | 23 (5.1%) |
| $5,000 to $7,499 | 14 (2.0%) | 101 (22.5%) |
| $7,500 to $9,999 | 38 (5.3%) | 0 (0.0%) |
| $10,000 to $12,499 | 0 (0.0%) | 30 (6.7%) |
| $12,500 to $14,999 | 0 (0.0%) | 0 (0.0%) |
| $15,000 to $17,499 | 0 (0.0%) | 25 (5.6%) |
| $17,500 to $19,999 | 0 (0.0%) | 0 (0.0%) |
| $20,000 to $22,499 | 0 (0.0%) | 0 (0.0%) |
| $22,500 to $24,999 | 22 (3.1%) | 0 (0.0%) |
| $25,000 to $29,999 | 124 (17.4%) | 37 (8.3%) |
| $30,000 to $34,999 | 123 (17.2%) | 26 (5.8%) |
| $35,000 to $39,999 | 0 (0.0%) | 0 (0.0%) |
| $40,000 to $44,999 | 0 (0.0%) | 20 (4.5%) |
| $45,000 to $49,999 | 0 (0.0%) | 23 (5.1%) |
| $50,000 to $54,999 | 0 (0.0%) | 0 (0.0%) |
| $55,000 to $64,999 | 29 (4.1%) | 21 (4.7%) |
| $65,000 to $74,999 | 0 (0.0%) | 27 (6.0%) |
| $75,000 to $99,999 | 111 (15.5%) | 76 (17.0%) |
| $100,000+ | 200 (28.0%) | 39 (8.7%) |
| Total | 714 (100.0%) | 448 (100.0%) |
Earnings by Sex by Educational Attainment in Pleasant Valley

| Educational Attainment | Male Income | Female Income |
| Less than High School | - | - |
| High School Diploma | - | - |
| College or Associate's Degree | - | - |
| Bachelor's Degree | $115,875 | $0 |
| Graduate Degree | $107,438 | $88,267 |
| Total | $100,083 | $0 |
Family Income in Pleasant Valley
Family Income Brackets in Pleasant Valley
According to the Pleasant Valley family income data, there are 163 families falling into the $100,000 to $149,999 income range, which is the most common income bracket and makes up 33.5% of all families.
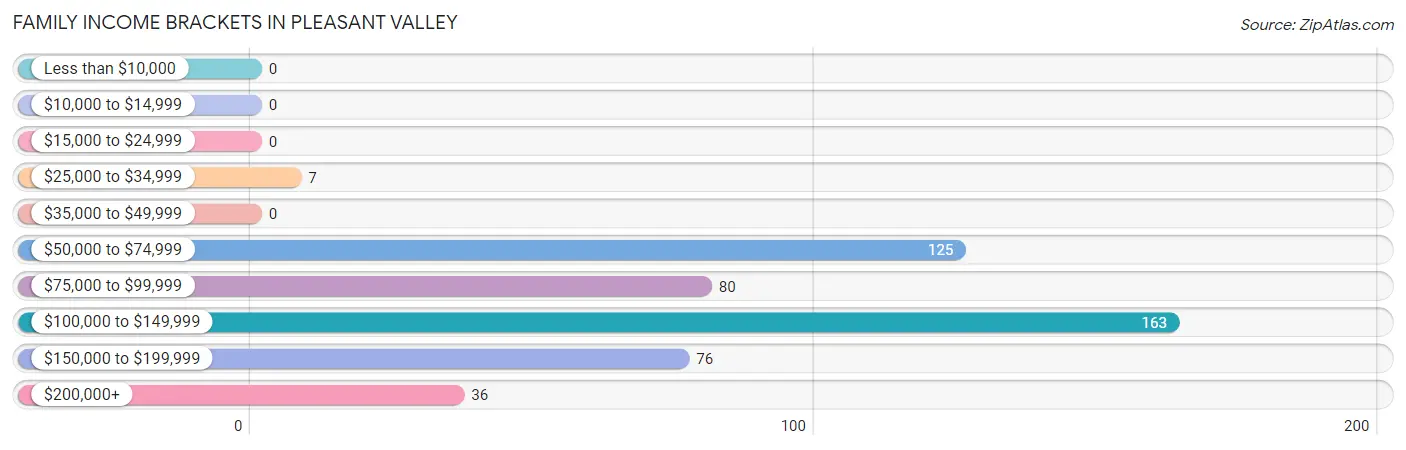
| Income Bracket | # Families | % Families |
| Less than $10,000 | 0 | 0.0% |
| $10,000 to $14,999 | 0 | 0.0% |
| $15,000 to $24,999 | 0 | 0.0% |
| $25,000 to $34,999 | 7 | 1.4% |
| $35,000 to $49,999 | 0 | 0.0% |
| $50,000 to $74,999 | 125 | 25.7% |
| $75,000 to $99,999 | 80 | 16.4% |
| $100,000 to $149,999 | 163 | 33.5% |
| $150,000 to $199,999 | 76 | 15.6% |
| $200,000+ | 36 | 7.4% |
Family Income by Famaliy Size in Pleasant Valley
3-person families (133 | 27.3%) account for the highest median family income in Pleasant Valley with $130,536 per family, while 3-person families (133 | 27.3%) have the highest median income of $43,512 per family member.
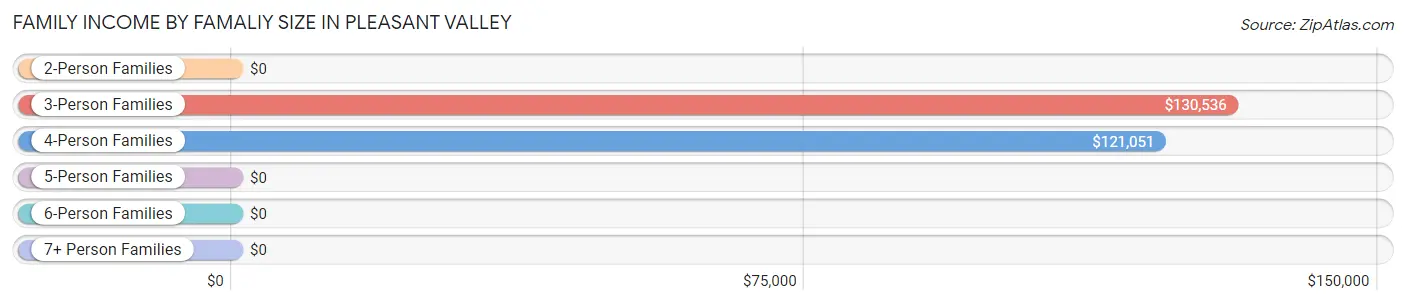
| Income Bracket | # Families | Median Income |
| 2-Person Families | 225 (46.2%) | $0 |
| 3-Person Families | 133 (27.3%) | $130,536 |
| 4-Person Families | 85 (17.4%) | $121,051 |
| 5-Person Families | 44 (9.0%) | $0 |
| 6-Person Families | 0 (0.0%) | $0 |
| 7+ Person Families | 0 (0.0%) | $0 |
| Total | 487 (100.0%) | $109,628 |
Family Income by Number of Earners in Pleasant Valley
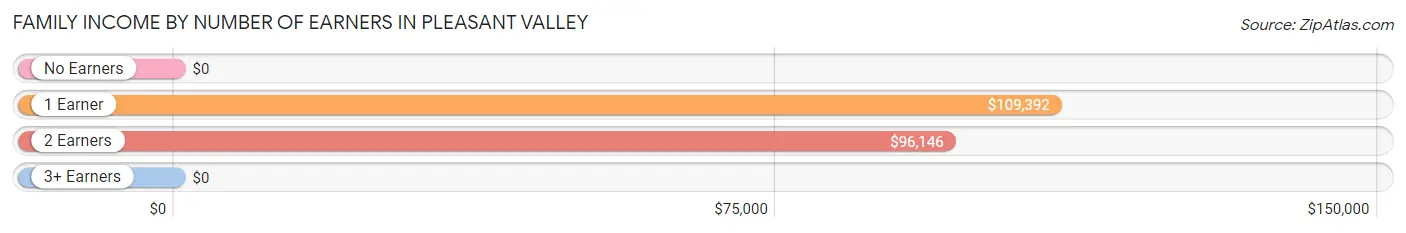
| Number of Earners | # Families | Median Income |
| No Earners | 30 (6.2%) | $0 |
| 1 Earner | 104 (21.4%) | $109,392 |
| 2 Earners | 292 (60.0%) | $96,146 |
| 3+ Earners | 61 (12.5%) | $0 |
| Total | 487 (100.0%) | $109,628 |
Household Income in Pleasant Valley
Household Income Brackets in Pleasant Valley
With 245 households falling in the category, the $100,000 to $149,999 income range is the most frequent in Pleasant Valley, accounting for 30.2% of all households.
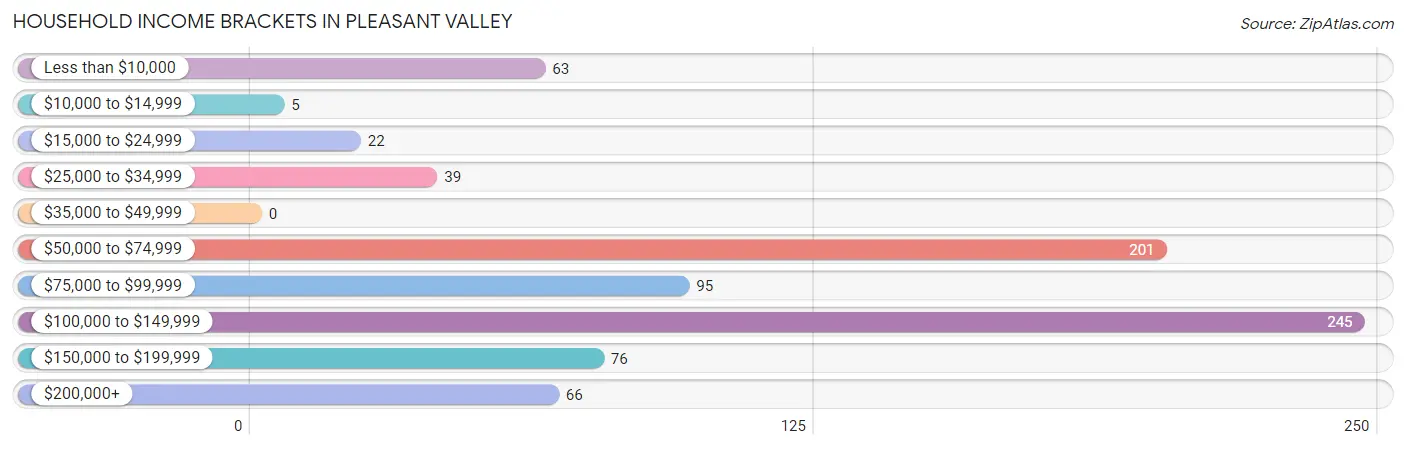
| Income Bracket | # Households | % Households |
| Less than $10,000 | 63 | 7.8% |
| $10,000 to $14,999 | 5 | 0.6% |
| $15,000 to $24,999 | 22 | 2.7% |
| $25,000 to $34,999 | 39 | 4.8% |
| $35,000 to $49,999 | 0 | 0.0% |
| $50,000 to $74,999 | 201 | 24.8% |
| $75,000 to $99,999 | 95 | 11.7% |
| $100,000 to $149,999 | 245 | 30.2% |
| $150,000 to $199,999 | 76 | 9.4% |
| $200,000+ | 66 | 8.1% |
Household Income by Householder Age in Pleasant Valley
The median household income in Pleasant Valley is $96,510, with the highest median household income of $121,534 found in the 45 to 64 years age bracket for the primary householder. A total of 286 households (35.2%) fall into this category. Meanwhile, the 15 to 24 years age bracket for the primary householder has the lowest median household income of $0, with 123 households (15.1%) in this group.
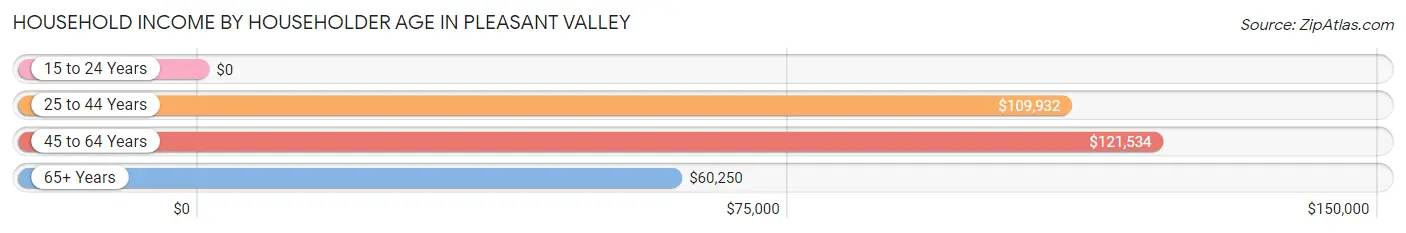
| Income Bracket | # Households | Median Income |
| 15 to 24 Years | 123 (15.1%) | $0 |
| 25 to 44 Years | 232 (28.6%) | $109,932 |
| 45 to 64 Years | 286 (35.2%) | $121,534 |
| 65+ Years | 171 (21.1%) | $60,250 |
| Total | 812 (100.0%) | $96,510 |
Poverty in Pleasant Valley
Income Below Poverty by Sex and Age in Pleasant Valley
With 4.7% poverty level for males and 2.4% for females among the residents of Pleasant Valley, 55 to 64 year old males and 75 year old and over females are the most vulnerable to poverty, with 49 males (46.2%) and 14 females (63.6%) in their respective age groups living below the poverty level.
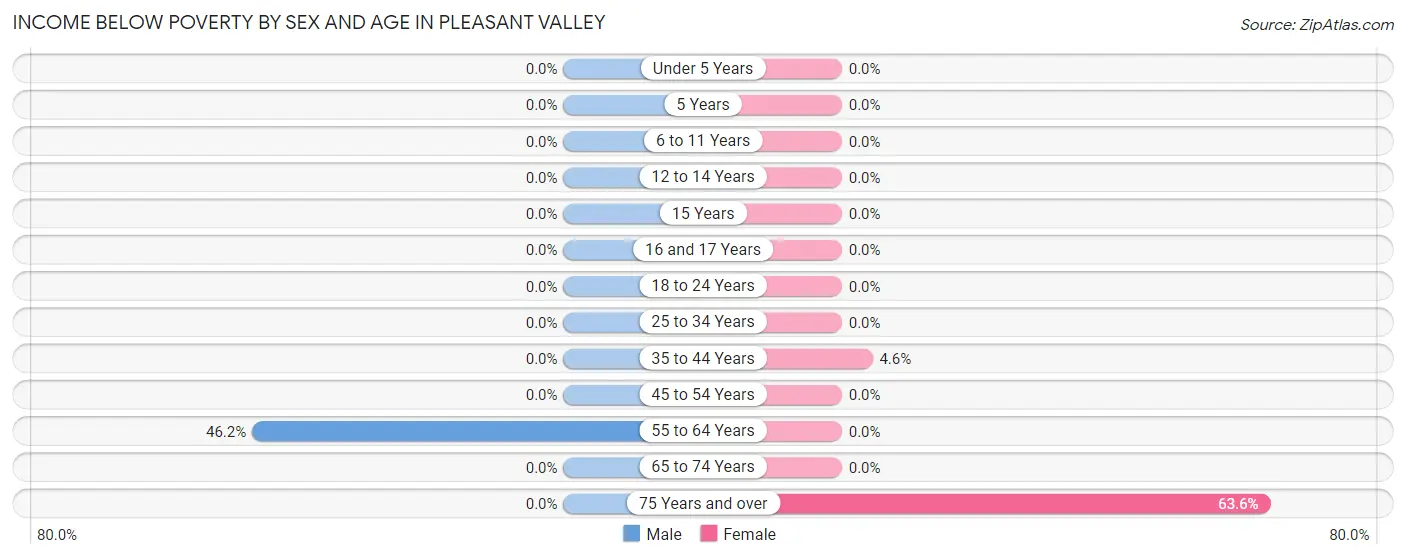
| Age Bracket | Male | Female |
| Under 5 Years | 0 (0.0%) | 0 (0.0%) |
| 5 Years | 0 (0.0%) | 0 (0.0%) |
| 6 to 11 Years | 0 (0.0%) | 0 (0.0%) |
| 12 to 14 Years | 0 (0.0%) | 0 (0.0%) |
| 15 Years | 0 (0.0%) | 0 (0.0%) |
| 16 and 17 Years | 0 (0.0%) | 0 (0.0%) |
| 18 to 24 Years | 0 (0.0%) | 0 (0.0%) |
| 25 to 34 Years | 0 (0.0%) | 0 (0.0%) |
| 35 to 44 Years | 0 (0.0%) | 5 (4.5%) |
| 45 to 54 Years | 0 (0.0%) | 0 (0.0%) |
| 55 to 64 Years | 49 (46.2%) | 0 (0.0%) |
| 65 to 74 Years | 0 (0.0%) | 0 (0.0%) |
| 75 Years and over | 0 (0.0%) | 14 (63.6%) |
| Total | 49 (4.7%) | 19 (2.4%) |
Income Above Poverty by Sex and Age in Pleasant Valley
According to the poverty statistics in Pleasant Valley, males aged under 5 years and females aged under 5 years are the age groups that are most secure financially, with 100.0% of males and 100.0% of females in these age groups living above the poverty line.
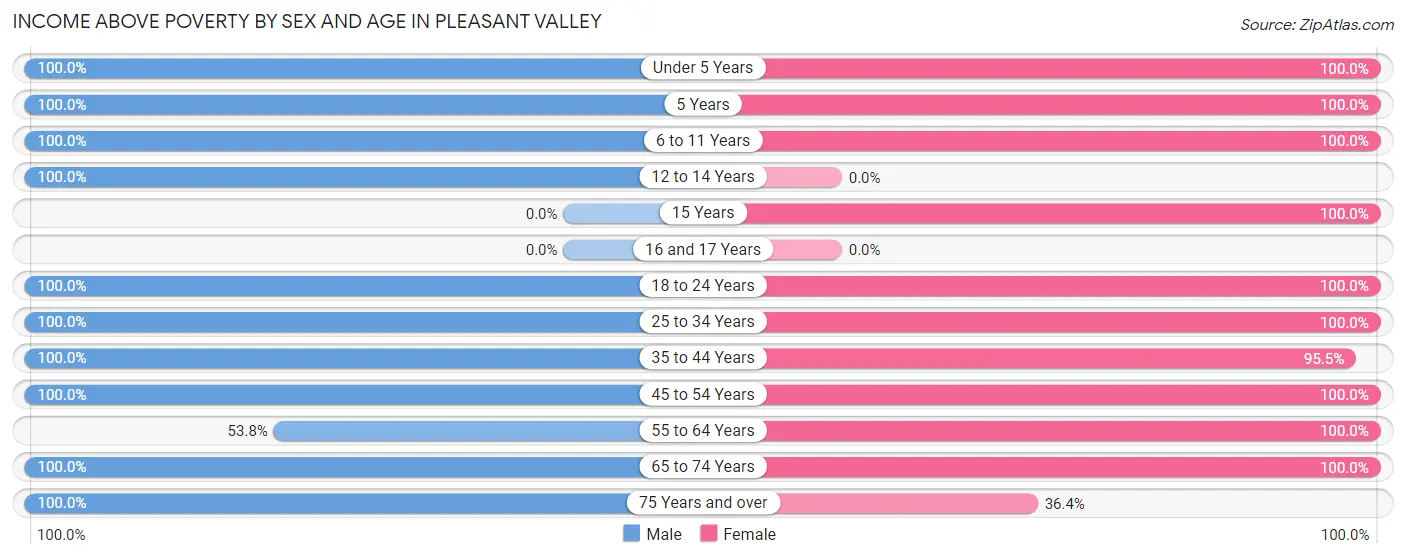
| Age Bracket | Male | Female |
| Under 5 Years | 69 (100.0%) | 80 (100.0%) |
| 5 Years | 13 (100.0%) | 26 (100.0%) |
| 6 to 11 Years | 26 (100.0%) | 64 (100.0%) |
| 12 to 14 Years | 76 (100.0%) | 0 (0.0%) |
| 15 Years | 0 (0.0%) | 76 (100.0%) |
| 16 and 17 Years | 0 (0.0%) | 0 (0.0%) |
| 18 to 24 Years | 315 (100.0%) | 72 (100.0%) |
| 25 to 34 Years | 102 (100.0%) | 63 (100.0%) |
| 35 to 44 Years | 93 (100.0%) | 105 (95.5%) |
| 45 to 54 Years | 108 (100.0%) | 172 (100.0%) |
| 55 to 64 Years | 57 (53.8%) | 67 (100.0%) |
| 65 to 74 Years | 75 (100.0%) | 54 (100.0%) |
| 75 Years and over | 59 (100.0%) | 8 (36.4%) |
| Total | 993 (95.3%) | 787 (97.6%) |
Income Below Poverty Among Married-Couple Families in Pleasant Valley
| Children | Above Poverty | Below Poverty |
| No Children | 78 (100.0%) | 0 (0.0%) |
| 1 or 2 Children | 164 (100.0%) | 0 (0.0%) |
| 3 or 4 Children | 44 (100.0%) | 0 (0.0%) |
| 5 or more Children | 0 (0.0%) | 0 (0.0%) |
| Total | 286 (100.0%) | 0 (0.0%) |
Income Below Poverty Among Single-Parent Households in Pleasant Valley
| Children | Single Father | Single Mother |
| No Children | 0 (0.0%) | 0 (0.0%) |
| 1 or 2 Children | 0 (0.0%) | 0 (0.0%) |
| 3 or 4 Children | 0 (0.0%) | 0 (0.0%) |
| 5 or more Children | 0 (0.0%) | 0 (0.0%) |
| Total | 0 (0.0%) | 0 (0.0%) |
Income Below Poverty Among Married-Couple vs Single-Parent Households in Pleasant Valley
| Children | Married-Couple Families | Single-Parent Households |
| No Children | 0 (0.0%) | 0 (0.0%) |
| 1 or 2 Children | 0 (0.0%) | 0 (0.0%) |
| 3 or 4 Children | 0 (0.0%) | 0 (0.0%) |
| 5 or more Children | 0 (0.0%) | 0 (0.0%) |
| Total | 0 (0.0%) | 0 (0.0%) |
Employment Characteristics in Pleasant Valley
Employment by Class of Employer in Pleasant Valley
Among the 1,134 employed individuals in Pleasant Valley, private company employees (751 | 66.2%), not-for-profit organizations (123 | 10.8%), and self-employed (not incorporated) (98 | 8.6%) make up the most common classes of employment.
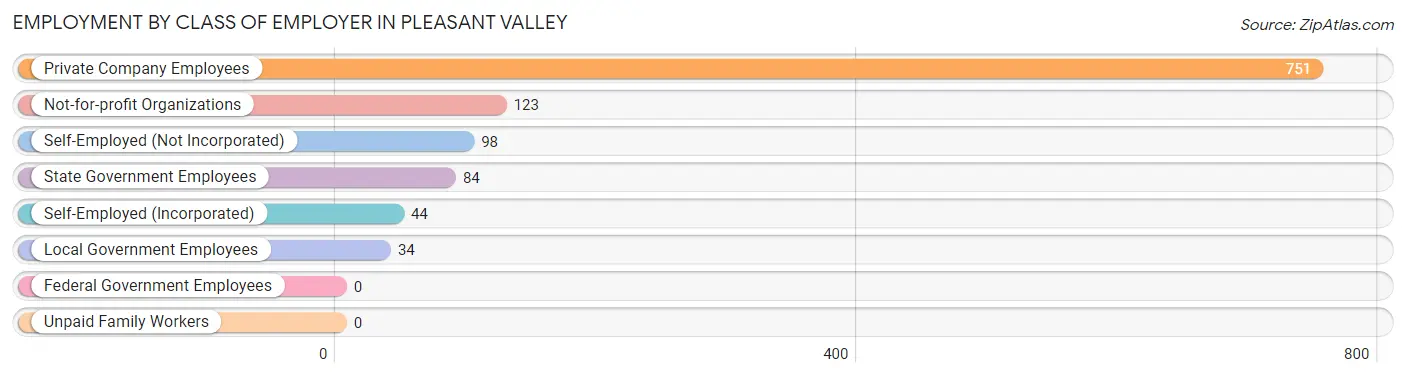
| Employer Class | # Employees | % Employees |
| Private Company Employees | 751 | 66.2% |
| Self-Employed (Incorporated) | 44 | 3.9% |
| Self-Employed (Not Incorporated) | 98 | 8.6% |
| Not-for-profit Organizations | 123 | 10.8% |
| Local Government Employees | 34 | 3.0% |
| State Government Employees | 84 | 7.4% |
| Federal Government Employees | 0 | 0.0% |
| Unpaid Family Workers | 0 | 0.0% |
| Total | 1,134 | 100.0% |
Employment Status by Age in Pleasant Valley
According to the labor force statistics for Pleasant Valley, out of the total population over 16 years of age (1,418), 82.8% or 1,174 individuals are in the labor force, with 1.5% or 18 of them unemployed. The age group with the highest labor force participation rate is 20 to 24 years, with 100.0% or 387 individuals in the labor force. Within the labor force, the 55 to 59 years age range has the highest percentage of unemployed individuals, with 8.7% or 6 of them being unemployed.
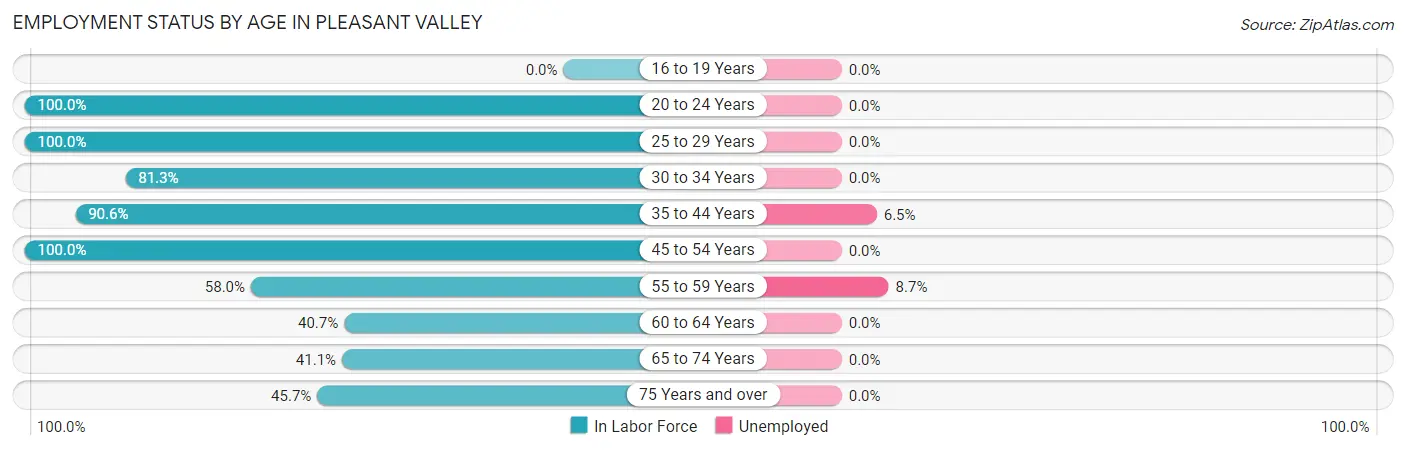
| Age Bracket | In Labor Force | Unemployed |
| 16 to 19 Years | 0 (0.0%) | 0 (0.0%) |
| 20 to 24 Years | 387 (100.0%) | 0 (0.0%) |
| 25 to 29 Years | 42 (100.0%) | 0 (0.0%) |
| 30 to 34 Years | 100 (81.3%) | 0 (0.0%) |
| 35 to 44 Years | 184 (90.6%) | 12 (6.5%) |
| 45 to 54 Years | 280 (100.0%) | 0 (0.0%) |
| 55 to 59 Years | 69 (58.0%) | 6 (8.7%) |
| 60 to 64 Years | 22 (40.7%) | 0 (0.0%) |
| 65 to 74 Years | 53 (41.1%) | 0 (0.0%) |
| 75 Years and over | 37 (45.7%) | 0 (0.0%) |
| Total | 1,174 (82.8%) | 18 (1.5%) |
Employment Status by Educational Attainment in Pleasant Valley
According to labor force statistics for Pleasant Valley, 84.9% of individuals (697) out of the total population between 25 and 64 years of age (821) are in the labor force, with 2.6% or 18 of them being unemployed. The group with the highest labor force participation rate are those with the educational attainment of bachelor's degree or higher, with 100.0% or 330 individuals in the labor force. Within the labor force, individuals with bachelor's degree or higher education have the highest percentage of unemployment, with 3.6% or 12 of them being unemployed.
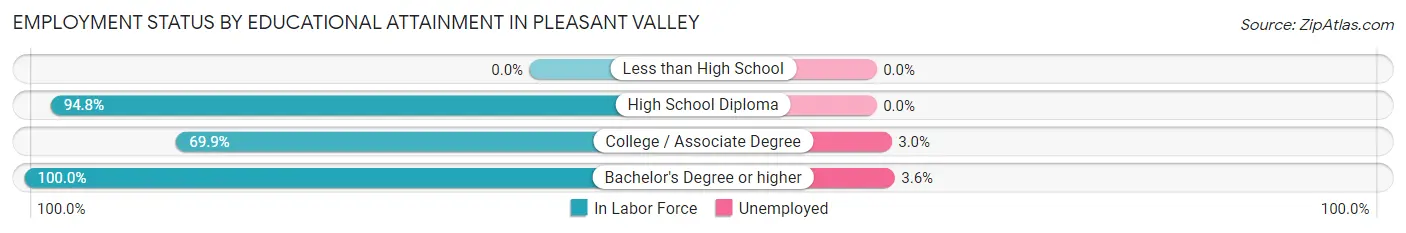
| Educational Attainment | In Labor Force | Unemployed |
| Less than High School | 0 (0.0%) | 0 (0.0%) |
| High School Diploma | 165 (94.8%) | 0 (0.0%) |
| College / Associate Degree | 202 (69.9%) | 9 (3.0%) |
| Bachelor's Degree or higher | 330 (100.0%) | 12 (3.6%) |
| Total | 697 (84.9%) | 21 (2.6%) |
Employment Occupations by Sex in Pleasant Valley
Management, Business, Science and Arts Occupations
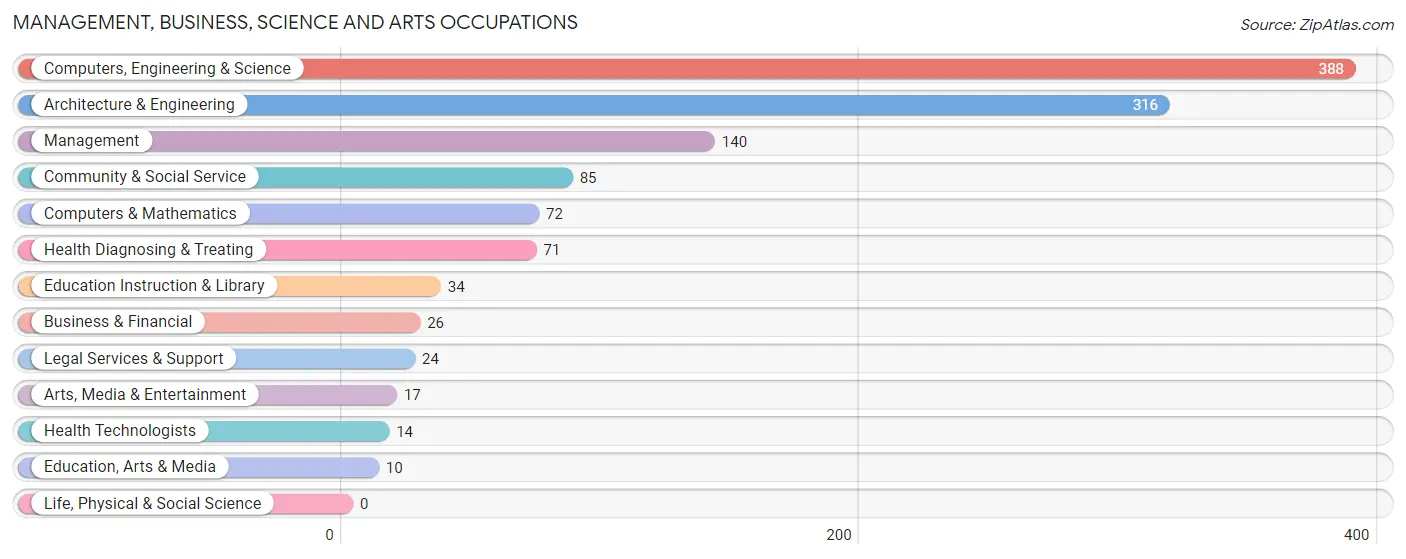
The most common Management, Business, Science and Arts occupations in Pleasant Valley are Computers, Engineering & Science (388 | 33.6%), Architecture & Engineering (316 | 27.3%), Management (140 | 12.1%), Community & Social Service (85 | 7.3%), and Computers & Mathematics (72 | 6.2%).
Management, Business, Science and Arts Occupations by Sex
Within the Management, Business, Science and Arts occupations in Pleasant Valley, the most male-oriented occupations are Business & Financial (100.0%), Arts, Media & Entertainment (100.0%), and Health Technologists (100.0%), while the most female-oriented occupations are Education, Arts & Media (100.0%), Legal Services & Support (95.8%), and Health Diagnosing & Treating (80.3%).
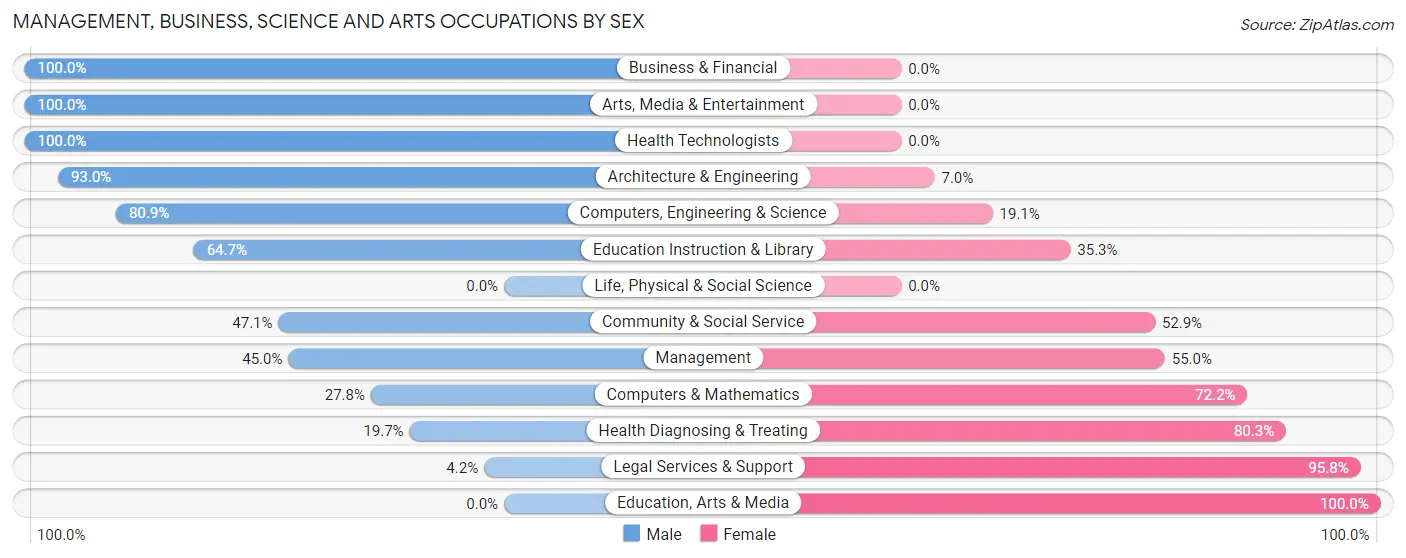
| Occupation | Male | Female |
| Management | 63 (45.0%) | 77 (55.0%) |
| Business & Financial | 26 (100.0%) | 0 (0.0%) |
| Computers, Engineering & Science | 314 (80.9%) | 74 (19.1%) |
| Computers & Mathematics | 20 (27.8%) | 52 (72.2%) |
| Architecture & Engineering | 294 (93.0%) | 22 (7.0%) |
| Life, Physical & Social Science | 0 (0.0%) | 0 (0.0%) |
| Community & Social Service | 40 (47.1%) | 45 (52.9%) |
| Education, Arts & Media | 0 (0.0%) | 10 (100.0%) |
| Legal Services & Support | 1 (4.2%) | 23 (95.8%) |
| Education Instruction & Library | 22 (64.7%) | 12 (35.3%) |
| Arts, Media & Entertainment | 17 (100.0%) | 0 (0.0%) |
| Health Diagnosing & Treating | 14 (19.7%) | 57 (80.3%) |
| Health Technologists | 14 (100.0%) | 0 (0.0%) |
| Total (Category) | 457 (64.4%) | 253 (35.6%) |
| Total (Overall) | 714 (61.8%) | 442 (38.2%) |
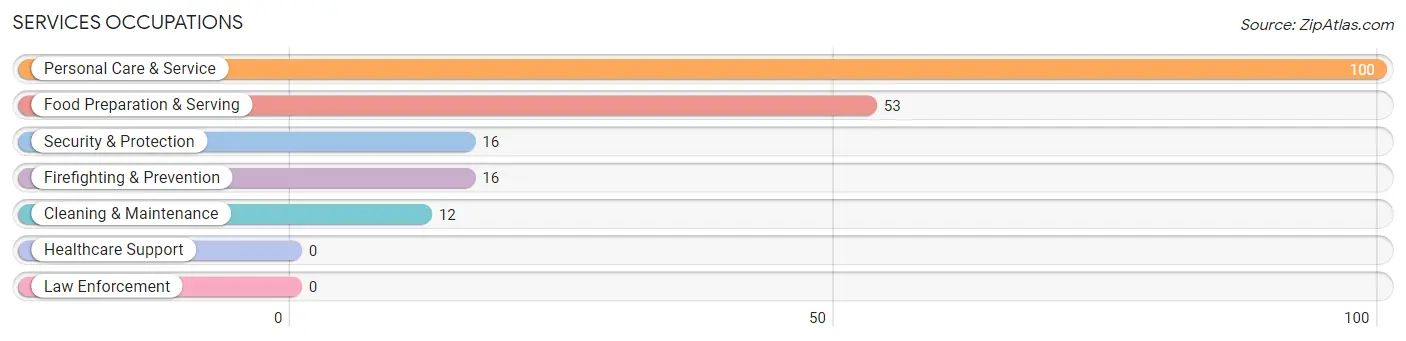
Services Occupations
The most common Services occupations in Pleasant Valley are Personal Care & Service (100 | 8.6%), Food Preparation & Serving (53 | 4.6%), Security & Protection (16 | 1.4%), Firefighting & Prevention (16 | 1.4%), and Cleaning & Maintenance (12 | 1.0%).
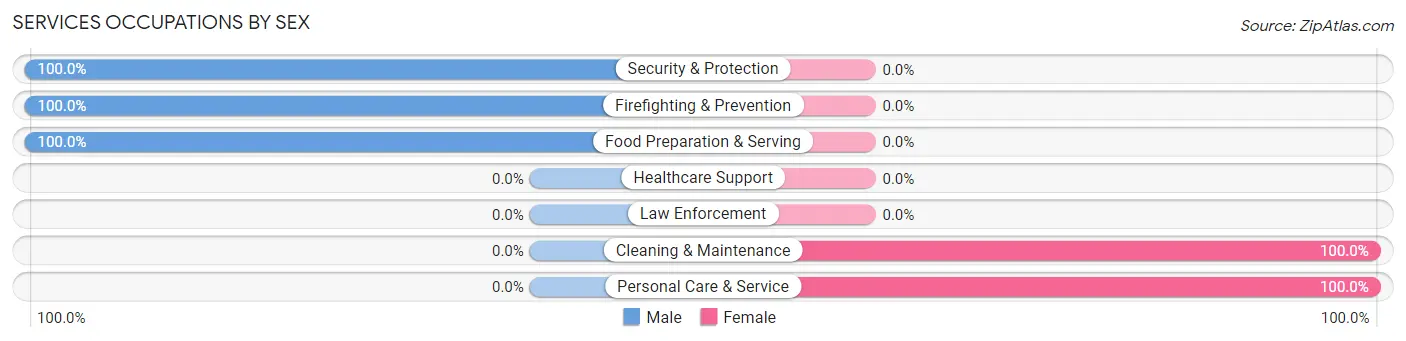
Services Occupations by Sex
Within the Services occupations in Pleasant Valley, the most male-oriented occupations are Security & Protection (100.0%), Firefighting & Prevention (100.0%), and Food Preparation & Serving (100.0%), while the most female-oriented occupations are Cleaning & Maintenance (100.0%), and Personal Care & Service (100.0%).
| Occupation | Male | Female |
| Healthcare Support | 0 (0.0%) | 0 (0.0%) |
| Security & Protection | 16 (100.0%) | 0 (0.0%) |
| Firefighting & Prevention | 16 (100.0%) | 0 (0.0%) |
| Law Enforcement | 0 (0.0%) | 0 (0.0%) |
| Food Preparation & Serving | 53 (100.0%) | 0 (0.0%) |
| Cleaning & Maintenance | 0 (0.0%) | 12 (100.0%) |
| Personal Care & Service | 0 (0.0%) | 100 (100.0%) |
| Total (Category) | 69 (38.1%) | 112 (61.9%) |
| Total (Overall) | 714 (61.8%) | 442 (38.2%) |
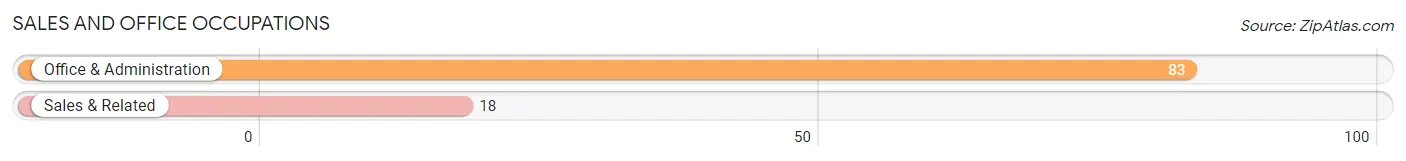
Sales and Office Occupations
The most common Sales and Office occupations in Pleasant Valley are Office & Administration (83 | 7.2%), and Sales & Related (18 | 1.6%).
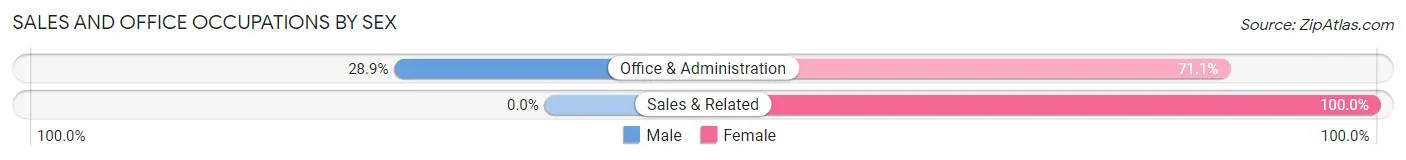
Sales and Office Occupations by Sex
| Occupation | Male | Female |
| Sales & Related | 0 (0.0%) | 18 (100.0%) |
| Office & Administration | 24 (28.9%) | 59 (71.1%) |
| Total (Category) | 24 (23.8%) | 77 (76.2%) |
| Total (Overall) | 714 (61.8%) | 442 (38.2%) |
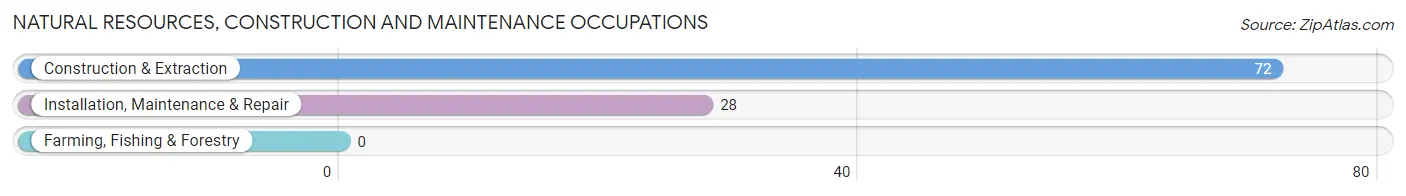
Natural Resources, Construction and Maintenance Occupations
The most common Natural Resources, Construction and Maintenance occupations in Pleasant Valley are Construction & Extraction (72 | 6.2%), and Installation, Maintenance & Repair (28 | 2.4%).
Natural Resources, Construction and Maintenance Occupations by Sex
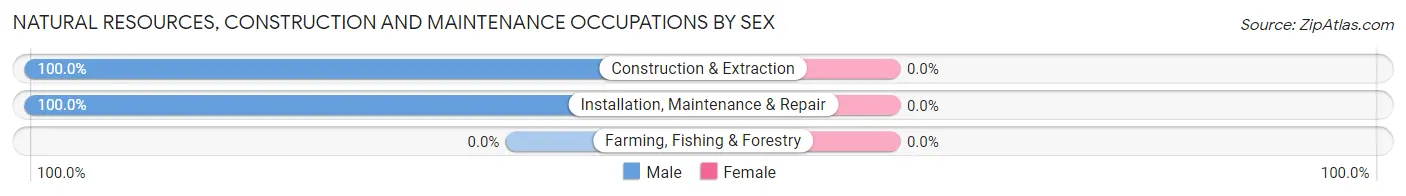
| Occupation | Male | Female |
| Farming, Fishing & Forestry | 0 (0.0%) | 0 (0.0%) |
| Construction & Extraction | 72 (100.0%) | 0 (0.0%) |
| Installation, Maintenance & Repair | 28 (100.0%) | 0 (0.0%) |
| Total (Category) | 100 (100.0%) | 0 (0.0%) |
| Total (Overall) | 714 (61.8%) | 442 (38.2%) |
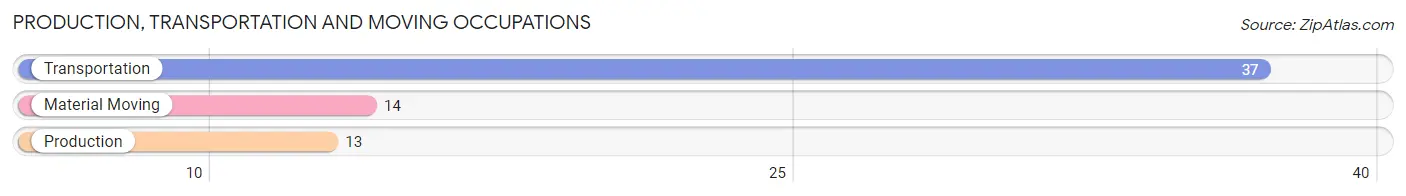
Production, Transportation and Moving Occupations
The most common Production, Transportation and Moving occupations in Pleasant Valley are Transportation (37 | 3.2%), Material Moving (14 | 1.2%), and Production (13 | 1.1%).
Production, Transportation and Moving Occupations by Sex
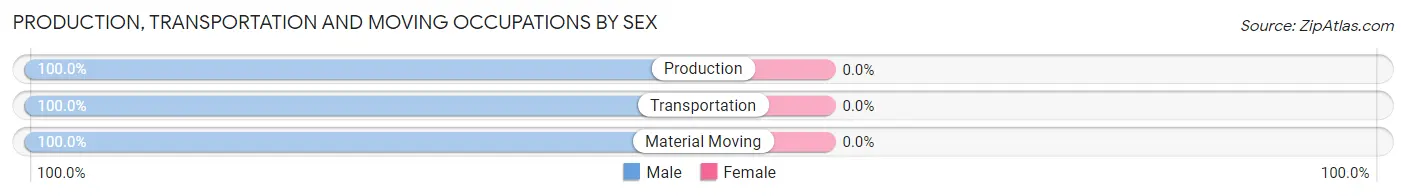
| Occupation | Male | Female |
| Production | 13 (100.0%) | 0 (0.0%) |
| Transportation | 37 (100.0%) | 0 (0.0%) |
| Material Moving | 14 (100.0%) | 0 (0.0%) |
| Total (Category) | 64 (100.0%) | 0 (0.0%) |
| Total (Overall) | 714 (61.8%) | 442 (38.2%) |
Employment Industries by Sex in Pleasant Valley
Employment Industries in Pleasant Valley
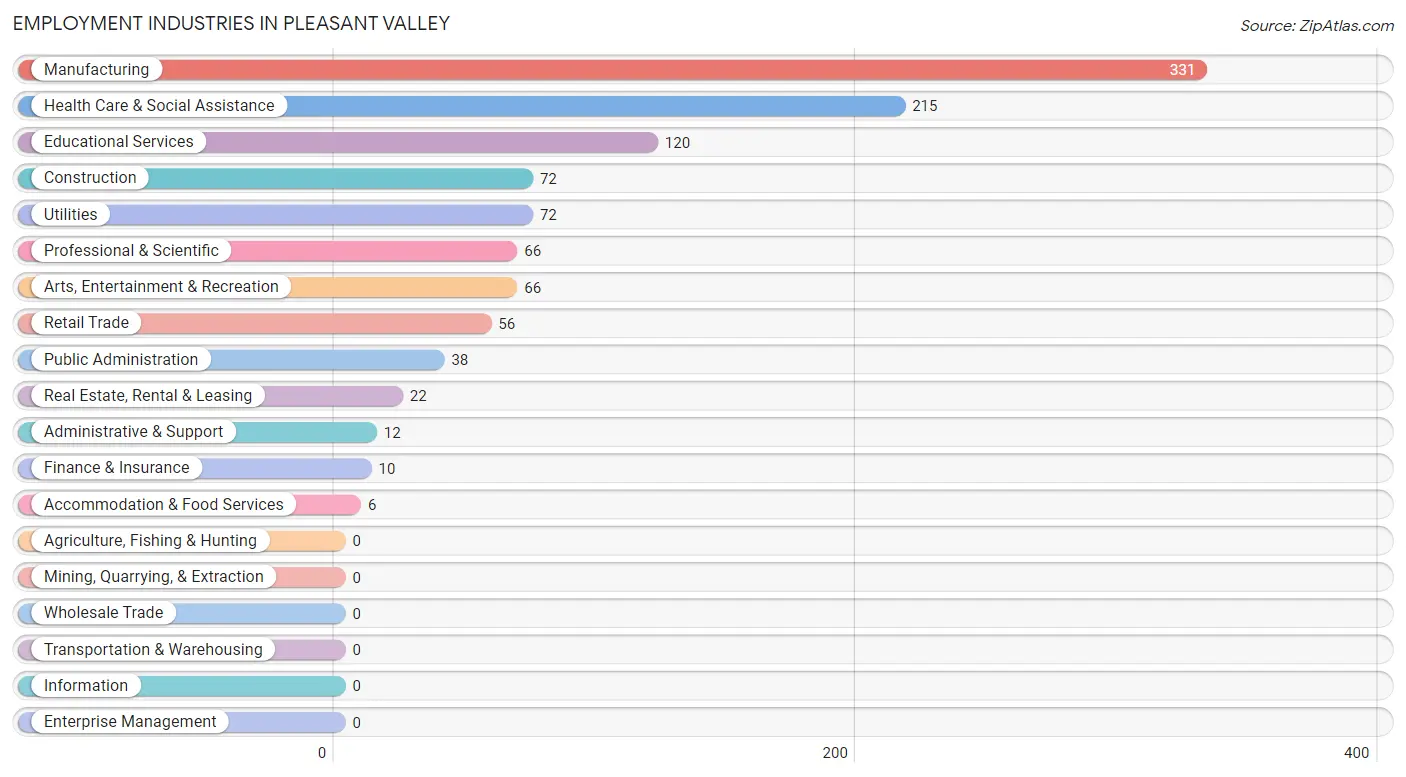
The major employment industries in Pleasant Valley include Manufacturing (331 | 28.6%), Health Care & Social Assistance (215 | 18.6%), Educational Services (120 | 10.4%), Construction (72 | 6.2%), and Utilities (72 | 6.2%).
Employment Industries by Sex in Pleasant Valley
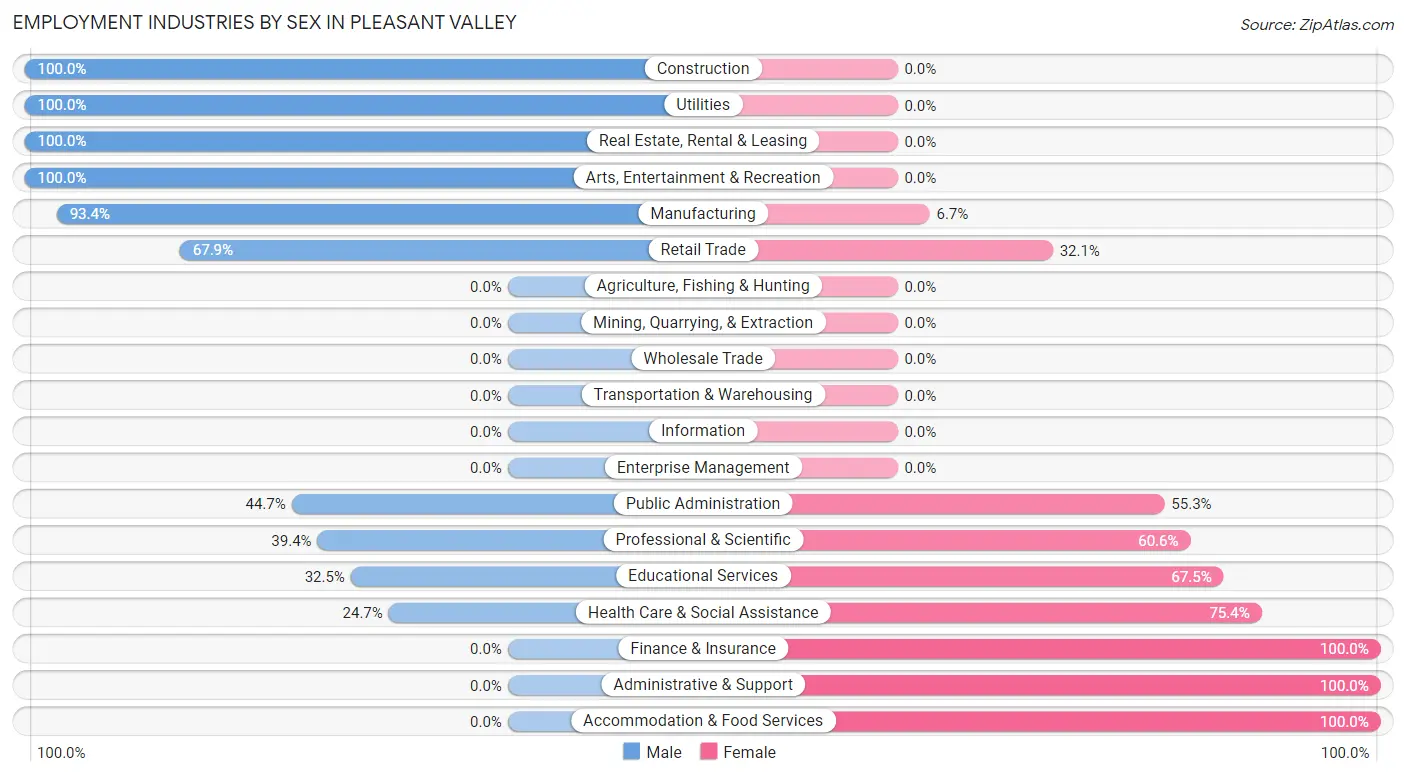
The Pleasant Valley industries that see more men than women are Construction (100.0%), Utilities (100.0%), and Real Estate, Rental & Leasing (100.0%), whereas the industries that tend to have a higher number of women are Finance & Insurance (100.0%), Administrative & Support (100.0%), and Accommodation & Food Services (100.0%).
| Industry | Male | Female |
| Agriculture, Fishing & Hunting | 0 (0.0%) | 0 (0.0%) |
| Mining, Quarrying, & Extraction | 0 (0.0%) | 0 (0.0%) |
| Construction | 72 (100.0%) | 0 (0.0%) |
| Manufacturing | 309 (93.3%) | 22 (6.7%) |
| Wholesale Trade | 0 (0.0%) | 0 (0.0%) |
| Retail Trade | 38 (67.9%) | 18 (32.1%) |
| Transportation & Warehousing | 0 (0.0%) | 0 (0.0%) |
| Utilities | 72 (100.0%) | 0 (0.0%) |
| Information | 0 (0.0%) | 0 (0.0%) |
| Finance & Insurance | 0 (0.0%) | 10 (100.0%) |
| Real Estate, Rental & Leasing | 22 (100.0%) | 0 (0.0%) |
| Professional & Scientific | 26 (39.4%) | 40 (60.6%) |
| Enterprise Management | 0 (0.0%) | 0 (0.0%) |
| Administrative & Support | 0 (0.0%) | 12 (100.0%) |
| Educational Services | 39 (32.5%) | 81 (67.5%) |
| Health Care & Social Assistance | 53 (24.6%) | 162 (75.3%) |
| Arts, Entertainment & Recreation | 66 (100.0%) | 0 (0.0%) |
| Accommodation & Food Services | 0 (0.0%) | 6 (100.0%) |
| Public Administration | 17 (44.7%) | 21 (55.3%) |
| Total | 714 (61.8%) | 442 (38.2%) |
Education in Pleasant Valley
School Enrollment in Pleasant Valley
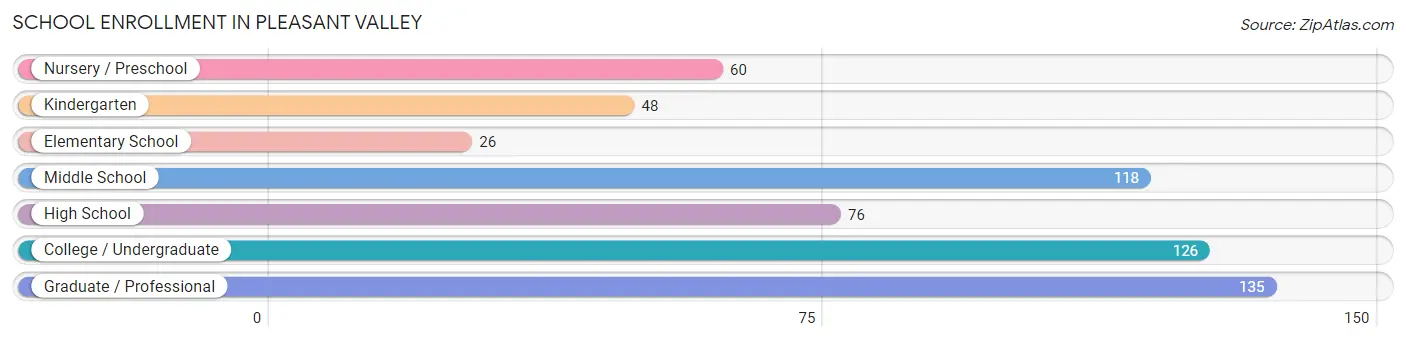
The most common levels of schooling among the 589 students in Pleasant Valley are graduate / professional (135 | 22.9%), college / undergraduate (126 | 21.4%), and middle school (118 | 20.0%).
| School Level | # Students | % Students |
| Nursery / Preschool | 60 | 10.2% |
| Kindergarten | 48 | 8.2% |
| Elementary School | 26 | 4.4% |
| Middle School | 118 | 20.0% |
| High School | 76 | 12.9% |
| College / Undergraduate | 126 | 21.4% |
| Graduate / Professional | 135 | 22.9% |
| Total | 589 | 100.0% |
School Enrollment by Age by Funding Source in Pleasant Valley
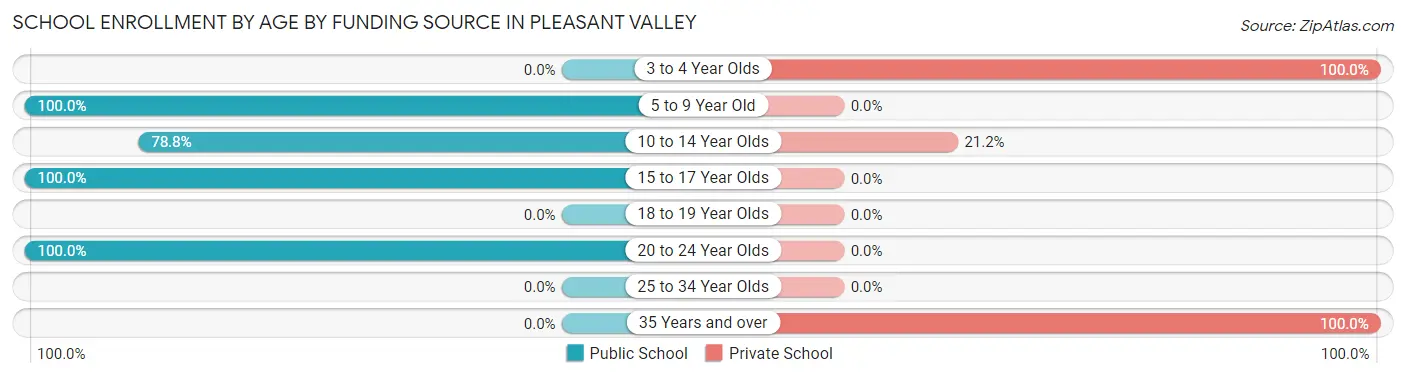
Out of a total of 589 students who are enrolled in schools in Pleasant Valley, 84 (14.3%) attend a private institution, while the remaining 505 (85.7%) are enrolled in public schools. The age group of 3 to 4 year olds has the highest likelihood of being enrolled in private schools, with 47 (100.0% in the age bracket) enrolled. Conversely, the age group of 5 to 9 year old has the lowest likelihood of being enrolled in a private school, with 87 (100.0% in the age bracket) attending a public institution.
| Age Bracket | Public School | Private School |
| 3 to 4 Year Olds | 0 (0.0%) | 47 (100.0%) |
| 5 to 9 Year Old | 87 (100.0%) | 0 (0.0%) |
| 10 to 14 Year Olds | 93 (78.8%) | 25 (21.2%) |
| 15 to 17 Year Olds | 76 (100.0%) | 0 (0.0%) |
| 18 to 19 Year Olds | 0 (0.0%) | 0 (0.0%) |
| 20 to 24 Year Olds | 249 (100.0%) | 0 (0.0%) |
| 25 to 34 Year Olds | 0 (0.0%) | 0 (0.0%) |
| 35 Years and over | 0 (0.0%) | 12 (100.0%) |
| Total | 505 (85.7%) | 84 (14.3%) |
Educational Attainment by Field of Study in Pleasant Valley
Engineering (94 | 21.2%), arts & humanities (78 | 17.6%), business (74 | 16.7%), social sciences (49 | 11.1%), and visual & performing arts (32 | 7.2%) are the most common fields of study among 443 individuals in Pleasant Valley who have obtained a bachelor's degree or higher.
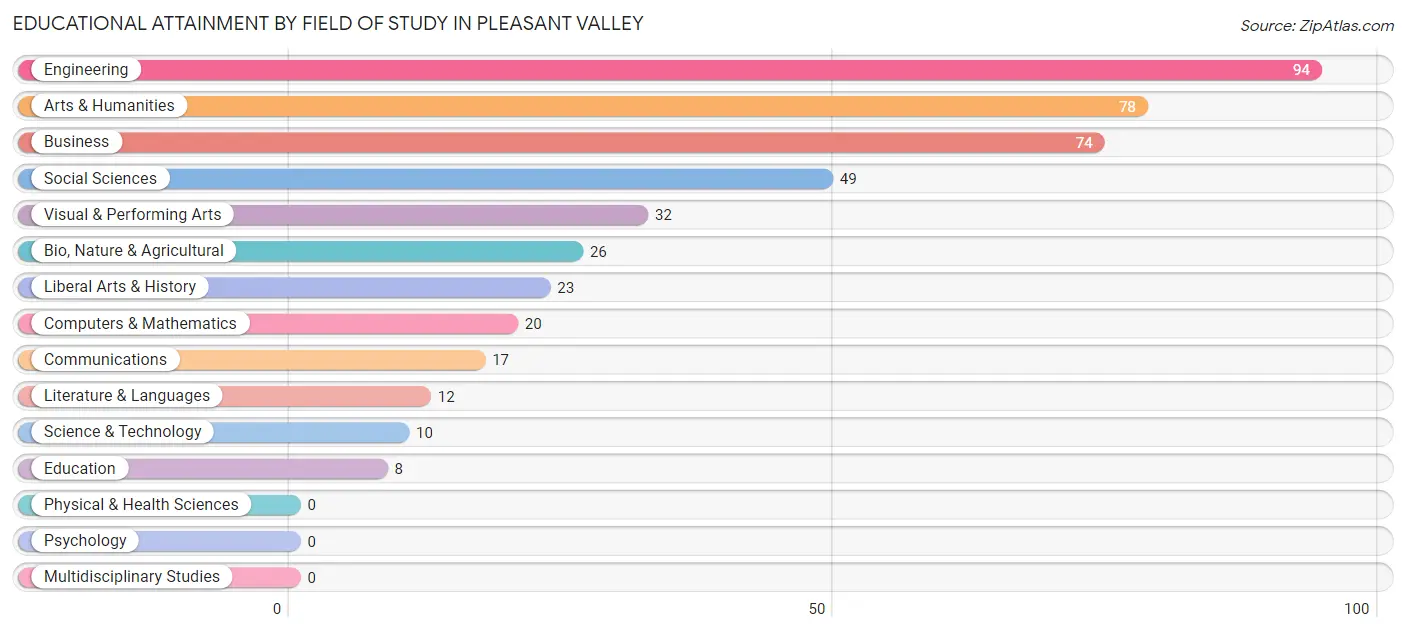
| Field of Study | # Graduates | % Graduates |
| Computers & Mathematics | 20 | 4.5% |
| Bio, Nature & Agricultural | 26 | 5.9% |
| Physical & Health Sciences | 0 | 0.0% |
| Psychology | 0 | 0.0% |
| Social Sciences | 49 | 11.1% |
| Engineering | 94 | 21.2% |
| Multidisciplinary Studies | 0 | 0.0% |
| Science & Technology | 10 | 2.3% |
| Business | 74 | 16.7% |
| Education | 8 | 1.8% |
| Literature & Languages | 12 | 2.7% |
| Liberal Arts & History | 23 | 5.2% |
| Visual & Performing Arts | 32 | 7.2% |
| Communications | 17 | 3.8% |
| Arts & Humanities | 78 | 17.6% |
| Total | 443 | 100.0% |
Transportation & Commute in Pleasant Valley
Vehicle Availability by Sex in Pleasant Valley
The most prevalent vehicle ownership categories in Pleasant Valley are males with 2 vehicles (441, accounting for 61.8%) and females with 2 vehicles (144, making up 105.0%).
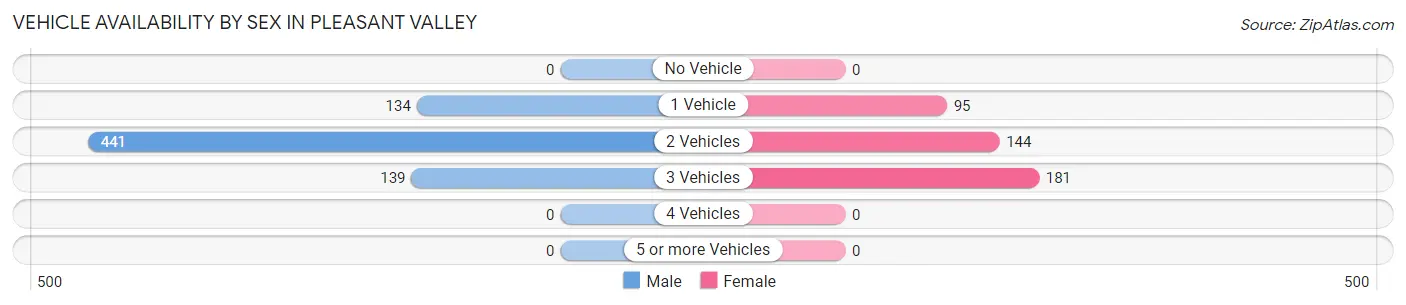
| Vehicles Available | Male | Female |
| No Vehicle | 0 (0.0%) | 0 (0.0%) |
| 1 Vehicle | 134 (18.8%) | 95 (22.6%) |
| 2 Vehicles | 441 (61.8%) | 144 (34.3%) |
| 3 Vehicles | 139 (19.5%) | 181 (43.1%) |
| 4 Vehicles | 0 (0.0%) | 0 (0.0%) |
| 5 or more Vehicles | 0 (0.0%) | 0 (0.0%) |
| Total | 714 (100.0%) | 420 (100.0%) |
Commute Time in Pleasant Valley
The most frequently occuring commute durations in Pleasant Valley are 15 to 19 minutes (252 commuters, 26.3%), 20 to 24 minutes (202 commuters, 21.1%), and 40 to 44 minutes (148 commuters, 15.4%).
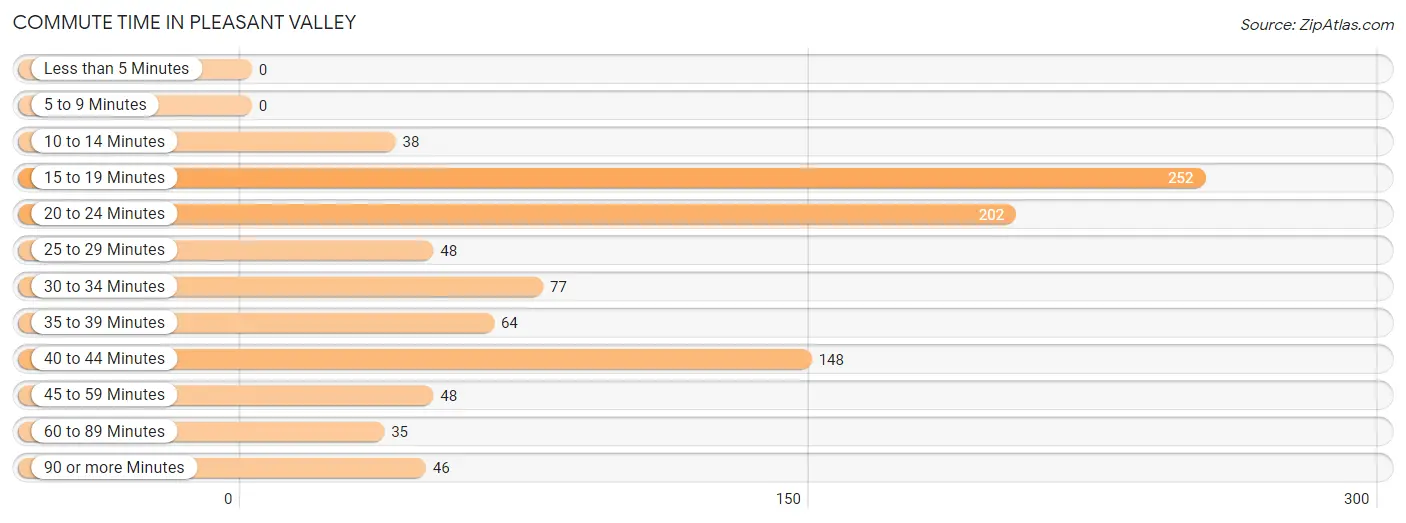
| Commute Time | # Commuters | % Commuters |
| Less than 5 Minutes | 0 | 0.0% |
| 5 to 9 Minutes | 0 | 0.0% |
| 10 to 14 Minutes | 38 | 4.0% |
| 15 to 19 Minutes | 252 | 26.3% |
| 20 to 24 Minutes | 202 | 21.1% |
| 25 to 29 Minutes | 48 | 5.0% |
| 30 to 34 Minutes | 77 | 8.0% |
| 35 to 39 Minutes | 64 | 6.7% |
| 40 to 44 Minutes | 148 | 15.4% |
| 45 to 59 Minutes | 48 | 5.0% |
| 60 to 89 Minutes | 35 | 3.6% |
| 90 or more Minutes | 46 | 4.8% |
Commute Time by Sex in Pleasant Valley
The most common commute times in Pleasant Valley are 15 to 19 minutes (198 commuters, 28.5%) for males and 20 to 24 minutes (90 commuters, 34.1%) for females.
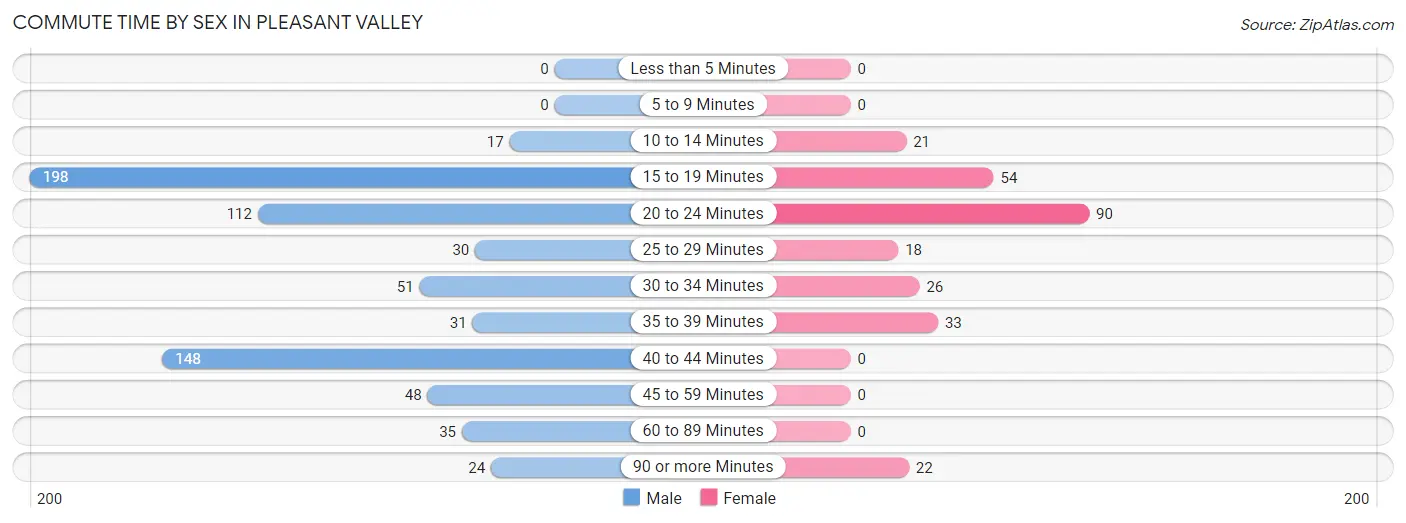
| Commute Time | Male | Female |
| Less than 5 Minutes | 0 (0.0%) | 0 (0.0%) |
| 5 to 9 Minutes | 0 (0.0%) | 0 (0.0%) |
| 10 to 14 Minutes | 17 (2.5%) | 21 (8.0%) |
| 15 to 19 Minutes | 198 (28.5%) | 54 (20.4%) |
| 20 to 24 Minutes | 112 (16.1%) | 90 (34.1%) |
| 25 to 29 Minutes | 30 (4.3%) | 18 (6.8%) |
| 30 to 34 Minutes | 51 (7.3%) | 26 (9.9%) |
| 35 to 39 Minutes | 31 (4.5%) | 33 (12.5%) |
| 40 to 44 Minutes | 148 (21.3%) | 0 (0.0%) |
| 45 to 59 Minutes | 48 (6.9%) | 0 (0.0%) |
| 60 to 89 Minutes | 35 (5.0%) | 0 (0.0%) |
| 90 or more Minutes | 24 (3.5%) | 22 (8.3%) |
Time of Departure to Work by Sex in Pleasant Valley
The most frequent times of departure to work in Pleasant Valley are 7:00 AM to 7:29 AM (182, 26.2%) for males and 9:00 AM to 9:59 AM (113, 42.8%) for females.
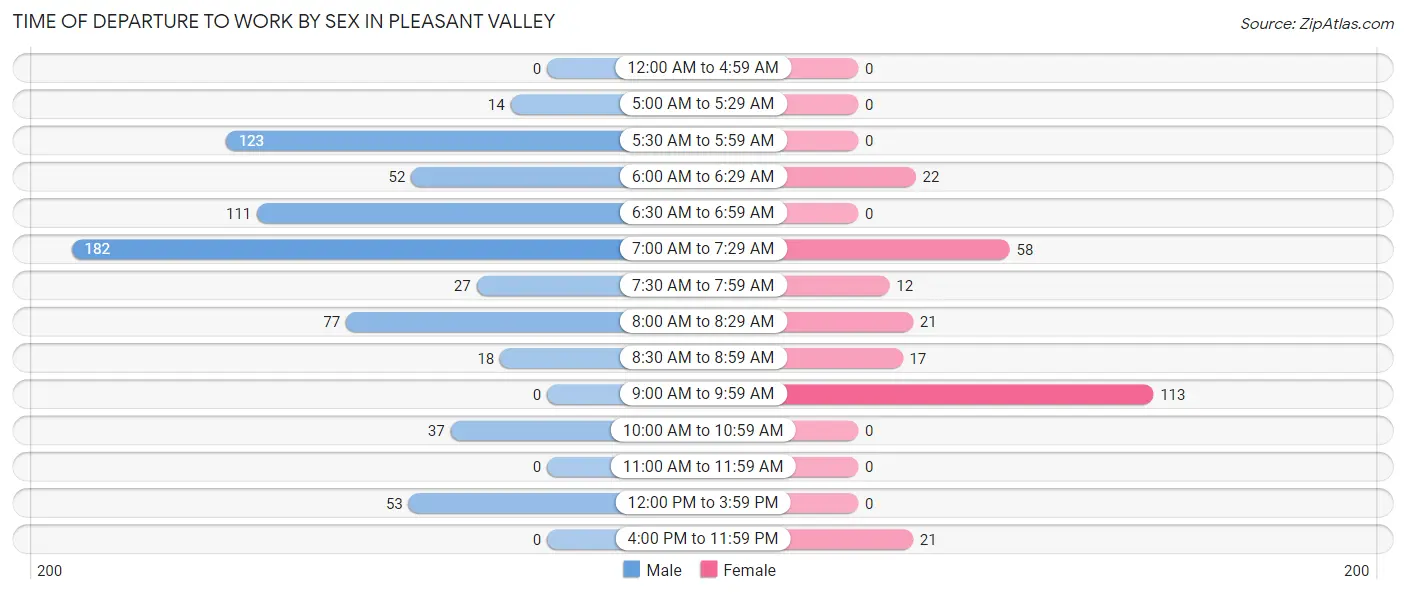
| Time of Departure | Male | Female |
| 12:00 AM to 4:59 AM | 0 (0.0%) | 0 (0.0%) |
| 5:00 AM to 5:29 AM | 14 (2.0%) | 0 (0.0%) |
| 5:30 AM to 5:59 AM | 123 (17.7%) | 0 (0.0%) |
| 6:00 AM to 6:29 AM | 52 (7.5%) | 22 (8.3%) |
| 6:30 AM to 6:59 AM | 111 (16.0%) | 0 (0.0%) |
| 7:00 AM to 7:29 AM | 182 (26.2%) | 58 (22.0%) |
| 7:30 AM to 7:59 AM | 27 (3.9%) | 12 (4.5%) |
| 8:00 AM to 8:29 AM | 77 (11.1%) | 21 (8.0%) |
| 8:30 AM to 8:59 AM | 18 (2.6%) | 17 (6.4%) |
| 9:00 AM to 9:59 AM | 0 (0.0%) | 113 (42.8%) |
| 10:00 AM to 10:59 AM | 37 (5.3%) | 0 (0.0%) |
| 11:00 AM to 11:59 AM | 0 (0.0%) | 0 (0.0%) |
| 12:00 PM to 3:59 PM | 53 (7.6%) | 0 (0.0%) |
| 4:00 PM to 11:59 PM | 0 (0.0%) | 21 (8.0%) |
| Total | 694 (100.0%) | 264 (100.0%) |
Housing Occupancy in Pleasant Valley
Occupancy by Ownership in Pleasant Valley
Of the total 812 dwellings in Pleasant Valley, owner-occupied units account for 165 (20.3%), while renter-occupied units make up 647 (79.7%).
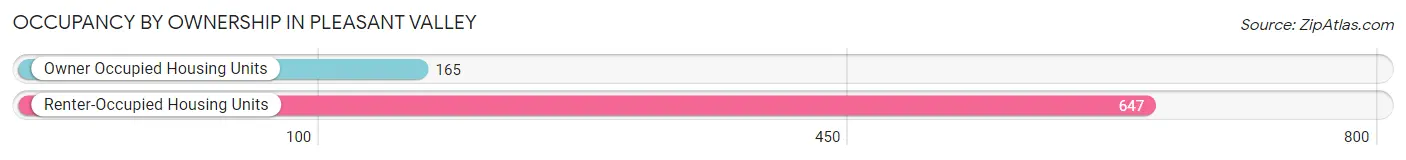
| Occupancy | # Housing Units | % Housing Units |
| Owner Occupied Housing Units | 165 | 20.3% |
| Renter-Occupied Housing Units | 647 | 79.7% |
| Total Occupied Housing Units | 812 | 100.0% |
Occupancy by Household Size in Pleasant Valley
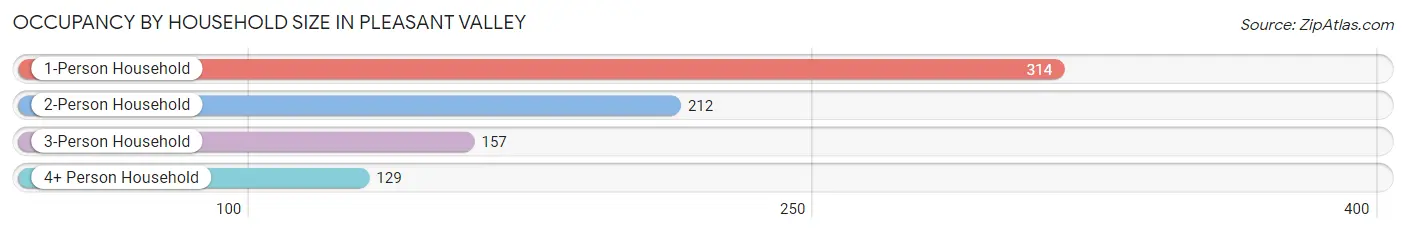
| Household Size | # Housing Units | % Housing Units |
| 1-Person Household | 314 | 38.7% |
| 2-Person Household | 212 | 26.1% |
| 3-Person Household | 157 | 19.3% |
| 4+ Person Household | 129 | 15.9% |
| Total Housing Units | 812 | 100.0% |
Occupancy by Ownership by Household Size in Pleasant Valley
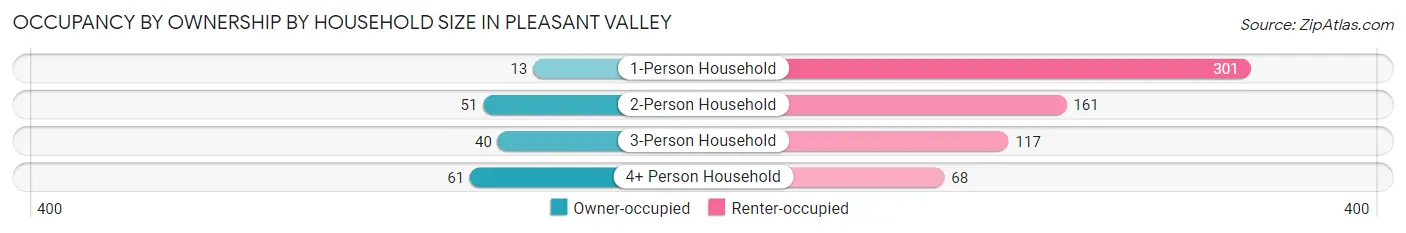
| Household Size | Owner-occupied | Renter-occupied |
| 1-Person Household | 13 (4.1%) | 301 (95.9%) |
| 2-Person Household | 51 (24.1%) | 161 (75.9%) |
| 3-Person Household | 40 (25.5%) | 117 (74.5%) |
| 4+ Person Household | 61 (47.3%) | 68 (52.7%) |
| Total Housing Units | 165 (20.3%) | 647 (79.7%) |
Occupancy by Educational Attainment in Pleasant Valley
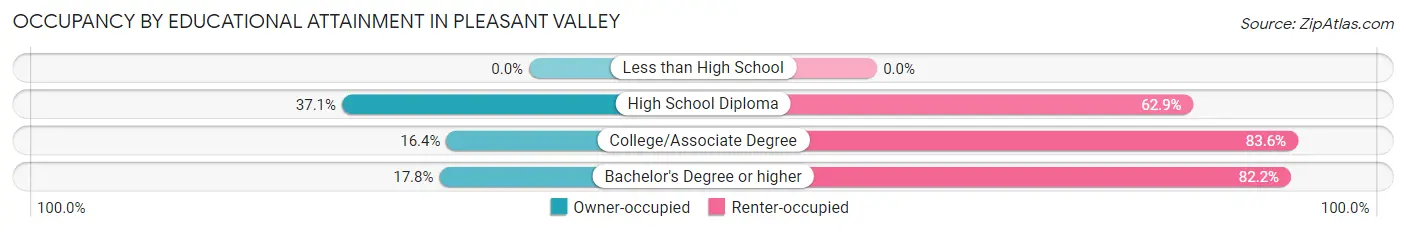
| Household Size | Owner-occupied | Renter-occupied |
| Less than High School | 0 (0.0%) | 0 (0.0%) |
| High School Diploma | 46 (37.1%) | 78 (62.9%) |
| College/Associate Degree | 39 (16.4%) | 199 (83.6%) |
| Bachelor's Degree or higher | 80 (17.8%) | 370 (82.2%) |
Occupancy by Age of Householder in Pleasant Valley
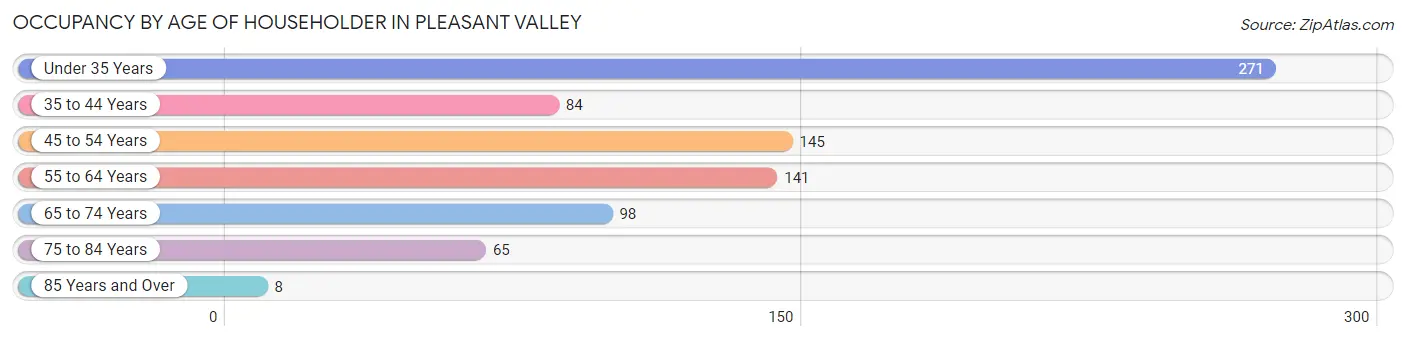
| Age Bracket | # Households | % Households |
| Under 35 Years | 271 | 33.4% |
| 35 to 44 Years | 84 | 10.3% |
| 45 to 54 Years | 145 | 17.9% |
| 55 to 64 Years | 141 | 17.4% |
| 65 to 74 Years | 98 | 12.1% |
| 75 to 84 Years | 65 | 8.0% |
| 85 Years and Over | 8 | 1.0% |
| Total | 812 | 100.0% |
Housing Finances in Pleasant Valley
Median Income by Occupancy in Pleasant Valley
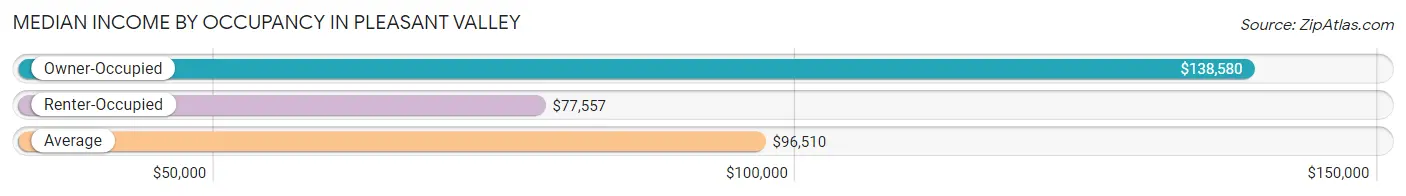
| Occupancy Type | # Households | Median Income |
| Owner-Occupied | 165 (20.3%) | $138,580 |
| Renter-Occupied | 647 (79.7%) | $77,557 |
| Average | 812 (100.0%) | $96,510 |
Occupancy by Householder Income Bracket in Pleasant Valley
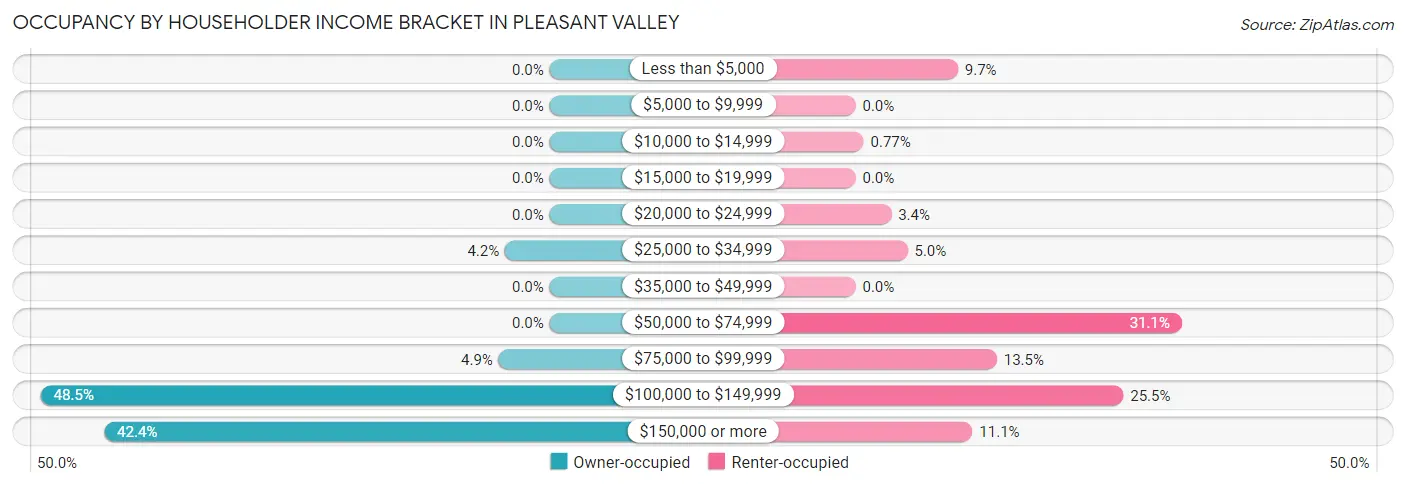
| Income Bracket | Owner-occupied | Renter-occupied |
| Less than $5,000 | 0 (0.0%) | 63 (9.7%) |
| $5,000 to $9,999 | 0 (0.0%) | 0 (0.0%) |
| $10,000 to $14,999 | 0 (0.0%) | 5 (0.8%) |
| $15,000 to $19,999 | 0 (0.0%) | 0 (0.0%) |
| $20,000 to $24,999 | 0 (0.0%) | 22 (3.4%) |
| $25,000 to $34,999 | 7 (4.2%) | 32 (5.0%) |
| $35,000 to $49,999 | 0 (0.0%) | 0 (0.0%) |
| $50,000 to $74,999 | 0 (0.0%) | 201 (31.1%) |
| $75,000 to $99,999 | 8 (4.9%) | 87 (13.5%) |
| $100,000 to $149,999 | 80 (48.5%) | 165 (25.5%) |
| $150,000 or more | 70 (42.4%) | 72 (11.1%) |
| Total | 165 (100.0%) | 647 (100.0%) |
Monthly Housing Cost Tiers in Pleasant Valley
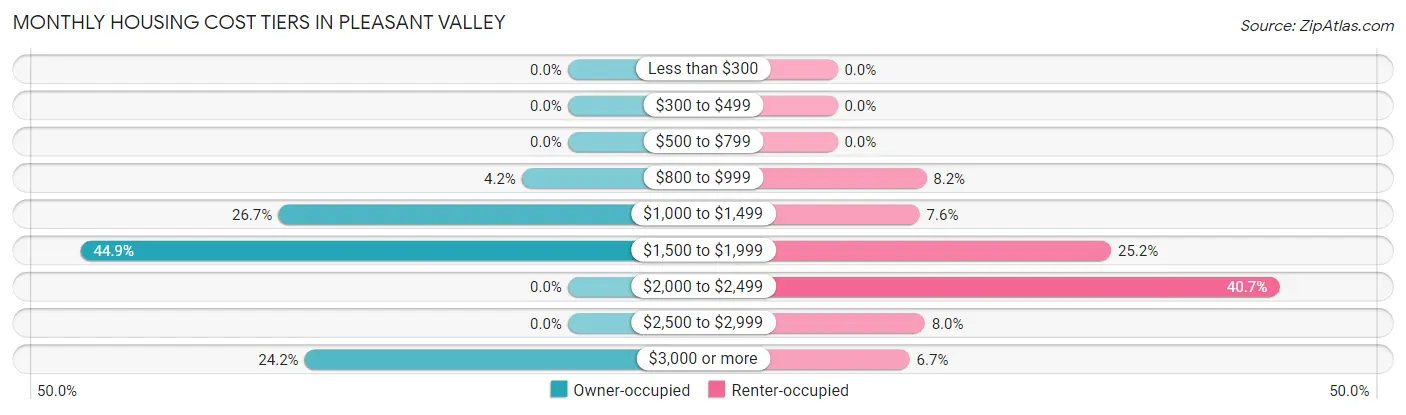
| Monthly Cost | Owner-occupied | Renter-occupied |
| Less than $300 | 0 (0.0%) | 0 (0.0%) |
| $300 to $499 | 0 (0.0%) | 0 (0.0%) |
| $500 to $799 | 0 (0.0%) | 0 (0.0%) |
| $800 to $999 | 7 (4.2%) | 53 (8.2%) |
| $1,000 to $1,499 | 44 (26.7%) | 49 (7.6%) |
| $1,500 to $1,999 | 74 (44.9%) | 163 (25.2%) |
| $2,000 to $2,499 | 0 (0.0%) | 263 (40.6%) |
| $2,500 to $2,999 | 0 (0.0%) | 52 (8.0%) |
| $3,000 or more | 40 (24.2%) | 43 (6.7%) |
| Total | 165 (100.0%) | 647 (100.0%) |
Physical Housing Characteristics in Pleasant Valley
Housing Structures in Pleasant Valley
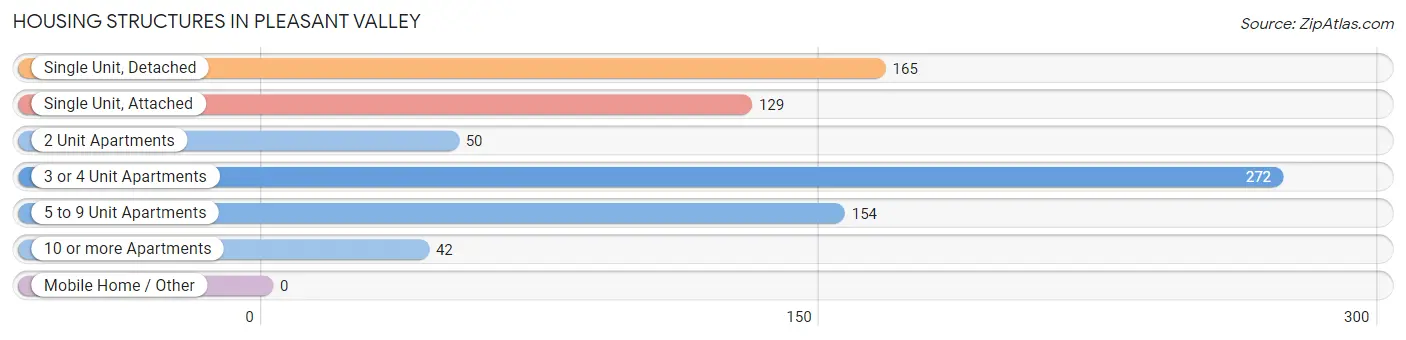
| Structure Type | # Housing Units | % Housing Units |
| Single Unit, Detached | 165 | 20.3% |
| Single Unit, Attached | 129 | 15.9% |
| 2 Unit Apartments | 50 | 6.2% |
| 3 or 4 Unit Apartments | 272 | 33.5% |
| 5 to 9 Unit Apartments | 154 | 19.0% |
| 10 or more Apartments | 42 | 5.2% |
| Mobile Home / Other | 0 | 0.0% |
| Total | 812 | 100.0% |
Housing Structures by Occupancy in Pleasant Valley
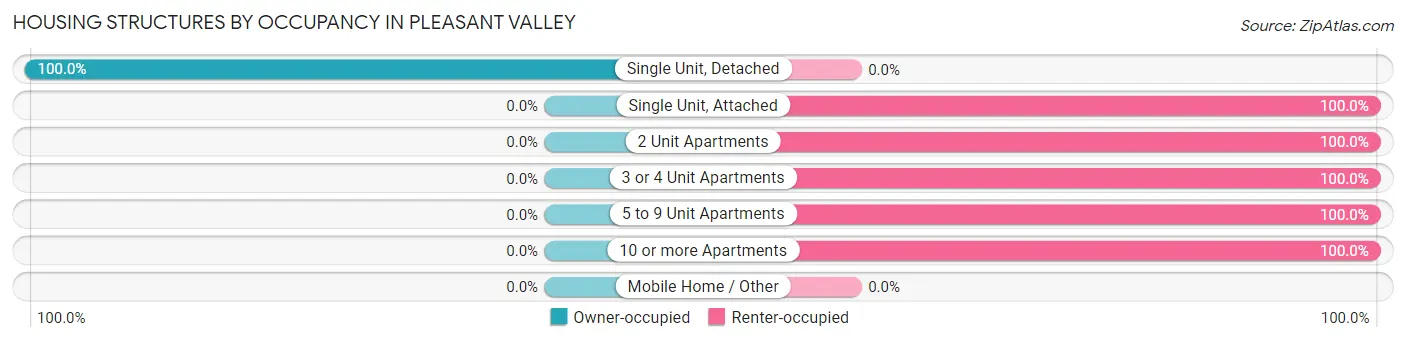
| Structure Type | Owner-occupied | Renter-occupied |
| Single Unit, Detached | 165 (100.0%) | 0 (0.0%) |
| Single Unit, Attached | 0 (0.0%) | 129 (100.0%) |
| 2 Unit Apartments | 0 (0.0%) | 50 (100.0%) |
| 3 or 4 Unit Apartments | 0 (0.0%) | 272 (100.0%) |
| 5 to 9 Unit Apartments | 0 (0.0%) | 154 (100.0%) |
| 10 or more Apartments | 0 (0.0%) | 42 (100.0%) |
| Mobile Home / Other | 0 (0.0%) | 0 (0.0%) |
| Total | 165 (20.3%) | 647 (79.7%) |
Housing Structures by Number of Rooms in Pleasant Valley
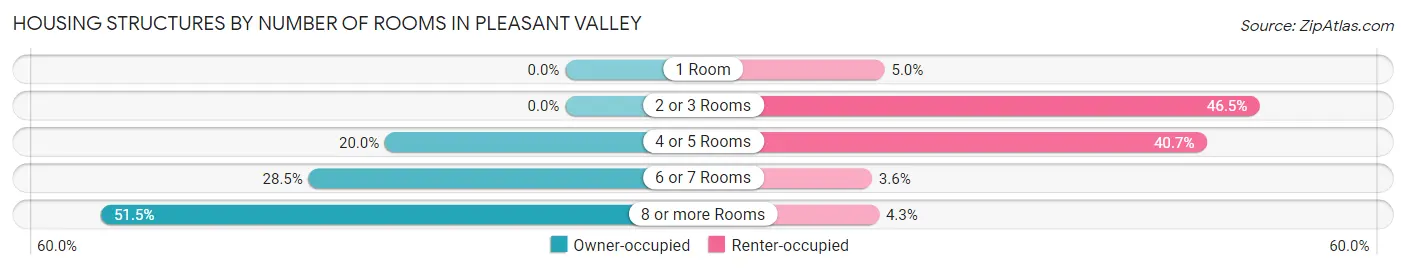
| Number of Rooms | Owner-occupied | Renter-occupied |
| 1 Room | 0 (0.0%) | 32 (5.0%) |
| 2 or 3 Rooms | 0 (0.0%) | 301 (46.5%) |
| 4 or 5 Rooms | 33 (20.0%) | 263 (40.6%) |
| 6 or 7 Rooms | 47 (28.5%) | 23 (3.5%) |
| 8 or more Rooms | 85 (51.5%) | 28 (4.3%) |
| Total | 165 (100.0%) | 647 (100.0%) |
Housing Structure by Heating Type in Pleasant Valley
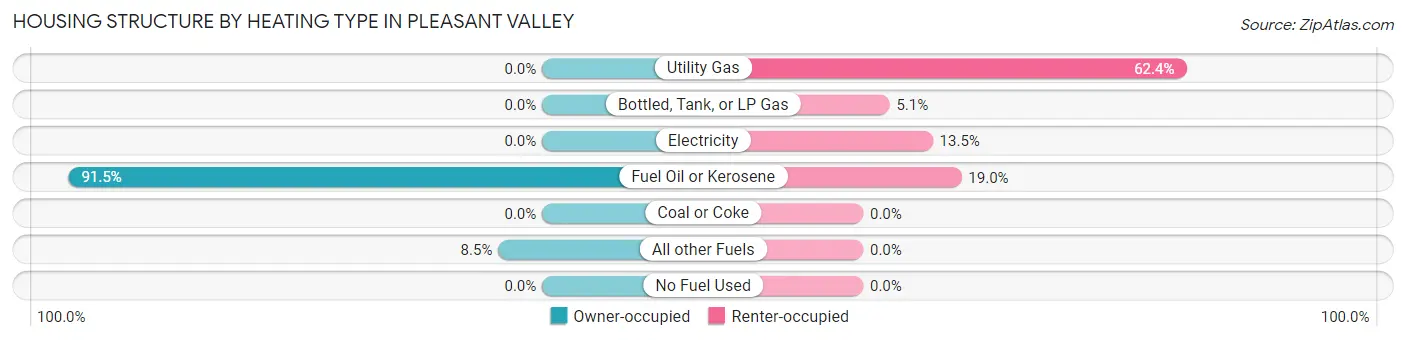
| Heating Type | Owner-occupied | Renter-occupied |
| Utility Gas | 0 (0.0%) | 404 (62.4%) |
| Bottled, Tank, or LP Gas | 0 (0.0%) | 33 (5.1%) |
| Electricity | 0 (0.0%) | 87 (13.5%) |
| Fuel Oil or Kerosene | 151 (91.5%) | 123 (19.0%) |
| Coal or Coke | 0 (0.0%) | 0 (0.0%) |
| All other Fuels | 14 (8.5%) | 0 (0.0%) |
| No Fuel Used | 0 (0.0%) | 0 (0.0%) |
| Total | 165 (100.0%) | 647 (100.0%) |
Household Vehicle Usage in Pleasant Valley
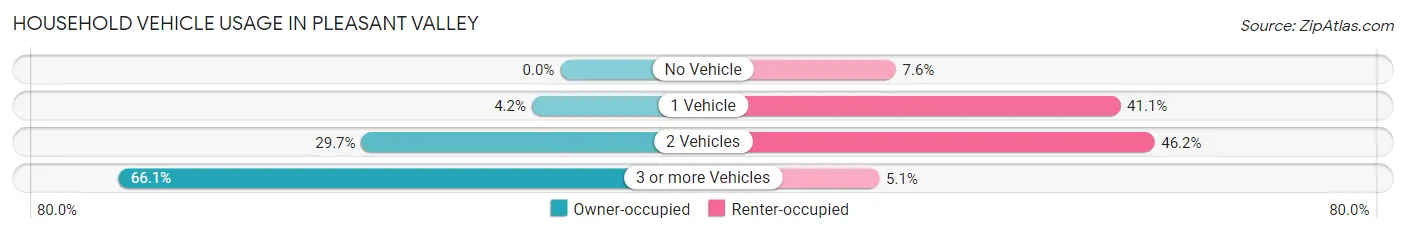
| Vehicles per Household | Owner-occupied | Renter-occupied |
| No Vehicle | 0 (0.0%) | 49 (7.6%) |
| 1 Vehicle | 7 (4.2%) | 266 (41.1%) |
| 2 Vehicles | 49 (29.7%) | 299 (46.2%) |
| 3 or more Vehicles | 109 (66.1%) | 33 (5.1%) |
| Total | 165 (100.0%) | 647 (100.0%) |
Real Estate & Mortgages in Pleasant Valley
Real Estate and Mortgage Overview in Pleasant Valley
| Characteristic | Without Mortgage | With Mortgage |
| Housing Units | 51 | 114 |
| Median Property Value | $280,800 | $329,500 |
| Median Household Income | $138,693 | $56 |
| Monthly Housing Costs | $1,084 | $40 |
| Real Estate Taxes | $8,551 | $0 |
Property Value by Mortgage Status in Pleasant Valley
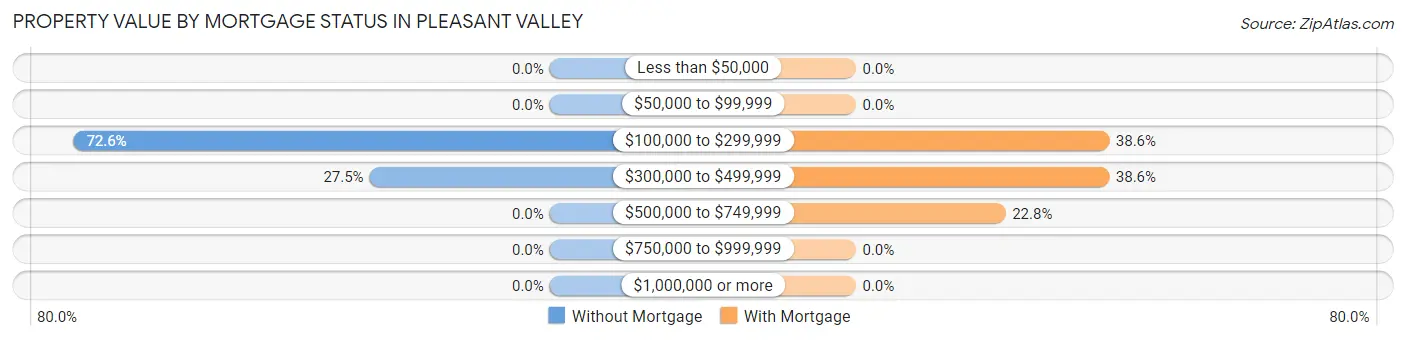
| Property Value | Without Mortgage | With Mortgage |
| Less than $50,000 | 0 (0.0%) | 0 (0.0%) |
| $50,000 to $99,999 | 0 (0.0%) | 0 (0.0%) |
| $100,000 to $299,999 | 37 (72.6%) | 44 (38.6%) |
| $300,000 to $499,999 | 14 (27.5%) | 44 (38.6%) |
| $500,000 to $749,999 | 0 (0.0%) | 26 (22.8%) |
| $750,000 to $999,999 | 0 (0.0%) | 0 (0.0%) |
| $1,000,000 or more | 0 (0.0%) | 0 (0.0%) |
| Total | 51 (100.0%) | 114 (100.0%) |
Household Income by Mortgage Status in Pleasant Valley
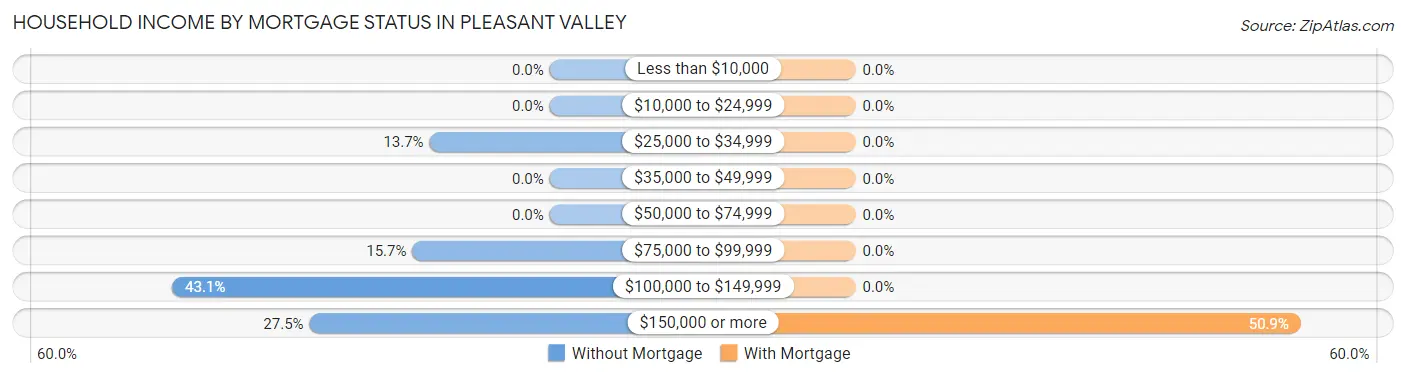
| Household Income | Without Mortgage | With Mortgage |
| Less than $10,000 | 0 (0.0%) | 0 (0.0%) |
| $10,000 to $24,999 | 0 (0.0%) | 0 (0.0%) |
| $25,000 to $34,999 | 7 (13.7%) | 0 (0.0%) |
| $35,000 to $49,999 | 0 (0.0%) | 0 (0.0%) |
| $50,000 to $74,999 | 0 (0.0%) | 0 (0.0%) |
| $75,000 to $99,999 | 8 (15.7%) | 0 (0.0%) |
| $100,000 to $149,999 | 22 (43.1%) | 0 (0.0%) |
| $150,000 or more | 14 (27.5%) | 58 (50.9%) |
| Total | 51 (100.0%) | 114 (100.0%) |
Property Value to Household Income Ratio in Pleasant Valley
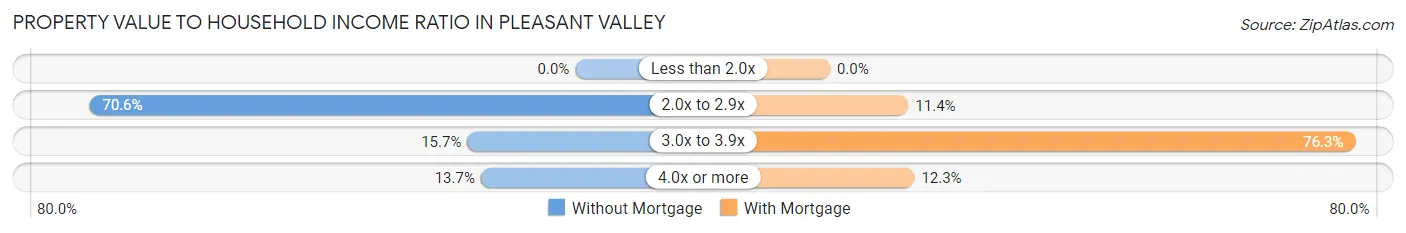
| Value-to-Income Ratio | Without Mortgage | With Mortgage |
| Less than 2.0x | 0 (0.0%) | 0 (0.0%) |
| 2.0x to 2.9x | 36 (70.6%) | 13 (11.4%) |
| 3.0x to 3.9x | 8 (15.7%) | 87 (76.3%) |
| 4.0x or more | 7 (13.7%) | 14 (12.3%) |
| Total | 51 (100.0%) | 114 (100.0%) |
Real Estate Taxes by Mortgage Status in Pleasant Valley
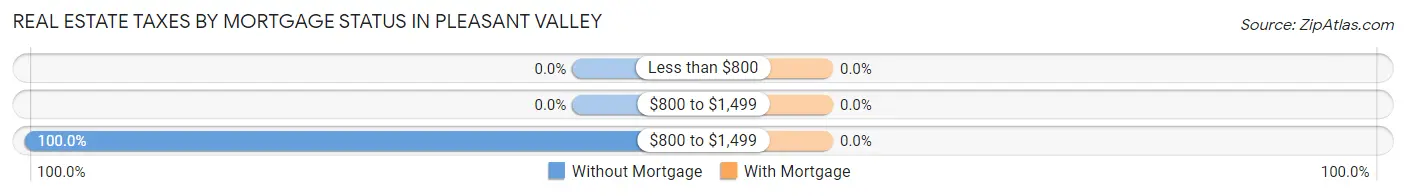
| Property Taxes | Without Mortgage | With Mortgage |
| Less than $800 | 0 (0.0%) | 0 (0.0%) |
| $800 to $1,499 | 0 (0.0%) | 0 (0.0%) |
| $800 to $1,499 | 51 (100.0%) | 0 (0.0%) |
| Total | 51 (100.0%) | 114 (100.0%) |
Health & Disability in Pleasant Valley
Health Insurance Coverage by Age in Pleasant Valley
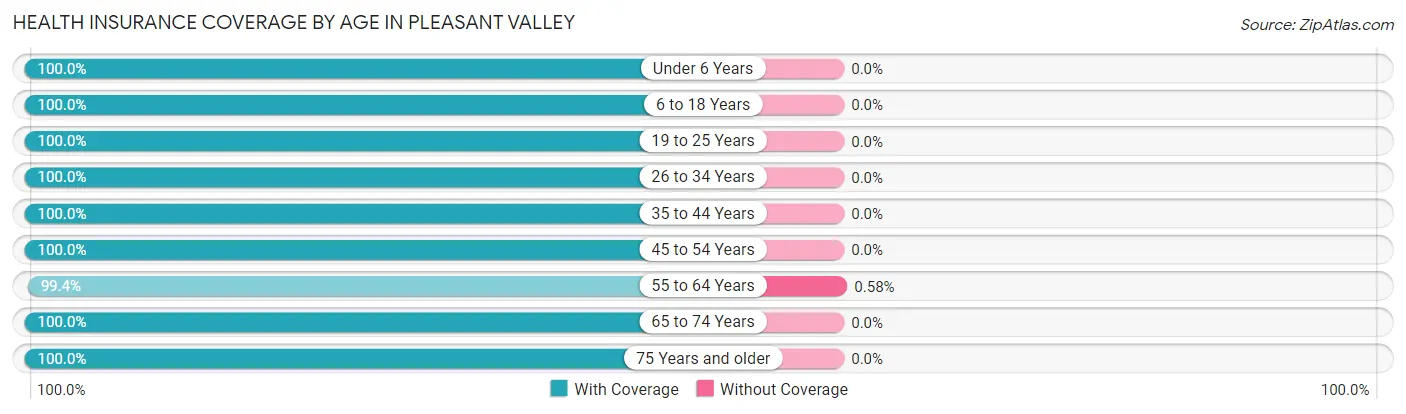
| Age Bracket | With Coverage | Without Coverage |
| Under 6 Years | 188 (100.0%) | 0 (0.0%) |
| 6 to 18 Years | 242 (100.0%) | 0 (0.0%) |
| 19 to 25 Years | 387 (100.0%) | 0 (0.0%) |
| 26 to 34 Years | 165 (100.0%) | 0 (0.0%) |
| 35 to 44 Years | 203 (100.0%) | 0 (0.0%) |
| 45 to 54 Years | 280 (100.0%) | 0 (0.0%) |
| 55 to 64 Years | 172 (99.4%) | 1 (0.6%) |
| 65 to 74 Years | 129 (100.0%) | 0 (0.0%) |
| 75 Years and older | 81 (100.0%) | 0 (0.0%) |
| Total | 1,847 (100.0%) | 1 (0.1%) |
Health Insurance Coverage by Citizenship Status in Pleasant Valley
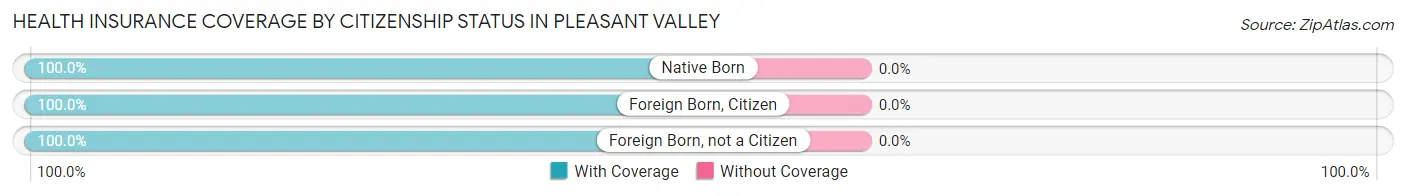
| Citizenship Status | With Coverage | Without Coverage |
| Native Born | 188 (100.0%) | 0 (0.0%) |
| Foreign Born, Citizen | 242 (100.0%) | 0 (0.0%) |
| Foreign Born, not a Citizen | 387 (100.0%) | 0 (0.0%) |
Health Insurance Coverage by Household Income in Pleasant Valley
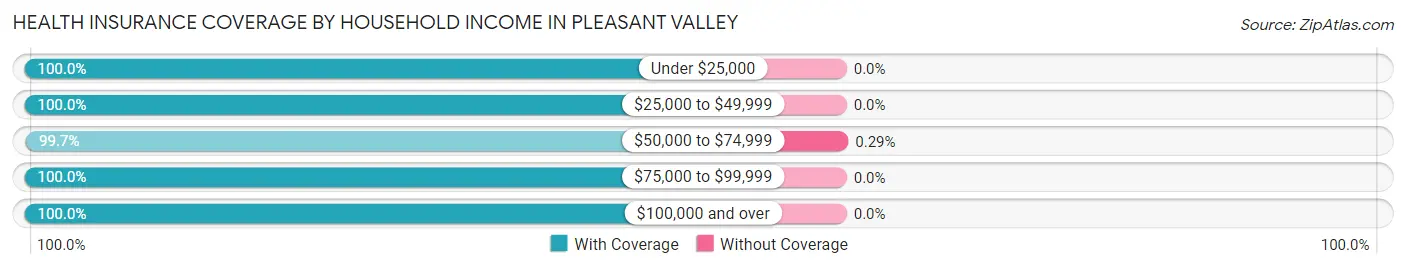
| Household Income | With Coverage | Without Coverage |
| Under $25,000 | 95 (100.0%) | 0 (0.0%) |
| $25,000 to $49,999 | 46 (100.0%) | 0 (0.0%) |
| $50,000 to $74,999 | 339 (99.7%) | 1 (0.3%) |
| $75,000 to $99,999 | 208 (100.0%) | 0 (0.0%) |
| $100,000 and over | 1,159 (100.0%) | 0 (0.0%) |
Public vs Private Health Insurance Coverage by Age in Pleasant Valley
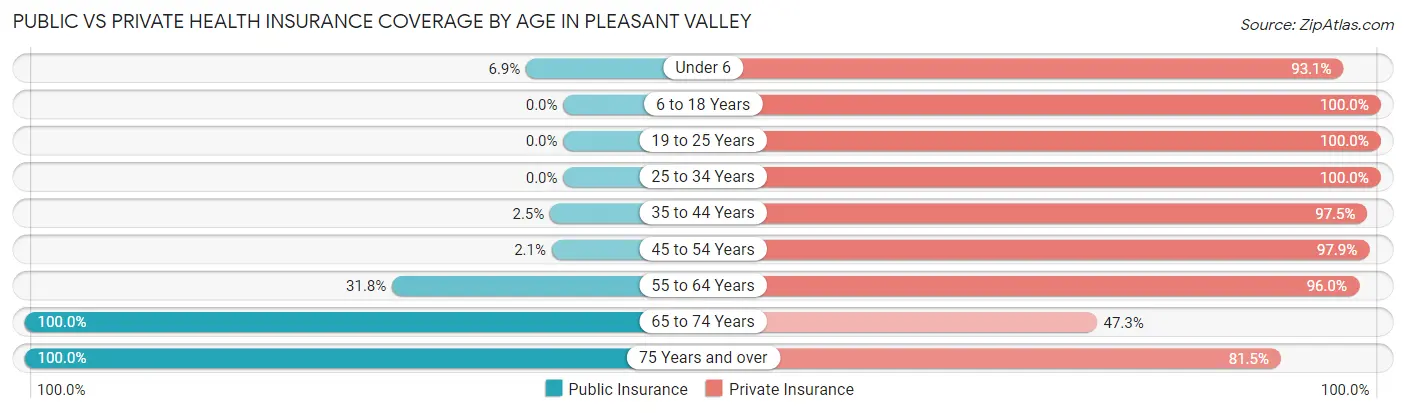
| Age Bracket | Public Insurance | Private Insurance |
| Under 6 | 13 (6.9%) | 175 (93.1%) |
| 6 to 18 Years | 0 (0.0%) | 242 (100.0%) |
| 19 to 25 Years | 0 (0.0%) | 387 (100.0%) |
| 25 to 34 Years | 0 (0.0%) | 165 (100.0%) |
| 35 to 44 Years | 5 (2.5%) | 198 (97.5%) |
| 45 to 54 Years | 6 (2.1%) | 274 (97.9%) |
| 55 to 64 Years | 55 (31.8%) | 166 (96.0%) |
| 65 to 74 Years | 129 (100.0%) | 61 (47.3%) |
| 75 Years and over | 81 (100.0%) | 66 (81.5%) |
| Total | 289 (15.6%) | 1,734 (93.8%) |
Disability Status by Sex by Age in Pleasant Valley
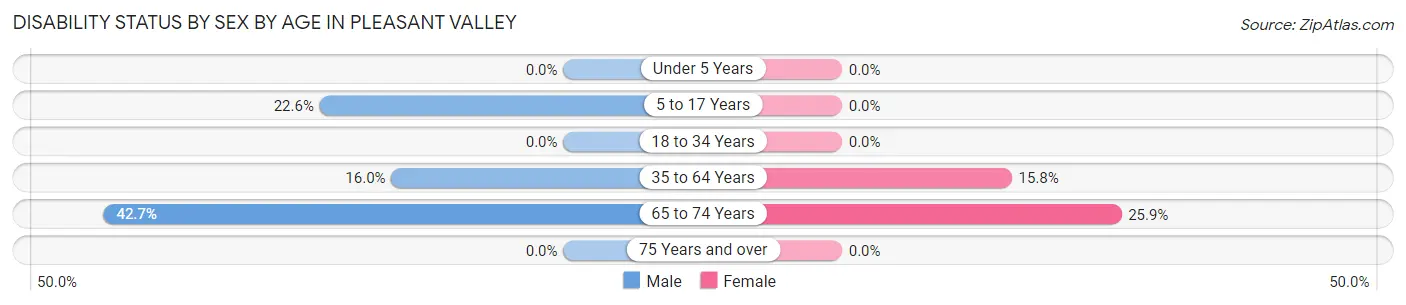
| Age Bracket | Male | Female |
| Under 5 Years | 0 (0.0%) | 0 (0.0%) |
| 5 to 17 Years | 26 (22.6%) | 0 (0.0%) |
| 18 to 34 Years | 0 (0.0%) | 0 (0.0%) |
| 35 to 64 Years | 49 (16.0%) | 55 (15.8%) |
| 65 to 74 Years | 32 (42.7%) | 14 (25.9%) |
| 75 Years and over | 0 (0.0%) | 0 (0.0%) |
Disability Class by Sex by Age in Pleasant Valley
Disability Class: Hearing Difficulty
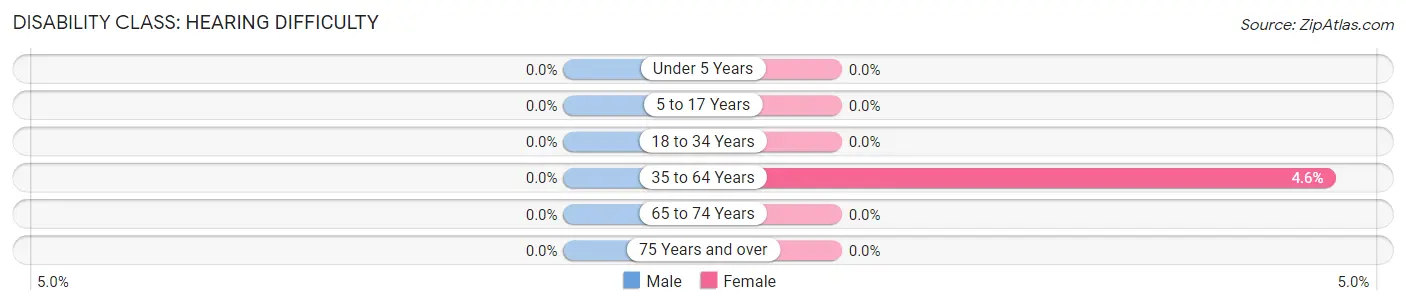
| Age Bracket | Male | Female |
| Under 5 Years | 0 (0.0%) | 0 (0.0%) |
| 5 to 17 Years | 0 (0.0%) | 0 (0.0%) |
| 18 to 34 Years | 0 (0.0%) | 0 (0.0%) |
| 35 to 64 Years | 0 (0.0%) | 16 (4.6%) |
| 65 to 74 Years | 0 (0.0%) | 0 (0.0%) |
| 75 Years and over | 0 (0.0%) | 0 (0.0%) |
Disability Class: Vision Difficulty
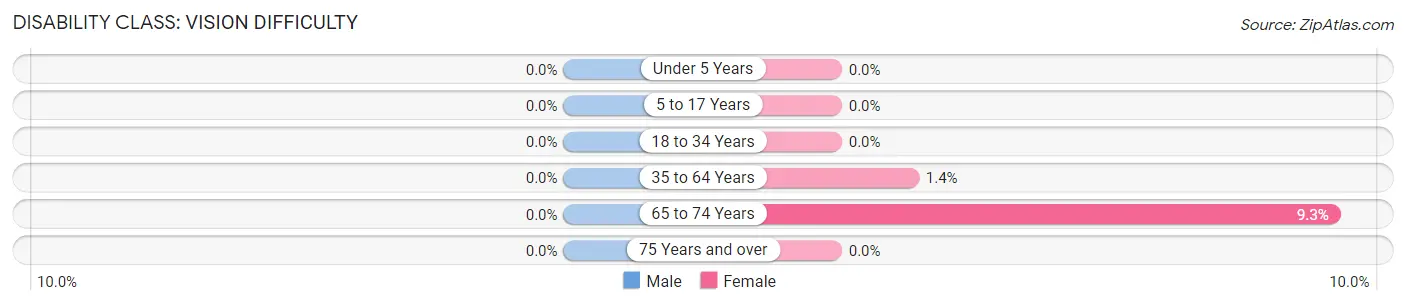
| Age Bracket | Male | Female |
| Under 5 Years | 0 (0.0%) | 0 (0.0%) |
| 5 to 17 Years | 0 (0.0%) | 0 (0.0%) |
| 18 to 34 Years | 0 (0.0%) | 0 (0.0%) |
| 35 to 64 Years | 0 (0.0%) | 5 (1.4%) |
| 65 to 74 Years | 0 (0.0%) | 5 (9.3%) |
| 75 Years and over | 0 (0.0%) | 0 (0.0%) |
Disability Class: Cognitive Difficulty
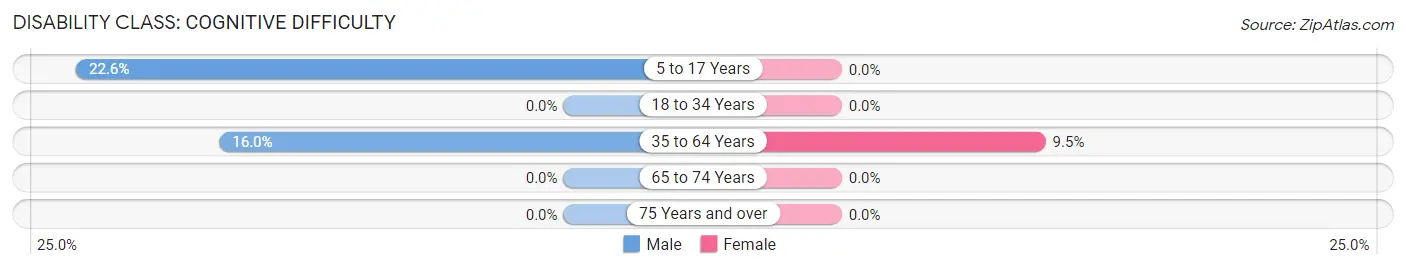
| Age Bracket | Male | Female |
| 5 to 17 Years | 26 (22.6%) | 0 (0.0%) |
| 18 to 34 Years | 0 (0.0%) | 0 (0.0%) |
| 35 to 64 Years | 49 (16.0%) | 33 (9.5%) |
| 65 to 74 Years | 0 (0.0%) | 0 (0.0%) |
| 75 Years and over | 0 (0.0%) | 0 (0.0%) |
Disability Class: Ambulatory Difficulty
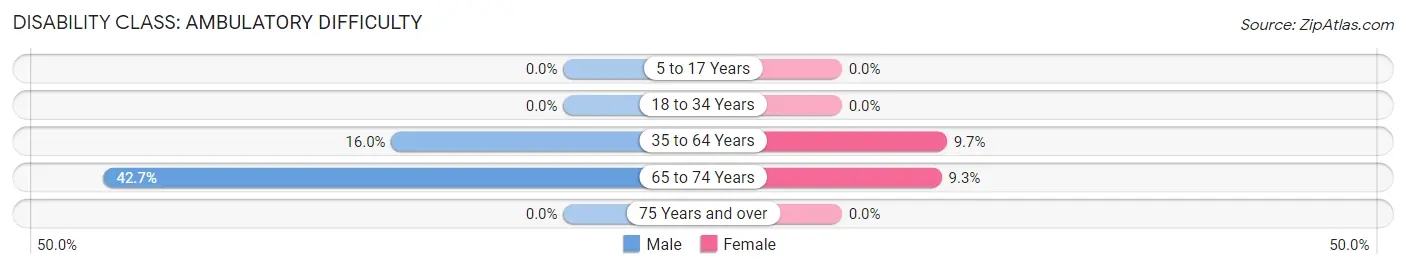
| Age Bracket | Male | Female |
| 5 to 17 Years | 0 (0.0%) | 0 (0.0%) |
| 18 to 34 Years | 0 (0.0%) | 0 (0.0%) |
| 35 to 64 Years | 49 (16.0%) | 34 (9.7%) |
| 65 to 74 Years | 32 (42.7%) | 5 (9.3%) |
| 75 Years and over | 0 (0.0%) | 0 (0.0%) |
Disability Class: Self-Care Difficulty
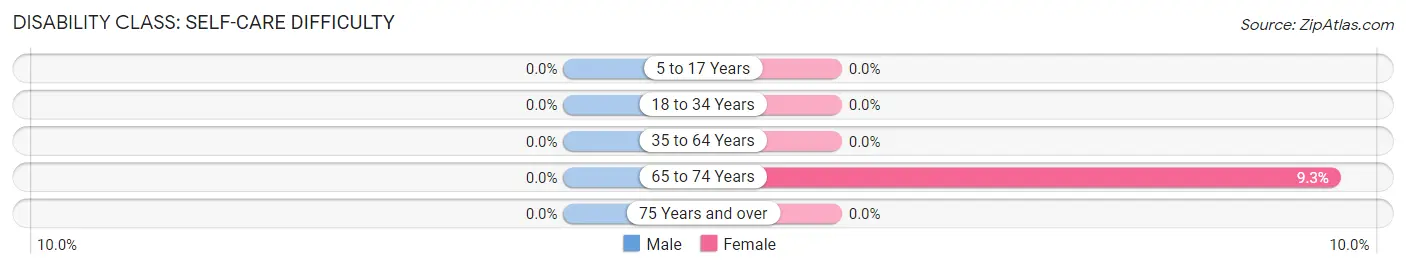
| Age Bracket | Male | Female |
| 5 to 17 Years | 0 (0.0%) | 0 (0.0%) |
| 18 to 34 Years | 0 (0.0%) | 0 (0.0%) |
| 35 to 64 Years | 0 (0.0%) | 0 (0.0%) |
| 65 to 74 Years | 0 (0.0%) | 5 (9.3%) |
| 75 Years and over | 0 (0.0%) | 0 (0.0%) |
Technology Access in Pleasant Valley
Computing Device Access in Pleasant Valley
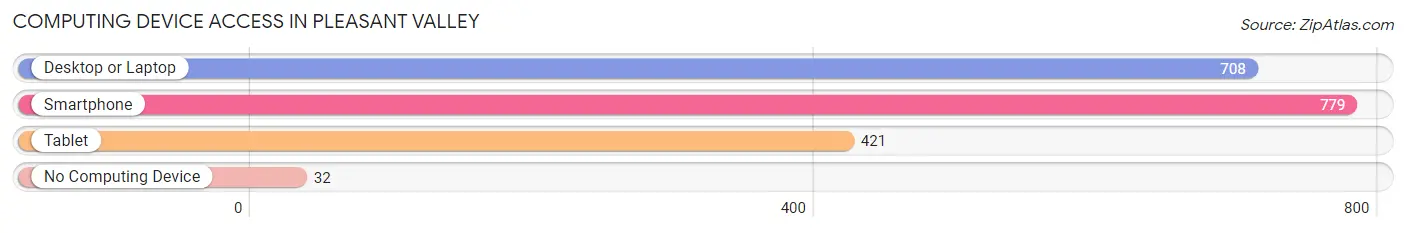
| Device Type | # Households | % Households |
| Desktop or Laptop | 708 | 87.2% |
| Smartphone | 779 | 95.9% |
| Tablet | 421 | 51.8% |
| No Computing Device | 32 | 3.9% |
| Total | 812 | 100.0% |
Internet Access in Pleasant Valley
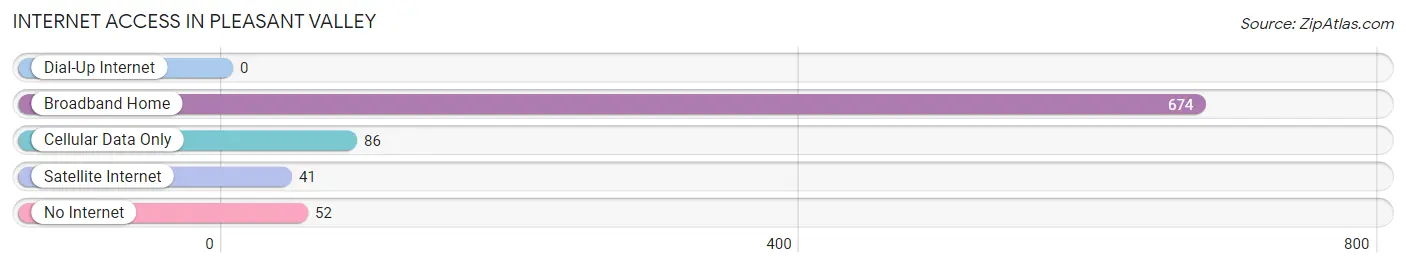
| Internet Type | # Households | % Households |
| Dial-Up Internet | 0 | 0.0% |
| Broadband Home | 674 | 83.0% |
| Cellular Data Only | 86 | 10.6% |
| Satellite Internet | 41 | 5.1% |
| No Internet | 52 | 6.4% |
| Total | 812 | 100.0% |
Pleasant Valley Summary
Pleasant Valley is a hamlet located in the town of Washington in Dutchess County, New York. It is situated in the Hudson Valley region of New York, approximately 70 miles north of New York City. The hamlet is bordered by the towns of LaGrange, East Fishkill, and Union Vale.
History
The area that is now Pleasant Valley was originally inhabited by the Wappinger Native American tribe. The first European settlers arrived in the area in the late 17th century. The hamlet was originally known as “Pleasant Valley” due to its pleasant climate and fertile soil.
In 1737, the first church in the area was established. The hamlet was officially incorporated in 1845. During the 19th century, Pleasant Valley was a popular destination for wealthy New Yorkers who wanted to escape the hustle and bustle of the city.
In the early 20th century, the hamlet experienced a period of growth and development. The Pleasant Valley Country Club was established in 1910, and the hamlet’s first post office opened in 1912.
Geography
Pleasant Valley is located in the Hudson Valley region of New York. The hamlet is situated in the town of Washington, which is bordered by the towns of LaGrange, East Fishkill, and Union Vale.
The hamlet is located in the Hudson River Valley, which is a major agricultural region. The area is known for its rolling hills, lush forests, and picturesque views of the Hudson River.
The hamlet is located approximately 70 miles north of New York City. It is accessible by car via Interstate 84 and the Taconic State Parkway.
Economy
Pleasant Valley’s economy is largely based on agriculture. The area is known for its dairy farms, apple orchards, and vegetable farms. The hamlet is also home to several wineries and breweries.
The hamlet is also home to several small businesses, including restaurants, retail stores, and professional services. The hamlet is also home to several corporate offices, including IBM and PepsiCo.
Demographics
As of the 2010 census, the population of Pleasant Valley was 5,845. The median household income was $76,945, and the median age was 41.
The hamlet is predominantly white (94.3%), with small percentages of African American (2.2%), Asian (1.3%), and Hispanic (1.2%) residents. The hamlet is also home to a small population of Native Americans (0.2%).
Conclusion
Pleasant Valley is a hamlet located in the town of Washington in Dutchess County, New York. It is situated in the Hudson Valley region of New York, approximately 70 miles north of New York City. The hamlet is bordered by the towns of LaGrange, East Fishkill, and Union Vale. The area was originally inhabited by the Wappinger Native American tribe, and was officially incorporated in 1845. The hamlet’s economy is largely based on agriculture, and it is also home to several small businesses and corporate offices. As of the 2010 census, the population of Pleasant Valley was 5,845. The hamlet is predominantly white, with small percentages of African American, Asian, Hispanic, and Native American residents.
Common Questions
What is the Total Population of Pleasant Valley?
Total Population of Pleasant Valley is 1,848.
What is the Total Male Population of Pleasant Valley?
Total Male Population of Pleasant Valley is 1,042.
What is the Total Female Population of Pleasant Valley?
Total Female Population of Pleasant Valley is 806.
What is the Ratio of Males per 100 Females in Pleasant Valley?
There are 129.28 Males per 100 Females in Pleasant Valley.
What is the Ratio of Females per 100 Males in Pleasant Valley?
There are 77.35 Females per 100 Males in Pleasant Valley.
What is the Median Population Age in Pleasant Valley?
Median Population Age in Pleasant Valley is 33.3 Years.
What is the Average Family Size in Pleasant Valley
Average Family Size in Pleasant Valley is 3.1 People.
What is the Average Household Size in Pleasant Valley
Average Household Size in Pleasant Valley is 2.3 People.
What is Per Capita Income in Pleasant Valley?
Per Capita income in Pleasant Valley is $43,758.
What is the Median Family Income in Pleasant Valley?
Median Family Income in Pleasant Valley is $109,628.
What is the Median Household income in Pleasant Valley?
Median Household Income in Pleasant Valley is $96,510.
What is Inequality or Gini Index in Pleasant Valley?
Inequality or Gini Index in Pleasant Valley is 0.34.
How Large is the Labor Force in Pleasant Valley?
There are 1,174 People in the Labor Forcein in Pleasant Valley.
What is the Percentage of People in the Labor Force in Pleasant Valley?
82.8% of People are in the Labor Force in Pleasant Valley.
What is the Unemployment Rate in Pleasant Valley?
Unemployment Rate in Pleasant Valley is 1.5%.