Robbinsdale, MN
Robbinsdale Map
Robbinsdale Overview
14,452
TOTAL POPULATION
7,055
MALE POPULATION
7,397
FEMALE POPULATION
95.38
MALES / 100 FEMALES
104.85
FEMALES / 100 MALES
38.9
MEDIAN AGE
3.0
AVG FAMILY SIZE
2.2
AVG HOUSEHOLD SIZE
$48,508
PER CAPITA INCOME
$105,878
AVG FAMILY INCOME
$80,125
AVG HOUSEHOLD INCOME
10.6%
WAGE / INCOME GAP [ % ]
89.4¢/ $1
WAGE / INCOME GAP [ $ ]
0.48
INEQUALITY / GINI INDEX
8,484
LABOR FORCE [ PEOPLE ]
73.5%
PERCENT IN LABOR FORCE
5.8%
UNEMPLOYMENT RATE
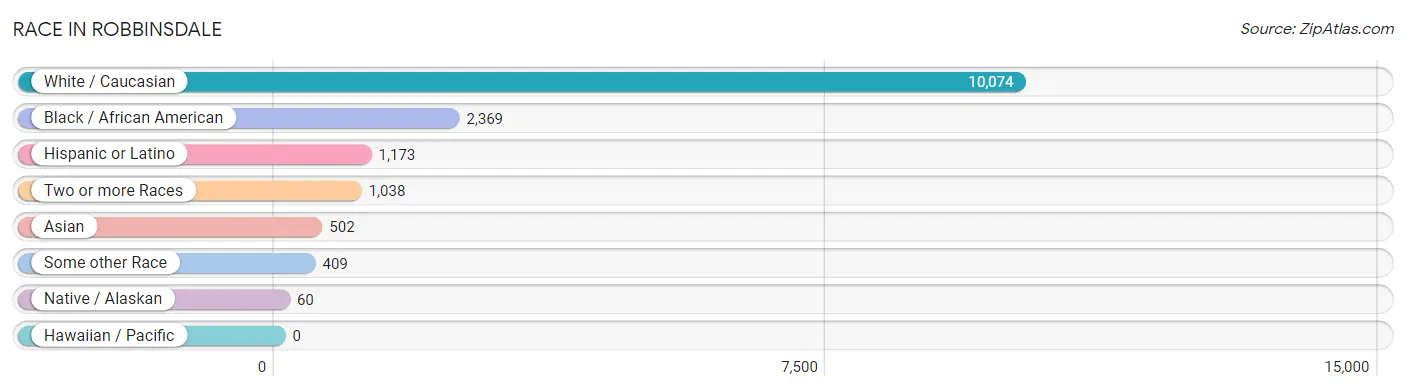
Race in Robbinsdale
The most populous races in Robbinsdale are White / Caucasian (10,074 | 69.7%), Black / African American (2,369 | 16.4%), and Hispanic or Latino (1,173 | 8.1%).
| Race | # Population | % Population |
| Asian | 502 | 3.5% |
| Black / African American | 2,369 | 16.4% |
| Hawaiian / Pacific | 0 | 0.0% |
| Hispanic or Latino | 1,173 | 8.1% |
| Native / Alaskan | 60 | 0.4% |
| White / Caucasian | 10,074 | 69.7% |
| Two or more Races | 1,038 | 7.2% |
| Some other Race | 409 | 2.8% |
| Total | 14,452 | 100.0% |
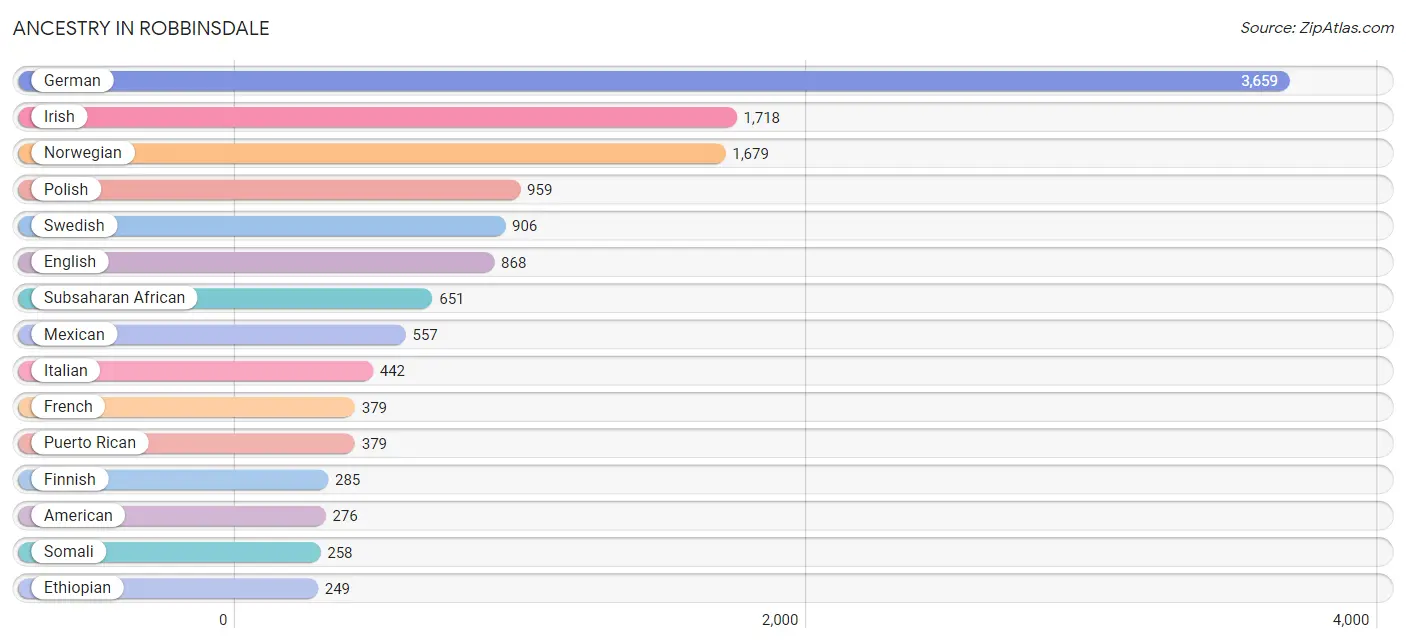
Ancestry in Robbinsdale
The most populous ancestries reported in Robbinsdale are German (3,659 | 25.3%), Irish (1,718 | 11.9%), Norwegian (1,679 | 11.6%), Polish (959 | 6.6%), and Swedish (906 | 6.3%), together accounting for 61.7% of all Robbinsdale residents.
| Ancestry | # Population | % Population |
| African | 104 | 0.7% |
| American | 276 | 1.9% |
| Arab | 61 | 0.4% |
| Austrian | 7 | 0.1% |
| Bahamian | 138 | 0.9% |
| Bangladeshi | 73 | 0.5% |
| Belgian | 46 | 0.3% |
| Bhutanese | 5 | 0.0% |
| Brazilian | 19 | 0.1% |
| British | 22 | 0.2% |
| Bulgarian | 11 | 0.1% |
| Burmese | 115 | 0.8% |
| Canadian | 2 | 0.0% |
| Central American | 17 | 0.1% |
| Cherokee | 18 | 0.1% |
| Chilean | 11 | 0.1% |
| Chippewa | 138 | 0.9% |
| Colombian | 72 | 0.5% |
| Comanche | 4 | 0.0% |
| Croatian | 55 | 0.4% |
| Czech | 241 | 1.7% |
| Czechoslovakian | 39 | 0.3% |
| Danish | 182 | 1.3% |
| Dutch | 159 | 1.1% |
| Eastern European | 30 | 0.2% |
| Ecuadorian | 70 | 0.5% |
| English | 868 | 6.0% |
| Ethiopian | 249 | 1.7% |
| European | 233 | 1.6% |
| Finnish | 285 | 2.0% |
| French | 379 | 2.6% |
| French Canadian | 77 | 0.5% |
| German | 3,659 | 25.3% |
| German Russian | 9 | 0.1% |
| Greek | 69 | 0.5% |
| Guatemalan | 17 | 0.1% |
| Haitian | 15 | 0.1% |
| Hungarian | 21 | 0.2% |
| Indian (Asian) | 195 | 1.3% |
| Iranian | 22 | 0.2% |
| Irish | 1,718 | 11.9% |
| Italian | 442 | 3.1% |
| Japanese | 5 | 0.0% |
| Korean | 117 | 0.8% |
| Latvian | 6 | 0.0% |
| Lebanese | 36 | 0.3% |
| Liberian | 16 | 0.1% |
| Malaysian | 86 | 0.6% |
| Mexican | 557 | 3.8% |
| Mexican American Indian | 31 | 0.2% |
| Nigerian | 9 | 0.1% |
| Northern European | 82 | 0.6% |
| Norwegian | 1,679 | 11.6% |
| Pennsylvania German | 16 | 0.1% |
| Polish | 959 | 6.6% |
| Portuguese | 20 | 0.1% |
| Puerto Rican | 379 | 2.6% |
| Romanian | 19 | 0.1% |
| Russian | 111 | 0.8% |
| Scandinavian | 200 | 1.4% |
| Scotch-Irish | 45 | 0.3% |
| Scottish | 169 | 1.2% |
| Sioux | 2 | 0.0% |
| Slovak | 9 | 0.1% |
| Slovene | 30 | 0.2% |
| Somali | 258 | 1.8% |
| South American | 153 | 1.1% |
| Spaniard | 59 | 0.4% |
| Spanish | 8 | 0.1% |
| Sri Lankan | 58 | 0.4% |
| Subsaharan African | 651 | 4.5% |
| Swedish | 906 | 6.3% |
| Swiss | 9 | 0.1% |
| Thai | 79 | 0.5% |
| Trinidadian and Tobagonian | 138 | 0.9% |
| Ugandan | 15 | 0.1% |
| Ukrainian | 50 | 0.4% |
| Welsh | 32 | 0.2% | View All 78 Rows |
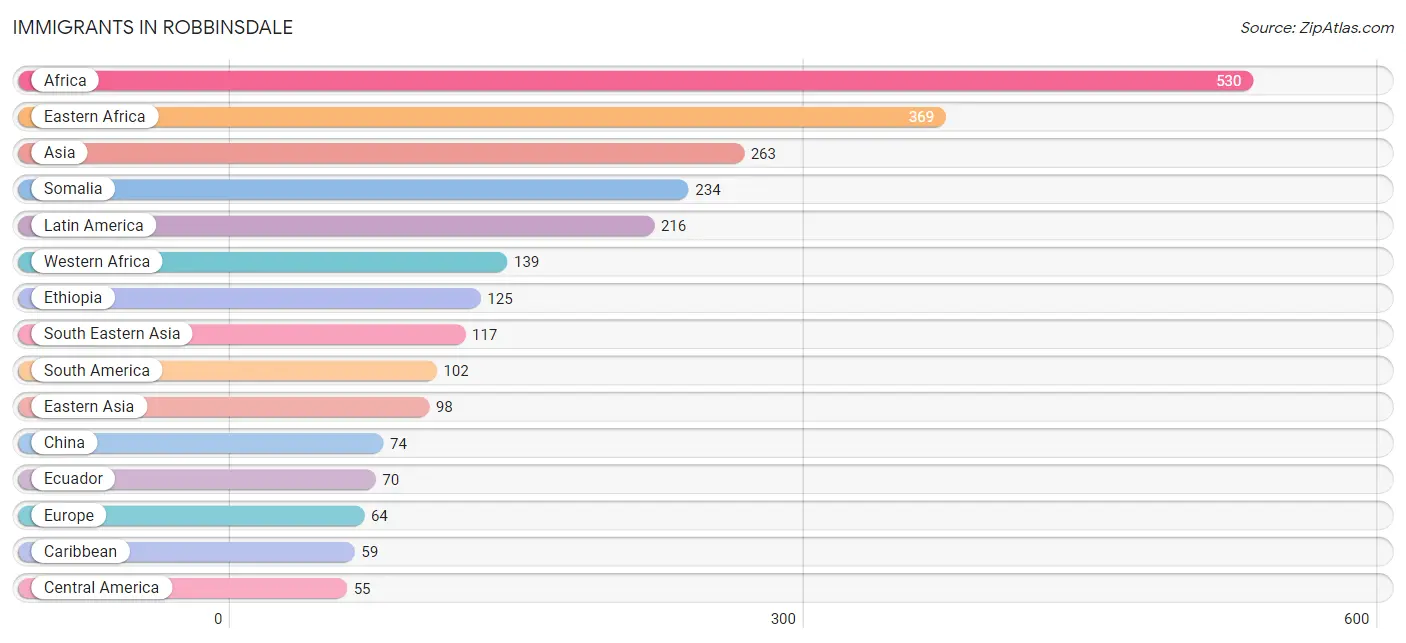
Immigrants in Robbinsdale
The most numerous immigrant groups reported in Robbinsdale came from Africa (530 | 3.7%), Eastern Africa (369 | 2.5%), Asia (263 | 1.8%), Somalia (234 | 1.6%), and Latin America (216 | 1.5%), together accounting for 11.1% of all Robbinsdale residents.
| Immigration Origin | # Population | % Population |
| Africa | 530 | 3.7% |
| Asia | 263 | 1.8% |
| Bahamas | 46 | 0.3% |
| Bulgaria | 11 | 0.1% |
| Canada | 6 | 0.0% |
| Caribbean | 59 | 0.4% |
| Central America | 55 | 0.4% |
| Chile | 3 | 0.0% |
| China | 74 | 0.5% |
| Colombia | 29 | 0.2% |
| Denmark | 21 | 0.2% |
| Eastern Africa | 369 | 2.5% |
| Eastern Asia | 98 | 0.7% |
| Eastern Europe | 30 | 0.2% |
| Ecuador | 70 | 0.5% |
| Ethiopia | 125 | 0.9% |
| Europe | 64 | 0.4% |
| Iran | 22 | 0.2% |
| Jamaica | 13 | 0.1% |
| Japan | 2 | 0.0% |
| Kenya | 6 | 0.0% |
| Korea | 22 | 0.2% |
| Laos | 44 | 0.3% |
| Latin America | 216 | 1.5% |
| Liberia | 48 | 0.3% |
| Mexico | 55 | 0.4% |
| Morocco | 17 | 0.1% |
| Nepal | 8 | 0.1% |
| Netherlands | 4 | 0.0% |
| Northern Africa | 17 | 0.1% |
| Northern Europe | 30 | 0.2% |
| Pakistan | 18 | 0.1% |
| Philippines | 50 | 0.4% |
| Romania | 19 | 0.1% |
| Somalia | 234 | 1.6% |
| South America | 102 | 0.7% |
| South Central Asia | 48 | 0.3% |
| South Eastern Asia | 117 | 0.8% |
| Thailand | 16 | 0.1% |
| Uganda | 4 | 0.0% |
| Vietnam | 7 | 0.1% |
| Western Africa | 139 | 1.0% |
| Western Europe | 4 | 0.0% | View All 43 Rows |
Sex and Age in Robbinsdale
Sex and Age in Robbinsdale
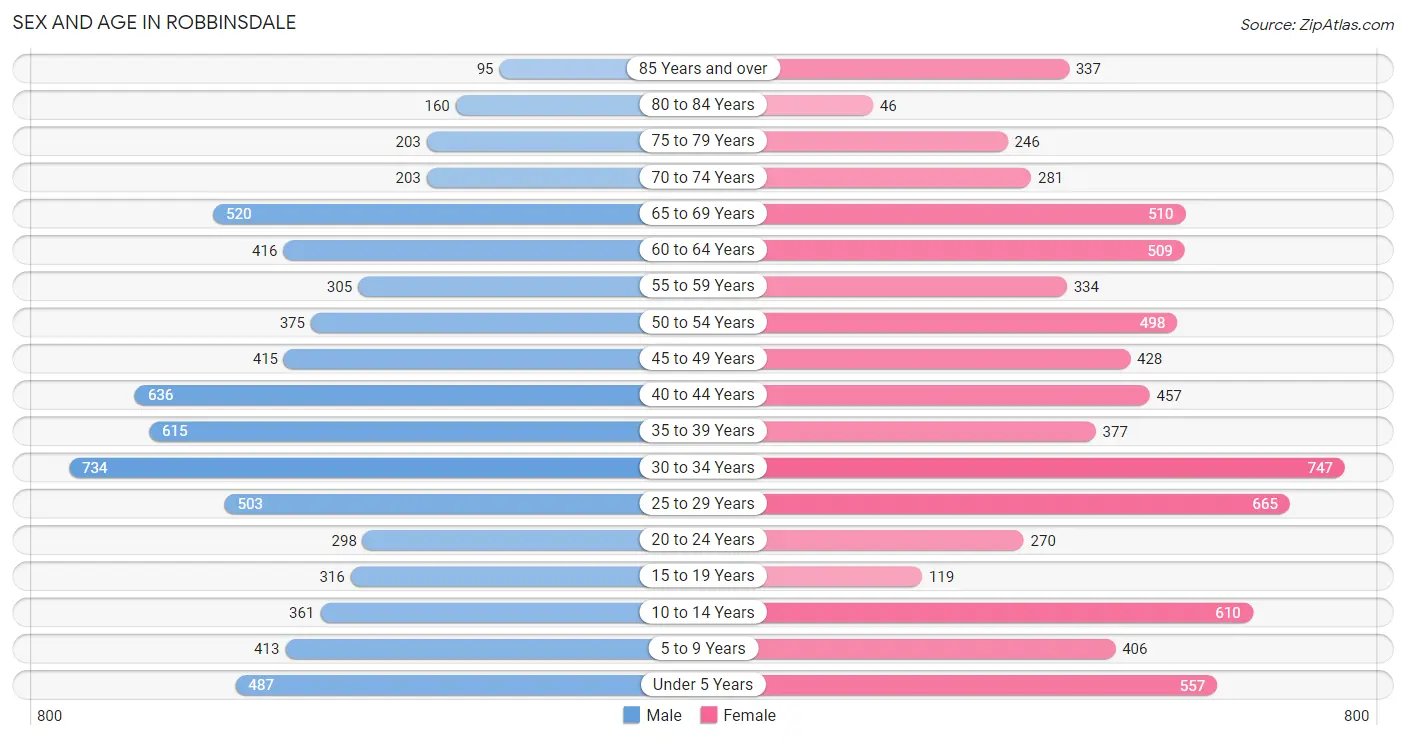
The most populous age groups in Robbinsdale are 30 to 34 Years (734 | 10.4%) for men and 30 to 34 Years (747 | 10.1%) for women.
| Age Bracket | Male | Female |
| Under 5 Years | 487 (6.9%) | 557 (7.5%) |
| 5 to 9 Years | 413 (5.9%) | 406 (5.5%) |
| 10 to 14 Years | 361 (5.1%) | 610 (8.3%) |
| 15 to 19 Years | 316 (4.5%) | 119 (1.6%) |
| 20 to 24 Years | 298 (4.2%) | 270 (3.6%) |
| 25 to 29 Years | 503 (7.1%) | 665 (9.0%) |
| 30 to 34 Years | 734 (10.4%) | 747 (10.1%) |
| 35 to 39 Years | 615 (8.7%) | 377 (5.1%) |
| 40 to 44 Years | 636 (9.0%) | 457 (6.2%) |
| 45 to 49 Years | 415 (5.9%) | 428 (5.8%) |
| 50 to 54 Years | 375 (5.3%) | 498 (6.7%) |
| 55 to 59 Years | 305 (4.3%) | 334 (4.5%) |
| 60 to 64 Years | 416 (5.9%) | 509 (6.9%) |
| 65 to 69 Years | 520 (7.4%) | 510 (6.9%) |
| 70 to 74 Years | 203 (2.9%) | 281 (3.8%) |
| 75 to 79 Years | 203 (2.9%) | 246 (3.3%) |
| 80 to 84 Years | 160 (2.3%) | 46 (0.6%) |
| 85 Years and over | 95 (1.3%) | 337 (4.6%) |
| Total | 7,055 (100.0%) | 7,397 (100.0%) |
Families and Households in Robbinsdale
Median Family Size in Robbinsdale
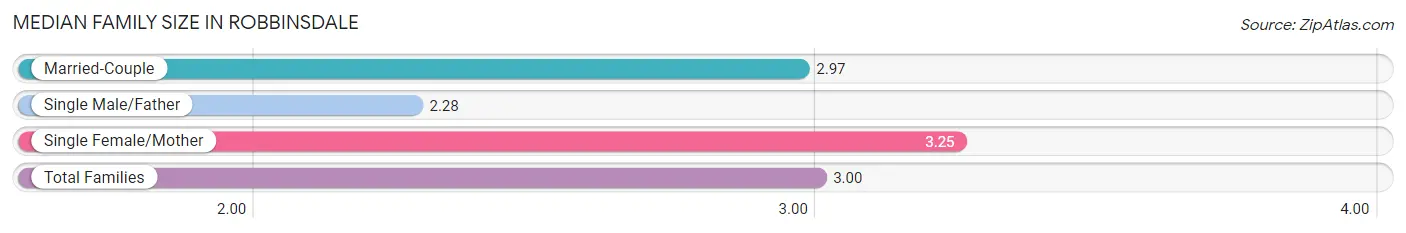
The median family size in Robbinsdale is 3.00 persons per family, with single female/mother families (770 | 24.0%) accounting for the largest median family size of 3.25 persons per family. On the other hand, single male/father families (164 | 5.1%) represent the smallest median family size with 2.28 persons per family.
| Family Type | # Families | Family Size |
| Married-Couple | 2,275 (70.9%) | 2.97 |
| Single Male/Father | 164 (5.1%) | 2.28 |
| Single Female/Mother | 770 (24.0%) | 3.25 |
| Total Families | 3,209 (100.0%) | 3.00 |
Median Household Size in Robbinsdale
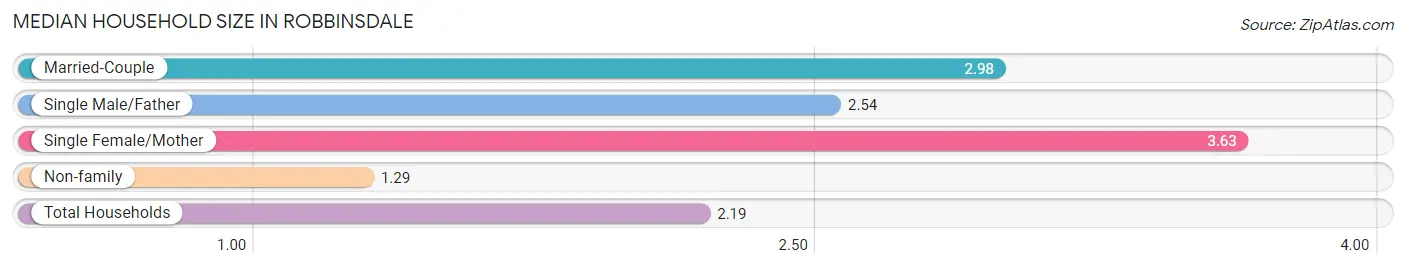
The median household size in Robbinsdale is 2.19 persons per household, with single female/mother households (770 | 11.9%) accounting for the largest median household size of 3.63 persons per household. non-family households (3,271 | 50.5%) represent the smallest median household size with 1.29 persons per household.
| Household Type | # Households | Household Size |
| Married-Couple | 2,275 (35.1%) | 2.98 |
| Single Male/Father | 164 (2.5%) | 2.54 |
| Single Female/Mother | 770 (11.9%) | 3.63 |
| Non-family | 3,271 (50.5%) | 1.29 |
| Total Households | 6,480 (100.0%) | 2.19 |
Household Size by Marriage Status in Robbinsdale
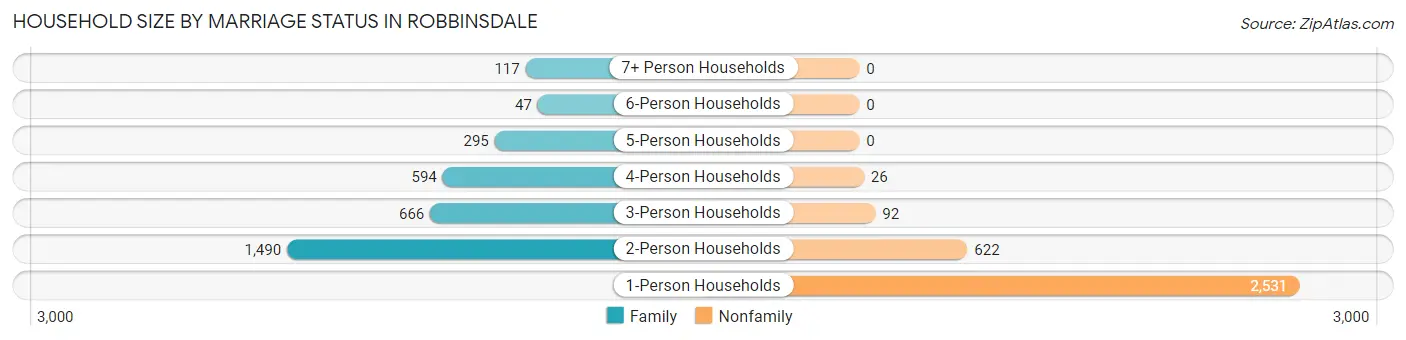
Out of a total of 6,480 households in Robbinsdale, 3,209 (49.5%) are family households, while 3,271 (50.5%) are nonfamily households. The most numerous type of family households are 2-person households, comprising 1,490, and the most common type of nonfamily households are 1-person households, comprising 2,531.
| Household Size | Family Households | Nonfamily Households |
| 1-Person Households | - | 2,531 (39.1%) |
| 2-Person Households | 1,490 (23.0%) | 622 (9.6%) |
| 3-Person Households | 666 (10.3%) | 92 (1.4%) |
| 4-Person Households | 594 (9.2%) | 26 (0.4%) |
| 5-Person Households | 295 (4.5%) | 0 (0.0%) |
| 6-Person Households | 47 (0.7%) | 0 (0.0%) |
| 7+ Person Households | 117 (1.8%) | 0 (0.0%) |
| Total | 3,209 (49.5%) | 3,271 (50.5%) |
Female Fertility in Robbinsdale
Fertility by Age in Robbinsdale
Average fertility rate in Robbinsdale is 53.0 births per 1,000 women. Women in the age bracket of 20 to 34 years have the highest fertility rate with 81.0 births per 1,000 women. Women in the age bracket of 20 to 34 years acount for 80.5% of all women with births.
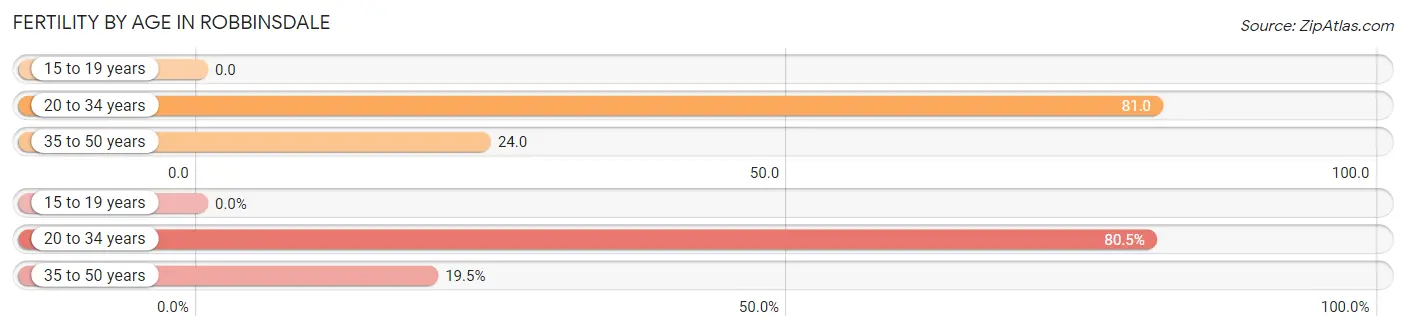
| Age Bracket | Women with Births | Births / 1,000 Women |
| 15 to 19 years | 0 (0.0%) | 0.0 |
| 20 to 34 years | 136 (80.5%) | 81.0 |
| 35 to 50 years | 33 (19.5%) | 24.0 |
| Total | 169 (100.0%) | 53.0 |
Fertility by Age by Marriage Status in Robbinsdale
91.1% of women with births (169) in Robbinsdale are married. The highest percentage of unmarried women with births falls into 20 to 34 years age bracket with 11.0% of them unmarried at the time of birth, while the lowest percentage of unmarried women with births belong to 35 to 50 years age bracket with 0.0% of them unmarried.
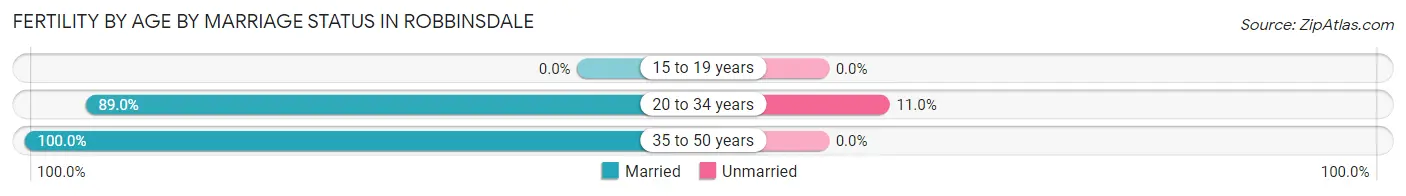
| Age Bracket | Married | Unmarried |
| 15 to 19 years | 0 (0.0%) | 0 (0.0%) |
| 20 to 34 years | 121 (89.0%) | 15 (11.0%) |
| 35 to 50 years | 33 (100.0%) | 0 (0.0%) |
| Total | 154 (91.1%) | 15 (8.9%) |
Fertility by Education in Robbinsdale
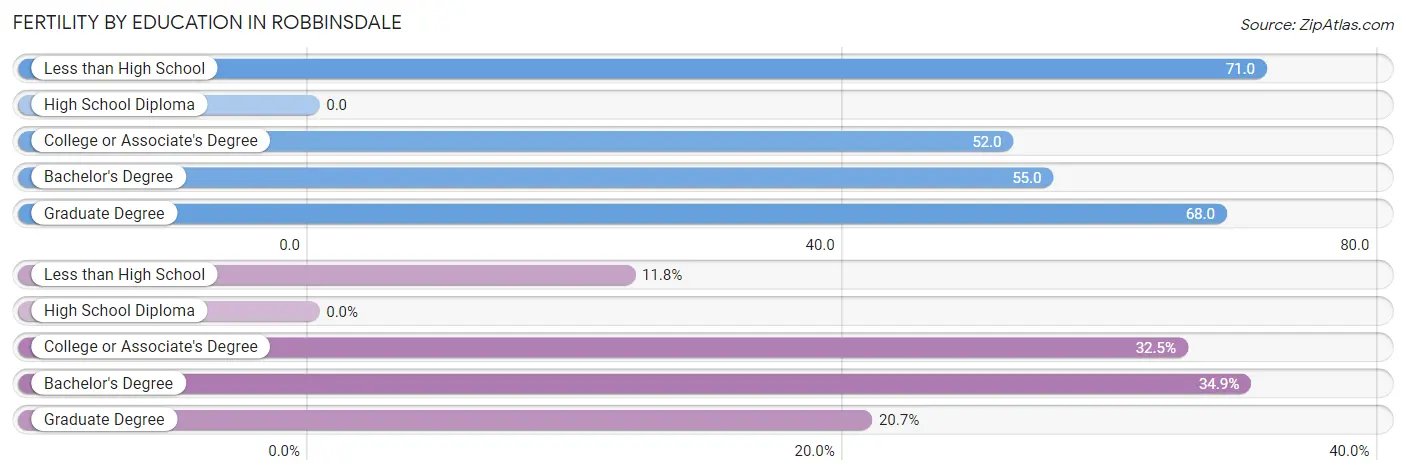
| Educational Attainment | Women with Births | Births / 1,000 Women |
| Less than High School | 20 (11.8%) | 71.0 |
| High School Diploma | 0 (0.0%) | 0.0 |
| College or Associate's Degree | 55 (32.5%) | 52.0 |
| Bachelor's Degree | 59 (34.9%) | 55.0 |
| Graduate Degree | 35 (20.7%) | 68.0 |
| Total | 169 (100.0%) | 53.0 |
Fertility by Education by Marriage Status in Robbinsdale
8.9% of women with births in Robbinsdale are unmarried. Women with the educational attainment of less than high school are most likely to be married with 100.0% of them married at childbirth, while women with the educational attainment of college or associate's degree are least likely to be married with 27.3% of them unmarried at childbirth.
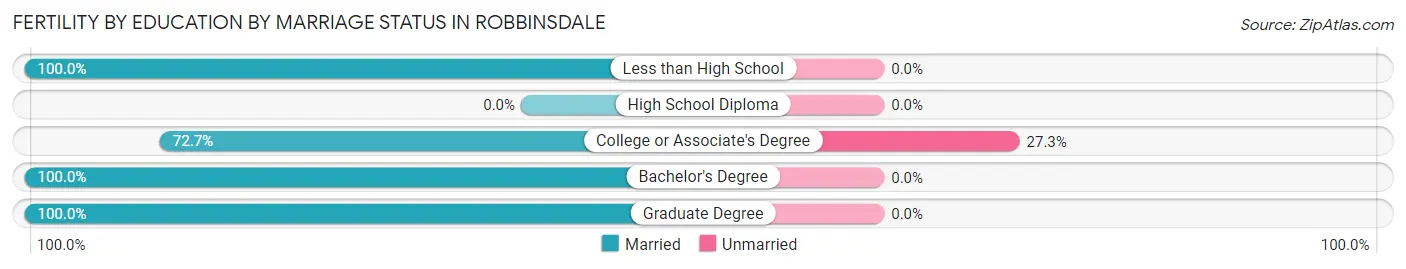
| Educational Attainment | Married | Unmarried |
| Less than High School | 20 (100.0%) | 0 (0.0%) |
| High School Diploma | 0 (0.0%) | 0 (0.0%) |
| College or Associate's Degree | 40 (72.7%) | 15 (27.3%) |
| Bachelor's Degree | 59 (100.0%) | 0 (0.0%) |
| Graduate Degree | 35 (100.0%) | 0 (0.0%) |
| Total | 154 (91.1%) | 15 (8.9%) |
Income in Robbinsdale
Income Overview in Robbinsdale
Per Capita Income in Robbinsdale is $48,508, while median incomes of families and households are $105,878 and $80,125 respectively.
| Characteristic | Number | Measure |
| Per Capita Income | 14,452 | $48,508 |
| Median Family Income | 3,209 | $105,878 |
| Mean Family Income | 3,209 | $134,179 |
| Median Household Income | 6,480 | $80,125 |
| Mean Household Income | 6,480 | $106,583 |
| Income Deficit | 3,209 | $0 |
| Wage / Income Gap (%) | 14,452 | 10.60% |
| Wage / Income Gap ($) | 14,452 | 89.40¢ per $1 |
| Gini / Inequality Index | 14,452 | 0.48 |
Earnings by Sex in Robbinsdale
Average Earnings in Robbinsdale are $52,771, $55,246 for men and $49,391 for women, a difference of 10.6%.
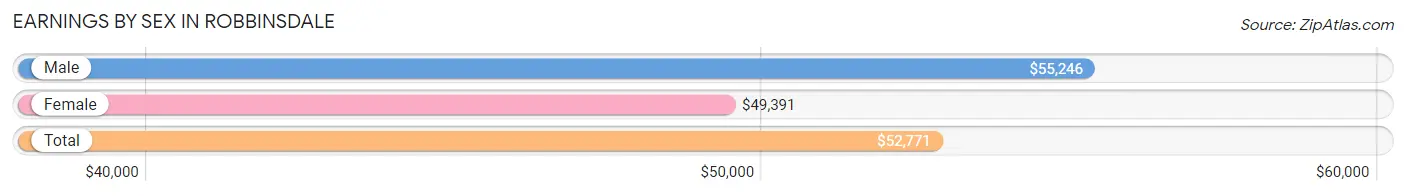
| Sex | Number | Average Earnings |
| Male | 4,346 (50.4%) | $55,246 |
| Female | 4,279 (49.6%) | $49,391 |
| Total | 8,625 (100.0%) | $52,771 |
Earnings by Sex by Income Bracket in Robbinsdale
The most common earnings brackets in Robbinsdale are $75,000 to $99,999 for men (735 | 16.9%) and $100,000+ for women (613 | 14.3%).
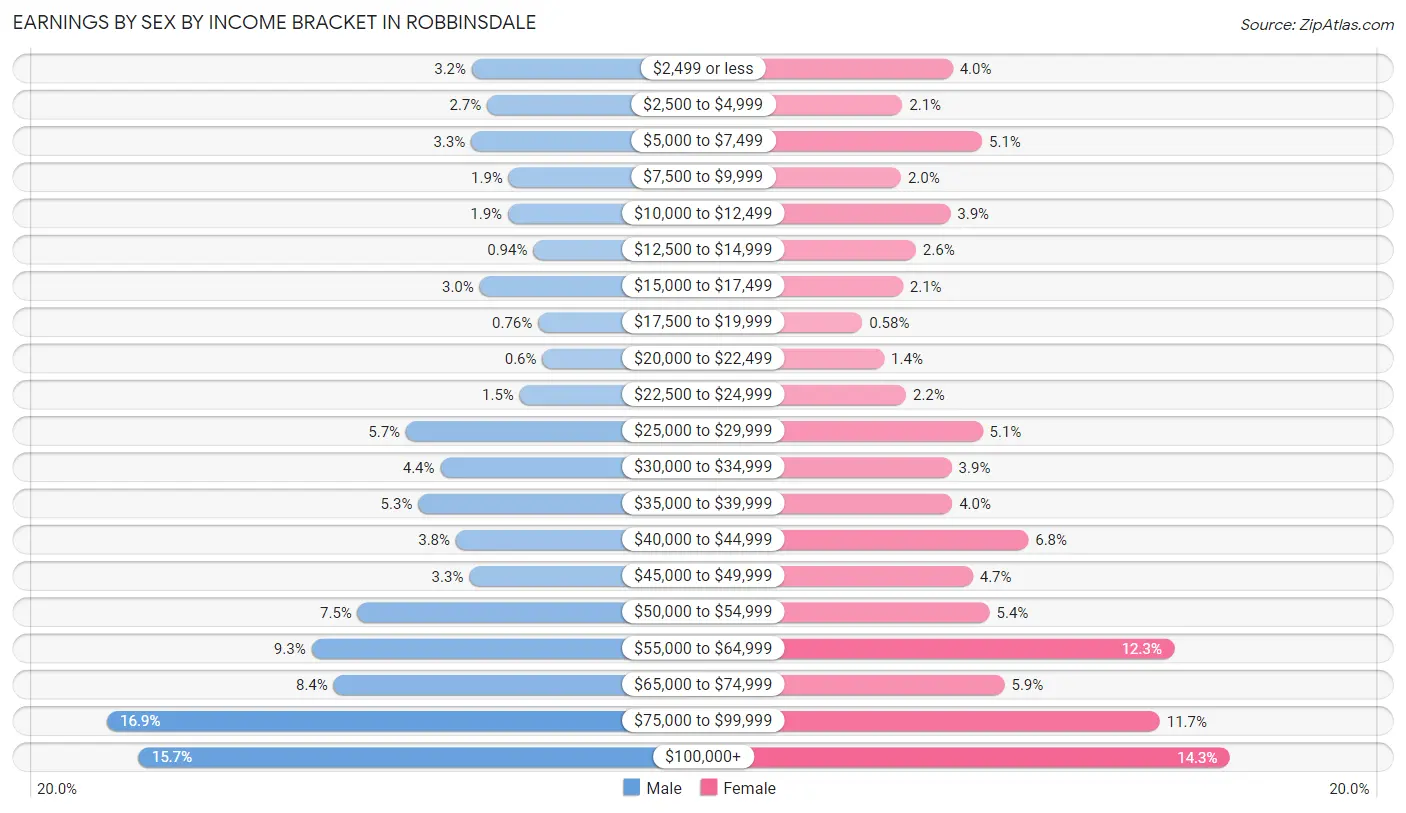
| Income | Male | Female |
| $2,499 or less | 141 (3.2%) | 170 (4.0%) |
| $2,500 to $4,999 | 116 (2.7%) | 89 (2.1%) |
| $5,000 to $7,499 | 142 (3.3%) | 217 (5.1%) |
| $7,500 to $9,999 | 81 (1.9%) | 87 (2.0%) |
| $10,000 to $12,499 | 82 (1.9%) | 166 (3.9%) |
| $12,500 to $14,999 | 41 (0.9%) | 111 (2.6%) |
| $15,000 to $17,499 | 128 (2.9%) | 90 (2.1%) |
| $17,500 to $19,999 | 33 (0.8%) | 25 (0.6%) |
| $20,000 to $22,499 | 26 (0.6%) | 60 (1.4%) |
| $22,500 to $24,999 | 63 (1.5%) | 95 (2.2%) |
| $25,000 to $29,999 | 248 (5.7%) | 218 (5.1%) |
| $30,000 to $34,999 | 192 (4.4%) | 168 (3.9%) |
| $35,000 to $39,999 | 228 (5.2%) | 169 (4.0%) |
| $40,000 to $44,999 | 167 (3.8%) | 291 (6.8%) |
| $45,000 to $49,999 | 145 (3.3%) | 202 (4.7%) |
| $50,000 to $54,999 | 327 (7.5%) | 229 (5.3%) |
| $55,000 to $64,999 | 402 (9.2%) | 524 (12.2%) |
| $65,000 to $74,999 | 366 (8.4%) | 253 (5.9%) |
| $75,000 to $99,999 | 735 (16.9%) | 502 (11.7%) |
| $100,000+ | 683 (15.7%) | 613 (14.3%) |
| Total | 4,346 (100.0%) | 4,279 (100.0%) |
Earnings by Sex by Educational Attainment in Robbinsdale
Average earnings in Robbinsdale are $57,588 for men and $52,753 for women, a difference of 8.4%. Men with an educational attainment of graduate degree enjoy the highest average annual earnings of $94,702, while those with less than high school education earn the least with $31,793. Women with an educational attainment of graduate degree earn the most with the average annual earnings of $90,103, while those with less than high school education have the smallest earnings of $20,625.
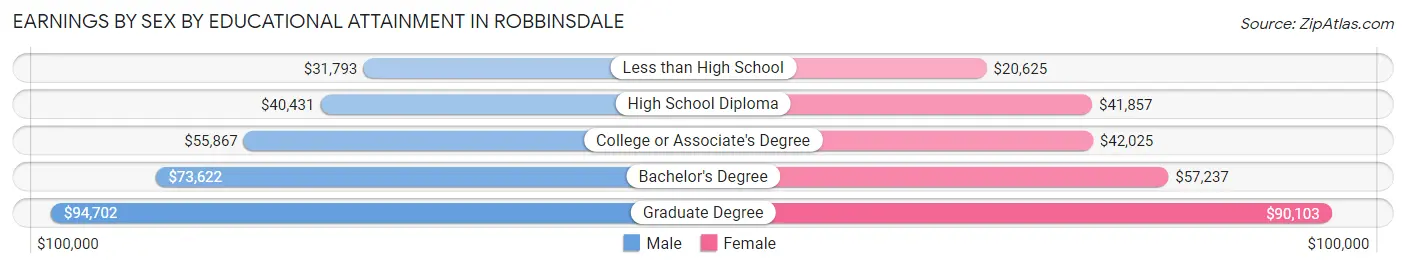
| Educational Attainment | Male Income | Female Income |
| Less than High School | $31,793 | $20,625 |
| High School Diploma | $40,431 | $41,857 |
| College or Associate's Degree | $55,867 | $42,025 |
| Bachelor's Degree | $73,622 | $57,237 |
| Graduate Degree | $94,702 | $90,103 |
| Total | $57,588 | $52,753 |
Family Income in Robbinsdale
Family Income Brackets in Robbinsdale
According to the Robbinsdale family income data, there are 924 families falling into the $100,000 to $149,999 income range, which is the most common income bracket and makes up 28.8% of all families. Conversely, the $10,000 to $14,999 income bracket is the least frequent group with only 26 families (0.8%) belonging to this category.
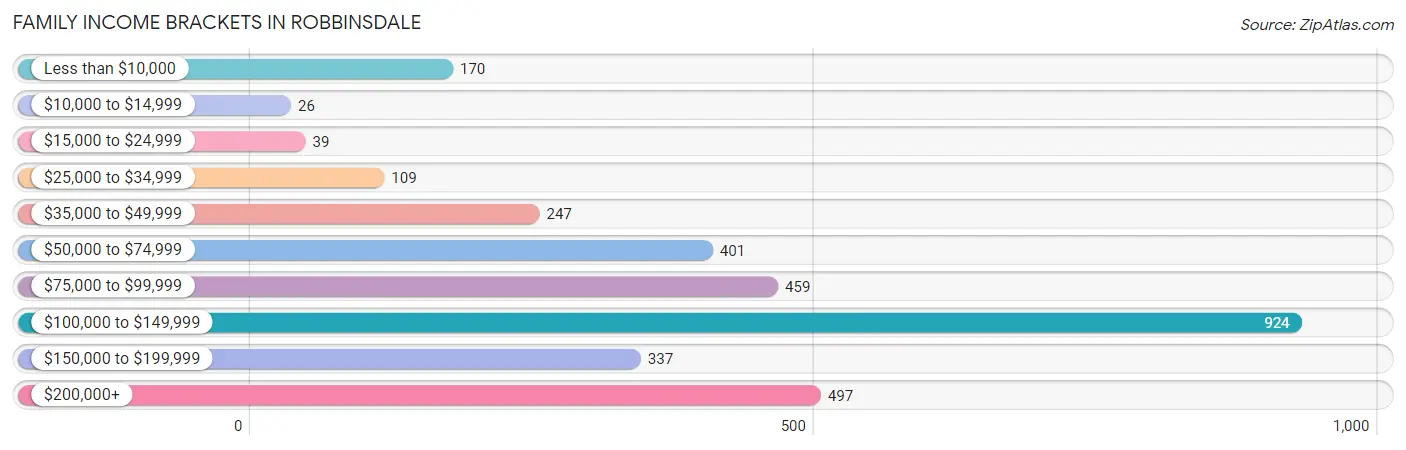
| Income Bracket | # Families | % Families |
| Less than $10,000 | 170 | 5.3% |
| $10,000 to $14,999 | 26 | 0.8% |
| $15,000 to $24,999 | 39 | 1.2% |
| $25,000 to $34,999 | 109 | 3.4% |
| $35,000 to $49,999 | 247 | 7.7% |
| $50,000 to $74,999 | 401 | 12.5% |
| $75,000 to $99,999 | 459 | 14.3% |
| $100,000 to $149,999 | 924 | 28.8% |
| $150,000 to $199,999 | 337 | 10.5% |
| $200,000+ | 497 | 15.5% |
Family Income by Famaliy Size in Robbinsdale
4-person families (634 | 19.8%) account for the highest median family income in Robbinsdale with $123,125 per family, while 2-person families (1,573 | 49.0%) have the highest median income of $51,498 per family member.
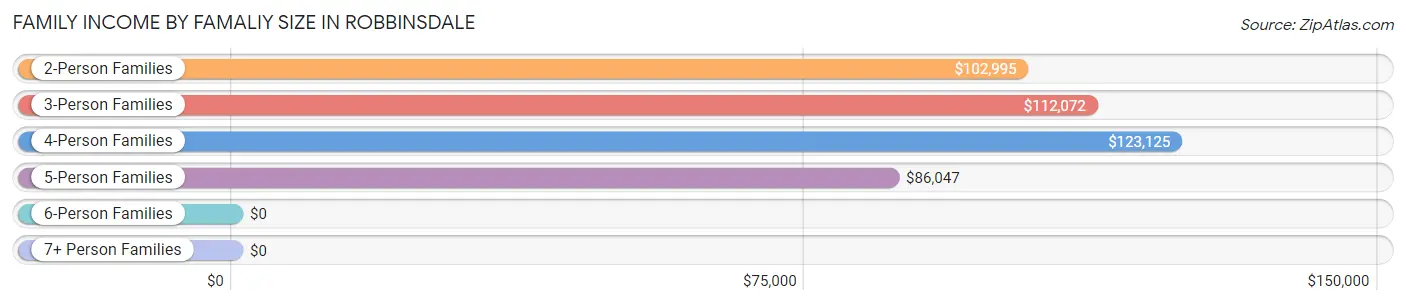
| Income Bracket | # Families | Median Income |
| 2-Person Families | 1,573 (49.0%) | $102,995 |
| 3-Person Families | 665 (20.7%) | $112,072 |
| 4-Person Families | 634 (19.8%) | $123,125 |
| 5-Person Families | 177 (5.5%) | $86,047 |
| 6-Person Families | 67 (2.1%) | $0 |
| 7+ Person Families | 93 (2.9%) | $0 |
| Total | 3,209 (100.0%) | $105,878 |
Family Income by Number of Earners in Robbinsdale
The median family income in Robbinsdale is $105,878, with families comprising 3+ earners (381) having the highest median family income of $151,339, while families with no earners (189) have the lowest median family income of $38,550, accounting for 11.9% and 5.9% of families, respectively.
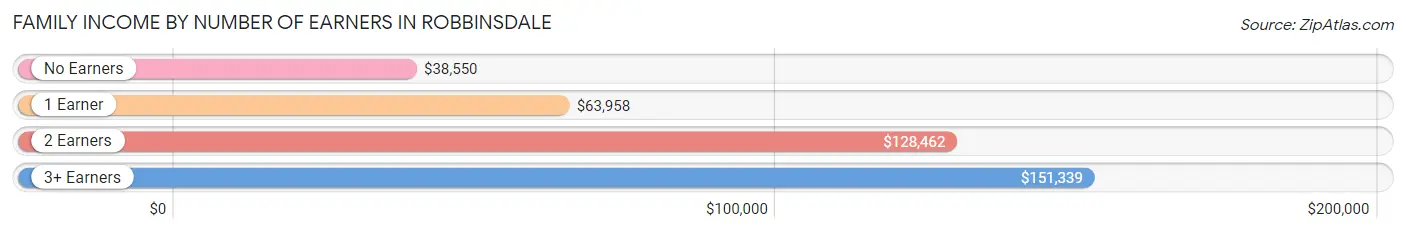
| Number of Earners | # Families | Median Income |
| No Earners | 189 (5.9%) | $38,550 |
| 1 Earner | 1,019 (31.8%) | $63,958 |
| 2 Earners | 1,620 (50.5%) | $128,462 |
| 3+ Earners | 381 (11.9%) | $151,339 |
| Total | 3,209 (100.0%) | $105,878 |
Household Income in Robbinsdale
Household Income Brackets in Robbinsdale
With 1,328 households falling in the category, the $100,000 to $149,999 income range is the most frequent in Robbinsdale, accounting for 20.5% of all households. In contrast, only 220 households (3.4%) fall into the $25,000 to $34,999 income bracket, making it the least populous group.
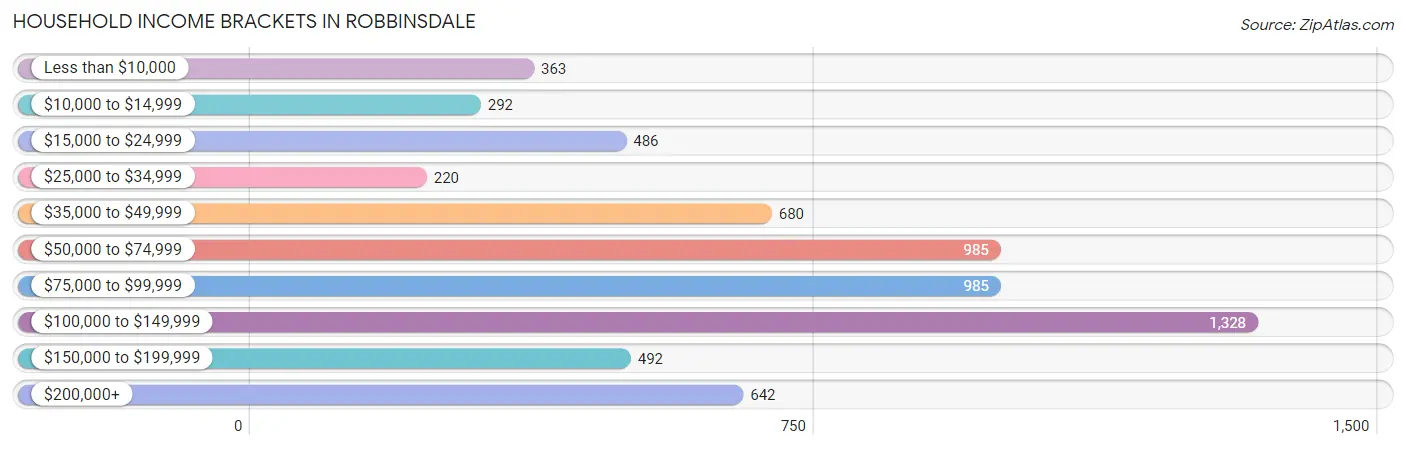
| Income Bracket | # Households | % Households |
| Less than $10,000 | 363 | 5.6% |
| $10,000 to $14,999 | 292 | 4.5% |
| $15,000 to $24,999 | 486 | 7.5% |
| $25,000 to $34,999 | 220 | 3.4% |
| $35,000 to $49,999 | 680 | 10.5% |
| $50,000 to $74,999 | 985 | 15.2% |
| $75,000 to $99,999 | 985 | 15.2% |
| $100,000 to $149,999 | 1,328 | 20.5% |
| $150,000 to $199,999 | 492 | 7.6% |
| $200,000+ | 642 | 9.9% |
Household Income by Householder Age in Robbinsdale
The median household income in Robbinsdale is $80,125, with the highest median household income of $97,402 found in the 25 to 44 years age bracket for the primary householder. A total of 2,470 households (38.1%) fall into this category. Meanwhile, the 65+ years age bracket for the primary householder has the lowest median household income of $42,975, with 1,955 households (30.2%) in this group.
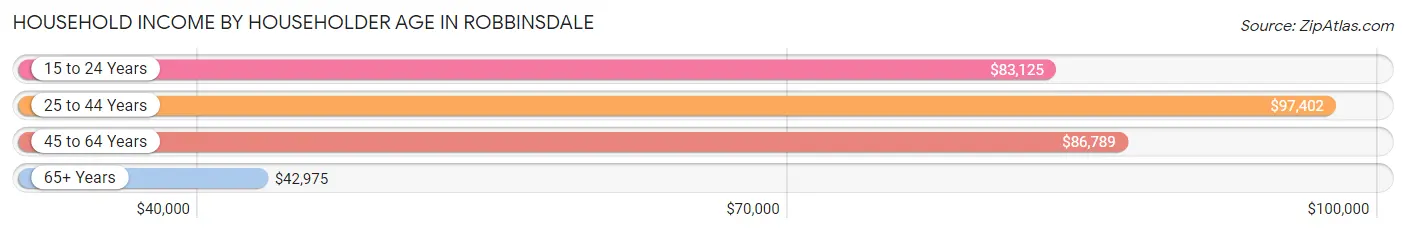
| Income Bracket | # Households | Median Income |
| 15 to 24 Years | 70 (1.1%) | $83,125 |
| 25 to 44 Years | 2,470 (38.1%) | $97,402 |
| 45 to 64 Years | 1,985 (30.6%) | $86,789 |
| 65+ Years | 1,955 (30.2%) | $42,975 |
| Total | 6,480 (100.0%) | $80,125 |
Poverty in Robbinsdale
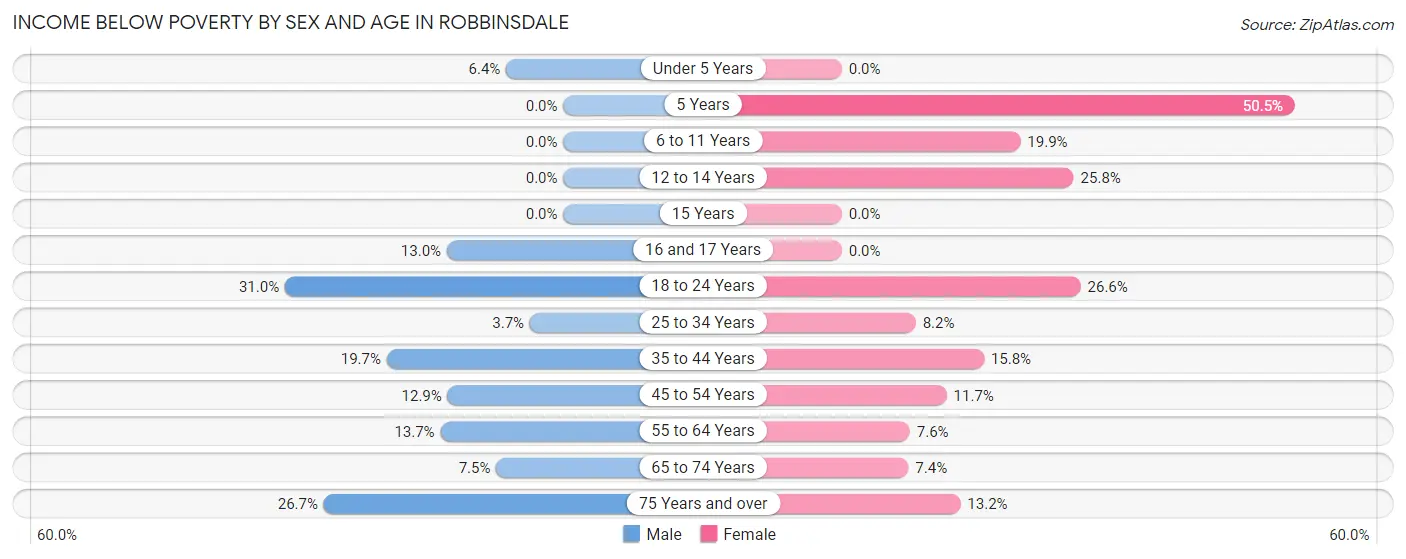
Income Below Poverty by Sex and Age in Robbinsdale
With 11.9% poverty level for males and 12.7% for females among the residents of Robbinsdale, 18 to 24 year old males and 5 year old females are the most vulnerable to poverty, with 115 males (31.0%) and 110 females (50.5%) in their respective age groups living below the poverty level.
| Age Bracket | Male | Female |
| Under 5 Years | 31 (6.4%) | 0 (0.0%) |
| 5 Years | 0 (0.0%) | 110 (50.5%) |
| 6 to 11 Years | 0 (0.0%) | 74 (19.9%) |
| 12 to 14 Years | 0 (0.0%) | 110 (25.8%) |
| 15 Years | 0 (0.0%) | 0 (0.0%) |
| 16 and 17 Years | 24 (13.0%) | 0 (0.0%) |
| 18 to 24 Years | 115 (31.0%) | 79 (26.6%) |
| 25 to 34 Years | 46 (3.7%) | 116 (8.2%) |
| 35 to 44 Years | 246 (19.7%) | 132 (15.8%) |
| 45 to 54 Years | 99 (12.9%) | 107 (11.7%) |
| 55 to 64 Years | 98 (13.7%) | 62 (7.6%) |
| 65 to 74 Years | 52 (7.5%) | 57 (7.4%) |
| 75 Years and over | 115 (26.7%) | 81 (13.2%) |
| Total | 826 (11.9%) | 928 (12.7%) |
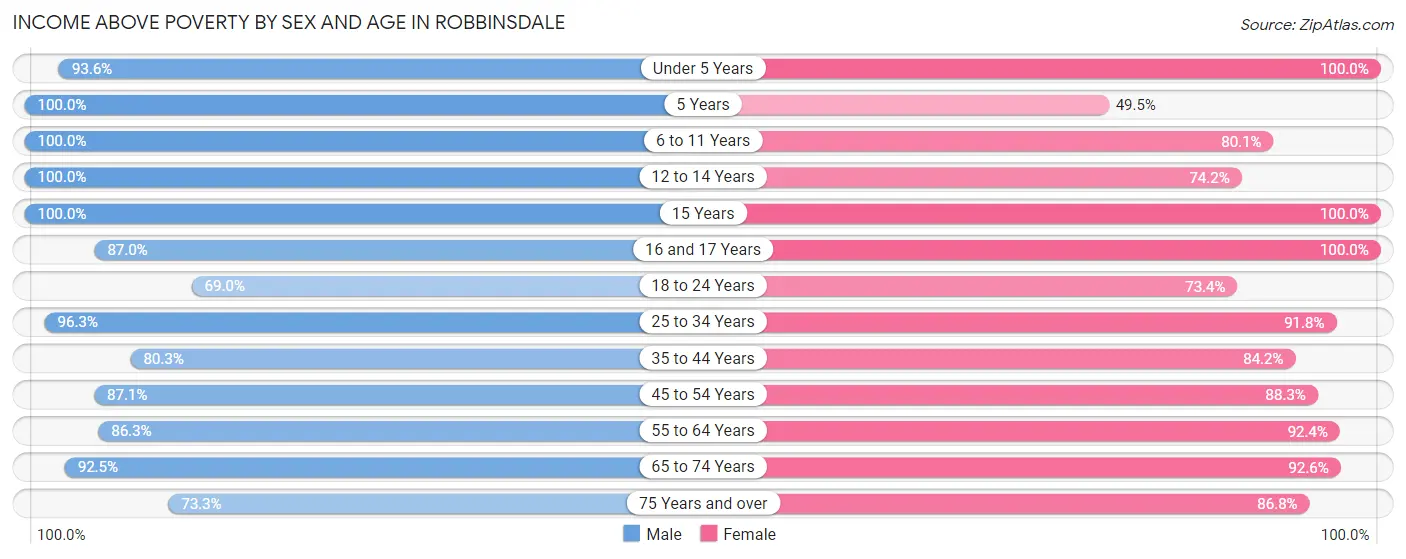
Income Above Poverty by Sex and Age in Robbinsdale
According to the poverty statistics in Robbinsdale, males aged 5 years and females aged under 5 years are the age groups that are most secure financially, with 100.0% of males and 100.0% of females in these age groups living above the poverty line.
| Age Bracket | Male | Female |
| Under 5 Years | 456 (93.6%) | 557 (100.0%) |
| 5 Years | 143 (100.0%) | 108 (49.5%) |
| 6 to 11 Years | 448 (100.0%) | 298 (80.1%) |
| 12 to 14 Years | 163 (100.0%) | 316 (74.2%) |
| 15 Years | 58 (100.0%) | 17 (100.0%) |
| 16 and 17 Years | 161 (87.0%) | 75 (100.0%) |
| 18 to 24 Years | 256 (69.0%) | 218 (73.4%) |
| 25 to 34 Years | 1,191 (96.3%) | 1,294 (91.8%) |
| 35 to 44 Years | 1,005 (80.3%) | 702 (84.2%) |
| 45 to 54 Years | 669 (87.1%) | 809 (88.3%) |
| 55 to 64 Years | 618 (86.3%) | 756 (92.4%) |
| 65 to 74 Years | 644 (92.5%) | 711 (92.6%) |
| 75 Years and over | 316 (73.3%) | 532 (86.8%) |
| Total | 6,128 (88.1%) | 6,393 (87.3%) |
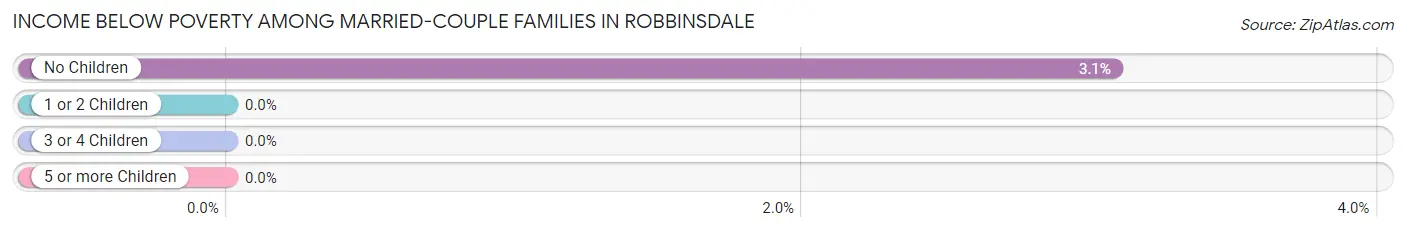
Income Below Poverty Among Married-Couple Families in Robbinsdale
The poverty statistics for married-couple families in Robbinsdale show that 1.8% or 41 of the total 2,275 families live below the poverty line. Families with no children have the highest poverty rate of 3.1%, comprising of 41 families. On the other hand, families with 1 or 2 children have the lowest poverty rate of 0.0%, which includes 0 families.
| Children | Above Poverty | Below Poverty |
| No Children | 1,290 (96.9%) | 41 (3.1%) |
| 1 or 2 Children | 774 (100.0%) | 0 (0.0%) |
| 3 or 4 Children | 99 (100.0%) | 0 (0.0%) |
| 5 or more Children | 71 (100.0%) | 0 (0.0%) |
| Total | 2,234 (98.2%) | 41 (1.8%) |
Income Below Poverty Among Single-Parent Households in Robbinsdale
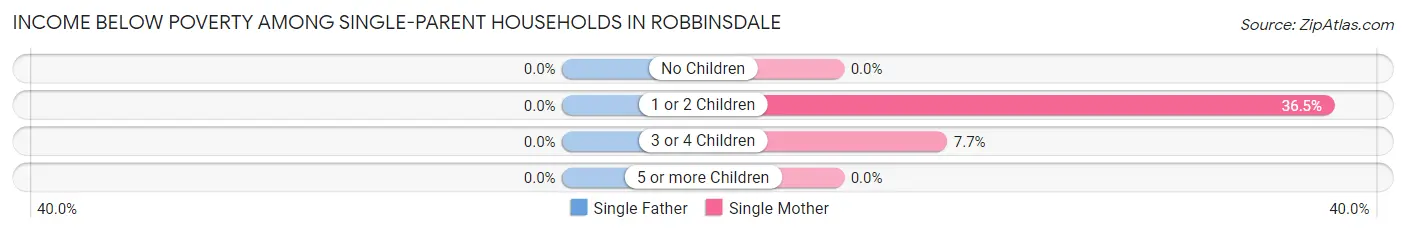
| Children | Single Father | Single Mother |
| No Children | 0 (0.0%) | 0 (0.0%) |
| 1 or 2 Children | 0 (0.0%) | 168 (36.5%) |
| 3 or 4 Children | 0 (0.0%) | 14 (7.7%) |
| 5 or more Children | 0 (0.0%) | 0 (0.0%) |
| Total | 0 (0.0%) | 182 (23.6%) |
Income Below Poverty Among Married-Couple vs Single-Parent Households in Robbinsdale
The poverty data for Robbinsdale shows that 41 of the married-couple family households (1.8%) and 182 of the single-parent households (19.5%) are living below the poverty level. Within the married-couple family households, those with no children have the highest poverty rate, with 41 households (3.1%) falling below the poverty line. Among the single-parent households, those with 1 or 2 children have the highest poverty rate, with 168 household (28.9%) living below poverty.
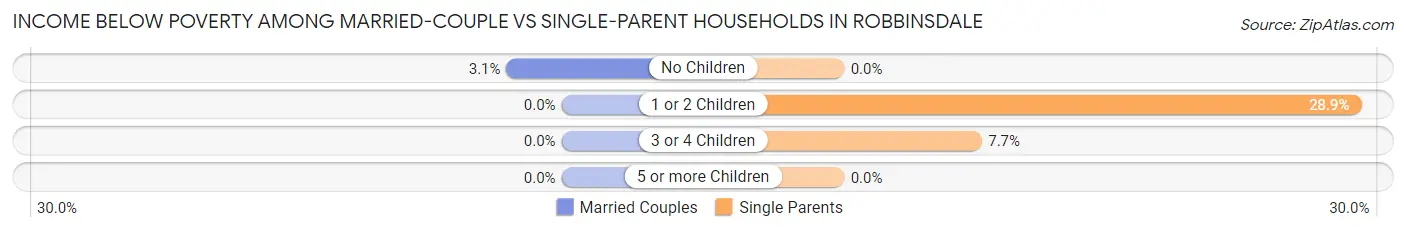
| Children | Married-Couple Families | Single-Parent Households |
| No Children | 41 (3.1%) | 0 (0.0%) |
| 1 or 2 Children | 0 (0.0%) | 168 (28.9%) |
| 3 or 4 Children | 0 (0.0%) | 14 (7.7%) |
| 5 or more Children | 0 (0.0%) | 0 (0.0%) |
| Total | 41 (1.8%) | 182 (19.5%) |
Employment Characteristics in Robbinsdale
Employment by Class of Employer in Robbinsdale
Among the 7,924 employed individuals in Robbinsdale, private company employees (5,361 | 67.7%), not-for-profit organizations (899 | 11.4%), and local government employees (606 | 7.6%) make up the most common classes of employment.
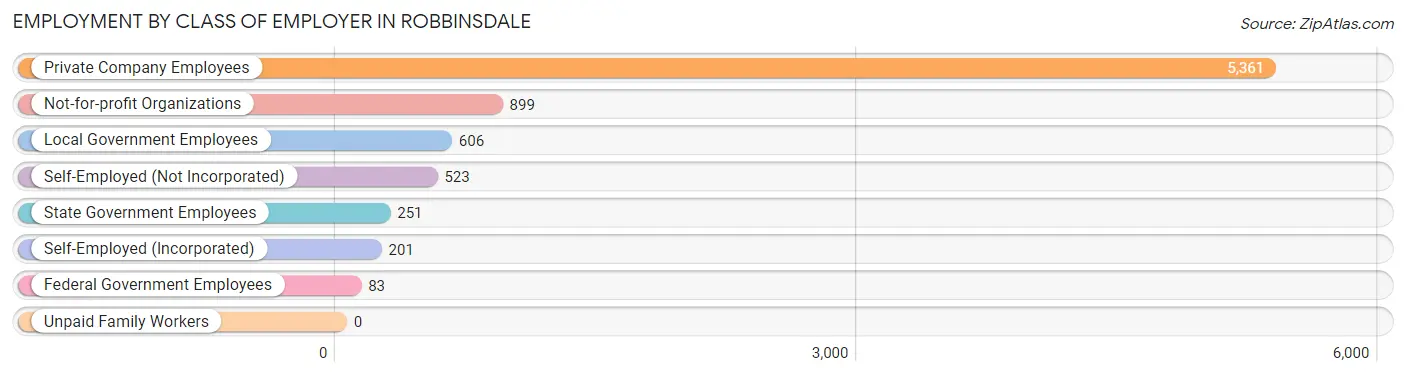
| Employer Class | # Employees | % Employees |
| Private Company Employees | 5,361 | 67.7% |
| Self-Employed (Incorporated) | 201 | 2.5% |
| Self-Employed (Not Incorporated) | 523 | 6.6% |
| Not-for-profit Organizations | 899 | 11.4% |
| Local Government Employees | 606 | 7.6% |
| State Government Employees | 251 | 3.2% |
| Federal Government Employees | 83 | 1.1% |
| Unpaid Family Workers | 0 | 0.0% |
| Total | 7,924 | 100.0% |
Employment Status by Age in Robbinsdale
According to the labor force statistics for Robbinsdale, out of the total population over 16 years of age (11,543), 73.5% or 8,484 individuals are in the labor force, with 5.8% or 492 of them unemployed. The age group with the highest labor force participation rate is 45 to 54 years, with 92.8% or 1,592 individuals in the labor force. Within the labor force, the 20 to 24 years age range has the highest percentage of unemployed individuals, with 24.9% or 125 of them being unemployed.
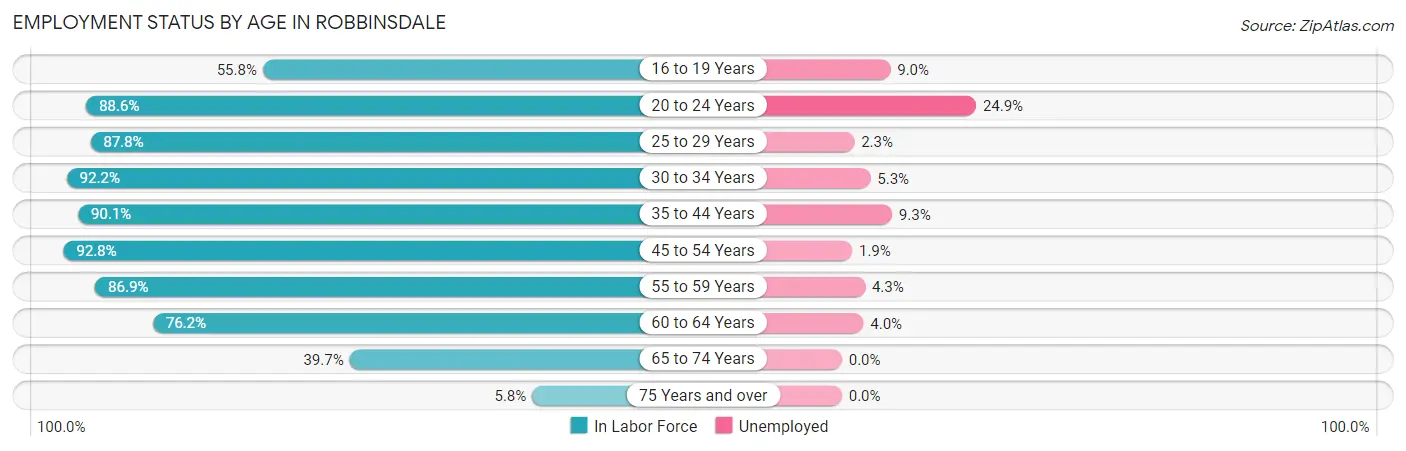
| Age Bracket | In Labor Force | Unemployed |
| 16 to 19 Years | 201 (55.8%) | 18 (9.0%) |
| 20 to 24 Years | 503 (88.6%) | 125 (24.9%) |
| 25 to 29 Years | 1,026 (87.8%) | 24 (2.3%) |
| 30 to 34 Years | 1,365 (92.2%) | 72 (5.3%) |
| 35 to 44 Years | 1,879 (90.1%) | 175 (9.3%) |
| 45 to 54 Years | 1,592 (92.8%) | 30 (1.9%) |
| 55 to 59 Years | 555 (86.9%) | 24 (4.3%) |
| 60 to 64 Years | 705 (76.2%) | 28 (4.0%) |
| 65 to 74 Years | 601 (39.7%) | 0 (0.0%) |
| 75 Years and over | 63 (5.8%) | 0 (0.0%) |
| Total | 8,484 (73.5%) | 492 (5.8%) |
Employment Status by Educational Attainment in Robbinsdale
According to labor force statistics for Robbinsdale, 88.9% of individuals (7,124) out of the total population between 25 and 64 years of age (8,014) are in the labor force, with 4.9% or 349 of them being unemployed. The group with the highest labor force participation rate are those with the educational attainment of bachelor's degree or higher, with 95.0% or 3,339 individuals in the labor force. Within the labor force, individuals with college / associate degree education have the highest percentage of unemployment, with 7.3% or 183 of them being unemployed.
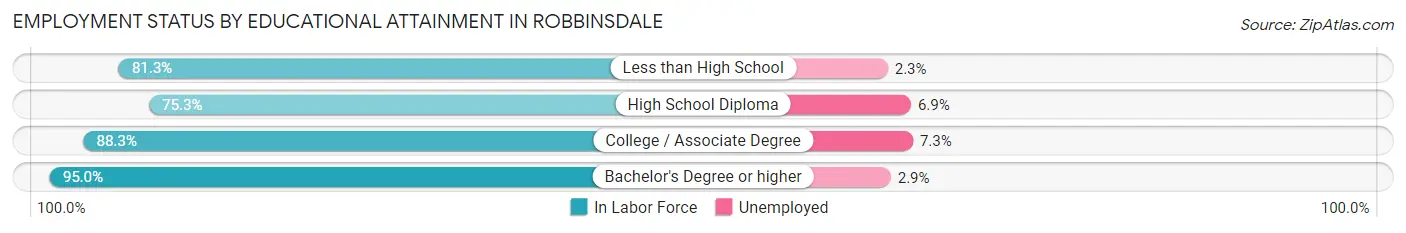
| Educational Attainment | In Labor Force | Unemployed |
| Less than High School | 352 (81.3%) | 10 (2.3%) |
| High School Diploma | 919 (75.3%) | 84 (6.9%) |
| College / Associate Degree | 2,512 (88.3%) | 208 (7.3%) |
| Bachelor's Degree or higher | 3,339 (95.0%) | 102 (2.9%) |
| Total | 7,124 (88.9%) | 393 (4.9%) |
Employment Occupations by Sex in Robbinsdale
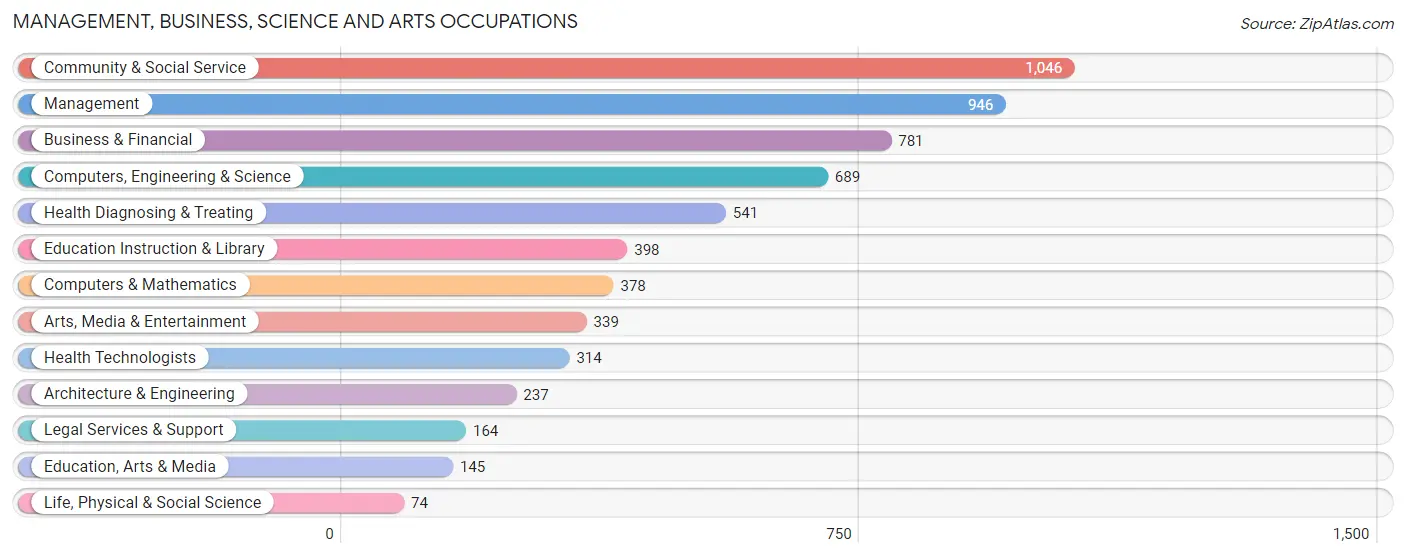
Management, Business, Science and Arts Occupations
The most common Management, Business, Science and Arts occupations in Robbinsdale are Community & Social Service (1,046 | 13.1%), Management (946 | 11.8%), Business & Financial (781 | 9.8%), Computers, Engineering & Science (689 | 8.6%), and Health Diagnosing & Treating (541 | 6.8%).
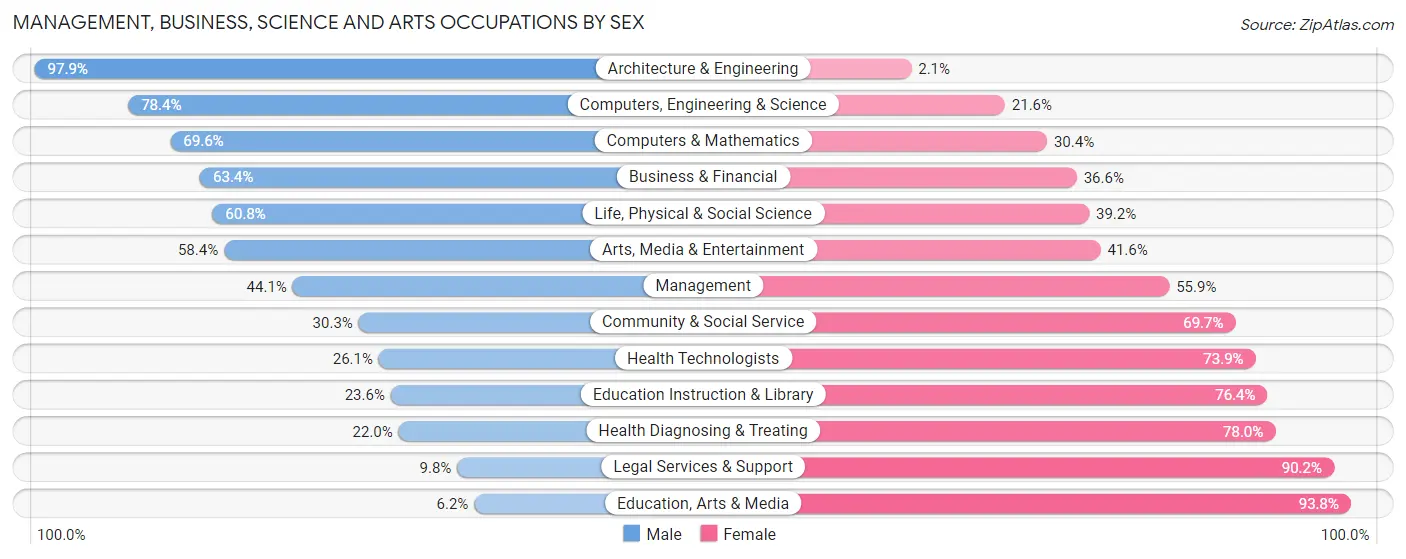
Management, Business, Science and Arts Occupations by Sex
Within the Management, Business, Science and Arts occupations in Robbinsdale, the most male-oriented occupations are Architecture & Engineering (97.9%), Computers, Engineering & Science (78.4%), and Computers & Mathematics (69.6%), while the most female-oriented occupations are Education, Arts & Media (93.8%), Legal Services & Support (90.2%), and Health Diagnosing & Treating (78.0%).
| Occupation | Male | Female |
| Management | 417 (44.1%) | 529 (55.9%) |
| Business & Financial | 495 (63.4%) | 286 (36.6%) |
| Computers, Engineering & Science | 540 (78.4%) | 149 (21.6%) |
| Computers & Mathematics | 263 (69.6%) | 115 (30.4%) |
| Architecture & Engineering | 232 (97.9%) | 5 (2.1%) |
| Life, Physical & Social Science | 45 (60.8%) | 29 (39.2%) |
| Community & Social Service | 317 (30.3%) | 729 (69.7%) |
| Education, Arts & Media | 9 (6.2%) | 136 (93.8%) |
| Legal Services & Support | 16 (9.8%) | 148 (90.2%) |
| Education Instruction & Library | 94 (23.6%) | 304 (76.4%) |
| Arts, Media & Entertainment | 198 (58.4%) | 141 (41.6%) |
| Health Diagnosing & Treating | 119 (22.0%) | 422 (78.0%) |
| Health Technologists | 82 (26.1%) | 232 (73.9%) |
| Total (Category) | 1,888 (47.2%) | 2,115 (52.8%) |
| Total (Overall) | 4,110 (51.5%) | 3,873 (48.5%) |
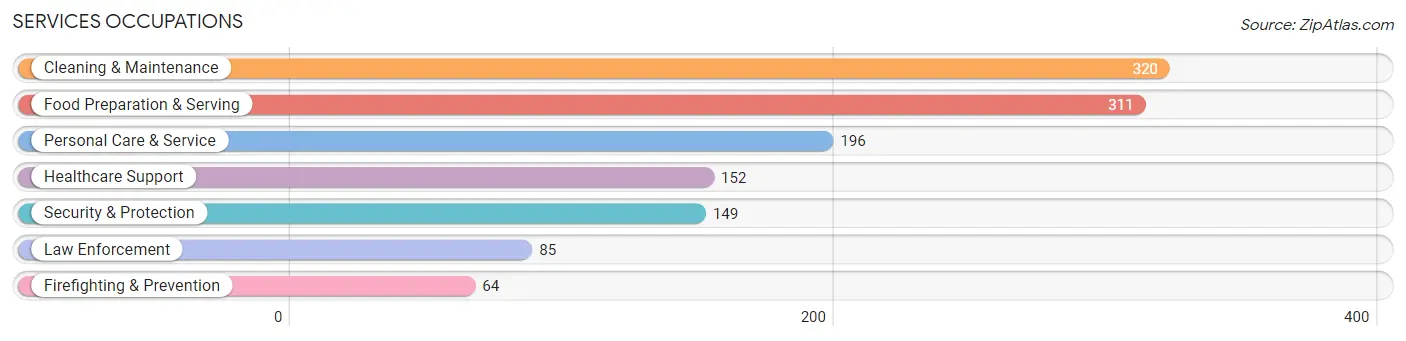
Services Occupations
The most common Services occupations in Robbinsdale are Cleaning & Maintenance (320 | 4.0%), Food Preparation & Serving (311 | 3.9%), Personal Care & Service (196 | 2.5%), Healthcare Support (152 | 1.9%), and Security & Protection (149 | 1.9%).
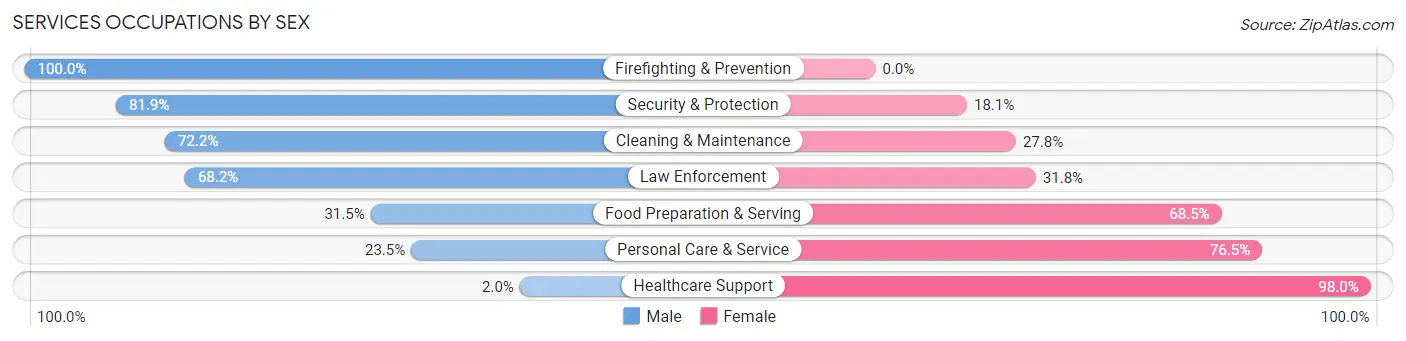
Services Occupations by Sex
Within the Services occupations in Robbinsdale, the most male-oriented occupations are Firefighting & Prevention (100.0%), Security & Protection (81.9%), and Cleaning & Maintenance (72.2%), while the most female-oriented occupations are Healthcare Support (98.0%), Personal Care & Service (76.5%), and Food Preparation & Serving (68.5%).
| Occupation | Male | Female |
| Healthcare Support | 3 (2.0%) | 149 (98.0%) |
| Security & Protection | 122 (81.9%) | 27 (18.1%) |
| Firefighting & Prevention | 64 (100.0%) | 0 (0.0%) |
| Law Enforcement | 58 (68.2%) | 27 (31.8%) |
| Food Preparation & Serving | 98 (31.5%) | 213 (68.5%) |
| Cleaning & Maintenance | 231 (72.2%) | 89 (27.8%) |
| Personal Care & Service | 46 (23.5%) | 150 (76.5%) |
| Total (Category) | 500 (44.3%) | 628 (55.7%) |
| Total (Overall) | 4,110 (51.5%) | 3,873 (48.5%) |
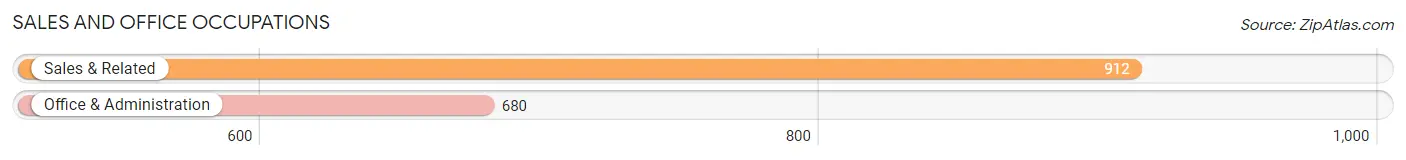
Sales and Office Occupations
The most common Sales and Office occupations in Robbinsdale are Sales & Related (912 | 11.4%), and Office & Administration (680 | 8.5%).
Sales and Office Occupations by Sex
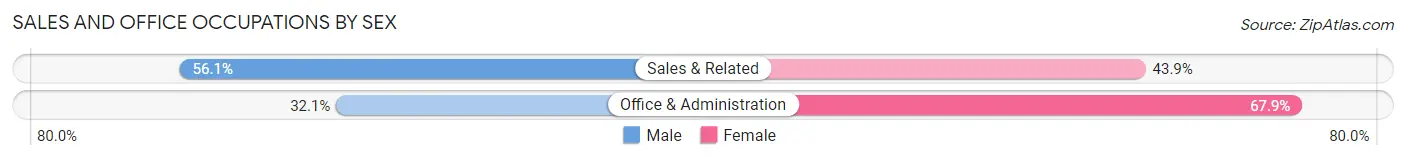
| Occupation | Male | Female |
| Sales & Related | 512 (56.1%) | 400 (43.9%) |
| Office & Administration | 218 (32.1%) | 462 (67.9%) |
| Total (Category) | 730 (45.9%) | 862 (54.1%) |
| Total (Overall) | 4,110 (51.5%) | 3,873 (48.5%) |
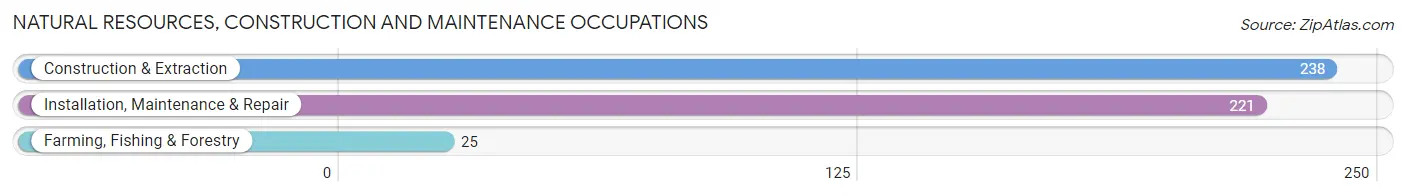
Natural Resources, Construction and Maintenance Occupations
The most common Natural Resources, Construction and Maintenance occupations in Robbinsdale are Construction & Extraction (238 | 3.0%), Installation, Maintenance & Repair (221 | 2.8%), and Farming, Fishing & Forestry (25 | 0.3%).
Natural Resources, Construction and Maintenance Occupations by Sex
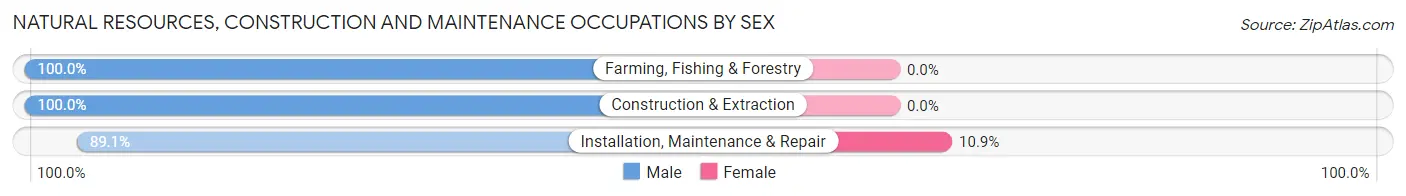
| Occupation | Male | Female |
| Farming, Fishing & Forestry | 25 (100.0%) | 0 (0.0%) |
| Construction & Extraction | 238 (100.0%) | 0 (0.0%) |
| Installation, Maintenance & Repair | 197 (89.1%) | 24 (10.9%) |
| Total (Category) | 460 (95.0%) | 24 (5.0%) |
| Total (Overall) | 4,110 (51.5%) | 3,873 (48.5%) |
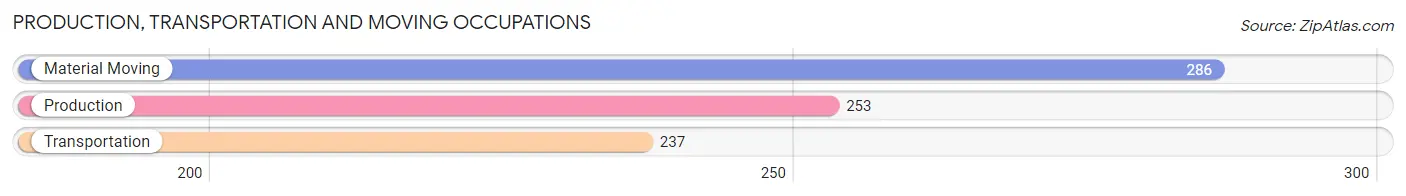
Production, Transportation and Moving Occupations
The most common Production, Transportation and Moving occupations in Robbinsdale are Material Moving (286 | 3.6%), Production (253 | 3.2%), and Transportation (237 | 3.0%).
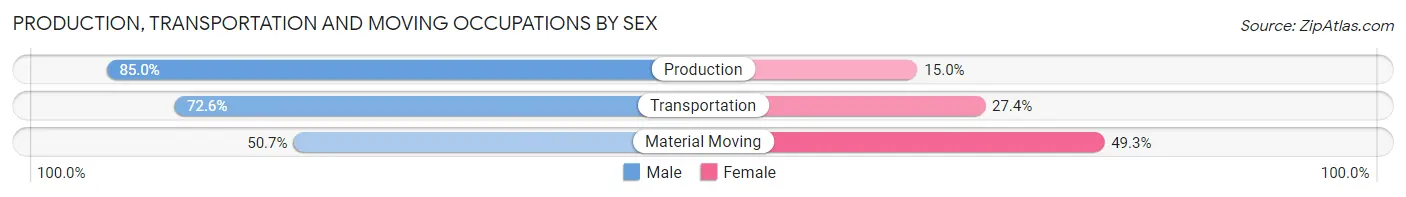
Production, Transportation and Moving Occupations by Sex
| Occupation | Male | Female |
| Production | 215 (85.0%) | 38 (15.0%) |
| Transportation | 172 (72.6%) | 65 (27.4%) |
| Material Moving | 145 (50.7%) | 141 (49.3%) |
| Total (Category) | 532 (68.6%) | 244 (31.4%) |
| Total (Overall) | 4,110 (51.5%) | 3,873 (48.5%) |
Employment Industries by Sex in Robbinsdale
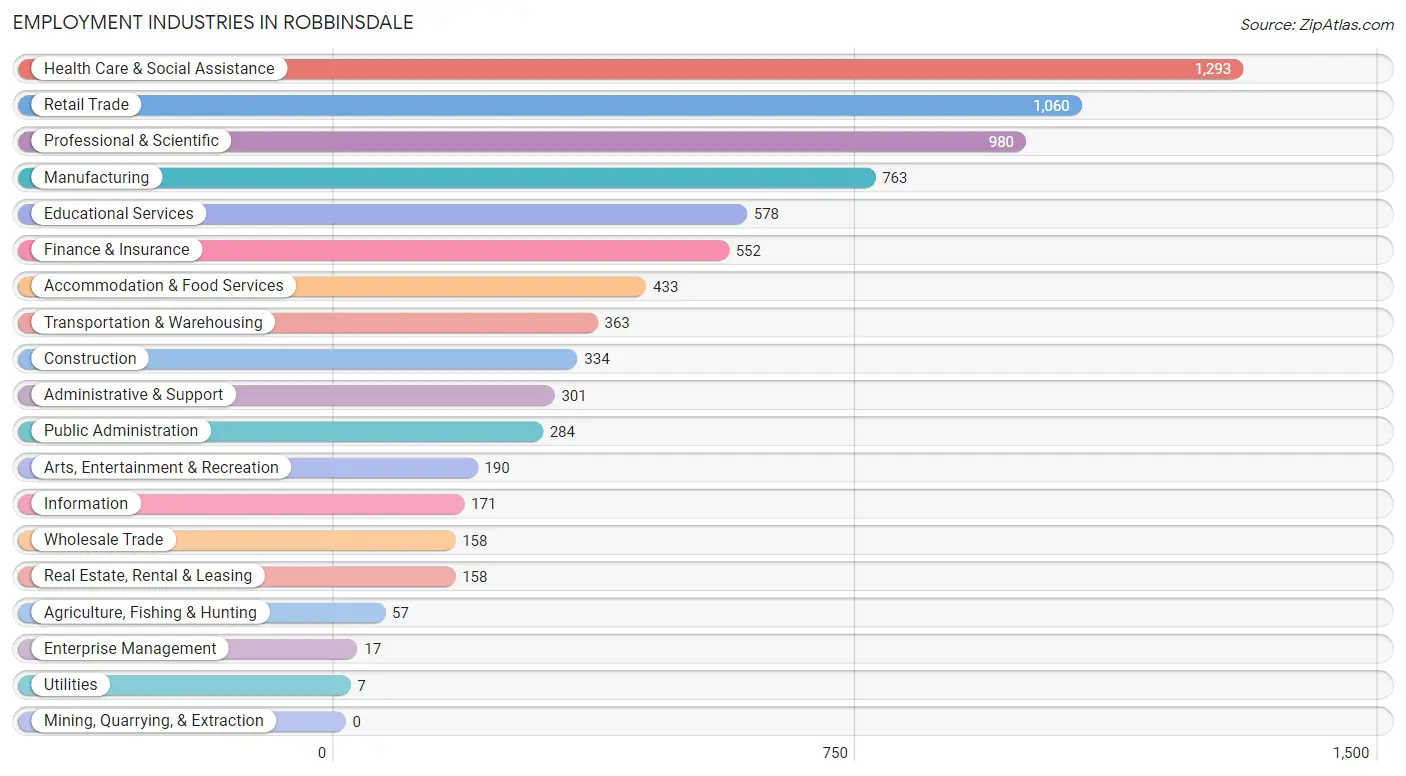
Employment Industries in Robbinsdale
The major employment industries in Robbinsdale include Health Care & Social Assistance (1,293 | 16.2%), Retail Trade (1,060 | 13.3%), Professional & Scientific (980 | 12.3%), Manufacturing (763 | 9.6%), and Educational Services (578 | 7.2%).
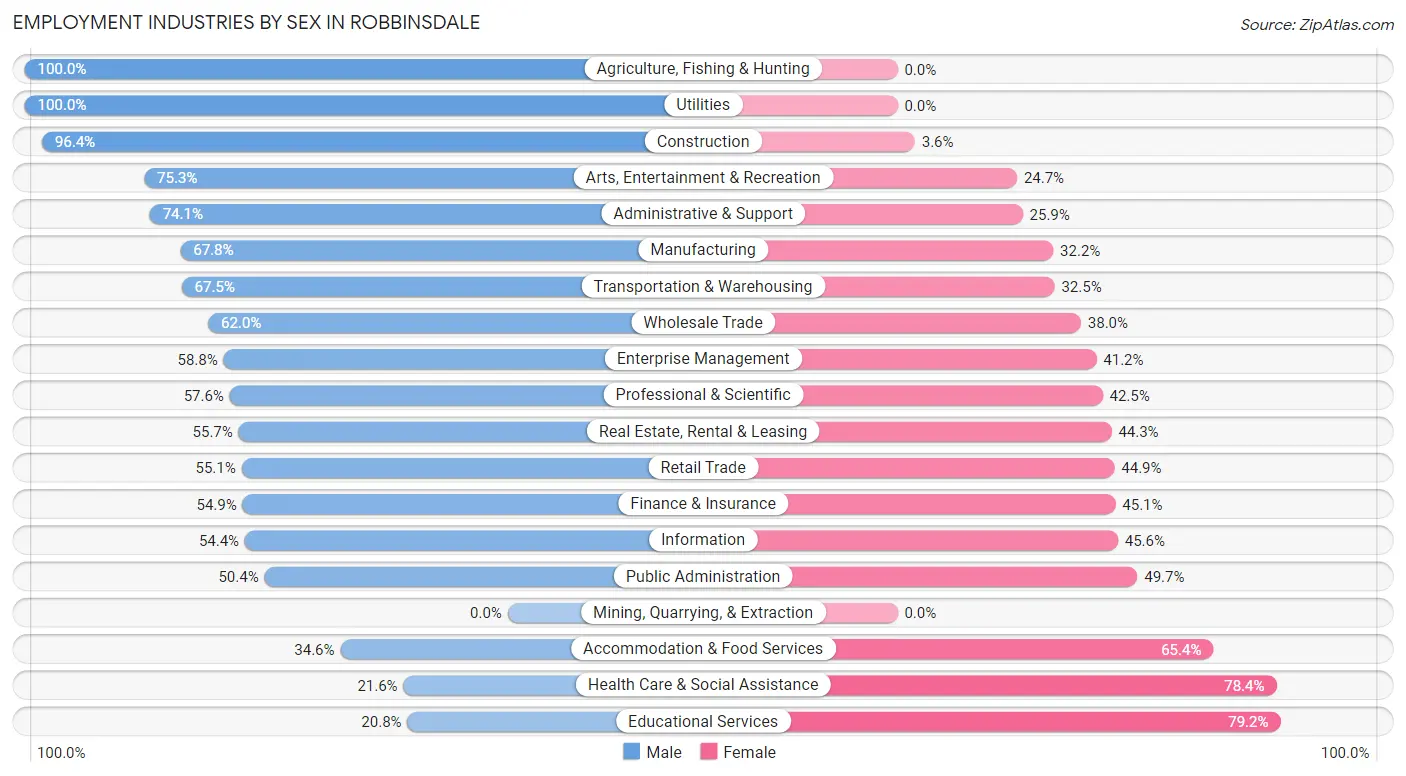
Employment Industries by Sex in Robbinsdale
The Robbinsdale industries that see more men than women are Agriculture, Fishing & Hunting (100.0%), Utilities (100.0%), and Construction (96.4%), whereas the industries that tend to have a higher number of women are Educational Services (79.2%), Health Care & Social Assistance (78.4%), and Accommodation & Food Services (65.4%).
| Industry | Male | Female |
| Agriculture, Fishing & Hunting | 57 (100.0%) | 0 (0.0%) |
| Mining, Quarrying, & Extraction | 0 (0.0%) | 0 (0.0%) |
| Construction | 322 (96.4%) | 12 (3.6%) |
| Manufacturing | 517 (67.8%) | 246 (32.2%) |
| Wholesale Trade | 98 (62.0%) | 60 (38.0%) |
| Retail Trade | 584 (55.1%) | 476 (44.9%) |
| Transportation & Warehousing | 245 (67.5%) | 118 (32.5%) |
| Utilities | 7 (100.0%) | 0 (0.0%) |
| Information | 93 (54.4%) | 78 (45.6%) |
| Finance & Insurance | 303 (54.9%) | 249 (45.1%) |
| Real Estate, Rental & Leasing | 88 (55.7%) | 70 (44.3%) |
| Professional & Scientific | 564 (57.6%) | 416 (42.4%) |
| Enterprise Management | 10 (58.8%) | 7 (41.2%) |
| Administrative & Support | 223 (74.1%) | 78 (25.9%) |
| Educational Services | 120 (20.8%) | 458 (79.2%) |
| Health Care & Social Assistance | 279 (21.6%) | 1,014 (78.4%) |
| Arts, Entertainment & Recreation | 143 (75.3%) | 47 (24.7%) |
| Accommodation & Food Services | 150 (34.6%) | 283 (65.4%) |
| Public Administration | 143 (50.3%) | 141 (49.6%) |
| Total | 4,110 (51.5%) | 3,873 (48.5%) |
Education in Robbinsdale
School Enrollment in Robbinsdale
The most common levels of schooling among the 2,977 students in Robbinsdale are middle school (867 | 29.1%), high school (468 | 15.7%), and elementary school (432 | 14.5%).
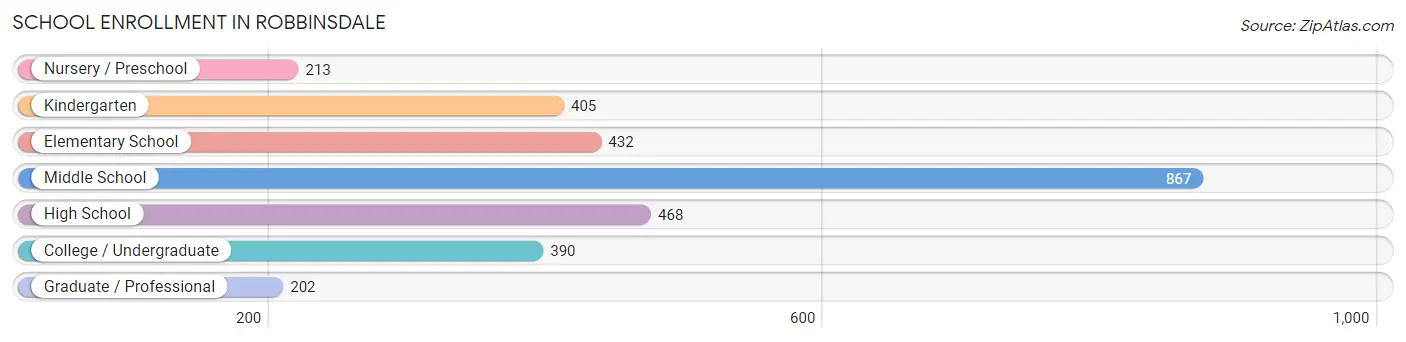
| School Level | # Students | % Students |
| Nursery / Preschool | 213 | 7.1% |
| Kindergarten | 405 | 13.6% |
| Elementary School | 432 | 14.5% |
| Middle School | 867 | 29.1% |
| High School | 468 | 15.7% |
| College / Undergraduate | 390 | 13.1% |
| Graduate / Professional | 202 | 6.8% |
| Total | 2,977 | 100.0% |
School Enrollment by Age by Funding Source in Robbinsdale
Out of a total of 2,977 students who are enrolled in schools in Robbinsdale, 485 (16.3%) attend a private institution, while the remaining 2,492 (83.7%) are enrolled in public schools. The age group of 25 to 34 year olds has the highest likelihood of being enrolled in private schools, with 72 (29.1% in the age bracket) enrolled. Conversely, the age group of 15 to 17 year olds has the lowest likelihood of being enrolled in a private school, with 318 (94.9% in the age bracket) attending a public institution.
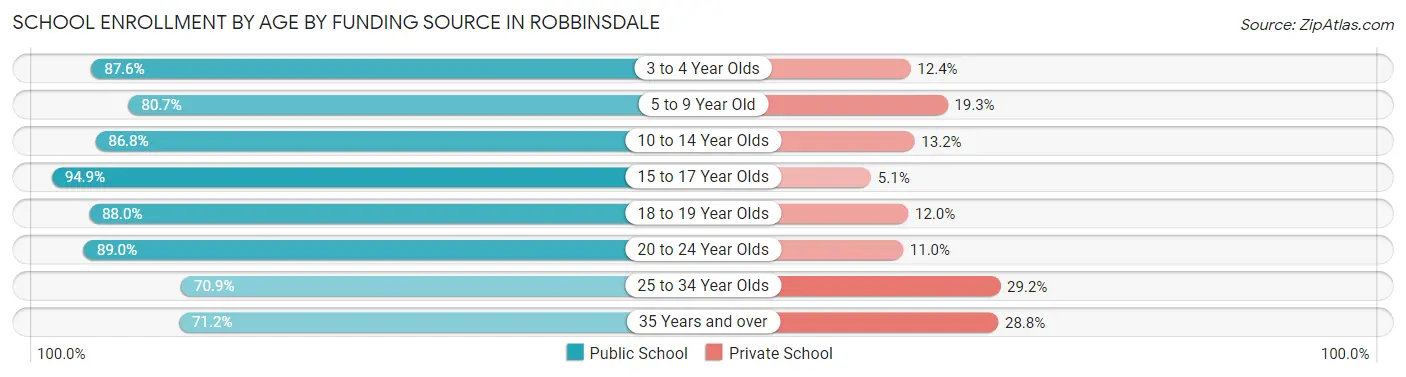
| Age Bracket | Public School | Private School |
| 3 to 4 Year Olds | 162 (87.6%) | 23 (12.4%) |
| 5 to 9 Year Old | 647 (80.7%) | 155 (19.3%) |
| 10 to 14 Year Olds | 843 (86.8%) | 128 (13.2%) |
| 15 to 17 Year Olds | 318 (94.9%) | 17 (5.1%) |
| 18 to 19 Year Olds | 66 (88.0%) | 9 (12.0%) |
| 20 to 24 Year Olds | 121 (89.0%) | 15 (11.0%) |
| 25 to 34 Year Olds | 175 (70.9%) | 72 (29.1%) |
| 35 Years and over | 161 (71.2%) | 65 (28.8%) |
| Total | 2,492 (83.7%) | 485 (16.3%) |
Educational Attainment by Field of Study in Robbinsdale
Business (941 | 19.0%), education (521 | 10.5%), visual & performing arts (493 | 10.0%), social sciences (454 | 9.2%), and communications (358 | 7.2%) are the most common fields of study among 4,952 individuals in Robbinsdale who have obtained a bachelor's degree or higher.
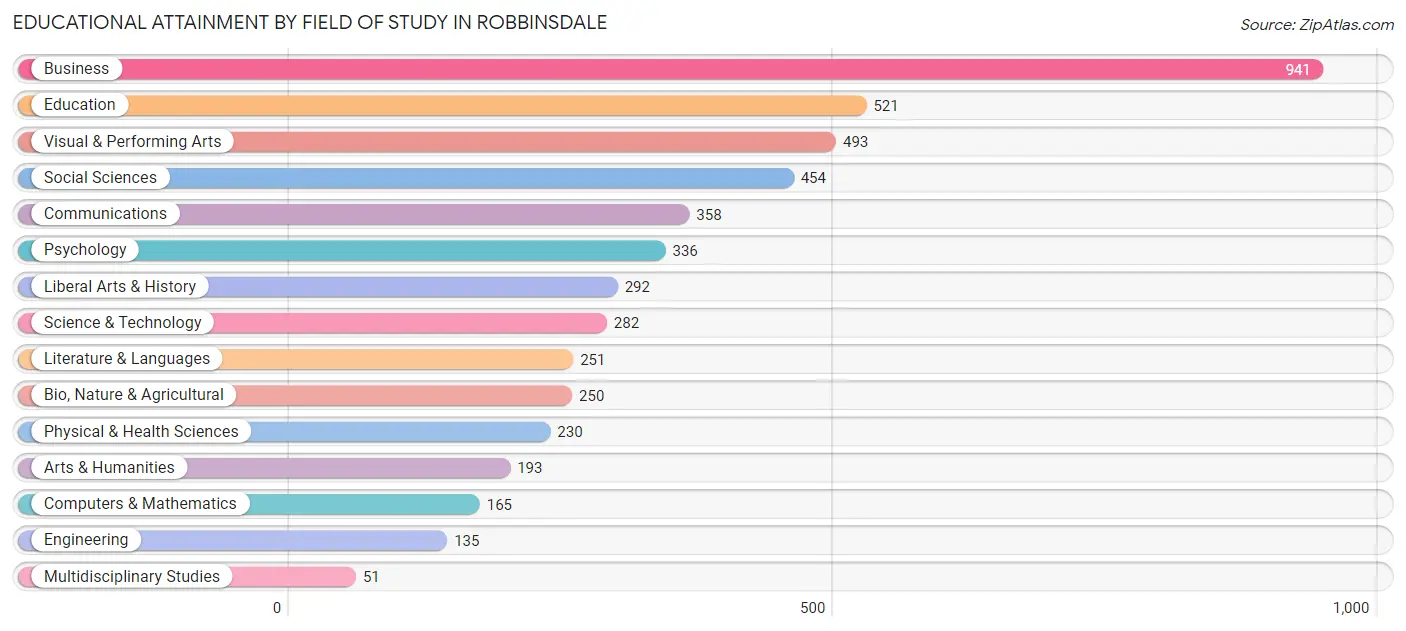
| Field of Study | # Graduates | % Graduates |
| Computers & Mathematics | 165 | 3.3% |
| Bio, Nature & Agricultural | 250 | 5.1% |
| Physical & Health Sciences | 230 | 4.6% |
| Psychology | 336 | 6.8% |
| Social Sciences | 454 | 9.2% |
| Engineering | 135 | 2.7% |
| Multidisciplinary Studies | 51 | 1.0% |
| Science & Technology | 282 | 5.7% |
| Business | 941 | 19.0% |
| Education | 521 | 10.5% |
| Literature & Languages | 251 | 5.1% |
| Liberal Arts & History | 292 | 5.9% |
| Visual & Performing Arts | 493 | 10.0% |
| Communications | 358 | 7.2% |
| Arts & Humanities | 193 | 3.9% |
| Total | 4,952 | 100.0% |
Transportation & Commute in Robbinsdale
Vehicle Availability by Sex in Robbinsdale
The most prevalent vehicle ownership categories in Robbinsdale are males with 2 vehicles (2,317, accounting for 56.9%) and females with 2 vehicles (2,054, making up 60.3%).
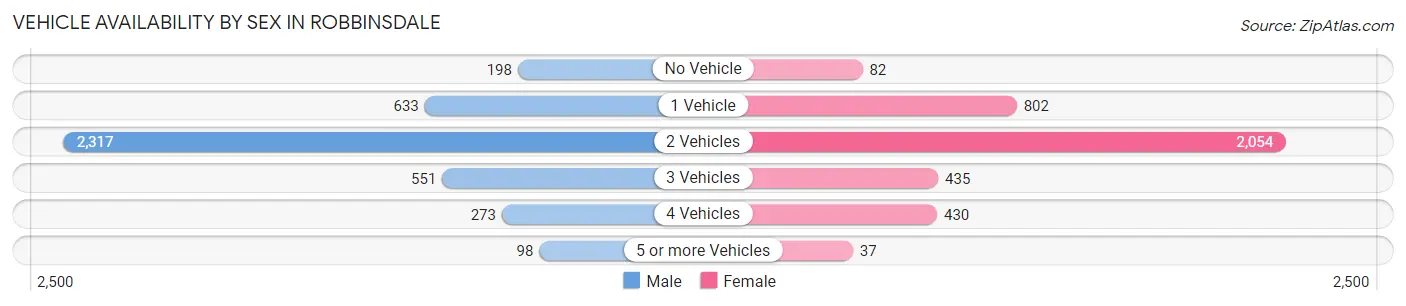
| Vehicles Available | Male | Female |
| No Vehicle | 198 (4.9%) | 82 (2.1%) |
| 1 Vehicle | 633 (15.5%) | 802 (20.9%) |
| 2 Vehicles | 2,317 (56.9%) | 2,054 (53.5%) |
| 3 Vehicles | 551 (13.5%) | 435 (11.3%) |
| 4 Vehicles | 273 (6.7%) | 430 (11.2%) |
| 5 or more Vehicles | 98 (2.4%) | 37 (1.0%) |
| Total | 4,070 (100.0%) | 3,840 (100.0%) |
Commute Time in Robbinsdale
The most frequently occuring commute durations in Robbinsdale are 15 to 19 minutes (1,596 commuters, 24.0%), 20 to 24 minutes (1,517 commuters, 22.9%), and 30 to 34 minutes (806 commuters, 12.1%).
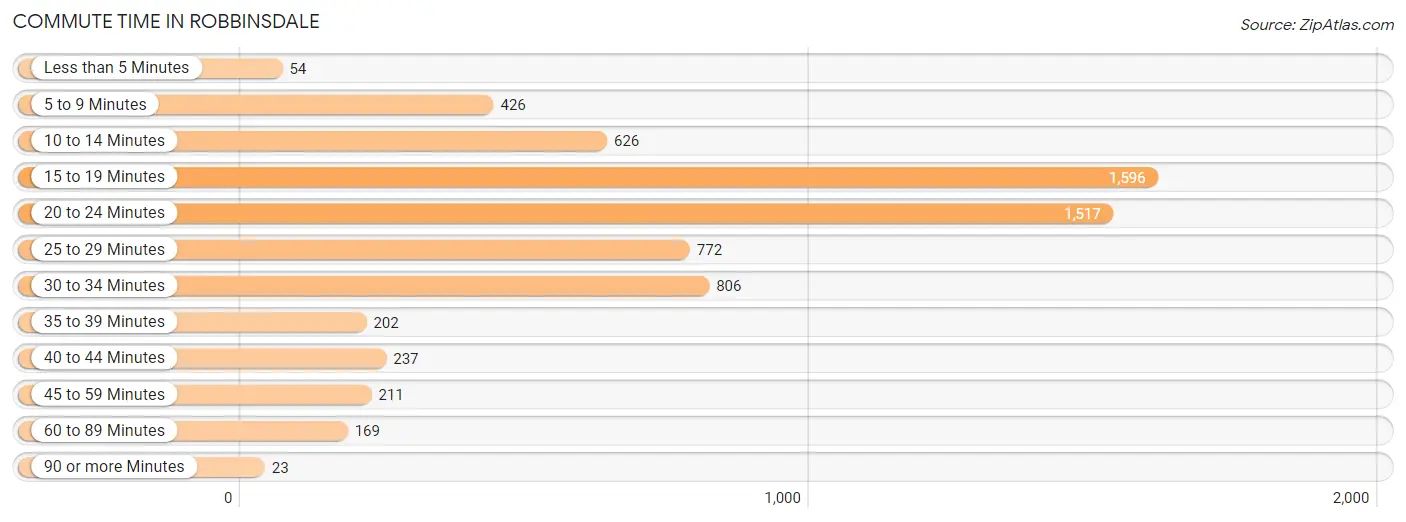
| Commute Time | # Commuters | % Commuters |
| Less than 5 Minutes | 54 | 0.8% |
| 5 to 9 Minutes | 426 | 6.4% |
| 10 to 14 Minutes | 626 | 9.4% |
| 15 to 19 Minutes | 1,596 | 24.0% |
| 20 to 24 Minutes | 1,517 | 22.9% |
| 25 to 29 Minutes | 772 | 11.6% |
| 30 to 34 Minutes | 806 | 12.1% |
| 35 to 39 Minutes | 202 | 3.0% |
| 40 to 44 Minutes | 237 | 3.6% |
| 45 to 59 Minutes | 211 | 3.2% |
| 60 to 89 Minutes | 169 | 2.5% |
| 90 or more Minutes | 23 | 0.4% |
Commute Time by Sex in Robbinsdale
The most common commute times in Robbinsdale are 20 to 24 minutes (935 commuters, 27.2%) for males and 15 to 19 minutes (862 commuters, 26.9%) for females.
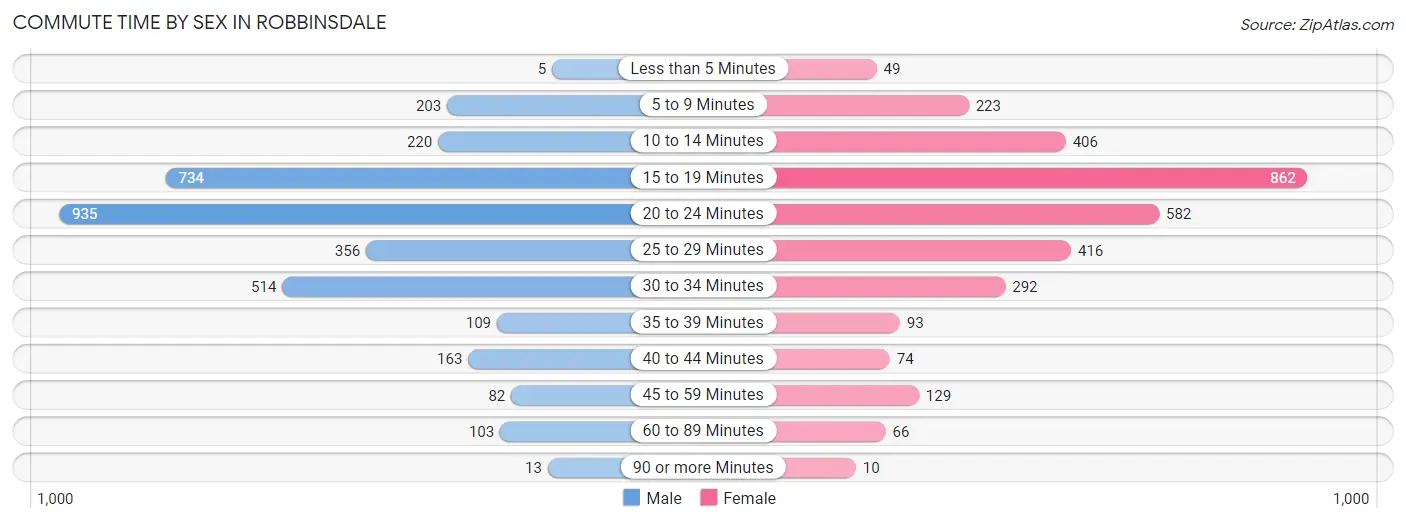
| Commute Time | Male | Female |
| Less than 5 Minutes | 5 (0.2%) | 49 (1.5%) |
| 5 to 9 Minutes | 203 (5.9%) | 223 (7.0%) |
| 10 to 14 Minutes | 220 (6.4%) | 406 (12.7%) |
| 15 to 19 Minutes | 734 (21.4%) | 862 (26.9%) |
| 20 to 24 Minutes | 935 (27.2%) | 582 (18.2%) |
| 25 to 29 Minutes | 356 (10.4%) | 416 (13.0%) |
| 30 to 34 Minutes | 514 (14.9%) | 292 (9.1%) |
| 35 to 39 Minutes | 109 (3.2%) | 93 (2.9%) |
| 40 to 44 Minutes | 163 (4.7%) | 74 (2.3%) |
| 45 to 59 Minutes | 82 (2.4%) | 129 (4.0%) |
| 60 to 89 Minutes | 103 (3.0%) | 66 (2.1%) |
| 90 or more Minutes | 13 (0.4%) | 10 (0.3%) |
Time of Departure to Work by Sex in Robbinsdale
The most frequent times of departure to work in Robbinsdale are 7:00 AM to 7:29 AM (418, 12.2%) for males and 7:30 AM to 7:59 AM (636, 19.9%) for females.
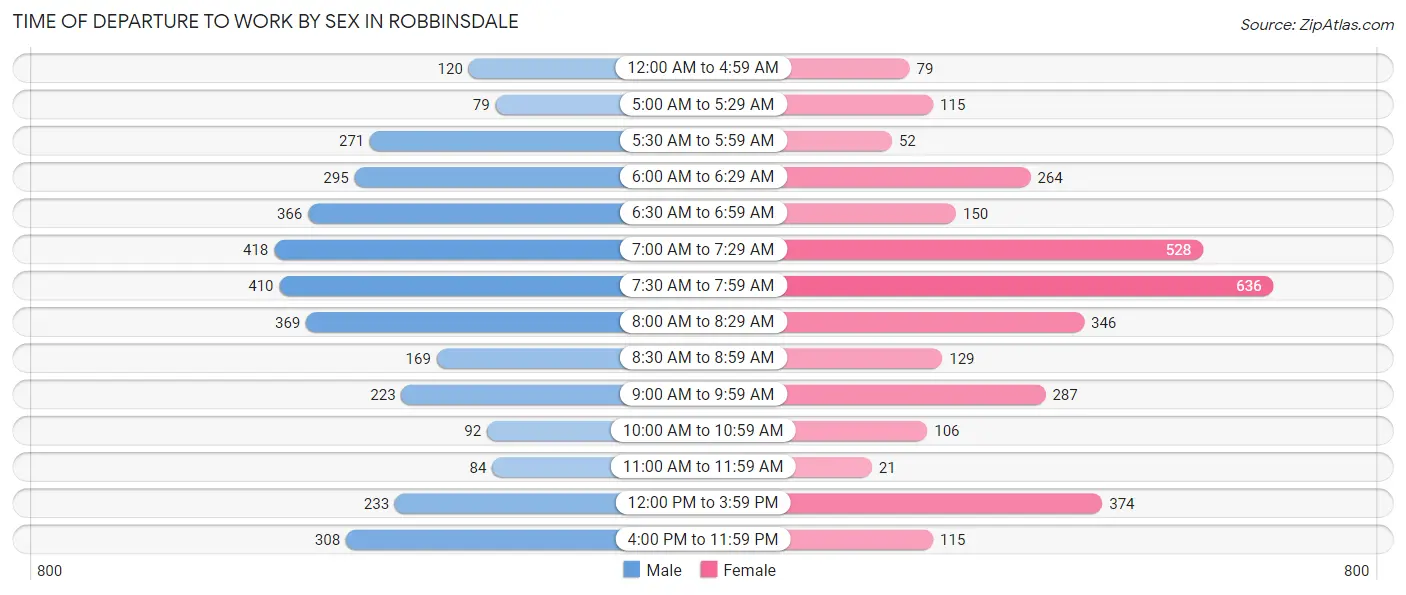
| Time of Departure | Male | Female |
| 12:00 AM to 4:59 AM | 120 (3.5%) | 79 (2.5%) |
| 5:00 AM to 5:29 AM | 79 (2.3%) | 115 (3.6%) |
| 5:30 AM to 5:59 AM | 271 (7.9%) | 52 (1.6%) |
| 6:00 AM to 6:29 AM | 295 (8.6%) | 264 (8.2%) |
| 6:30 AM to 6:59 AM | 366 (10.6%) | 150 (4.7%) |
| 7:00 AM to 7:29 AM | 418 (12.2%) | 528 (16.5%) |
| 7:30 AM to 7:59 AM | 410 (11.9%) | 636 (19.9%) |
| 8:00 AM to 8:29 AM | 369 (10.7%) | 346 (10.8%) |
| 8:30 AM to 8:59 AM | 169 (4.9%) | 129 (4.0%) |
| 9:00 AM to 9:59 AM | 223 (6.5%) | 287 (9.0%) |
| 10:00 AM to 10:59 AM | 92 (2.7%) | 106 (3.3%) |
| 11:00 AM to 11:59 AM | 84 (2.4%) | 21 (0.7%) |
| 12:00 PM to 3:59 PM | 233 (6.8%) | 374 (11.7%) |
| 4:00 PM to 11:59 PM | 308 (9.0%) | 115 (3.6%) |
| Total | 3,437 (100.0%) | 3,202 (100.0%) |
Housing Occupancy in Robbinsdale
Occupancy by Ownership in Robbinsdale
Of the total 6,480 dwellings in Robbinsdale, owner-occupied units account for 4,591 (70.9%), while renter-occupied units make up 1,889 (29.1%).
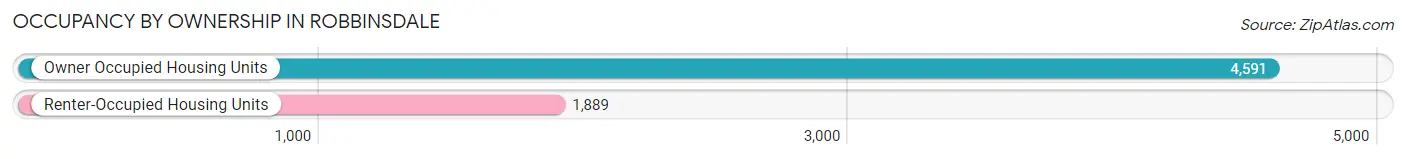
| Occupancy | # Housing Units | % Housing Units |
| Owner Occupied Housing Units | 4,591 | 70.9% |
| Renter-Occupied Housing Units | 1,889 | 29.1% |
| Total Occupied Housing Units | 6,480 | 100.0% |
Occupancy by Household Size in Robbinsdale
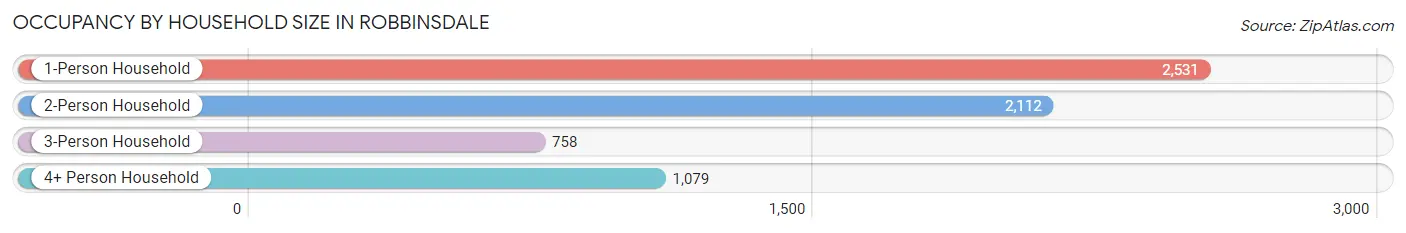
| Household Size | # Housing Units | % Housing Units |
| 1-Person Household | 2,531 | 39.1% |
| 2-Person Household | 2,112 | 32.6% |
| 3-Person Household | 758 | 11.7% |
| 4+ Person Household | 1,079 | 16.7% |
| Total Housing Units | 6,480 | 100.0% |
Occupancy by Ownership by Household Size in Robbinsdale
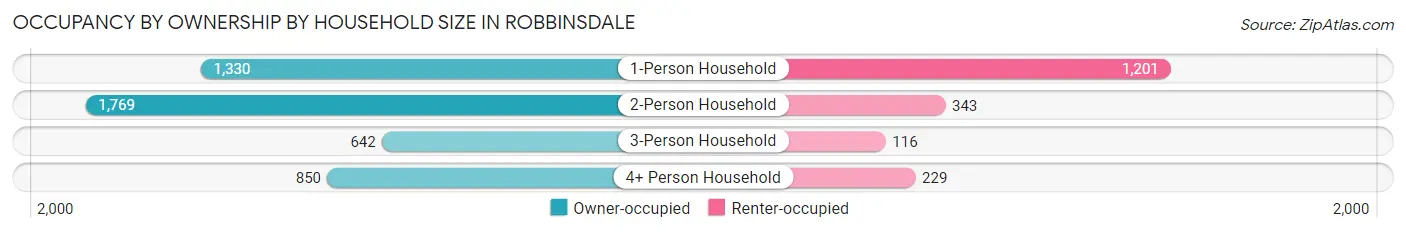
| Household Size | Owner-occupied | Renter-occupied |
| 1-Person Household | 1,330 (52.5%) | 1,201 (47.4%) |
| 2-Person Household | 1,769 (83.8%) | 343 (16.2%) |
| 3-Person Household | 642 (84.7%) | 116 (15.3%) |
| 4+ Person Household | 850 (78.8%) | 229 (21.2%) |
| Total Housing Units | 4,591 (70.9%) | 1,889 (29.1%) |
Occupancy by Educational Attainment in Robbinsdale
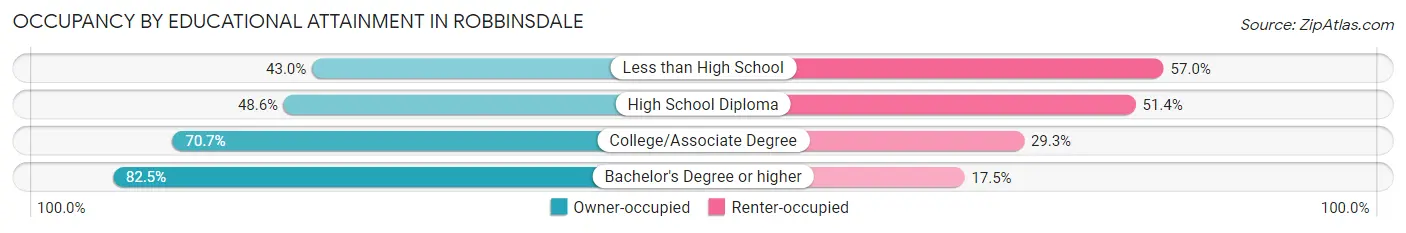
| Household Size | Owner-occupied | Renter-occupied |
| Less than High School | 86 (43.0%) | 114 (57.0%) |
| High School Diploma | 582 (48.6%) | 616 (51.4%) |
| College/Associate Degree | 1,617 (70.7%) | 670 (29.3%) |
| Bachelor's Degree or higher | 2,306 (82.5%) | 489 (17.5%) |
Occupancy by Age of Householder in Robbinsdale
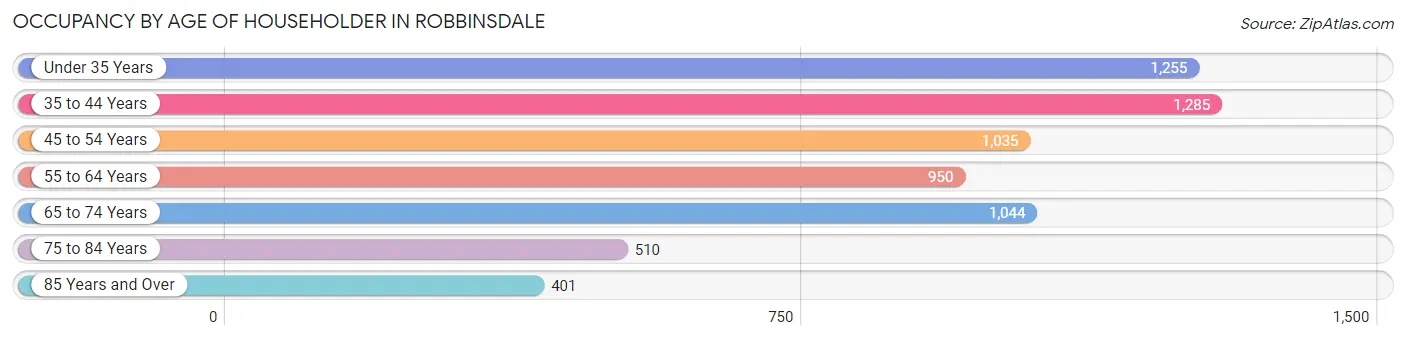
| Age Bracket | # Households | % Households |
| Under 35 Years | 1,255 | 19.4% |
| 35 to 44 Years | 1,285 | 19.8% |
| 45 to 54 Years | 1,035 | 16.0% |
| 55 to 64 Years | 950 | 14.7% |
| 65 to 74 Years | 1,044 | 16.1% |
| 75 to 84 Years | 510 | 7.9% |
| 85 Years and Over | 401 | 6.2% |
| Total | 6,480 | 100.0% |
Housing Finances in Robbinsdale
Median Income by Occupancy in Robbinsdale
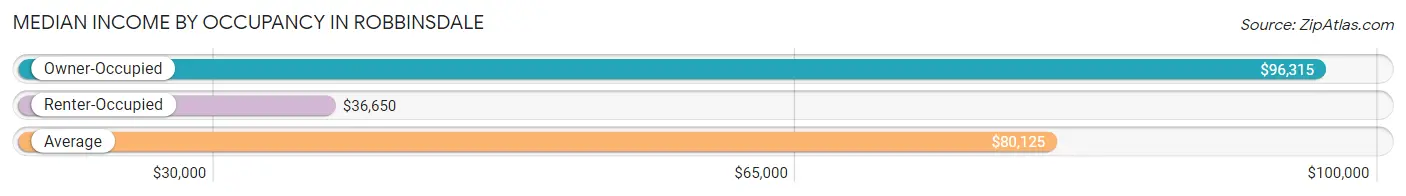
| Occupancy Type | # Households | Median Income |
| Owner-Occupied | 4,591 (70.9%) | $96,315 |
| Renter-Occupied | 1,889 (29.1%) | $36,650 |
| Average | 6,480 (100.0%) | $80,125 |
Occupancy by Householder Income Bracket in Robbinsdale
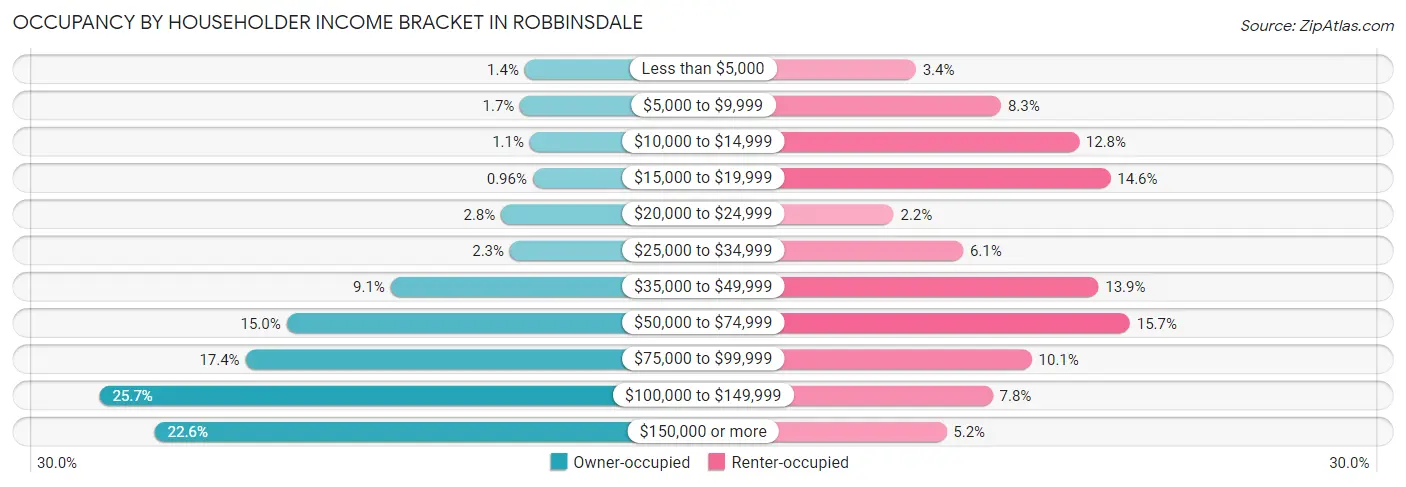
| Income Bracket | Owner-occupied | Renter-occupied |
| Less than $5,000 | 65 (1.4%) | 65 (3.4%) |
| $5,000 to $9,999 | 77 (1.7%) | 157 (8.3%) |
| $10,000 to $14,999 | 52 (1.1%) | 241 (12.8%) |
| $15,000 to $19,999 | 44 (1.0%) | 275 (14.6%) |
| $20,000 to $24,999 | 127 (2.8%) | 41 (2.2%) |
| $25,000 to $34,999 | 104 (2.3%) | 116 (6.1%) |
| $35,000 to $49,999 | 417 (9.1%) | 262 (13.9%) |
| $50,000 to $74,999 | 690 (15.0%) | 296 (15.7%) |
| $75,000 to $99,999 | 798 (17.4%) | 190 (10.1%) |
| $100,000 to $149,999 | 1,181 (25.7%) | 148 (7.8%) |
| $150,000 or more | 1,036 (22.6%) | 98 (5.2%) |
| Total | 4,591 (100.0%) | 1,889 (100.0%) |
Monthly Housing Cost Tiers in Robbinsdale
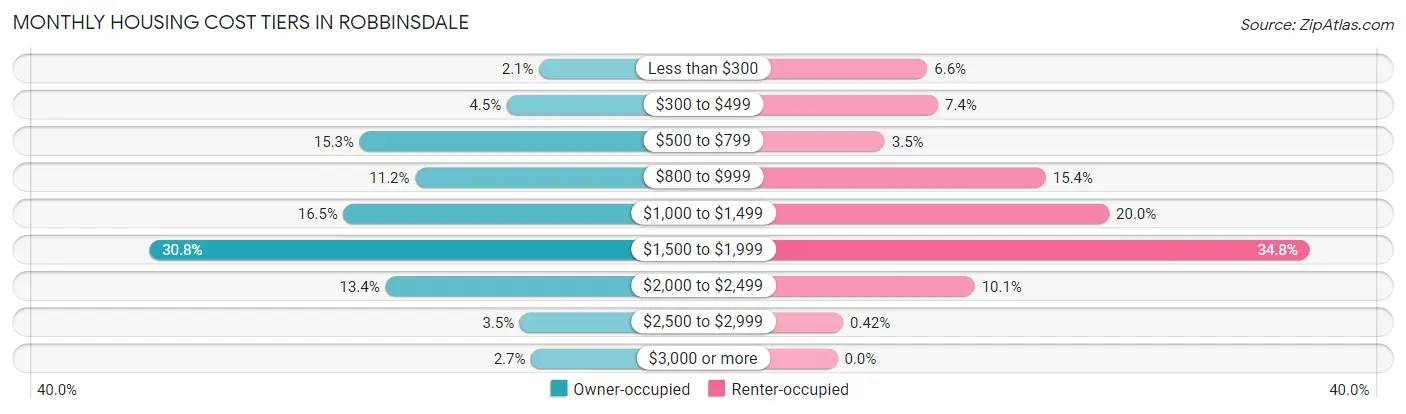
| Monthly Cost | Owner-occupied | Renter-occupied |
| Less than $300 | 96 (2.1%) | 125 (6.6%) |
| $300 to $499 | 205 (4.5%) | 140 (7.4%) |
| $500 to $799 | 703 (15.3%) | 66 (3.5%) |
| $800 to $999 | 515 (11.2%) | 290 (15.3%) |
| $1,000 to $1,499 | 757 (16.5%) | 378 (20.0%) |
| $1,500 to $1,999 | 1,415 (30.8%) | 657 (34.8%) |
| $2,000 to $2,499 | 616 (13.4%) | 191 (10.1%) |
| $2,500 to $2,999 | 161 (3.5%) | 8 (0.4%) |
| $3,000 or more | 123 (2.7%) | 0 (0.0%) |
| Total | 4,591 (100.0%) | 1,889 (100.0%) |
Physical Housing Characteristics in Robbinsdale
Housing Structures in Robbinsdale
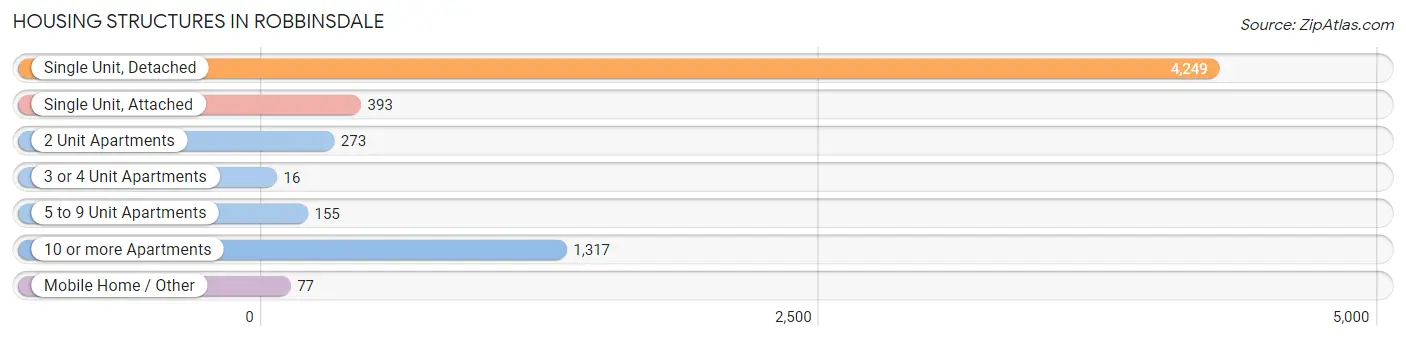
| Structure Type | # Housing Units | % Housing Units |
| Single Unit, Detached | 4,249 | 65.6% |
| Single Unit, Attached | 393 | 6.1% |
| 2 Unit Apartments | 273 | 4.2% |
| 3 or 4 Unit Apartments | 16 | 0.3% |
| 5 to 9 Unit Apartments | 155 | 2.4% |
| 10 or more Apartments | 1,317 | 20.3% |
| Mobile Home / Other | 77 | 1.2% |
| Total | 6,480 | 100.0% |
Housing Structures by Occupancy in Robbinsdale
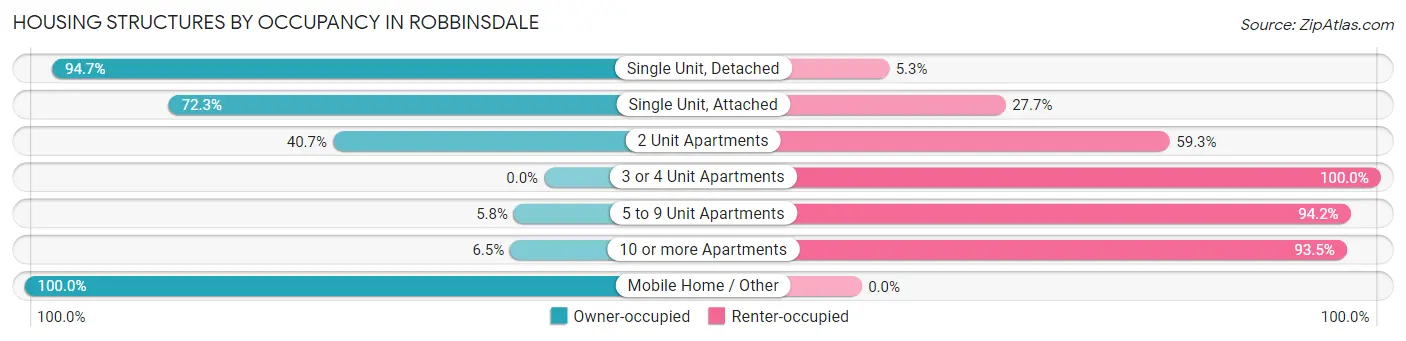
| Structure Type | Owner-occupied | Renter-occupied |
| Single Unit, Detached | 4,024 (94.7%) | 225 (5.3%) |
| Single Unit, Attached | 284 (72.3%) | 109 (27.7%) |
| 2 Unit Apartments | 111 (40.7%) | 162 (59.3%) |
| 3 or 4 Unit Apartments | 0 (0.0%) | 16 (100.0%) |
| 5 to 9 Unit Apartments | 9 (5.8%) | 146 (94.2%) |
| 10 or more Apartments | 86 (6.5%) | 1,231 (93.5%) |
| Mobile Home / Other | 77 (100.0%) | 0 (0.0%) |
| Total | 4,591 (70.9%) | 1,889 (29.1%) |
Housing Structures by Number of Rooms in Robbinsdale
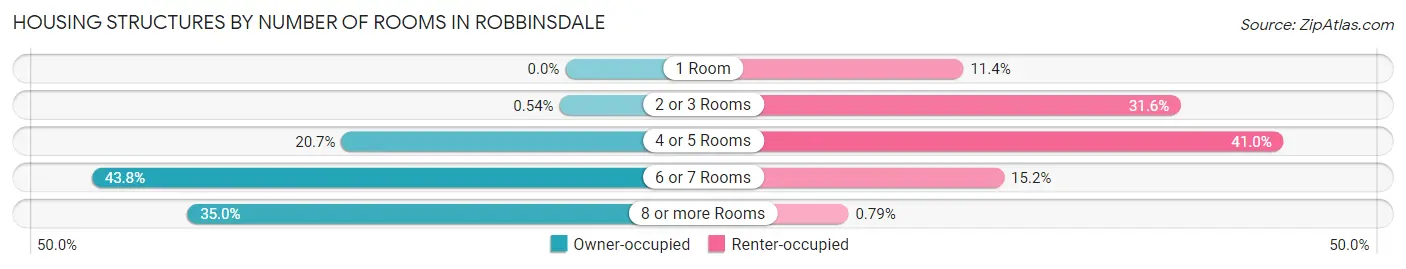
| Number of Rooms | Owner-occupied | Renter-occupied |
| 1 Room | 0 (0.0%) | 216 (11.4%) |
| 2 or 3 Rooms | 25 (0.5%) | 596 (31.6%) |
| 4 or 5 Rooms | 951 (20.7%) | 775 (41.0%) |
| 6 or 7 Rooms | 2,010 (43.8%) | 287 (15.2%) |
| 8 or more Rooms | 1,605 (35.0%) | 15 (0.8%) |
| Total | 4,591 (100.0%) | 1,889 (100.0%) |
Housing Structure by Heating Type in Robbinsdale
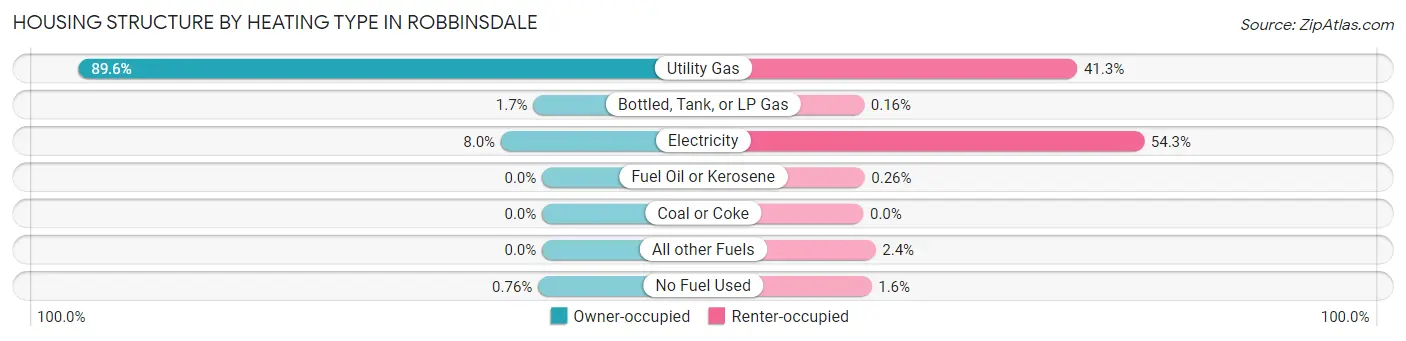
| Heating Type | Owner-occupied | Renter-occupied |
| Utility Gas | 4,114 (89.6%) | 781 (41.3%) |
| Bottled, Tank, or LP Gas | 77 (1.7%) | 3 (0.2%) |
| Electricity | 365 (8.0%) | 1,025 (54.3%) |
| Fuel Oil or Kerosene | 0 (0.0%) | 5 (0.3%) |
| Coal or Coke | 0 (0.0%) | 0 (0.0%) |
| All other Fuels | 0 (0.0%) | 45 (2.4%) |
| No Fuel Used | 35 (0.8%) | 30 (1.6%) |
| Total | 4,591 (100.0%) | 1,889 (100.0%) |
Household Vehicle Usage in Robbinsdale
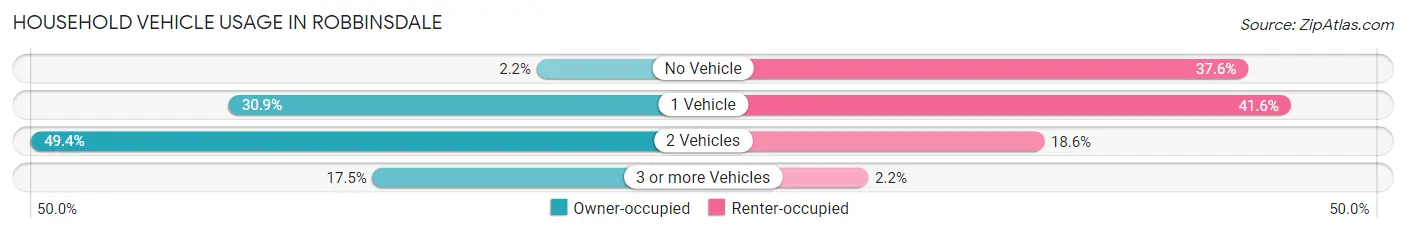
| Vehicles per Household | Owner-occupied | Renter-occupied |
| No Vehicle | 100 (2.2%) | 711 (37.6%) |
| 1 Vehicle | 1,420 (30.9%) | 786 (41.6%) |
| 2 Vehicles | 2,267 (49.4%) | 351 (18.6%) |
| 3 or more Vehicles | 804 (17.5%) | 41 (2.2%) |
| Total | 4,591 (100.0%) | 1,889 (100.0%) |
Real Estate & Mortgages in Robbinsdale
Real Estate and Mortgage Overview in Robbinsdale
| Characteristic | Without Mortgage | With Mortgage |
| Housing Units | 1,324 | 3,267 |
| Median Property Value | $256,900 | $271,000 |
| Median Household Income | $64,858 | $812 |
| Monthly Housing Costs | $650 | $123 |
| Real Estate Taxes | $3,318 | $15 |
Property Value by Mortgage Status in Robbinsdale
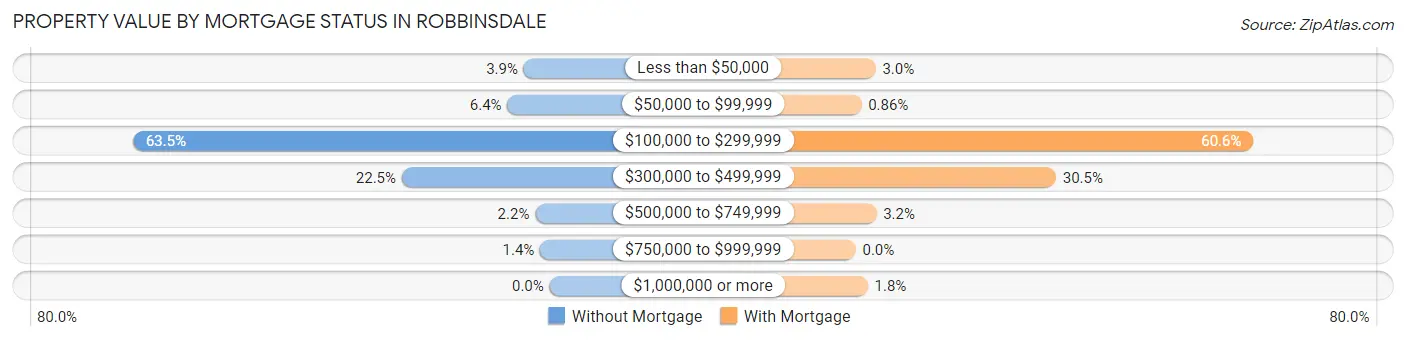
| Property Value | Without Mortgage | With Mortgage |
| Less than $50,000 | 52 (3.9%) | 99 (3.0%) |
| $50,000 to $99,999 | 85 (6.4%) | 28 (0.9%) |
| $100,000 to $299,999 | 841 (63.5%) | 1,980 (60.6%) |
| $300,000 to $499,999 | 298 (22.5%) | 997 (30.5%) |
| $500,000 to $749,999 | 29 (2.2%) | 103 (3.2%) |
| $750,000 to $999,999 | 19 (1.4%) | 0 (0.0%) |
| $1,000,000 or more | 0 (0.0%) | 60 (1.8%) |
| Total | 1,324 (100.0%) | 3,267 (100.0%) |
Household Income by Mortgage Status in Robbinsdale
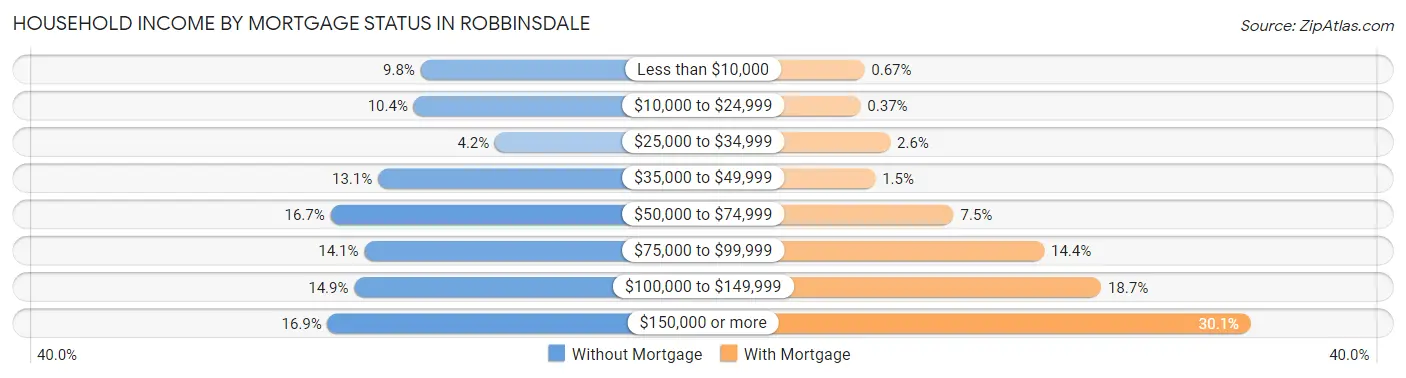
| Household Income | Without Mortgage | With Mortgage |
| Less than $10,000 | 130 (9.8%) | 22 (0.7%) |
| $10,000 to $24,999 | 137 (10.3%) | 12 (0.4%) |
| $25,000 to $34,999 | 55 (4.2%) | 86 (2.6%) |
| $35,000 to $49,999 | 173 (13.1%) | 49 (1.5%) |
| $50,000 to $74,999 | 221 (16.7%) | 244 (7.5%) |
| $75,000 to $99,999 | 187 (14.1%) | 469 (14.4%) |
| $100,000 to $149,999 | 197 (14.9%) | 611 (18.7%) |
| $150,000 or more | 224 (16.9%) | 984 (30.1%) |
| Total | 1,324 (100.0%) | 3,267 (100.0%) |
Property Value to Household Income Ratio in Robbinsdale
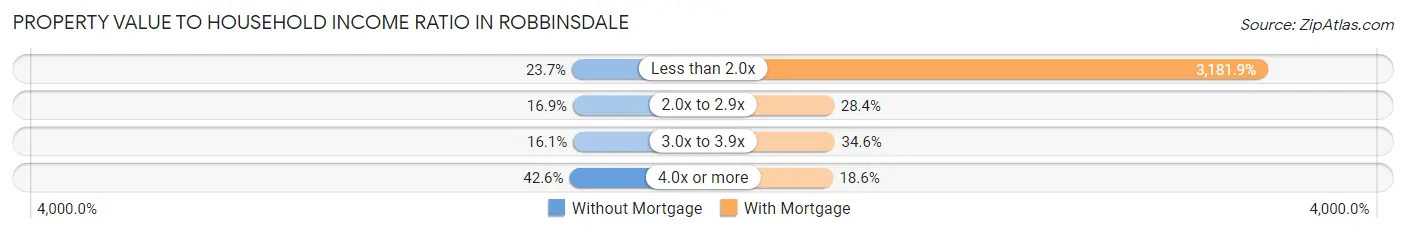
| Value-to-Income Ratio | Without Mortgage | With Mortgage |
| Less than 2.0x | 314 (23.7%) | 103,954 (3,181.9%) |
| 2.0x to 2.9x | 224 (16.9%) | 927 (28.4%) |
| 3.0x to 3.9x | 213 (16.1%) | 1,129 (34.6%) |
| 4.0x or more | 564 (42.6%) | 606 (18.5%) |
| Total | 1,324 (100.0%) | 3,267 (100.0%) |
Real Estate Taxes by Mortgage Status in Robbinsdale
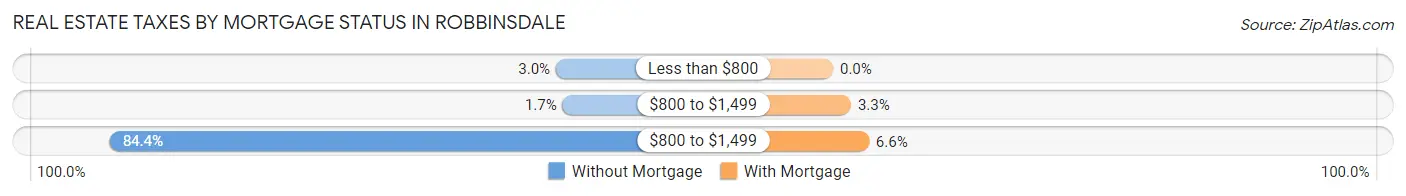
| Property Taxes | Without Mortgage | With Mortgage |
| Less than $800 | 39 (2.9%) | 0 (0.0%) |
| $800 to $1,499 | 23 (1.7%) | 107 (3.3%) |
| $800 to $1,499 | 1,118 (84.4%) | 214 (6.6%) |
| Total | 1,324 (100.0%) | 3,267 (100.0%) |
Health & Disability in Robbinsdale
Health Insurance Coverage by Age in Robbinsdale
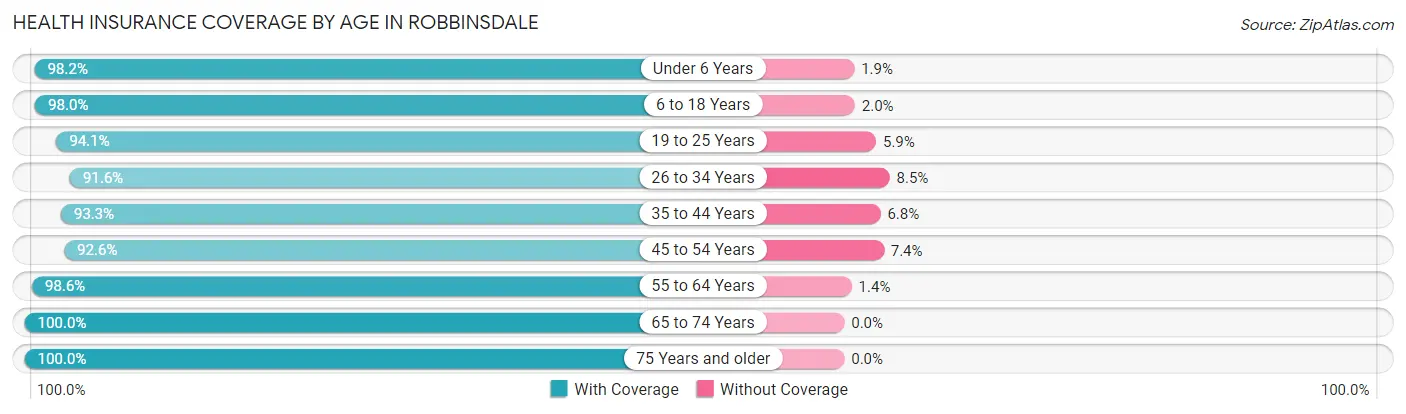
| Age Bracket | With Coverage | Without Coverage |
| Under 6 Years | 1,379 (98.2%) | 26 (1.8%) |
| 6 to 18 Years | 1,795 (98.0%) | 36 (2.0%) |
| 19 to 25 Years | 683 (94.1%) | 43 (5.9%) |
| 26 to 34 Years | 2,309 (91.5%) | 213 (8.5%) |
| 35 to 44 Years | 1,933 (93.2%) | 140 (6.8%) |
| 45 to 54 Years | 1,560 (92.6%) | 124 (7.4%) |
| 55 to 64 Years | 1,513 (98.6%) | 21 (1.4%) |
| 65 to 74 Years | 1,464 (100.0%) | 0 (0.0%) |
| 75 Years and older | 1,044 (100.0%) | 0 (0.0%) |
| Total | 13,680 (95.8%) | 603 (4.2%) |
Health Insurance Coverage by Citizenship Status in Robbinsdale
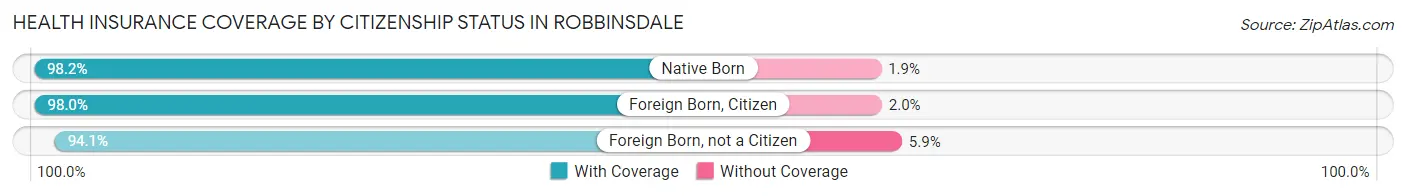
| Citizenship Status | With Coverage | Without Coverage |
| Native Born | 1,379 (98.2%) | 26 (1.8%) |
| Foreign Born, Citizen | 1,795 (98.0%) | 36 (2.0%) |
| Foreign Born, not a Citizen | 683 (94.1%) | 43 (5.9%) |
Health Insurance Coverage by Household Income in Robbinsdale
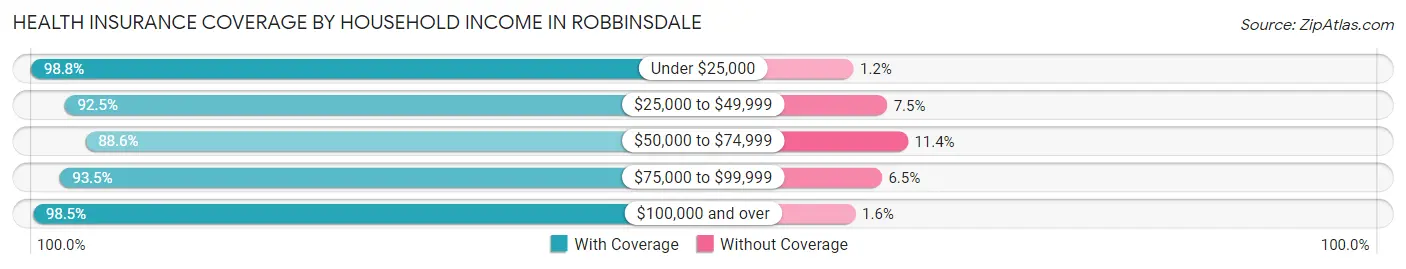
| Household Income | With Coverage | Without Coverage |
| Under $25,000 | 1,670 (98.8%) | 20 (1.2%) |
| $25,000 to $49,999 | 1,250 (92.5%) | 101 (7.5%) |
| $50,000 to $74,999 | 1,569 (88.6%) | 201 (11.4%) |
| $75,000 to $99,999 | 2,559 (93.5%) | 178 (6.5%) |
| $100,000 and over | 6,539 (98.5%) | 103 (1.5%) |
Public vs Private Health Insurance Coverage by Age in Robbinsdale
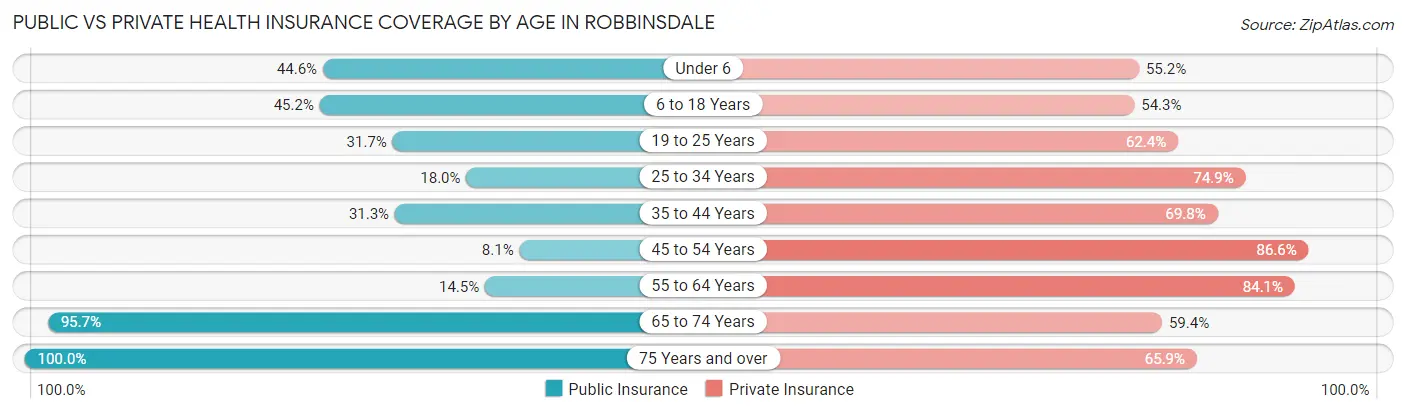
| Age Bracket | Public Insurance | Private Insurance |
| Under 6 | 627 (44.6%) | 775 (55.2%) |
| 6 to 18 Years | 828 (45.2%) | 994 (54.3%) |
| 19 to 25 Years | 230 (31.7%) | 453 (62.4%) |
| 25 to 34 Years | 454 (18.0%) | 1,890 (74.9%) |
| 35 to 44 Years | 648 (31.3%) | 1,446 (69.8%) |
| 45 to 54 Years | 137 (8.1%) | 1,459 (86.6%) |
| 55 to 64 Years | 223 (14.5%) | 1,290 (84.1%) |
| 65 to 74 Years | 1,401 (95.7%) | 870 (59.4%) |
| 75 Years and over | 1,044 (100.0%) | 688 (65.9%) |
| Total | 5,592 (39.2%) | 9,865 (69.1%) |
Disability Status by Sex by Age in Robbinsdale
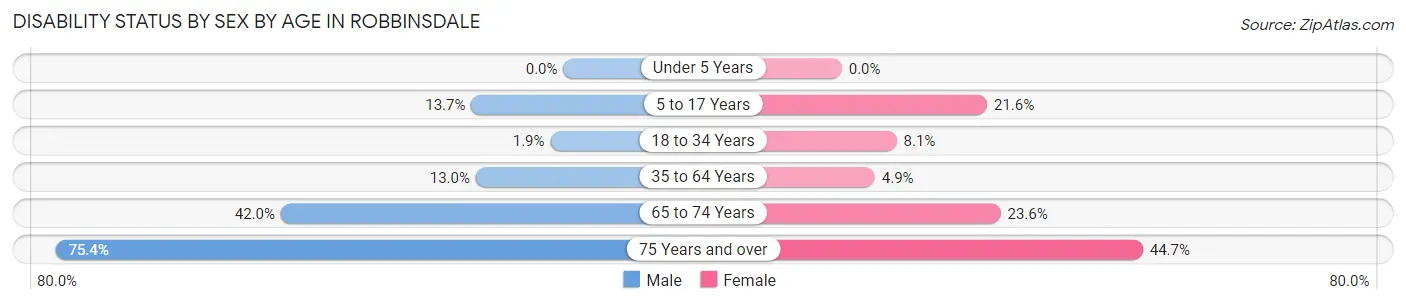
| Age Bracket | Male | Female |
| Under 5 Years | 0 (0.0%) | 0 (0.0%) |
| 5 to 17 Years | 139 (13.7%) | 239 (21.6%) |
| 18 to 34 Years | 31 (1.9%) | 139 (8.1%) |
| 35 to 64 Years | 354 (13.0%) | 126 (4.9%) |
| 65 to 74 Years | 292 (41.9%) | 181 (23.6%) |
| 75 Years and over | 325 (75.4%) | 274 (44.7%) |
Disability Class by Sex by Age in Robbinsdale
Disability Class: Hearing Difficulty
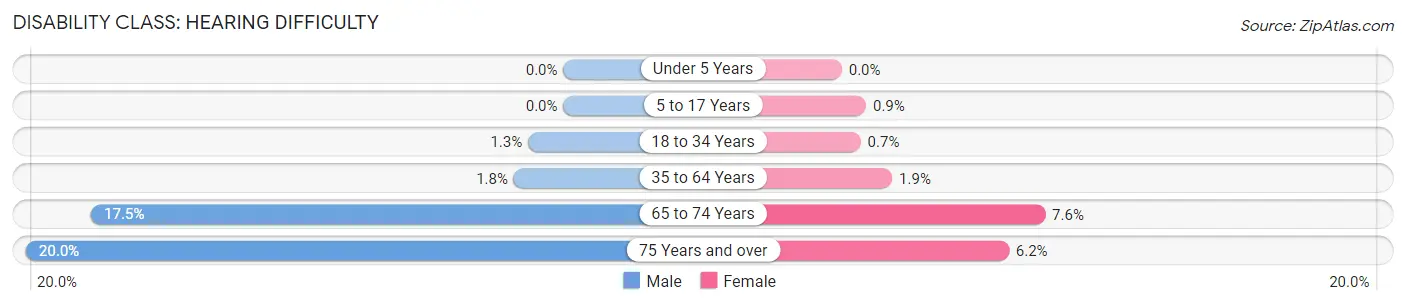
| Age Bracket | Male | Female |
| Under 5 Years | 0 (0.0%) | 0 (0.0%) |
| 5 to 17 Years | 0 (0.0%) | 10 (0.9%) |
| 18 to 34 Years | 21 (1.3%) | 12 (0.7%) |
| 35 to 64 Years | 50 (1.8%) | 48 (1.9%) |
| 65 to 74 Years | 122 (17.5%) | 58 (7.5%) |
| 75 Years and over | 86 (20.0%) | 38 (6.2%) |
Disability Class: Vision Difficulty
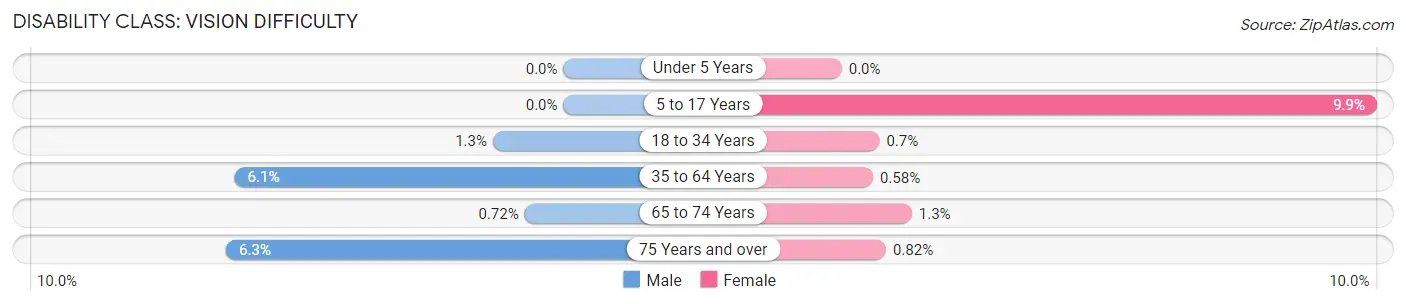
| Age Bracket | Male | Female |
| Under 5 Years | 0 (0.0%) | 0 (0.0%) |
| 5 to 17 Years | 0 (0.0%) | 110 (9.9%) |
| 18 to 34 Years | 21 (1.3%) | 12 (0.7%) |
| 35 to 64 Years | 166 (6.1%) | 15 (0.6%) |
| 65 to 74 Years | 5 (0.7%) | 10 (1.3%) |
| 75 Years and over | 27 (6.3%) | 5 (0.8%) |
Disability Class: Cognitive Difficulty
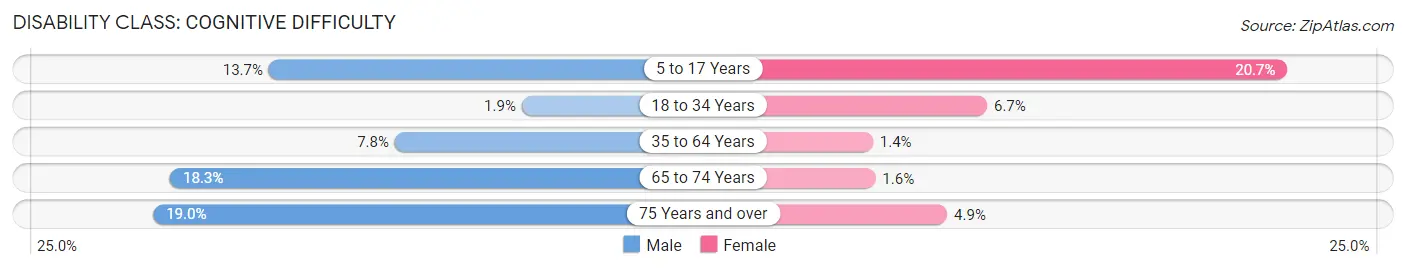
| Age Bracket | Male | Female |
| 5 to 17 Years | 139 (13.7%) | 229 (20.7%) |
| 18 to 34 Years | 31 (1.9%) | 115 (6.7%) |
| 35 to 64 Years | 213 (7.8%) | 37 (1.4%) |
| 65 to 74 Years | 127 (18.2%) | 12 (1.6%) |
| 75 Years and over | 82 (19.0%) | 30 (4.9%) |
Disability Class: Ambulatory Difficulty
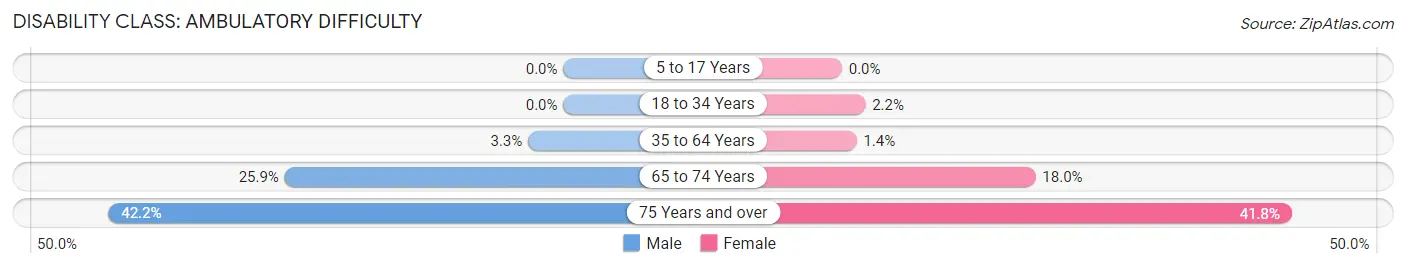
| Age Bracket | Male | Female |
| 5 to 17 Years | 0 (0.0%) | 0 (0.0%) |
| 18 to 34 Years | 0 (0.0%) | 37 (2.2%) |
| 35 to 64 Years | 89 (3.3%) | 35 (1.4%) |
| 65 to 74 Years | 180 (25.9%) | 138 (18.0%) |
| 75 Years and over | 182 (42.2%) | 256 (41.8%) |
Disability Class: Self-Care Difficulty
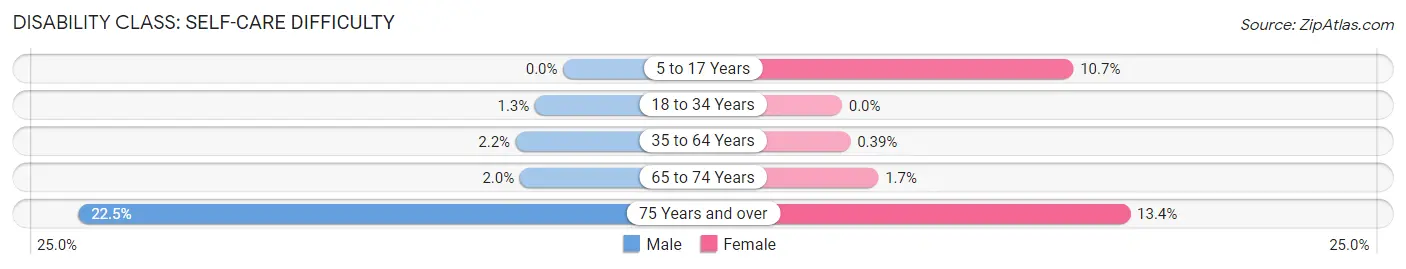
| Age Bracket | Male | Female |
| 5 to 17 Years | 0 (0.0%) | 119 (10.7%) |
| 18 to 34 Years | 21 (1.3%) | 0 (0.0%) |
| 35 to 64 Years | 60 (2.2%) | 10 (0.4%) |
| 65 to 74 Years | 14 (2.0%) | 13 (1.7%) |
| 75 Years and over | 97 (22.5%) | 82 (13.4%) |
Technology Access in Robbinsdale
Computing Device Access in Robbinsdale
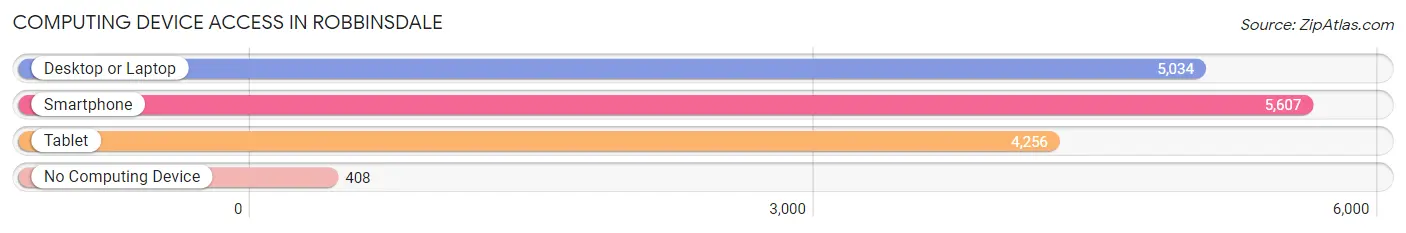
| Device Type | # Households | % Households |
| Desktop or Laptop | 5,034 | 77.7% |
| Smartphone | 5,607 | 86.5% |
| Tablet | 4,256 | 65.7% |
| No Computing Device | 408 | 6.3% |
| Total | 6,480 | 100.0% |
Internet Access in Robbinsdale
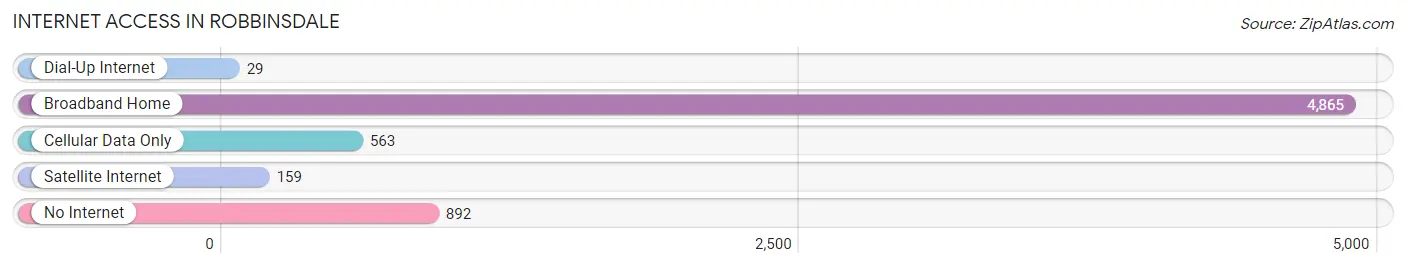
| Internet Type | # Households | % Households |
| Dial-Up Internet | 29 | 0.4% |
| Broadband Home | 4,865 | 75.1% |
| Cellular Data Only | 563 | 8.7% |
| Satellite Internet | 159 | 2.5% |
| No Internet | 892 | 13.8% |
| Total | 6,480 | 100.0% |
Robbinsdale Summary
Robbinsdale, Minnesota is a city located in Hennepin County, Minnesota, United States. It is a suburb of Minneapolis and is located just north of the city. The population was 14,678 at the 2010 census.
History
Robbinsdale was first settled in 1855 by William and Mary Robbins, who were among the first settlers in the area. The city was incorporated in 1886 and was named after the Robbins family. The city was originally a farming community, but it began to grow in the early 1900s when the Twin Cities Rapid Transit Company began to build a streetcar line through the city. This allowed people to commute to Minneapolis and St. Paul for work.
In the 1920s, the city began to develop into a residential suburb of Minneapolis. The city was home to many small businesses, including a grocery store, a hardware store, and a movie theater. The city also had a number of churches, including the Robbinsdale Methodist Church, which was founded in 1887.
Geography
Robbinsdale is located at 45°02'N 93°21'W (45.037, -93.355). According to the United States Census Bureau, the city has a total area of 3.2 square miles (8.3 km2), all of it land.
Robbinsdale is located in the Twin Cities metropolitan area, which is the 15th largest metropolitan area in the United States. The city is bordered by Minneapolis to the south, Golden Valley to the west, Crystal to the north, and Brooklyn Center to the east.
Economy
Robbinsdale is home to a number of businesses, including a number of small businesses and restaurants. The city is also home to a number of large employers, including the Robbinsdale Medical Center, the Robbinsdale Area Schools, and the Robbinsdale Police Department.
Demographics
As of the 2010 census, there were 14,678 people, 6,093 households, and 3,845 families living in the city. The population density was 4,567.2 people per square mile (1,764.2/km2). There were 6,521 housing units at an average density of 2,039.2 per square mile (788.2/km2). The racial makeup of the city was 79.2% White, 8.2% African American, 0.5% Native American, 5.2% Asian, 0.1% Pacific Islander, 4.2% from other races, and 2.7% from two or more races. Hispanic or Latino of any race were 8.7% of the population.
There were 6,093 households, out of which 28.2% had children under the age of 18 living with them, 44.2% were married couples living together, 12.7% had a female householder with no husband present, and 38.2% were non-families. 32.2% of all households were made up of individuals, and 11.2% had someone living alone who was 65 years of age or older. The average household size was 2.39 and the average family size was 3.05.
In the city, the population was spread out, with 23.7% under the age of 18, 8.2% from 18 to 24, 30.2% from 25 to 44, 22.7% from 45 to 64, and 15.2% who were 65 years of age or older. The median age was 37 years. For every 100 females, there were 93.2 males. For every 100 females age 18 and over, there were 90.2 males.
The median income for a household in the city was $45,945, and the median income for a family was $54,945. Males had a median income of $40,945 versus $31,945 for females. The per capita income for the city was $23,945. About 5.2% of families and 7.2% of the population were below the poverty line, including 9.2% of those under age 18 and 6.2% of those age 65 or over.
Common Questions
What is the Total Population of Robbinsdale?
Total Population of Robbinsdale is 14,452.
What is the Total Male Population of Robbinsdale?
Total Male Population of Robbinsdale is 7,055.
What is the Total Female Population of Robbinsdale?
Total Female Population of Robbinsdale is 7,397.
What is the Ratio of Males per 100 Females in Robbinsdale?
There are 95.38 Males per 100 Females in Robbinsdale.
What is the Ratio of Females per 100 Males in Robbinsdale?
There are 104.85 Females per 100 Males in Robbinsdale.
What is the Median Population Age in Robbinsdale?
Median Population Age in Robbinsdale is 38.9 Years.
What is the Average Family Size in Robbinsdale
Average Family Size in Robbinsdale is 3.0 People.
What is the Average Household Size in Robbinsdale
Average Household Size in Robbinsdale is 2.2 People.
What is Per Capita Income in Robbinsdale?
Per Capita income in Robbinsdale is $48,508.
What is the Median Family Income in Robbinsdale?
Median Family Income in Robbinsdale is $105,878.
What is the Median Household income in Robbinsdale?
Median Household Income in Robbinsdale is $80,125.
What is Income or Wage Gap in Robbinsdale?
Income or Wage Gap in Robbinsdale is 10.6%.
Women in Robbinsdale earn 89.4 cents for every dollar earned by a man.
What is Inequality or Gini Index in Robbinsdale?
Inequality or Gini Index in Robbinsdale is 0.48.
How Large is the Labor Force in Robbinsdale?
There are 8,484 People in the Labor Forcein in Robbinsdale.
What is the Percentage of People in the Labor Force in Robbinsdale?
73.5% of People are in the Labor Force in Robbinsdale.
What is the Unemployment Rate in Robbinsdale?
Unemployment Rate in Robbinsdale is 5.8%.