Prior Lake, MN
Prior Lake Map
Prior Lake Overview
27,608
TOTAL POPULATION
13,572
MALE POPULATION
14,036
FEMALE POPULATION
96.69
MALES / 100 FEMALES
103.42
FEMALES / 100 MALES
39.4
MEDIAN AGE
3.2
AVG FAMILY SIZE
2.8
AVG HOUSEHOLD SIZE
$62,432
PER CAPITA INCOME
$147,520
AVG FAMILY INCOME
$129,539
AVG HOUSEHOLD INCOME
28.4%
WAGE / INCOME GAP [ % ]
71.6¢/ $1
WAGE / INCOME GAP [ $ ]
0.44
INEQUALITY / GINI INDEX
15,877
LABOR FORCE [ PEOPLE ]
74.9%
PERCENT IN LABOR FORCE
1.5%
UNEMPLOYMENT RATE
Prior Lake Zip Codes
Prior Lake Area Codes
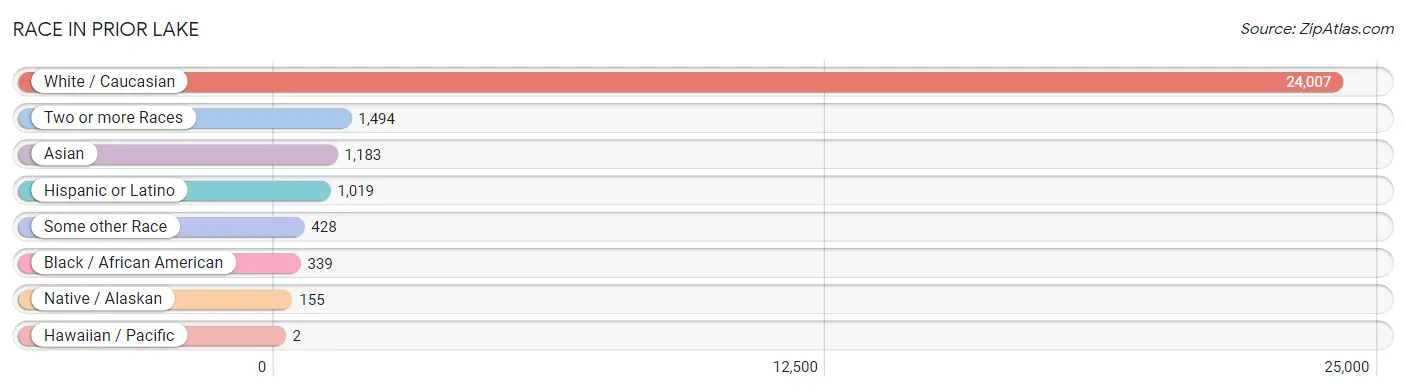
Race in Prior Lake
The most populous races in Prior Lake are White / Caucasian (24,007 | 87.0%), Two or more Races (1,494 | 5.4%), and Asian (1,183 | 4.3%).
| Race | # Population | % Population |
| Asian | 1,183 | 4.3% |
| Black / African American | 339 | 1.2% |
| Hawaiian / Pacific | 2 | 0.0% |
| Hispanic or Latino | 1,019 | 3.7% |
| Native / Alaskan | 155 | 0.6% |
| White / Caucasian | 24,007 | 87.0% |
| Two or more Races | 1,494 | 5.4% |
| Some other Race | 428 | 1.5% |
| Total | 27,608 | 100.0% |
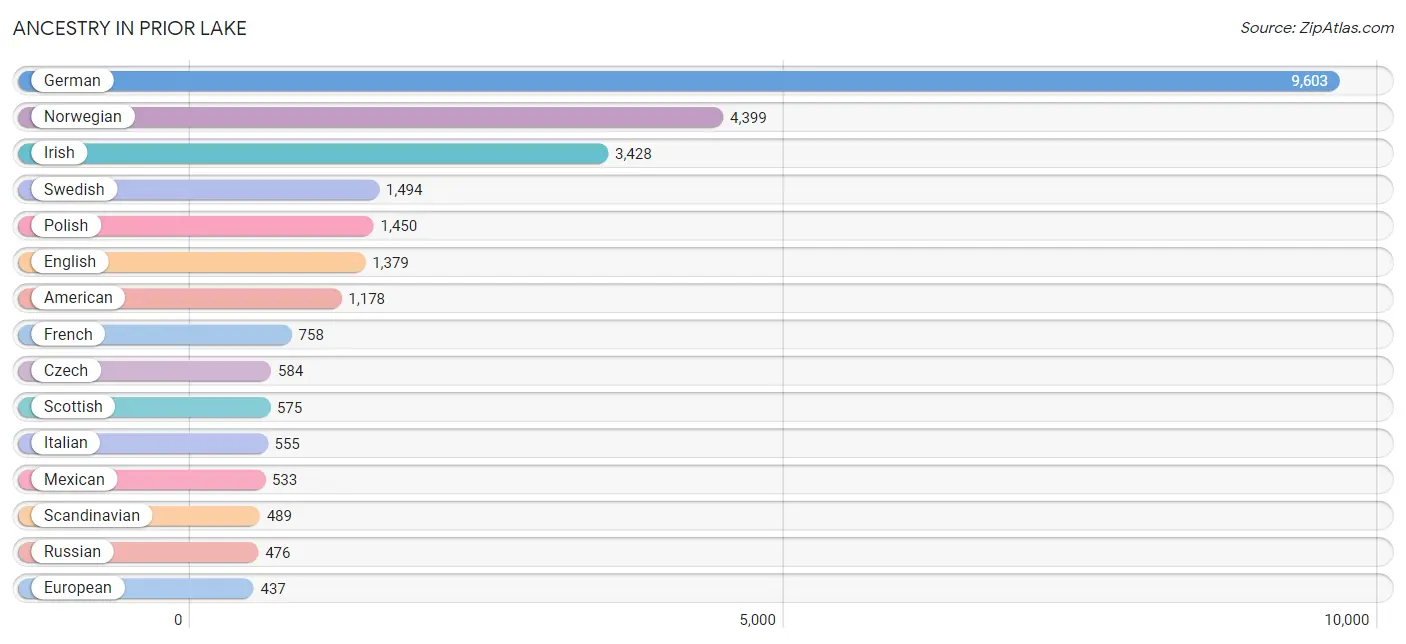
Ancestry in Prior Lake
The most populous ancestries reported in Prior Lake are German (9,603 | 34.8%), Norwegian (4,399 | 15.9%), Irish (3,428 | 12.4%), Swedish (1,494 | 5.4%), and Polish (1,450 | 5.2%), together accounting for 73.8% of all Prior Lake residents.
| Ancestry | # Population | % Population |
| Afghan | 12 | 0.0% |
| African | 3 | 0.0% |
| Alaska Native | 1 | 0.0% |
| American | 1,178 | 4.3% |
| Arab | 62 | 0.2% |
| Argentinean | 21 | 0.1% |
| Austrian | 43 | 0.2% |
| Bangladeshi | 10 | 0.0% |
| Belgian | 199 | 0.7% |
| Bhutanese | 82 | 0.3% |
| Blackfeet | 59 | 0.2% |
| Brazilian | 83 | 0.3% |
| British | 137 | 0.5% |
| Burmese | 59 | 0.2% |
| Canadian | 32 | 0.1% |
| Central American | 115 | 0.4% |
| Cherokee | 17 | 0.1% |
| Chippewa | 20 | 0.1% |
| Choctaw | 1 | 0.0% |
| Croatian | 204 | 0.7% |
| Cuban | 47 | 0.2% |
| Czech | 584 | 2.1% |
| Czechoslovakian | 95 | 0.3% |
| Danish | 224 | 0.8% |
| Dutch | 240 | 0.9% |
| Eastern European | 42 | 0.2% |
| English | 1,379 | 5.0% |
| Estonian | 4 | 0.0% |
| European | 437 | 1.6% |
| Finnish | 275 | 1.0% |
| French | 758 | 2.8% |
| French Canadian | 99 | 0.4% |
| German | 9,603 | 34.8% |
| Greek | 1 | 0.0% |
| Guamanian / Chamorro | 2 | 0.0% |
| Guyanese | 33 | 0.1% |
| Hungarian | 53 | 0.2% |
| Icelander | 18 | 0.1% |
| Indian (Asian) | 160 | 0.6% |
| Irish | 3,428 | 12.4% |
| Italian | 555 | 2.0% |
| Japanese | 243 | 0.9% |
| Korean | 51 | 0.2% |
| Lebanese | 19 | 0.1% |
| Lithuanian | 22 | 0.1% |
| Luxembourger | 15 | 0.1% |
| Malaysian | 51 | 0.2% |
| Mexican | 533 | 1.9% |
| Moroccan | 9 | 0.0% |
| Nicaraguan | 65 | 0.2% |
| Nigerian | 2 | 0.0% |
| Northern European | 91 | 0.3% |
| Norwegian | 4,399 | 15.9% |
| Panamanian | 50 | 0.2% |
| Polish | 1,450 | 5.2% |
| Portuguese | 17 | 0.1% |
| Puerto Rican | 61 | 0.2% |
| Romanian | 27 | 0.1% |
| Russian | 476 | 1.7% |
| Scandinavian | 489 | 1.8% |
| Scotch-Irish | 125 | 0.4% |
| Scottish | 575 | 2.1% |
| Serbian | 19 | 0.1% |
| Sioux | 202 | 0.7% |
| Slavic | 55 | 0.2% |
| Slovak | 70 | 0.3% |
| Slovene | 36 | 0.1% |
| South American | 121 | 0.4% |
| Spaniard | 89 | 0.3% |
| Sri Lankan | 103 | 0.4% |
| Subsaharan African | 27 | 0.1% |
| Swedish | 1,494 | 5.4% |
| Swiss | 137 | 0.5% |
| Syrian | 16 | 0.1% |
| Thai | 431 | 1.6% |
| Trinidadian and Tobagonian | 16 | 0.1% |
| Turkish | 48 | 0.2% |
| Ukrainian | 143 | 0.5% |
| Ute | 1 | 0.0% |
| Venezuelan | 100 | 0.4% |
| Welsh | 68 | 0.3% |
| Yugoslavian | 51 | 0.2% | View All 82 Rows |
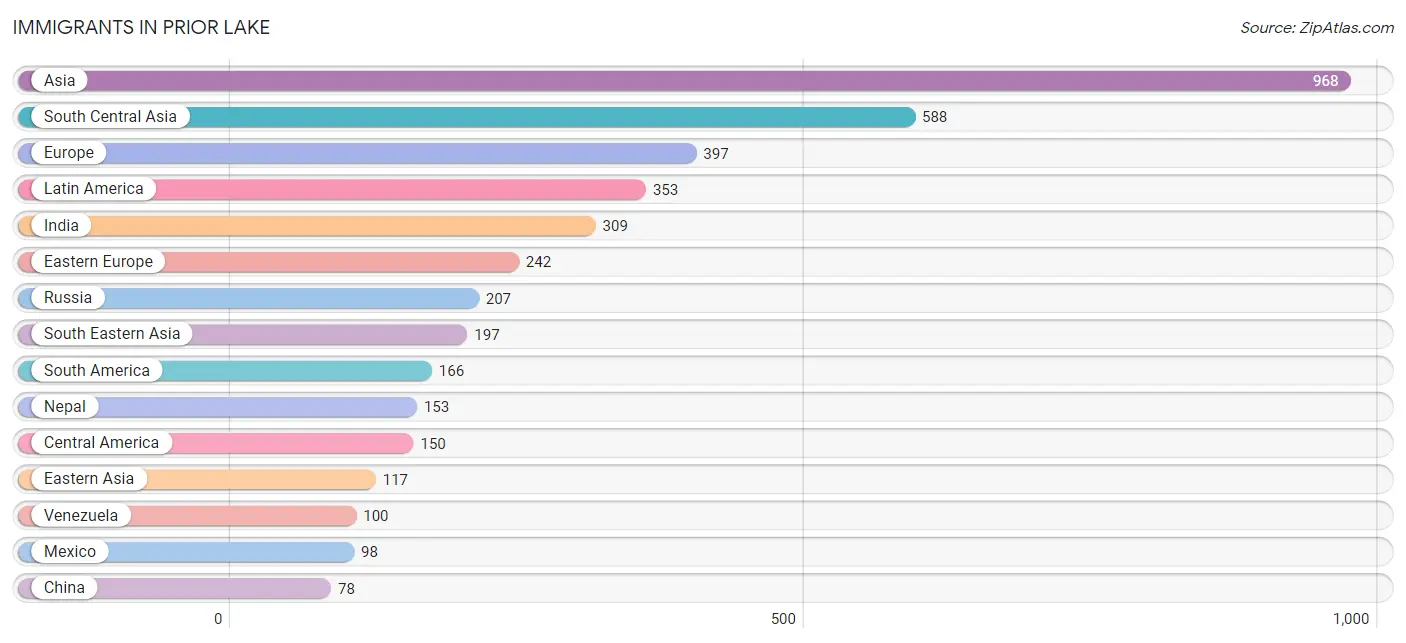
Immigrants in Prior Lake
The most numerous immigrant groups reported in Prior Lake came from Asia (968 | 3.5%), South Central Asia (588 | 2.1%), Europe (397 | 1.4%), Latin America (353 | 1.3%), and India (309 | 1.1%), together accounting for 9.5% of all Prior Lake residents.
| Immigration Origin | # Population | % Population |
| Africa | 29 | 0.1% |
| Argentina | 21 | 0.1% |
| Asia | 968 | 3.5% |
| Bosnia and Herzegovina | 12 | 0.0% |
| Brazil | 17 | 0.1% |
| Cambodia | 75 | 0.3% |
| Canada | 46 | 0.2% |
| Caribbean | 37 | 0.1% |
| Central America | 150 | 0.5% |
| China | 78 | 0.3% |
| Cuba | 37 | 0.1% |
| Eastern Africa | 27 | 0.1% |
| Eastern Asia | 117 | 0.4% |
| Eastern Europe | 242 | 0.9% |
| El Salvador | 2 | 0.0% |
| Eritrea | 1 | 0.0% |
| Europe | 397 | 1.4% |
| Germany | 73 | 0.3% |
| Guyana | 28 | 0.1% |
| Hong Kong | 7 | 0.0% |
| India | 309 | 1.1% |
| Italy | 27 | 0.1% |
| Kazakhstan | 68 | 0.3% |
| Kenya | 22 | 0.1% |
| Korea | 39 | 0.1% |
| Laos | 10 | 0.0% |
| Latin America | 353 | 1.3% |
| Mexico | 98 | 0.4% |
| Nepal | 153 | 0.5% |
| Nicaragua | 50 | 0.2% |
| Nigeria | 2 | 0.0% |
| Northern Europe | 29 | 0.1% |
| Philippines | 47 | 0.2% |
| Poland | 19 | 0.1% |
| Russia | 207 | 0.7% |
| Saudi Arabia | 18 | 0.1% |
| Scotland | 12 | 0.0% |
| Somalia | 4 | 0.0% |
| South America | 166 | 0.6% |
| South Central Asia | 588 | 2.1% |
| South Eastern Asia | 197 | 0.7% |
| Southern Europe | 53 | 0.2% |
| Spain | 26 | 0.1% |
| Taiwan | 13 | 0.1% |
| Turkey | 48 | 0.2% |
| Venezuela | 100 | 0.4% |
| Vietnam | 65 | 0.2% |
| Western Africa | 2 | 0.0% |
| Western Asia | 66 | 0.2% |
| Western Europe | 73 | 0.3% | View All 50 Rows |
Sex and Age in Prior Lake
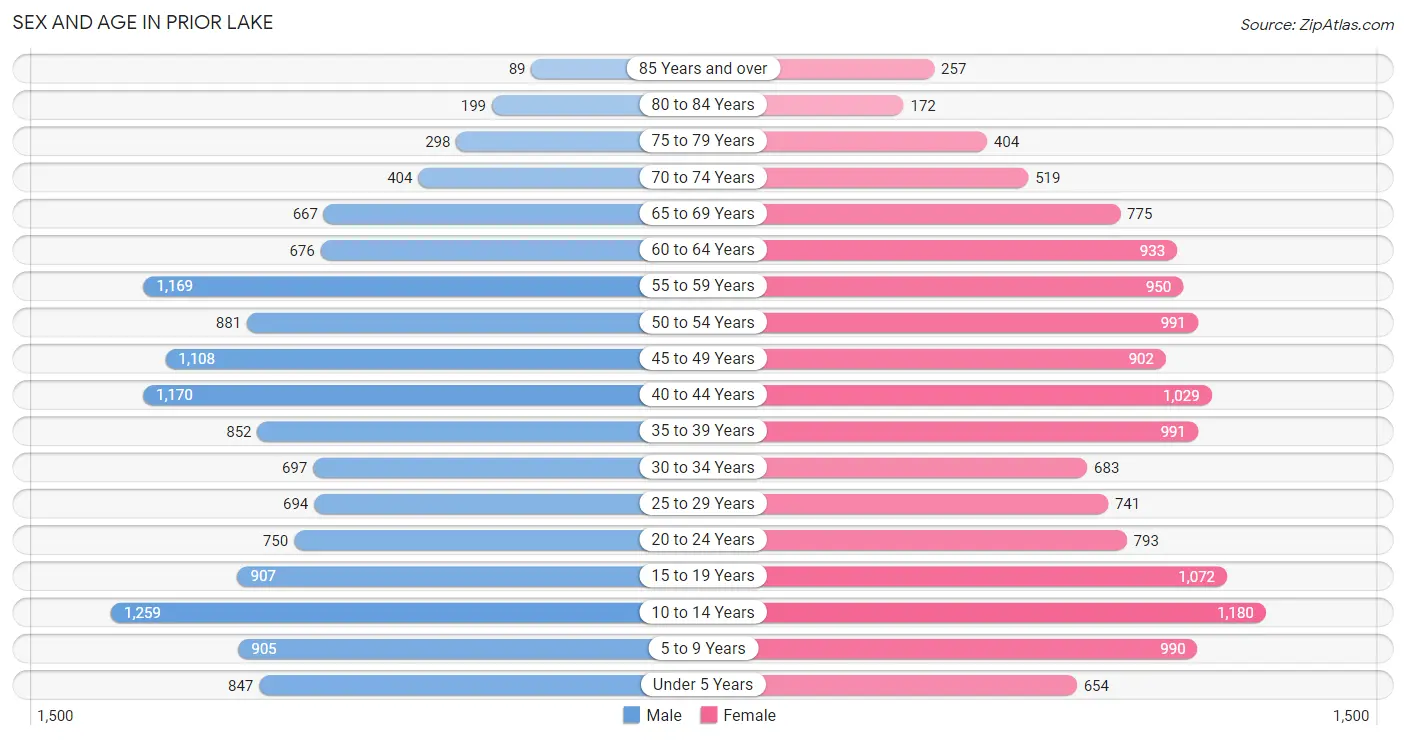
Sex and Age in Prior Lake
The most populous age groups in Prior Lake are 10 to 14 Years (1,259 | 9.3%) for men and 10 to 14 Years (1,180 | 8.4%) for women.
| Age Bracket | Male | Female |
| Under 5 Years | 847 (6.2%) | 654 (4.7%) |
| 5 to 9 Years | 905 (6.7%) | 990 (7.0%) |
| 10 to 14 Years | 1,259 (9.3%) | 1,180 (8.4%) |
| 15 to 19 Years | 907 (6.7%) | 1,072 (7.6%) |
| 20 to 24 Years | 750 (5.5%) | 793 (5.7%) |
| 25 to 29 Years | 694 (5.1%) | 741 (5.3%) |
| 30 to 34 Years | 697 (5.1%) | 683 (4.9%) |
| 35 to 39 Years | 852 (6.3%) | 991 (7.1%) |
| 40 to 44 Years | 1,170 (8.6%) | 1,029 (7.3%) |
| 45 to 49 Years | 1,108 (8.2%) | 902 (6.4%) |
| 50 to 54 Years | 881 (6.5%) | 991 (7.1%) |
| 55 to 59 Years | 1,169 (8.6%) | 950 (6.8%) |
| 60 to 64 Years | 676 (5.0%) | 933 (6.7%) |
| 65 to 69 Years | 667 (4.9%) | 775 (5.5%) |
| 70 to 74 Years | 404 (3.0%) | 519 (3.7%) |
| 75 to 79 Years | 298 (2.2%) | 404 (2.9%) |
| 80 to 84 Years | 199 (1.5%) | 172 (1.2%) |
| 85 Years and over | 89 (0.7%) | 257 (1.8%) |
| Total | 13,572 (100.0%) | 14,036 (100.0%) |
Families and Households in Prior Lake
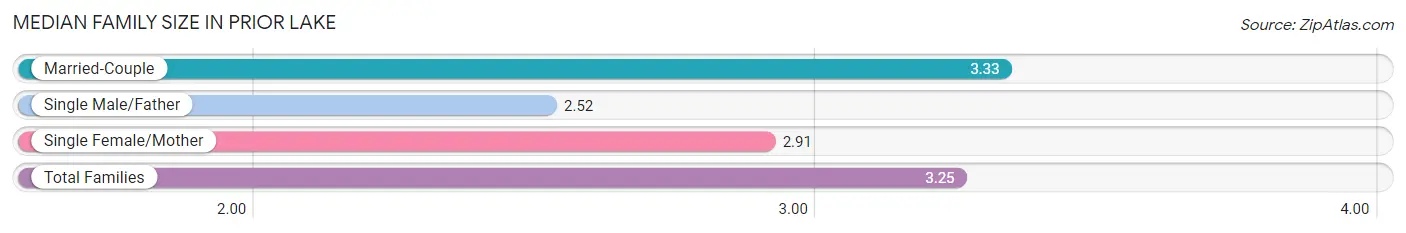
Median Family Size in Prior Lake
The median family size in Prior Lake is 3.25 persons per family, with married-couple families (6,364 | 86.6%) accounting for the largest median family size of 3.33 persons per family. On the other hand, single male/father families (397 | 5.4%) represent the smallest median family size with 2.52 persons per family.
| Family Type | # Families | Family Size |
| Married-Couple | 6,364 (86.6%) | 3.33 |
| Single Male/Father | 397 (5.4%) | 2.52 |
| Single Female/Mother | 587 (8.0%) | 2.91 |
| Total Families | 7,348 (100.0%) | 3.25 |
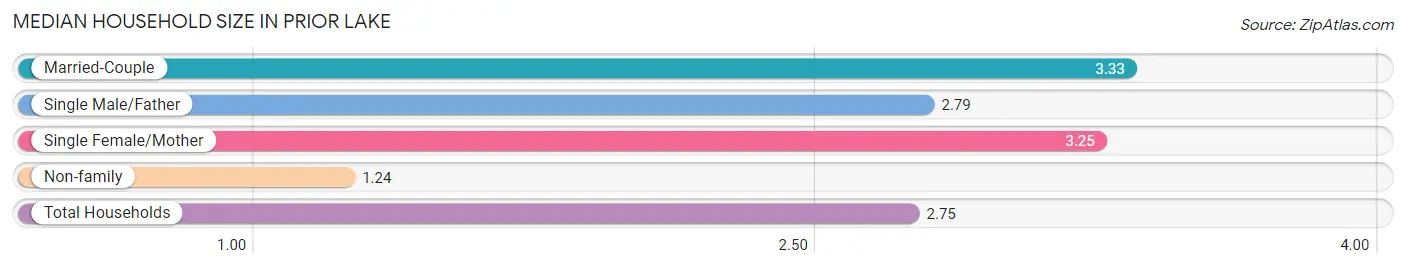
Median Household Size in Prior Lake
The median household size in Prior Lake is 2.75 persons per household, with married-couple households (6,364 | 63.5%) accounting for the largest median household size of 3.33 persons per household. non-family households (2,673 | 26.7%) represent the smallest median household size with 1.24 persons per household.
| Household Type | # Households | Household Size |
| Married-Couple | 6,364 (63.5%) | 3.33 |
| Single Male/Father | 397 (4.0%) | 2.79 |
| Single Female/Mother | 587 (5.9%) | 3.25 |
| Non-family | 2,673 (26.7%) | 1.24 |
| Total Households | 10,021 (100.0%) | 2.75 |
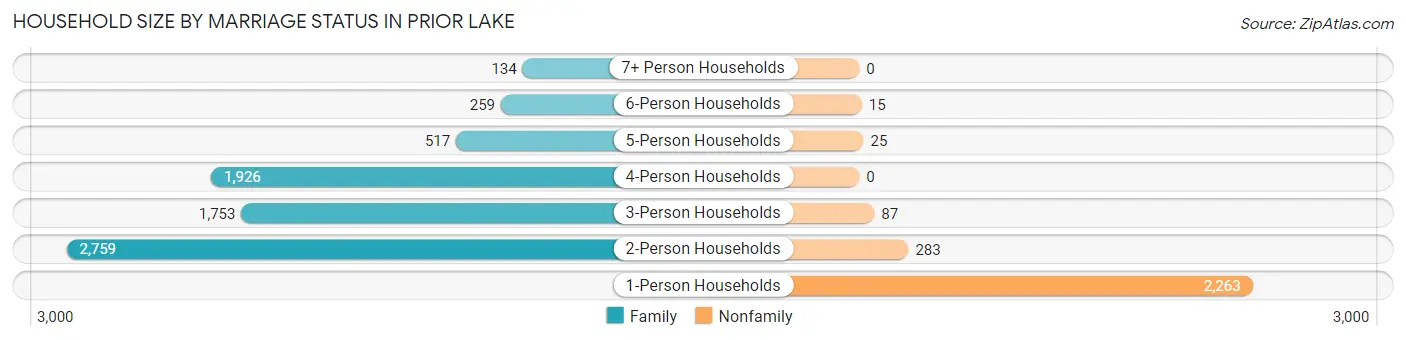
Household Size by Marriage Status in Prior Lake
Out of a total of 10,021 households in Prior Lake, 7,348 (73.3%) are family households, while 2,673 (26.7%) are nonfamily households. The most numerous type of family households are 2-person households, comprising 2,759, and the most common type of nonfamily households are 1-person households, comprising 2,263.
| Household Size | Family Households | Nonfamily Households |
| 1-Person Households | - | 2,263 (22.6%) |
| 2-Person Households | 2,759 (27.5%) | 283 (2.8%) |
| 3-Person Households | 1,753 (17.5%) | 87 (0.9%) |
| 4-Person Households | 1,926 (19.2%) | 0 (0.0%) |
| 5-Person Households | 517 (5.2%) | 25 (0.3%) |
| 6-Person Households | 259 (2.6%) | 15 (0.2%) |
| 7+ Person Households | 134 (1.3%) | 0 (0.0%) |
| Total | 7,348 (73.3%) | 2,673 (26.7%) |
Female Fertility in Prior Lake
Fertility by Age in Prior Lake
Average fertility rate in Prior Lake is 35.0 births per 1,000 women. Women in the age bracket of 20 to 34 years have the highest fertility rate with 82.0 births per 1,000 women. Women in the age bracket of 20 to 34 years acount for 81.2% of all women with births.
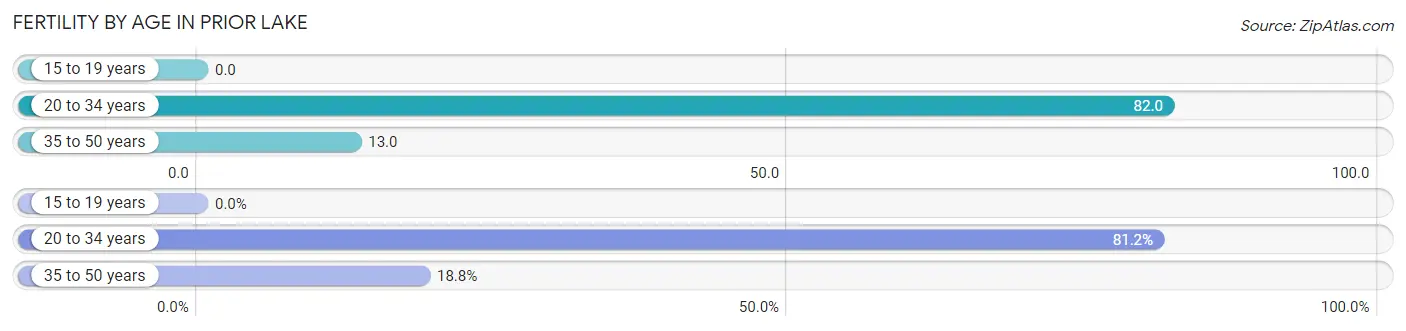
| Age Bracket | Women with Births | Births / 1,000 Women |
| 15 to 19 years | 0 (0.0%) | 0.0 |
| 20 to 34 years | 181 (81.2%) | 82.0 |
| 35 to 50 years | 42 (18.8%) | 13.0 |
| Total | 223 (100.0%) | 35.0 |
Fertility by Age by Marriage Status in Prior Lake
90.1% of women with births (223) in Prior Lake are married. The highest percentage of unmarried women with births falls into 20 to 34 years age bracket with 12.1% of them unmarried at the time of birth, while the lowest percentage of unmarried women with births belong to 35 to 50 years age bracket with 0.0% of them unmarried.
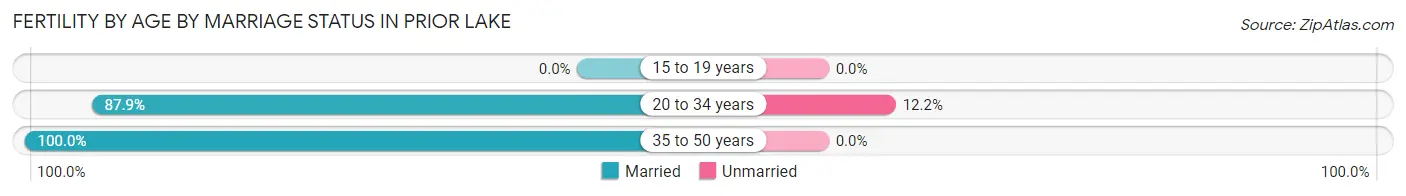
| Age Bracket | Married | Unmarried |
| 15 to 19 years | 0 (0.0%) | 0 (0.0%) |
| 20 to 34 years | 159 (87.8%) | 22 (12.1%) |
| 35 to 50 years | 42 (100.0%) | 0 (0.0%) |
| Total | 201 (90.1%) | 22 (9.9%) |
Fertility by Education in Prior Lake
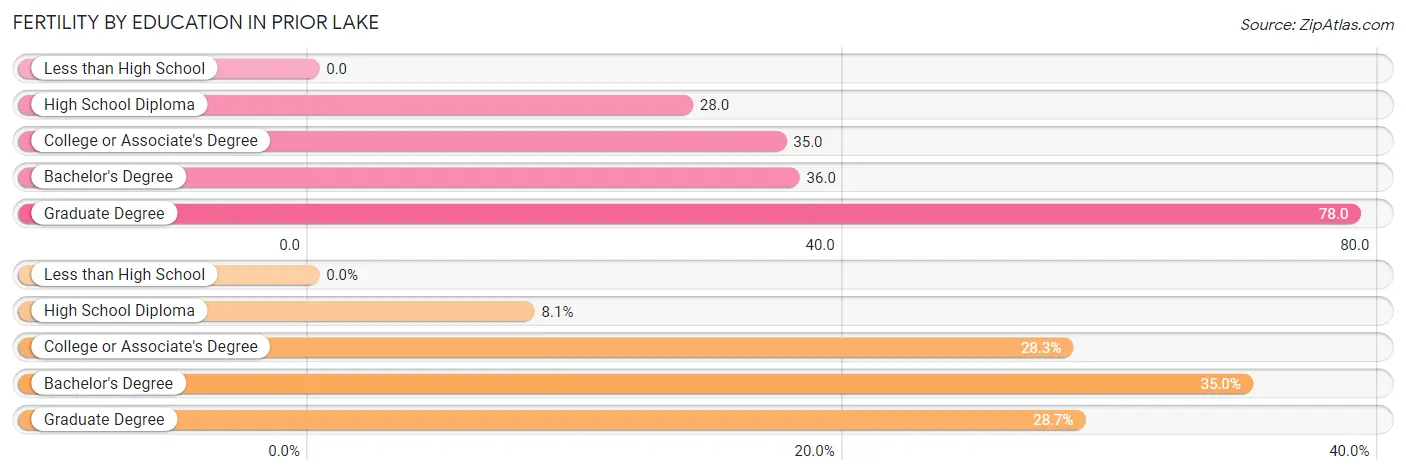
| Educational Attainment | Women with Births | Births / 1,000 Women |
| Less than High School | 0 (0.0%) | 0.0 |
| High School Diploma | 18 (8.1%) | 28.0 |
| College or Associate's Degree | 63 (28.2%) | 35.0 |
| Bachelor's Degree | 78 (35.0%) | 36.0 |
| Graduate Degree | 64 (28.7%) | 78.0 |
| Total | 223 (100.0%) | 35.0 |
Fertility by Education by Marriage Status in Prior Lake
9.9% of women with births in Prior Lake are unmarried. Women with the educational attainment of high school diploma are most likely to be married with 100.0% of them married at childbirth, while women with the educational attainment of college or associate's degree are least likely to be married with 34.9% of them unmarried at childbirth.
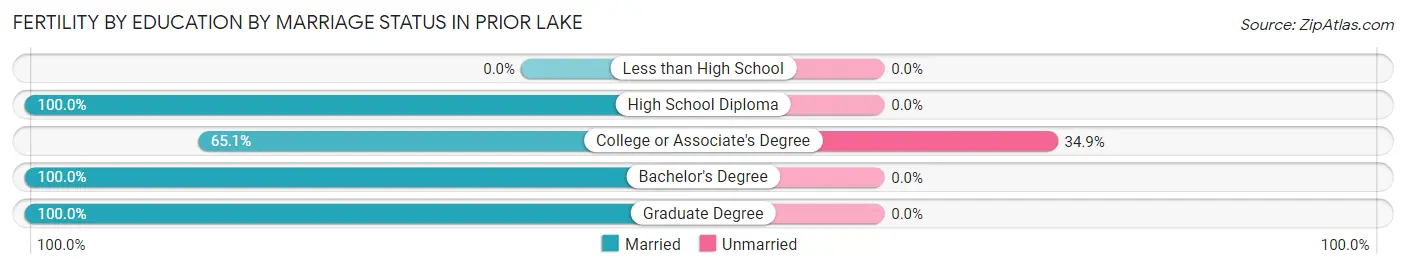
| Educational Attainment | Married | Unmarried |
| Less than High School | 0 (0.0%) | 0 (0.0%) |
| High School Diploma | 18 (100.0%) | 0 (0.0%) |
| College or Associate's Degree | 41 (65.1%) | 22 (34.9%) |
| Bachelor's Degree | 78 (100.0%) | 0 (0.0%) |
| Graduate Degree | 64 (100.0%) | 0 (0.0%) |
| Total | 201 (90.1%) | 22 (9.9%) |
Income in Prior Lake
Income Overview in Prior Lake
Per Capita Income in Prior Lake is $62,432, while median incomes of families and households are $147,520 and $129,539 respectively.
| Characteristic | Number | Measure |
| Per Capita Income | 27,608 | $62,432 |
| Median Family Income | 7,348 | $147,520 |
| Mean Family Income | 7,348 | $187,057 |
| Median Household Income | 10,021 | $129,539 |
| Mean Household Income | 10,021 | $167,740 |
| Income Deficit | 7,348 | $0 |
| Wage / Income Gap (%) | 27,608 | 28.44% |
| Wage / Income Gap ($) | 27,608 | 71.56¢ per $1 |
| Gini / Inequality Index | 27,608 | 0.44 |
Earnings by Sex in Prior Lake
Average Earnings in Prior Lake are $63,557, $72,315 for men and $51,749 for women, a difference of 28.4%.
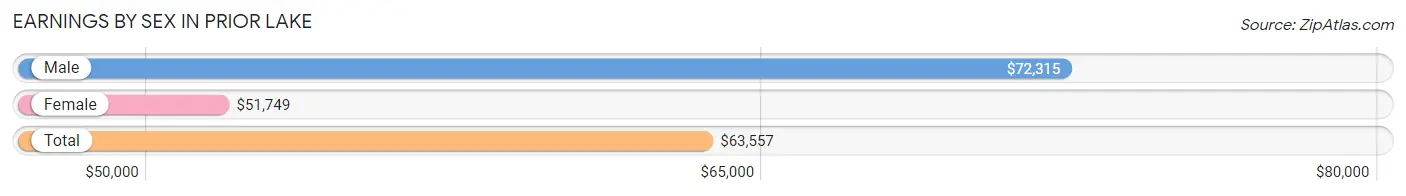
| Sex | Number | Average Earnings |
| Male | 8,661 (52.1%) | $72,315 |
| Female | 7,961 (47.9%) | $51,749 |
| Total | 16,622 (100.0%) | $63,557 |
Earnings by Sex by Income Bracket in Prior Lake
The most common earnings brackets in Prior Lake are $100,000+ for men (2,806 | 32.4%) and $100,000+ for women (1,603 | 20.1%).
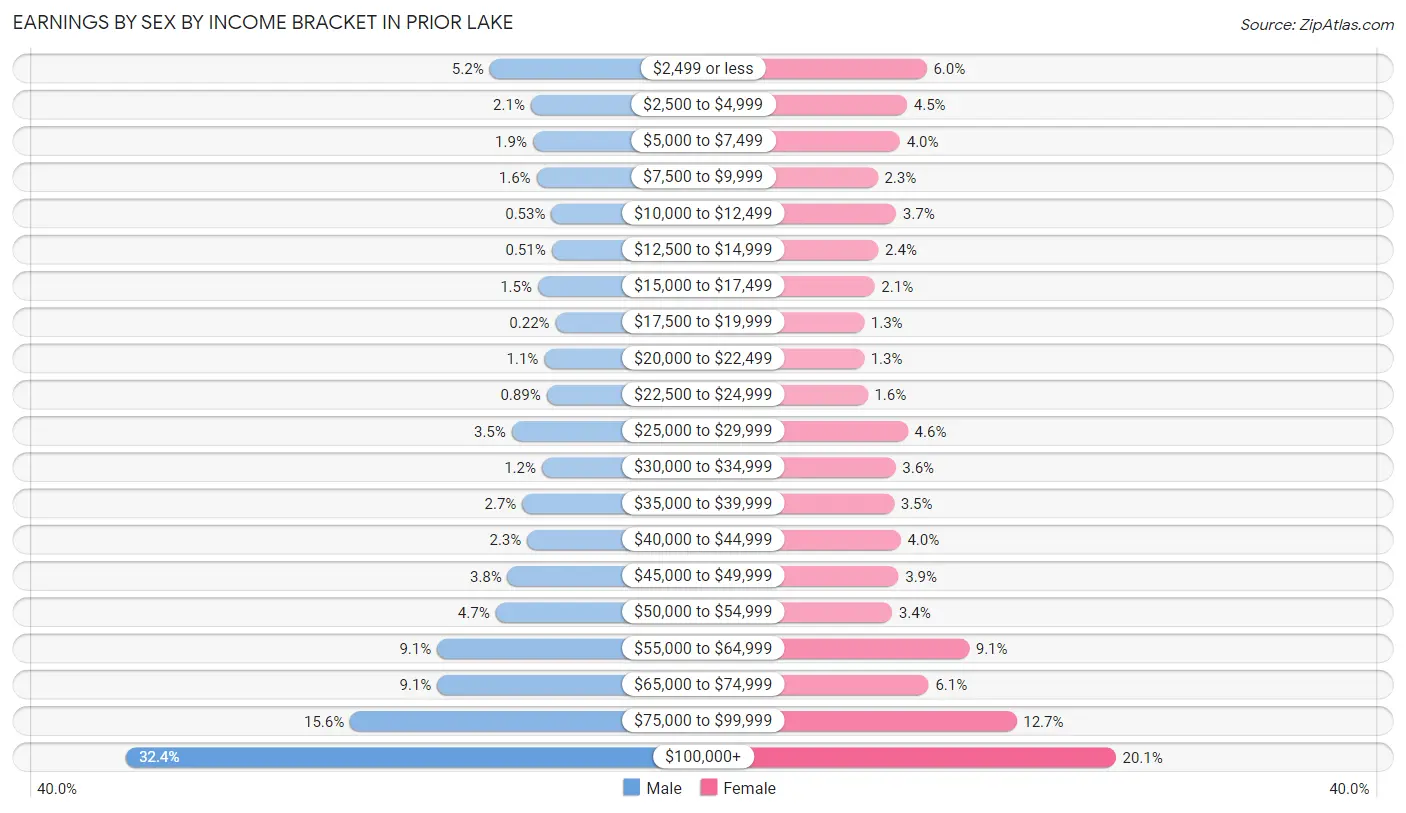
| Income | Male | Female |
| $2,499 or less | 447 (5.2%) | 475 (6.0%) |
| $2,500 to $4,999 | 179 (2.1%) | 358 (4.5%) |
| $5,000 to $7,499 | 166 (1.9%) | 316 (4.0%) |
| $7,500 to $9,999 | 142 (1.6%) | 183 (2.3%) |
| $10,000 to $12,499 | 46 (0.5%) | 293 (3.7%) |
| $12,500 to $14,999 | 44 (0.5%) | 187 (2.4%) |
| $15,000 to $17,499 | 133 (1.5%) | 165 (2.1%) |
| $17,500 to $19,999 | 19 (0.2%) | 102 (1.3%) |
| $20,000 to $22,499 | 92 (1.1%) | 101 (1.3%) |
| $22,500 to $24,999 | 77 (0.9%) | 123 (1.5%) |
| $25,000 to $29,999 | 303 (3.5%) | 363 (4.6%) |
| $30,000 to $34,999 | 107 (1.2%) | 290 (3.6%) |
| $35,000 to $39,999 | 235 (2.7%) | 280 (3.5%) |
| $40,000 to $44,999 | 203 (2.3%) | 320 (4.0%) |
| $45,000 to $49,999 | 329 (3.8%) | 307 (3.9%) |
| $50,000 to $54,999 | 408 (4.7%) | 269 (3.4%) |
| $55,000 to $64,999 | 787 (9.1%) | 728 (9.1%) |
| $65,000 to $74,999 | 786 (9.1%) | 487 (6.1%) |
| $75,000 to $99,999 | 1,352 (15.6%) | 1,011 (12.7%) |
| $100,000+ | 2,806 (32.4%) | 1,603 (20.1%) |
| Total | 8,661 (100.0%) | 7,961 (100.0%) |
Earnings by Sex by Educational Attainment in Prior Lake
Average earnings in Prior Lake are $82,054 for men and $59,576 for women, a difference of 27.4%. Men with an educational attainment of bachelor's degree enjoy the highest average annual earnings of $115,299, while those with less than high school education earn the least with $46,563. Women with an educational attainment of graduate degree earn the most with the average annual earnings of $97,031, while those with high school diploma education have the smallest earnings of $29,948.
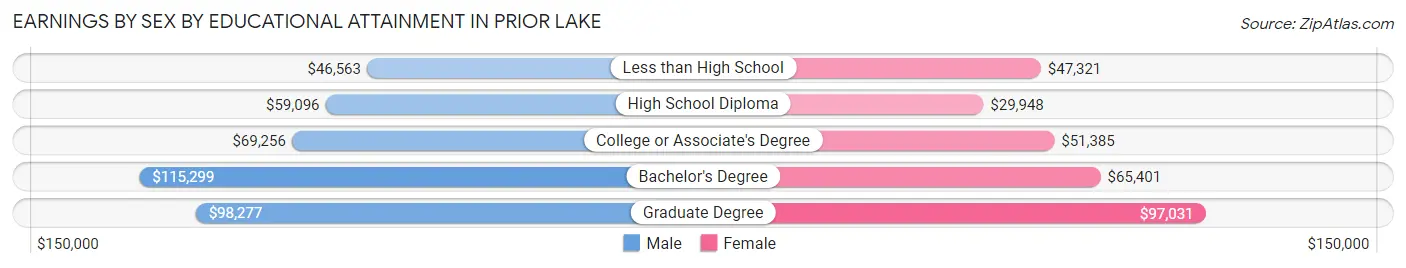
| Educational Attainment | Male Income | Female Income |
| Less than High School | $46,563 | $47,321 |
| High School Diploma | $59,096 | $29,948 |
| College or Associate's Degree | $69,256 | $51,385 |
| Bachelor's Degree | $115,299 | $65,401 |
| Graduate Degree | $98,277 | $97,031 |
| Total | $82,054 | $59,576 |
Family Income in Prior Lake
Family Income Brackets in Prior Lake
According to the Prior Lake family income data, there are 2,395 families falling into the $200,000+ income range, which is the most common income bracket and makes up 32.6% of all families. Conversely, the $10,000 to $14,999 income bracket is the least frequent group with only 7 families (0.1%) belonging to this category.
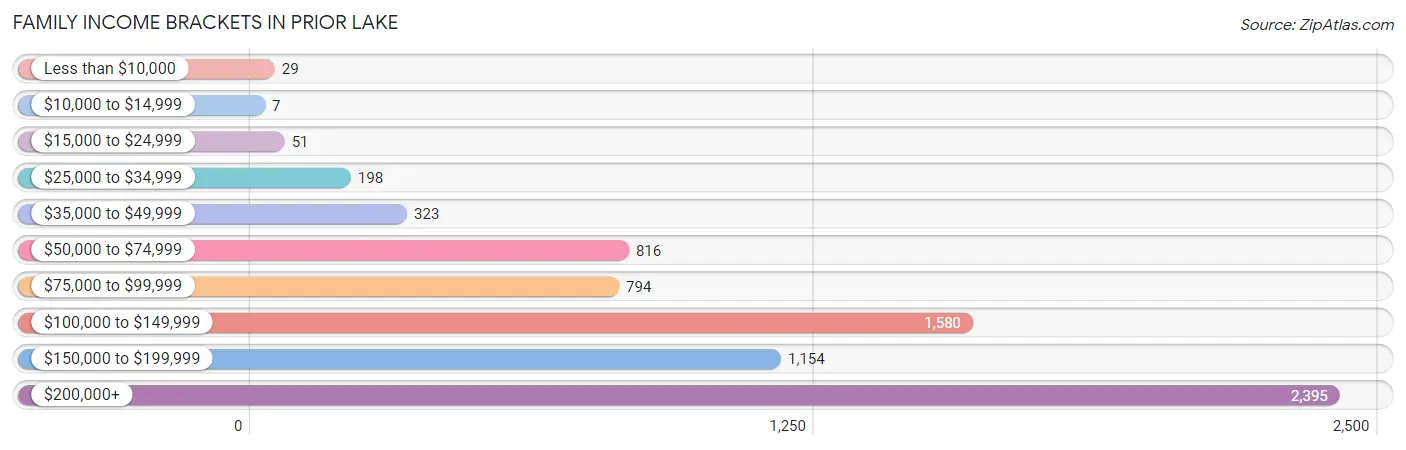
| Income Bracket | # Families | % Families |
| Less than $10,000 | 29 | 0.4% |
| $10,000 to $14,999 | 7 | 0.1% |
| $15,000 to $24,999 | 51 | 0.7% |
| $25,000 to $34,999 | 198 | 2.7% |
| $35,000 to $49,999 | 323 | 4.4% |
| $50,000 to $74,999 | 816 | 11.1% |
| $75,000 to $99,999 | 794 | 10.8% |
| $100,000 to $149,999 | 1,580 | 21.5% |
| $150,000 to $199,999 | 1,154 | 15.7% |
| $200,000+ | 2,395 | 32.6% |
Family Income by Famaliy Size in Prior Lake
7+ person families (134 | 1.8%) account for the highest median family income in Prior Lake with $250,001 per family, while 2-person families (2,940 | 40.0%) have the highest median income of $53,148 per family member.
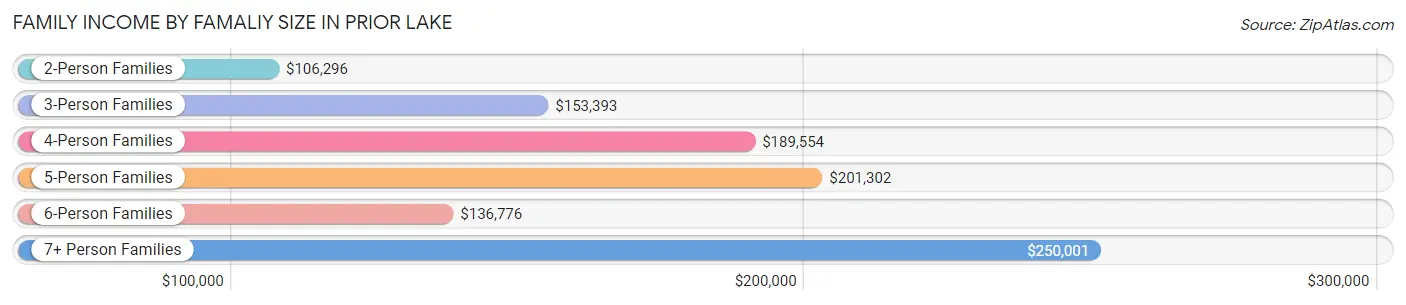
| Income Bracket | # Families | Median Income |
| 2-Person Families | 2,940 (40.0%) | $106,296 |
| 3-Person Families | 1,624 (22.1%) | $153,393 |
| 4-Person Families | 1,929 (26.3%) | $189,554 |
| 5-Person Families | 475 (6.5%) | $201,302 |
| 6-Person Families | 246 (3.4%) | $136,776 |
| 7+ Person Families | 134 (1.8%) | $250,001 |
| Total | 7,348 (100.0%) | $147,520 |
Family Income by Number of Earners in Prior Lake
The median family income in Prior Lake is $147,520, with families comprising 3+ earners (1,268) having the highest median family income of $218,750, while families with no earners (771) have the lowest median family income of $74,938, accounting for 17.3% and 10.5% of families, respectively.
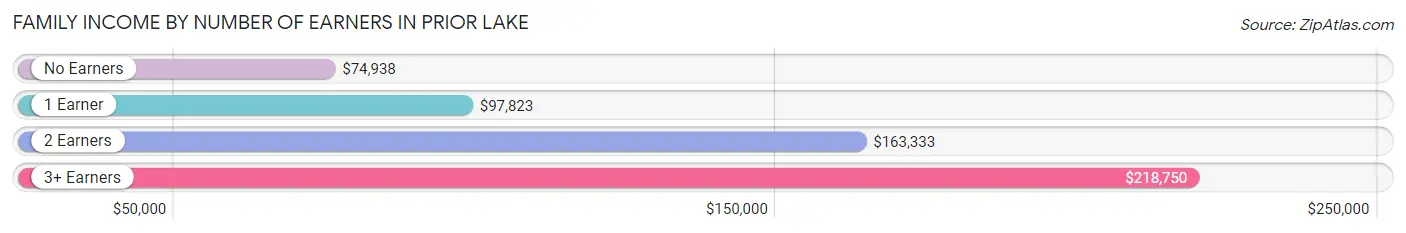
| Number of Earners | # Families | Median Income |
| No Earners | 771 (10.5%) | $74,938 |
| 1 Earner | 1,499 (20.4%) | $97,823 |
| 2 Earners | 3,810 (51.8%) | $163,333 |
| 3+ Earners | 1,268 (17.3%) | $218,750 |
| Total | 7,348 (100.0%) | $147,520 |
Household Income in Prior Lake
Household Income Brackets in Prior Lake
With 2,706 households falling in the category, the $200,000+ income range is the most frequent in Prior Lake, accounting for 27.0% of all households. In contrast, only 140 households (1.4%) fall into the $10,000 to $14,999 income bracket, making it the least populous group.
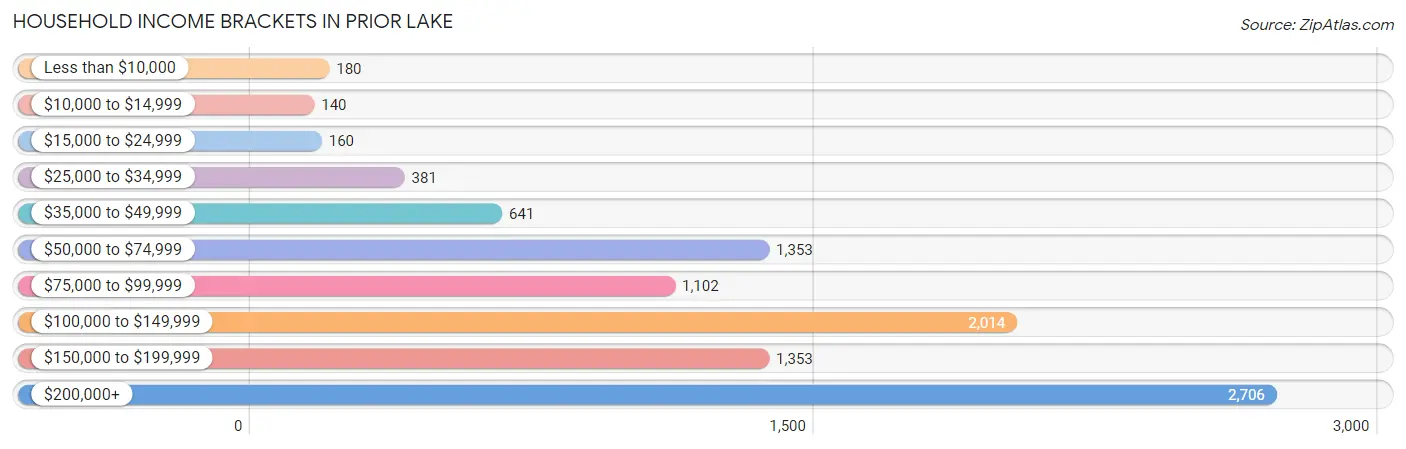
| Income Bracket | # Households | % Households |
| Less than $10,000 | 180 | 1.8% |
| $10,000 to $14,999 | 140 | 1.4% |
| $15,000 to $24,999 | 160 | 1.6% |
| $25,000 to $34,999 | 381 | 3.8% |
| $35,000 to $49,999 | 641 | 6.4% |
| $50,000 to $74,999 | 1,353 | 13.5% |
| $75,000 to $99,999 | 1,102 | 11.0% |
| $100,000 to $149,999 | 2,014 | 20.1% |
| $150,000 to $199,999 | 1,353 | 13.5% |
| $200,000+ | 2,706 | 27.0% |
Household Income by Householder Age in Prior Lake
The median household income in Prior Lake is $129,539, with the highest median household income of $150,636 found in the 45 to 64 years age bracket for the primary householder. A total of 4,215 households (42.1%) fall into this category. Meanwhile, the 65+ years age bracket for the primary householder has the lowest median household income of $66,558, with 2,358 households (23.5%) in this group.
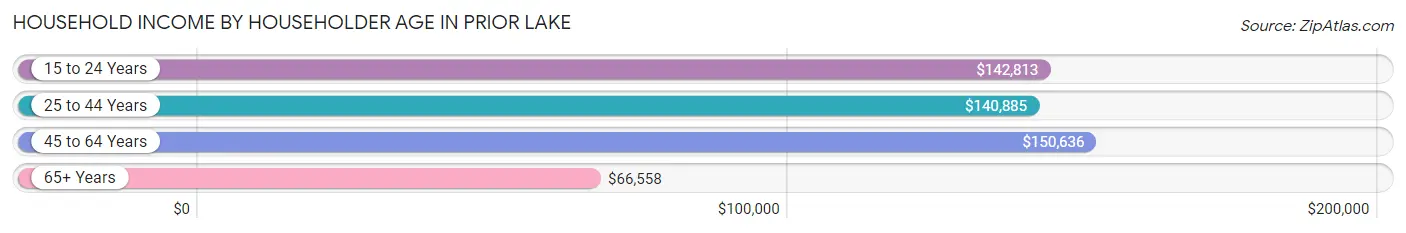
| Income Bracket | # Households | Median Income |
| 15 to 24 Years | 158 (1.6%) | $142,813 |
| 25 to 44 Years | 3,290 (32.8%) | $140,885 |
| 45 to 64 Years | 4,215 (42.1%) | $150,636 |
| 65+ Years | 2,358 (23.5%) | $66,558 |
| Total | 10,021 (100.0%) | $129,539 |
Poverty in Prior Lake
Income Below Poverty by Sex and Age in Prior Lake
With 1.3% poverty level for males and 3.6% for females among the residents of Prior Lake, 5 year old males and 75 year old and over females are the most vulnerable to poverty, with 13 males (7.5%) and 95 females (11.7%) in their respective age groups living below the poverty level.
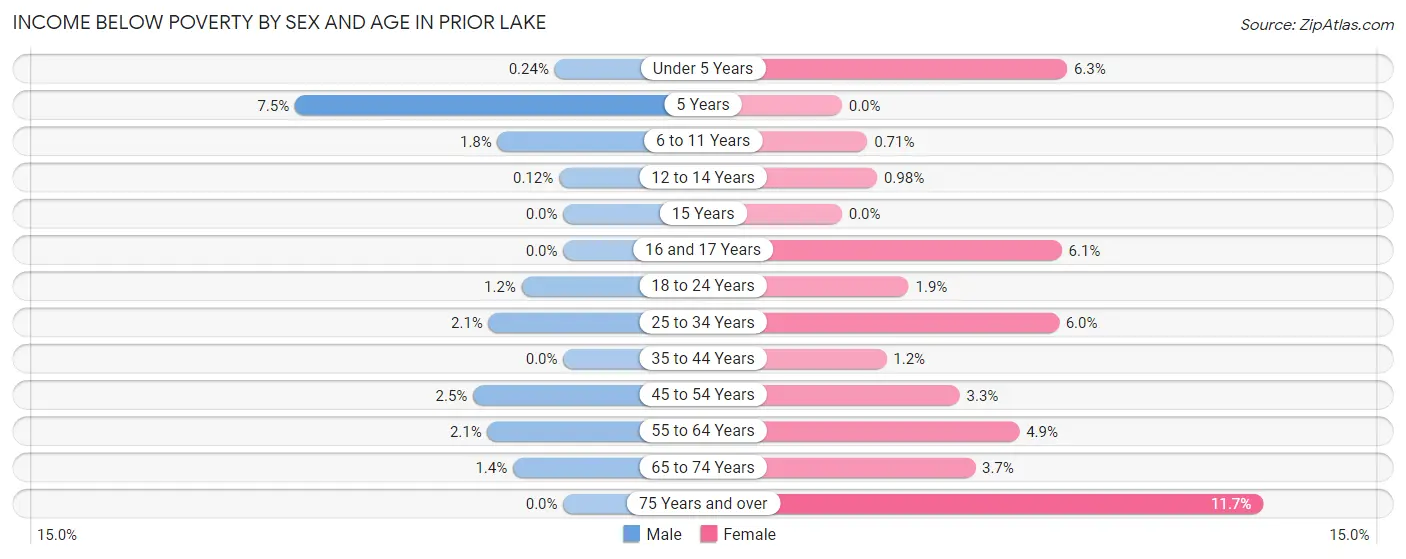
| Age Bracket | Male | Female |
| Under 5 Years | 2 (0.2%) | 41 (6.3%) |
| 5 Years | 13 (7.5%) | 0 (0.0%) |
| 6 to 11 Years | 20 (1.8%) | 9 (0.7%) |
| 12 to 14 Years | 1 (0.1%) | 7 (1.0%) |
| 15 Years | 0 (0.0%) | 0 (0.0%) |
| 16 and 17 Years | 0 (0.0%) | 23 (6.1%) |
| 18 to 24 Years | 13 (1.2%) | 20 (1.9%) |
| 25 to 34 Years | 29 (2.1%) | 86 (6.0%) |
| 35 to 44 Years | 0 (0.0%) | 25 (1.2%) |
| 45 to 54 Years | 50 (2.5%) | 62 (3.3%) |
| 55 to 64 Years | 39 (2.1%) | 93 (4.9%) |
| 65 to 74 Years | 15 (1.4%) | 48 (3.7%) |
| 75 Years and over | 0 (0.0%) | 95 (11.7%) |
| Total | 182 (1.3%) | 509 (3.6%) |
Income Above Poverty by Sex and Age in Prior Lake
According to the poverty statistics in Prior Lake, males aged 15 years and females aged 5 years are the age groups that are most secure financially, with 100.0% of males and 100.0% of females in these age groups living above the poverty line.
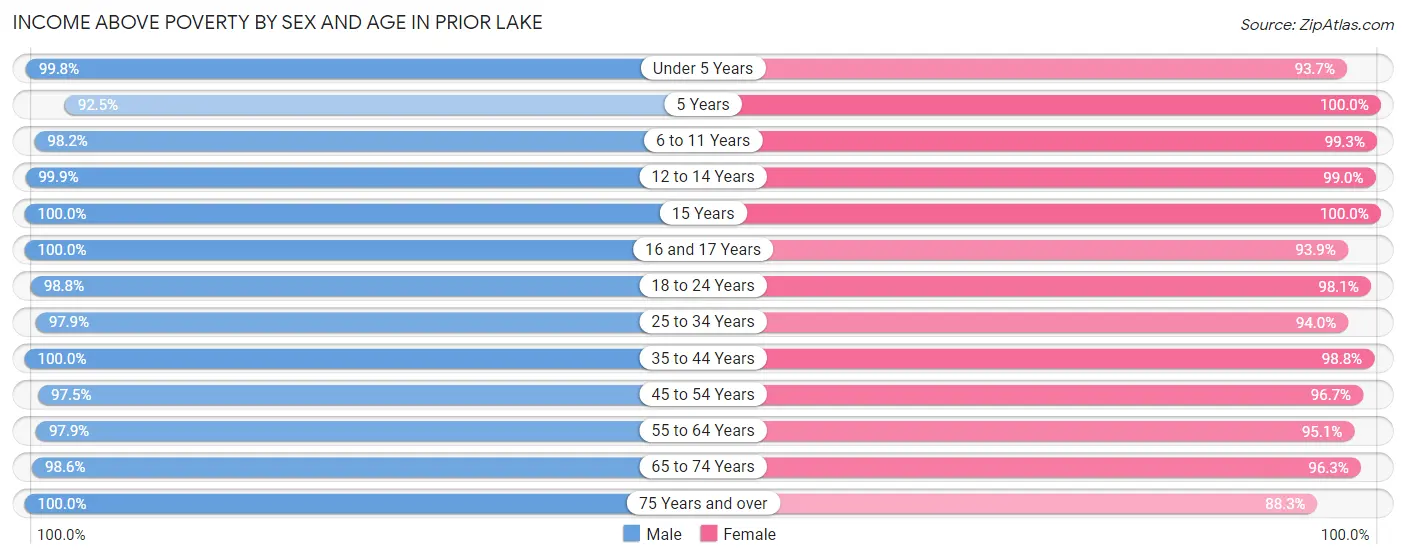
| Age Bracket | Male | Female |
| Under 5 Years | 843 (99.8%) | 613 (93.7%) |
| 5 Years | 161 (92.5%) | 192 (100.0%) |
| 6 to 11 Years | 1,073 (98.2%) | 1,253 (99.3%) |
| 12 to 14 Years | 820 (99.9%) | 708 (99.0%) |
| 15 Years | 165 (100.0%) | 410 (100.0%) |
| 16 and 17 Years | 368 (100.0%) | 353 (93.9%) |
| 18 to 24 Years | 1,109 (98.8%) | 1,057 (98.1%) |
| 25 to 34 Years | 1,362 (97.9%) | 1,338 (94.0%) |
| 35 to 44 Years | 2,022 (100.0%) | 1,995 (98.8%) |
| 45 to 54 Years | 1,939 (97.5%) | 1,831 (96.7%) |
| 55 to 64 Years | 1,806 (97.9%) | 1,790 (95.1%) |
| 65 to 74 Years | 1,054 (98.6%) | 1,246 (96.3%) |
| 75 Years and over | 562 (100.0%) | 715 (88.3%) |
| Total | 13,284 (98.7%) | 13,501 (96.4%) |
Income Below Poverty Among Married-Couple Families in Prior Lake
The poverty statistics for married-couple families in Prior Lake show that 0.5% or 29 of the total 6,364 families live below the poverty line. Families with 5 or more children have the highest poverty rate of 23.5%, comprising of 8 families. On the other hand, families with 3 or 4 children have the lowest poverty rate of 0.0%, which includes 0 families.
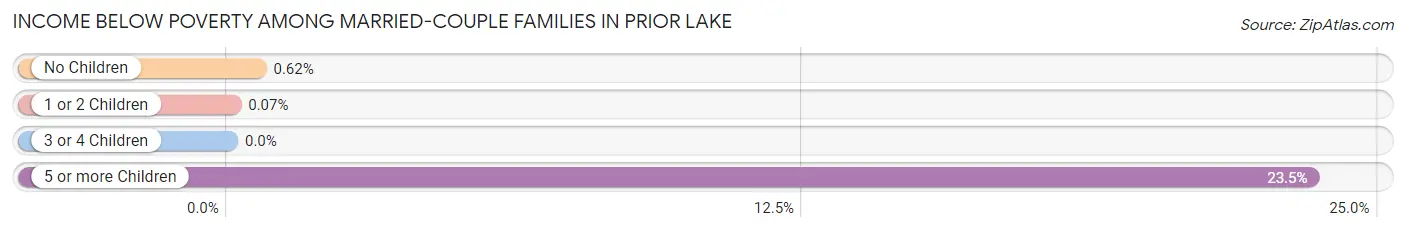
| Children | Above Poverty | Below Poverty |
| No Children | 3,043 (99.4%) | 19 (0.6%) |
| 1 or 2 Children | 2,773 (99.9%) | 2 (0.1%) |
| 3 or 4 Children | 493 (100.0%) | 0 (0.0%) |
| 5 or more Children | 26 (76.5%) | 8 (23.5%) |
| Total | 6,335 (99.5%) | 29 (0.5%) |
Income Below Poverty Among Single-Parent Households in Prior Lake
According to the poverty data in Prior Lake, 0.5% or 2 single-father households and 7.7% or 45 single-mother households are living below the poverty line. Among single-father households, those with 1 or 2 children have the highest poverty rate, with 2 households (0.8%) experiencing poverty. Likewise, among single-mother households, those with 3 or 4 children have the highest poverty rate, with 12 households (37.5%) falling below the poverty line.
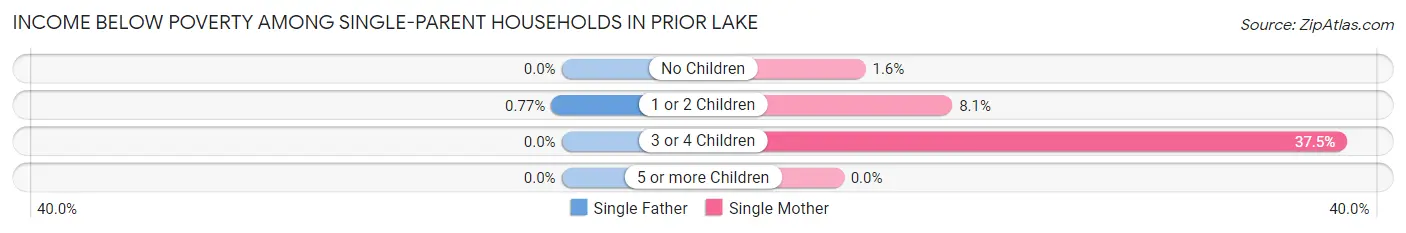
| Children | Single Father | Single Mother |
| No Children | 0 (0.0%) | 3 (1.6%) |
| 1 or 2 Children | 2 (0.8%) | 30 (8.1%) |
| 3 or 4 Children | 0 (0.0%) | 12 (37.5%) |
| 5 or more Children | 0 (0.0%) | 0 (0.0%) |
| Total | 2 (0.5%) | 45 (7.7%) |
Income Below Poverty Among Married-Couple vs Single-Parent Households in Prior Lake
The poverty data for Prior Lake shows that 29 of the married-couple family households (0.5%) and 47 of the single-parent households (4.8%) are living below the poverty level. Within the married-couple family households, those with 5 or more children have the highest poverty rate, with 8 households (23.5%) falling below the poverty line. Among the single-parent households, those with 3 or 4 children have the highest poverty rate, with 12 household (25.0%) living below poverty.
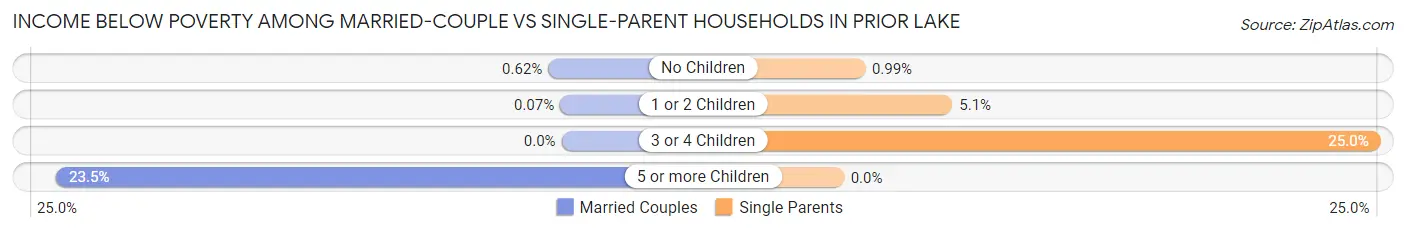
| Children | Married-Couple Families | Single-Parent Households |
| No Children | 19 (0.6%) | 3 (1.0%) |
| 1 or 2 Children | 2 (0.1%) | 32 (5.1%) |
| 3 or 4 Children | 0 (0.0%) | 12 (25.0%) |
| 5 or more Children | 8 (23.5%) | 0 (0.0%) |
| Total | 29 (0.5%) | 47 (4.8%) |
Employment Characteristics in Prior Lake
Employment by Class of Employer in Prior Lake
Among the 15,347 employed individuals in Prior Lake, private company employees (10,954 | 71.4%), not-for-profit organizations (1,271 | 8.3%), and self-employed (not incorporated) (944 | 6.1%) make up the most common classes of employment.
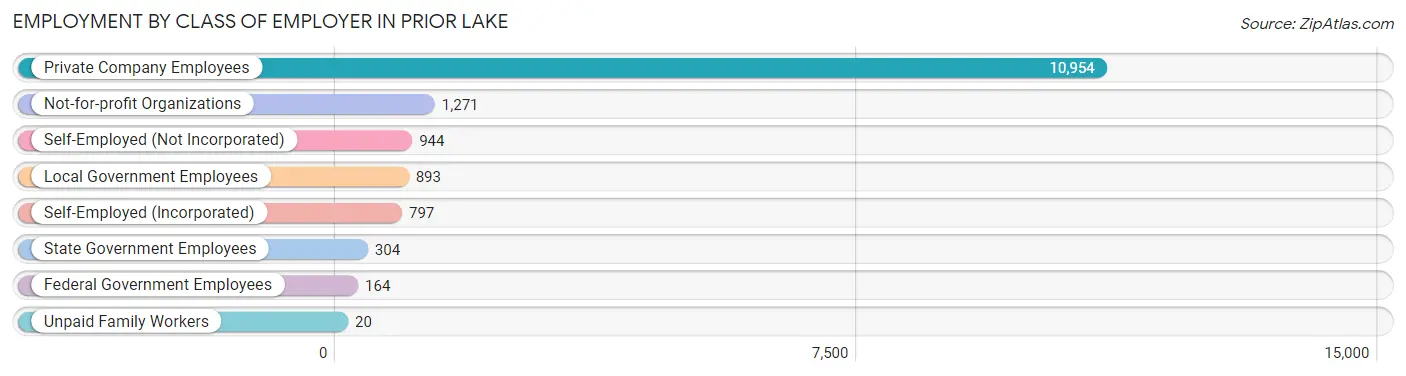
| Employer Class | # Employees | % Employees |
| Private Company Employees | 10,954 | 71.4% |
| Self-Employed (Incorporated) | 797 | 5.2% |
| Self-Employed (Not Incorporated) | 944 | 6.1% |
| Not-for-profit Organizations | 1,271 | 8.3% |
| Local Government Employees | 893 | 5.8% |
| State Government Employees | 304 | 2.0% |
| Federal Government Employees | 164 | 1.1% |
| Unpaid Family Workers | 20 | 0.1% |
| Total | 15,347 | 100.0% |
Employment Status by Age in Prior Lake
According to the labor force statistics for Prior Lake, out of the total population over 16 years of age (21,197), 74.9% or 15,877 individuals are in the labor force, with 1.5% or 238 of them unemployed. The age group with the highest labor force participation rate is 30 to 34 years, with 94.2% or 1,300 individuals in the labor force. Within the labor force, the 16 to 19 years age range has the highest percentage of unemployed individuals, with 5.0% or 38 of them being unemployed.
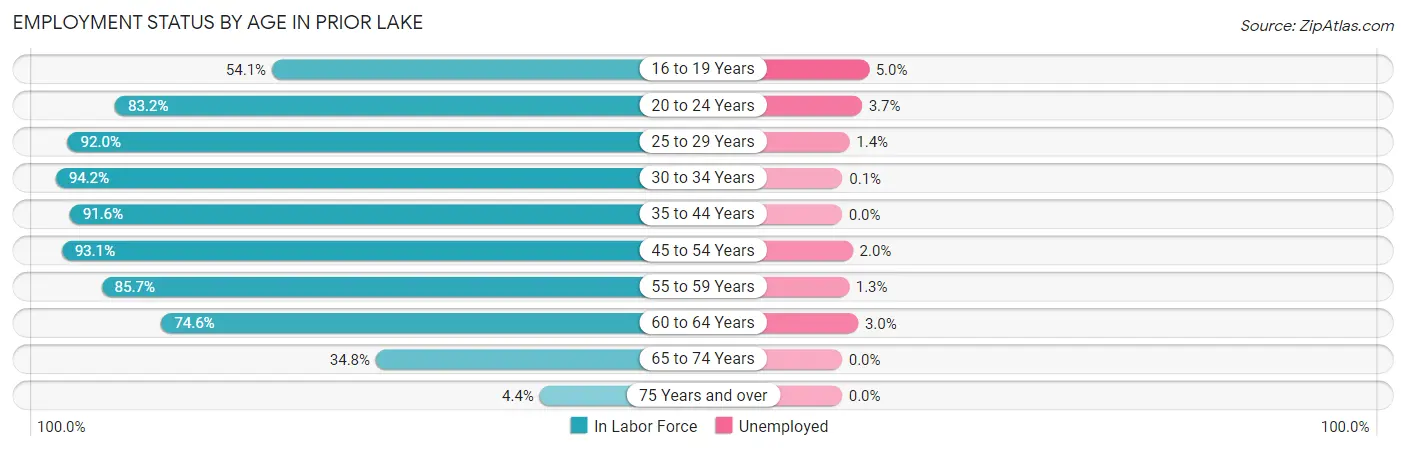
| Age Bracket | In Labor Force | Unemployed |
| 16 to 19 Years | 759 (54.1%) | 38 (5.0%) |
| 20 to 24 Years | 1,284 (83.2%) | 48 (3.7%) |
| 25 to 29 Years | 1,320 (92.0%) | 18 (1.4%) |
| 30 to 34 Years | 1,300 (94.2%) | 1 (0.1%) |
| 35 to 44 Years | 3,702 (91.6%) | 0 (0.0%) |
| 45 to 54 Years | 3,614 (93.1%) | 72 (2.0%) |
| 55 to 59 Years | 1,816 (85.7%) | 24 (1.3%) |
| 60 to 64 Years | 1,200 (74.6%) | 36 (3.0%) |
| 65 to 74 Years | 823 (34.8%) | 0 (0.0%) |
| 75 Years and over | 62 (4.4%) | 0 (0.0%) |
| Total | 15,877 (74.9%) | 238 (1.5%) |
Employment Status by Educational Attainment in Prior Lake
According to labor force statistics for Prior Lake, 89.5% of individuals (12,948) out of the total population between 25 and 64 years of age (14,467) are in the labor force, with 1.2% or 155 of them being unemployed. The group with the highest labor force participation rate are those with the educational attainment of bachelor's degree or higher, with 92.9% or 7,334 individuals in the labor force. Within the labor force, individuals with less than high school education have the highest percentage of unemployment, with 4.0% or 13 of them being unemployed.
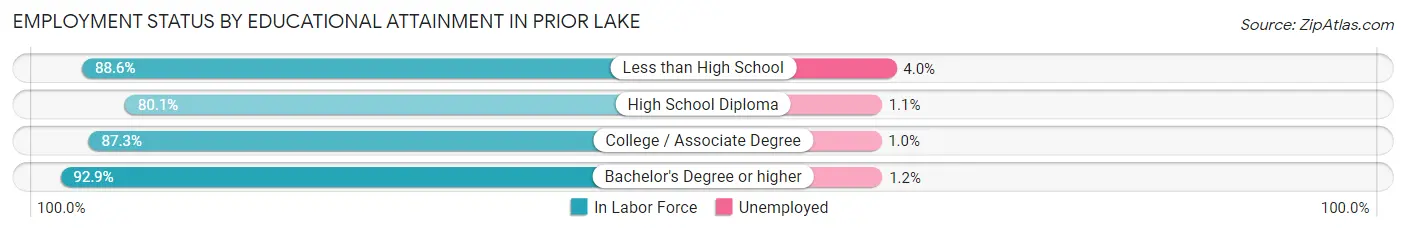
| Educational Attainment | In Labor Force | Unemployed |
| Less than High School | 325 (88.6%) | 15 (4.0%) |
| High School Diploma | 1,374 (80.1%) | 19 (1.1%) |
| College / Associate Degree | 3,920 (87.3%) | 45 (1.0%) |
| Bachelor's Degree or higher | 7,334 (92.9%) | 95 (1.2%) |
| Total | 12,948 (89.5%) | 174 (1.2%) |
Employment Occupations by Sex in Prior Lake
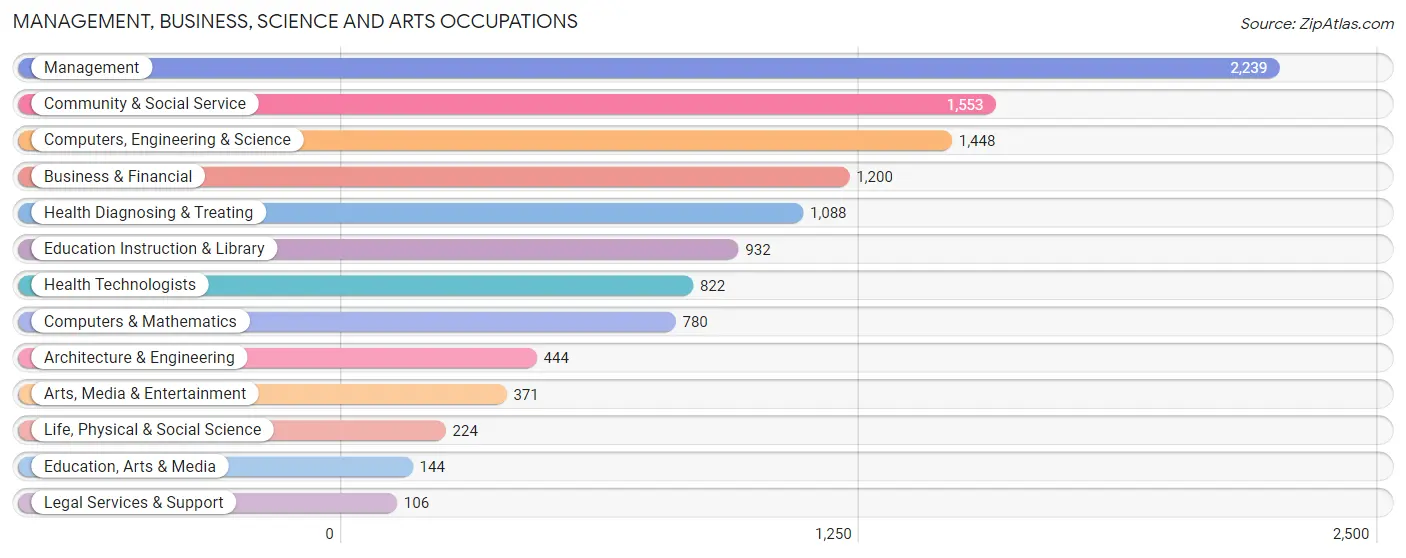
Management, Business, Science and Arts Occupations
The most common Management, Business, Science and Arts occupations in Prior Lake are Management (2,239 | 14.4%), Community & Social Service (1,553 | 10.0%), Computers, Engineering & Science (1,448 | 9.3%), Business & Financial (1,200 | 7.7%), and Health Diagnosing & Treating (1,088 | 7.0%).
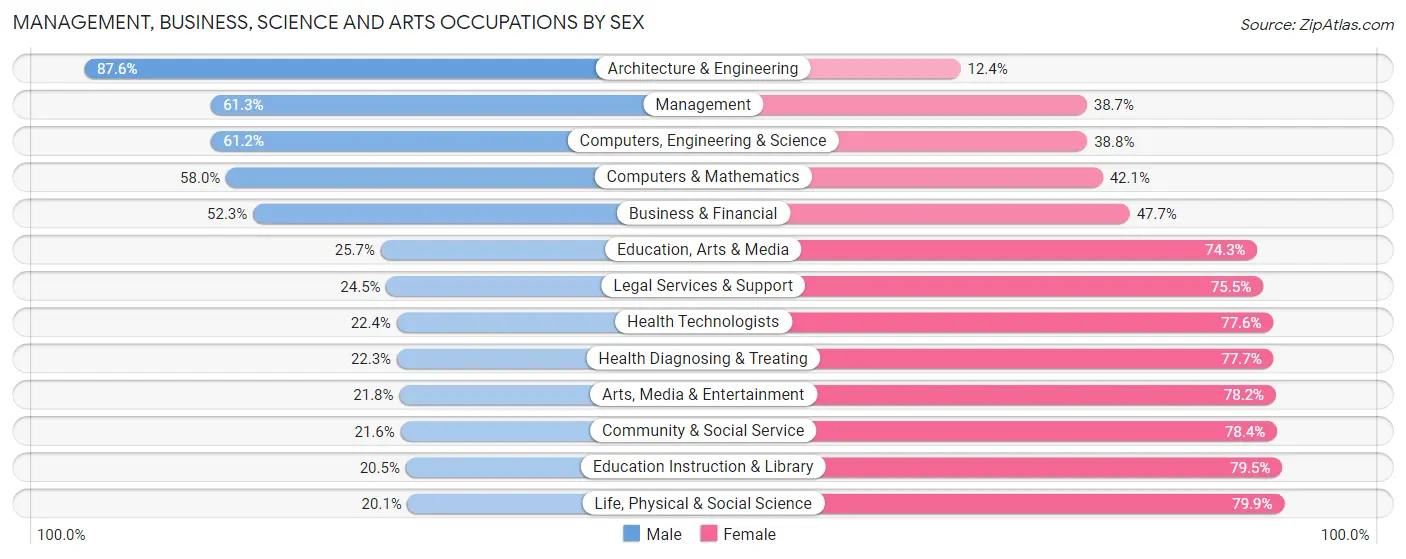
Management, Business, Science and Arts Occupations by Sex
Within the Management, Business, Science and Arts occupations in Prior Lake, the most male-oriented occupations are Architecture & Engineering (87.6%), Management (61.3%), and Computers, Engineering & Science (61.2%), while the most female-oriented occupations are Life, Physical & Social Science (79.9%), Education Instruction & Library (79.5%), and Community & Social Service (78.4%).
| Occupation | Male | Female |
| Management | 1,372 (61.3%) | 867 (38.7%) |
| Business & Financial | 628 (52.3%) | 572 (47.7%) |
| Computers, Engineering & Science | 886 (61.2%) | 562 (38.8%) |
| Computers & Mathematics | 452 (58.0%) | 328 (42.0%) |
| Architecture & Engineering | 389 (87.6%) | 55 (12.4%) |
| Life, Physical & Social Science | 45 (20.1%) | 179 (79.9%) |
| Community & Social Service | 335 (21.6%) | 1,218 (78.4%) |
| Education, Arts & Media | 37 (25.7%) | 107 (74.3%) |
| Legal Services & Support | 26 (24.5%) | 80 (75.5%) |
| Education Instruction & Library | 191 (20.5%) | 741 (79.5%) |
| Arts, Media & Entertainment | 81 (21.8%) | 290 (78.2%) |
| Health Diagnosing & Treating | 243 (22.3%) | 845 (77.7%) |
| Health Technologists | 184 (22.4%) | 638 (77.6%) |
| Total (Category) | 3,464 (46.0%) | 4,064 (54.0%) |
| Total (Overall) | 8,166 (52.4%) | 7,418 (47.6%) |
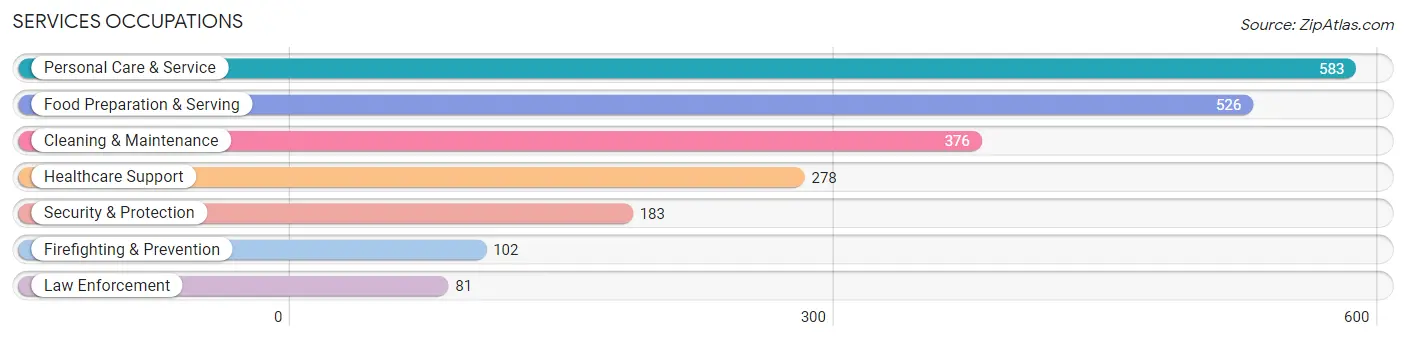
Services Occupations
The most common Services occupations in Prior Lake are Personal Care & Service (583 | 3.7%), Food Preparation & Serving (526 | 3.4%), Cleaning & Maintenance (376 | 2.4%), Healthcare Support (278 | 1.8%), and Security & Protection (183 | 1.2%).
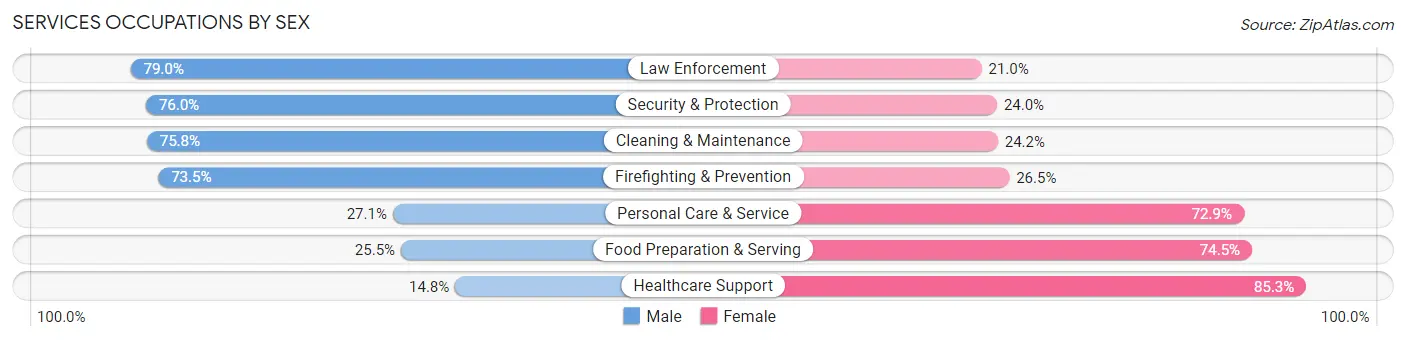
Services Occupations by Sex
Within the Services occupations in Prior Lake, the most male-oriented occupations are Law Enforcement (79.0%), Security & Protection (76.0%), and Cleaning & Maintenance (75.8%), while the most female-oriented occupations are Healthcare Support (85.3%), Food Preparation & Serving (74.5%), and Personal Care & Service (72.9%).
| Occupation | Male | Female |
| Healthcare Support | 41 (14.7%) | 237 (85.3%) |
| Security & Protection | 139 (76.0%) | 44 (24.0%) |
| Firefighting & Prevention | 75 (73.5%) | 27 (26.5%) |
| Law Enforcement | 64 (79.0%) | 17 (21.0%) |
| Food Preparation & Serving | 134 (25.5%) | 392 (74.5%) |
| Cleaning & Maintenance | 285 (75.8%) | 91 (24.2%) |
| Personal Care & Service | 158 (27.1%) | 425 (72.9%) |
| Total (Category) | 757 (38.9%) | 1,189 (61.1%) |
| Total (Overall) | 8,166 (52.4%) | 7,418 (47.6%) |
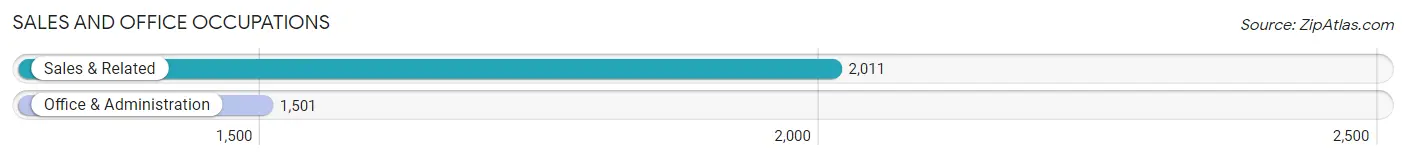
Sales and Office Occupations
The most common Sales and Office occupations in Prior Lake are Sales & Related (2,011 | 12.9%), and Office & Administration (1,501 | 9.6%).
Sales and Office Occupations by Sex
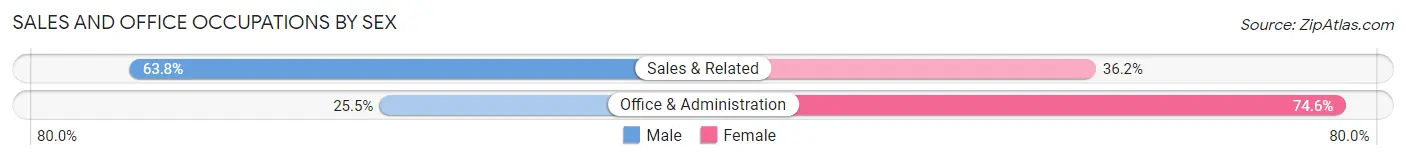
| Occupation | Male | Female |
| Sales & Related | 1,283 (63.8%) | 728 (36.2%) |
| Office & Administration | 382 (25.5%) | 1,119 (74.6%) |
| Total (Category) | 1,665 (47.4%) | 1,847 (52.6%) |
| Total (Overall) | 8,166 (52.4%) | 7,418 (47.6%) |
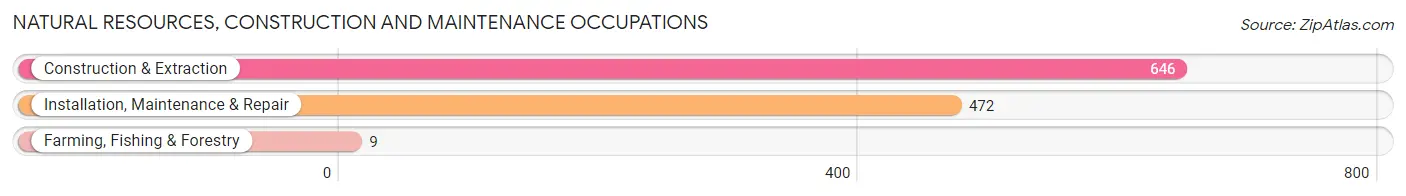
Natural Resources, Construction and Maintenance Occupations
The most common Natural Resources, Construction and Maintenance occupations in Prior Lake are Construction & Extraction (646 | 4.2%), Installation, Maintenance & Repair (472 | 3.0%), and Farming, Fishing & Forestry (9 | 0.1%).
Natural Resources, Construction and Maintenance Occupations by Sex
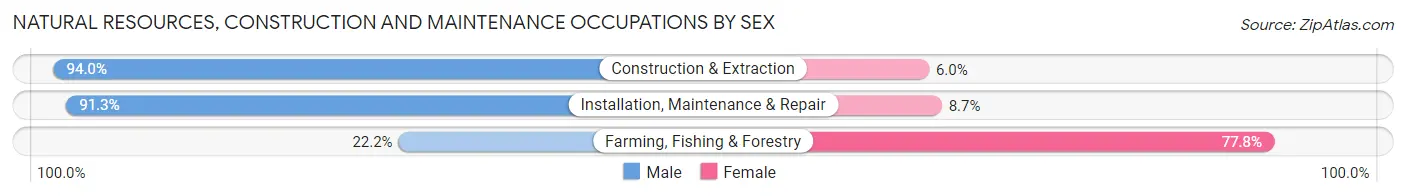
| Occupation | Male | Female |
| Farming, Fishing & Forestry | 2 (22.2%) | 7 (77.8%) |
| Construction & Extraction | 607 (94.0%) | 39 (6.0%) |
| Installation, Maintenance & Repair | 431 (91.3%) | 41 (8.7%) |
| Total (Category) | 1,040 (92.3%) | 87 (7.7%) |
| Total (Overall) | 8,166 (52.4%) | 7,418 (47.6%) |
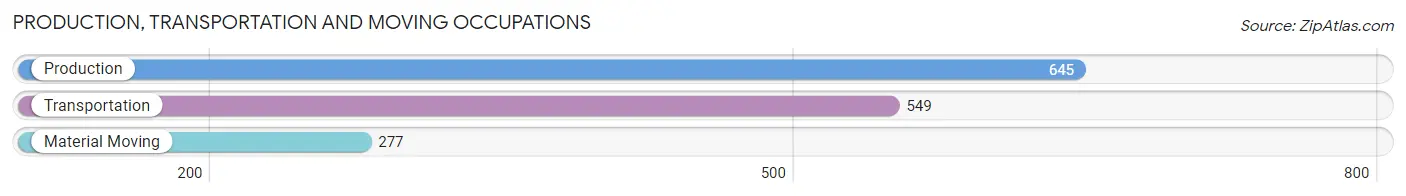
Production, Transportation and Moving Occupations
The most common Production, Transportation and Moving occupations in Prior Lake are Production (645 | 4.1%), Transportation (549 | 3.5%), and Material Moving (277 | 1.8%).
Production, Transportation and Moving Occupations by Sex
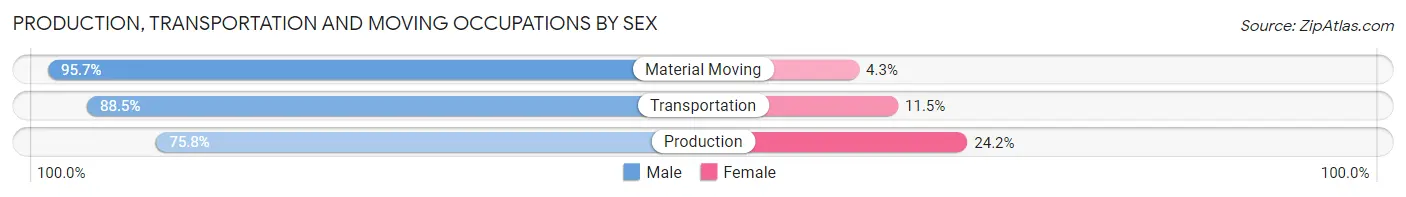
| Occupation | Male | Female |
| Production | 489 (75.8%) | 156 (24.2%) |
| Transportation | 486 (88.5%) | 63 (11.5%) |
| Material Moving | 265 (95.7%) | 12 (4.3%) |
| Total (Category) | 1,240 (84.3%) | 231 (15.7%) |
| Total (Overall) | 8,166 (52.4%) | 7,418 (47.6%) |
Employment Industries by Sex in Prior Lake
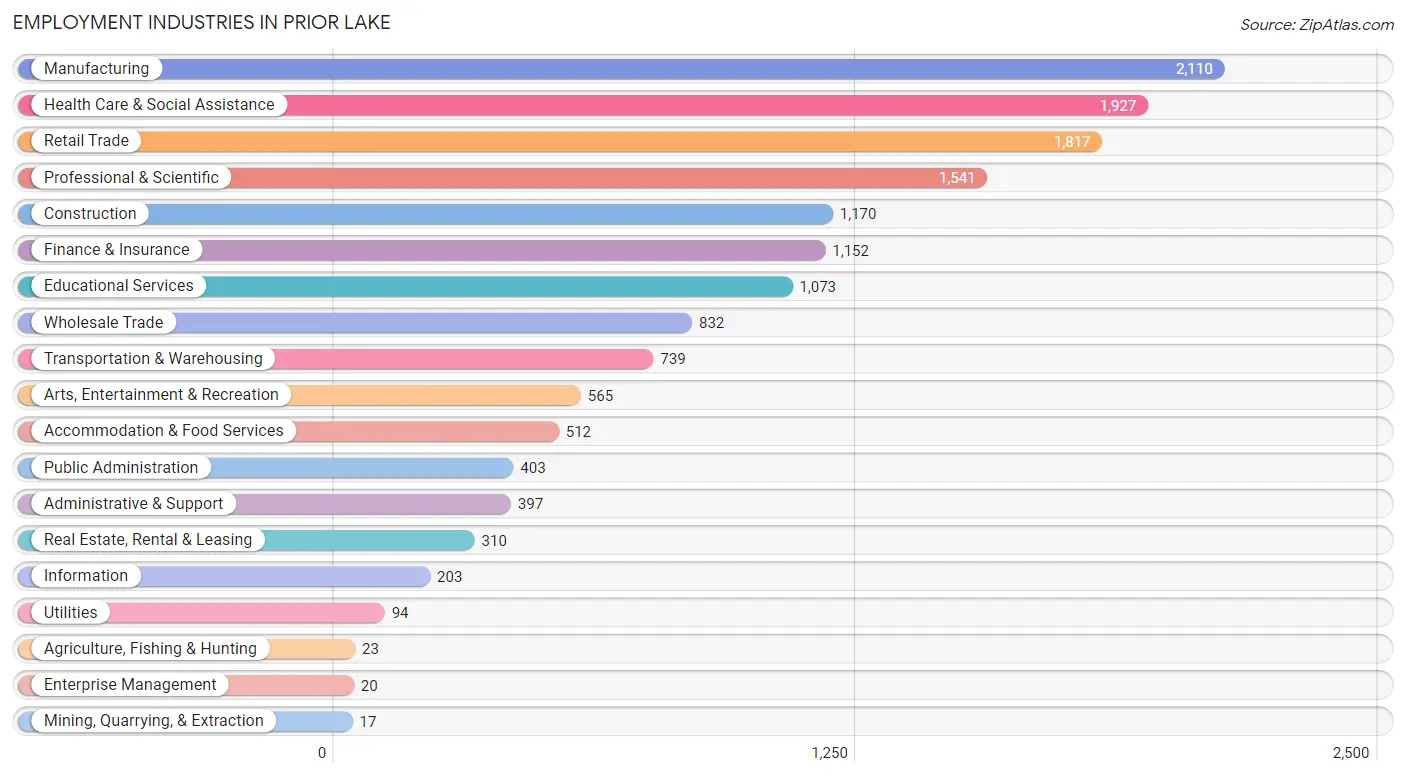
Employment Industries in Prior Lake
The major employment industries in Prior Lake include Manufacturing (2,110 | 13.5%), Health Care & Social Assistance (1,927 | 12.4%), Retail Trade (1,817 | 11.7%), Professional & Scientific (1,541 | 9.9%), and Construction (1,170 | 7.5%).
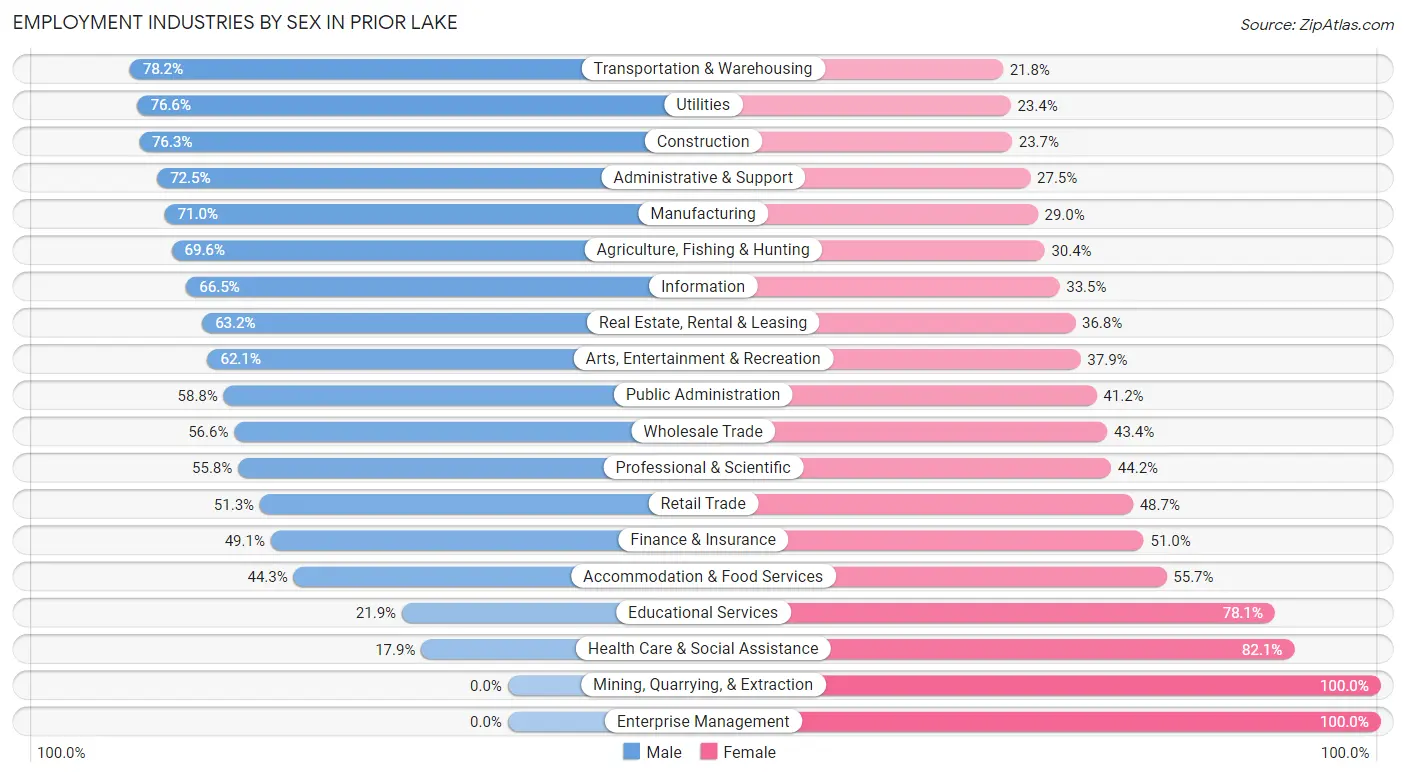
Employment Industries by Sex in Prior Lake
The Prior Lake industries that see more men than women are Transportation & Warehousing (78.2%), Utilities (76.6%), and Construction (76.3%), whereas the industries that tend to have a higher number of women are Mining, Quarrying, & Extraction (100.0%), Enterprise Management (100.0%), and Health Care & Social Assistance (82.1%).
| Industry | Male | Female |
| Agriculture, Fishing & Hunting | 16 (69.6%) | 7 (30.4%) |
| Mining, Quarrying, & Extraction | 0 (0.0%) | 17 (100.0%) |
| Construction | 893 (76.3%) | 277 (23.7%) |
| Manufacturing | 1,498 (71.0%) | 612 (29.0%) |
| Wholesale Trade | 471 (56.6%) | 361 (43.4%) |
| Retail Trade | 932 (51.3%) | 885 (48.7%) |
| Transportation & Warehousing | 578 (78.2%) | 161 (21.8%) |
| Utilities | 72 (76.6%) | 22 (23.4%) |
| Information | 135 (66.5%) | 68 (33.5%) |
| Finance & Insurance | 565 (49.0%) | 587 (50.9%) |
| Real Estate, Rental & Leasing | 196 (63.2%) | 114 (36.8%) |
| Professional & Scientific | 860 (55.8%) | 681 (44.2%) |
| Enterprise Management | 0 (0.0%) | 20 (100.0%) |
| Administrative & Support | 288 (72.5%) | 109 (27.5%) |
| Educational Services | 235 (21.9%) | 838 (78.1%) |
| Health Care & Social Assistance | 345 (17.9%) | 1,582 (82.1%) |
| Arts, Entertainment & Recreation | 351 (62.1%) | 214 (37.9%) |
| Accommodation & Food Services | 227 (44.3%) | 285 (55.7%) |
| Public Administration | 237 (58.8%) | 166 (41.2%) |
| Total | 8,166 (52.4%) | 7,418 (47.6%) |
Education in Prior Lake
School Enrollment in Prior Lake
The most common levels of schooling among the 7,305 students in Prior Lake are middle school (1,861 | 25.5%), high school (1,706 | 23.4%), and elementary school (1,554 | 21.3%).
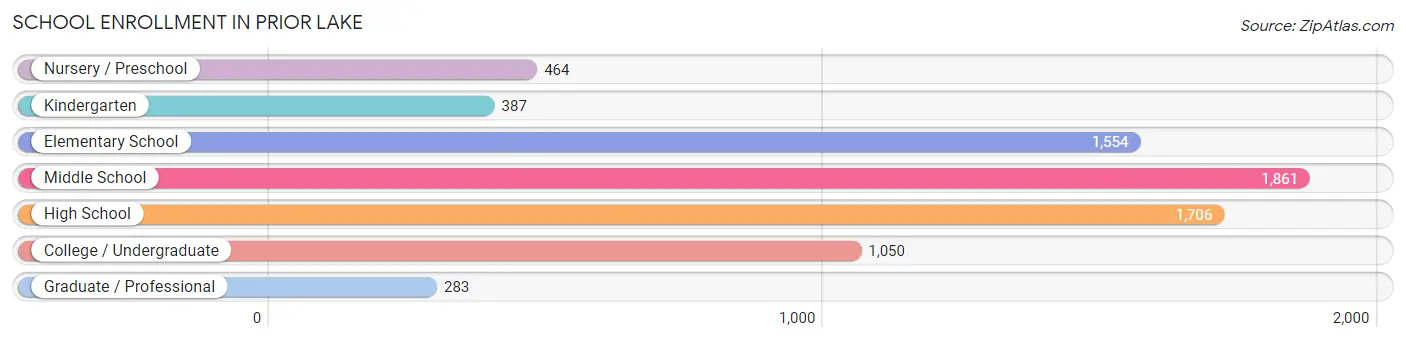
| School Level | # Students | % Students |
| Nursery / Preschool | 464 | 6.4% |
| Kindergarten | 387 | 5.3% |
| Elementary School | 1,554 | 21.3% |
| Middle School | 1,861 | 25.5% |
| High School | 1,706 | 23.4% |
| College / Undergraduate | 1,050 | 14.4% |
| Graduate / Professional | 283 | 3.9% |
| Total | 7,305 | 100.0% |
School Enrollment by Age by Funding Source in Prior Lake
Out of a total of 7,305 students who are enrolled in schools in Prior Lake, 1,337 (18.3%) attend a private institution, while the remaining 5,968 (81.7%) are enrolled in public schools. The age group of 3 to 4 year olds has the highest likelihood of being enrolled in private schools, with 181 (58.6% in the age bracket) enrolled. Conversely, the age group of 15 to 17 year olds has the lowest likelihood of being enrolled in a private school, with 1,217 (93.1% in the age bracket) attending a public institution.
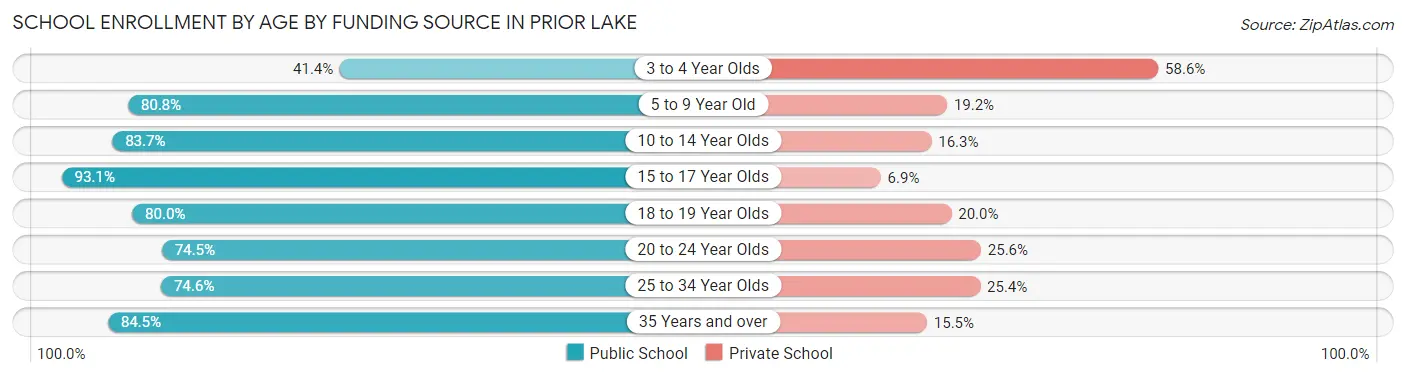
| Age Bracket | Public School | Private School |
| 3 to 4 Year Olds | 128 (41.4%) | 181 (58.6%) |
| 5 to 9 Year Old | 1,402 (80.8%) | 334 (19.2%) |
| 10 to 14 Year Olds | 2,036 (83.7%) | 397 (16.3%) |
| 15 to 17 Year Olds | 1,217 (93.1%) | 90 (6.9%) |
| 18 to 19 Year Olds | 403 (80.0%) | 101 (20.0%) |
| 20 to 24 Year Olds | 373 (74.5%) | 128 (25.6%) |
| 25 to 34 Year Olds | 182 (74.6%) | 62 (25.4%) |
| 35 Years and over | 229 (84.5%) | 42 (15.5%) |
| Total | 5,968 (81.7%) | 1,337 (18.3%) |
Educational Attainment by Field of Study in Prior Lake
Business (2,410 | 23.7%), science & technology (1,317 | 13.0%), education (1,264 | 12.4%), engineering (700 | 6.9%), and social sciences (652 | 6.4%) are the most common fields of study among 10,152 individuals in Prior Lake who have obtained a bachelor's degree or higher.
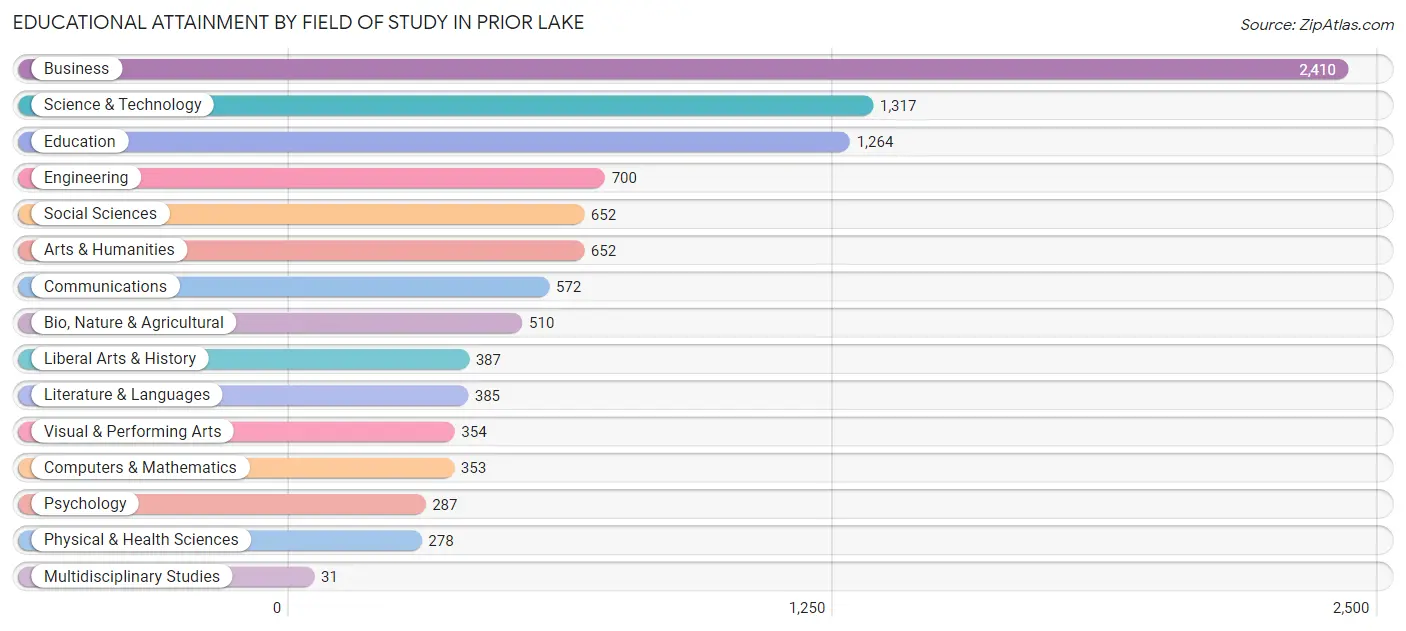
| Field of Study | # Graduates | % Graduates |
| Computers & Mathematics | 353 | 3.5% |
| Bio, Nature & Agricultural | 510 | 5.0% |
| Physical & Health Sciences | 278 | 2.7% |
| Psychology | 287 | 2.8% |
| Social Sciences | 652 | 6.4% |
| Engineering | 700 | 6.9% |
| Multidisciplinary Studies | 31 | 0.3% |
| Science & Technology | 1,317 | 13.0% |
| Business | 2,410 | 23.7% |
| Education | 1,264 | 12.4% |
| Literature & Languages | 385 | 3.8% |
| Liberal Arts & History | 387 | 3.8% |
| Visual & Performing Arts | 354 | 3.5% |
| Communications | 572 | 5.6% |
| Arts & Humanities | 652 | 6.4% |
| Total | 10,152 | 100.0% |
Transportation & Commute in Prior Lake
Vehicle Availability by Sex in Prior Lake
The most prevalent vehicle ownership categories in Prior Lake are males with 2 vehicles (3,879, accounting for 48.1%) and females with 2 vehicles (3,415, making up 53.3%).
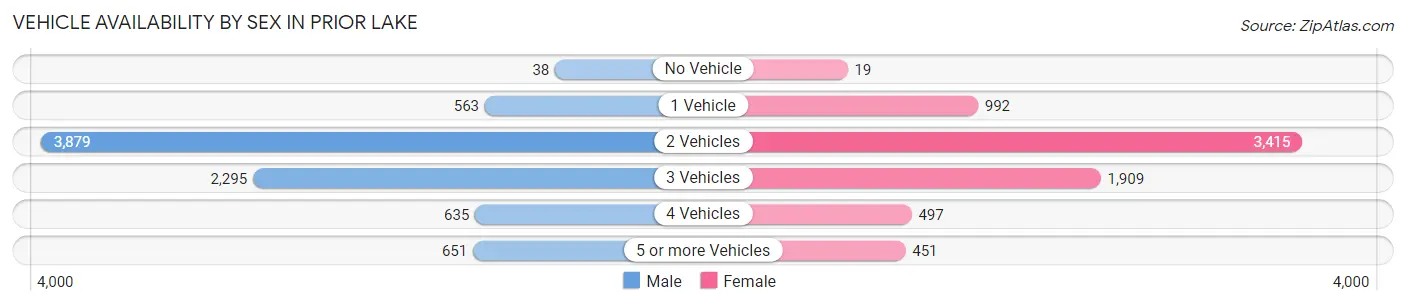
| Vehicles Available | Male | Female |
| No Vehicle | 38 (0.5%) | 19 (0.3%) |
| 1 Vehicle | 563 (7.0%) | 992 (13.6%) |
| 2 Vehicles | 3,879 (48.1%) | 3,415 (46.9%) |
| 3 Vehicles | 2,295 (28.5%) | 1,909 (26.2%) |
| 4 Vehicles | 635 (7.9%) | 497 (6.8%) |
| 5 or more Vehicles | 651 (8.1%) | 451 (6.2%) |
| Total | 8,061 (100.0%) | 7,283 (100.0%) |
Commute Time in Prior Lake
The most frequently occuring commute durations in Prior Lake are 20 to 24 minutes (1,996 commuters, 16.3%), 30 to 34 minutes (1,909 commuters, 15.6%), and 15 to 19 minutes (1,630 commuters, 13.3%).
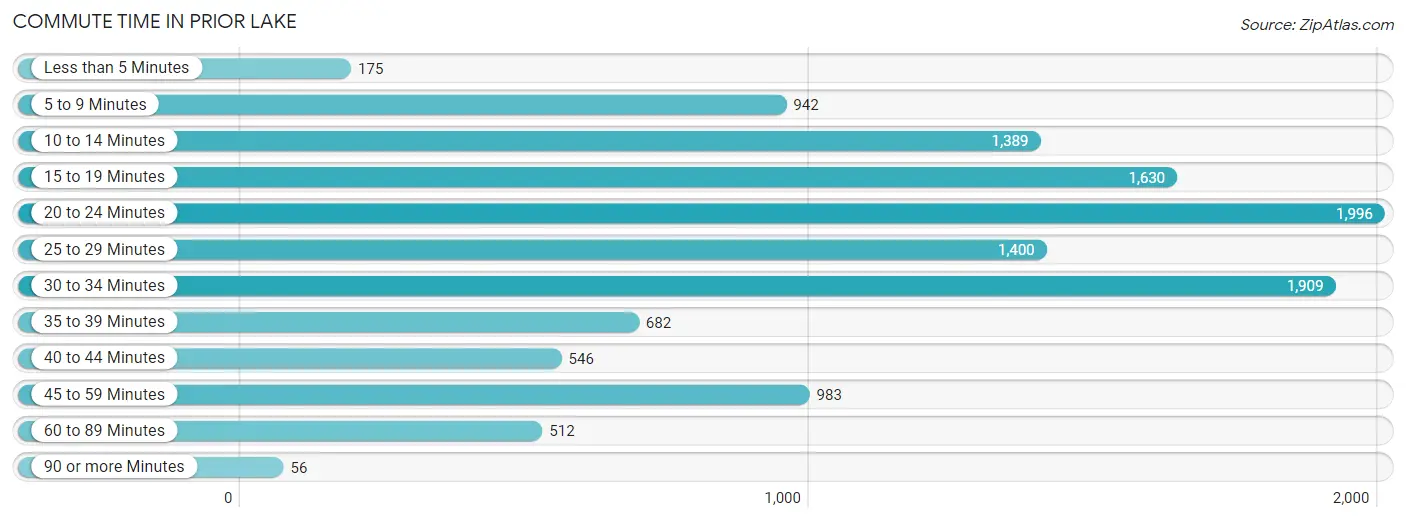
| Commute Time | # Commuters | % Commuters |
| Less than 5 Minutes | 175 | 1.4% |
| 5 to 9 Minutes | 942 | 7.7% |
| 10 to 14 Minutes | 1,389 | 11.4% |
| 15 to 19 Minutes | 1,630 | 13.3% |
| 20 to 24 Minutes | 1,996 | 16.3% |
| 25 to 29 Minutes | 1,400 | 11.5% |
| 30 to 34 Minutes | 1,909 | 15.6% |
| 35 to 39 Minutes | 682 | 5.6% |
| 40 to 44 Minutes | 546 | 4.5% |
| 45 to 59 Minutes | 983 | 8.0% |
| 60 to 89 Minutes | 512 | 4.2% |
| 90 or more Minutes | 56 | 0.5% |
Commute Time by Sex in Prior Lake
The most common commute times in Prior Lake are 30 to 34 minutes (1,151 commuters, 18.1%) for males and 20 to 24 minutes (1,102 commuters, 18.8%) for females.
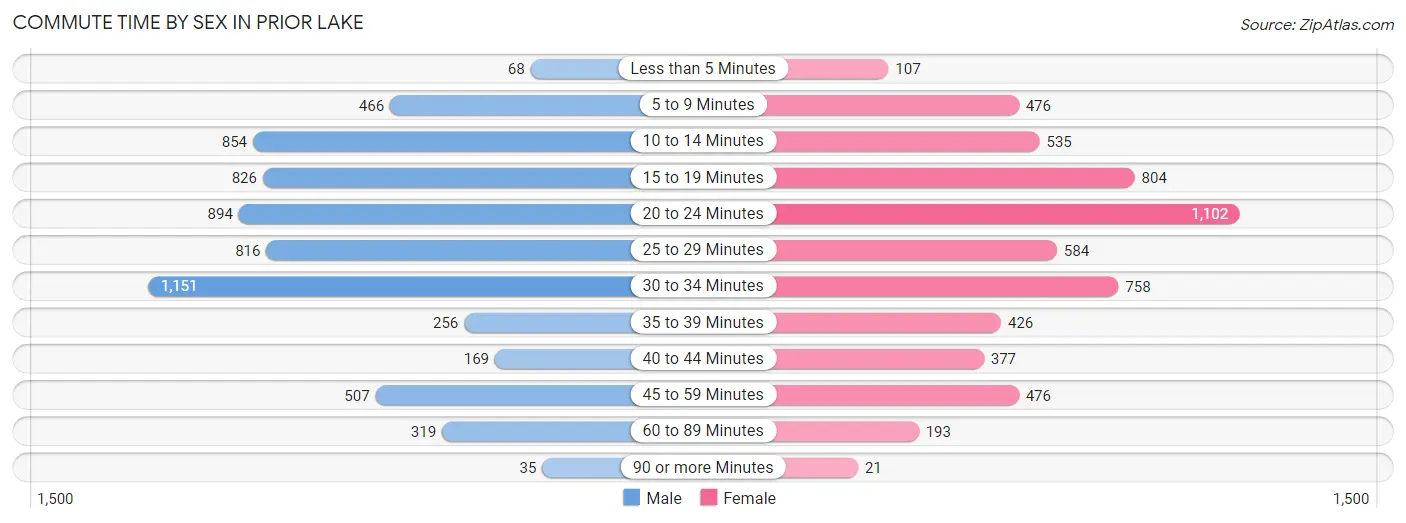
| Commute Time | Male | Female |
| Less than 5 Minutes | 68 (1.1%) | 107 (1.8%) |
| 5 to 9 Minutes | 466 (7.3%) | 476 (8.1%) |
| 10 to 14 Minutes | 854 (13.4%) | 535 (9.1%) |
| 15 to 19 Minutes | 826 (13.0%) | 804 (13.7%) |
| 20 to 24 Minutes | 894 (14.1%) | 1,102 (18.8%) |
| 25 to 29 Minutes | 816 (12.8%) | 584 (10.0%) |
| 30 to 34 Minutes | 1,151 (18.1%) | 758 (12.9%) |
| 35 to 39 Minutes | 256 (4.0%) | 426 (7.3%) |
| 40 to 44 Minutes | 169 (2.7%) | 377 (6.4%) |
| 45 to 59 Minutes | 507 (8.0%) | 476 (8.1%) |
| 60 to 89 Minutes | 319 (5.0%) | 193 (3.3%) |
| 90 or more Minutes | 35 (0.5%) | 21 (0.4%) |
Time of Departure to Work by Sex in Prior Lake
The most frequent times of departure to work in Prior Lake are 7:00 AM to 7:29 AM (1,103, 17.3%) for males and 7:30 AM to 7:59 AM (1,082, 18.5%) for females.
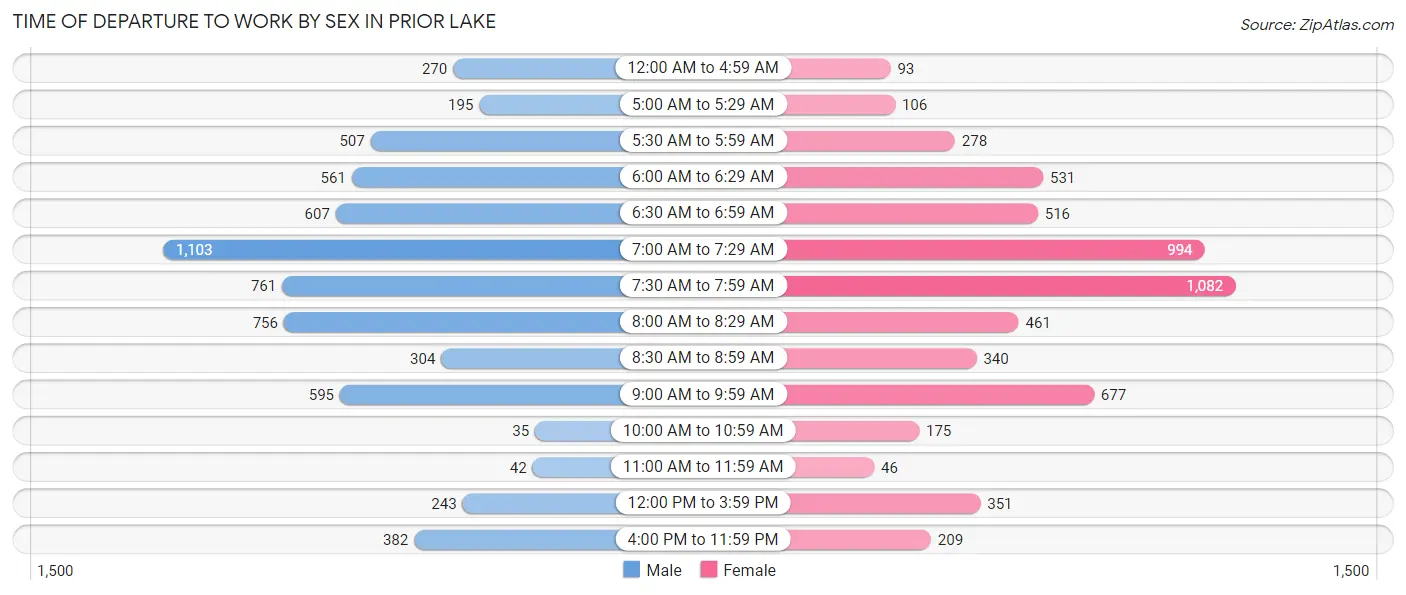
| Time of Departure | Male | Female |
| 12:00 AM to 4:59 AM | 270 (4.2%) | 93 (1.6%) |
| 5:00 AM to 5:29 AM | 195 (3.1%) | 106 (1.8%) |
| 5:30 AM to 5:59 AM | 507 (8.0%) | 278 (4.7%) |
| 6:00 AM to 6:29 AM | 561 (8.8%) | 531 (9.1%) |
| 6:30 AM to 6:59 AM | 607 (9.5%) | 516 (8.8%) |
| 7:00 AM to 7:29 AM | 1,103 (17.3%) | 994 (17.0%) |
| 7:30 AM to 7:59 AM | 761 (12.0%) | 1,082 (18.5%) |
| 8:00 AM to 8:29 AM | 756 (11.9%) | 461 (7.9%) |
| 8:30 AM to 8:59 AM | 304 (4.8%) | 340 (5.8%) |
| 9:00 AM to 9:59 AM | 595 (9.3%) | 677 (11.6%) |
| 10:00 AM to 10:59 AM | 35 (0.5%) | 175 (3.0%) |
| 11:00 AM to 11:59 AM | 42 (0.7%) | 46 (0.8%) |
| 12:00 PM to 3:59 PM | 243 (3.8%) | 351 (6.0%) |
| 4:00 PM to 11:59 PM | 382 (6.0%) | 209 (3.6%) |
| Total | 6,361 (100.0%) | 5,859 (100.0%) |
Housing Occupancy in Prior Lake
Occupancy by Ownership in Prior Lake
Of the total 10,021 dwellings in Prior Lake, owner-occupied units account for 8,635 (86.2%), while renter-occupied units make up 1,386 (13.8%).
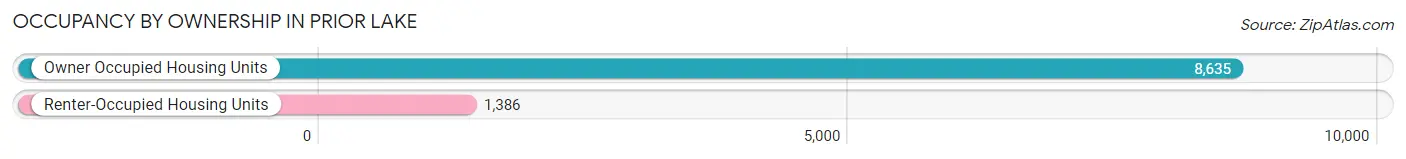
| Occupancy | # Housing Units | % Housing Units |
| Owner Occupied Housing Units | 8,635 | 86.2% |
| Renter-Occupied Housing Units | 1,386 | 13.8% |
| Total Occupied Housing Units | 10,021 | 100.0% |
Occupancy by Household Size in Prior Lake
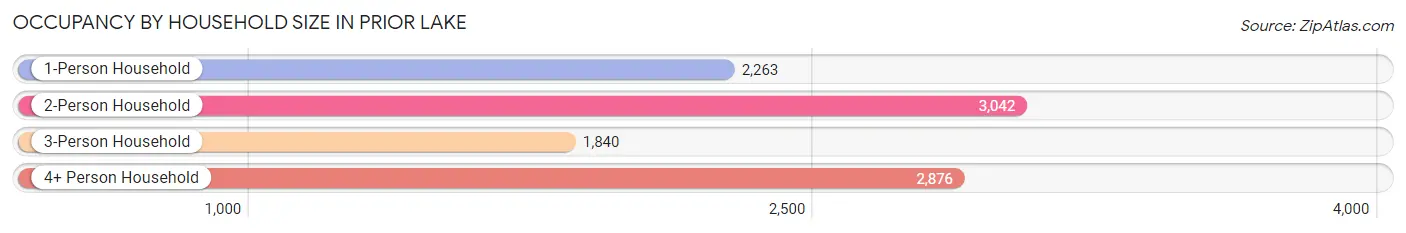
| Household Size | # Housing Units | % Housing Units |
| 1-Person Household | 2,263 | 22.6% |
| 2-Person Household | 3,042 | 30.4% |
| 3-Person Household | 1,840 | 18.4% |
| 4+ Person Household | 2,876 | 28.7% |
| Total Housing Units | 10,021 | 100.0% |
Occupancy by Ownership by Household Size in Prior Lake
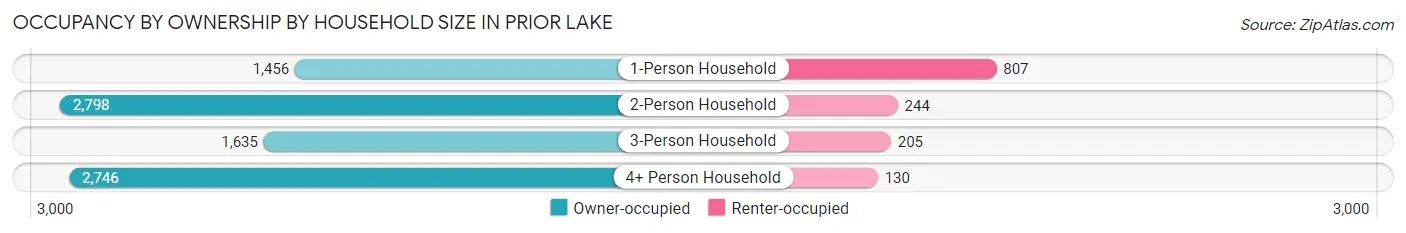
| Household Size | Owner-occupied | Renter-occupied |
| 1-Person Household | 1,456 (64.3%) | 807 (35.7%) |
| 2-Person Household | 2,798 (92.0%) | 244 (8.0%) |
| 3-Person Household | 1,635 (88.9%) | 205 (11.1%) |
| 4+ Person Household | 2,746 (95.5%) | 130 (4.5%) |
| Total Housing Units | 8,635 (86.2%) | 1,386 (13.8%) |
Occupancy by Educational Attainment in Prior Lake
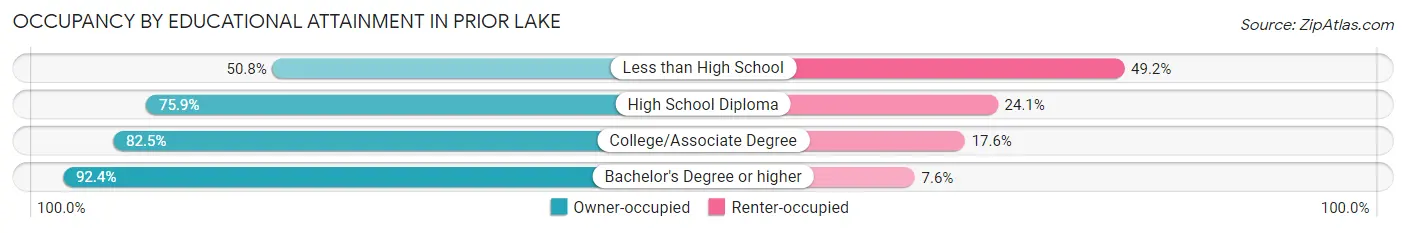
| Household Size | Owner-occupied | Renter-occupied |
| Less than High School | 121 (50.8%) | 117 (49.2%) |
| High School Diploma | 848 (75.9%) | 269 (24.1%) |
| College/Associate Degree | 2,818 (82.5%) | 600 (17.5%) |
| Bachelor's Degree or higher | 4,848 (92.4%) | 400 (7.6%) |
Occupancy by Age of Householder in Prior Lake
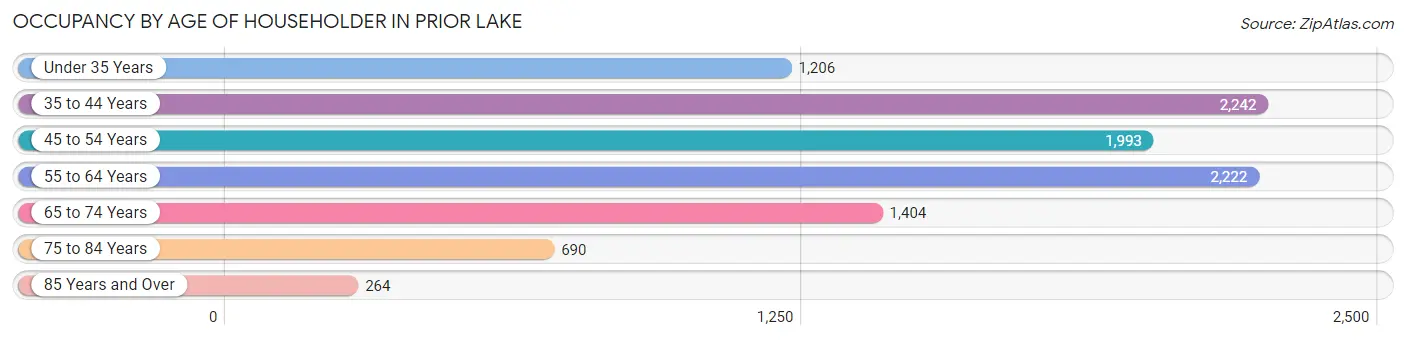
| Age Bracket | # Households | % Households |
| Under 35 Years | 1,206 | 12.0% |
| 35 to 44 Years | 2,242 | 22.4% |
| 45 to 54 Years | 1,993 | 19.9% |
| 55 to 64 Years | 2,222 | 22.2% |
| 65 to 74 Years | 1,404 | 14.0% |
| 75 to 84 Years | 690 | 6.9% |
| 85 Years and Over | 264 | 2.6% |
| Total | 10,021 | 100.0% |
Housing Finances in Prior Lake
Median Income by Occupancy in Prior Lake
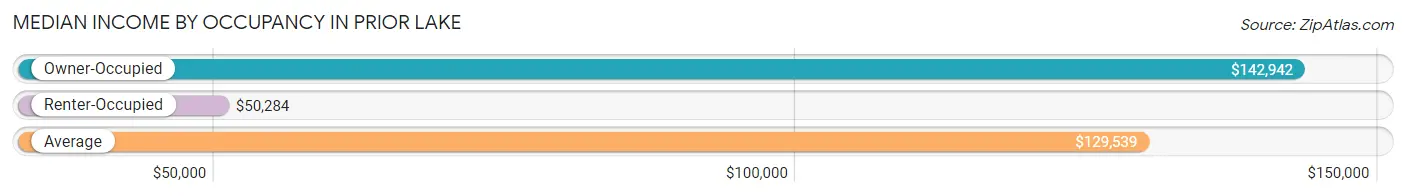
| Occupancy Type | # Households | Median Income |
| Owner-Occupied | 8,635 (86.2%) | $142,942 |
| Renter-Occupied | 1,386 (13.8%) | $50,284 |
| Average | 10,021 (100.0%) | $129,539 |
Occupancy by Householder Income Bracket in Prior Lake
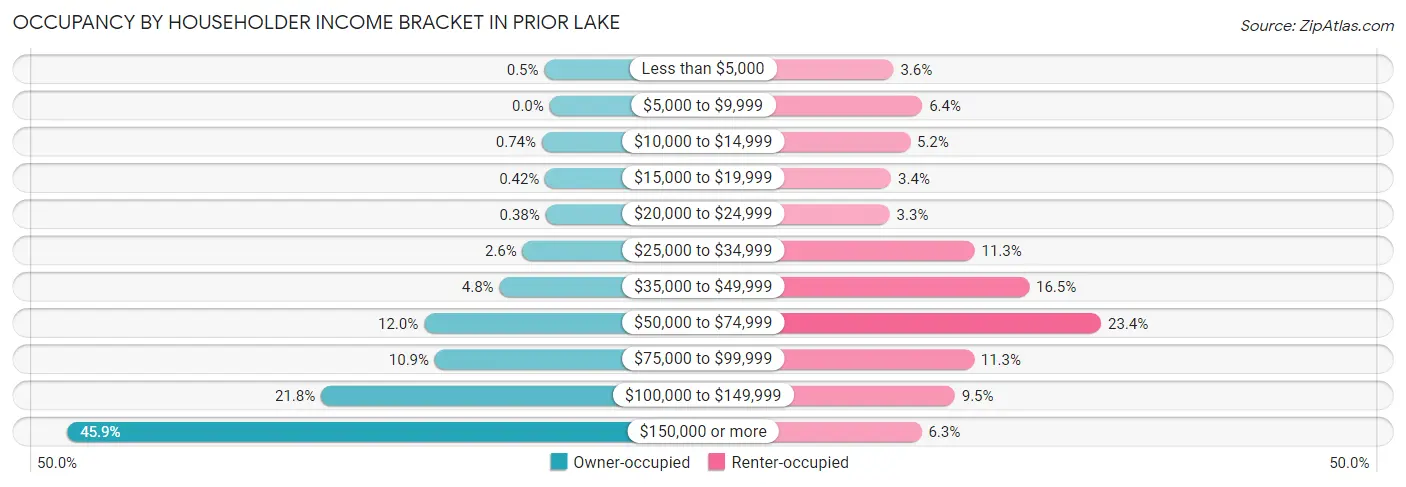
| Income Bracket | Owner-occupied | Renter-occupied |
| Less than $5,000 | 43 (0.5%) | 50 (3.6%) |
| $5,000 to $9,999 | 0 (0.0%) | 88 (6.4%) |
| $10,000 to $14,999 | 64 (0.7%) | 72 (5.2%) |
| $15,000 to $19,999 | 36 (0.4%) | 47 (3.4%) |
| $20,000 to $24,999 | 33 (0.4%) | 45 (3.3%) |
| $25,000 to $34,999 | 222 (2.6%) | 157 (11.3%) |
| $35,000 to $49,999 | 413 (4.8%) | 229 (16.5%) |
| $50,000 to $74,999 | 1,033 (12.0%) | 324 (23.4%) |
| $75,000 to $99,999 | 944 (10.9%) | 156 (11.3%) |
| $100,000 to $149,999 | 1,880 (21.8%) | 131 (9.5%) |
| $150,000 or more | 3,967 (45.9%) | 87 (6.3%) |
| Total | 8,635 (100.0%) | 1,386 (100.0%) |
Monthly Housing Cost Tiers in Prior Lake
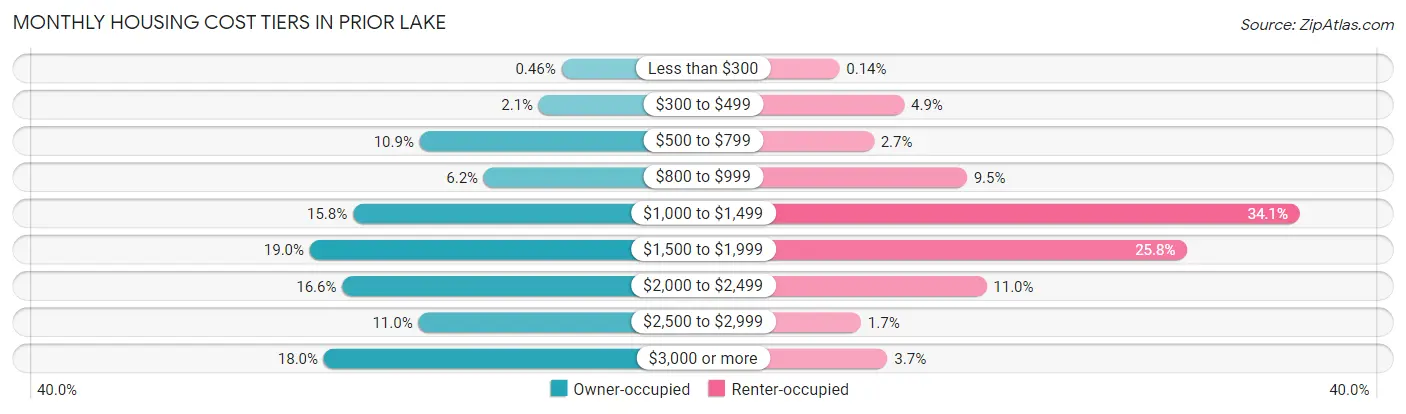
| Monthly Cost | Owner-occupied | Renter-occupied |
| Less than $300 | 40 (0.5%) | 2 (0.1%) |
| $300 to $499 | 183 (2.1%) | 68 (4.9%) |
| $500 to $799 | 941 (10.9%) | 37 (2.7%) |
| $800 to $999 | 533 (6.2%) | 132 (9.5%) |
| $1,000 to $1,499 | 1,365 (15.8%) | 472 (34.1%) |
| $1,500 to $1,999 | 1,640 (19.0%) | 357 (25.8%) |
| $2,000 to $2,499 | 1,433 (16.6%) | 152 (11.0%) |
| $2,500 to $2,999 | 949 (11.0%) | 24 (1.7%) |
| $3,000 or more | 1,551 (18.0%) | 51 (3.7%) |
| Total | 8,635 (100.0%) | 1,386 (100.0%) |
Physical Housing Characteristics in Prior Lake
Housing Structures in Prior Lake
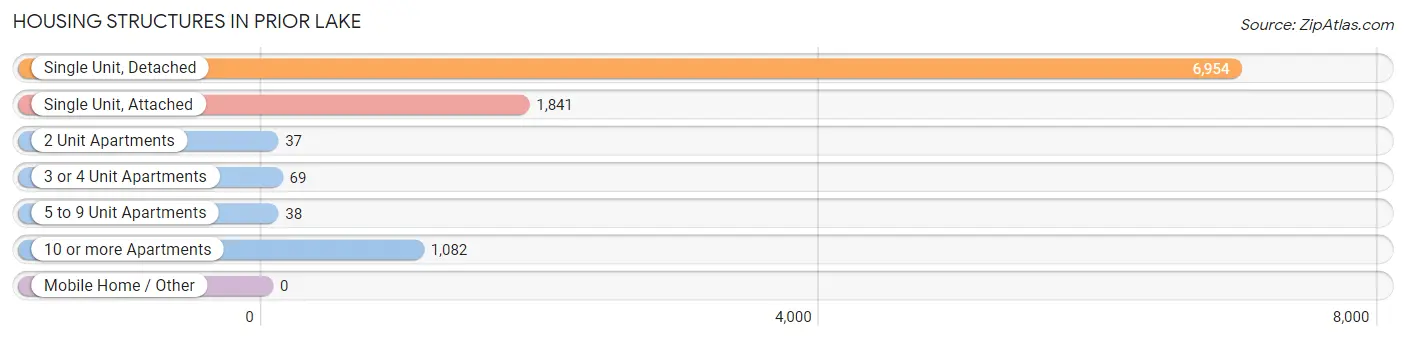
| Structure Type | # Housing Units | % Housing Units |
| Single Unit, Detached | 6,954 | 69.4% |
| Single Unit, Attached | 1,841 | 18.4% |
| 2 Unit Apartments | 37 | 0.4% |
| 3 or 4 Unit Apartments | 69 | 0.7% |
| 5 to 9 Unit Apartments | 38 | 0.4% |
| 10 or more Apartments | 1,082 | 10.8% |
| Mobile Home / Other | 0 | 0.0% |
| Total | 10,021 | 100.0% |
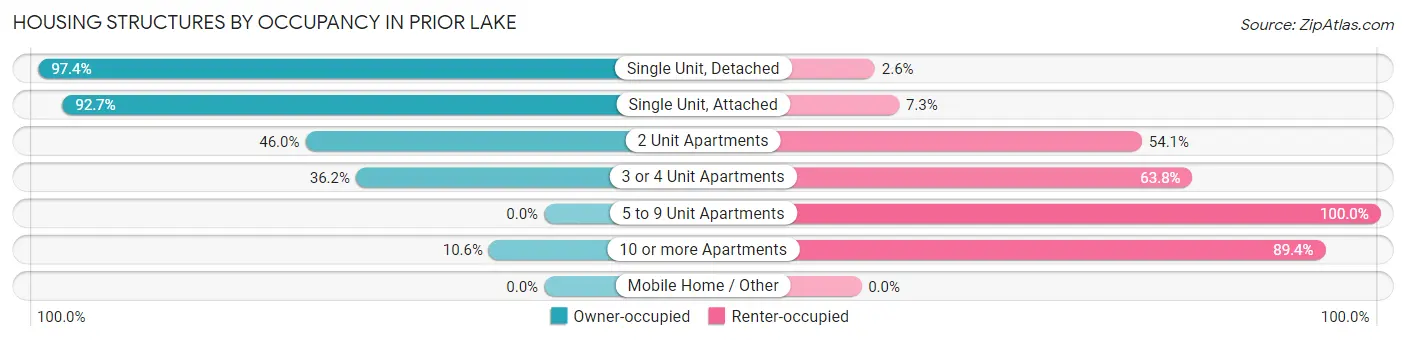
Housing Structures by Occupancy in Prior Lake
| Structure Type | Owner-occupied | Renter-occupied |
| Single Unit, Detached | 6,771 (97.4%) | 183 (2.6%) |
| Single Unit, Attached | 1,707 (92.7%) | 134 (7.3%) |
| 2 Unit Apartments | 17 (46.0%) | 20 (54.0%) |
| 3 or 4 Unit Apartments | 25 (36.2%) | 44 (63.8%) |
| 5 to 9 Unit Apartments | 0 (0.0%) | 38 (100.0%) |
| 10 or more Apartments | 115 (10.6%) | 967 (89.4%) |
| Mobile Home / Other | 0 (0.0%) | 0 (0.0%) |
| Total | 8,635 (86.2%) | 1,386 (13.8%) |
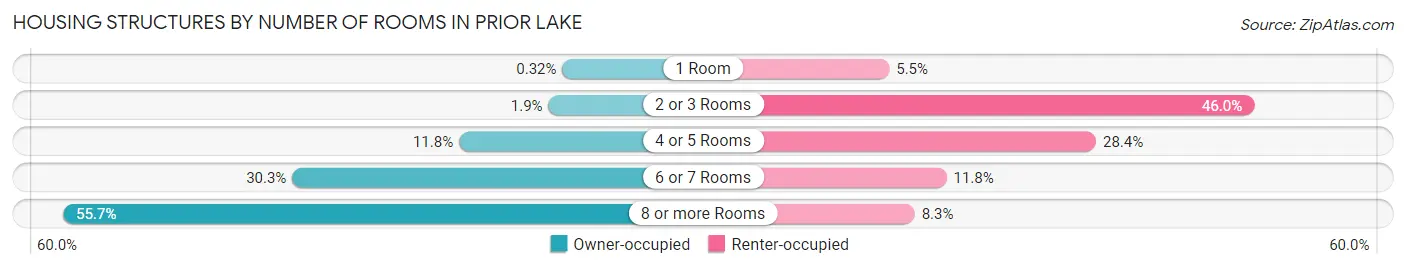
Housing Structures by Number of Rooms in Prior Lake
| Number of Rooms | Owner-occupied | Renter-occupied |
| 1 Room | 28 (0.3%) | 76 (5.5%) |
| 2 or 3 Rooms | 161 (1.9%) | 637 (46.0%) |
| 4 or 5 Rooms | 1,018 (11.8%) | 394 (28.4%) |
| 6 or 7 Rooms | 2,616 (30.3%) | 164 (11.8%) |
| 8 or more Rooms | 4,812 (55.7%) | 115 (8.3%) |
| Total | 8,635 (100.0%) | 1,386 (100.0%) |
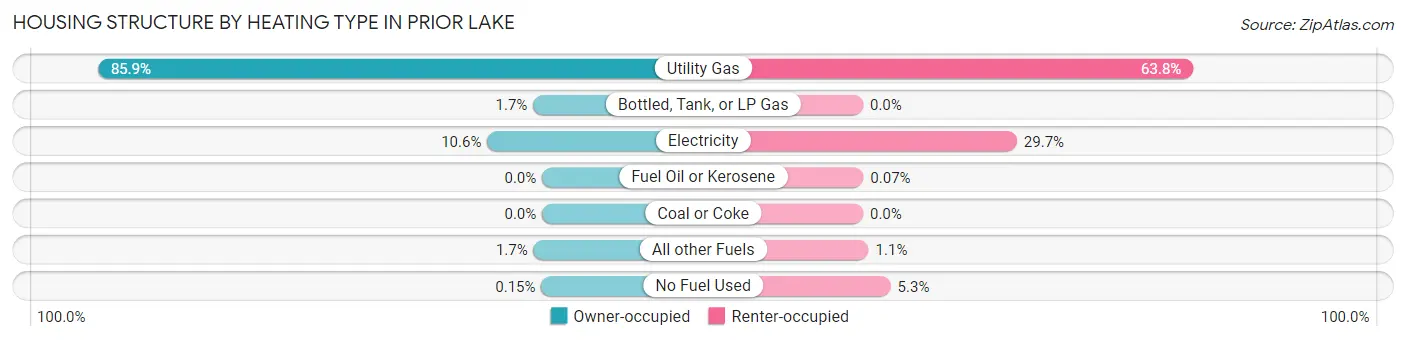
Housing Structure by Heating Type in Prior Lake
| Heating Type | Owner-occupied | Renter-occupied |
| Utility Gas | 7,415 (85.9%) | 884 (63.8%) |
| Bottled, Tank, or LP Gas | 149 (1.7%) | 0 (0.0%) |
| Electricity | 915 (10.6%) | 412 (29.7%) |
| Fuel Oil or Kerosene | 0 (0.0%) | 1 (0.1%) |
| Coal or Coke | 0 (0.0%) | 0 (0.0%) |
| All other Fuels | 143 (1.7%) | 15 (1.1%) |
| No Fuel Used | 13 (0.2%) | 74 (5.3%) |
| Total | 8,635 (100.0%) | 1,386 (100.0%) |
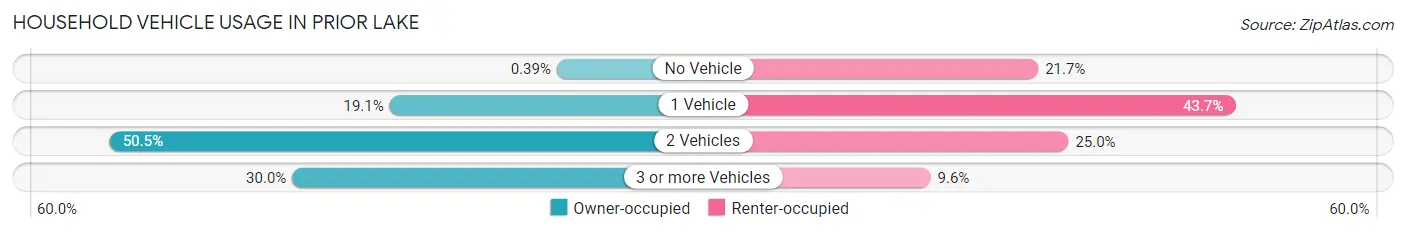
Household Vehicle Usage in Prior Lake
| Vehicles per Household | Owner-occupied | Renter-occupied |
| No Vehicle | 34 (0.4%) | 300 (21.6%) |
| 1 Vehicle | 1,651 (19.1%) | 606 (43.7%) |
| 2 Vehicles | 4,357 (50.5%) | 347 (25.0%) |
| 3 or more Vehicles | 2,593 (30.0%) | 133 (9.6%) |
| Total | 8,635 (100.0%) | 1,386 (100.0%) |
Real Estate & Mortgages in Prior Lake
Real Estate and Mortgage Overview in Prior Lake
| Characteristic | Without Mortgage | With Mortgage |
| Housing Units | 2,143 | 6,492 |
| Median Property Value | $413,300 | $396,700 |
| Median Household Income | $100,843 | $3,233 |
| Monthly Housing Costs | $789 | $1,551 |
| Real Estate Taxes | $4,620 | $112 |
Property Value by Mortgage Status in Prior Lake
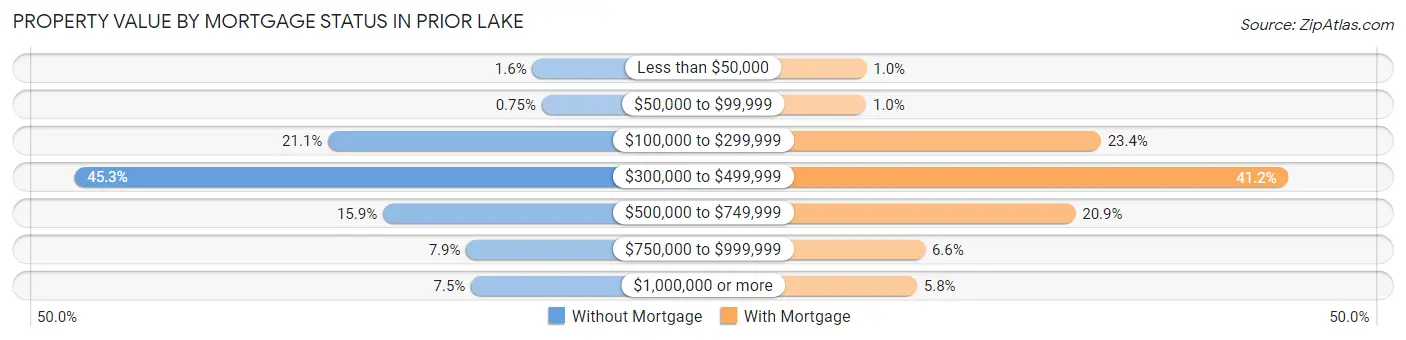
| Property Value | Without Mortgage | With Mortgage |
| Less than $50,000 | 35 (1.6%) | 67 (1.0%) |
| $50,000 to $99,999 | 16 (0.7%) | 65 (1.0%) |
| $100,000 to $299,999 | 452 (21.1%) | 1,516 (23.4%) |
| $300,000 to $499,999 | 970 (45.3%) | 2,677 (41.2%) |
| $500,000 to $749,999 | 340 (15.9%) | 1,359 (20.9%) |
| $750,000 to $999,999 | 170 (7.9%) | 429 (6.6%) |
| $1,000,000 or more | 160 (7.5%) | 379 (5.8%) |
| Total | 2,143 (100.0%) | 6,492 (100.0%) |
Household Income by Mortgage Status in Prior Lake
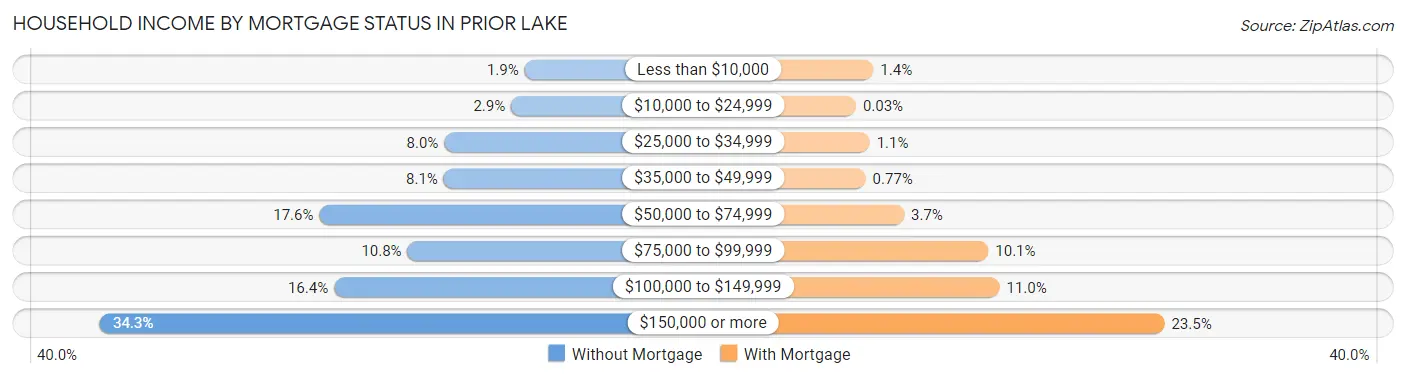
| Household Income | Without Mortgage | With Mortgage |
| Less than $10,000 | 41 (1.9%) | 88 (1.4%) |
| $10,000 to $24,999 | 63 (2.9%) | 2 (0.0%) |
| $25,000 to $34,999 | 172 (8.0%) | 70 (1.1%) |
| $35,000 to $49,999 | 173 (8.1%) | 50 (0.8%) |
| $50,000 to $74,999 | 376 (17.5%) | 240 (3.7%) |
| $75,000 to $99,999 | 232 (10.8%) | 657 (10.1%) |
| $100,000 to $149,999 | 352 (16.4%) | 712 (11.0%) |
| $150,000 or more | 734 (34.3%) | 1,528 (23.5%) |
| Total | 2,143 (100.0%) | 6,492 (100.0%) |
Property Value to Household Income Ratio in Prior Lake
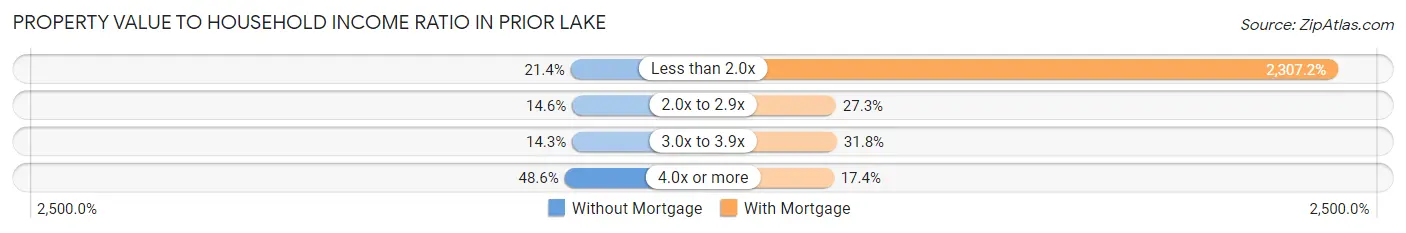
| Value-to-Income Ratio | Without Mortgage | With Mortgage |
| Less than 2.0x | 458 (21.4%) | 149,783 (2,307.2%) |
| 2.0x to 2.9x | 312 (14.6%) | 1,769 (27.3%) |
| 3.0x to 3.9x | 307 (14.3%) | 2,065 (31.8%) |
| 4.0x or more | 1,042 (48.6%) | 1,128 (17.4%) |
| Total | 2,143 (100.0%) | 6,492 (100.0%) |
Real Estate Taxes by Mortgage Status in Prior Lake
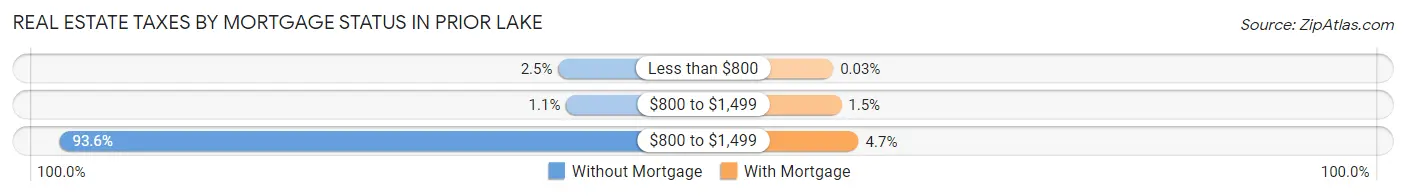
| Property Taxes | Without Mortgage | With Mortgage |
| Less than $800 | 54 (2.5%) | 2 (0.0%) |
| $800 to $1,499 | 23 (1.1%) | 98 (1.5%) |
| $800 to $1,499 | 2,006 (93.6%) | 304 (4.7%) |
| Total | 2,143 (100.0%) | 6,492 (100.0%) |
Health & Disability in Prior Lake
Health Insurance Coverage by Age in Prior Lake
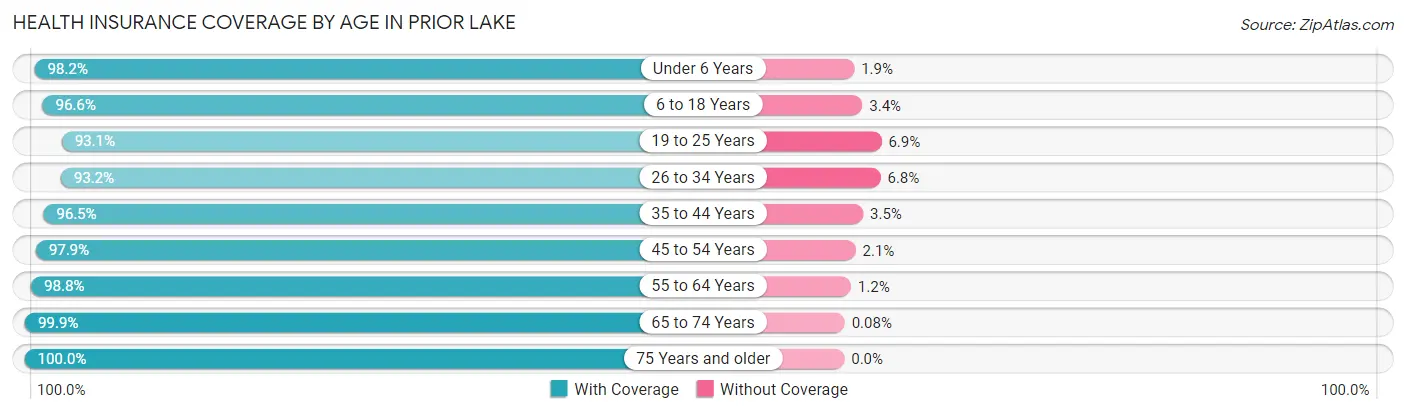
| Age Bracket | With Coverage | Without Coverage |
| Under 6 Years | 1,857 (98.2%) | 35 (1.8%) |
| 6 to 18 Years | 5,405 (96.6%) | 188 (3.4%) |
| 19 to 25 Years | 2,002 (93.1%) | 149 (6.9%) |
| 26 to 34 Years | 2,360 (93.2%) | 171 (6.8%) |
| 35 to 44 Years | 3,845 (96.5%) | 140 (3.5%) |
| 45 to 54 Years | 3,800 (97.9%) | 82 (2.1%) |
| 55 to 64 Years | 3,682 (98.8%) | 46 (1.2%) |
| 65 to 74 Years | 2,361 (99.9%) | 2 (0.1%) |
| 75 Years and older | 1,372 (100.0%) | 0 (0.0%) |
| Total | 26,684 (97.0%) | 813 (3.0%) |
Health Insurance Coverage by Citizenship Status in Prior Lake
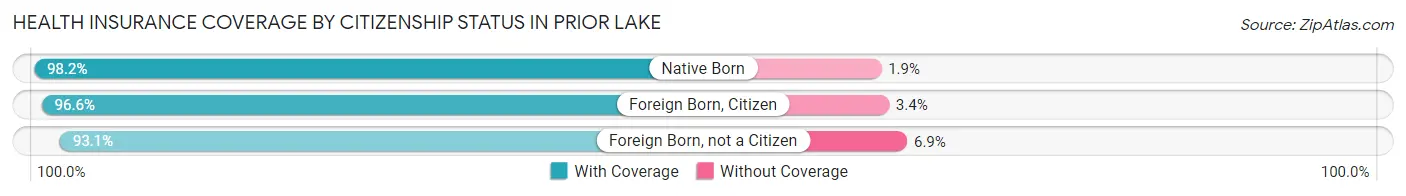
| Citizenship Status | With Coverage | Without Coverage |
| Native Born | 1,857 (98.2%) | 35 (1.8%) |
| Foreign Born, Citizen | 5,405 (96.6%) | 188 (3.4%) |
| Foreign Born, not a Citizen | 2,002 (93.1%) | 149 (6.9%) |
Health Insurance Coverage by Household Income in Prior Lake
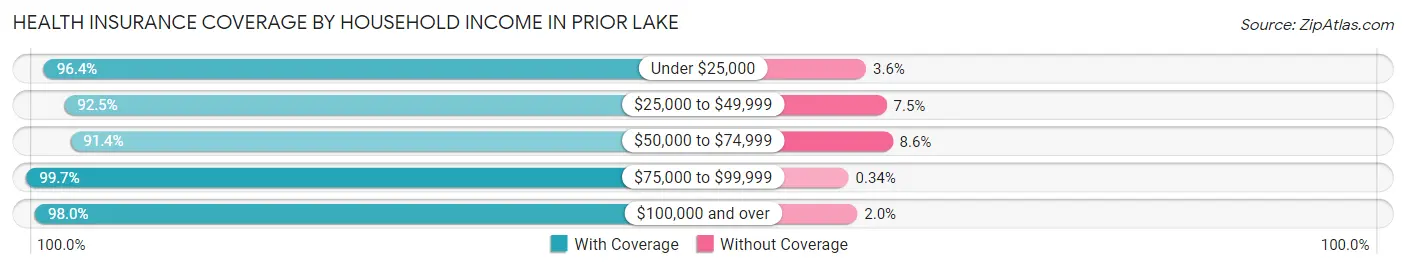
| Household Income | With Coverage | Without Coverage |
| Under $25,000 | 533 (96.4%) | 20 (3.6%) |
| $25,000 to $49,999 | 1,774 (92.5%) | 143 (7.5%) |
| $50,000 to $74,999 | 2,748 (91.4%) | 258 (8.6%) |
| $75,000 to $99,999 | 2,647 (99.7%) | 9 (0.3%) |
| $100,000 and over | 18,972 (98.0%) | 383 (2.0%) |
Public vs Private Health Insurance Coverage by Age in Prior Lake
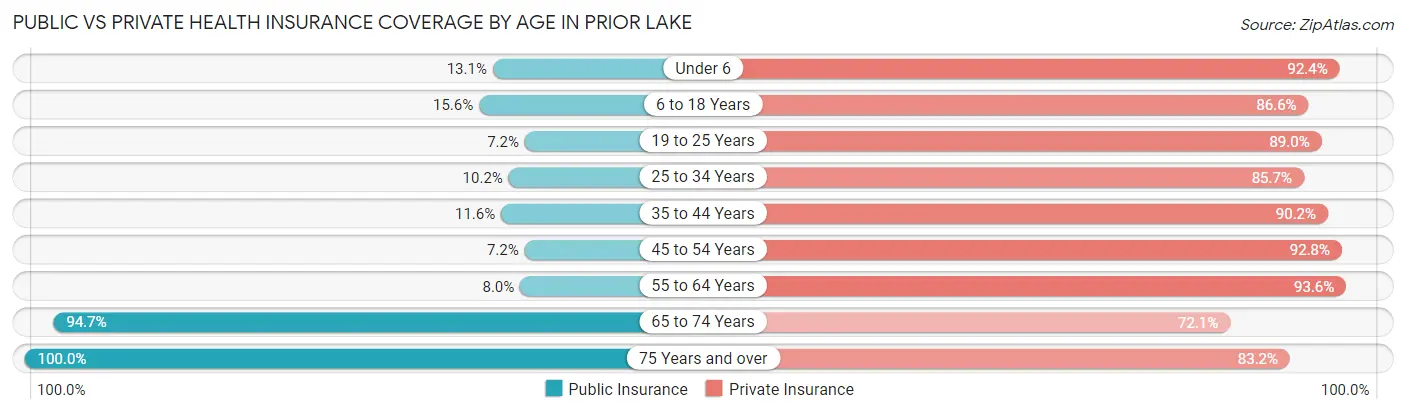
| Age Bracket | Public Insurance | Private Insurance |
| Under 6 | 248 (13.1%) | 1,748 (92.4%) |
| 6 to 18 Years | 875 (15.6%) | 4,844 (86.6%) |
| 19 to 25 Years | 154 (7.2%) | 1,915 (89.0%) |
| 25 to 34 Years | 257 (10.2%) | 2,170 (85.7%) |
| 35 to 44 Years | 461 (11.6%) | 3,595 (90.2%) |
| 45 to 54 Years | 280 (7.2%) | 3,603 (92.8%) |
| 55 to 64 Years | 299 (8.0%) | 3,489 (93.6%) |
| 65 to 74 Years | 2,237 (94.7%) | 1,703 (72.1%) |
| 75 Years and over | 1,372 (100.0%) | 1,141 (83.2%) |
| Total | 6,183 (22.5%) | 24,208 (88.0%) |
Disability Status by Sex by Age in Prior Lake
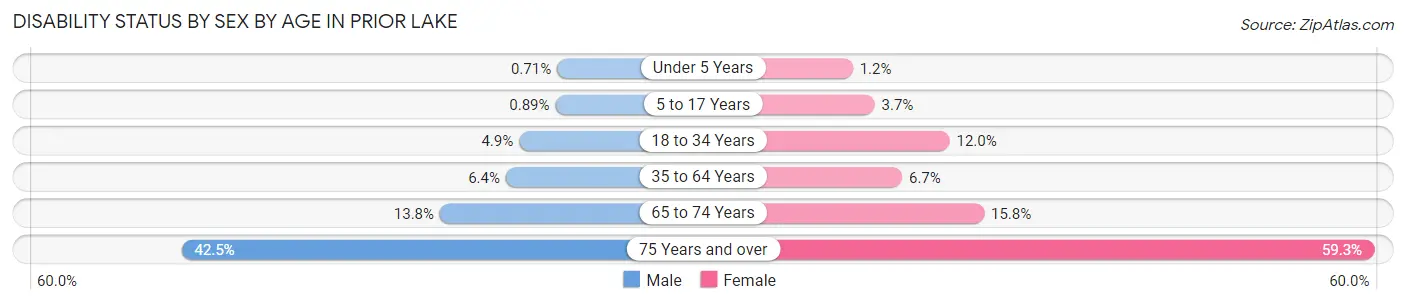
| Age Bracket | Male | Female |
| Under 5 Years | 6 (0.7%) | 8 (1.2%) |
| 5 to 17 Years | 24 (0.9%) | 108 (3.6%) |
| 18 to 34 Years | 124 (4.9%) | 300 (12.0%) |
| 35 to 64 Years | 372 (6.4%) | 389 (6.7%) |
| 65 to 74 Years | 147 (13.8%) | 205 (15.8%) |
| 75 Years and over | 239 (42.5%) | 480 (59.3%) |
Disability Class by Sex by Age in Prior Lake
Disability Class: Hearing Difficulty
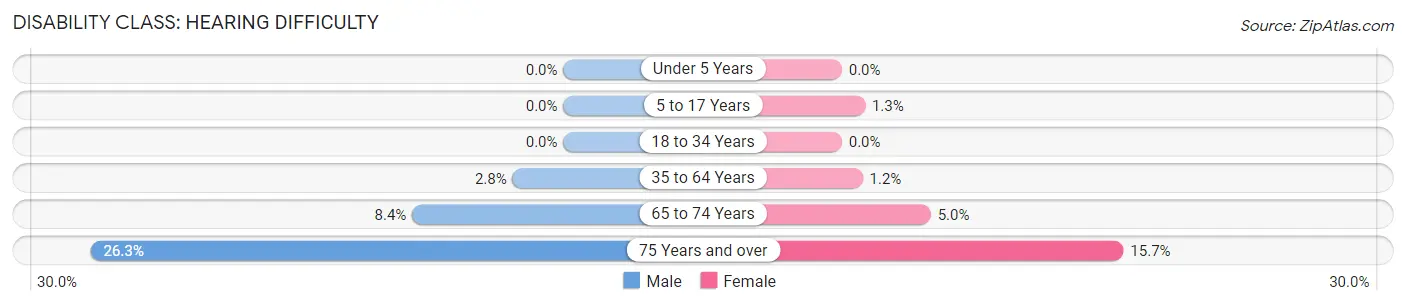
| Age Bracket | Male | Female |
| Under 5 Years | 0 (0.0%) | 0 (0.0%) |
| 5 to 17 Years | 0 (0.0%) | 38 (1.3%) |
| 18 to 34 Years | 0 (0.0%) | 0 (0.0%) |
| 35 to 64 Years | 164 (2.8%) | 67 (1.2%) |
| 65 to 74 Years | 90 (8.4%) | 64 (5.0%) |
| 75 Years and over | 148 (26.3%) | 127 (15.7%) |
Disability Class: Vision Difficulty
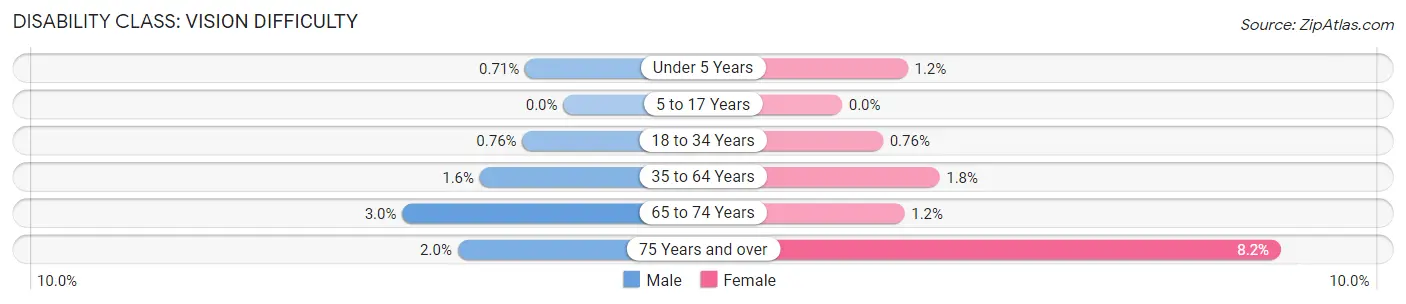
| Age Bracket | Male | Female |
| Under 5 Years | 6 (0.7%) | 8 (1.2%) |
| 5 to 17 Years | 0 (0.0%) | 0 (0.0%) |
| 18 to 34 Years | 19 (0.8%) | 19 (0.8%) |
| 35 to 64 Years | 90 (1.5%) | 105 (1.8%) |
| 65 to 74 Years | 32 (3.0%) | 15 (1.2%) |
| 75 Years and over | 11 (2.0%) | 66 (8.2%) |
Disability Class: Cognitive Difficulty
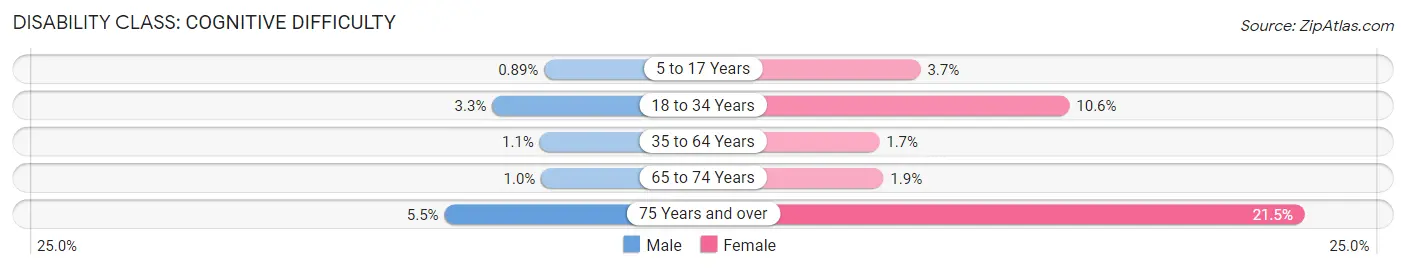
| Age Bracket | Male | Female |
| 5 to 17 Years | 24 (0.9%) | 108 (3.6%) |
| 18 to 34 Years | 83 (3.3%) | 264 (10.6%) |
| 35 to 64 Years | 64 (1.1%) | 101 (1.7%) |
| 65 to 74 Years | 11 (1.0%) | 25 (1.9%) |
| 75 Years and over | 31 (5.5%) | 174 (21.5%) |
Disability Class: Ambulatory Difficulty
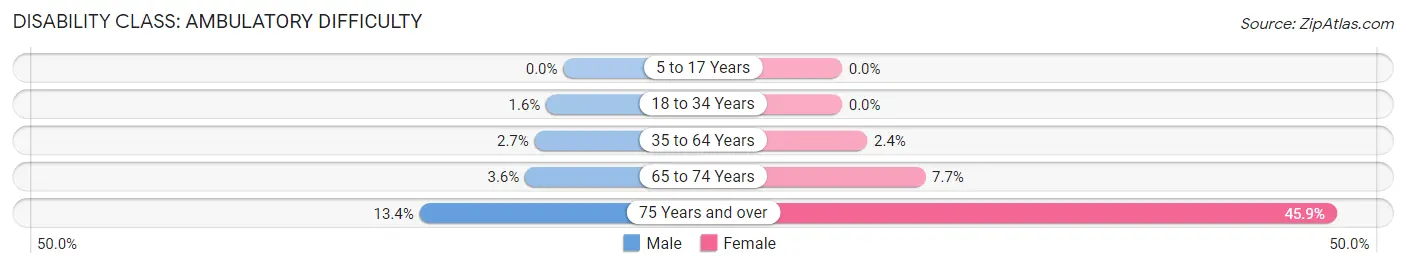
| Age Bracket | Male | Female |
| 5 to 17 Years | 0 (0.0%) | 0 (0.0%) |
| 18 to 34 Years | 40 (1.6%) | 0 (0.0%) |
| 35 to 64 Years | 155 (2.7%) | 136 (2.4%) |
| 65 to 74 Years | 38 (3.5%) | 100 (7.7%) |
| 75 Years and over | 75 (13.4%) | 372 (45.9%) |
Disability Class: Self-Care Difficulty
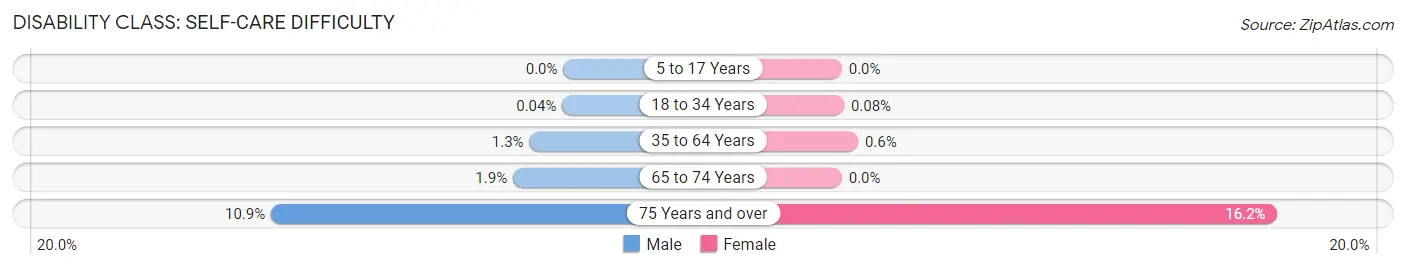
| Age Bracket | Male | Female |
| 5 to 17 Years | 0 (0.0%) | 0 (0.0%) |
| 18 to 34 Years | 1 (0.0%) | 2 (0.1%) |
| 35 to 64 Years | 73 (1.3%) | 35 (0.6%) |
| 65 to 74 Years | 20 (1.9%) | 0 (0.0%) |
| 75 Years and over | 61 (10.8%) | 131 (16.2%) |
Technology Access in Prior Lake
Computing Device Access in Prior Lake
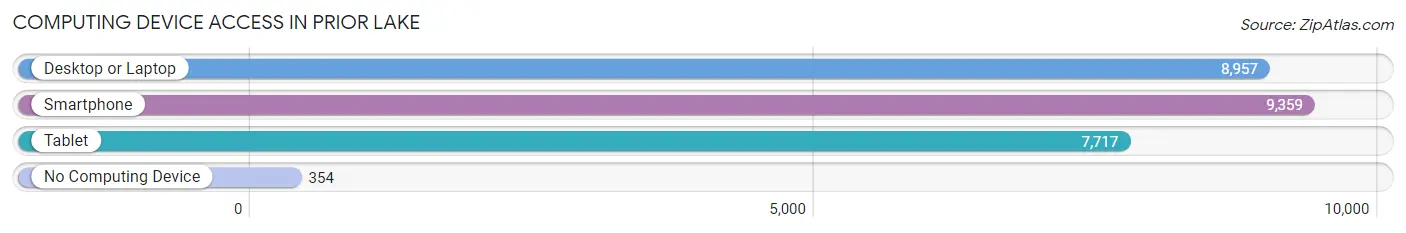
| Device Type | # Households | % Households |
| Desktop or Laptop | 8,957 | 89.4% |
| Smartphone | 9,359 | 93.4% |
| Tablet | 7,717 | 77.0% |
| No Computing Device | 354 | 3.5% |
| Total | 10,021 | 100.0% |
Internet Access in Prior Lake
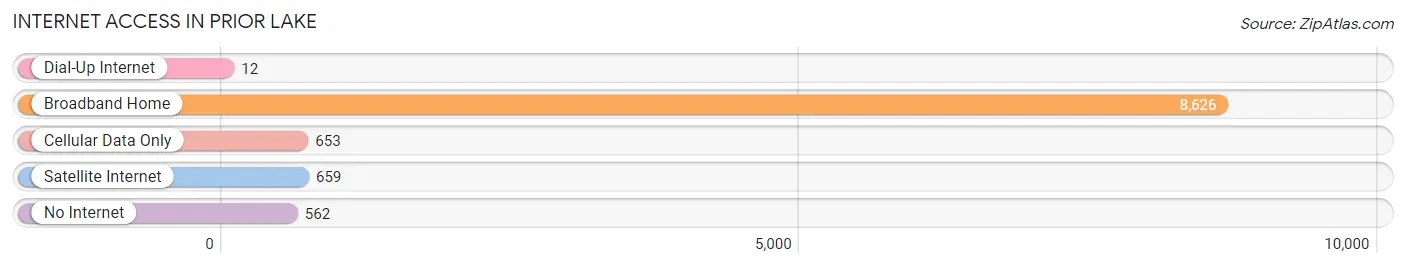
| Internet Type | # Households | % Households |
| Dial-Up Internet | 12 | 0.1% |
| Broadband Home | 8,626 | 86.1% |
| Cellular Data Only | 653 | 6.5% |
| Satellite Internet | 659 | 6.6% |
| No Internet | 562 | 5.6% |
| Total | 10,021 | 100.0% |
Prior Lake Summary
Located in Scott County, Minnesota, Prior Lake is a city of approximately 25,000 people. It is situated on the south shore of Prior Lake, a lake of the same name, and is part of the Minneapolis-St. Paul metropolitan area. Prior Lake is known for its natural beauty, recreational opportunities, and vibrant community.
History
Prior Lake has a long and rich history. The area was first inhabited by the Mdewakanton Dakota people, who lived in the area for centuries before the arrival of European settlers. The first European settlers arrived in the area in the mid-1800s, and the city was officially incorporated in 1891.
Prior Lake was originally a farming community, and the city’s economy was largely based on agriculture. In the early 1900s, the city began to develop as a resort destination, and the area’s population began to grow. In the 1950s, the city began to experience rapid growth, and the population increased from 1,000 to over 10,000 by the 1970s.
Geography
Prior Lake is located in the south-central part of Minnesota, approximately 20 miles southwest of Minneapolis. The city is situated on the south shore of Prior Lake, a lake of the same name. The lake is approximately 4,000 acres in size and is a popular destination for fishing, boating, and other recreational activities.
The city is surrounded by rolling hills and is home to several parks and nature preserves. The city is also home to several golf courses, including the Wilds Golf Club, which is one of the top-rated courses in the state.
Economy
Prior Lake’s economy is largely based on tourism and retail. The city is home to several large retail stores, including Target, Walmart, and Kohl’s. The city is also home to several restaurants, bars, and other entertainment venues.
The city is also home to several large employers, including Mystic Lake Casino, which is the largest employer in the city. Other major employers include the Shakopee Mdewakanton Sioux Community, the Prior Lake-Savage School District, and the City of Prior Lake.
Demographics
As of the 2010 census, the population of Prior Lake was 24,569. The racial makeup of the city was 87.3% White, 5.2% African American, 0.7% Native American, 2.3% Asian, 0.1% Pacific Islander, 1.7% from other races, and 2.9% from two or more races. Hispanic or Latino of any race were 4.3% of the population.
The median household income in Prior Lake was $76,845, and the median family income was $90,945. The per capita income for the city was $35,945. About 4.2% of families and 5.7% of the population were below the poverty line, including 6.3% of those under age 18 and 4.2% of those age 65 or over.
Prior Lake is a vibrant and growing city with a rich history and a bright future. The city is home to a diverse population and a strong economy, and it offers a variety of recreational opportunities and amenities. With its natural beauty and vibrant community, Prior Lake is an ideal place to live, work, and play.
Common Questions
What is the Total Population of Prior Lake?
Total Population of Prior Lake is 27,608.
What is the Total Male Population of Prior Lake?
Total Male Population of Prior Lake is 13,572.
What is the Total Female Population of Prior Lake?
Total Female Population of Prior Lake is 14,036.
What is the Ratio of Males per 100 Females in Prior Lake?
There are 96.69 Males per 100 Females in Prior Lake.
What is the Ratio of Females per 100 Males in Prior Lake?
There are 103.42 Females per 100 Males in Prior Lake.
What is the Median Population Age in Prior Lake?
Median Population Age in Prior Lake is 39.4 Years.
What is the Average Family Size in Prior Lake
Average Family Size in Prior Lake is 3.2 People.
What is the Average Household Size in Prior Lake
Average Household Size in Prior Lake is 2.8 People.
What is Per Capita Income in Prior Lake?
Per Capita income in Prior Lake is $62,432.
What is the Median Family Income in Prior Lake?
Median Family Income in Prior Lake is $147,520.
What is the Median Household income in Prior Lake?
Median Household Income in Prior Lake is $129,539.
What is Income or Wage Gap in Prior Lake?
Income or Wage Gap in Prior Lake is 28.4%.
Women in Prior Lake earn 71.6 cents for every dollar earned by a man.
What is Inequality or Gini Index in Prior Lake?
Inequality or Gini Index in Prior Lake is 0.44.
How Large is the Labor Force in Prior Lake?
There are 15,877 People in the Labor Forcein in Prior Lake.
What is the Percentage of People in the Labor Force in Prior Lake?
74.9% of People are in the Labor Force in Prior Lake.
What is the Unemployment Rate in Prior Lake?
Unemployment Rate in Prior Lake is 1.5%.