Victoria, MN
Victoria Map
Victoria Overview
10,681
TOTAL POPULATION
5,491
MALE POPULATION
5,190
FEMALE POPULATION
105.80
MALES / 100 FEMALES
94.52
FEMALES / 100 MALES
39.4
MEDIAN AGE
3.1
AVG FAMILY SIZE
2.9
AVG HOUSEHOLD SIZE
$71,237
PER CAPITA INCOME
$192,083
AVG FAMILY INCOME
$179,515
AVG HOUSEHOLD INCOME
41.7%
WAGE / INCOME GAP [ % ]
58.3¢/ $1
WAGE / INCOME GAP [ $ ]
0.34
INEQUALITY / GINI INDEX
6,089
LABOR FORCE [ PEOPLE ]
73.8%
PERCENT IN LABOR FORCE
4.3%
UNEMPLOYMENT RATE
Victoria Zip Codes
Victoria Area Codes
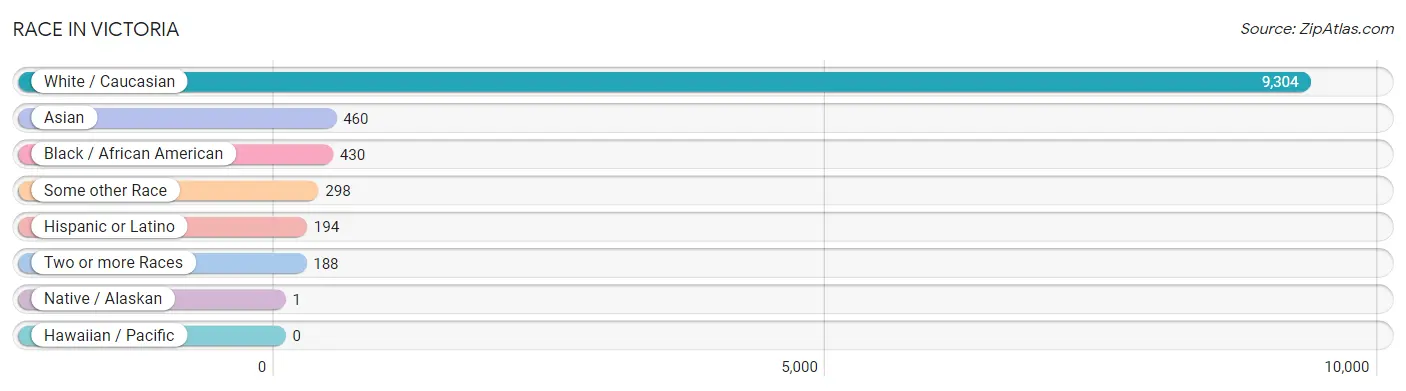
Race in Victoria
The most populous races in Victoria are White / Caucasian (9,304 | 87.1%), Asian (460 | 4.3%), and Black / African American (430 | 4.0%).
| Race | # Population | % Population |
| Asian | 460 | 4.3% |
| Black / African American | 430 | 4.0% |
| Hawaiian / Pacific | 0 | 0.0% |
| Hispanic or Latino | 194 | 1.8% |
| Native / Alaskan | 1 | 0.0% |
| White / Caucasian | 9,304 | 87.1% |
| Two or more Races | 188 | 1.8% |
| Some other Race | 298 | 2.8% |
| Total | 10,681 | 100.0% |
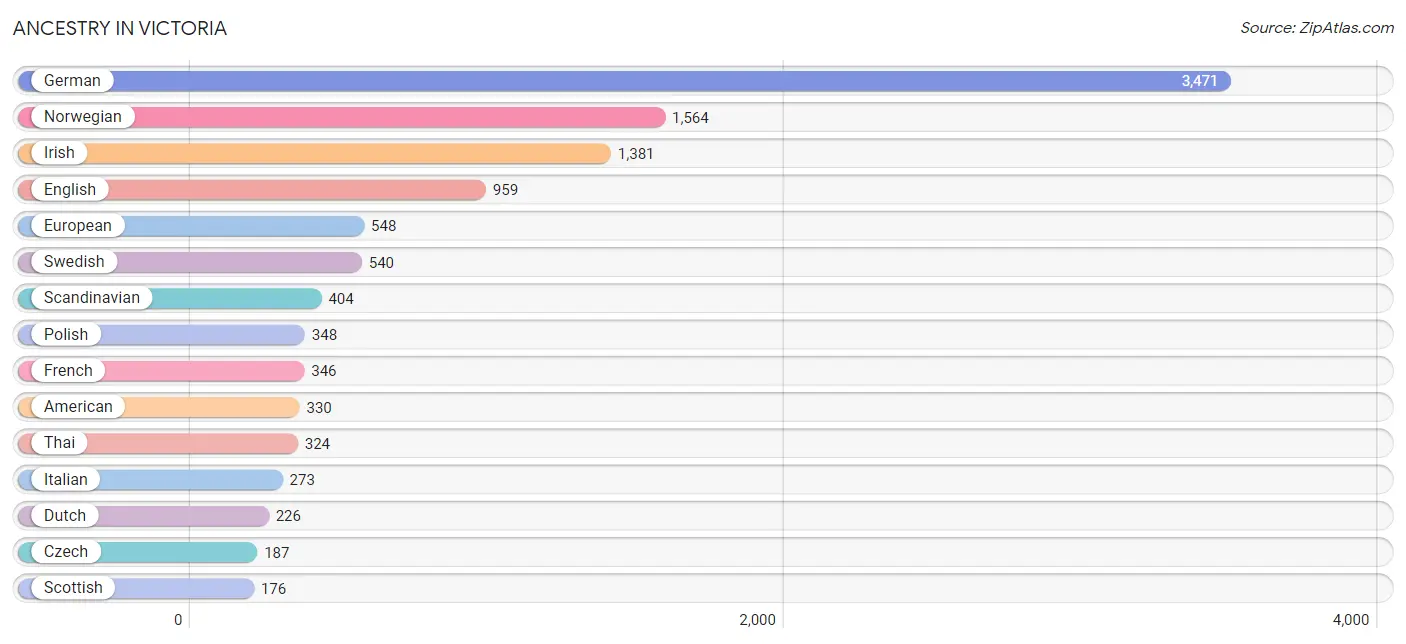
Ancestry in Victoria
The most populous ancestries reported in Victoria are German (3,471 | 32.5%), Norwegian (1,564 | 14.6%), Irish (1,381 | 12.9%), English (959 | 9.0%), and European (548 | 5.1%), together accounting for 74.2% of all Victoria residents.
| Ancestry | # Population | % Population |
| American | 330 | 3.1% |
| Arab | 35 | 0.3% |
| Bangladeshi | 1 | 0.0% |
| Bhutanese | 14 | 0.1% |
| British | 77 | 0.7% |
| Canadian | 73 | 0.7% |
| Central American | 16 | 0.2% |
| Central American Indian | 16 | 0.2% |
| Cherokee | 1 | 0.0% |
| Chippewa | 1 | 0.0% |
| Croatian | 6 | 0.1% |
| Czech | 187 | 1.8% |
| Czechoslovakian | 16 | 0.2% |
| Danish | 143 | 1.3% |
| Dutch | 226 | 2.1% |
| Eastern European | 33 | 0.3% |
| English | 959 | 9.0% |
| European | 548 | 5.1% |
| Filipino | 10 | 0.1% |
| Finnish | 133 | 1.3% |
| French | 346 | 3.2% |
| French Canadian | 23 | 0.2% |
| German | 3,471 | 32.5% |
| Greek | 9 | 0.1% |
| Guatemalan | 16 | 0.2% |
| Hungarian | 8 | 0.1% |
| Irish | 1,381 | 12.9% |
| Italian | 273 | 2.6% |
| Japanese | 51 | 0.5% |
| Korean | 44 | 0.4% |
| Latvian | 29 | 0.3% |
| Lebanese | 11 | 0.1% |
| Mexican | 35 | 0.3% |
| Native Hawaiian | 6 | 0.1% |
| Northern European | 32 | 0.3% |
| Norwegian | 1,564 | 14.6% |
| Osage | 4 | 0.0% |
| Pakistani | 71 | 0.7% |
| Pennsylvania German | 7 | 0.1% |
| Peruvian | 1 | 0.0% |
| Polish | 348 | 3.3% |
| Puerto Rican | 99 | 0.9% |
| Romanian | 43 | 0.4% |
| Russian | 27 | 0.3% |
| Samoan | 6 | 0.1% |
| Scandinavian | 404 | 3.8% |
| Scotch-Irish | 67 | 0.6% |
| Scottish | 176 | 1.7% |
| Slovak | 35 | 0.3% |
| South American | 1 | 0.0% |
| Spaniard | 43 | 0.4% |
| Sri Lankan | 37 | 0.4% |
| Swedish | 540 | 5.1% |
| Swiss | 21 | 0.2% |
| Thai | 324 | 3.0% |
| Welsh | 9 | 0.1% | View All 56 Rows |
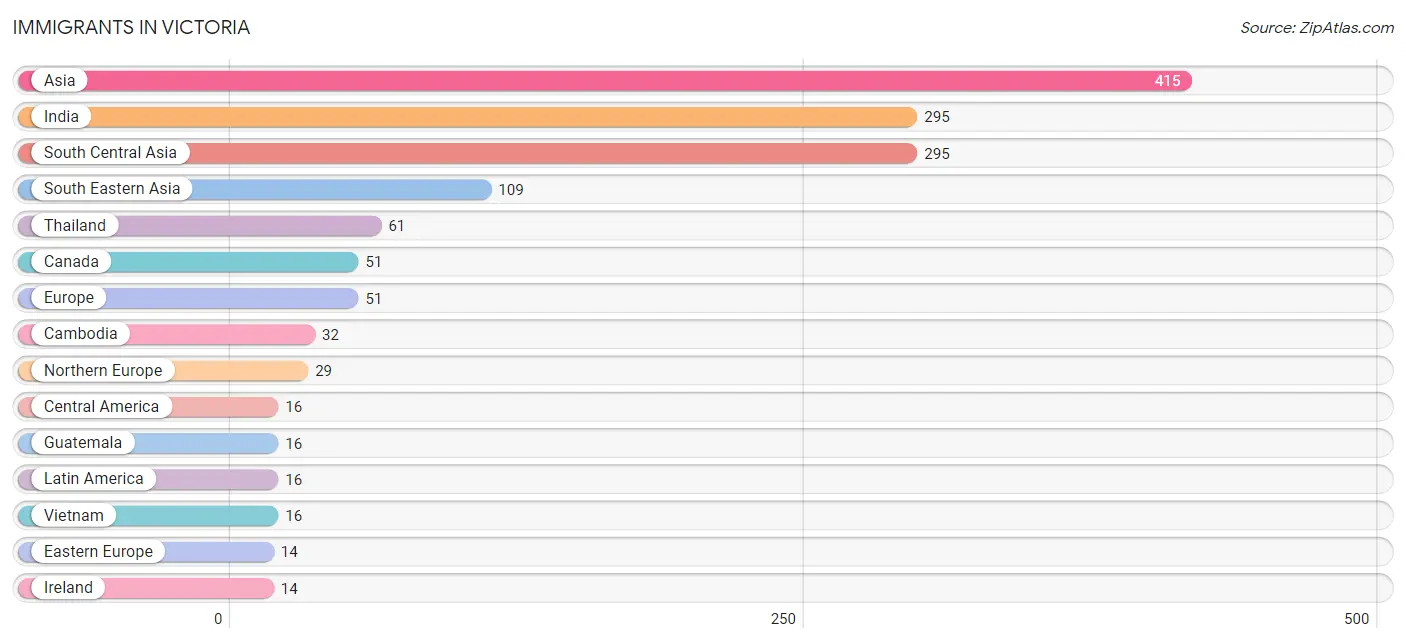
Immigrants in Victoria
The most numerous immigrant groups reported in Victoria came from Asia (415 | 3.9%), India (295 | 2.8%), South Central Asia (295 | 2.8%), South Eastern Asia (109 | 1.0%), and Thailand (61 | 0.6%), together accounting for 11.0% of all Victoria residents.
| Immigration Origin | # Population | % Population |
| Africa | 12 | 0.1% |
| Asia | 415 | 3.9% |
| Cambodia | 32 | 0.3% |
| Canada | 51 | 0.5% |
| Central America | 16 | 0.2% |
| Eastern Europe | 14 | 0.1% |
| Europe | 51 | 0.5% |
| France | 8 | 0.1% |
| Guatemala | 16 | 0.2% |
| India | 295 | 2.8% |
| Ireland | 14 | 0.1% |
| Latin America | 16 | 0.2% |
| Lebanon | 11 | 0.1% |
| Northern Africa | 12 | 0.1% |
| Northern Europe | 29 | 0.3% |
| Romania | 14 | 0.1% |
| South Central Asia | 295 | 2.8% |
| South Eastern Asia | 109 | 1.0% |
| Thailand | 61 | 0.6% |
| Vietnam | 16 | 0.2% |
| Western Asia | 11 | 0.1% |
| Western Europe | 8 | 0.1% | View All 22 Rows |
Sex and Age in Victoria
Sex and Age in Victoria
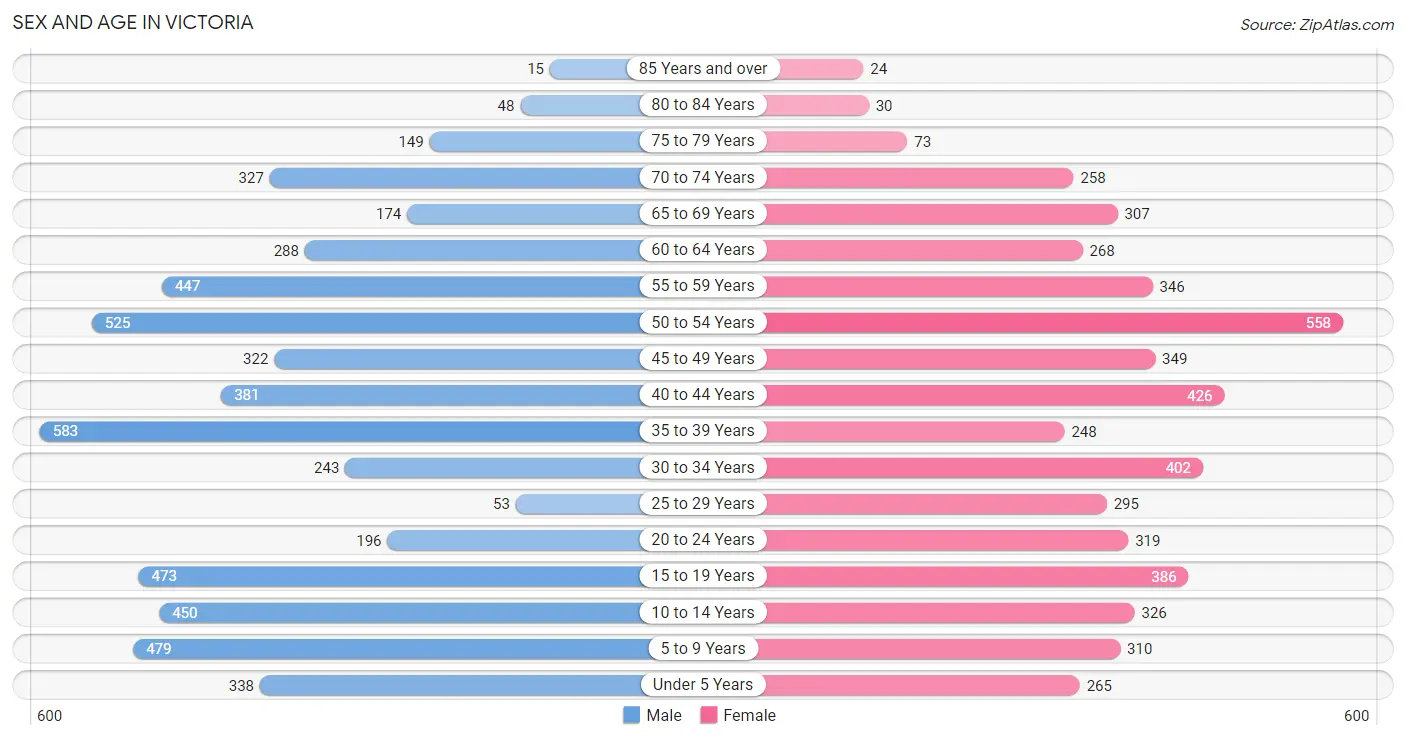
The most populous age groups in Victoria are 35 to 39 Years (583 | 10.6%) for men and 50 to 54 Years (558 | 10.7%) for women.
| Age Bracket | Male | Female |
| Under 5 Years | 338 (6.2%) | 265 (5.1%) |
| 5 to 9 Years | 479 (8.7%) | 310 (6.0%) |
| 10 to 14 Years | 450 (8.2%) | 326 (6.3%) |
| 15 to 19 Years | 473 (8.6%) | 386 (7.4%) |
| 20 to 24 Years | 196 (3.6%) | 319 (6.1%) |
| 25 to 29 Years | 53 (1.0%) | 295 (5.7%) |
| 30 to 34 Years | 243 (4.4%) | 402 (7.7%) |
| 35 to 39 Years | 583 (10.6%) | 248 (4.8%) |
| 40 to 44 Years | 381 (6.9%) | 426 (8.2%) |
| 45 to 49 Years | 322 (5.9%) | 349 (6.7%) |
| 50 to 54 Years | 525 (9.6%) | 558 (10.7%) |
| 55 to 59 Years | 447 (8.1%) | 346 (6.7%) |
| 60 to 64 Years | 288 (5.2%) | 268 (5.2%) |
| 65 to 69 Years | 174 (3.2%) | 307 (5.9%) |
| 70 to 74 Years | 327 (6.0%) | 258 (5.0%) |
| 75 to 79 Years | 149 (2.7%) | 73 (1.4%) |
| 80 to 84 Years | 48 (0.9%) | 30 (0.6%) |
| 85 Years and over | 15 (0.3%) | 24 (0.5%) |
| Total | 5,491 (100.0%) | 5,190 (100.0%) |
Families and Households in Victoria
Median Family Size in Victoria
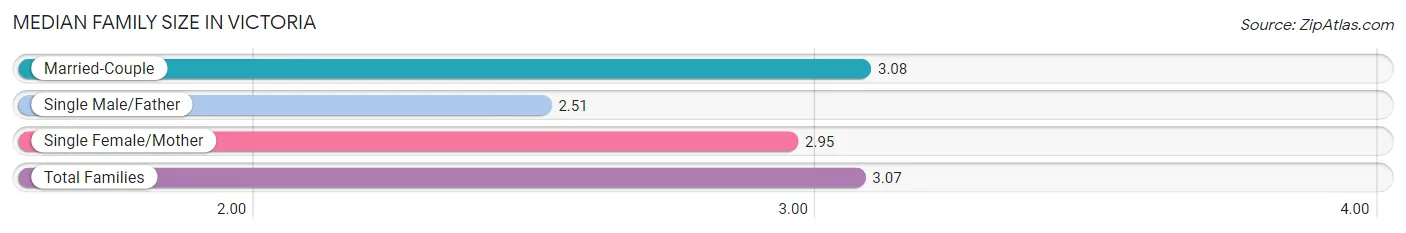
The median family size in Victoria is 3.07 persons per family, with married-couple families (2,955 | 91.5%) accounting for the largest median family size of 3.08 persons per family. On the other hand, single male/father families (47 | 1.5%) represent the smallest median family size with 2.51 persons per family.
| Family Type | # Families | Family Size |
| Married-Couple | 2,955 (91.5%) | 3.08 |
| Single Male/Father | 47 (1.5%) | 2.51 |
| Single Female/Mother | 227 (7.0%) | 2.95 |
| Total Families | 3,229 (100.0%) | 3.07 |
Median Household Size in Victoria
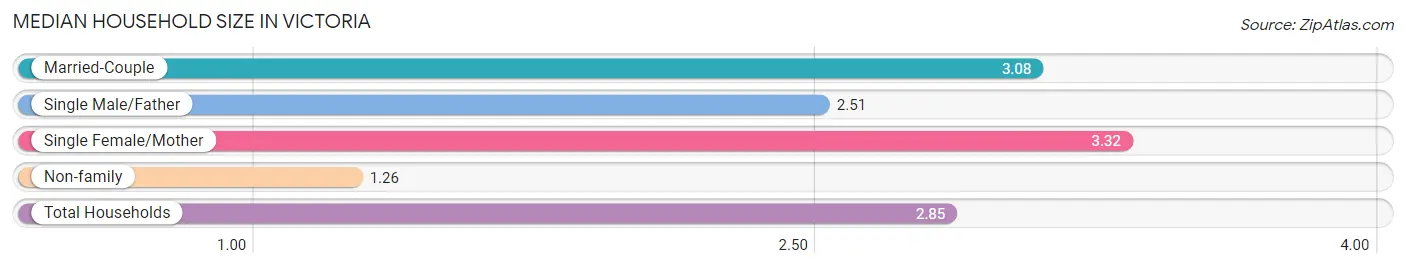
The median household size in Victoria is 2.85 persons per household, with single female/mother households (227 | 6.1%) accounting for the largest median household size of 3.32 persons per household. non-family households (480 | 12.9%) represent the smallest median household size with 1.26 persons per household.
| Household Type | # Households | Household Size |
| Married-Couple | 2,955 (79.7%) | 3.08 |
| Single Male/Father | 47 (1.3%) | 2.51 |
| Single Female/Mother | 227 (6.1%) | 3.32 |
| Non-family | 480 (12.9%) | 1.26 |
| Total Households | 3,709 (100.0%) | 2.85 |
Household Size by Marriage Status in Victoria
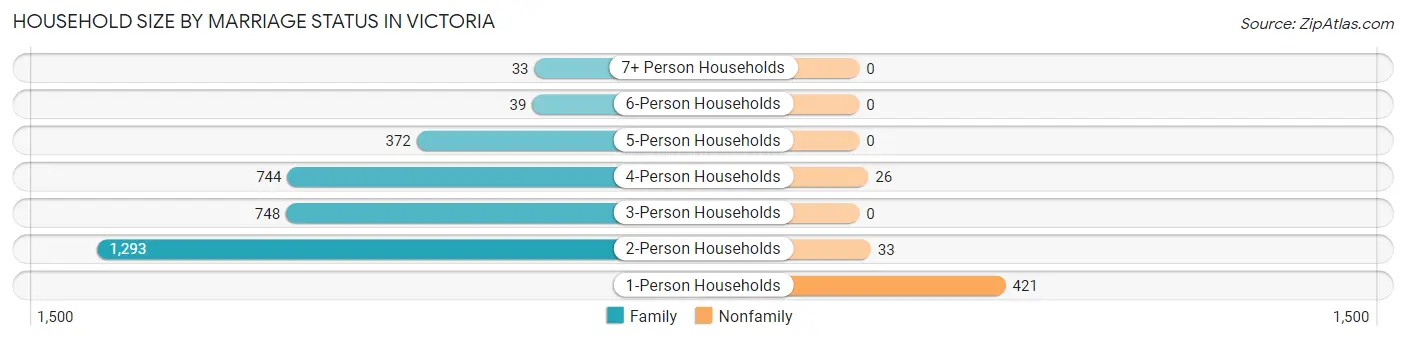
Out of a total of 3,709 households in Victoria, 3,229 (87.1%) are family households, while 480 (12.9%) are nonfamily households. The most numerous type of family households are 2-person households, comprising 1,293, and the most common type of nonfamily households are 1-person households, comprising 421.
| Household Size | Family Households | Nonfamily Households |
| 1-Person Households | - | 421 (11.4%) |
| 2-Person Households | 1,293 (34.9%) | 33 (0.9%) |
| 3-Person Households | 748 (20.2%) | 0 (0.0%) |
| 4-Person Households | 744 (20.1%) | 26 (0.7%) |
| 5-Person Households | 372 (10.0%) | 0 (0.0%) |
| 6-Person Households | 39 (1.1%) | 0 (0.0%) |
| 7+ Person Households | 33 (0.9%) | 0 (0.0%) |
| Total | 3,229 (87.1%) | 480 (12.9%) |
Female Fertility in Victoria
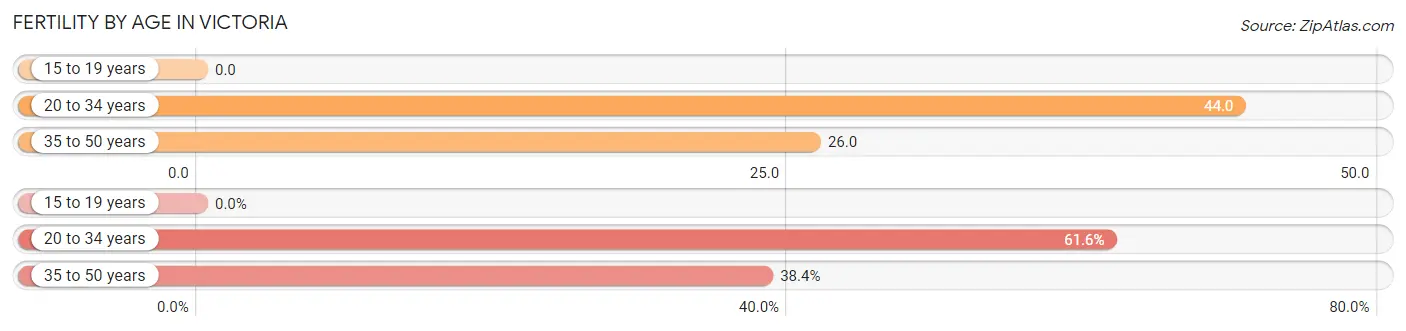
Fertility by Age in Victoria
Average fertility rate in Victoria is 30.0 births per 1,000 women. Women in the age bracket of 20 to 34 years have the highest fertility rate with 44.0 births per 1,000 women. Women in the age bracket of 20 to 34 years acount for 61.6% of all women with births.
| Age Bracket | Women with Births | Births / 1,000 Women |
| 15 to 19 years | 0 (0.0%) | 0.0 |
| 20 to 34 years | 45 (61.6%) | 44.0 |
| 35 to 50 years | 28 (38.4%) | 26.0 |
| Total | 73 (100.0%) | 30.0 |
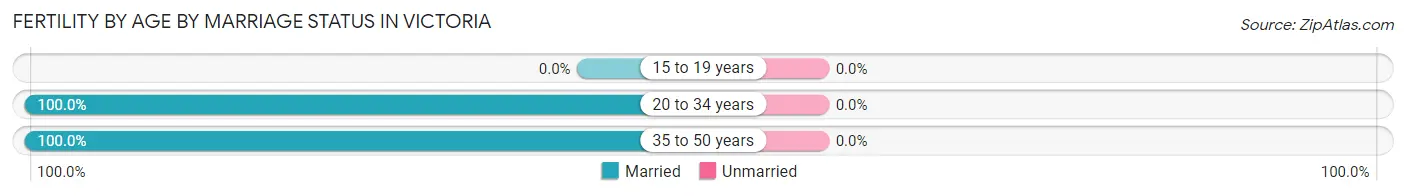
Fertility by Age by Marriage Status in Victoria
| Age Bracket | Married | Unmarried |
| 15 to 19 years | 0 (0.0%) | 0 (0.0%) |
| 20 to 34 years | 45 (100.0%) | 0 (0.0%) |
| 35 to 50 years | 28 (100.0%) | 0 (0.0%) |
| Total | 73 (100.0%) | 0 (0.0%) |
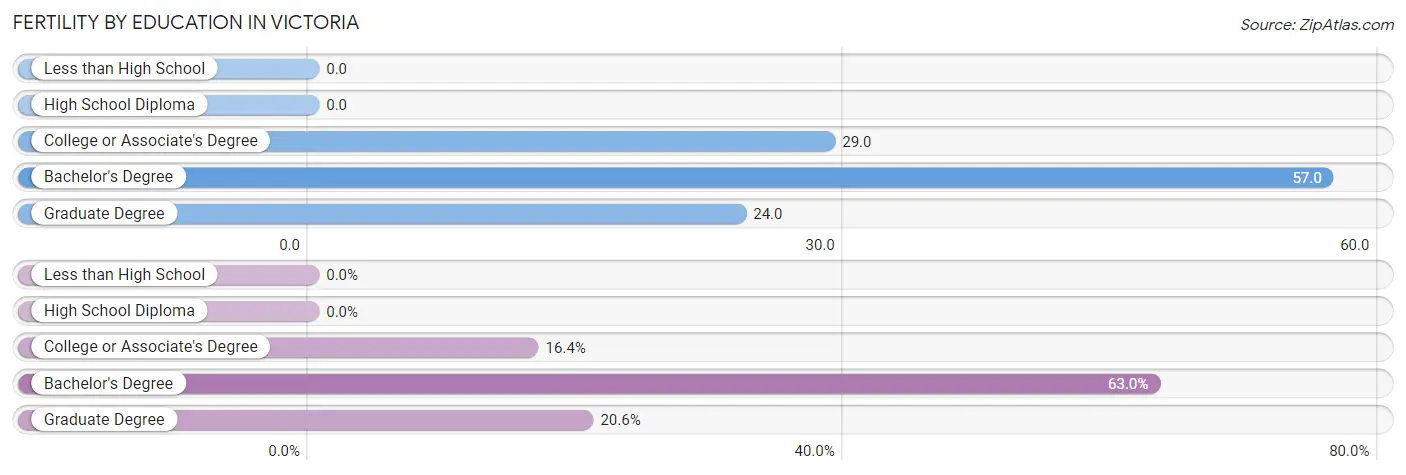
Fertility by Education in Victoria
| Educational Attainment | Women with Births | Births / 1,000 Women |
| Less than High School | 0 (0.0%) | 0.0 |
| High School Diploma | 0 (0.0%) | 0.0 |
| College or Associate's Degree | 12 (16.4%) | 29.0 |
| Bachelor's Degree | 46 (63.0%) | 57.0 |
| Graduate Degree | 15 (20.5%) | 24.0 |
| Total | 73 (100.0%) | 30.0 |
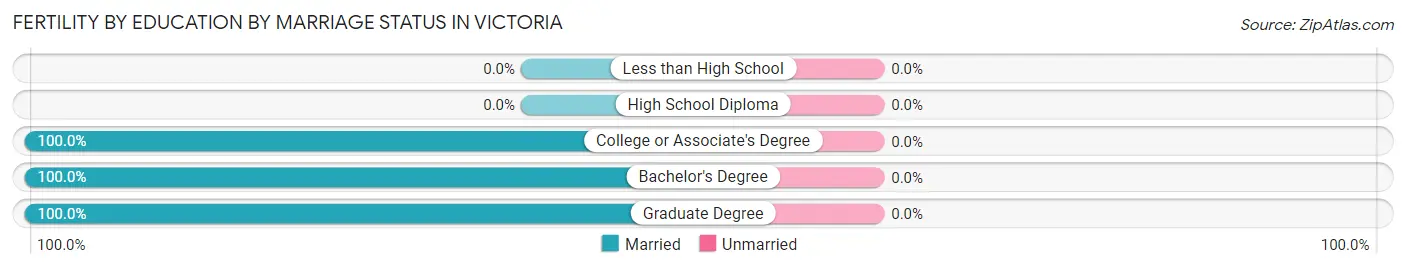
Fertility by Education by Marriage Status in Victoria
| Educational Attainment | Married | Unmarried |
| Less than High School | 0 (0.0%) | 0 (0.0%) |
| High School Diploma | 0 (0.0%) | 0 (0.0%) |
| College or Associate's Degree | 12 (100.0%) | 0 (0.0%) |
| Bachelor's Degree | 46 (100.0%) | 0 (0.0%) |
| Graduate Degree | 15 (100.0%) | 0 (0.0%) |
| Total | 73 (100.0%) | 0 (0.0%) |
Income in Victoria
Income Overview in Victoria
Per Capita Income in Victoria is $71,237, while median incomes of families and households are $192,083 and $179,515 respectively.
| Characteristic | Number | Measure |
| Per Capita Income | 10,681 | $71,237 |
| Median Family Income | 3,229 | $192,083 |
| Mean Family Income | 3,229 | $219,434 |
| Median Household Income | 3,709 | $179,515 |
| Mean Household Income | 3,709 | $203,507 |
| Income Deficit | 3,229 | $0 |
| Wage / Income Gap (%) | 10,681 | 41.74% |
| Wage / Income Gap ($) | 10,681 | 58.26¢ per $1 |
| Gini / Inequality Index | 10,681 | 0.34 |
Earnings by Sex in Victoria
Average Earnings in Victoria are $78,556, $94,139 for men and $54,848 for women, a difference of 41.7%.
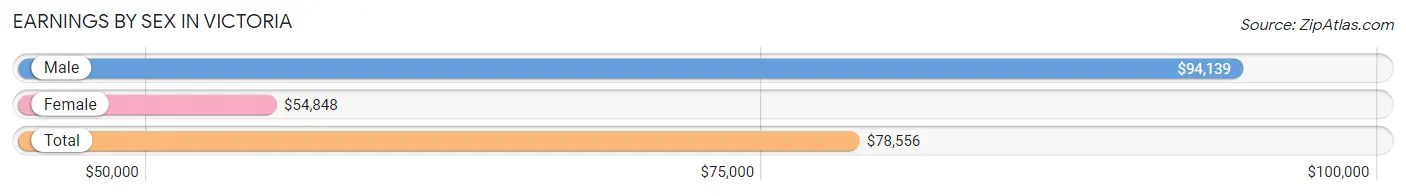
| Sex | Number | Average Earnings |
| Male | 3,340 (52.9%) | $94,139 |
| Female | 2,971 (47.1%) | $54,848 |
| Total | 6,311 (100.0%) | $78,556 |
Earnings by Sex by Income Bracket in Victoria
The most common earnings brackets in Victoria are $100,000+ for men (1,609 | 48.2%) and $100,000+ for women (997 | 33.6%).
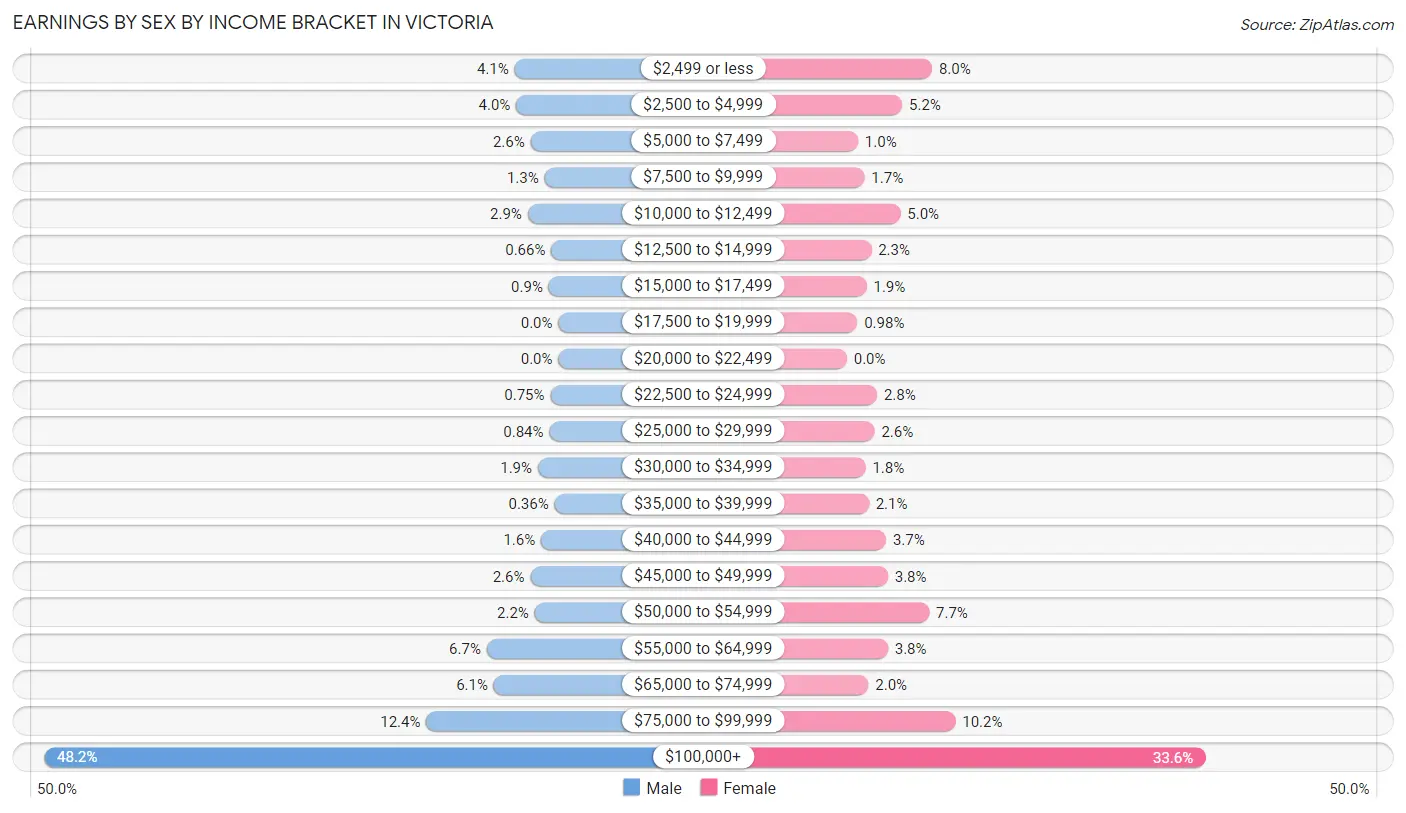
| Income | Male | Female |
| $2,499 or less | 137 (4.1%) | 237 (8.0%) |
| $2,500 to $4,999 | 132 (4.0%) | 154 (5.2%) |
| $5,000 to $7,499 | 87 (2.6%) | 31 (1.0%) |
| $7,500 to $9,999 | 43 (1.3%) | 49 (1.7%) |
| $10,000 to $12,499 | 96 (2.9%) | 149 (5.0%) |
| $12,500 to $14,999 | 22 (0.7%) | 68 (2.3%) |
| $15,000 to $17,499 | 30 (0.9%) | 55 (1.8%) |
| $17,500 to $19,999 | 0 (0.0%) | 29 (1.0%) |
| $20,000 to $22,499 | 0 (0.0%) | 0 (0.0%) |
| $22,500 to $24,999 | 25 (0.7%) | 84 (2.8%) |
| $25,000 to $29,999 | 28 (0.8%) | 77 (2.6%) |
| $30,000 to $34,999 | 64 (1.9%) | 52 (1.8%) |
| $35,000 to $39,999 | 12 (0.4%) | 61 (2.1%) |
| $40,000 to $44,999 | 54 (1.6%) | 109 (3.7%) |
| $45,000 to $49,999 | 88 (2.6%) | 114 (3.8%) |
| $50,000 to $54,999 | 74 (2.2%) | 229 (7.7%) |
| $55,000 to $64,999 | 224 (6.7%) | 114 (3.8%) |
| $65,000 to $74,999 | 202 (6.0%) | 60 (2.0%) |
| $75,000 to $99,999 | 413 (12.4%) | 302 (10.2%) |
| $100,000+ | 1,609 (48.2%) | 997 (33.6%) |
| Total | 3,340 (100.0%) | 2,971 (100.0%) |
Earnings by Sex by Educational Attainment in Victoria
Average earnings in Victoria are $110,329 for men and $72,273 for women, a difference of 34.5%. Men with an educational attainment of graduate degree enjoy the highest average annual earnings of $154,164, while those with high school diploma education earn the least with $49,750. Women with an educational attainment of graduate degree earn the most with the average annual earnings of $108,169, while those with college or associate's degree education have the smallest earnings of $57,237.
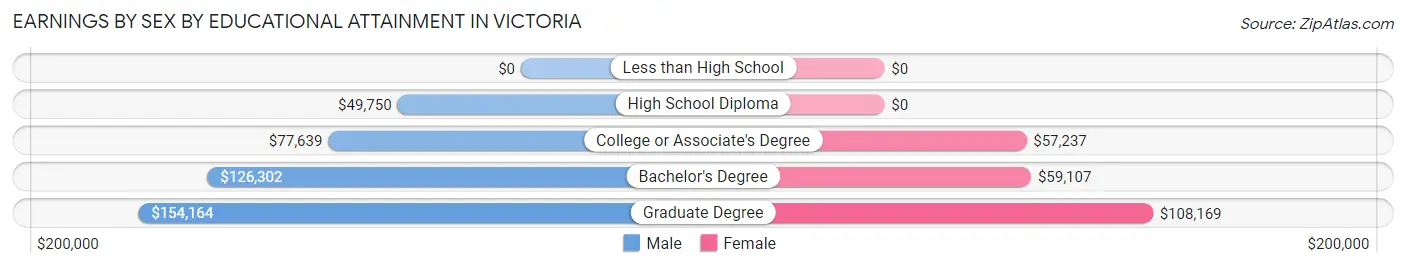
| Educational Attainment | Male Income | Female Income |
| Less than High School | - | - |
| High School Diploma | $49,750 | $0 |
| College or Associate's Degree | $77,639 | $57,237 |
| Bachelor's Degree | $126,302 | $59,107 |
| Graduate Degree | $154,164 | $108,169 |
| Total | $110,329 | $72,273 |
Family Income in Victoria
Family Income Brackets in Victoria
According to the Victoria family income data, there are 1,560 families falling into the $200,000+ income range, which is the most common income bracket and makes up 48.3% of all families.
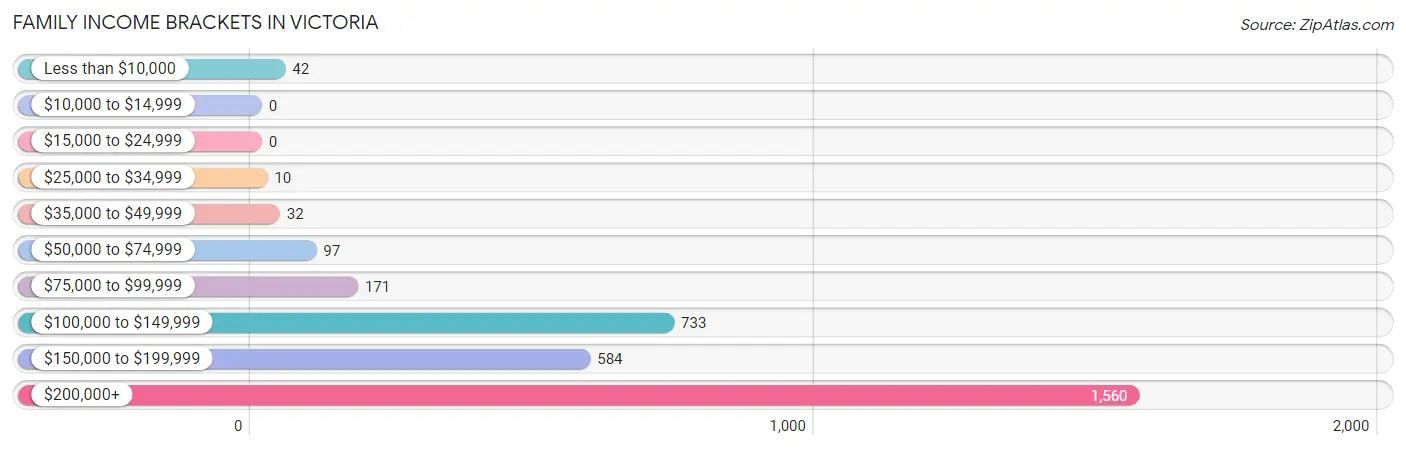
| Income Bracket | # Families | % Families |
| Less than $10,000 | 42 | 1.3% |
| $10,000 to $14,999 | 0 | 0.0% |
| $15,000 to $24,999 | 0 | 0.0% |
| $25,000 to $34,999 | 10 | 0.3% |
| $35,000 to $49,999 | 32 | 1.0% |
| $50,000 to $74,999 | 97 | 3.0% |
| $75,000 to $99,999 | 171 | 5.3% |
| $100,000 to $149,999 | 733 | 22.7% |
| $150,000 to $199,999 | 584 | 18.1% |
| $200,000+ | 1,560 | 48.3% |
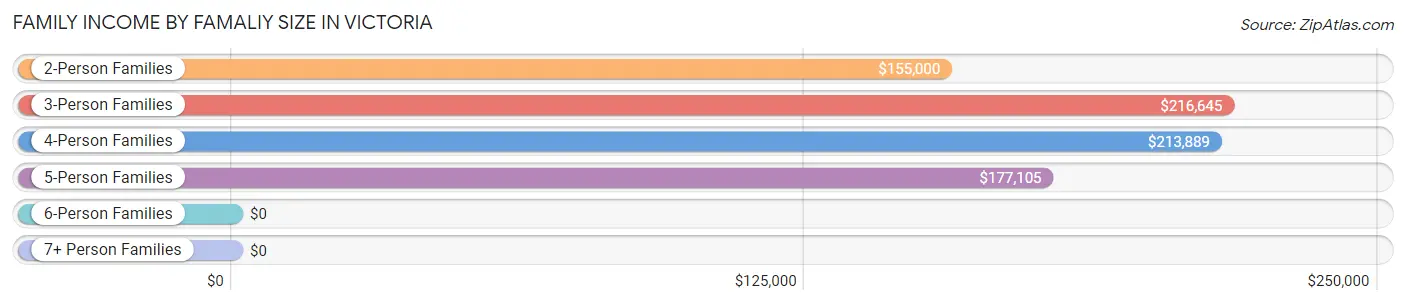
Family Income by Famaliy Size in Victoria
3-person families (711 | 22.0%) account for the highest median family income in Victoria with $216,645 per family, while 2-person families (1,350 | 41.8%) have the highest median income of $77,500 per family member.
| Income Bracket | # Families | Median Income |
| 2-Person Families | 1,350 (41.8%) | $155,000 |
| 3-Person Families | 711 (22.0%) | $216,645 |
| 4-Person Families | 724 (22.4%) | $213,889 |
| 5-Person Families | 372 (11.5%) | $177,105 |
| 6-Person Families | 39 (1.2%) | $0 |
| 7+ Person Families | 33 (1.0%) | $0 |
| Total | 3,229 (100.0%) | $192,083 |
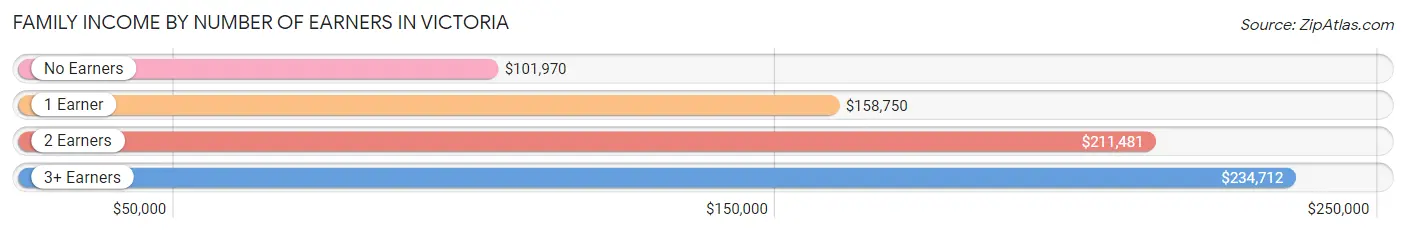
Family Income by Number of Earners in Victoria
The median family income in Victoria is $192,083, with families comprising 3+ earners (593) having the highest median family income of $234,712, while families with no earners (434) have the lowest median family income of $101,970, accounting for 18.4% and 13.4% of families, respectively.
| Number of Earners | # Families | Median Income |
| No Earners | 434 (13.4%) | $101,970 |
| 1 Earner | 574 (17.8%) | $158,750 |
| 2 Earners | 1,628 (50.4%) | $211,481 |
| 3+ Earners | 593 (18.4%) | $234,712 |
| Total | 3,229 (100.0%) | $192,083 |
Household Income in Victoria
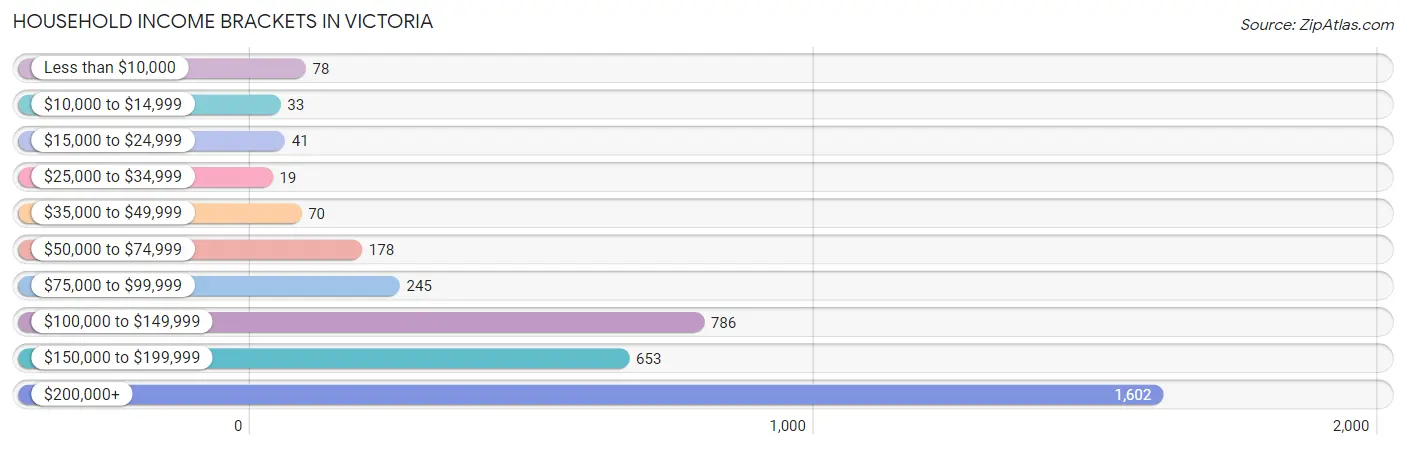
Household Income Brackets in Victoria
With 1,602 households falling in the category, the $200,000+ income range is the most frequent in Victoria, accounting for 43.2% of all households. In contrast, only 19 households (0.5%) fall into the $25,000 to $34,999 income bracket, making it the least populous group.
| Income Bracket | # Households | % Households |
| Less than $10,000 | 78 | 2.1% |
| $10,000 to $14,999 | 33 | 0.9% |
| $15,000 to $24,999 | 41 | 1.1% |
| $25,000 to $34,999 | 19 | 0.5% |
| $35,000 to $49,999 | 70 | 1.9% |
| $50,000 to $74,999 | 178 | 4.8% |
| $75,000 to $99,999 | 245 | 6.6% |
| $100,000 to $149,999 | 786 | 21.2% |
| $150,000 to $199,999 | 653 | 17.6% |
| $200,000+ | 1,602 | 43.2% |
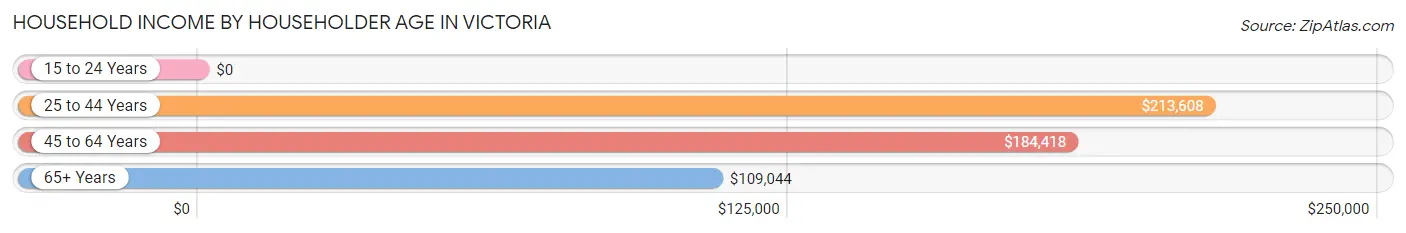
Household Income by Householder Age in Victoria
The median household income in Victoria is $179,515, with the highest median household income of $213,608 found in the 25 to 44 years age bracket for the primary householder. A total of 1,221 households (32.9%) fall into this category. Meanwhile, the 15 to 24 years age bracket for the primary householder has the lowest median household income of $0, with 20 households (0.5%) in this group.
| Income Bracket | # Households | Median Income |
| 15 to 24 Years | 20 (0.5%) | $0 |
| 25 to 44 Years | 1,221 (32.9%) | $213,608 |
| 45 to 64 Years | 1,689 (45.5%) | $184,418 |
| 65+ Years | 779 (21.0%) | $109,044 |
| Total | 3,709 (100.0%) | $179,515 |
Poverty in Victoria
Income Below Poverty by Sex and Age in Victoria
With 2.2% poverty level for males and 2.5% for females among the residents of Victoria, 75 year old and over males and 55 to 64 year old females are the most vulnerable to poverty, with 15 males (7.1%) and 61 females (9.9%) in their respective age groups living below the poverty level.
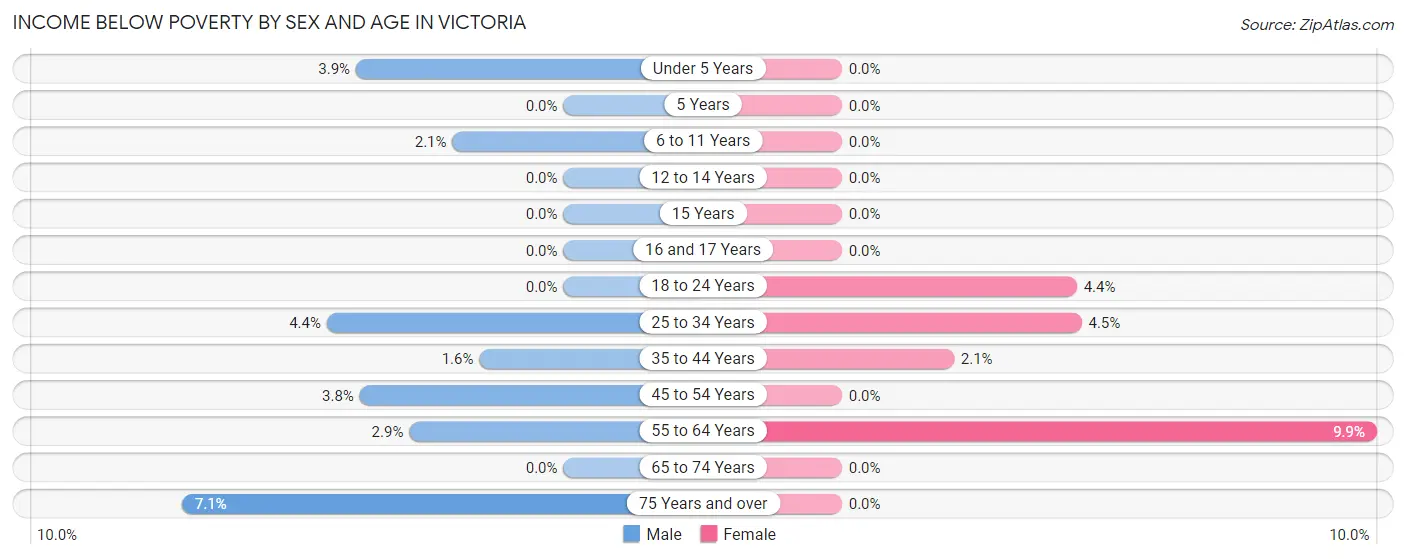
| Age Bracket | Male | Female |
| Under 5 Years | 13 (3.8%) | 0 (0.0%) |
| 5 Years | 0 (0.0%) | 0 (0.0%) |
| 6 to 11 Years | 14 (2.1%) | 0 (0.0%) |
| 12 to 14 Years | 0 (0.0%) | 0 (0.0%) |
| 15 Years | 0 (0.0%) | 0 (0.0%) |
| 16 and 17 Years | 0 (0.0%) | 0 (0.0%) |
| 18 to 24 Years | 0 (0.0%) | 21 (4.4%) |
| 25 to 34 Years | 13 (4.4%) | 31 (4.4%) |
| 35 to 44 Years | 15 (1.6%) | 14 (2.1%) |
| 45 to 54 Years | 32 (3.8%) | 0 (0.0%) |
| 55 to 64 Years | 21 (2.9%) | 61 (9.9%) |
| 65 to 74 Years | 0 (0.0%) | 0 (0.0%) |
| 75 Years and over | 15 (7.1%) | 0 (0.0%) |
| Total | 123 (2.2%) | 127 (2.5%) |
Income Above Poverty by Sex and Age in Victoria
According to the poverty statistics in Victoria, males aged 5 years and females aged under 5 years are the age groups that are most secure financially, with 100.0% of males and 100.0% of females in these age groups living above the poverty line.
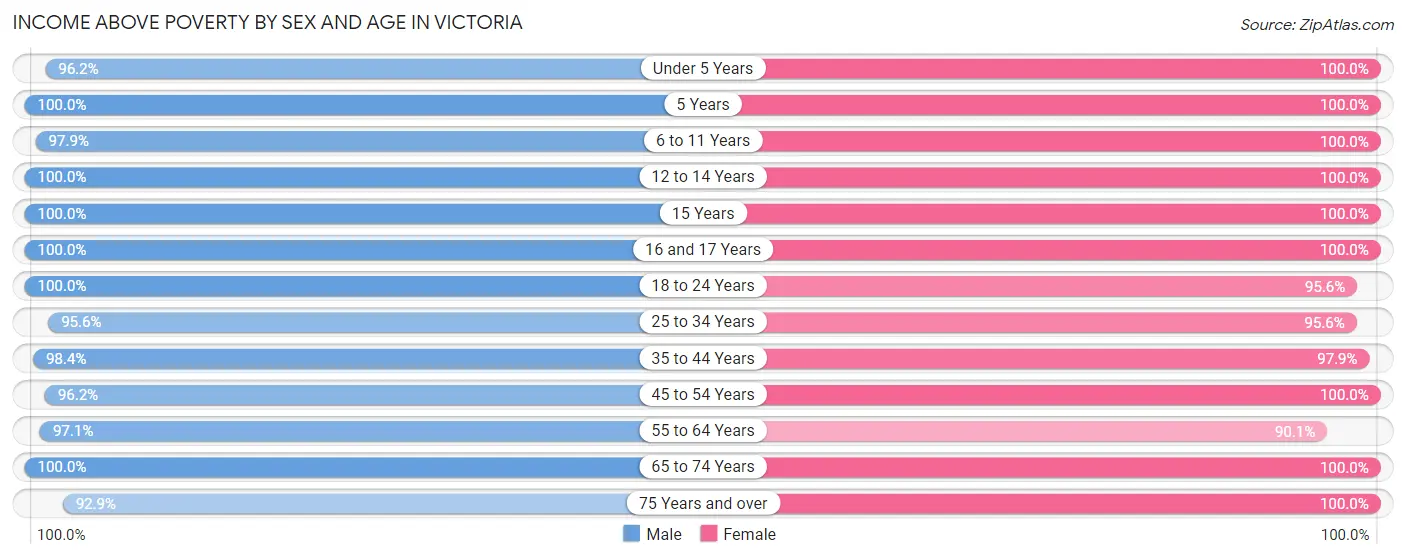
| Age Bracket | Male | Female |
| Under 5 Years | 325 (96.2%) | 265 (100.0%) |
| 5 Years | 63 (100.0%) | 64 (100.0%) |
| 6 to 11 Years | 665 (97.9%) | 306 (100.0%) |
| 12 to 14 Years | 185 (100.0%) | 239 (100.0%) |
| 15 Years | 154 (100.0%) | 108 (100.0%) |
| 16 and 17 Years | 217 (100.0%) | 115 (100.0%) |
| 18 to 24 Years | 294 (100.0%) | 461 (95.6%) |
| 25 to 34 Years | 283 (95.6%) | 666 (95.6%) |
| 35 to 44 Years | 949 (98.4%) | 660 (97.9%) |
| 45 to 54 Years | 815 (96.2%) | 907 (100.0%) |
| 55 to 64 Years | 714 (97.1%) | 553 (90.1%) |
| 65 to 74 Years | 501 (100.0%) | 559 (100.0%) |
| 75 Years and over | 197 (92.9%) | 127 (100.0%) |
| Total | 5,362 (97.8%) | 5,030 (97.5%) |
Income Below Poverty Among Married-Couple Families in Victoria
The poverty statistics for married-couple families in Victoria show that 0.9% or 26 of the total 2,955 families live below the poverty line. Families with 1 or 2 children have the highest poverty rate of 1.4%, comprising of 15 families. On the other hand, families with 3 or 4 children have the lowest poverty rate of 0.0%, which includes 0 families.
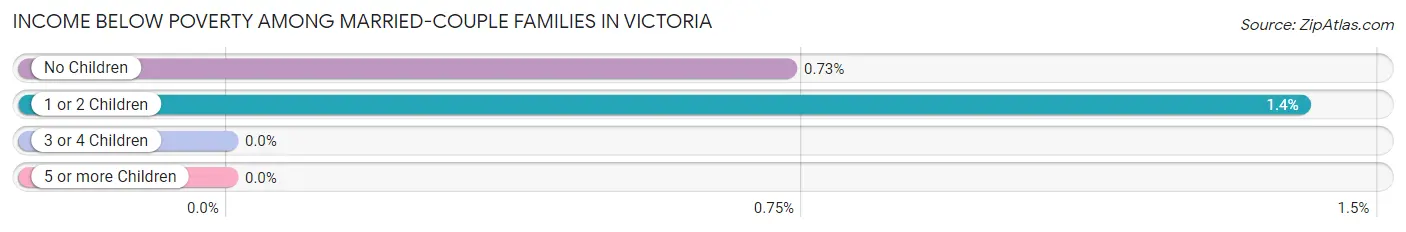
| Children | Above Poverty | Below Poverty |
| No Children | 1,496 (99.3%) | 11 (0.7%) |
| 1 or 2 Children | 1,058 (98.6%) | 15 (1.4%) |
| 3 or 4 Children | 342 (100.0%) | 0 (0.0%) |
| 5 or more Children | 33 (100.0%) | 0 (0.0%) |
| Total | 2,929 (99.1%) | 26 (0.9%) |
Income Below Poverty Among Single-Parent Households in Victoria
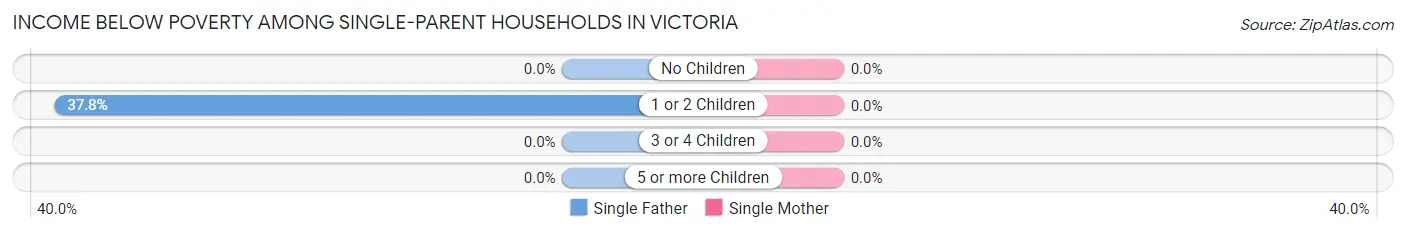
| Children | Single Father | Single Mother |
| No Children | 0 (0.0%) | 0 (0.0%) |
| 1 or 2 Children | 17 (37.8%) | 0 (0.0%) |
| 3 or 4 Children | 0 (0.0%) | 0 (0.0%) |
| 5 or more Children | 0 (0.0%) | 0 (0.0%) |
| Total | 17 (36.2%) | 0 (0.0%) |
Income Below Poverty Among Married-Couple vs Single-Parent Households in Victoria
The poverty data for Victoria shows that 26 of the married-couple family households (0.9%) and 17 of the single-parent households (6.2%) are living below the poverty level. Within the married-couple family households, those with 1 or 2 children have the highest poverty rate, with 15 households (1.4%) falling below the poverty line. Among the single-parent households, those with 1 or 2 children have the highest poverty rate, with 17 household (11.5%) living below poverty.
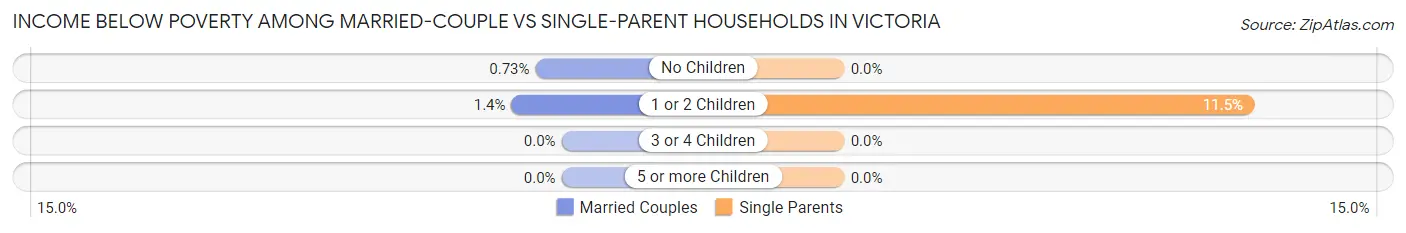
| Children | Married-Couple Families | Single-Parent Households |
| No Children | 11 (0.7%) | 0 (0.0%) |
| 1 or 2 Children | 15 (1.4%) | 17 (11.5%) |
| 3 or 4 Children | 0 (0.0%) | 0 (0.0%) |
| 5 or more Children | 0 (0.0%) | 0 (0.0%) |
| Total | 26 (0.9%) | 17 (6.2%) |
Employment Characteristics in Victoria
Employment by Class of Employer in Victoria
Among the 5,786 employed individuals in Victoria, private company employees (4,132 | 71.4%), not-for-profit organizations (413 | 7.1%), and local government employees (335 | 5.8%) make up the most common classes of employment.
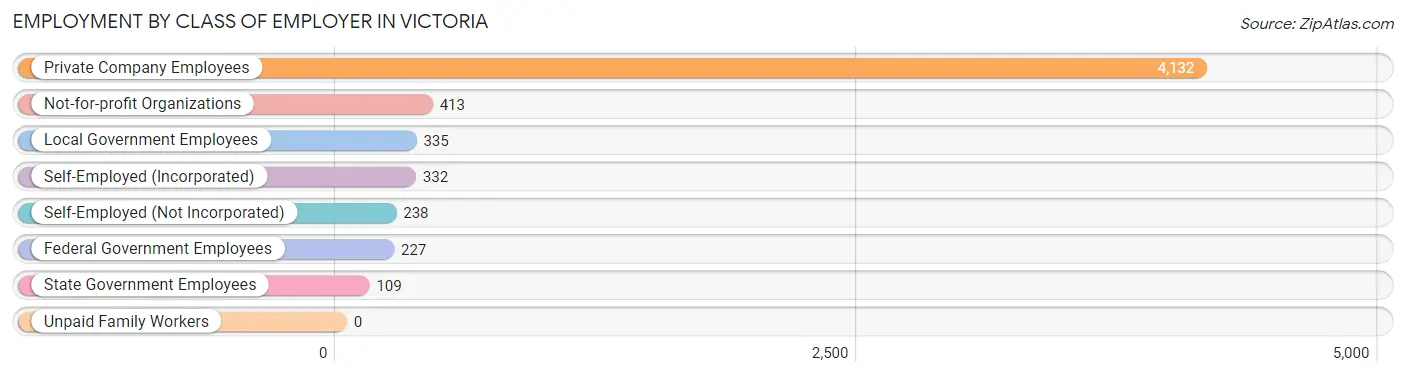
| Employer Class | # Employees | % Employees |
| Private Company Employees | 4,132 | 71.4% |
| Self-Employed (Incorporated) | 332 | 5.7% |
| Self-Employed (Not Incorporated) | 238 | 4.1% |
| Not-for-profit Organizations | 413 | 7.1% |
| Local Government Employees | 335 | 5.8% |
| State Government Employees | 109 | 1.9% |
| Federal Government Employees | 227 | 3.9% |
| Unpaid Family Workers | 0 | 0.0% |
| Total | 5,786 | 100.0% |
Employment Status by Age in Victoria
According to the labor force statistics for Victoria, out of the total population over 16 years of age (8,251), 73.8% or 6,089 individuals are in the labor force, with 4.3% or 262 of them unemployed. The age group with the highest labor force participation rate is 30 to 34 years, with 94.1% or 607 individuals in the labor force. Within the labor force, the 20 to 24 years age range has the highest percentage of unemployed individuals, with 26.5% or 79 of them being unemployed.
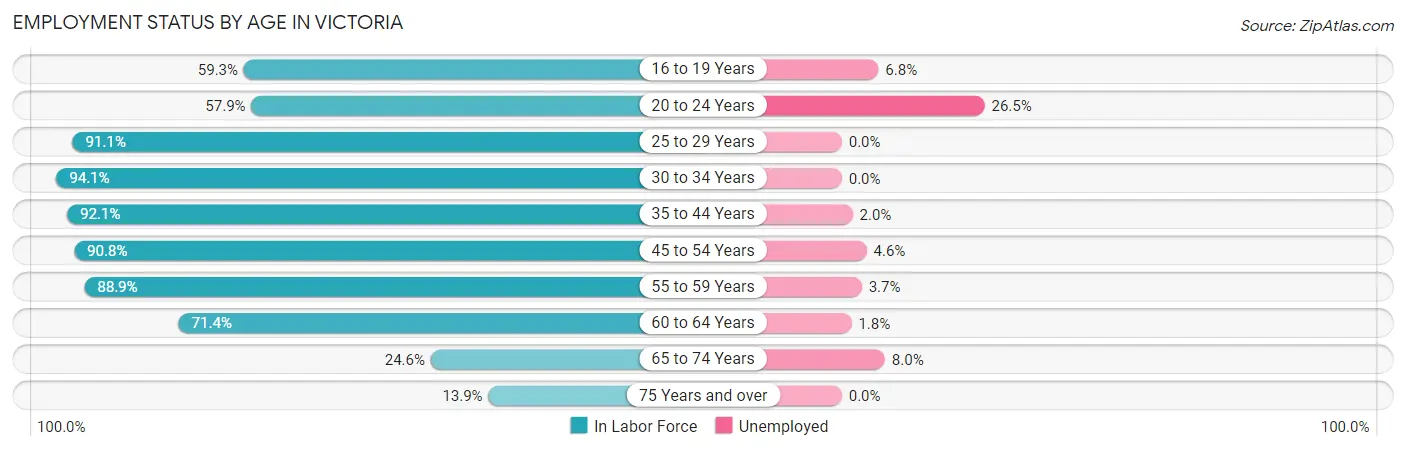
| Age Bracket | In Labor Force | Unemployed |
| 16 to 19 Years | 354 (59.3%) | 24 (6.8%) |
| 20 to 24 Years | 298 (57.9%) | 79 (26.5%) |
| 25 to 29 Years | 317 (91.1%) | 0 (0.0%) |
| 30 to 34 Years | 607 (94.1%) | 0 (0.0%) |
| 35 to 44 Years | 1,509 (92.1%) | 30 (2.0%) |
| 45 to 54 Years | 1,593 (90.8%) | 73 (4.6%) |
| 55 to 59 Years | 705 (88.9%) | 26 (3.7%) |
| 60 to 64 Years | 397 (71.4%) | 7 (1.8%) |
| 65 to 74 Years | 262 (24.6%) | 21 (8.0%) |
| 75 Years and over | 47 (13.9%) | 0 (0.0%) |
| Total | 6,089 (73.8%) | 262 (4.3%) |
Employment Status by Educational Attainment in Victoria
According to labor force statistics for Victoria, 89.4% of individuals (5,126) out of the total population between 25 and 64 years of age (5,734) are in the labor force, with 2.7% or 138 of them being unemployed. The group with the highest labor force participation rate are those with the educational attainment of bachelor's degree or higher, with 91.2% or 3,689 individuals in the labor force. Within the labor force, individuals with bachelor's degree or higher education have the highest percentage of unemployment, with 3.3% or 122 of them being unemployed.
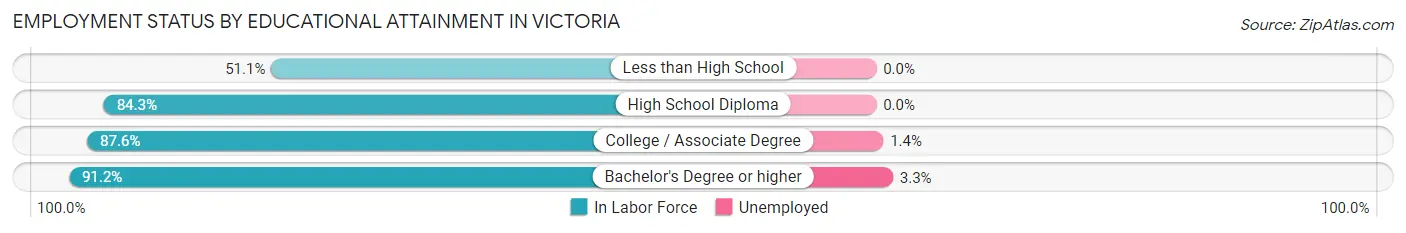
| Educational Attainment | In Labor Force | Unemployed |
| Less than High School | 45 (51.1%) | 0 (0.0%) |
| High School Diploma | 311 (84.3%) | 0 (0.0%) |
| College / Associate Degree | 1,079 (87.6%) | 17 (1.4%) |
| Bachelor's Degree or higher | 3,689 (91.2%) | 133 (3.3%) |
| Total | 5,126 (89.4%) | 155 (2.7%) |
Employment Occupations by Sex in Victoria
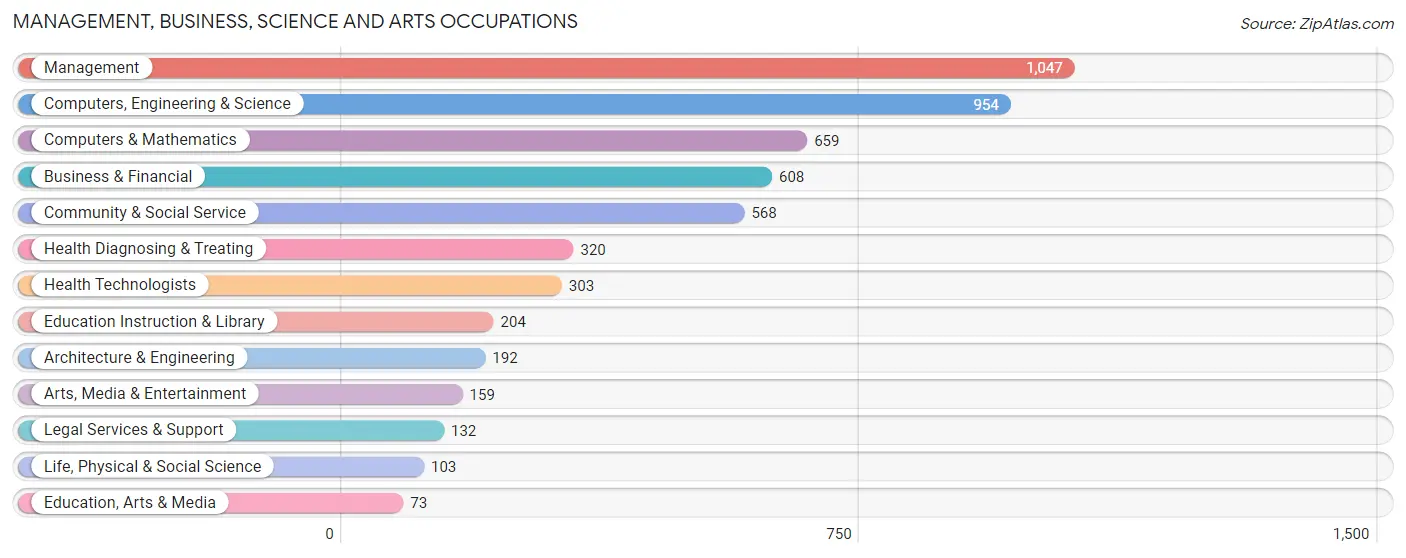
Management, Business, Science and Arts Occupations
The most common Management, Business, Science and Arts occupations in Victoria are Management (1,047 | 18.0%), Computers, Engineering & Science (954 | 16.4%), Computers & Mathematics (659 | 11.3%), Business & Financial (608 | 10.4%), and Community & Social Service (568 | 9.8%).
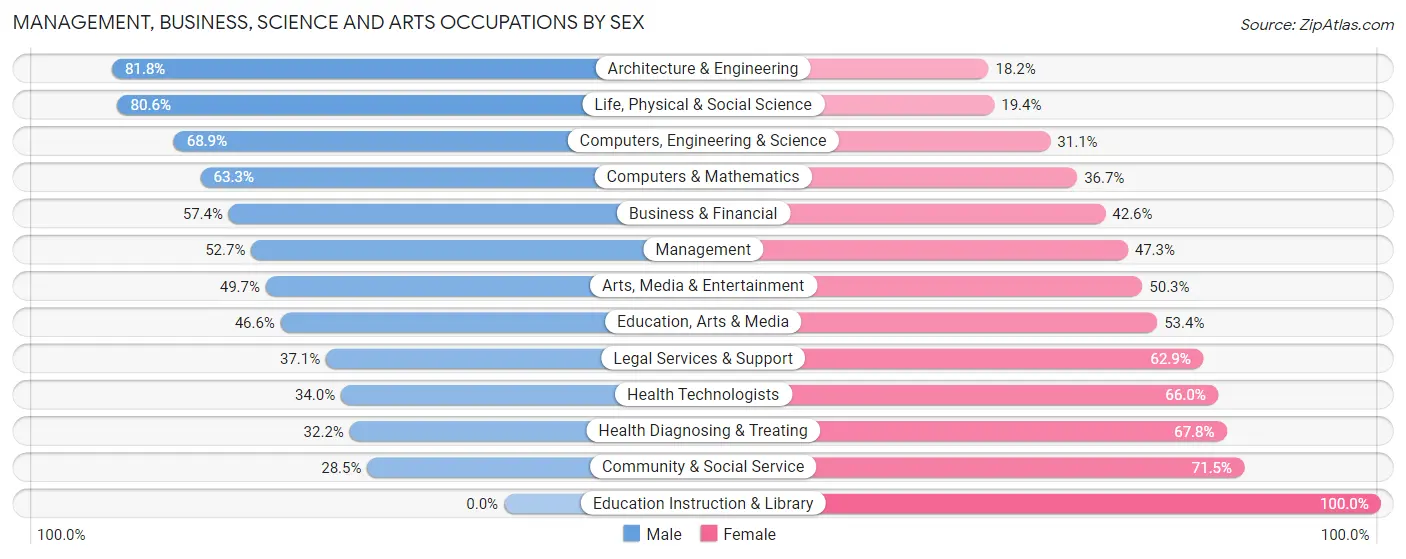
Management, Business, Science and Arts Occupations by Sex
Within the Management, Business, Science and Arts occupations in Victoria, the most male-oriented occupations are Architecture & Engineering (81.8%), Life, Physical & Social Science (80.6%), and Computers, Engineering & Science (68.9%), while the most female-oriented occupations are Education Instruction & Library (100.0%), Community & Social Service (71.5%), and Health Diagnosing & Treating (67.8%).
| Occupation | Male | Female |
| Management | 552 (52.7%) | 495 (47.3%) |
| Business & Financial | 349 (57.4%) | 259 (42.6%) |
| Computers, Engineering & Science | 657 (68.9%) | 297 (31.1%) |
| Computers & Mathematics | 417 (63.3%) | 242 (36.7%) |
| Architecture & Engineering | 157 (81.8%) | 35 (18.2%) |
| Life, Physical & Social Science | 83 (80.6%) | 20 (19.4%) |
| Community & Social Service | 162 (28.5%) | 406 (71.5%) |
| Education, Arts & Media | 34 (46.6%) | 39 (53.4%) |
| Legal Services & Support | 49 (37.1%) | 83 (62.9%) |
| Education Instruction & Library | 0 (0.0%) | 204 (100.0%) |
| Arts, Media & Entertainment | 79 (49.7%) | 80 (50.3%) |
| Health Diagnosing & Treating | 103 (32.2%) | 217 (67.8%) |
| Health Technologists | 103 (34.0%) | 200 (66.0%) |
| Total (Category) | 1,823 (52.1%) | 1,674 (47.9%) |
| Total (Overall) | 3,181 (54.6%) | 2,645 (45.4%) |
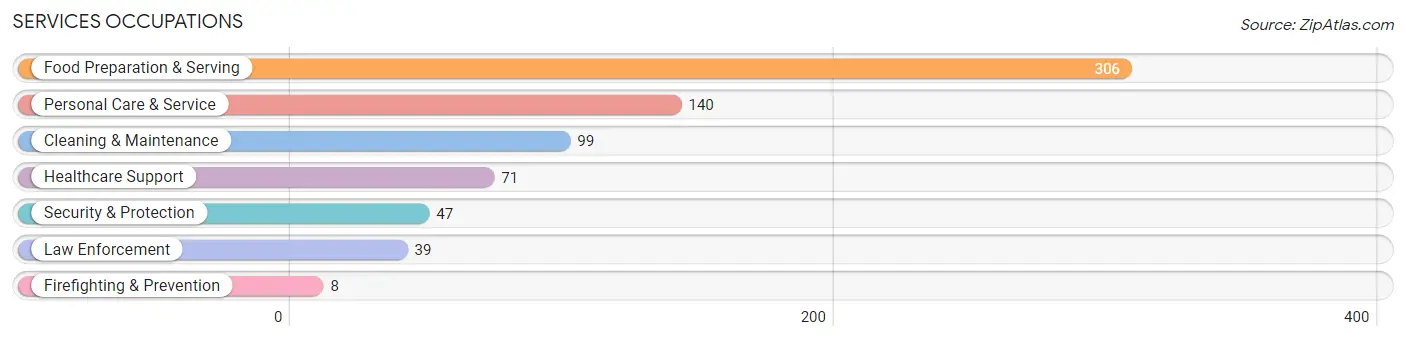
Services Occupations
The most common Services occupations in Victoria are Food Preparation & Serving (306 | 5.2%), Personal Care & Service (140 | 2.4%), Cleaning & Maintenance (99 | 1.7%), Healthcare Support (71 | 1.2%), and Security & Protection (47 | 0.8%).
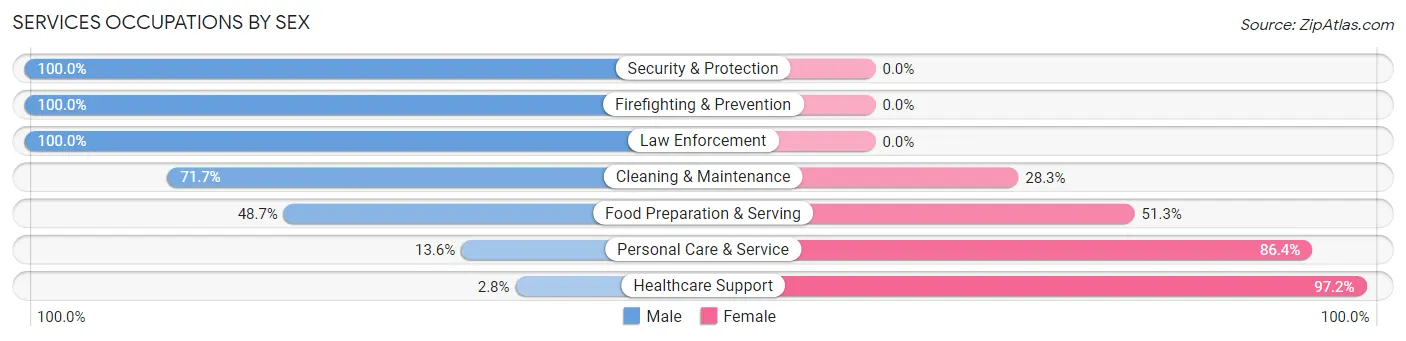
Services Occupations by Sex
Within the Services occupations in Victoria, the most male-oriented occupations are Security & Protection (100.0%), Firefighting & Prevention (100.0%), and Law Enforcement (100.0%), while the most female-oriented occupations are Healthcare Support (97.2%), Personal Care & Service (86.4%), and Food Preparation & Serving (51.3%).
| Occupation | Male | Female |
| Healthcare Support | 2 (2.8%) | 69 (97.2%) |
| Security & Protection | 47 (100.0%) | 0 (0.0%) |
| Firefighting & Prevention | 8 (100.0%) | 0 (0.0%) |
| Law Enforcement | 39 (100.0%) | 0 (0.0%) |
| Food Preparation & Serving | 149 (48.7%) | 157 (51.3%) |
| Cleaning & Maintenance | 71 (71.7%) | 28 (28.3%) |
| Personal Care & Service | 19 (13.6%) | 121 (86.4%) |
| Total (Category) | 288 (43.4%) | 375 (56.6%) |
| Total (Overall) | 3,181 (54.6%) | 2,645 (45.4%) |
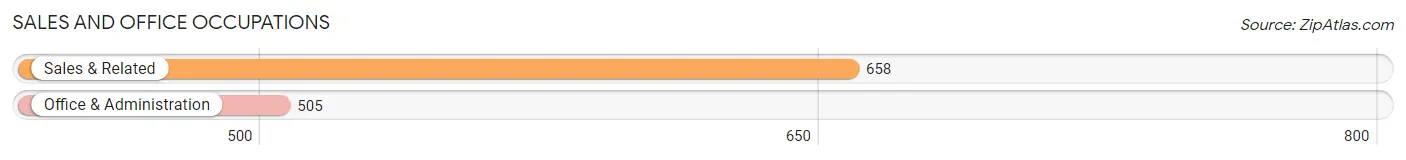
Sales and Office Occupations
The most common Sales and Office occupations in Victoria are Sales & Related (658 | 11.3%), and Office & Administration (505 | 8.7%).
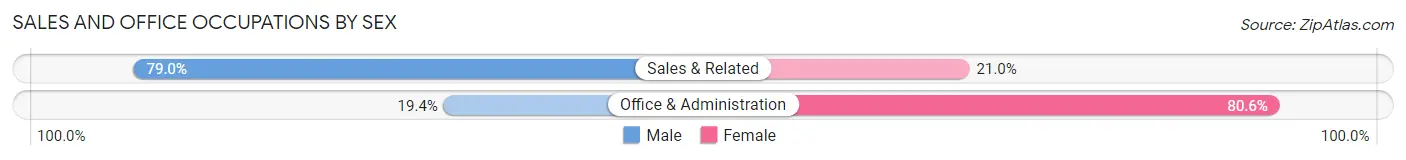
Sales and Office Occupations by Sex
| Occupation | Male | Female |
| Sales & Related | 520 (79.0%) | 138 (21.0%) |
| Office & Administration | 98 (19.4%) | 407 (80.6%) |
| Total (Category) | 618 (53.1%) | 545 (46.9%) |
| Total (Overall) | 3,181 (54.6%) | 2,645 (45.4%) |
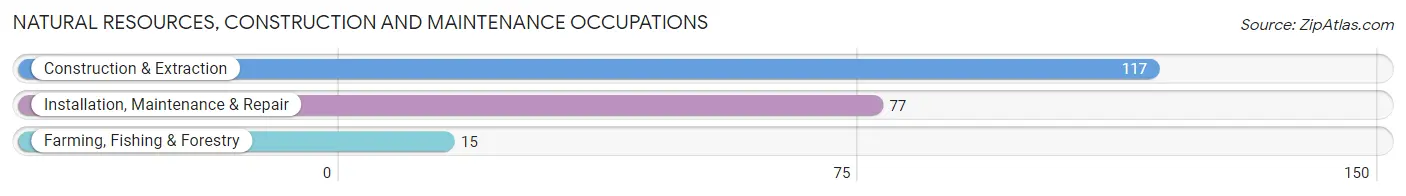
Natural Resources, Construction and Maintenance Occupations
The most common Natural Resources, Construction and Maintenance occupations in Victoria are Construction & Extraction (117 | 2.0%), Installation, Maintenance & Repair (77 | 1.3%), and Farming, Fishing & Forestry (15 | 0.3%).
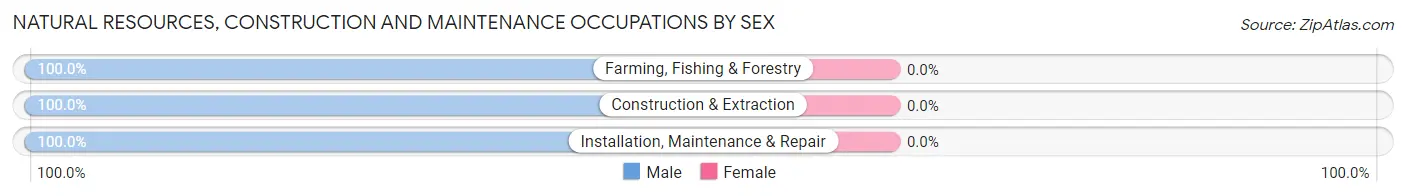
Natural Resources, Construction and Maintenance Occupations by Sex
| Occupation | Male | Female |
| Farming, Fishing & Forestry | 15 (100.0%) | 0 (0.0%) |
| Construction & Extraction | 117 (100.0%) | 0 (0.0%) |
| Installation, Maintenance & Repair | 77 (100.0%) | 0 (0.0%) |
| Total (Category) | 209 (100.0%) | 0 (0.0%) |
| Total (Overall) | 3,181 (54.6%) | 2,645 (45.4%) |
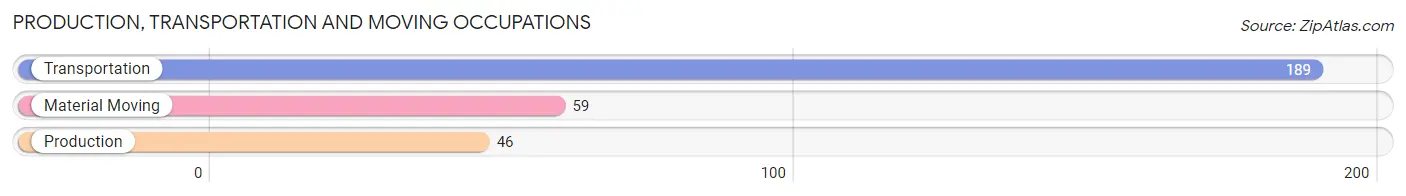
Production, Transportation and Moving Occupations
The most common Production, Transportation and Moving occupations in Victoria are Transportation (189 | 3.2%), Material Moving (59 | 1.0%), and Production (46 | 0.8%).
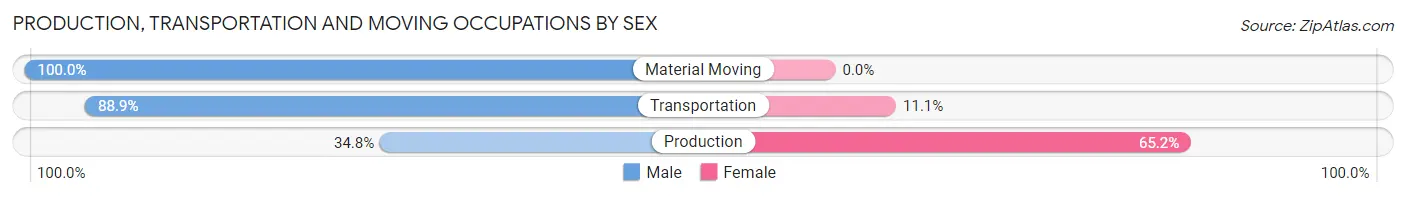
Production, Transportation and Moving Occupations by Sex
| Occupation | Male | Female |
| Production | 16 (34.8%) | 30 (65.2%) |
| Transportation | 168 (88.9%) | 21 (11.1%) |
| Material Moving | 59 (100.0%) | 0 (0.0%) |
| Total (Category) | 243 (82.7%) | 51 (17.3%) |
| Total (Overall) | 3,181 (54.6%) | 2,645 (45.4%) |
Employment Industries by Sex in Victoria
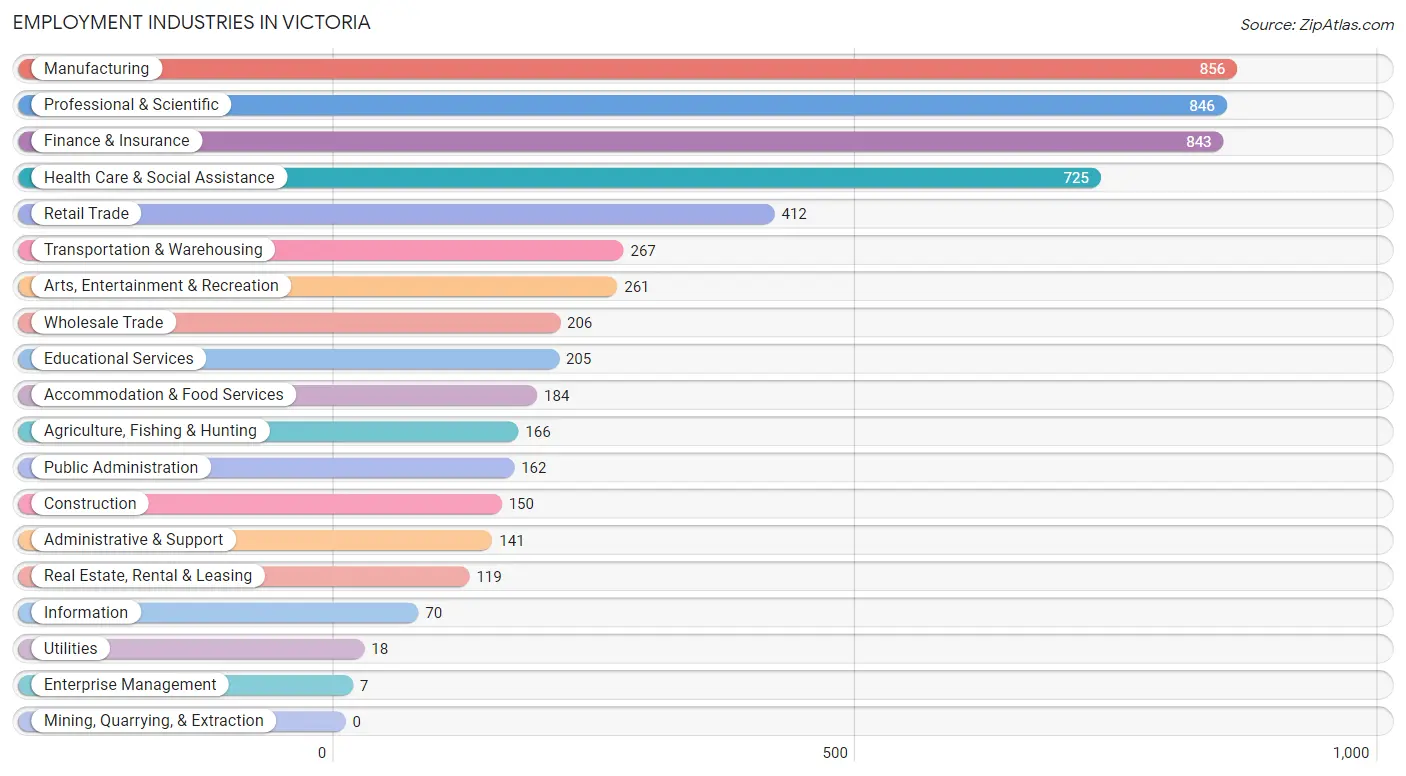
Employment Industries in Victoria
The major employment industries in Victoria include Manufacturing (856 | 14.7%), Professional & Scientific (846 | 14.5%), Finance & Insurance (843 | 14.5%), Health Care & Social Assistance (725 | 12.4%), and Retail Trade (412 | 7.1%).
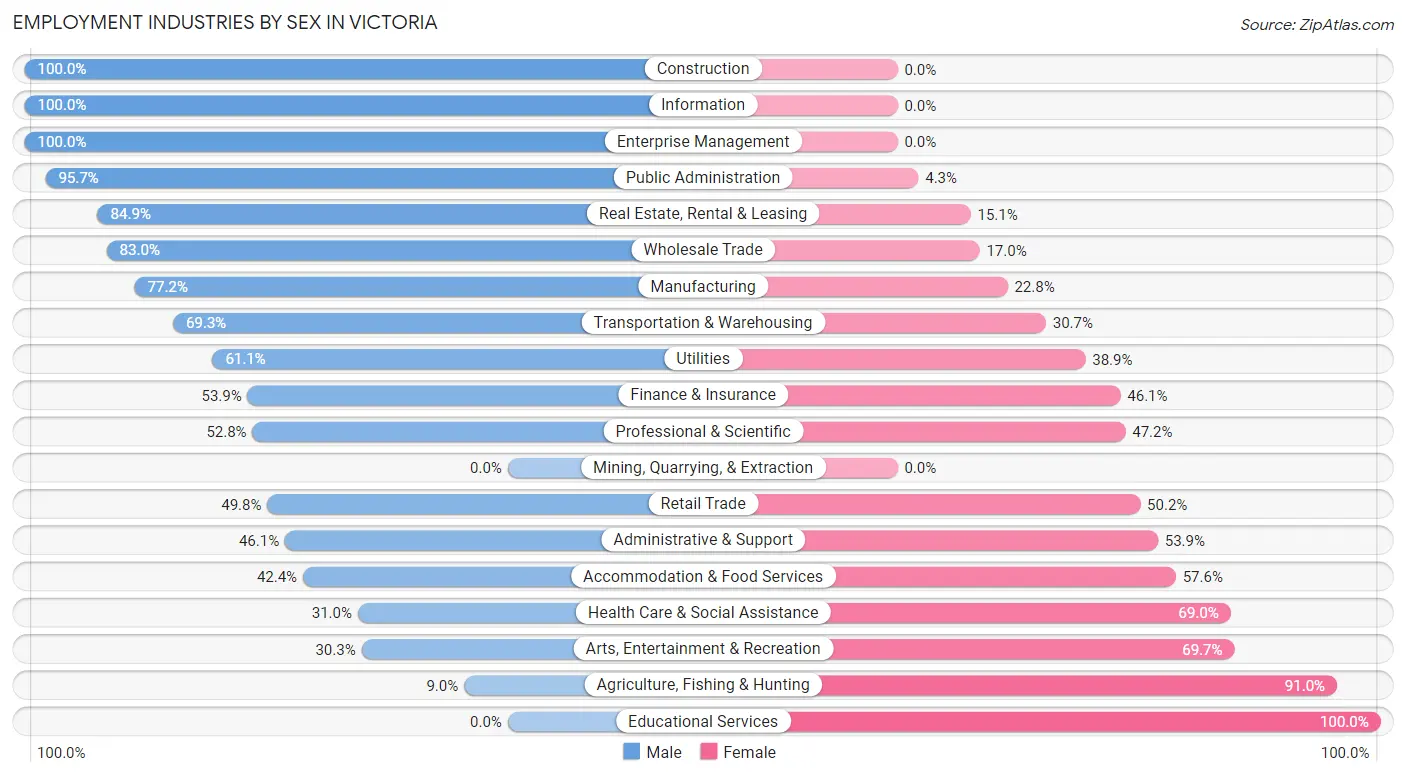
Employment Industries by Sex in Victoria
The Victoria industries that see more men than women are Construction (100.0%), Information (100.0%), and Enterprise Management (100.0%), whereas the industries that tend to have a higher number of women are Educational Services (100.0%), Agriculture, Fishing & Hunting (91.0%), and Arts, Entertainment & Recreation (69.7%).
| Industry | Male | Female |
| Agriculture, Fishing & Hunting | 15 (9.0%) | 151 (91.0%) |
| Mining, Quarrying, & Extraction | 0 (0.0%) | 0 (0.0%) |
| Construction | 150 (100.0%) | 0 (0.0%) |
| Manufacturing | 661 (77.2%) | 195 (22.8%) |
| Wholesale Trade | 171 (83.0%) | 35 (17.0%) |
| Retail Trade | 205 (49.8%) | 207 (50.2%) |
| Transportation & Warehousing | 185 (69.3%) | 82 (30.7%) |
| Utilities | 11 (61.1%) | 7 (38.9%) |
| Information | 70 (100.0%) | 0 (0.0%) |
| Finance & Insurance | 454 (53.9%) | 389 (46.1%) |
| Real Estate, Rental & Leasing | 101 (84.9%) | 18 (15.1%) |
| Professional & Scientific | 447 (52.8%) | 399 (47.2%) |
| Enterprise Management | 7 (100.0%) | 0 (0.0%) |
| Administrative & Support | 65 (46.1%) | 76 (53.9%) |
| Educational Services | 0 (0.0%) | 205 (100.0%) |
| Health Care & Social Assistance | 225 (31.0%) | 500 (69.0%) |
| Arts, Entertainment & Recreation | 79 (30.3%) | 182 (69.7%) |
| Accommodation & Food Services | 78 (42.4%) | 106 (57.6%) |
| Public Administration | 155 (95.7%) | 7 (4.3%) |
| Total | 3,181 (54.6%) | 2,645 (45.4%) |
Education in Victoria
School Enrollment in Victoria
The most common levels of schooling among the 3,118 students in Victoria are high school (927 | 29.7%), elementary school (711 | 22.8%), and middle school (648 | 20.8%).
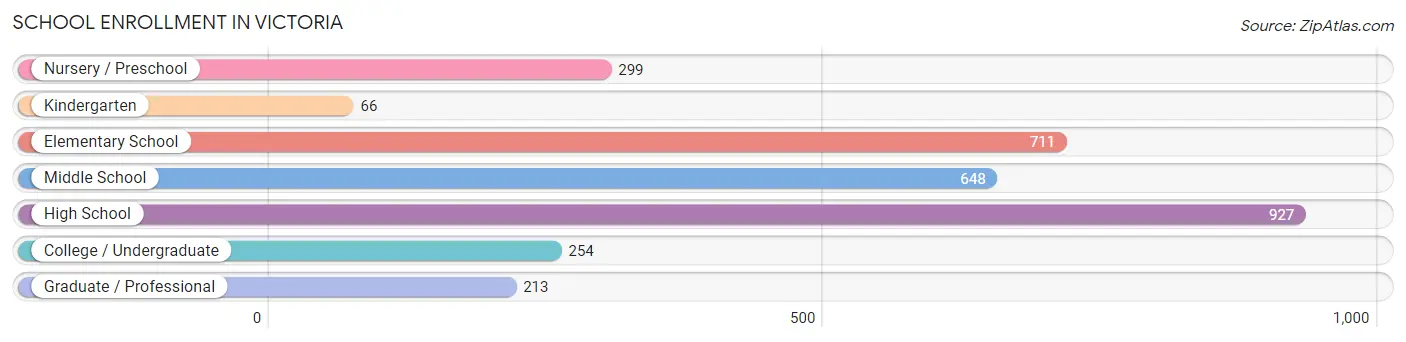
| School Level | # Students | % Students |
| Nursery / Preschool | 299 | 9.6% |
| Kindergarten | 66 | 2.1% |
| Elementary School | 711 | 22.8% |
| Middle School | 648 | 20.8% |
| High School | 927 | 29.7% |
| College / Undergraduate | 254 | 8.2% |
| Graduate / Professional | 213 | 6.8% |
| Total | 3,118 | 100.0% |
School Enrollment by Age by Funding Source in Victoria
Out of a total of 3,118 students who are enrolled in schools in Victoria, 714 (22.9%) attend a private institution, while the remaining 2,404 (77.1%) are enrolled in public schools. The age group of 20 to 24 year olds has the highest likelihood of being enrolled in private schools, with 132 (66.0% in the age bracket) enrolled. Conversely, the age group of 35 years and over has the lowest likelihood of being enrolled in a private school, with 119 (90.1% in the age bracket) attending a public institution.
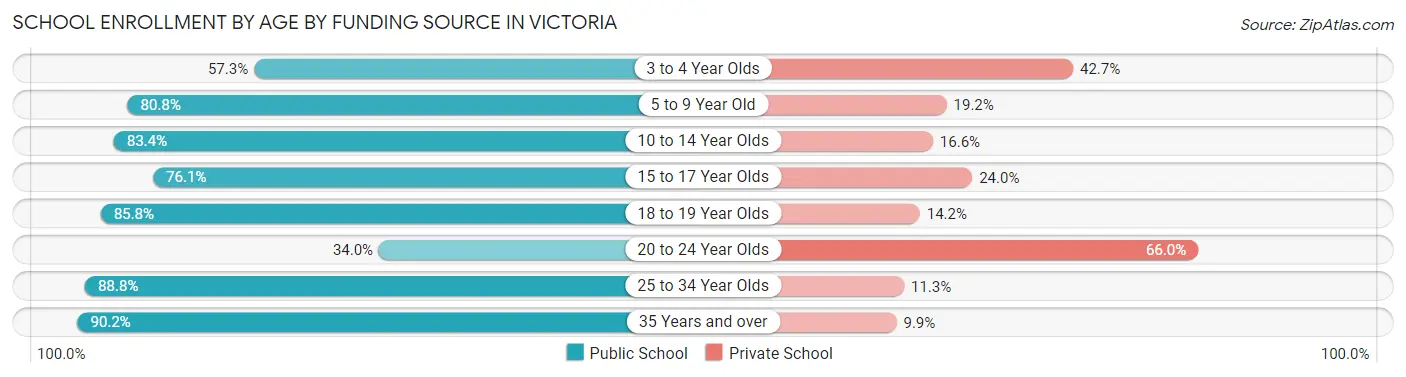
| Age Bracket | Public School | Private School |
| 3 to 4 Year Olds | 126 (57.3%) | 94 (42.7%) |
| 5 to 9 Year Old | 624 (80.8%) | 148 (19.2%) |
| 10 to 14 Year Olds | 647 (83.4%) | 129 (16.6%) |
| 15 to 17 Year Olds | 454 (76.0%) | 143 (23.9%) |
| 18 to 19 Year Olds | 224 (85.8%) | 37 (14.2%) |
| 20 to 24 Year Olds | 68 (34.0%) | 132 (66.0%) |
| 25 to 34 Year Olds | 142 (88.7%) | 18 (11.3%) |
| 35 Years and over | 119 (90.1%) | 13 (9.9%) |
| Total | 2,404 (77.1%) | 714 (22.9%) |
Educational Attainment by Field of Study in Victoria
Business (1,210 | 22.4%), engineering (517 | 9.6%), science & technology (501 | 9.3%), arts & humanities (475 | 8.8%), and education (429 | 8.0%) are the most common fields of study among 5,393 individuals in Victoria who have obtained a bachelor's degree or higher.
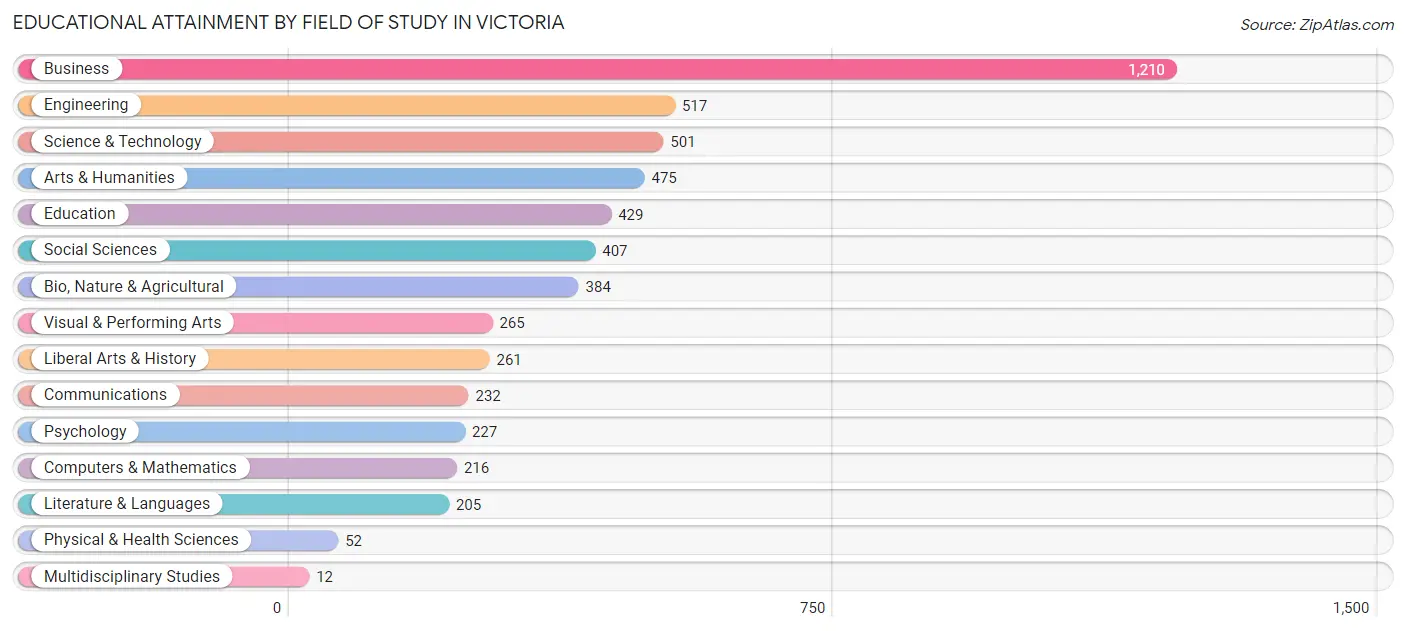
| Field of Study | # Graduates | % Graduates |
| Computers & Mathematics | 216 | 4.0% |
| Bio, Nature & Agricultural | 384 | 7.1% |
| Physical & Health Sciences | 52 | 1.0% |
| Psychology | 227 | 4.2% |
| Social Sciences | 407 | 7.5% |
| Engineering | 517 | 9.6% |
| Multidisciplinary Studies | 12 | 0.2% |
| Science & Technology | 501 | 9.3% |
| Business | 1,210 | 22.4% |
| Education | 429 | 8.0% |
| Literature & Languages | 205 | 3.8% |
| Liberal Arts & History | 261 | 4.8% |
| Visual & Performing Arts | 265 | 4.9% |
| Communications | 232 | 4.3% |
| Arts & Humanities | 475 | 8.8% |
| Total | 5,393 | 100.0% |
Transportation & Commute in Victoria
Vehicle Availability by Sex in Victoria
The most prevalent vehicle ownership categories in Victoria are males with 2 vehicles (1,546, accounting for 49.4%) and females with 2 vehicles (1,277, making up 59.1%).
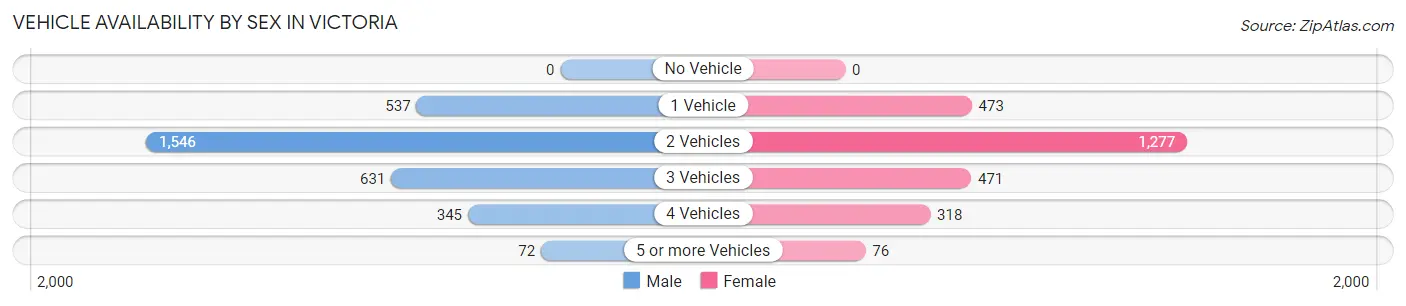
| Vehicles Available | Male | Female |
| No Vehicle | 0 (0.0%) | 0 (0.0%) |
| 1 Vehicle | 537 (17.2%) | 473 (18.1%) |
| 2 Vehicles | 1,546 (49.4%) | 1,277 (48.8%) |
| 3 Vehicles | 631 (20.2%) | 471 (18.0%) |
| 4 Vehicles | 345 (11.0%) | 318 (12.2%) |
| 5 or more Vehicles | 72 (2.3%) | 76 (2.9%) |
| Total | 3,131 (100.0%) | 2,615 (100.0%) |
Commute Time in Victoria
The most frequently occuring commute durations in Victoria are 30 to 34 minutes (796 commuters, 18.6%), 20 to 24 minutes (637 commuters, 14.9%), and 10 to 14 minutes (507 commuters, 11.8%).
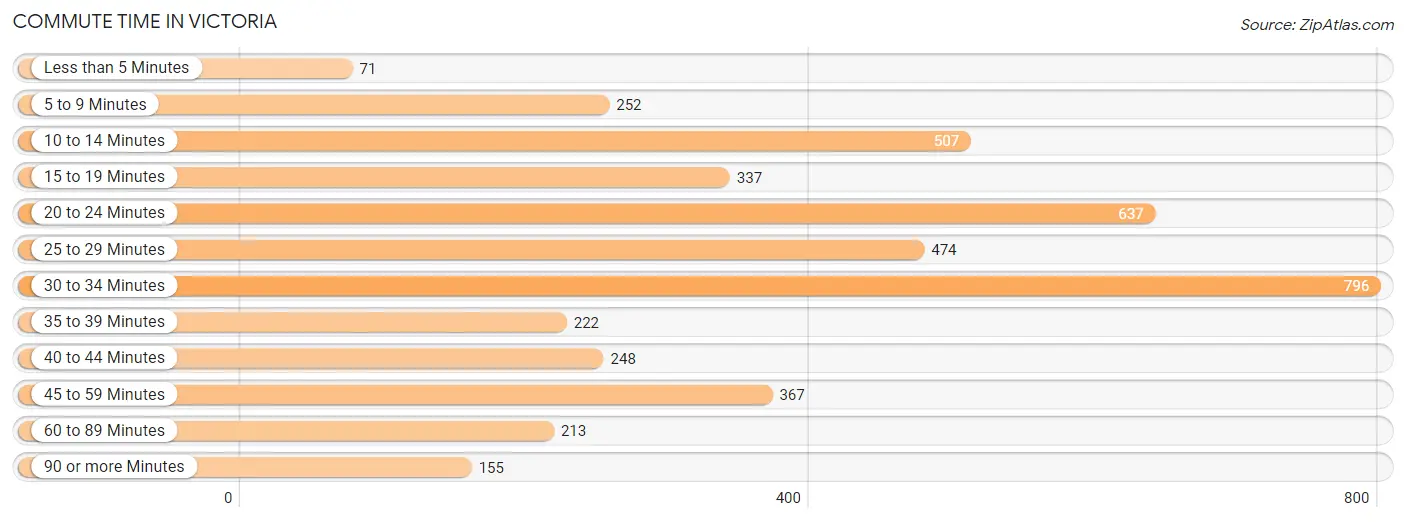
| Commute Time | # Commuters | % Commuters |
| Less than 5 Minutes | 71 | 1.7% |
| 5 to 9 Minutes | 252 | 5.9% |
| 10 to 14 Minutes | 507 | 11.8% |
| 15 to 19 Minutes | 337 | 7.9% |
| 20 to 24 Minutes | 637 | 14.9% |
| 25 to 29 Minutes | 474 | 11.1% |
| 30 to 34 Minutes | 796 | 18.6% |
| 35 to 39 Minutes | 222 | 5.2% |
| 40 to 44 Minutes | 248 | 5.8% |
| 45 to 59 Minutes | 367 | 8.6% |
| 60 to 89 Minutes | 213 | 5.0% |
| 90 or more Minutes | 155 | 3.6% |
Commute Time by Sex in Victoria
The most common commute times in Victoria are 30 to 34 minutes (430 commuters, 17.7%) for males and 30 to 34 minutes (366 commuters, 19.7%) for females.
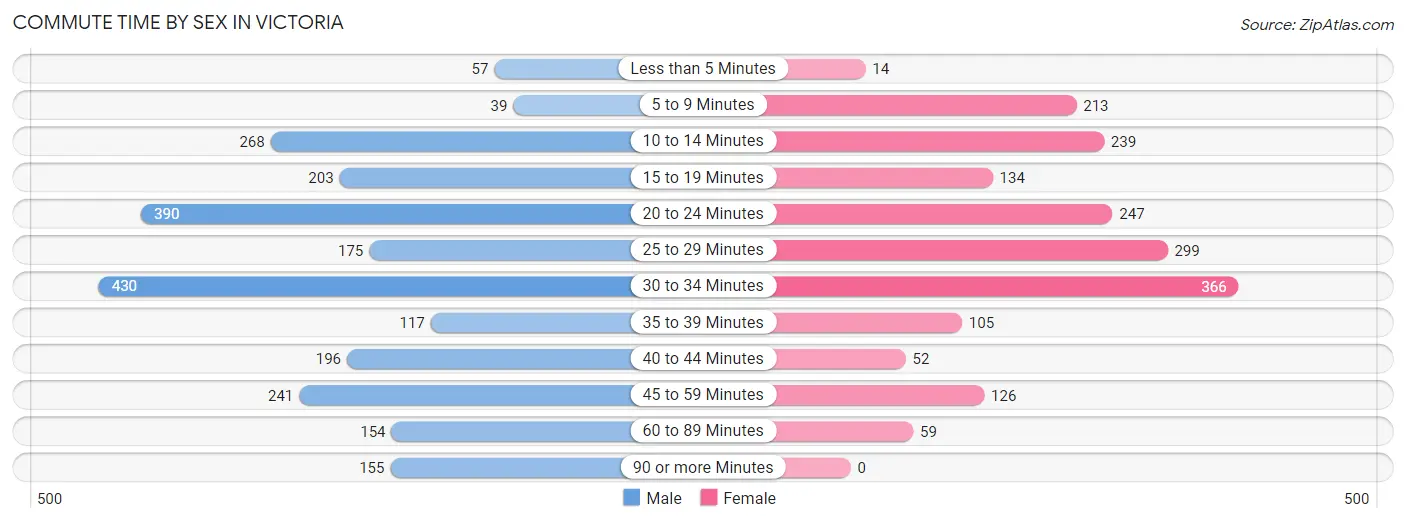
| Commute Time | Male | Female |
| Less than 5 Minutes | 57 (2.4%) | 14 (0.8%) |
| 5 to 9 Minutes | 39 (1.6%) | 213 (11.5%) |
| 10 to 14 Minutes | 268 (11.1%) | 239 (12.9%) |
| 15 to 19 Minutes | 203 (8.4%) | 134 (7.2%) |
| 20 to 24 Minutes | 390 (16.1%) | 247 (13.3%) |
| 25 to 29 Minutes | 175 (7.2%) | 299 (16.1%) |
| 30 to 34 Minutes | 430 (17.7%) | 366 (19.7%) |
| 35 to 39 Minutes | 117 (4.8%) | 105 (5.7%) |
| 40 to 44 Minutes | 196 (8.1%) | 52 (2.8%) |
| 45 to 59 Minutes | 241 (9.9%) | 126 (6.8%) |
| 60 to 89 Minutes | 154 (6.4%) | 59 (3.2%) |
| 90 or more Minutes | 155 (6.4%) | 0 (0.0%) |
Time of Departure to Work by Sex in Victoria
The most frequent times of departure to work in Victoria are 8:00 AM to 8:29 AM (560, 23.1%) for males and 8:00 AM to 8:29 AM (418, 22.6%) for females.
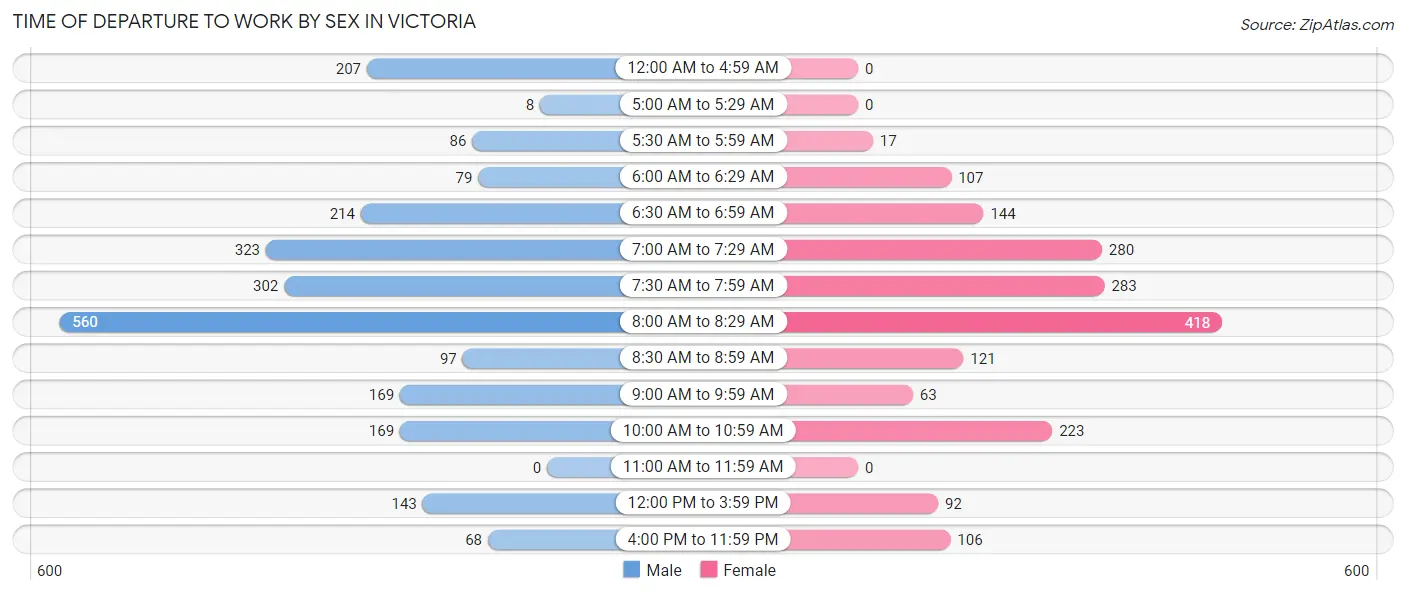
| Time of Departure | Male | Female |
| 12:00 AM to 4:59 AM | 207 (8.5%) | 0 (0.0%) |
| 5:00 AM to 5:29 AM | 8 (0.3%) | 0 (0.0%) |
| 5:30 AM to 5:59 AM | 86 (3.5%) | 17 (0.9%) |
| 6:00 AM to 6:29 AM | 79 (3.3%) | 107 (5.8%) |
| 6:30 AM to 6:59 AM | 214 (8.8%) | 144 (7.8%) |
| 7:00 AM to 7:29 AM | 323 (13.3%) | 280 (15.1%) |
| 7:30 AM to 7:59 AM | 302 (12.4%) | 283 (15.3%) |
| 8:00 AM to 8:29 AM | 560 (23.1%) | 418 (22.6%) |
| 8:30 AM to 8:59 AM | 97 (4.0%) | 121 (6.5%) |
| 9:00 AM to 9:59 AM | 169 (7.0%) | 63 (3.4%) |
| 10:00 AM to 10:59 AM | 169 (7.0%) | 223 (12.0%) |
| 11:00 AM to 11:59 AM | 0 (0.0%) | 0 (0.0%) |
| 12:00 PM to 3:59 PM | 143 (5.9%) | 92 (5.0%) |
| 4:00 PM to 11:59 PM | 68 (2.8%) | 106 (5.7%) |
| Total | 2,425 (100.0%) | 1,854 (100.0%) |
Housing Occupancy in Victoria
Occupancy by Ownership in Victoria
Of the total 3,709 dwellings in Victoria, owner-occupied units account for 3,362 (90.6%), while renter-occupied units make up 347 (9.4%).
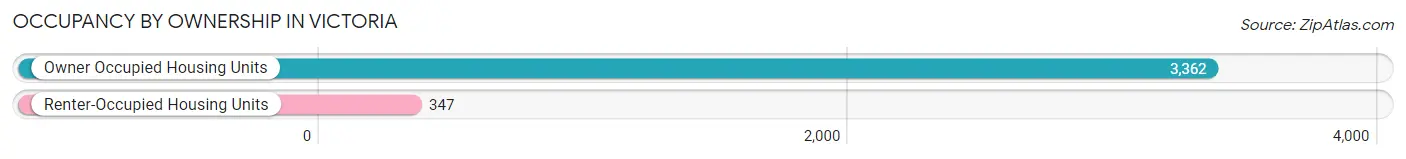
| Occupancy | # Housing Units | % Housing Units |
| Owner Occupied Housing Units | 3,362 | 90.6% |
| Renter-Occupied Housing Units | 347 | 9.4% |
| Total Occupied Housing Units | 3,709 | 100.0% |
Occupancy by Household Size in Victoria
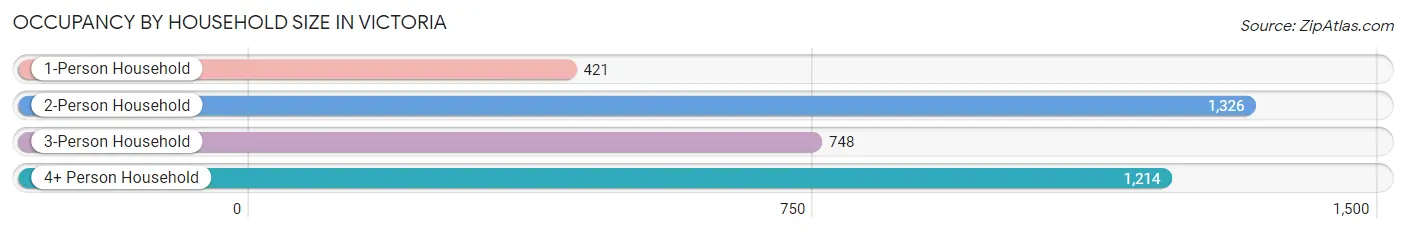
| Household Size | # Housing Units | % Housing Units |
| 1-Person Household | 421 | 11.4% |
| 2-Person Household | 1,326 | 35.7% |
| 3-Person Household | 748 | 20.2% |
| 4+ Person Household | 1,214 | 32.7% |
| Total Housing Units | 3,709 | 100.0% |
Occupancy by Ownership by Household Size in Victoria
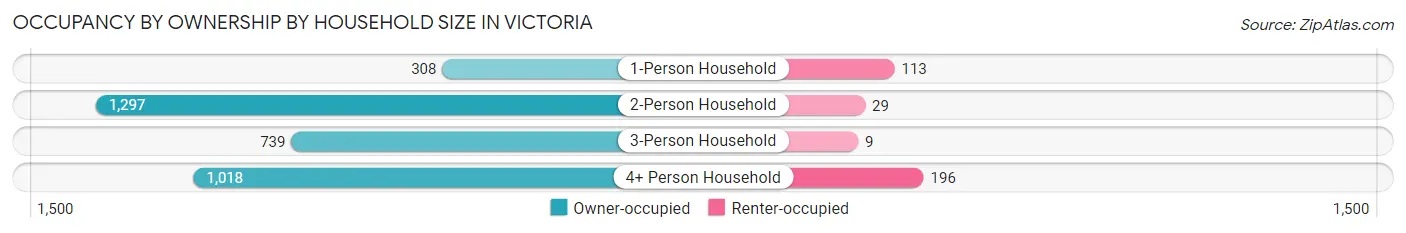
| Household Size | Owner-occupied | Renter-occupied |
| 1-Person Household | 308 (73.2%) | 113 (26.8%) |
| 2-Person Household | 1,297 (97.8%) | 29 (2.2%) |
| 3-Person Household | 739 (98.8%) | 9 (1.2%) |
| 4+ Person Household | 1,018 (83.9%) | 196 (16.1%) |
| Total Housing Units | 3,362 (90.6%) | 347 (9.4%) |
Occupancy by Educational Attainment in Victoria
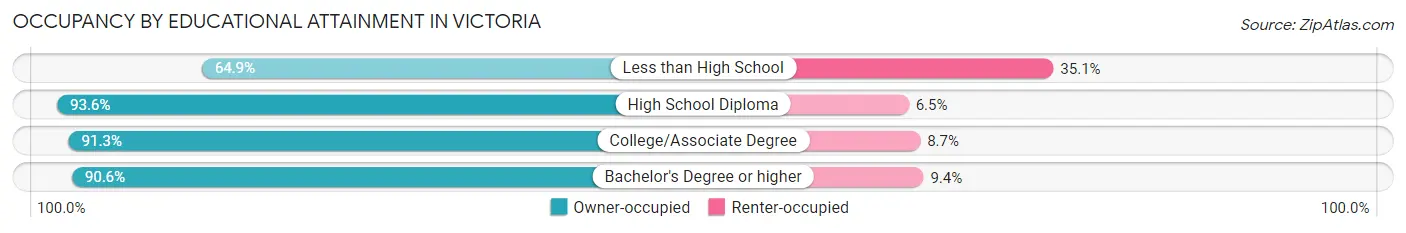
| Household Size | Owner-occupied | Renter-occupied |
| Less than High School | 24 (64.9%) | 13 (35.1%) |
| High School Diploma | 174 (93.5%) | 12 (6.5%) |
| College/Associate Degree | 690 (91.3%) | 66 (8.7%) |
| Bachelor's Degree or higher | 2,474 (90.6%) | 256 (9.4%) |
Occupancy by Age of Householder in Victoria
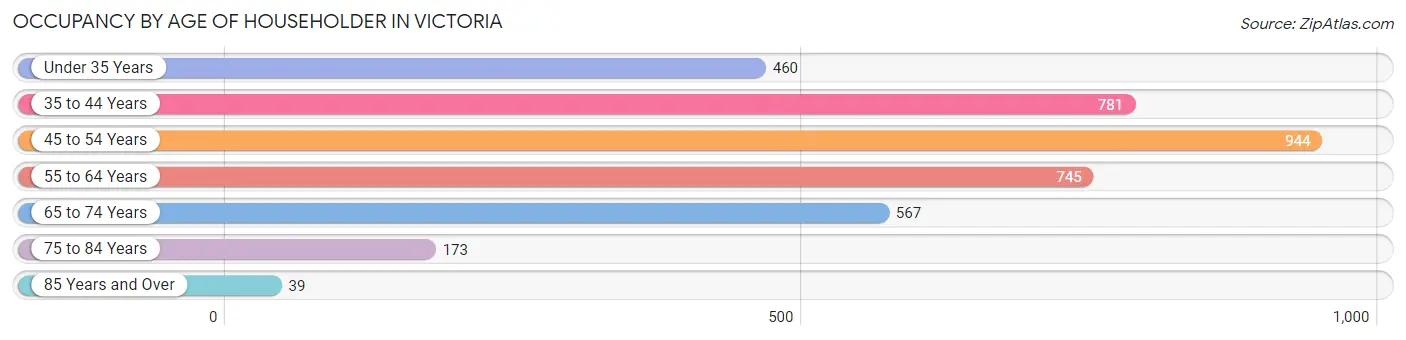
| Age Bracket | # Households | % Households |
| Under 35 Years | 460 | 12.4% |
| 35 to 44 Years | 781 | 21.1% |
| 45 to 54 Years | 944 | 25.5% |
| 55 to 64 Years | 745 | 20.1% |
| 65 to 74 Years | 567 | 15.3% |
| 75 to 84 Years | 173 | 4.7% |
| 85 Years and Over | 39 | 1.1% |
| Total | 3,709 | 100.0% |
Housing Finances in Victoria
Median Income by Occupancy in Victoria
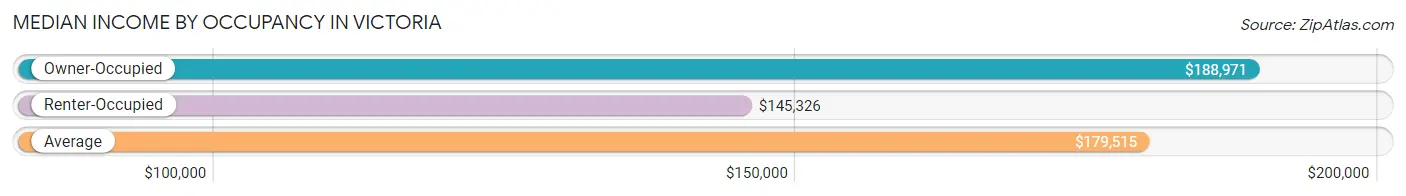
| Occupancy Type | # Households | Median Income |
| Owner-Occupied | 3,362 (90.6%) | $188,971 |
| Renter-Occupied | 347 (9.4%) | $145,326 |
| Average | 3,709 (100.0%) | $179,515 |
Occupancy by Householder Income Bracket in Victoria
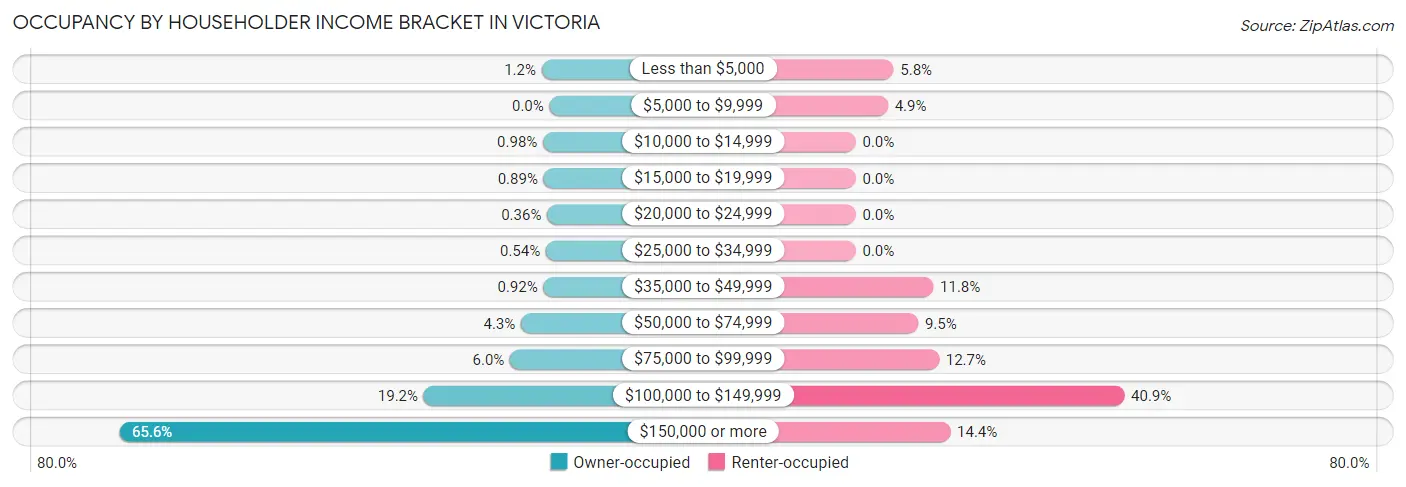
| Income Bracket | Owner-occupied | Renter-occupied |
| Less than $5,000 | 40 (1.2%) | 20 (5.8%) |
| $5,000 to $9,999 | 0 (0.0%) | 17 (4.9%) |
| $10,000 to $14,999 | 33 (1.0%) | 0 (0.0%) |
| $15,000 to $19,999 | 30 (0.9%) | 0 (0.0%) |
| $20,000 to $24,999 | 12 (0.4%) | 0 (0.0%) |
| $25,000 to $34,999 | 18 (0.5%) | 0 (0.0%) |
| $35,000 to $49,999 | 31 (0.9%) | 41 (11.8%) |
| $50,000 to $74,999 | 146 (4.3%) | 33 (9.5%) |
| $75,000 to $99,999 | 202 (6.0%) | 44 (12.7%) |
| $100,000 to $149,999 | 644 (19.2%) | 142 (40.9%) |
| $150,000 or more | 2,206 (65.6%) | 50 (14.4%) |
| Total | 3,362 (100.0%) | 347 (100.0%) |
Monthly Housing Cost Tiers in Victoria
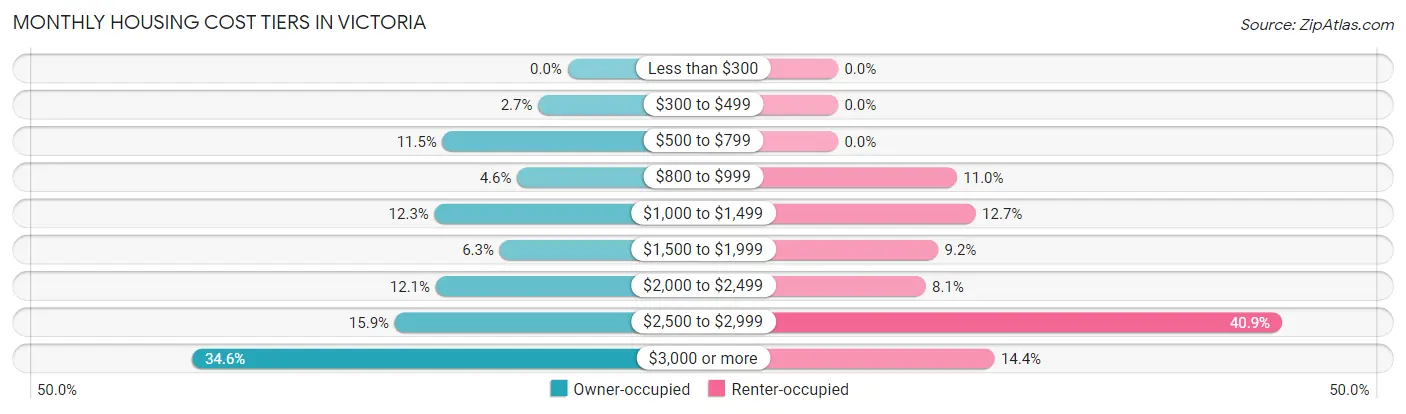
| Monthly Cost | Owner-occupied | Renter-occupied |
| Less than $300 | 0 (0.0%) | 0 (0.0%) |
| $300 to $499 | 91 (2.7%) | 0 (0.0%) |
| $500 to $799 | 387 (11.5%) | 0 (0.0%) |
| $800 to $999 | 156 (4.6%) | 38 (11.0%) |
| $1,000 to $1,499 | 412 (12.2%) | 44 (12.7%) |
| $1,500 to $1,999 | 210 (6.2%) | 32 (9.2%) |
| $2,000 to $2,499 | 408 (12.1%) | 28 (8.1%) |
| $2,500 to $2,999 | 535 (15.9%) | 142 (40.9%) |
| $3,000 or more | 1,163 (34.6%) | 50 (14.4%) |
| Total | 3,362 (100.0%) | 347 (100.0%) |
Physical Housing Characteristics in Victoria
Housing Structures in Victoria
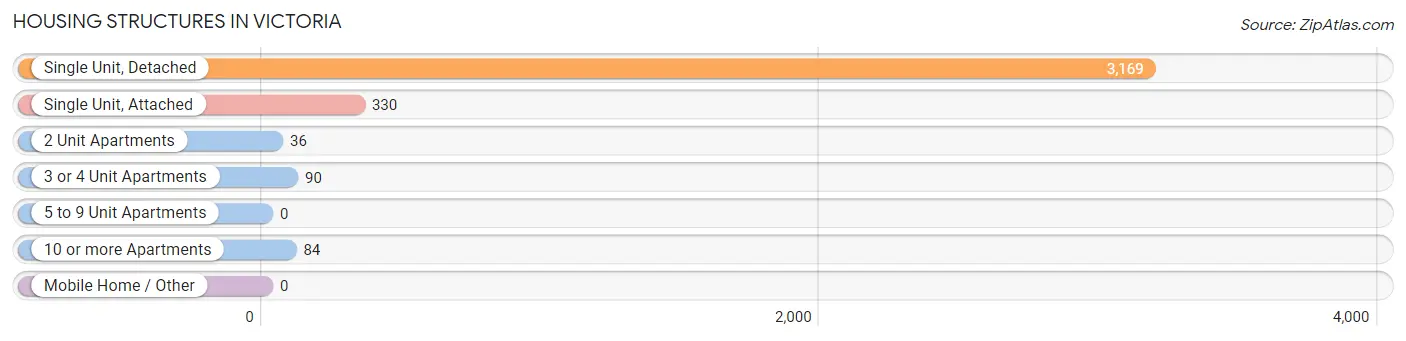
| Structure Type | # Housing Units | % Housing Units |
| Single Unit, Detached | 3,169 | 85.4% |
| Single Unit, Attached | 330 | 8.9% |
| 2 Unit Apartments | 36 | 1.0% |
| 3 or 4 Unit Apartments | 90 | 2.4% |
| 5 to 9 Unit Apartments | 0 | 0.0% |
| 10 or more Apartments | 84 | 2.3% |
| Mobile Home / Other | 0 | 0.0% |
| Total | 3,709 | 100.0% |
Housing Structures by Occupancy in Victoria
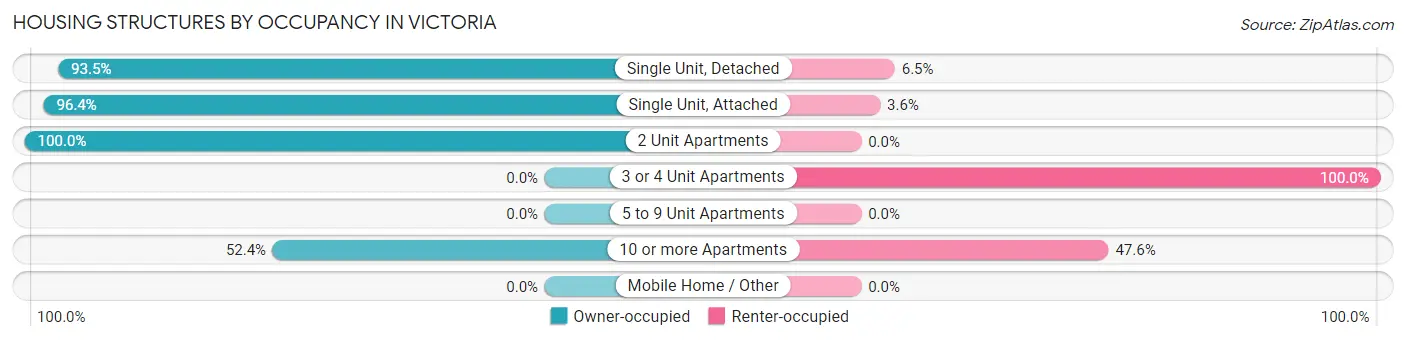
| Structure Type | Owner-occupied | Renter-occupied |
| Single Unit, Detached | 2,964 (93.5%) | 205 (6.5%) |
| Single Unit, Attached | 318 (96.4%) | 12 (3.6%) |
| 2 Unit Apartments | 36 (100.0%) | 0 (0.0%) |
| 3 or 4 Unit Apartments | 0 (0.0%) | 90 (100.0%) |
| 5 to 9 Unit Apartments | 0 (0.0%) | 0 (0.0%) |
| 10 or more Apartments | 44 (52.4%) | 40 (47.6%) |
| Mobile Home / Other | 0 (0.0%) | 0 (0.0%) |
| Total | 3,362 (90.6%) | 347 (9.4%) |
Housing Structures by Number of Rooms in Victoria
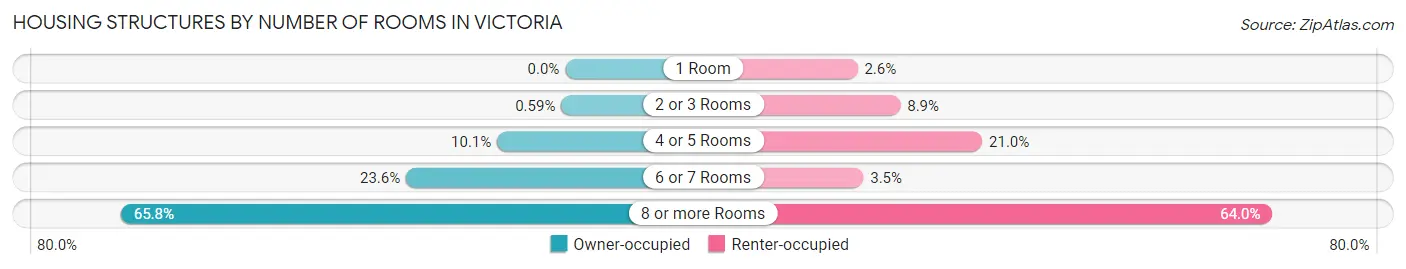
| Number of Rooms | Owner-occupied | Renter-occupied |
| 1 Room | 0 (0.0%) | 9 (2.6%) |
| 2 or 3 Rooms | 20 (0.6%) | 31 (8.9%) |
| 4 or 5 Rooms | 339 (10.1%) | 73 (21.0%) |
| 6 or 7 Rooms | 792 (23.6%) | 12 (3.5%) |
| 8 or more Rooms | 2,211 (65.8%) | 222 (64.0%) |
| Total | 3,362 (100.0%) | 347 (100.0%) |
Housing Structure by Heating Type in Victoria
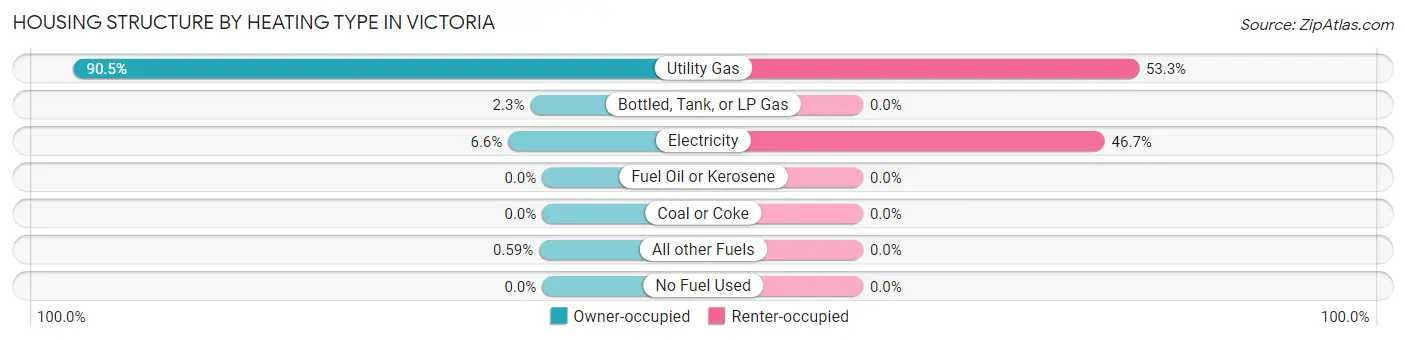
| Heating Type | Owner-occupied | Renter-occupied |
| Utility Gas | 3,044 (90.5%) | 185 (53.3%) |
| Bottled, Tank, or LP Gas | 77 (2.3%) | 0 (0.0%) |
| Electricity | 221 (6.6%) | 162 (46.7%) |
| Fuel Oil or Kerosene | 0 (0.0%) | 0 (0.0%) |
| Coal or Coke | 0 (0.0%) | 0 (0.0%) |
| All other Fuels | 20 (0.6%) | 0 (0.0%) |
| No Fuel Used | 0 (0.0%) | 0 (0.0%) |
| Total | 3,362 (100.0%) | 347 (100.0%) |
Household Vehicle Usage in Victoria
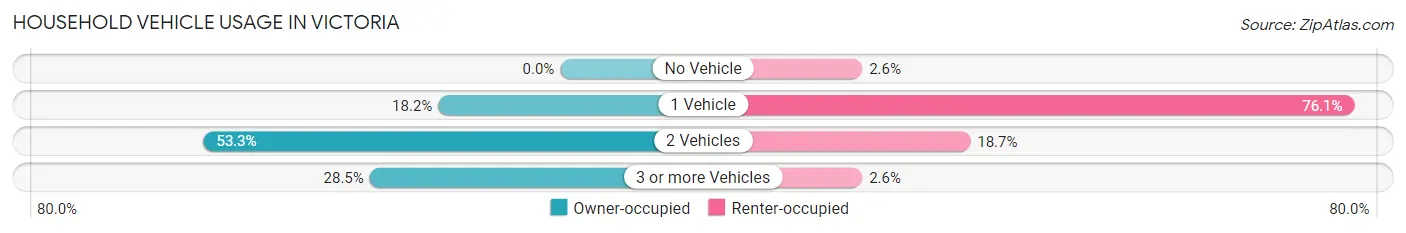
| Vehicles per Household | Owner-occupied | Renter-occupied |
| No Vehicle | 0 (0.0%) | 9 (2.6%) |
| 1 Vehicle | 613 (18.2%) | 264 (76.1%) |
| 2 Vehicles | 1,792 (53.3%) | 65 (18.7%) |
| 3 or more Vehicles | 957 (28.5%) | 9 (2.6%) |
| Total | 3,362 (100.0%) | 347 (100.0%) |
Real Estate & Mortgages in Victoria
Real Estate and Mortgage Overview in Victoria
| Characteristic | Without Mortgage | With Mortgage |
| Housing Units | 954 | 2,408 |
| Median Property Value | $423,400 | $567,900 |
| Median Household Income | $148,269 | $1,738 |
| Monthly Housing Costs | $914 | $1,153 |
| Real Estate Taxes | $5,068 | $0 |
Property Value by Mortgage Status in Victoria
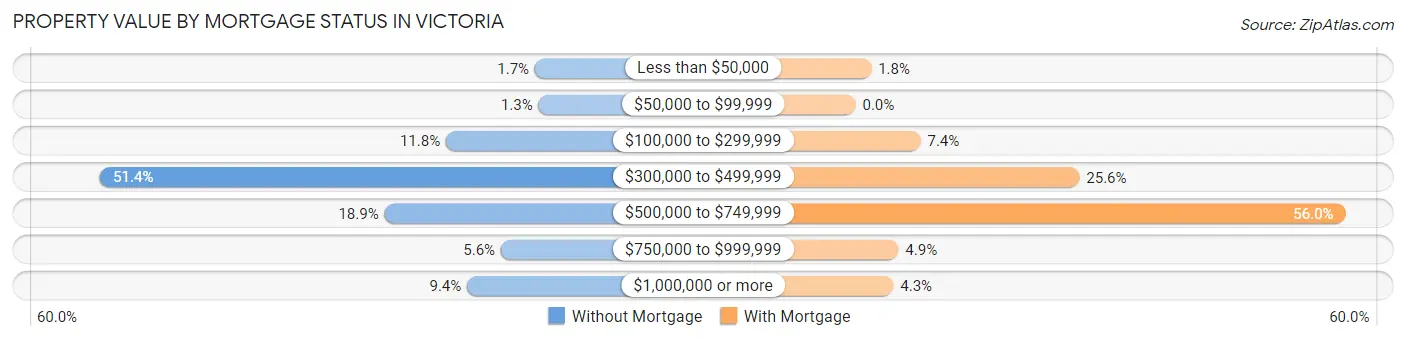
| Property Value | Without Mortgage | With Mortgage |
| Less than $50,000 | 16 (1.7%) | 43 (1.8%) |
| $50,000 to $99,999 | 12 (1.3%) | 0 (0.0%) |
| $100,000 to $299,999 | 113 (11.8%) | 179 (7.4%) |
| $300,000 to $499,999 | 490 (51.4%) | 616 (25.6%) |
| $500,000 to $749,999 | 180 (18.9%) | 1,348 (56.0%) |
| $750,000 to $999,999 | 53 (5.6%) | 118 (4.9%) |
| $1,000,000 or more | 90 (9.4%) | 104 (4.3%) |
| Total | 954 (100.0%) | 2,408 (100.0%) |
Household Income by Mortgage Status in Victoria
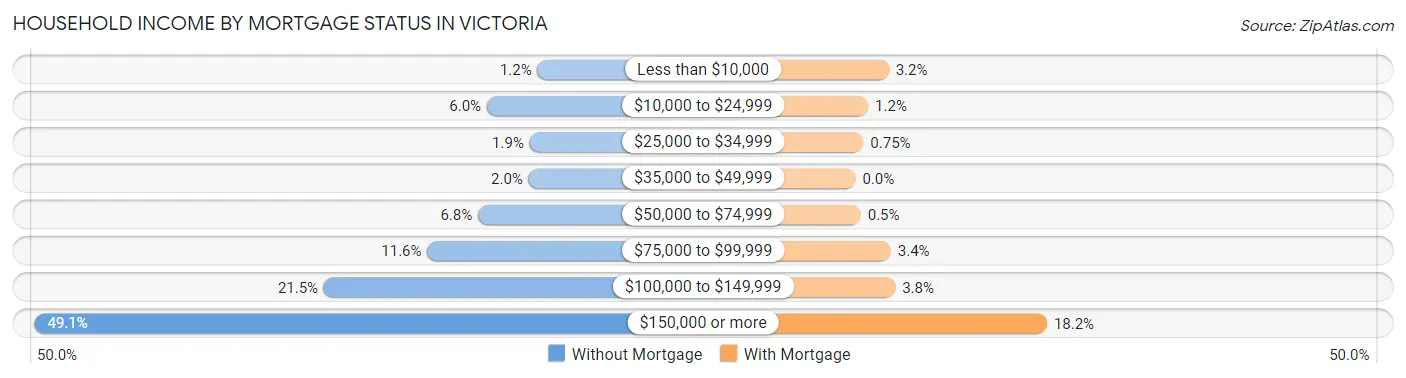
| Household Income | Without Mortgage | With Mortgage |
| Less than $10,000 | 11 (1.1%) | 76 (3.2%) |
| $10,000 to $24,999 | 57 (6.0%) | 29 (1.2%) |
| $25,000 to $34,999 | 18 (1.9%) | 18 (0.7%) |
| $35,000 to $49,999 | 19 (2.0%) | 0 (0.0%) |
| $50,000 to $74,999 | 65 (6.8%) | 12 (0.5%) |
| $75,000 to $99,999 | 111 (11.6%) | 81 (3.4%) |
| $100,000 to $149,999 | 205 (21.5%) | 91 (3.8%) |
| $150,000 or more | 468 (49.1%) | 439 (18.2%) |
| Total | 954 (100.0%) | 2,408 (100.0%) |
Property Value to Household Income Ratio in Victoria
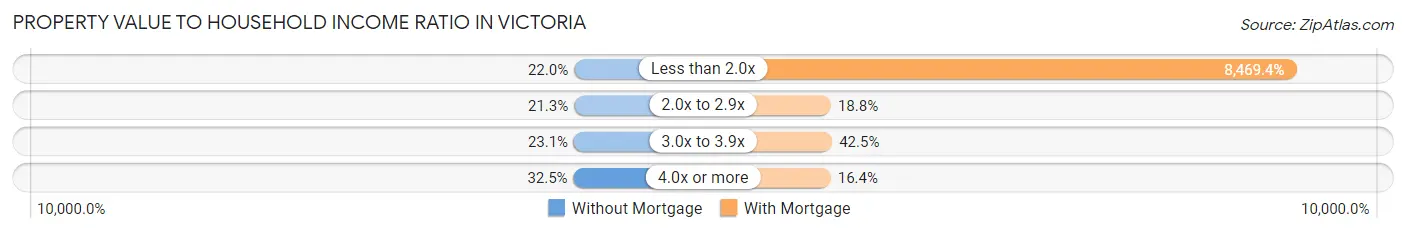
| Value-to-Income Ratio | Without Mortgage | With Mortgage |
| Less than 2.0x | 210 (22.0%) | 203,942 (8,469.4%) |
| 2.0x to 2.9x | 203 (21.3%) | 453 (18.8%) |
| 3.0x to 3.9x | 220 (23.1%) | 1,024 (42.5%) |
| 4.0x or more | 310 (32.5%) | 394 (16.4%) |
| Total | 954 (100.0%) | 2,408 (100.0%) |
Real Estate Taxes by Mortgage Status in Victoria
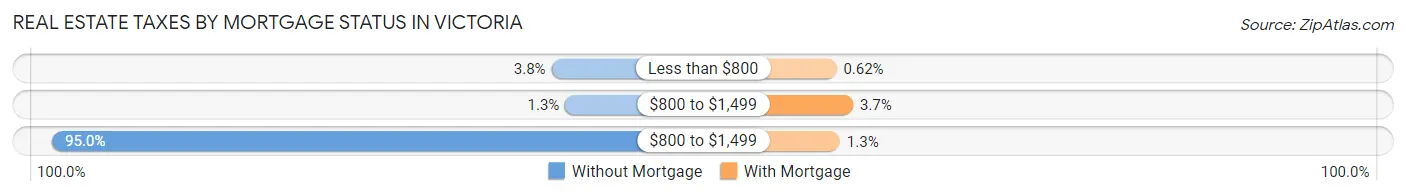
| Property Taxes | Without Mortgage | With Mortgage |
| Less than $800 | 36 (3.8%) | 15 (0.6%) |
| $800 to $1,499 | 12 (1.3%) | 88 (3.6%) |
| $800 to $1,499 | 906 (95.0%) | 30 (1.3%) |
| Total | 954 (100.0%) | 2,408 (100.0%) |
Health & Disability in Victoria
Health Insurance Coverage by Age in Victoria
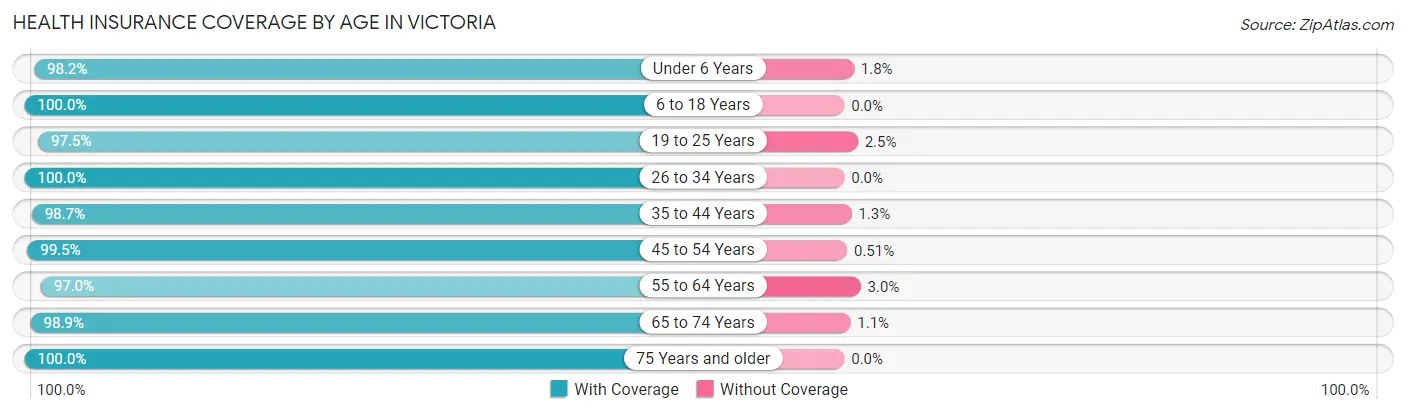
| Age Bracket | With Coverage | Without Coverage |
| Under 6 Years | 717 (98.2%) | 13 (1.8%) |
| 6 to 18 Years | 2,228 (100.0%) | 0 (0.0%) |
| 19 to 25 Years | 664 (97.5%) | 17 (2.5%) |
| 26 to 34 Years | 890 (100.0%) | 0 (0.0%) |
| 35 to 44 Years | 1,616 (98.7%) | 22 (1.3%) |
| 45 to 54 Years | 1,745 (99.5%) | 9 (0.5%) |
| 55 to 64 Years | 1,308 (97.0%) | 41 (3.0%) |
| 65 to 74 Years | 1,048 (98.9%) | 12 (1.1%) |
| 75 Years and older | 339 (100.0%) | 0 (0.0%) |
| Total | 10,555 (98.9%) | 114 (1.1%) |
Health Insurance Coverage by Citizenship Status in Victoria
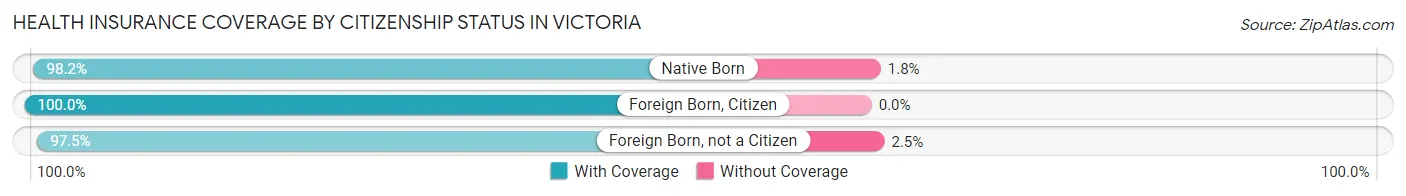
| Citizenship Status | With Coverage | Without Coverage |
| Native Born | 717 (98.2%) | 13 (1.8%) |
| Foreign Born, Citizen | 2,228 (100.0%) | 0 (0.0%) |
| Foreign Born, not a Citizen | 664 (97.5%) | 17 (2.5%) |
Health Insurance Coverage by Household Income in Victoria
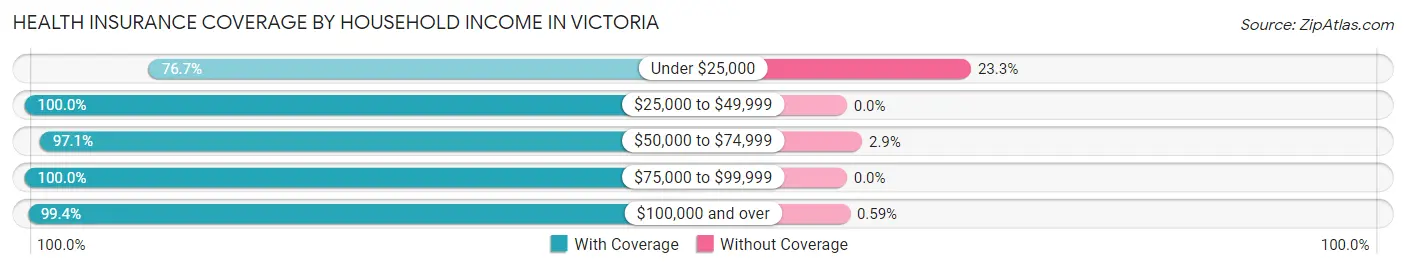
| Household Income | With Coverage | Without Coverage |
| Under $25,000 | 155 (76.7%) | 47 (23.3%) |
| $25,000 to $49,999 | 125 (100.0%) | 0 (0.0%) |
| $50,000 to $74,999 | 407 (97.1%) | 12 (2.9%) |
| $75,000 to $99,999 | 513 (100.0%) | 0 (0.0%) |
| $100,000 and over | 9,274 (99.4%) | 55 (0.6%) |
Public vs Private Health Insurance Coverage by Age in Victoria
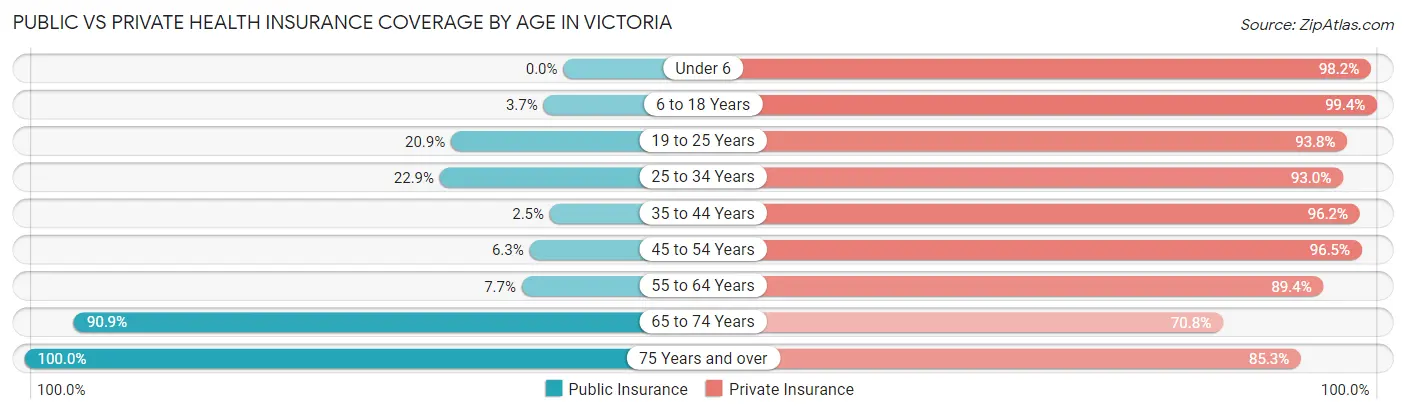
| Age Bracket | Public Insurance | Private Insurance |
| Under 6 | 0 (0.0%) | 717 (98.2%) |
| 6 to 18 Years | 82 (3.7%) | 2,214 (99.4%) |
| 19 to 25 Years | 142 (20.8%) | 639 (93.8%) |
| 25 to 34 Years | 204 (22.9%) | 828 (93.0%) |
| 35 to 44 Years | 41 (2.5%) | 1,575 (96.2%) |
| 45 to 54 Years | 110 (6.3%) | 1,693 (96.5%) |
| 55 to 64 Years | 104 (7.7%) | 1,206 (89.4%) |
| 65 to 74 Years | 963 (90.8%) | 750 (70.8%) |
| 75 Years and over | 339 (100.0%) | 289 (85.3%) |
| Total | 1,985 (18.6%) | 9,911 (92.9%) |
Disability Status by Sex by Age in Victoria
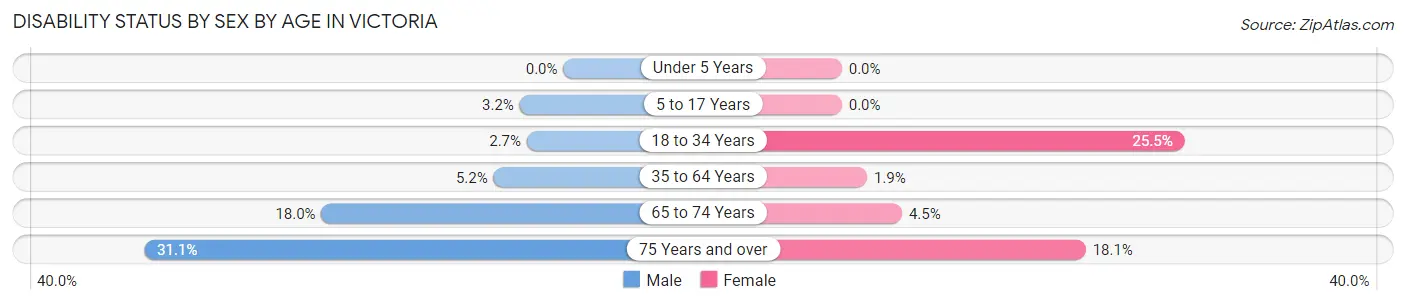
| Age Bracket | Male | Female |
| Under 5 Years | 0 (0.0%) | 0 (0.0%) |
| 5 to 17 Years | 42 (3.2%) | 0 (0.0%) |
| 18 to 34 Years | 16 (2.7%) | 300 (25.5%) |
| 35 to 64 Years | 132 (5.2%) | 41 (1.9%) |
| 65 to 74 Years | 90 (18.0%) | 25 (4.5%) |
| 75 Years and over | 66 (31.1%) | 23 (18.1%) |
Disability Class by Sex by Age in Victoria
Disability Class: Hearing Difficulty
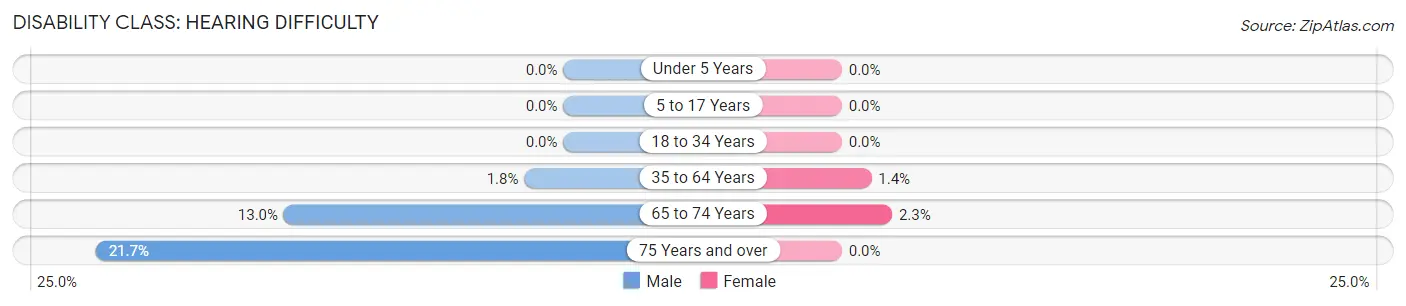
| Age Bracket | Male | Female |
| Under 5 Years | 0 (0.0%) | 0 (0.0%) |
| 5 to 17 Years | 0 (0.0%) | 0 (0.0%) |
| 18 to 34 Years | 0 (0.0%) | 0 (0.0%) |
| 35 to 64 Years | 46 (1.8%) | 30 (1.4%) |
| 65 to 74 Years | 65 (13.0%) | 13 (2.3%) |
| 75 Years and over | 46 (21.7%) | 0 (0.0%) |
Disability Class: Vision Difficulty
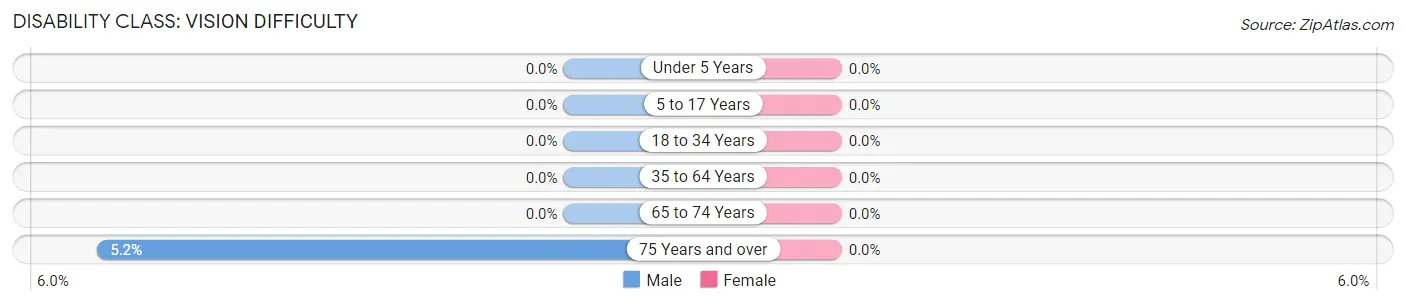
| Age Bracket | Male | Female |
| Under 5 Years | 0 (0.0%) | 0 (0.0%) |
| 5 to 17 Years | 0 (0.0%) | 0 (0.0%) |
| 18 to 34 Years | 0 (0.0%) | 0 (0.0%) |
| 35 to 64 Years | 0 (0.0%) | 0 (0.0%) |
| 65 to 74 Years | 0 (0.0%) | 0 (0.0%) |
| 75 Years and over | 11 (5.2%) | 0 (0.0%) |
Disability Class: Cognitive Difficulty
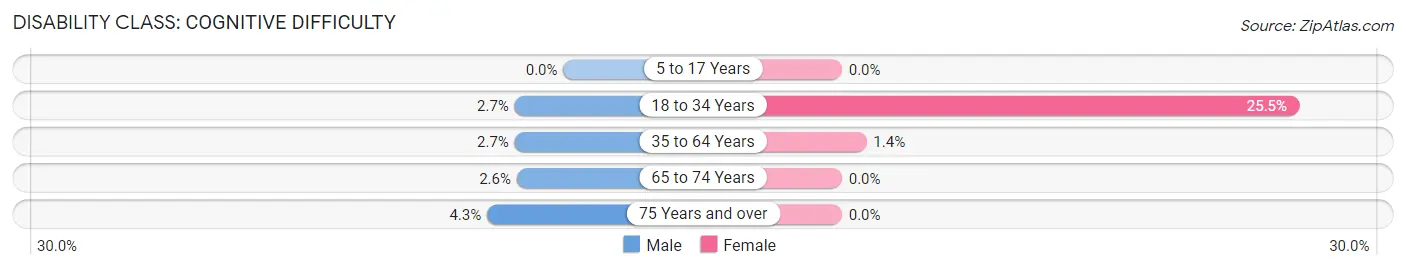
| Age Bracket | Male | Female |
| 5 to 17 Years | 0 (0.0%) | 0 (0.0%) |
| 18 to 34 Years | 16 (2.7%) | 300 (25.5%) |
| 35 to 64 Years | 69 (2.7%) | 30 (1.4%) |
| 65 to 74 Years | 13 (2.6%) | 0 (0.0%) |
| 75 Years and over | 9 (4.3%) | 0 (0.0%) |
Disability Class: Ambulatory Difficulty
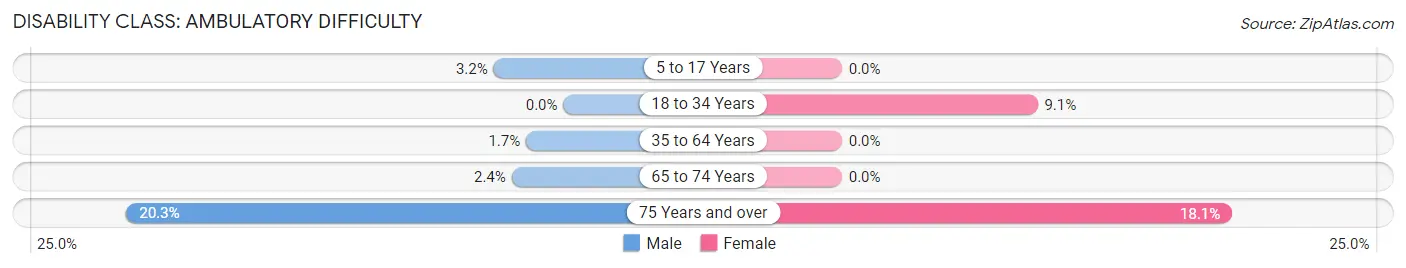
| Age Bracket | Male | Female |
| 5 to 17 Years | 42 (3.2%) | 0 (0.0%) |
| 18 to 34 Years | 0 (0.0%) | 107 (9.1%) |
| 35 to 64 Years | 44 (1.7%) | 0 (0.0%) |
| 65 to 74 Years | 12 (2.4%) | 0 (0.0%) |
| 75 Years and over | 43 (20.3%) | 23 (18.1%) |
Disability Class: Self-Care Difficulty
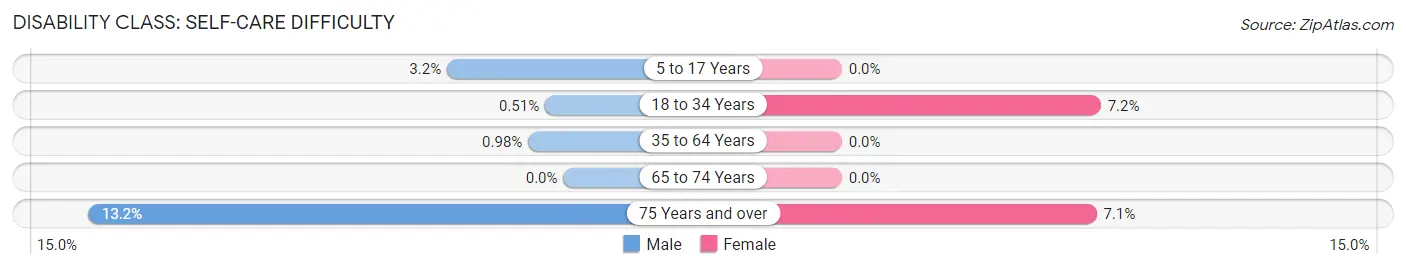
| Age Bracket | Male | Female |
| 5 to 17 Years | 42 (3.2%) | 0 (0.0%) |
| 18 to 34 Years | 3 (0.5%) | 85 (7.2%) |
| 35 to 64 Years | 25 (1.0%) | 0 (0.0%) |
| 65 to 74 Years | 0 (0.0%) | 0 (0.0%) |
| 75 Years and over | 28 (13.2%) | 9 (7.1%) |
Technology Access in Victoria
Computing Device Access in Victoria
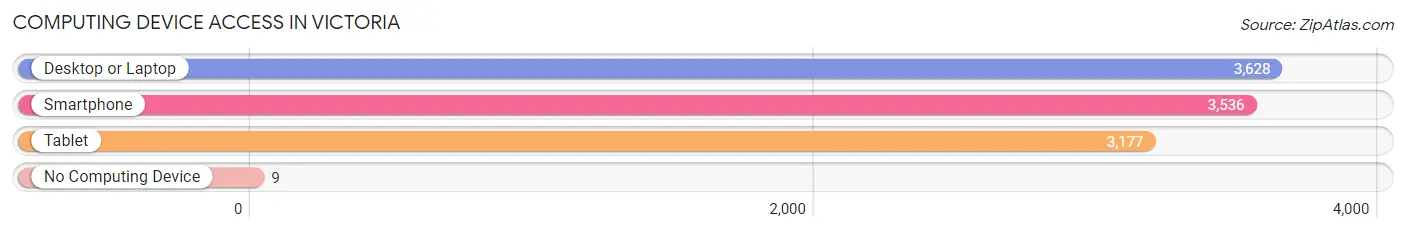
| Device Type | # Households | % Households |
| Desktop or Laptop | 3,628 | 97.8% |
| Smartphone | 3,536 | 95.3% |
| Tablet | 3,177 | 85.7% |
| No Computing Device | 9 | 0.2% |
| Total | 3,709 | 100.0% |
Internet Access in Victoria
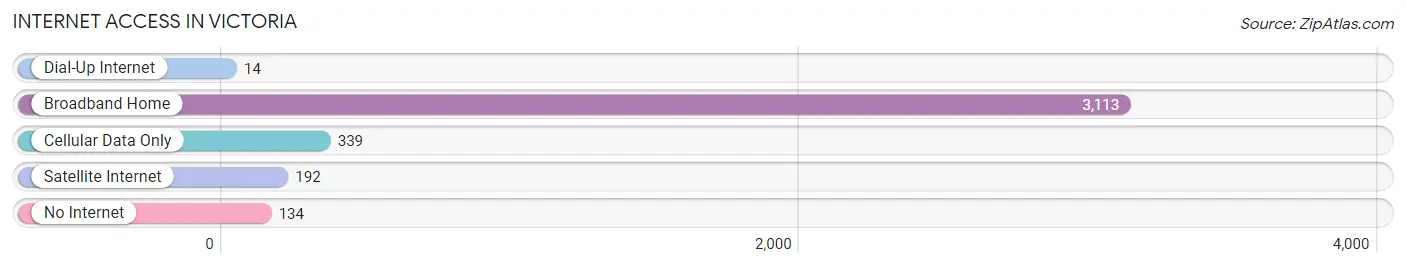
| Internet Type | # Households | % Households |
| Dial-Up Internet | 14 | 0.4% |
| Broadband Home | 3,113 | 83.9% |
| Cellular Data Only | 339 | 9.1% |
| Satellite Internet | 192 | 5.2% |
| No Internet | 134 | 3.6% |
| Total | 3,709 | 100.0% |
Victoria Summary
Victoria is a city located in Carver County, Minnesota, United States. The population was 8,385 at the 2010 census. It is part of the Minneapolis-St. Paul metropolitan area.
History
Victoria was founded in 1858 by German immigrants who were looking for a place to settle and farm. The city was named after Queen Victoria of the United Kingdom. The first settlers were mostly farmers, but the city soon became a center for industry and commerce. In 1876, the first railroad line was built, connecting Victoria to Minneapolis. This allowed for the growth of the city and the development of businesses.
In the late 19th century, Victoria was a thriving community with a variety of businesses, including a brewery, a flour mill, a sawmill, a brickyard, and a creamery. The city also had a number of churches, schools, and a library.
Geography
Victoria is located in Carver County, Minnesota, about 25 miles southwest of Minneapolis. The city is situated on the banks of the Minnesota River, and is surrounded by rolling hills and farmland. The city covers an area of 8.2 square miles, and has a population of 8,385 people, according to the 2010 census.
Economy
Victoria’s economy is largely based on agriculture and manufacturing. The city is home to a number of businesses, including a brewery, a flour mill, a sawmill, a brickyard, and a creamery. The city also has a number of churches, schools, and a library.
The city is also home to a number of large employers, including the Carver County Government, the Carver County Sheriff’s Office, and the Carver County Medical Center. The city is also home to a number of small businesses, including restaurants, retail stores, and professional services.
Demographics
According to the 2010 census, the population of Victoria was 8,385. The racial makeup of the city was 94.3% White, 1.2% African American, 0.3% Native American, 1.2% Asian, 0.1% Pacific Islander, 1.7% from other races, and 1.4% from two or more races. Hispanic or Latino of any race were 3.3% of the population.
The median income for a household in the city was $60,938, and the median income for a family was $71,944. The per capita income for the city was $27,945. About 4.2% of families and 5.7% of the population were below the poverty line, including 6.3% of those under age 18 and 5.2% of those age 65 or over.
Conclusion
Victoria is a city located in Carver County, Minnesota, United States. The city was founded in 1858 by German immigrants and has since grown to become a thriving community with a variety of businesses, churches, schools, and a library. The city’s economy is largely based on agriculture and manufacturing, and it is home to a number of large employers. According to the 2010 census, the population of Victoria was 8,385, with a median household income of $60,938.
Common Questions
What is the Total Population of Victoria?
Total Population of Victoria is 10,681.
What is the Total Male Population of Victoria?
Total Male Population of Victoria is 5,491.
What is the Total Female Population of Victoria?
Total Female Population of Victoria is 5,190.
What is the Ratio of Males per 100 Females in Victoria?
There are 105.80 Males per 100 Females in Victoria.
What is the Ratio of Females per 100 Males in Victoria?
There are 94.52 Females per 100 Males in Victoria.
What is the Median Population Age in Victoria?
Median Population Age in Victoria is 39.4 Years.
What is the Average Family Size in Victoria
Average Family Size in Victoria is 3.1 People.
What is the Average Household Size in Victoria
Average Household Size in Victoria is 2.9 People.
What is Per Capita Income in Victoria?
Per Capita income in Victoria is $71,237.
What is the Median Family Income in Victoria?
Median Family Income in Victoria is $192,083.
What is the Median Household income in Victoria?
Median Household Income in Victoria is $179,515.
What is Income or Wage Gap in Victoria?
Income or Wage Gap in Victoria is 41.7%.
Women in Victoria earn 58.3 cents for every dollar earned by a man.
What is Inequality or Gini Index in Victoria?
Inequality or Gini Index in Victoria is 0.34.
How Large is the Labor Force in Victoria?
There are 6,089 People in the Labor Forcein in Victoria.
What is the Percentage of People in the Labor Force in Victoria?
73.8% of People are in the Labor Force in Victoria.
What is the Unemployment Rate in Victoria?
Unemployment Rate in Victoria is 4.3%.