Otsego, MN
Otsego Map
Otsego Overview
20,455
TOTAL POPULATION
10,403
MALE POPULATION
10,052
FEMALE POPULATION
103.49
MALES / 100 FEMALES
96.63
FEMALES / 100 MALES
34.6
MEDIAN AGE
3.5
AVG FAMILY SIZE
3.0
AVG HOUSEHOLD SIZE
$45,856
PER CAPITA INCOME
$136,489
AVG FAMILY INCOME
$122,420
AVG HOUSEHOLD INCOME
33.2%
WAGE / INCOME GAP [ % ]
66.8¢/ $1
WAGE / INCOME GAP [ $ ]
0.30
INEQUALITY / GINI INDEX
11,390
LABOR FORCE [ PEOPLE ]
75.7%
PERCENT IN LABOR FORCE
1.5%
UNEMPLOYMENT RATE
Otsego Area Codes
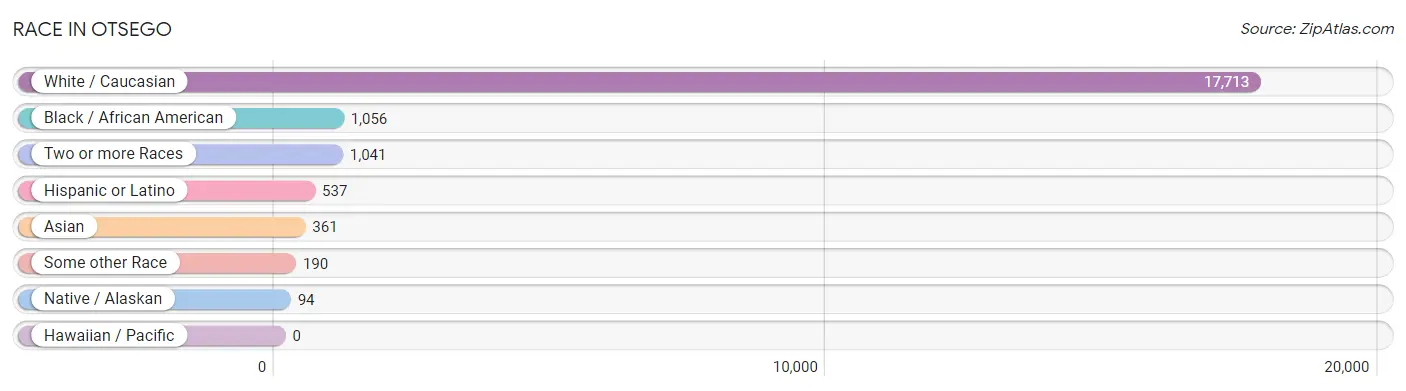
Race in Otsego
The most populous races in Otsego are White / Caucasian (17,713 | 86.6%), Black / African American (1,056 | 5.2%), and Two or more Races (1,041 | 5.1%).
| Race | # Population | % Population |
| Asian | 361 | 1.8% |
| Black / African American | 1,056 | 5.2% |
| Hawaiian / Pacific | 0 | 0.0% |
| Hispanic or Latino | 537 | 2.6% |
| Native / Alaskan | 94 | 0.5% |
| White / Caucasian | 17,713 | 86.6% |
| Two or more Races | 1,041 | 5.1% |
| Some other Race | 190 | 0.9% |
| Total | 20,455 | 100.0% |
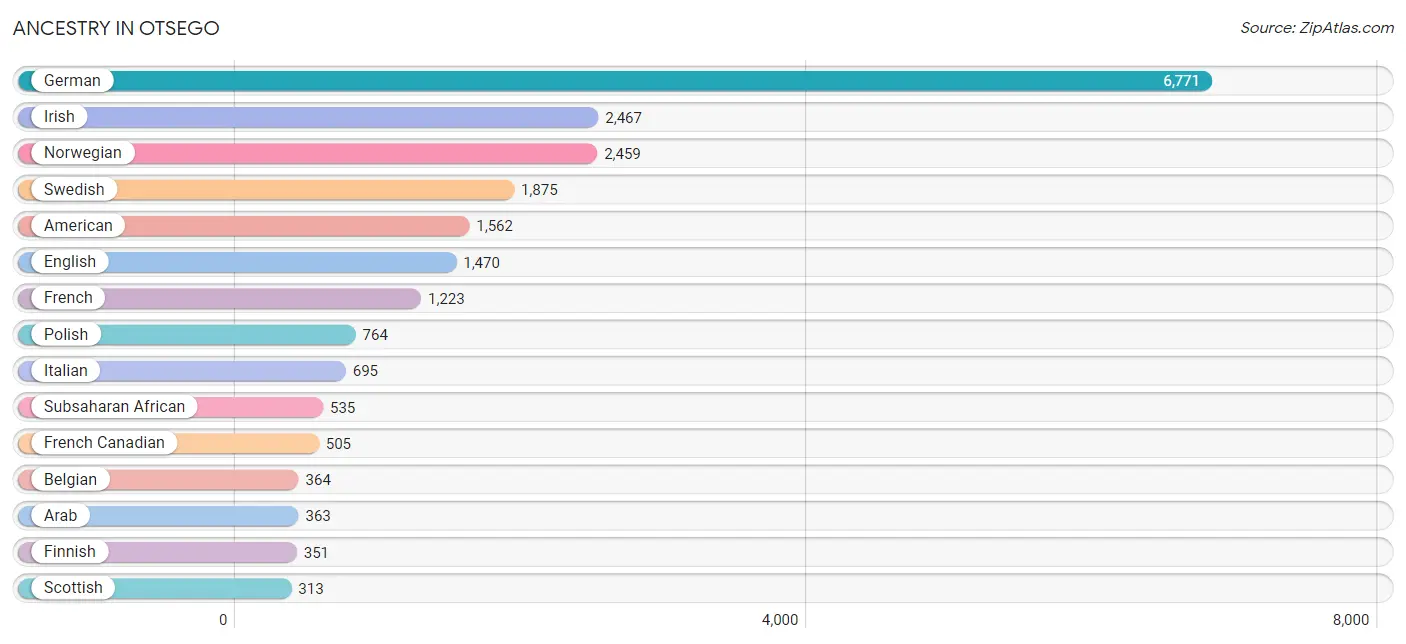
Ancestry in Otsego
The most populous ancestries reported in Otsego are German (6,771 | 33.1%), Irish (2,467 | 12.1%), Norwegian (2,459 | 12.0%), Swedish (1,875 | 9.2%), and American (1,562 | 7.6%), together accounting for 74.0% of all Otsego residents.
| Ancestry | # Population | % Population |
| African | 233 | 1.1% |
| American | 1,562 | 7.6% |
| Arab | 363 | 1.8% |
| Bangladeshi | 152 | 0.7% |
| Belgian | 364 | 1.8% |
| British | 33 | 0.2% |
| Burmese | 205 | 1.0% |
| Cherokee | 8 | 0.0% |
| Czech | 242 | 1.2% |
| Danish | 19 | 0.1% |
| Dutch | 202 | 1.0% |
| Eastern European | 16 | 0.1% |
| Egyptian | 308 | 1.5% |
| English | 1,470 | 7.2% |
| European | 308 | 1.5% |
| Finnish | 351 | 1.7% |
| French | 1,223 | 6.0% |
| French Canadian | 505 | 2.5% |
| German | 6,771 | 33.1% |
| Greek | 41 | 0.2% |
| Indian (Asian) | 81 | 0.4% |
| Irish | 2,467 | 12.1% |
| Italian | 695 | 3.4% |
| Kenyan | 302 | 1.5% |
| Korean | 67 | 0.3% |
| Laotian | 30 | 0.2% |
| Mexican | 234 | 1.1% |
| Northern European | 18 | 0.1% |
| Norwegian | 2,459 | 12.0% |
| Polish | 764 | 3.7% |
| Puerto Rican | 108 | 0.5% |
| Russian | 66 | 0.3% |
| Scandinavian | 296 | 1.5% |
| Scotch-Irish | 8 | 0.0% |
| Scottish | 313 | 1.5% |
| Slovak | 26 | 0.1% |
| Spanish | 191 | 0.9% |
| Sri Lankan | 76 | 0.4% |
| Subsaharan African | 535 | 2.6% |
| Swedish | 1,875 | 9.2% |
| Swiss | 40 | 0.2% |
| Syrian | 55 | 0.3% |
| Thai | 48 | 0.2% |
| Ukrainian | 27 | 0.1% |
| Yugoslavian | 22 | 0.1% |
| Yup'ik | 26 | 0.1% | View All 46 Rows |
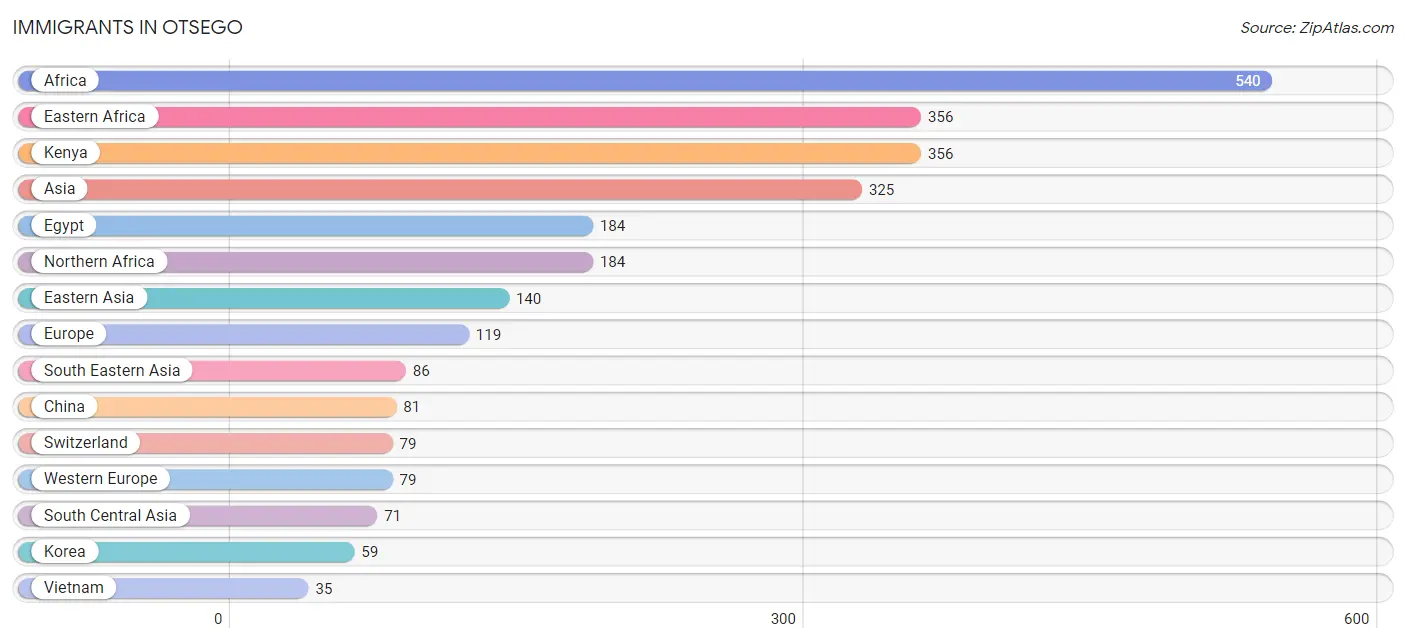
Immigrants in Otsego
The most numerous immigrant groups reported in Otsego came from Africa (540 | 2.6%), Eastern Africa (356 | 1.7%), Kenya (356 | 1.7%), Asia (325 | 1.6%), and Egypt (184 | 0.9%), together accounting for 8.6% of all Otsego residents.
| Immigration Origin | # Population | % Population |
| Africa | 540 | 2.6% |
| Asia | 325 | 1.6% |
| China | 81 | 0.4% |
| Eastern Africa | 356 | 1.7% |
| Eastern Asia | 140 | 0.7% |
| Eastern Europe | 15 | 0.1% |
| Egypt | 184 | 0.9% |
| Europe | 119 | 0.6% |
| India | 31 | 0.2% |
| Indonesia | 30 | 0.2% |
| Kenya | 356 | 1.7% |
| Korea | 59 | 0.3% |
| Northern Africa | 184 | 0.9% |
| Northern Europe | 25 | 0.1% |
| Philippines | 21 | 0.1% |
| Russia | 15 | 0.1% |
| South Central Asia | 71 | 0.4% |
| South Eastern Asia | 86 | 0.4% |
| Switzerland | 79 | 0.4% |
| Syria | 28 | 0.1% |
| Vietnam | 35 | 0.2% |
| Western Asia | 28 | 0.1% |
| Western Europe | 79 | 0.4% | View All 23 Rows |
Sex and Age in Otsego
Sex and Age in Otsego
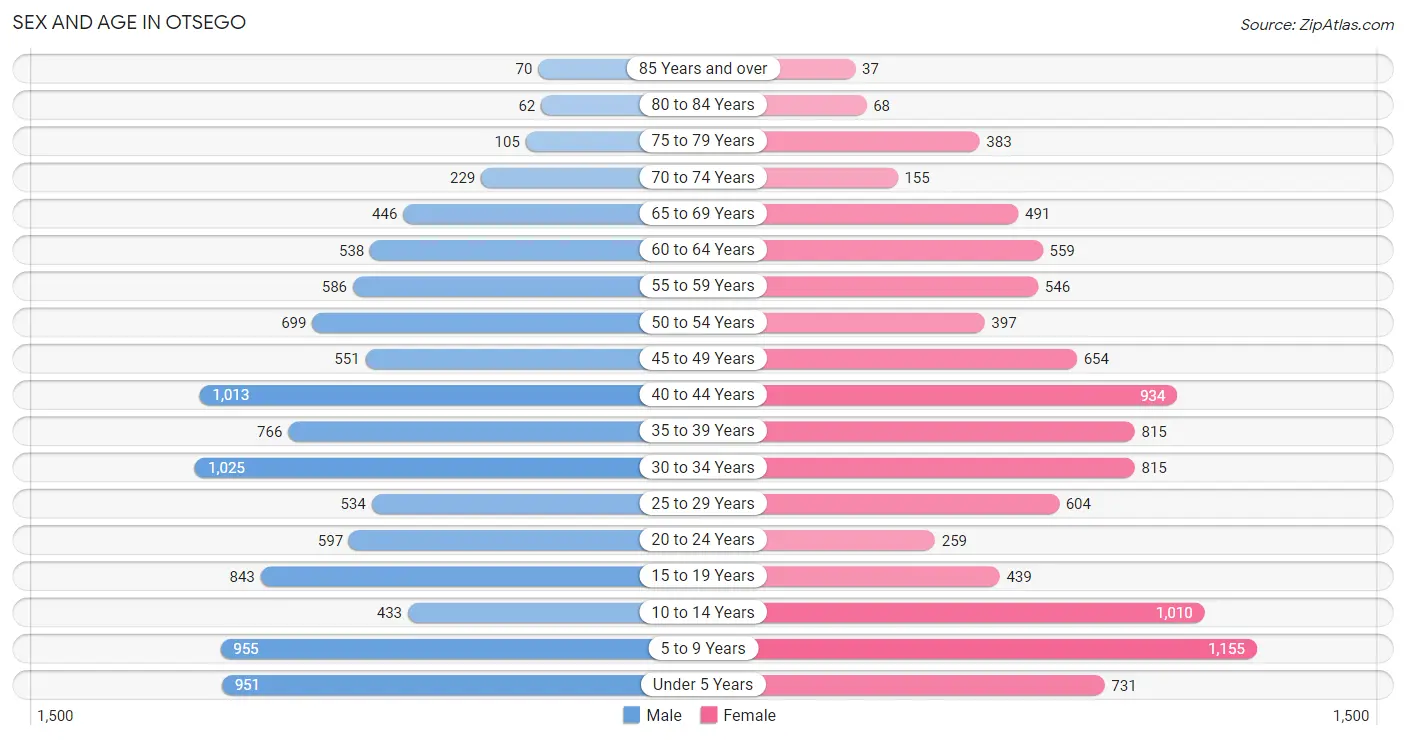
The most populous age groups in Otsego are 30 to 34 Years (1,025 | 9.9%) for men and 5 to 9 Years (1,155 | 11.5%) for women.
| Age Bracket | Male | Female |
| Under 5 Years | 951 (9.1%) | 731 (7.3%) |
| 5 to 9 Years | 955 (9.2%) | 1,155 (11.5%) |
| 10 to 14 Years | 433 (4.2%) | 1,010 (10.1%) |
| 15 to 19 Years | 843 (8.1%) | 439 (4.4%) |
| 20 to 24 Years | 597 (5.7%) | 259 (2.6%) |
| 25 to 29 Years | 534 (5.1%) | 604 (6.0%) |
| 30 to 34 Years | 1,025 (9.9%) | 815 (8.1%) |
| 35 to 39 Years | 766 (7.4%) | 815 (8.1%) |
| 40 to 44 Years | 1,013 (9.7%) | 934 (9.3%) |
| 45 to 49 Years | 551 (5.3%) | 654 (6.5%) |
| 50 to 54 Years | 699 (6.7%) | 397 (4.0%) |
| 55 to 59 Years | 586 (5.6%) | 546 (5.4%) |
| 60 to 64 Years | 538 (5.2%) | 559 (5.6%) |
| 65 to 69 Years | 446 (4.3%) | 491 (4.9%) |
| 70 to 74 Years | 229 (2.2%) | 155 (1.5%) |
| 75 to 79 Years | 105 (1.0%) | 383 (3.8%) |
| 80 to 84 Years | 62 (0.6%) | 68 (0.7%) |
| 85 Years and over | 70 (0.7%) | 37 (0.4%) |
| Total | 10,403 (100.0%) | 10,052 (100.0%) |
Families and Households in Otsego
Median Family Size in Otsego
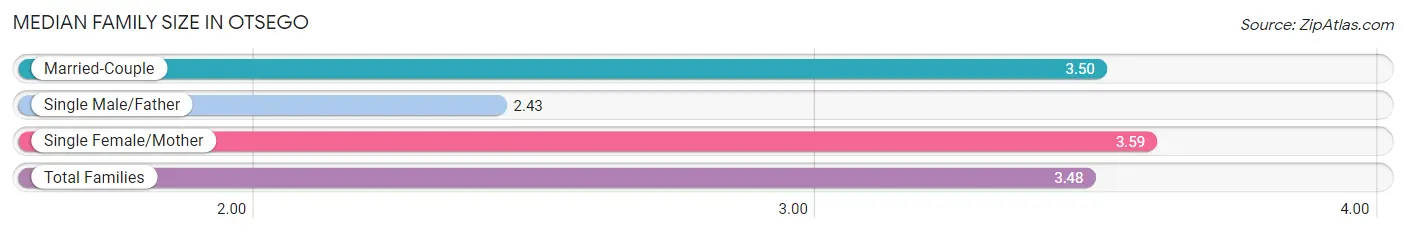
The median family size in Otsego is 3.48 persons per family, with single female/mother families (454 | 8.6%) accounting for the largest median family size of 3.59 persons per family. On the other hand, single male/father families (156 | 3.0%) represent the smallest median family size with 2.43 persons per family.
| Family Type | # Families | Family Size |
| Married-Couple | 4,648 (88.4%) | 3.50 |
| Single Male/Father | 156 (3.0%) | 2.43 |
| Single Female/Mother | 454 (8.6%) | 3.59 |
| Total Families | 5,258 (100.0%) | 3.48 |
Median Household Size in Otsego
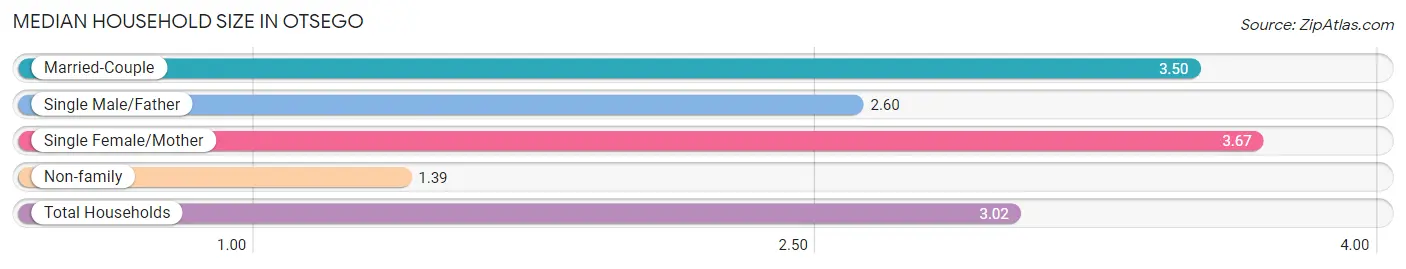
The median household size in Otsego is 3.02 persons per household, with single female/mother households (454 | 6.7%) accounting for the largest median household size of 3.67 persons per household. non-family households (1,501 | 22.2%) represent the smallest median household size with 1.39 persons per household.
| Household Type | # Households | Household Size |
| Married-Couple | 4,648 (68.8%) | 3.50 |
| Single Male/Father | 156 (2.3%) | 2.60 |
| Single Female/Mother | 454 (6.7%) | 3.67 |
| Non-family | 1,501 (22.2%) | 1.39 |
| Total Households | 6,759 (100.0%) | 3.02 |
Household Size by Marriage Status in Otsego
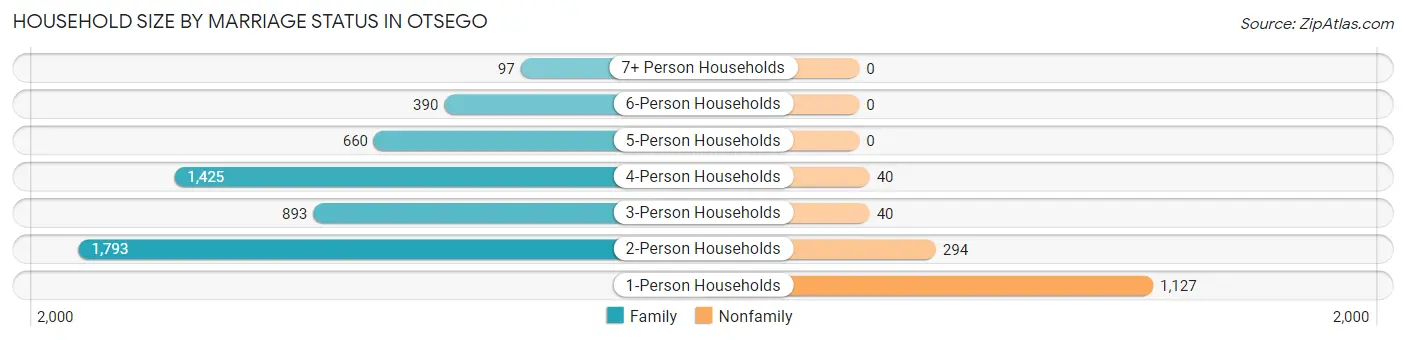
Out of a total of 6,759 households in Otsego, 5,258 (77.8%) are family households, while 1,501 (22.2%) are nonfamily households. The most numerous type of family households are 2-person households, comprising 1,793, and the most common type of nonfamily households are 1-person households, comprising 1,127.
| Household Size | Family Households | Nonfamily Households |
| 1-Person Households | - | 1,127 (16.7%) |
| 2-Person Households | 1,793 (26.5%) | 294 (4.3%) |
| 3-Person Households | 893 (13.2%) | 40 (0.6%) |
| 4-Person Households | 1,425 (21.1%) | 40 (0.6%) |
| 5-Person Households | 660 (9.8%) | 0 (0.0%) |
| 6-Person Households | 390 (5.8%) | 0 (0.0%) |
| 7+ Person Households | 97 (1.4%) | 0 (0.0%) |
| Total | 5,258 (77.8%) | 1,501 (22.2%) |
Female Fertility in Otsego
Fertility by Age in Otsego
Average fertility rate in Otsego is 81.0 births per 1,000 women. Women in the age bracket of 20 to 34 years have the highest fertility rate with 173.0 births per 1,000 women. Women in the age bracket of 20 to 34 years acount for 76.7% of all women with births.
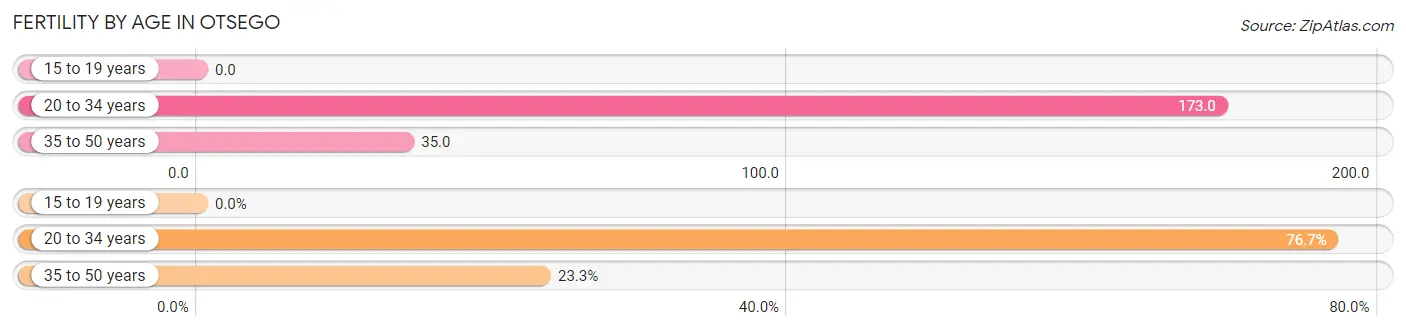
| Age Bracket | Women with Births | Births / 1,000 Women |
| 15 to 19 years | 0 (0.0%) | 0.0 |
| 20 to 34 years | 290 (76.7%) | 173.0 |
| 35 to 50 years | 88 (23.3%) | 35.0 |
| Total | 378 (100.0%) | 81.0 |
Fertility by Age by Marriage Status in Otsego
95.5% of women with births (378) in Otsego are married. The highest percentage of unmarried women with births falls into 35 to 50 years age bracket with 19.3% of them unmarried at the time of birth, while the lowest percentage of unmarried women with births belong to 20 to 34 years age bracket with 0.0% of them unmarried.
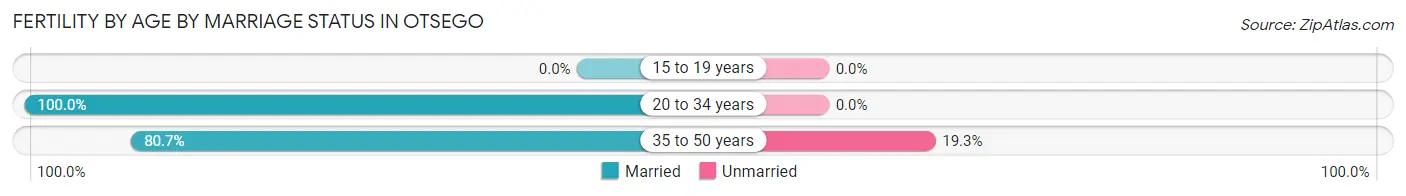
| Age Bracket | Married | Unmarried |
| 15 to 19 years | 0 (0.0%) | 0 (0.0%) |
| 20 to 34 years | 290 (100.0%) | 0 (0.0%) |
| 35 to 50 years | 71 (80.7%) | 17 (19.3%) |
| Total | 361 (95.5%) | 17 (4.5%) |
Fertility by Education in Otsego
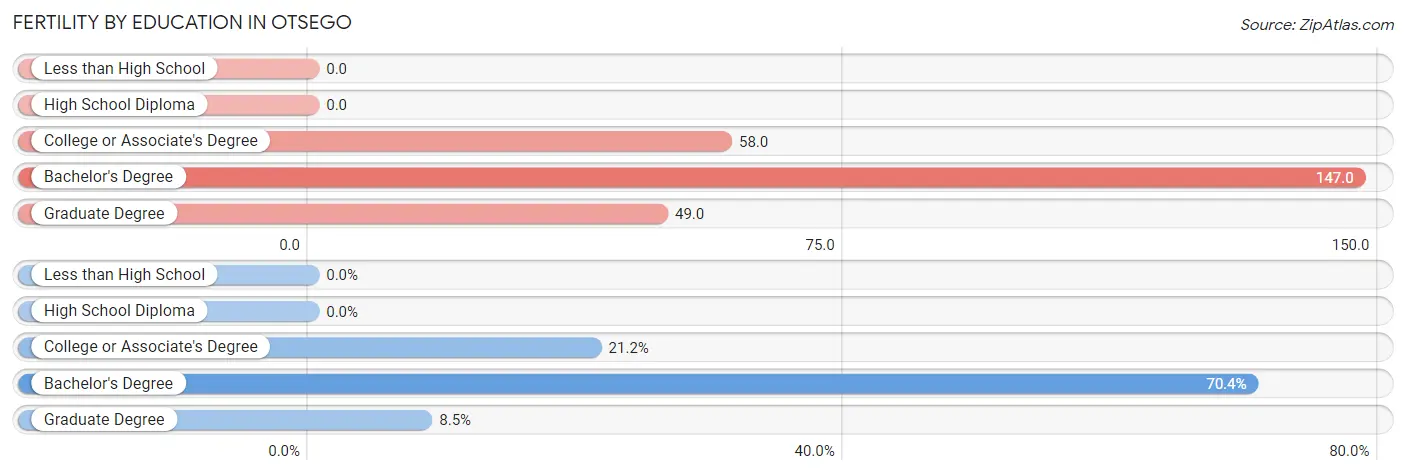
| Educational Attainment | Women with Births | Births / 1,000 Women |
| Less than High School | 0 (0.0%) | 0.0 |
| High School Diploma | 0 (0.0%) | 0.0 |
| College or Associate's Degree | 80 (21.2%) | 58.0 |
| Bachelor's Degree | 266 (70.4%) | 147.0 |
| Graduate Degree | 32 (8.5%) | 49.0 |
| Total | 378 (100.0%) | 81.0 |
Fertility by Education by Marriage Status in Otsego
4.5% of women with births in Otsego are unmarried. Women with the educational attainment of college or associate's degree are most likely to be married with 100.0% of them married at childbirth, while women with the educational attainment of bachelor's degree are least likely to be married with 6.0% of them unmarried at childbirth.
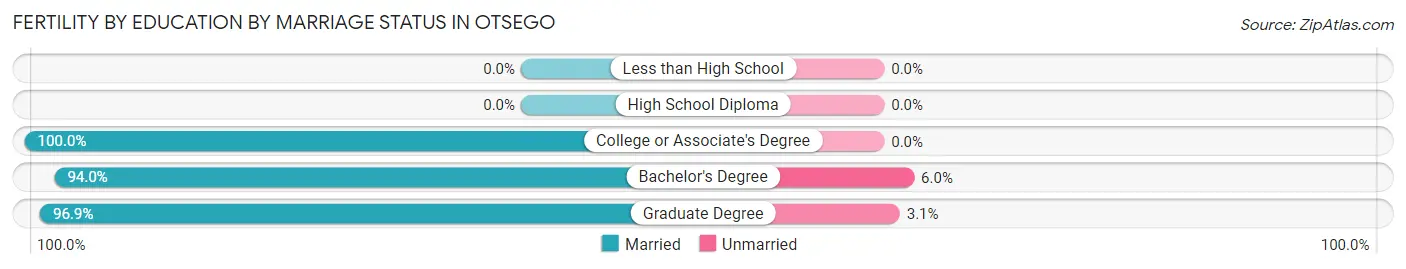
| Educational Attainment | Married | Unmarried |
| Less than High School | 0 (0.0%) | 0 (0.0%) |
| High School Diploma | 0 (0.0%) | 0 (0.0%) |
| College or Associate's Degree | 80 (100.0%) | 0 (0.0%) |
| Bachelor's Degree | 250 (94.0%) | 16 (6.0%) |
| Graduate Degree | 31 (96.9%) | 1 (3.1%) |
| Total | 361 (95.5%) | 17 (4.5%) |
Income in Otsego
Income Overview in Otsego
Per Capita Income in Otsego is $45,856, while median incomes of families and households are $136,489 and $122,420 respectively.
| Characteristic | Number | Measure |
| Per Capita Income | 20,455 | $45,856 |
| Median Family Income | 5,258 | $136,489 |
| Mean Family Income | 5,258 | $151,147 |
| Median Household Income | 6,759 | $122,420 |
| Mean Household Income | 6,759 | $136,360 |
| Income Deficit | 5,258 | $0 |
| Wage / Income Gap (%) | 20,455 | 33.23% |
| Wage / Income Gap ($) | 20,455 | 66.77¢ per $1 |
| Gini / Inequality Index | 20,455 | 0.30 |
Earnings by Sex in Otsego
Average Earnings in Otsego are $61,099, $71,429 for men and $47,692 for women, a difference of 33.2%.
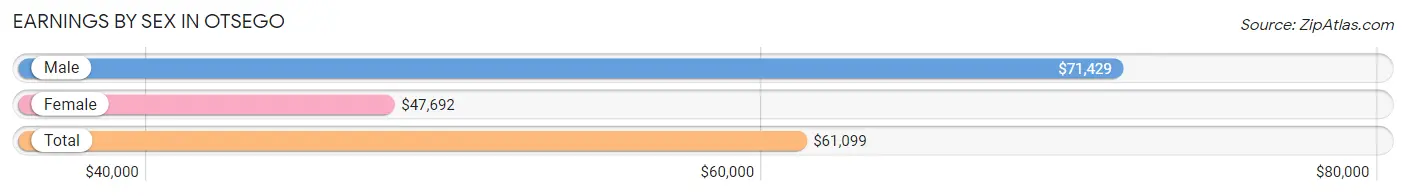
| Sex | Number | Average Earnings |
| Male | 6,686 (56.1%) | $71,429 |
| Female | 5,234 (43.9%) | $47,692 |
| Total | 11,920 (100.0%) | $61,099 |
Earnings by Sex by Income Bracket in Otsego
The most common earnings brackets in Otsego are $100,000+ for men (1,734 | 25.9%) and $75,000 to $99,999 for women (933 | 17.8%).
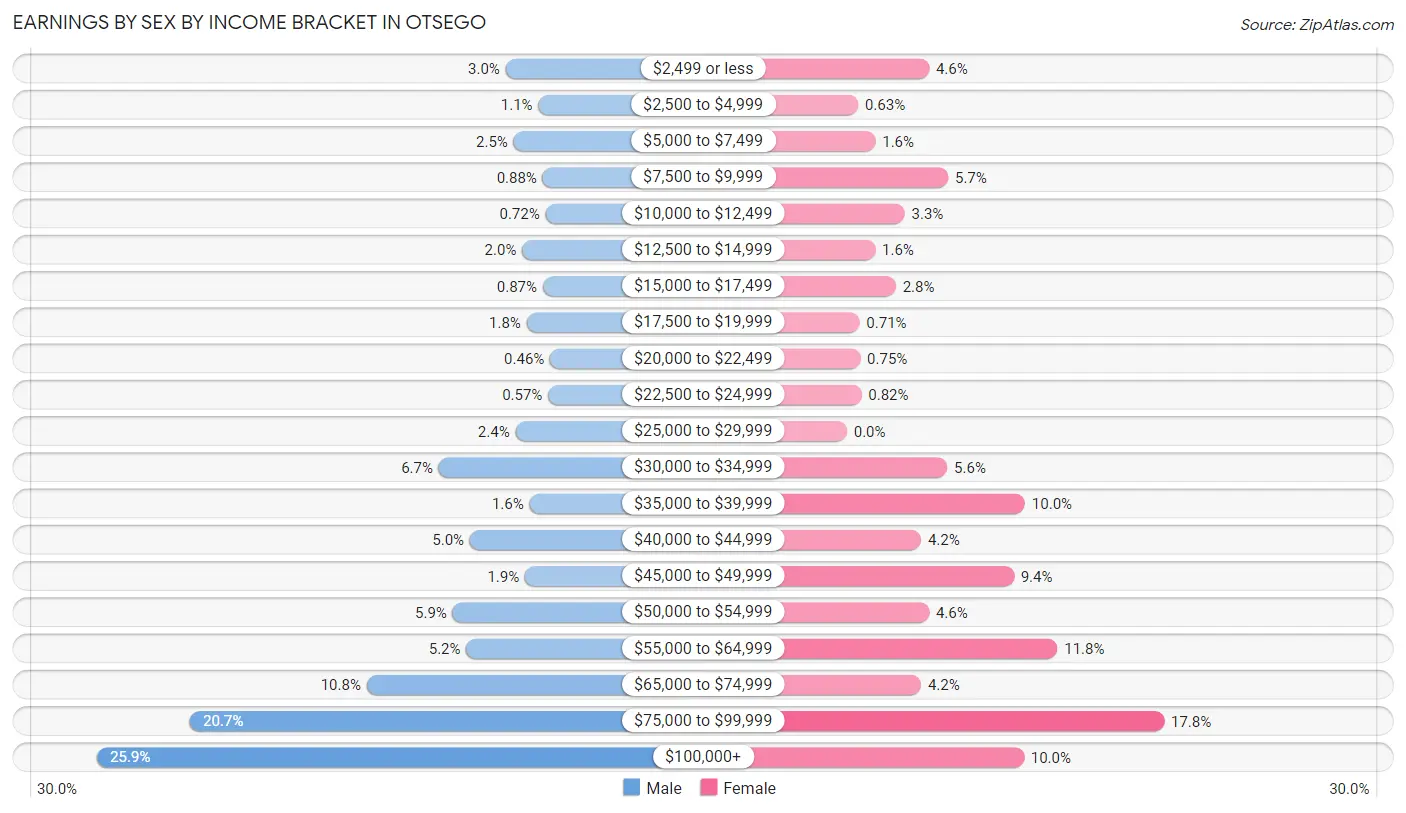
| Income | Male | Female |
| $2,499 or less | 198 (3.0%) | 242 (4.6%) |
| $2,500 to $4,999 | 75 (1.1%) | 33 (0.6%) |
| $5,000 to $7,499 | 168 (2.5%) | 84 (1.6%) |
| $7,500 to $9,999 | 59 (0.9%) | 298 (5.7%) |
| $10,000 to $12,499 | 48 (0.7%) | 170 (3.3%) |
| $12,500 to $14,999 | 136 (2.0%) | 83 (1.6%) |
| $15,000 to $17,499 | 58 (0.9%) | 144 (2.8%) |
| $17,500 to $19,999 | 119 (1.8%) | 37 (0.7%) |
| $20,000 to $22,499 | 31 (0.5%) | 39 (0.7%) |
| $22,500 to $24,999 | 38 (0.6%) | 43 (0.8%) |
| $25,000 to $29,999 | 161 (2.4%) | 0 (0.0%) |
| $30,000 to $34,999 | 449 (6.7%) | 295 (5.6%) |
| $35,000 to $39,999 | 108 (1.6%) | 524 (10.0%) |
| $40,000 to $44,999 | 332 (5.0%) | 218 (4.2%) |
| $45,000 to $49,999 | 125 (1.9%) | 491 (9.4%) |
| $50,000 to $54,999 | 397 (5.9%) | 242 (4.6%) |
| $55,000 to $64,999 | 346 (5.2%) | 619 (11.8%) |
| $65,000 to $74,999 | 720 (10.8%) | 218 (4.2%) |
| $75,000 to $99,999 | 1,384 (20.7%) | 933 (17.8%) |
| $100,000+ | 1,734 (25.9%) | 521 (10.0%) |
| Total | 6,686 (100.0%) | 5,234 (100.0%) |
Earnings by Sex by Educational Attainment in Otsego
Average earnings in Otsego are $81,136 for men and $52,867 for women, a difference of 34.8%. Men with an educational attainment of graduate degree enjoy the highest average annual earnings of $89,400, while those with high school diploma education earn the least with $51,673. Women with an educational attainment of graduate degree earn the most with the average annual earnings of $84,082, while those with college or associate's degree education have the smallest earnings of $40,224.
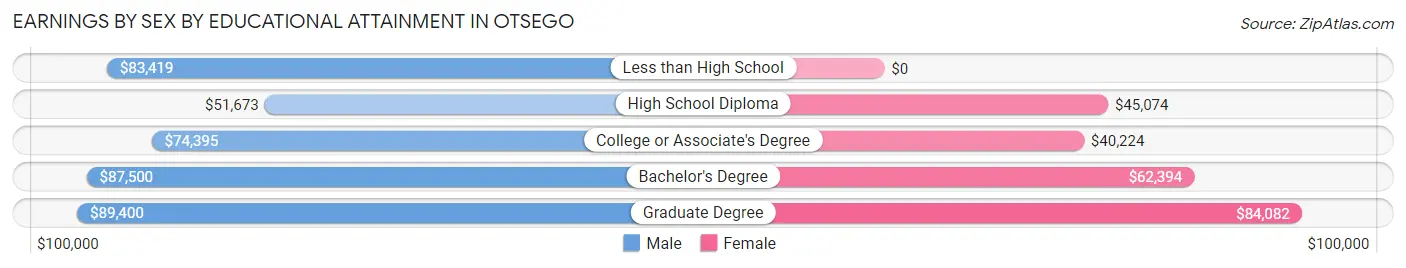
| Educational Attainment | Male Income | Female Income |
| Less than High School | $83,419 | $0 |
| High School Diploma | $51,673 | $45,074 |
| College or Associate's Degree | $74,395 | $40,224 |
| Bachelor's Degree | $87,500 | $62,394 |
| Graduate Degree | $89,400 | $84,082 |
| Total | $81,136 | $52,867 |
Family Income in Otsego
Family Income Brackets in Otsego
According to the Otsego family income data, there are 1,788 families falling into the $100,000 to $149,999 income range, which is the most common income bracket and makes up 34.0% of all families.
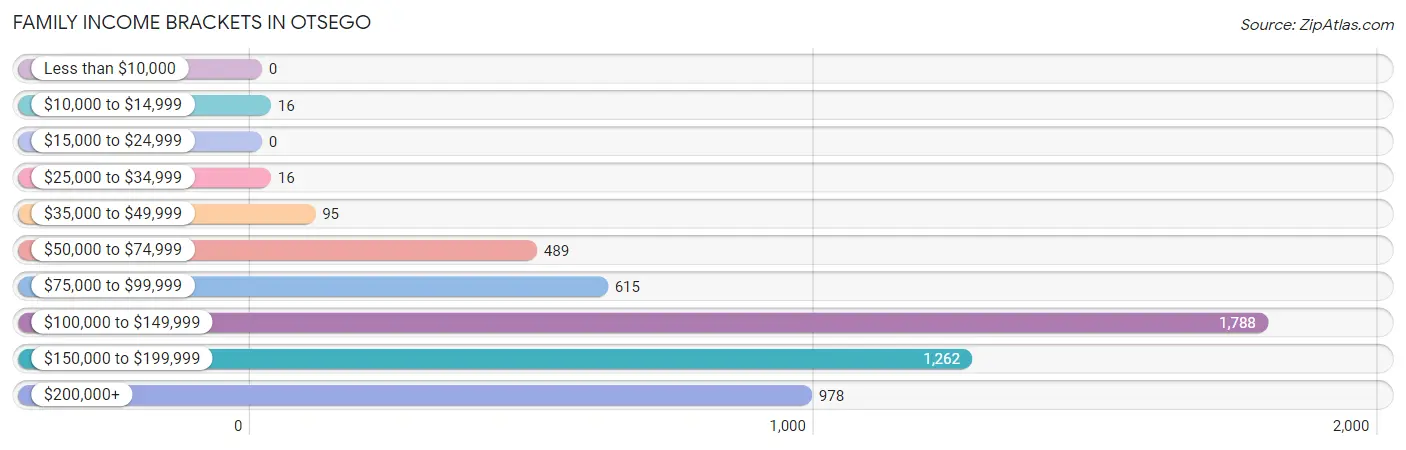
| Income Bracket | # Families | % Families |
| Less than $10,000 | 0 | 0.0% |
| $10,000 to $14,999 | 16 | 0.3% |
| $15,000 to $24,999 | 0 | 0.0% |
| $25,000 to $34,999 | 16 | 0.3% |
| $35,000 to $49,999 | 95 | 1.8% |
| $50,000 to $74,999 | 489 | 9.3% |
| $75,000 to $99,999 | 615 | 11.7% |
| $100,000 to $149,999 | 1,788 | 34.0% |
| $150,000 to $199,999 | 1,262 | 24.0% |
| $200,000+ | 978 | 18.6% |
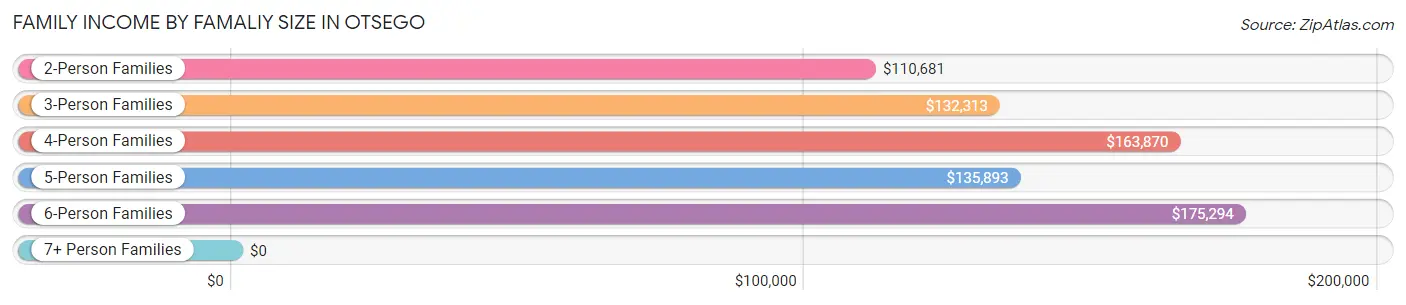
Family Income by Famaliy Size in Otsego
6-person families (374 | 7.1%) account for the highest median family income in Otsego with $175,294 per family, while 2-person families (1,839 | 35.0%) have the highest median income of $55,340 per family member.
| Income Bracket | # Families | Median Income |
| 2-Person Families | 1,839 (35.0%) | $110,681 |
| 3-Person Families | 862 (16.4%) | $132,313 |
| 4-Person Families | 1,411 (26.8%) | $163,870 |
| 5-Person Families | 675 (12.8%) | $135,893 |
| 6-Person Families | 374 (7.1%) | $175,294 |
| 7+ Person Families | 97 (1.8%) | $0 |
| Total | 5,258 (100.0%) | $136,489 |
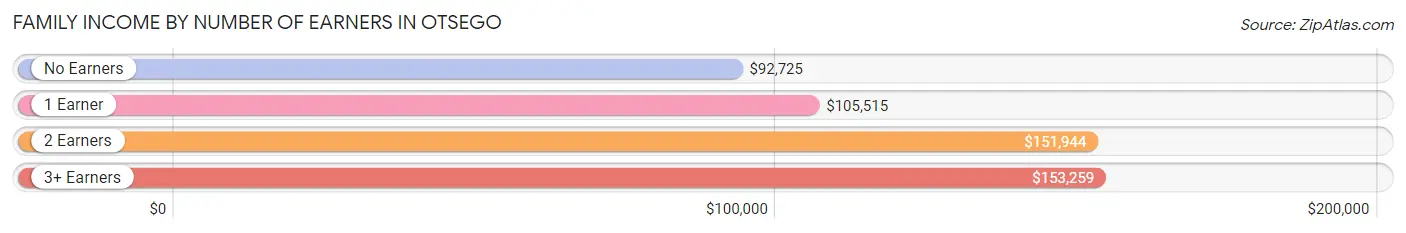
Family Income by Number of Earners in Otsego
The median family income in Otsego is $136,489, with families comprising 3+ earners (1,080) having the highest median family income of $153,259, while families with no earners (265) have the lowest median family income of $92,725, accounting for 20.5% and 5.0% of families, respectively.
| Number of Earners | # Families | Median Income |
| No Earners | 265 (5.0%) | $92,725 |
| 1 Earner | 1,221 (23.2%) | $105,515 |
| 2 Earners | 2,692 (51.2%) | $151,944 |
| 3+ Earners | 1,080 (20.5%) | $153,259 |
| Total | 5,258 (100.0%) | $136,489 |
Household Income in Otsego
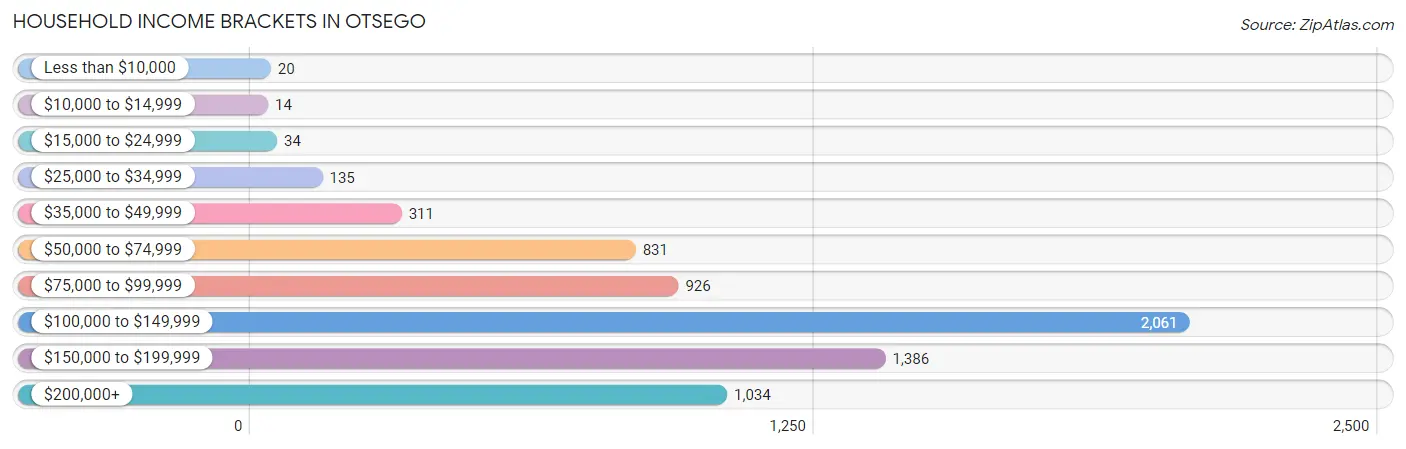
Household Income Brackets in Otsego
With 2,061 households falling in the category, the $100,000 to $149,999 income range is the most frequent in Otsego, accounting for 30.5% of all households. In contrast, only 14 households (0.2%) fall into the $10,000 to $14,999 income bracket, making it the least populous group.
| Income Bracket | # Households | % Households |
| Less than $10,000 | 20 | 0.3% |
| $10,000 to $14,999 | 14 | 0.2% |
| $15,000 to $24,999 | 34 | 0.5% |
| $25,000 to $34,999 | 135 | 2.0% |
| $35,000 to $49,999 | 311 | 4.6% |
| $50,000 to $74,999 | 831 | 12.3% |
| $75,000 to $99,999 | 926 | 13.7% |
| $100,000 to $149,999 | 2,061 | 30.5% |
| $150,000 to $199,999 | 1,386 | 20.5% |
| $200,000+ | 1,034 | 15.3% |
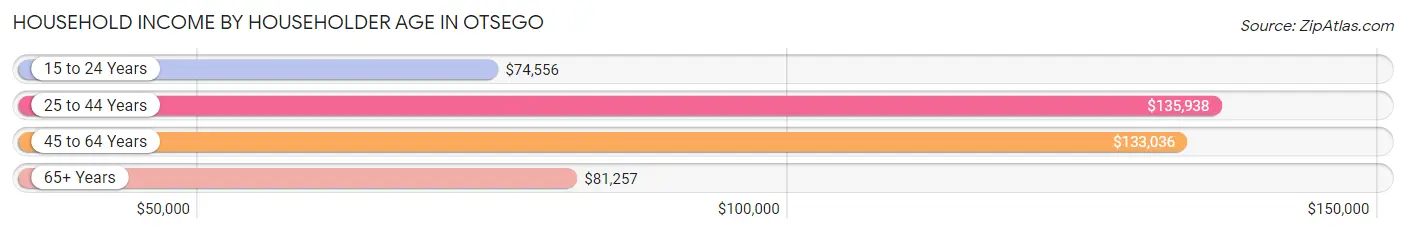
Household Income by Householder Age in Otsego
The median household income in Otsego is $122,420, with the highest median household income of $135,938 found in the 25 to 44 years age bracket for the primary householder. A total of 3,205 households (47.4%) fall into this category. Meanwhile, the 15 to 24 years age bracket for the primary householder has the lowest median household income of $74,556, with 85 households (1.3%) in this group.
| Income Bracket | # Households | Median Income |
| 15 to 24 Years | 85 (1.3%) | $74,556 |
| 25 to 44 Years | 3,205 (47.4%) | $135,938 |
| 45 to 64 Years | 2,161 (32.0%) | $133,036 |
| 65+ Years | 1,308 (19.4%) | $81,257 |
| Total | 6,759 (100.0%) | $122,420 |
Poverty in Otsego
Income Below Poverty by Sex and Age in Otsego
With 0.4% poverty level for males and 1.3% for females among the residents of Otsego, 6 to 11 year old males and 18 to 24 year old females are the most vulnerable to poverty, with 19 males (2.0%) and 18 females (6.1%) in their respective age groups living below the poverty level.
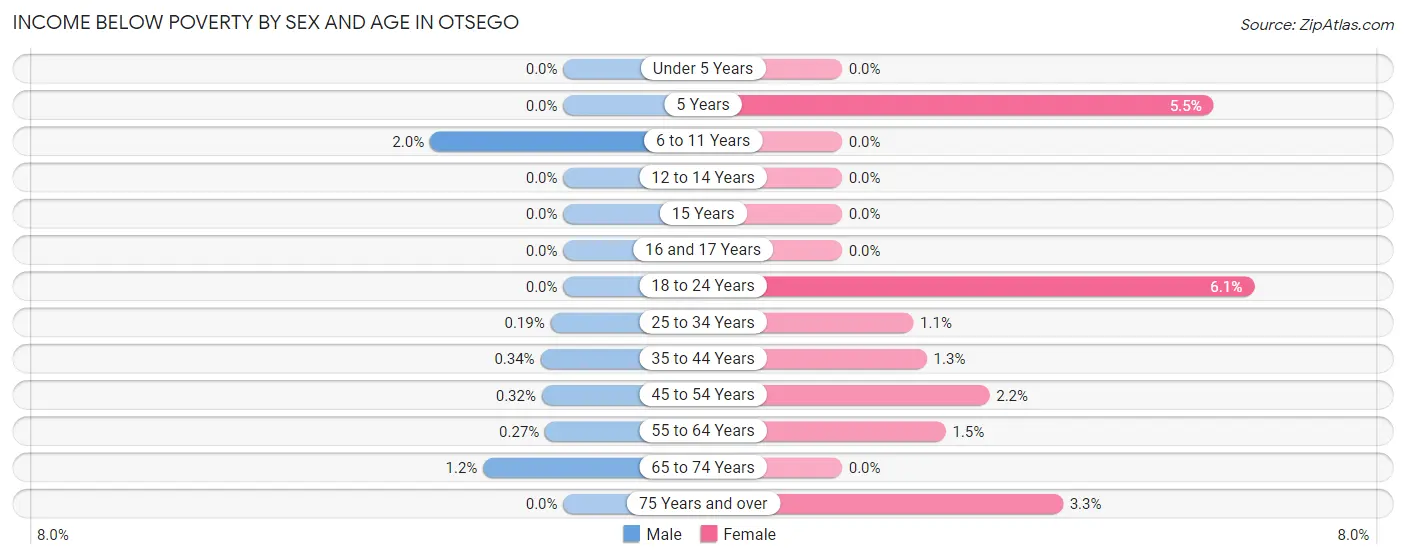
| Age Bracket | Male | Female |
| Under 5 Years | 0 (0.0%) | 0 (0.0%) |
| 5 Years | 0 (0.0%) | 18 (5.5%) |
| 6 to 11 Years | 19 (2.0%) | 0 (0.0%) |
| 12 to 14 Years | 0 (0.0%) | 0 (0.0%) |
| 15 Years | 0 (0.0%) | 0 (0.0%) |
| 16 and 17 Years | 0 (0.0%) | 0 (0.0%) |
| 18 to 24 Years | 0 (0.0%) | 18 (6.1%) |
| 25 to 34 Years | 3 (0.2%) | 15 (1.1%) |
| 35 to 44 Years | 6 (0.3%) | 22 (1.3%) |
| 45 to 54 Years | 4 (0.3%) | 23 (2.2%) |
| 55 to 64 Years | 3 (0.3%) | 17 (1.5%) |
| 65 to 74 Years | 8 (1.2%) | 0 (0.0%) |
| 75 Years and over | 0 (0.0%) | 16 (3.3%) |
| Total | 43 (0.4%) | 129 (1.3%) |
Income Above Poverty by Sex and Age in Otsego
According to the poverty statistics in Otsego, males aged under 5 years and females aged under 5 years are the age groups that are most secure financially, with 100.0% of males and 100.0% of females in these age groups living above the poverty line.
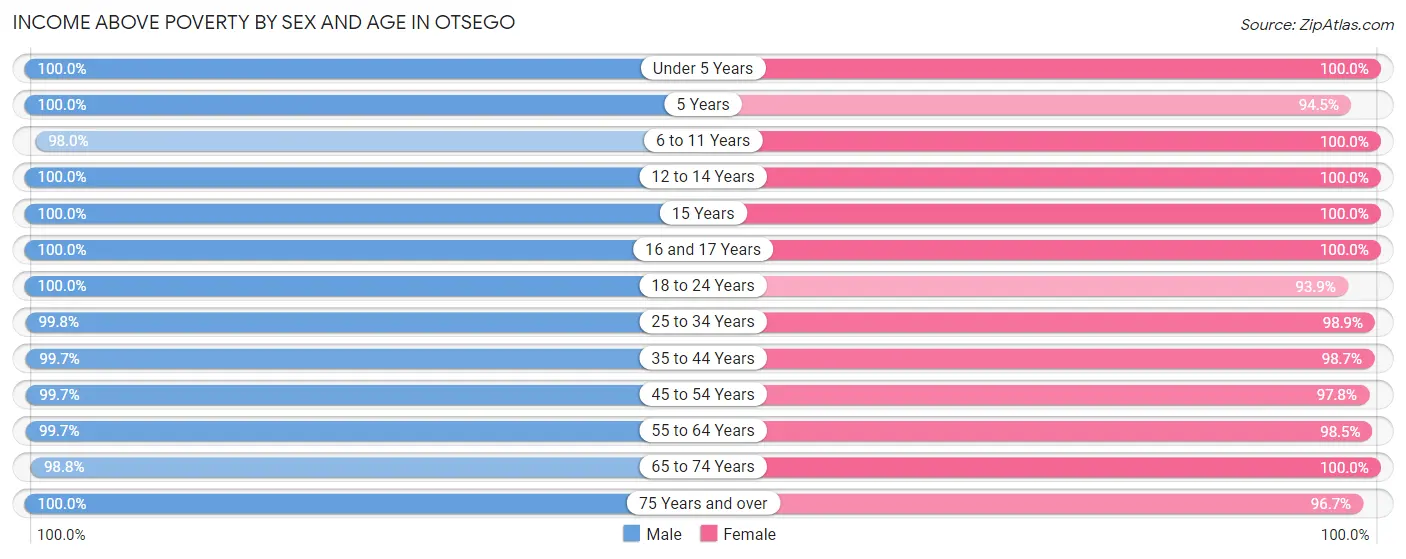
| Age Bracket | Male | Female |
| Under 5 Years | 951 (100.0%) | 731 (100.0%) |
| 5 Years | 150 (100.0%) | 308 (94.5%) |
| 6 to 11 Years | 941 (98.0%) | 1,227 (100.0%) |
| 12 to 14 Years | 219 (100.0%) | 571 (100.0%) |
| 15 Years | 97 (100.0%) | 77 (100.0%) |
| 16 and 17 Years | 390 (100.0%) | 327 (100.0%) |
| 18 to 24 Years | 953 (100.0%) | 276 (93.9%) |
| 25 to 34 Years | 1,556 (99.8%) | 1,404 (98.9%) |
| 35 to 44 Years | 1,773 (99.7%) | 1,727 (98.7%) |
| 45 to 54 Years | 1,246 (99.7%) | 1,028 (97.8%) |
| 55 to 64 Years | 1,121 (99.7%) | 1,088 (98.5%) |
| 65 to 74 Years | 667 (98.8%) | 646 (100.0%) |
| 75 Years and over | 237 (100.0%) | 472 (96.7%) |
| Total | 10,301 (99.6%) | 9,882 (98.7%) |
Income Below Poverty Among Married-Couple Families in Otsego
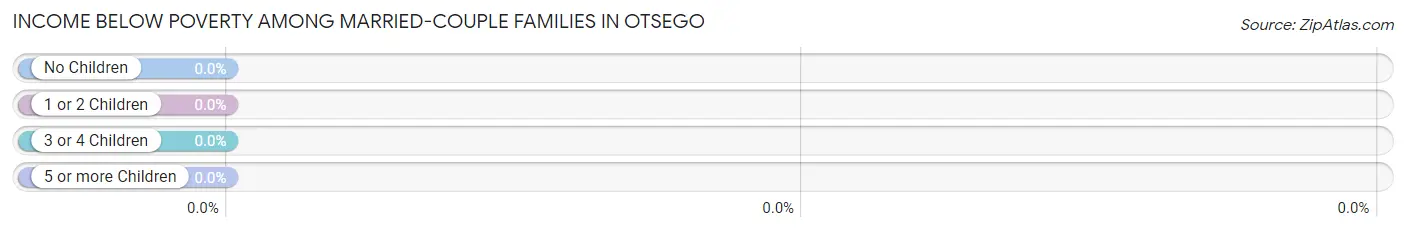
| Children | Above Poverty | Below Poverty |
| No Children | 2,109 (100.0%) | 0 (0.0%) |
| 1 or 2 Children | 1,996 (100.0%) | 0 (0.0%) |
| 3 or 4 Children | 486 (100.0%) | 0 (0.0%) |
| 5 or more Children | 57 (100.0%) | 0 (0.0%) |
| Total | 4,648 (100.0%) | 0 (0.0%) |
Income Below Poverty Among Single-Parent Households in Otsego
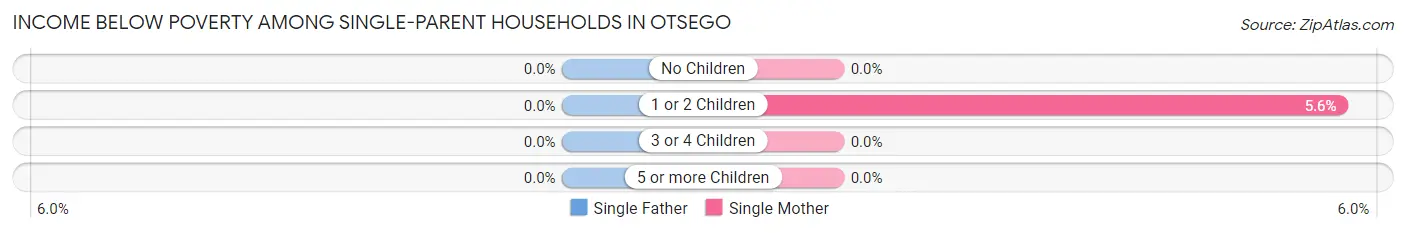
| Children | Single Father | Single Mother |
| No Children | 0 (0.0%) | 0 (0.0%) |
| 1 or 2 Children | 0 (0.0%) | 15 (5.6%) |
| 3 or 4 Children | 0 (0.0%) | 0 (0.0%) |
| 5 or more Children | 0 (0.0%) | 0 (0.0%) |
| Total | 0 (0.0%) | 15 (3.3%) |
Income Below Poverty Among Married-Couple vs Single-Parent Households in Otsego
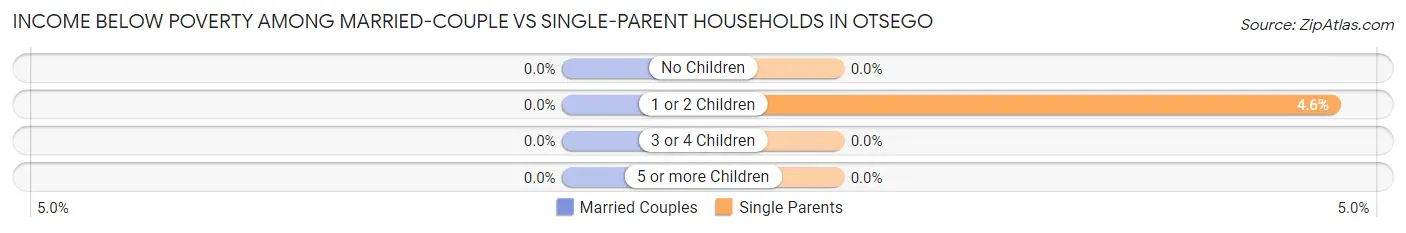
| Children | Married-Couple Families | Single-Parent Households |
| No Children | 0 (0.0%) | 0 (0.0%) |
| 1 or 2 Children | 0 (0.0%) | 15 (4.6%) |
| 3 or 4 Children | 0 (0.0%) | 0 (0.0%) |
| 5 or more Children | 0 (0.0%) | 0 (0.0%) |
| Total | 0 (0.0%) | 15 (2.5%) |
Employment Characteristics in Otsego
Employment by Class of Employer in Otsego
Among the 11,131 employed individuals in Otsego, private company employees (8,251 | 74.1%), not-for-profit organizations (910 | 8.2%), and local government employees (693 | 6.2%) make up the most common classes of employment.
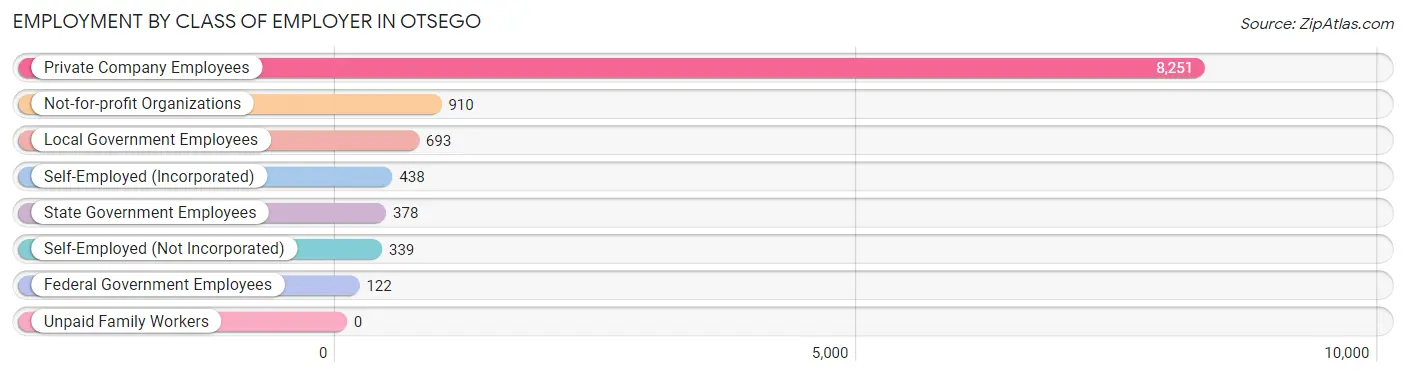
| Employer Class | # Employees | % Employees |
| Private Company Employees | 8,251 | 74.1% |
| Self-Employed (Incorporated) | 438 | 3.9% |
| Self-Employed (Not Incorporated) | 339 | 3.0% |
| Not-for-profit Organizations | 910 | 8.2% |
| Local Government Employees | 693 | 6.2% |
| State Government Employees | 378 | 3.4% |
| Federal Government Employees | 122 | 1.1% |
| Unpaid Family Workers | 0 | 0.0% |
| Total | 11,131 | 100.0% |
Employment Status by Age in Otsego
According to the labor force statistics for Otsego, out of the total population over 16 years of age (15,046), 75.7% or 11,390 individuals are in the labor force, with 1.5% or 171 of them unemployed. The age group with the highest labor force participation rate is 45 to 54 years, with 93.5% or 2,151 individuals in the labor force. Within the labor force, the 20 to 24 years age range has the highest percentage of unemployed individuals, with 8.7% or 67 of them being unemployed.
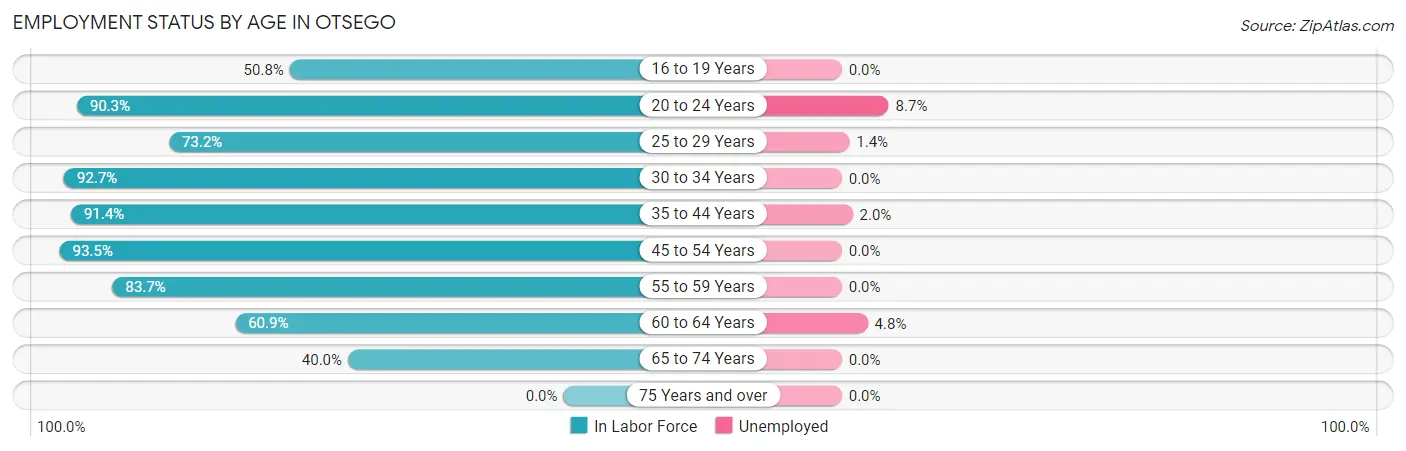
| Age Bracket | In Labor Force | Unemployed |
| 16 to 19 Years | 563 (50.8%) | 0 (0.0%) |
| 20 to 24 Years | 773 (90.3%) | 67 (8.7%) |
| 25 to 29 Years | 833 (73.2%) | 12 (1.4%) |
| 30 to 34 Years | 1,706 (92.7%) | 0 (0.0%) |
| 35 to 44 Years | 3,225 (91.4%) | 64 (2.0%) |
| 45 to 54 Years | 2,151 (93.5%) | 0 (0.0%) |
| 55 to 59 Years | 947 (83.7%) | 0 (0.0%) |
| 60 to 64 Years | 668 (60.9%) | 32 (4.8%) |
| 65 to 74 Years | 528 (40.0%) | 0 (0.0%) |
| 75 Years and over | 0 (0.0%) | 0 (0.0%) |
| Total | 11,390 (75.7%) | 171 (1.5%) |
Employment Status by Educational Attainment in Otsego
According to labor force statistics for Otsego, 86.3% of individuals (9,524) out of the total population between 25 and 64 years of age (11,036) are in the labor force, with 1.1% or 105 of them being unemployed. The group with the highest labor force participation rate are those with the educational attainment of bachelor's degree or higher, with 91.8% or 4,303 individuals in the labor force. Within the labor force, individuals with bachelor's degree or higher education have the highest percentage of unemployment, with 1.8% or 77 of them being unemployed.
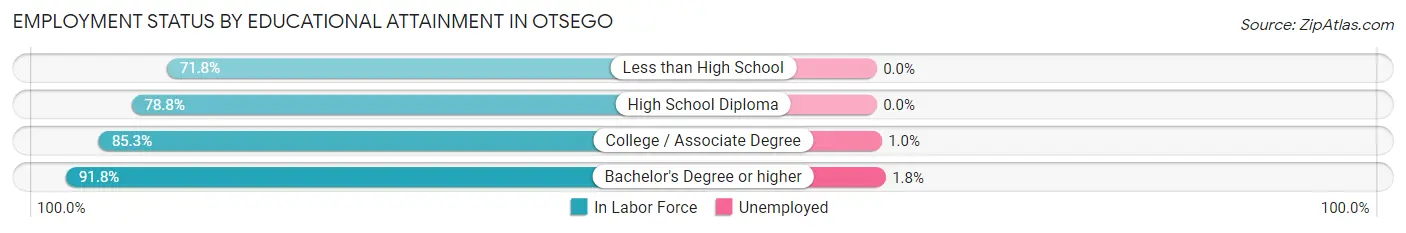
| Educational Attainment | In Labor Force | Unemployed |
| Less than High School | 295 (71.8%) | 0 (0.0%) |
| High School Diploma | 1,654 (78.8%) | 0 (0.0%) |
| College / Associate Degree | 3,275 (85.3%) | 38 (1.0%) |
| Bachelor's Degree or higher | 4,303 (91.8%) | 84 (1.8%) |
| Total | 9,524 (86.3%) | 121 (1.1%) |
Employment Occupations by Sex in Otsego
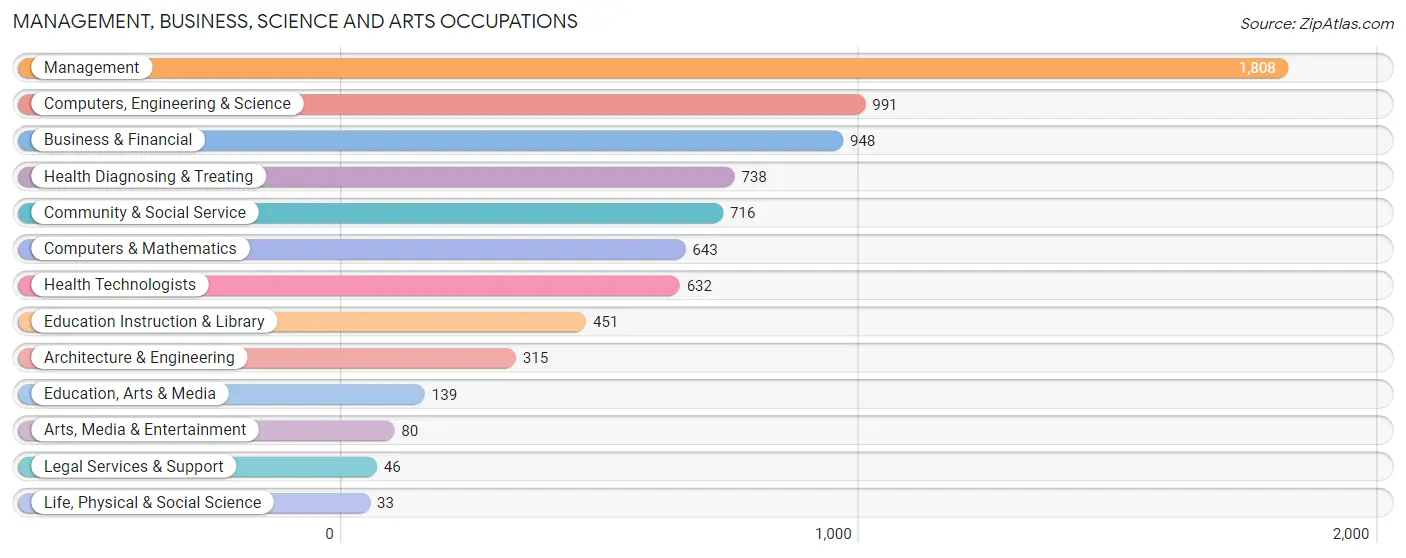
Management, Business, Science and Arts Occupations
The most common Management, Business, Science and Arts occupations in Otsego are Management (1,808 | 16.1%), Computers, Engineering & Science (991 | 8.8%), Business & Financial (948 | 8.5%), Health Diagnosing & Treating (738 | 6.6%), and Community & Social Service (716 | 6.4%).
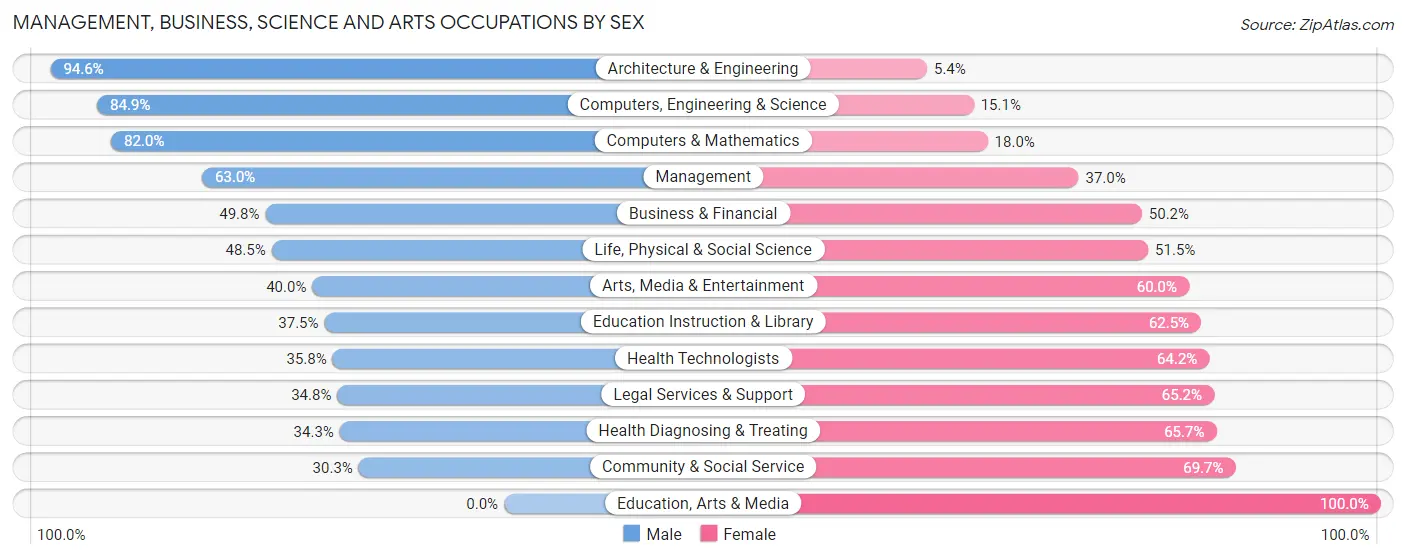
Management, Business, Science and Arts Occupations by Sex
Within the Management, Business, Science and Arts occupations in Otsego, the most male-oriented occupations are Architecture & Engineering (94.6%), Computers, Engineering & Science (84.9%), and Computers & Mathematics (82.0%), while the most female-oriented occupations are Education, Arts & Media (100.0%), Community & Social Service (69.7%), and Health Diagnosing & Treating (65.7%).
| Occupation | Male | Female |
| Management | 1,139 (63.0%) | 669 (37.0%) |
| Business & Financial | 472 (49.8%) | 476 (50.2%) |
| Computers, Engineering & Science | 841 (84.9%) | 150 (15.1%) |
| Computers & Mathematics | 527 (82.0%) | 116 (18.0%) |
| Architecture & Engineering | 298 (94.6%) | 17 (5.4%) |
| Life, Physical & Social Science | 16 (48.5%) | 17 (51.5%) |
| Community & Social Service | 217 (30.3%) | 499 (69.7%) |
| Education, Arts & Media | 0 (0.0%) | 139 (100.0%) |
| Legal Services & Support | 16 (34.8%) | 30 (65.2%) |
| Education Instruction & Library | 169 (37.5%) | 282 (62.5%) |
| Arts, Media & Entertainment | 32 (40.0%) | 48 (60.0%) |
| Health Diagnosing & Treating | 253 (34.3%) | 485 (65.7%) |
| Health Technologists | 226 (35.8%) | 406 (64.2%) |
| Total (Category) | 2,922 (56.2%) | 2,279 (43.8%) |
| Total (Overall) | 6,314 (56.4%) | 4,885 (43.6%) |
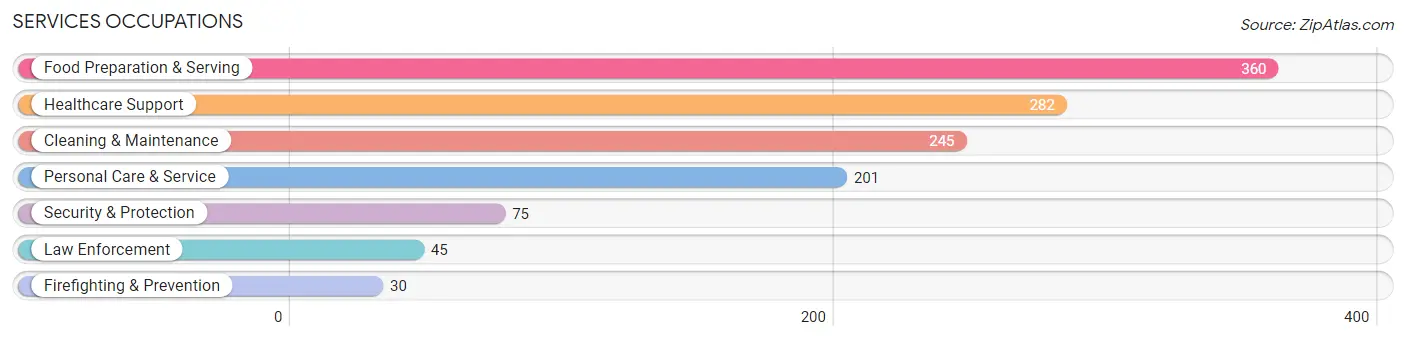
Services Occupations
The most common Services occupations in Otsego are Food Preparation & Serving (360 | 3.2%), Healthcare Support (282 | 2.5%), Cleaning & Maintenance (245 | 2.2%), Personal Care & Service (201 | 1.8%), and Security & Protection (75 | 0.7%).
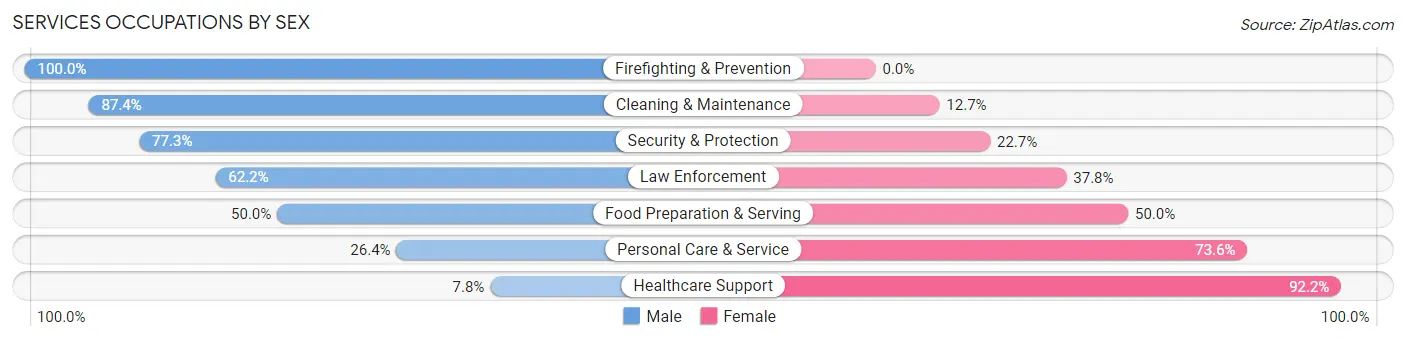
Services Occupations by Sex
Within the Services occupations in Otsego, the most male-oriented occupations are Firefighting & Prevention (100.0%), Cleaning & Maintenance (87.4%), and Security & Protection (77.3%), while the most female-oriented occupations are Healthcare Support (92.2%), Personal Care & Service (73.6%), and Food Preparation & Serving (50.0%).
| Occupation | Male | Female |
| Healthcare Support | 22 (7.8%) | 260 (92.2%) |
| Security & Protection | 58 (77.3%) | 17 (22.7%) |
| Firefighting & Prevention | 30 (100.0%) | 0 (0.0%) |
| Law Enforcement | 28 (62.2%) | 17 (37.8%) |
| Food Preparation & Serving | 180 (50.0%) | 180 (50.0%) |
| Cleaning & Maintenance | 214 (87.4%) | 31 (12.7%) |
| Personal Care & Service | 53 (26.4%) | 148 (73.6%) |
| Total (Category) | 527 (45.3%) | 636 (54.7%) |
| Total (Overall) | 6,314 (56.4%) | 4,885 (43.6%) |
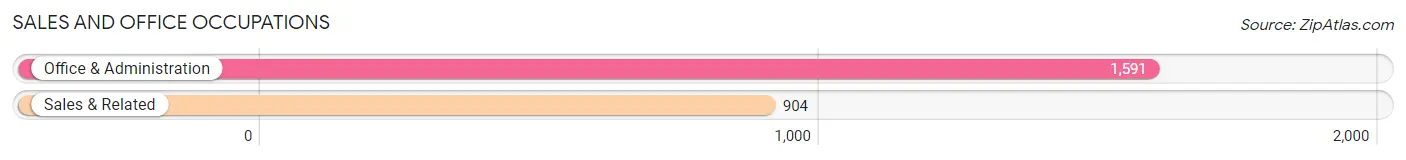
Sales and Office Occupations
The most common Sales and Office occupations in Otsego are Office & Administration (1,591 | 14.2%), and Sales & Related (904 | 8.1%).
Sales and Office Occupations by Sex
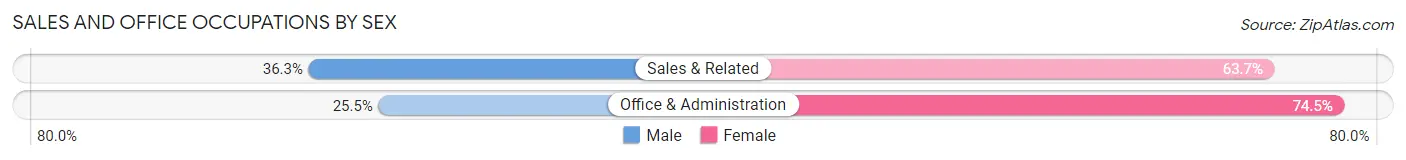
| Occupation | Male | Female |
| Sales & Related | 328 (36.3%) | 576 (63.7%) |
| Office & Administration | 406 (25.5%) | 1,185 (74.5%) |
| Total (Category) | 734 (29.4%) | 1,761 (70.6%) |
| Total (Overall) | 6,314 (56.4%) | 4,885 (43.6%) |
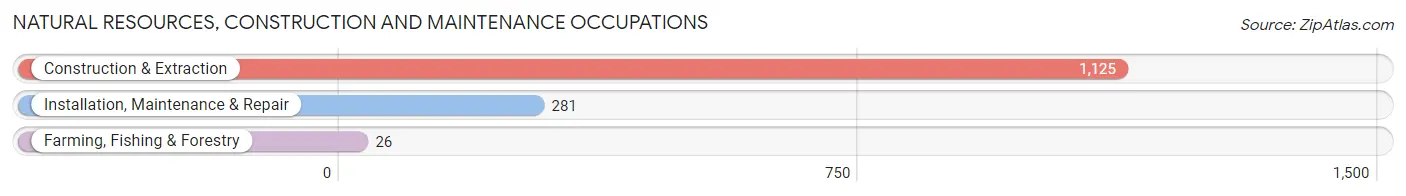
Natural Resources, Construction and Maintenance Occupations
The most common Natural Resources, Construction and Maintenance occupations in Otsego are Construction & Extraction (1,125 | 10.1%), Installation, Maintenance & Repair (281 | 2.5%), and Farming, Fishing & Forestry (26 | 0.2%).
Natural Resources, Construction and Maintenance Occupations by Sex
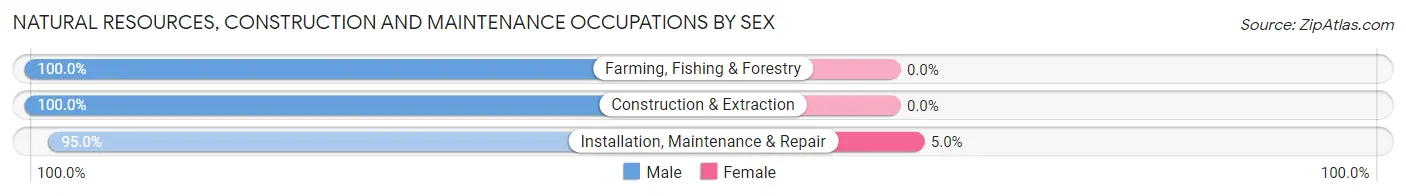
| Occupation | Male | Female |
| Farming, Fishing & Forestry | 26 (100.0%) | 0 (0.0%) |
| Construction & Extraction | 1,125 (100.0%) | 0 (0.0%) |
| Installation, Maintenance & Repair | 267 (95.0%) | 14 (5.0%) |
| Total (Category) | 1,418 (99.0%) | 14 (1.0%) |
| Total (Overall) | 6,314 (56.4%) | 4,885 (43.6%) |
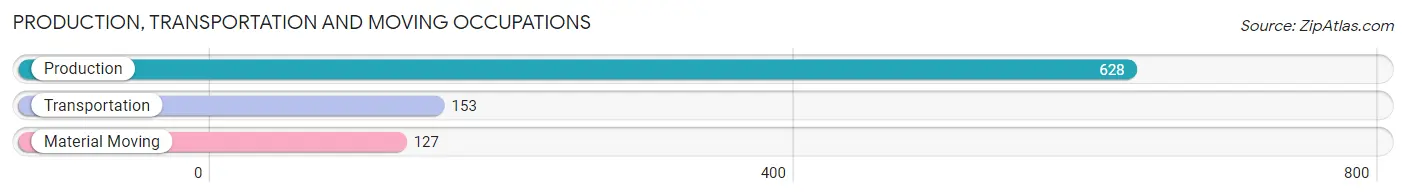
Production, Transportation and Moving Occupations
The most common Production, Transportation and Moving occupations in Otsego are Production (628 | 5.6%), Transportation (153 | 1.4%), and Material Moving (127 | 1.1%).
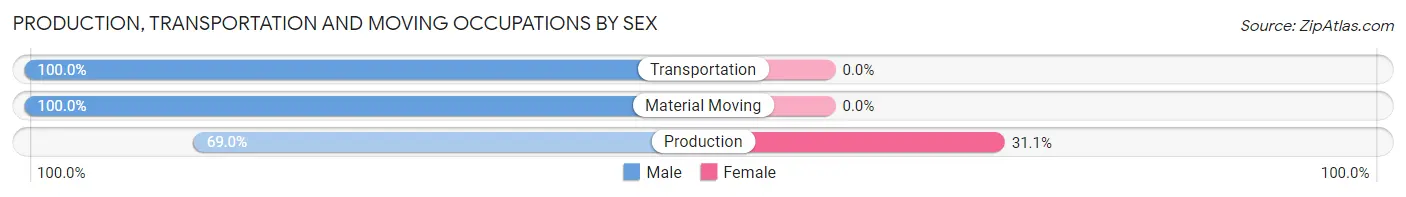
Production, Transportation and Moving Occupations by Sex
| Occupation | Male | Female |
| Production | 433 (69.0%) | 195 (31.0%) |
| Transportation | 153 (100.0%) | 0 (0.0%) |
| Material Moving | 127 (100.0%) | 0 (0.0%) |
| Total (Category) | 713 (78.5%) | 195 (21.5%) |
| Total (Overall) | 6,314 (56.4%) | 4,885 (43.6%) |
Employment Industries by Sex in Otsego
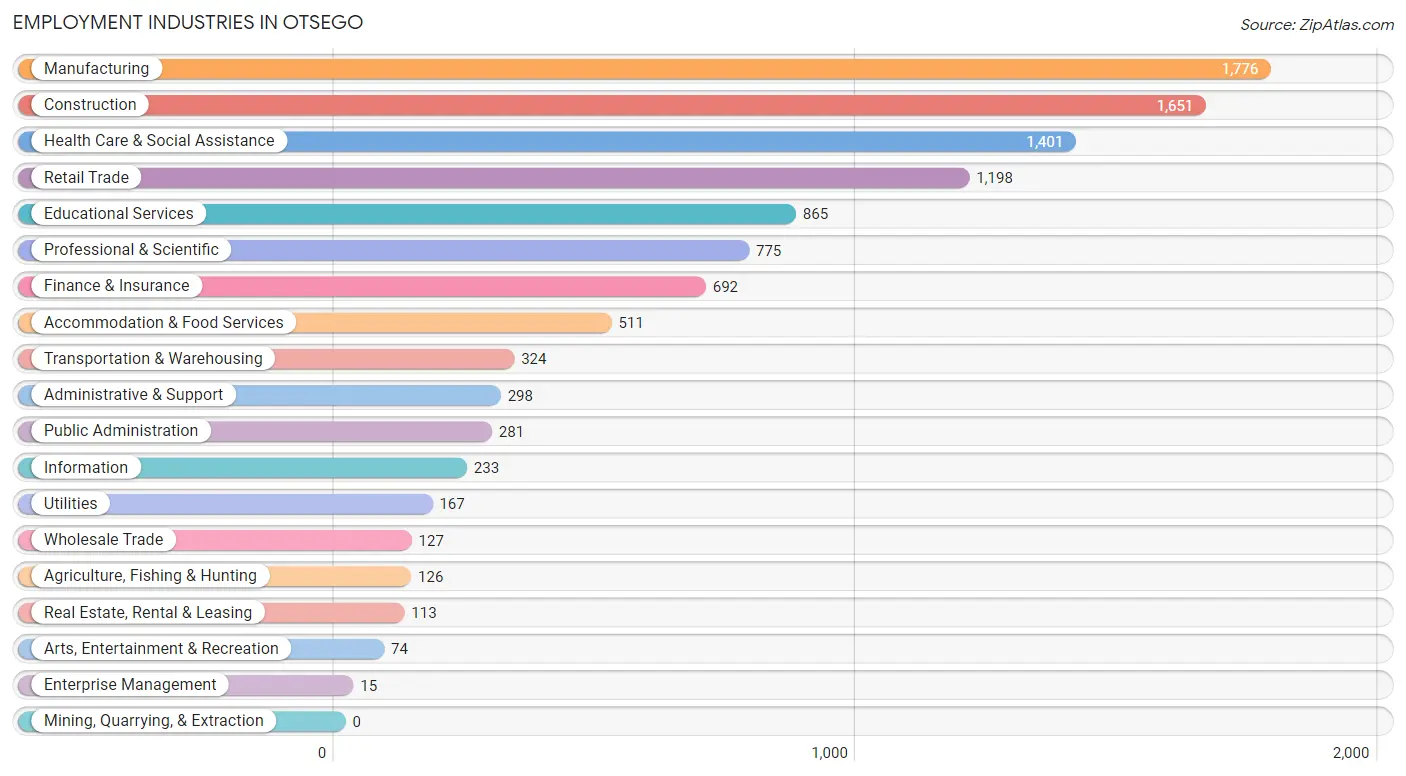
Employment Industries in Otsego
The major employment industries in Otsego include Manufacturing (1,776 | 15.9%), Construction (1,651 | 14.7%), Health Care & Social Assistance (1,401 | 12.5%), Retail Trade (1,198 | 10.7%), and Educational Services (865 | 7.7%).
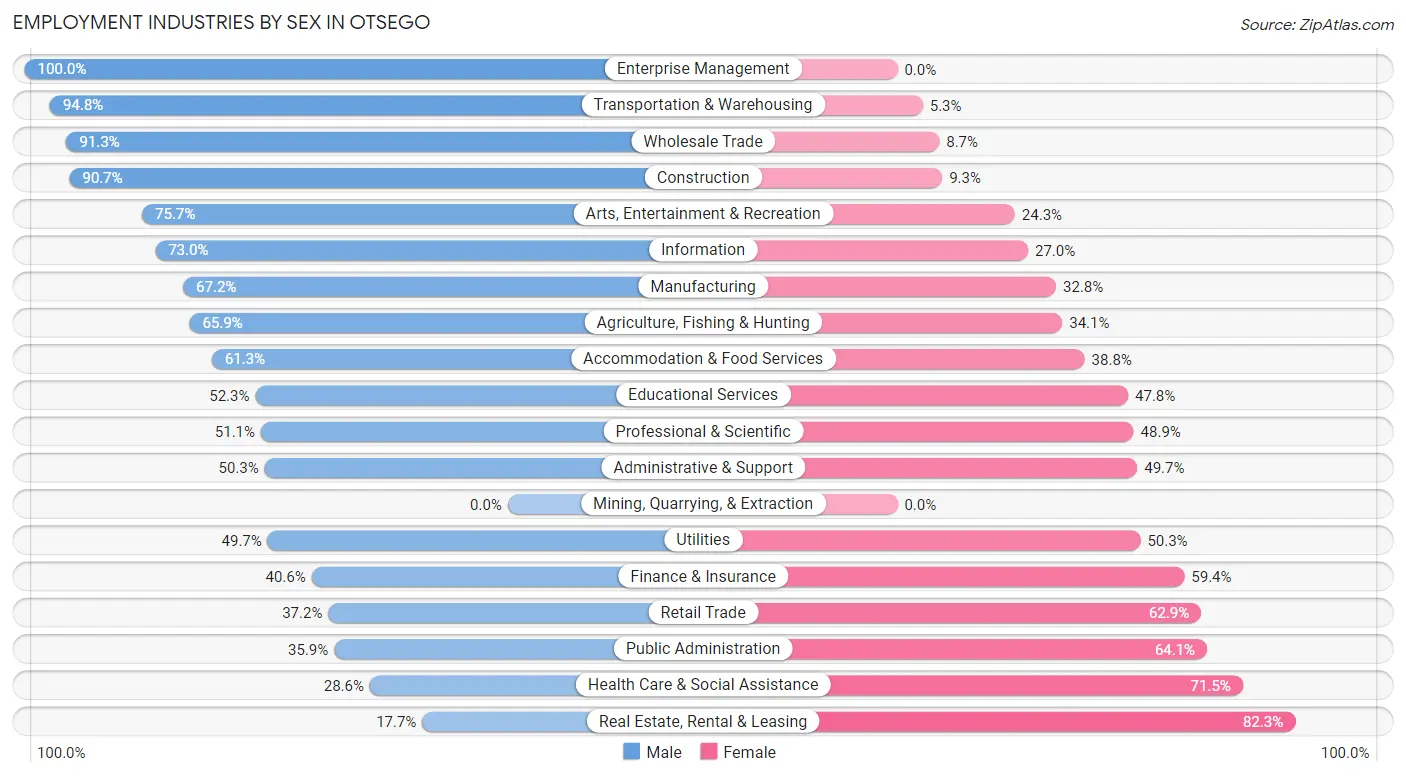
Employment Industries by Sex in Otsego
The Otsego industries that see more men than women are Enterprise Management (100.0%), Transportation & Warehousing (94.8%), and Wholesale Trade (91.3%), whereas the industries that tend to have a higher number of women are Real Estate, Rental & Leasing (82.3%), Health Care & Social Assistance (71.5%), and Public Administration (64.1%).
| Industry | Male | Female |
| Agriculture, Fishing & Hunting | 83 (65.9%) | 43 (34.1%) |
| Mining, Quarrying, & Extraction | 0 (0.0%) | 0 (0.0%) |
| Construction | 1,498 (90.7%) | 153 (9.3%) |
| Manufacturing | 1,193 (67.2%) | 583 (32.8%) |
| Wholesale Trade | 116 (91.3%) | 11 (8.7%) |
| Retail Trade | 445 (37.1%) | 753 (62.8%) |
| Transportation & Warehousing | 307 (94.8%) | 17 (5.2%) |
| Utilities | 83 (49.7%) | 84 (50.3%) |
| Information | 170 (73.0%) | 63 (27.0%) |
| Finance & Insurance | 281 (40.6%) | 411 (59.4%) |
| Real Estate, Rental & Leasing | 20 (17.7%) | 93 (82.3%) |
| Professional & Scientific | 396 (51.1%) | 379 (48.9%) |
| Enterprise Management | 15 (100.0%) | 0 (0.0%) |
| Administrative & Support | 150 (50.3%) | 148 (49.7%) |
| Educational Services | 452 (52.2%) | 413 (47.7%) |
| Health Care & Social Assistance | 400 (28.5%) | 1,001 (71.5%) |
| Arts, Entertainment & Recreation | 56 (75.7%) | 18 (24.3%) |
| Accommodation & Food Services | 313 (61.3%) | 198 (38.8%) |
| Public Administration | 101 (35.9%) | 180 (64.1%) |
| Total | 6,314 (56.4%) | 4,885 (43.6%) |
Education in Otsego
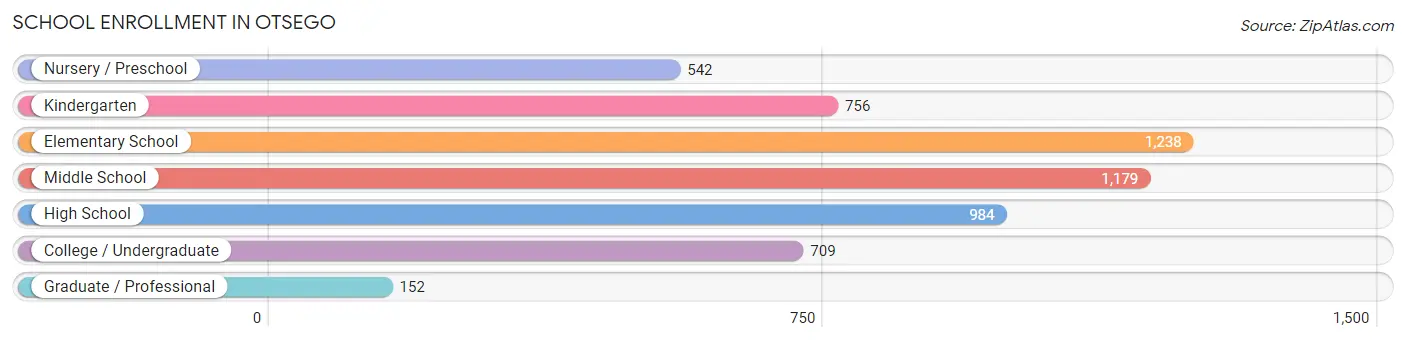
School Enrollment in Otsego
The most common levels of schooling among the 5,560 students in Otsego are elementary school (1,238 | 22.3%), middle school (1,179 | 21.2%), and high school (984 | 17.7%).
| School Level | # Students | % Students |
| Nursery / Preschool | 542 | 9.8% |
| Kindergarten | 756 | 13.6% |
| Elementary School | 1,238 | 22.3% |
| Middle School | 1,179 | 21.2% |
| High School | 984 | 17.7% |
| College / Undergraduate | 709 | 12.8% |
| Graduate / Professional | 152 | 2.7% |
| Total | 5,560 | 100.0% |
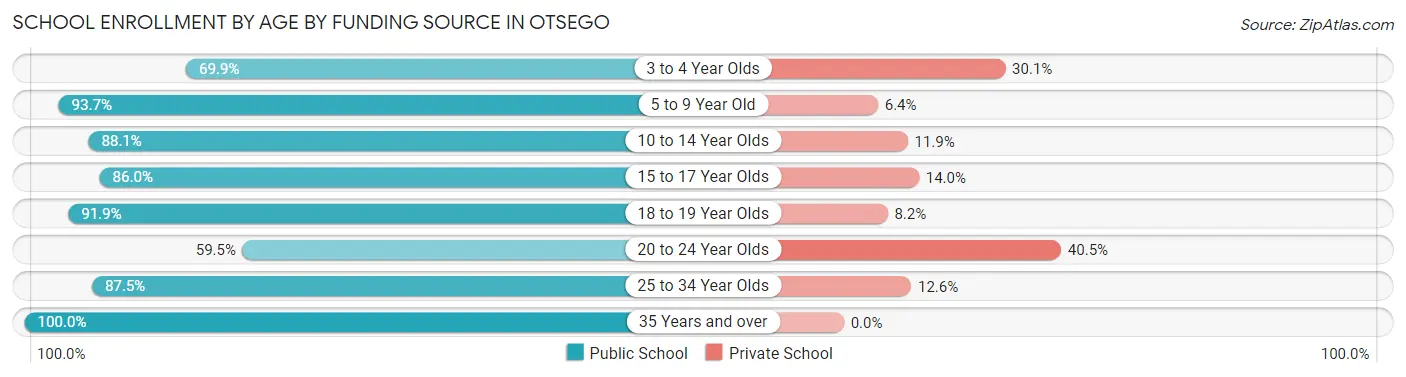
School Enrollment by Age by Funding Source in Otsego
Out of a total of 5,560 students who are enrolled in schools in Otsego, 656 (11.8%) attend a private institution, while the remaining 4,904 (88.2%) are enrolled in public schools. The age group of 20 to 24 year olds has the highest likelihood of being enrolled in private schools, with 70 (40.5% in the age bracket) enrolled. Conversely, the age group of 35 years and over has the lowest likelihood of being enrolled in a private school, with 184 (100.0% in the age bracket) attending a public institution.
| Age Bracket | Public School | Private School |
| 3 to 4 Year Olds | 272 (69.9%) | 117 (30.1%) |
| 5 to 9 Year Old | 1,946 (93.6%) | 132 (6.4%) |
| 10 to 14 Year Olds | 1,192 (88.1%) | 161 (11.9%) |
| 15 to 17 Year Olds | 756 (86.0%) | 123 (14.0%) |
| 18 to 19 Year Olds | 214 (91.8%) | 19 (8.2%) |
| 20 to 24 Year Olds | 103 (59.5%) | 70 (40.5%) |
| 25 to 34 Year Olds | 237 (87.5%) | 34 (12.6%) |
| 35 Years and over | 184 (100.0%) | 0 (0.0%) |
| Total | 4,904 (88.2%) | 656 (11.8%) |
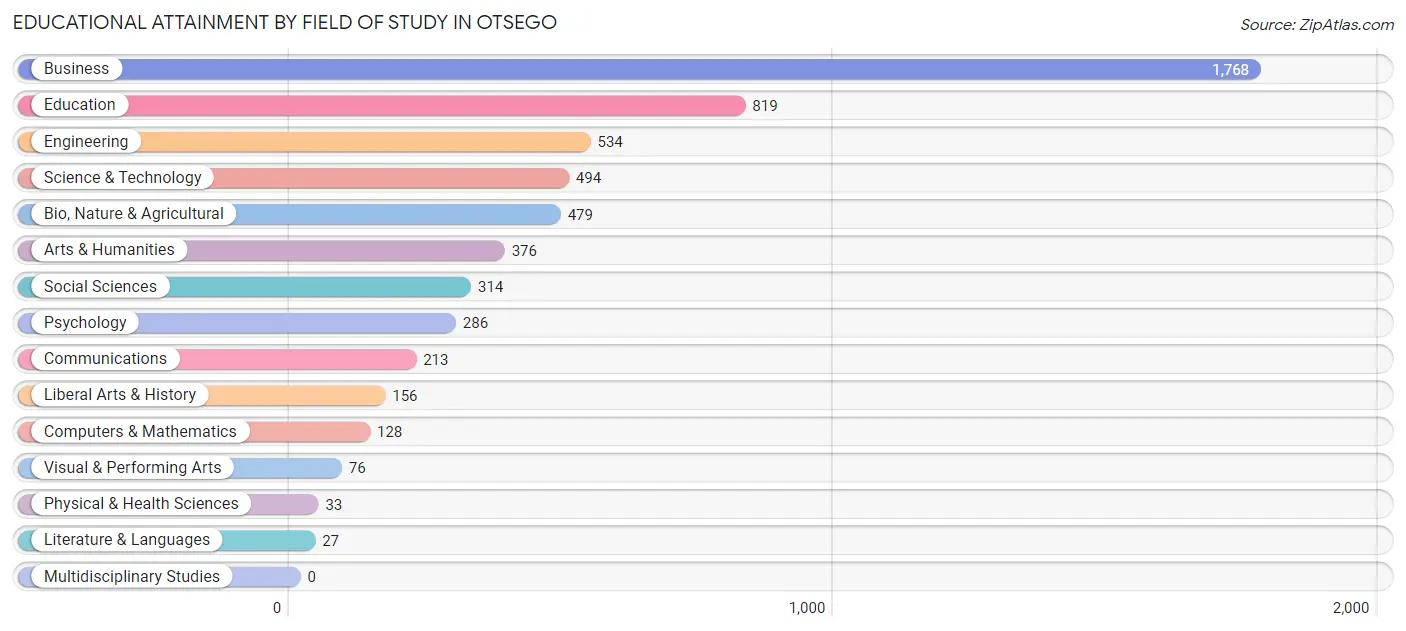
Educational Attainment by Field of Study in Otsego
Business (1,768 | 31.0%), education (819 | 14.4%), engineering (534 | 9.4%), science & technology (494 | 8.7%), and bio, nature & agricultural (479 | 8.4%) are the most common fields of study among 5,703 individuals in Otsego who have obtained a bachelor's degree or higher.
| Field of Study | # Graduates | % Graduates |
| Computers & Mathematics | 128 | 2.2% |
| Bio, Nature & Agricultural | 479 | 8.4% |
| Physical & Health Sciences | 33 | 0.6% |
| Psychology | 286 | 5.0% |
| Social Sciences | 314 | 5.5% |
| Engineering | 534 | 9.4% |
| Multidisciplinary Studies | 0 | 0.0% |
| Science & Technology | 494 | 8.7% |
| Business | 1,768 | 31.0% |
| Education | 819 | 14.4% |
| Literature & Languages | 27 | 0.5% |
| Liberal Arts & History | 156 | 2.7% |
| Visual & Performing Arts | 76 | 1.3% |
| Communications | 213 | 3.7% |
| Arts & Humanities | 376 | 6.6% |
| Total | 5,703 | 100.0% |
Transportation & Commute in Otsego
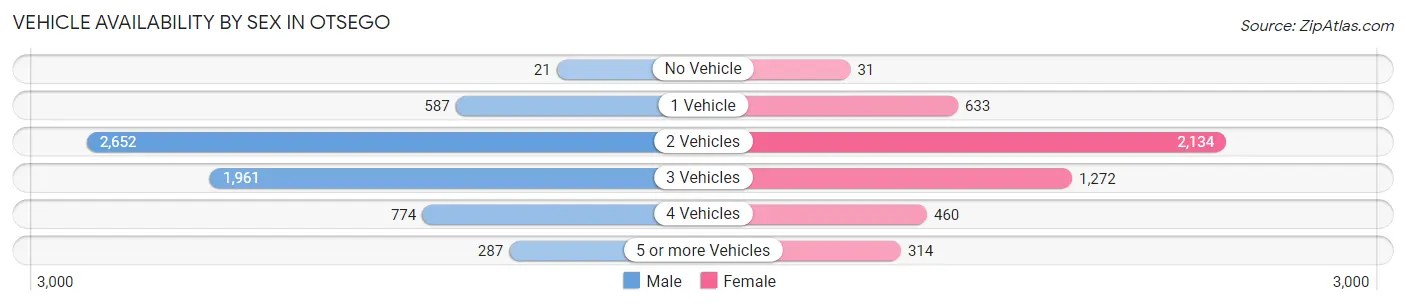
Vehicle Availability by Sex in Otsego
The most prevalent vehicle ownership categories in Otsego are males with 2 vehicles (2,652, accounting for 42.2%) and females with 2 vehicles (2,134, making up 54.7%).
| Vehicles Available | Male | Female |
| No Vehicle | 21 (0.3%) | 31 (0.6%) |
| 1 Vehicle | 587 (9.3%) | 633 (13.1%) |
| 2 Vehicles | 2,652 (42.2%) | 2,134 (44.1%) |
| 3 Vehicles | 1,961 (31.2%) | 1,272 (26.3%) |
| 4 Vehicles | 774 (12.3%) | 460 (9.5%) |
| 5 or more Vehicles | 287 (4.6%) | 314 (6.5%) |
| Total | 6,282 (100.0%) | 4,844 (100.0%) |
Commute Time in Otsego
The most frequently occuring commute durations in Otsego are 30 to 34 minutes (1,747 commuters, 17.5%), 45 to 59 minutes (1,328 commuters, 13.3%), and 40 to 44 minutes (1,249 commuters, 12.5%).
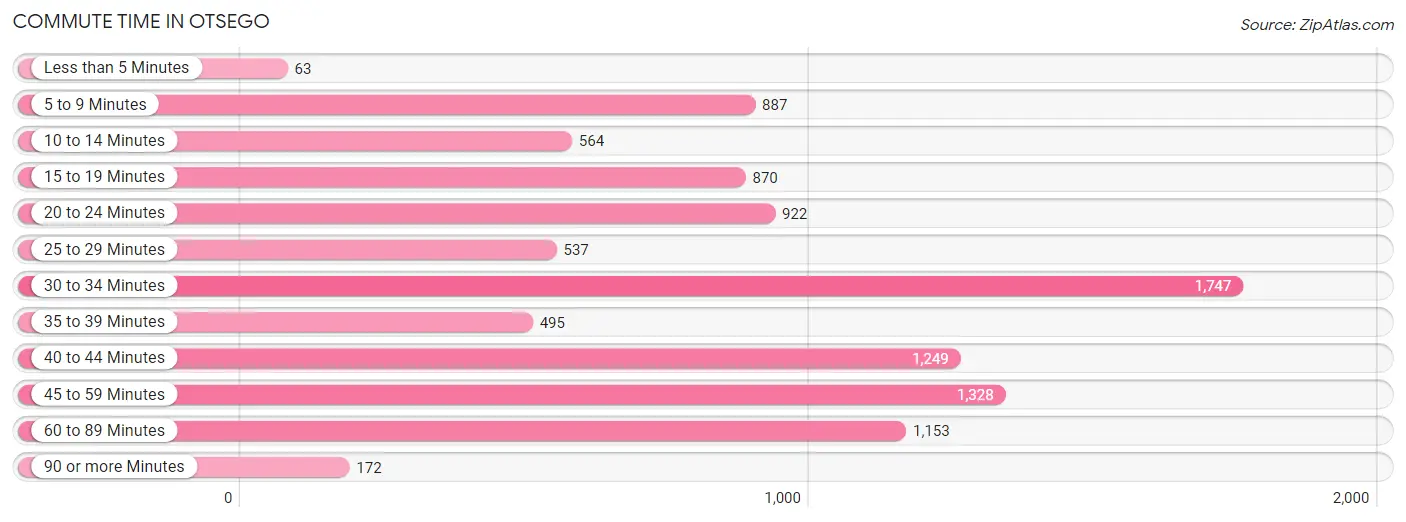
| Commute Time | # Commuters | % Commuters |
| Less than 5 Minutes | 63 | 0.6% |
| 5 to 9 Minutes | 887 | 8.9% |
| 10 to 14 Minutes | 564 | 5.7% |
| 15 to 19 Minutes | 870 | 8.7% |
| 20 to 24 Minutes | 922 | 9.2% |
| 25 to 29 Minutes | 537 | 5.4% |
| 30 to 34 Minutes | 1,747 | 17.5% |
| 35 to 39 Minutes | 495 | 5.0% |
| 40 to 44 Minutes | 1,249 | 12.5% |
| 45 to 59 Minutes | 1,328 | 13.3% |
| 60 to 89 Minutes | 1,153 | 11.6% |
| 90 or more Minutes | 172 | 1.7% |
Commute Time by Sex in Otsego
The most common commute times in Otsego are 30 to 34 minutes (1,083 commuters, 18.9%) for males and 45 to 59 minutes (794 commuters, 18.7%) for females.
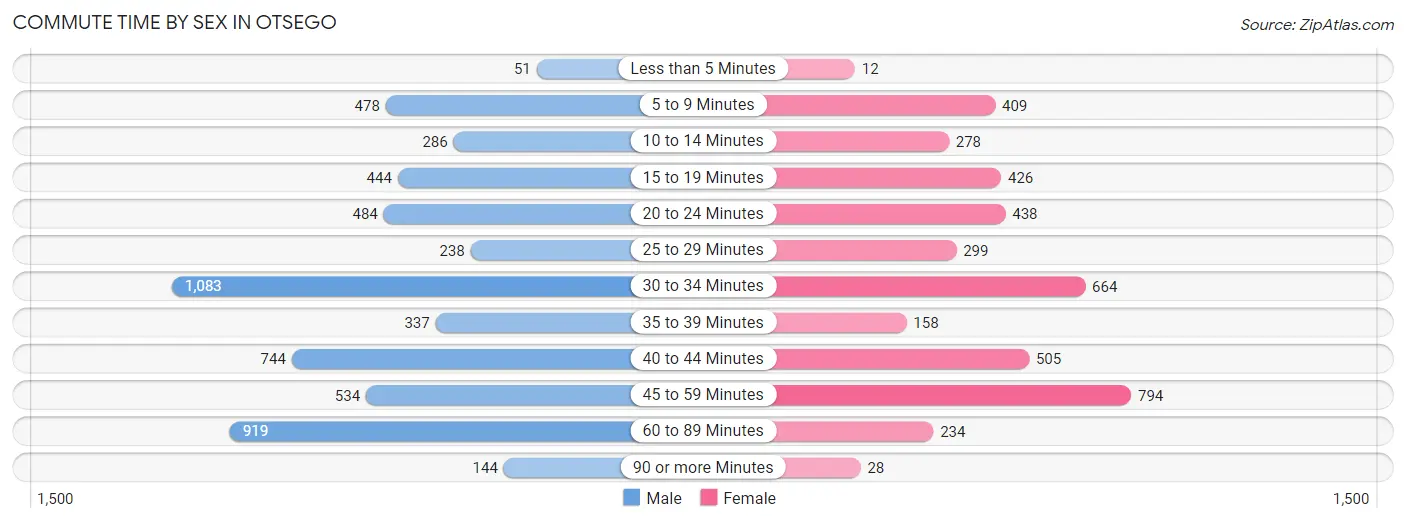
| Commute Time | Male | Female |
| Less than 5 Minutes | 51 (0.9%) | 12 (0.3%) |
| 5 to 9 Minutes | 478 (8.3%) | 409 (9.6%) |
| 10 to 14 Minutes | 286 (5.0%) | 278 (6.6%) |
| 15 to 19 Minutes | 444 (7.7%) | 426 (10.0%) |
| 20 to 24 Minutes | 484 (8.4%) | 438 (10.3%) |
| 25 to 29 Minutes | 238 (4.1%) | 299 (7.0%) |
| 30 to 34 Minutes | 1,083 (18.9%) | 664 (15.6%) |
| 35 to 39 Minutes | 337 (5.9%) | 158 (3.7%) |
| 40 to 44 Minutes | 744 (13.0%) | 505 (11.9%) |
| 45 to 59 Minutes | 534 (9.3%) | 794 (18.7%) |
| 60 to 89 Minutes | 919 (16.0%) | 234 (5.5%) |
| 90 or more Minutes | 144 (2.5%) | 28 (0.7%) |
Time of Departure to Work by Sex in Otsego
The most frequent times of departure to work in Otsego are 7:00 AM to 7:29 AM (1,192, 20.8%) for males and 7:00 AM to 7:29 AM (1,023, 24.1%) for females.
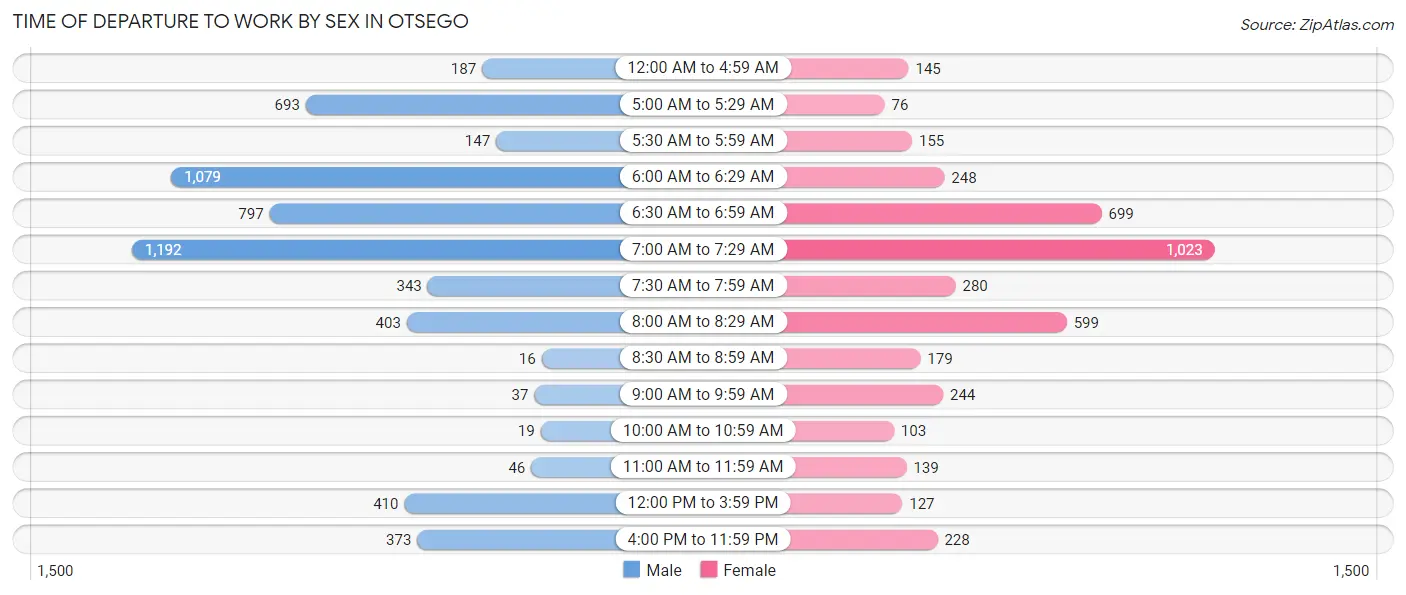
| Time of Departure | Male | Female |
| 12:00 AM to 4:59 AM | 187 (3.3%) | 145 (3.4%) |
| 5:00 AM to 5:29 AM | 693 (12.1%) | 76 (1.8%) |
| 5:30 AM to 5:59 AM | 147 (2.6%) | 155 (3.6%) |
| 6:00 AM to 6:29 AM | 1,079 (18.8%) | 248 (5.8%) |
| 6:30 AM to 6:59 AM | 797 (13.9%) | 699 (16.5%) |
| 7:00 AM to 7:29 AM | 1,192 (20.8%) | 1,023 (24.1%) |
| 7:30 AM to 7:59 AM | 343 (6.0%) | 280 (6.6%) |
| 8:00 AM to 8:29 AM | 403 (7.0%) | 599 (14.1%) |
| 8:30 AM to 8:59 AM | 16 (0.3%) | 179 (4.2%) |
| 9:00 AM to 9:59 AM | 37 (0.6%) | 244 (5.8%) |
| 10:00 AM to 10:59 AM | 19 (0.3%) | 103 (2.4%) |
| 11:00 AM to 11:59 AM | 46 (0.8%) | 139 (3.3%) |
| 12:00 PM to 3:59 PM | 410 (7.1%) | 127 (3.0%) |
| 4:00 PM to 11:59 PM | 373 (6.5%) | 228 (5.4%) |
| Total | 5,742 (100.0%) | 4,245 (100.0%) |
Housing Occupancy in Otsego
Occupancy by Ownership in Otsego
Of the total 6,759 dwellings in Otsego, owner-occupied units account for 6,027 (89.2%), while renter-occupied units make up 732 (10.8%).
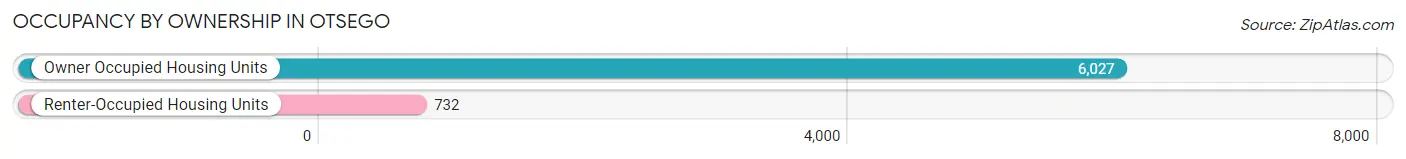
| Occupancy | # Housing Units | % Housing Units |
| Owner Occupied Housing Units | 6,027 | 89.2% |
| Renter-Occupied Housing Units | 732 | 10.8% |
| Total Occupied Housing Units | 6,759 | 100.0% |
Occupancy by Household Size in Otsego
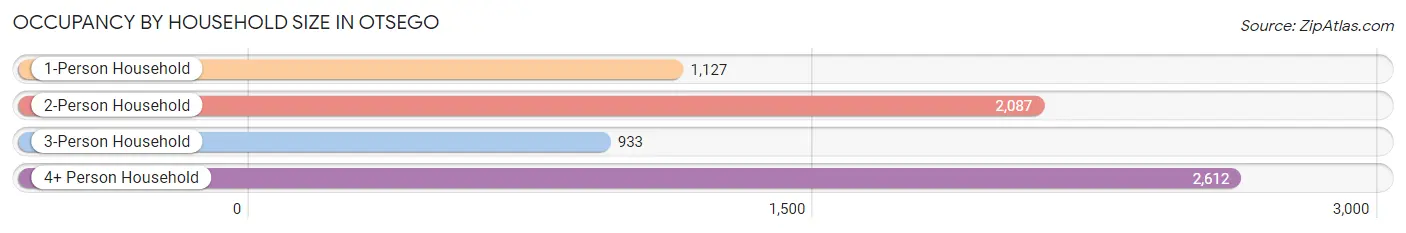
| Household Size | # Housing Units | % Housing Units |
| 1-Person Household | 1,127 | 16.7% |
| 2-Person Household | 2,087 | 30.9% |
| 3-Person Household | 933 | 13.8% |
| 4+ Person Household | 2,612 | 38.6% |
| Total Housing Units | 6,759 | 100.0% |
Occupancy by Ownership by Household Size in Otsego
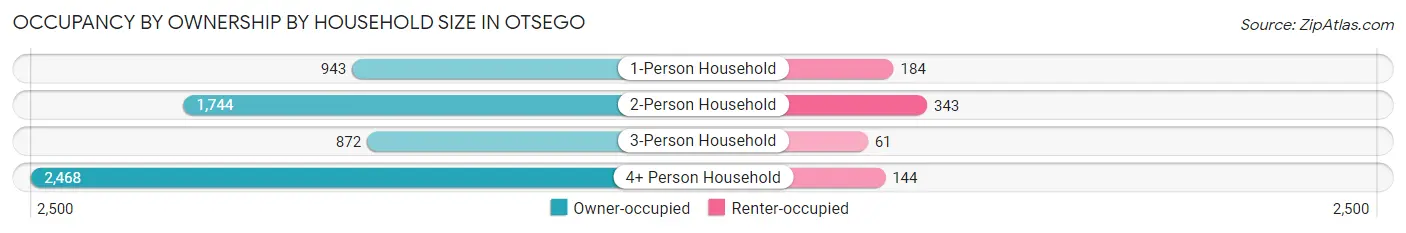
| Household Size | Owner-occupied | Renter-occupied |
| 1-Person Household | 943 (83.7%) | 184 (16.3%) |
| 2-Person Household | 1,744 (83.6%) | 343 (16.4%) |
| 3-Person Household | 872 (93.5%) | 61 (6.5%) |
| 4+ Person Household | 2,468 (94.5%) | 144 (5.5%) |
| Total Housing Units | 6,027 (89.2%) | 732 (10.8%) |
Occupancy by Educational Attainment in Otsego
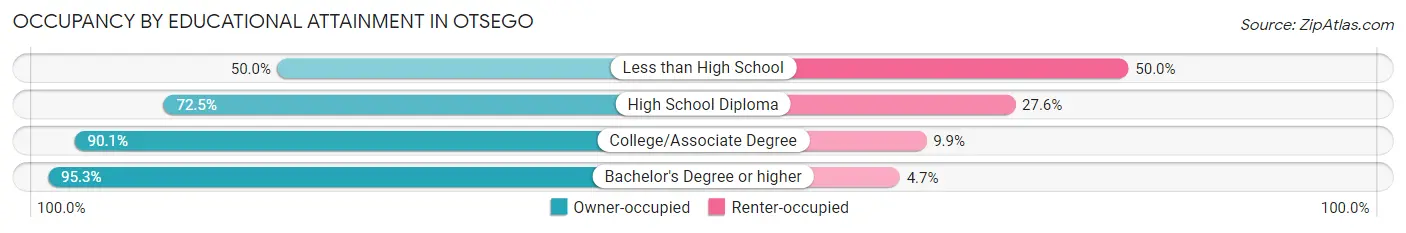
| Household Size | Owner-occupied | Renter-occupied |
| Less than High School | 17 (50.0%) | 17 (50.0%) |
| High School Diploma | 923 (72.5%) | 351 (27.6%) |
| College/Associate Degree | 1,879 (90.1%) | 207 (9.9%) |
| Bachelor's Degree or higher | 3,208 (95.3%) | 157 (4.7%) |
Occupancy by Age of Householder in Otsego
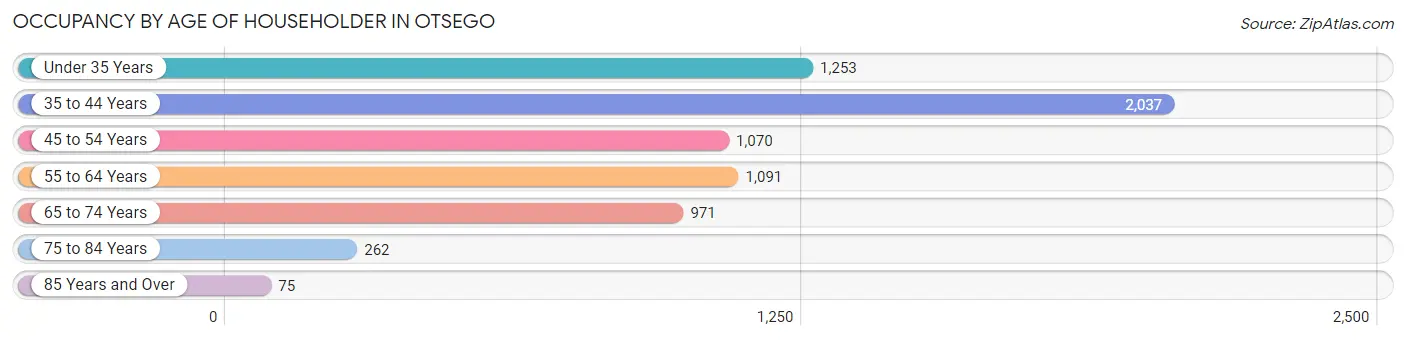
| Age Bracket | # Households | % Households |
| Under 35 Years | 1,253 | 18.5% |
| 35 to 44 Years | 2,037 | 30.1% |
| 45 to 54 Years | 1,070 | 15.8% |
| 55 to 64 Years | 1,091 | 16.1% |
| 65 to 74 Years | 971 | 14.4% |
| 75 to 84 Years | 262 | 3.9% |
| 85 Years and Over | 75 | 1.1% |
| Total | 6,759 | 100.0% |
Housing Finances in Otsego
Median Income by Occupancy in Otsego
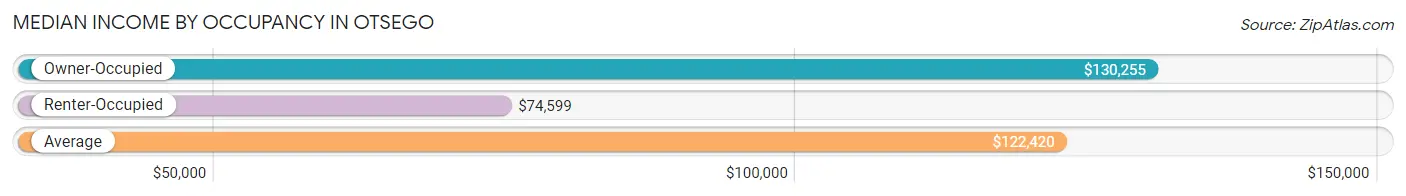
| Occupancy Type | # Households | Median Income |
| Owner-Occupied | 6,027 (89.2%) | $130,255 |
| Renter-Occupied | 732 (10.8%) | $74,599 |
| Average | 6,759 (100.0%) | $122,420 |
Occupancy by Householder Income Bracket in Otsego
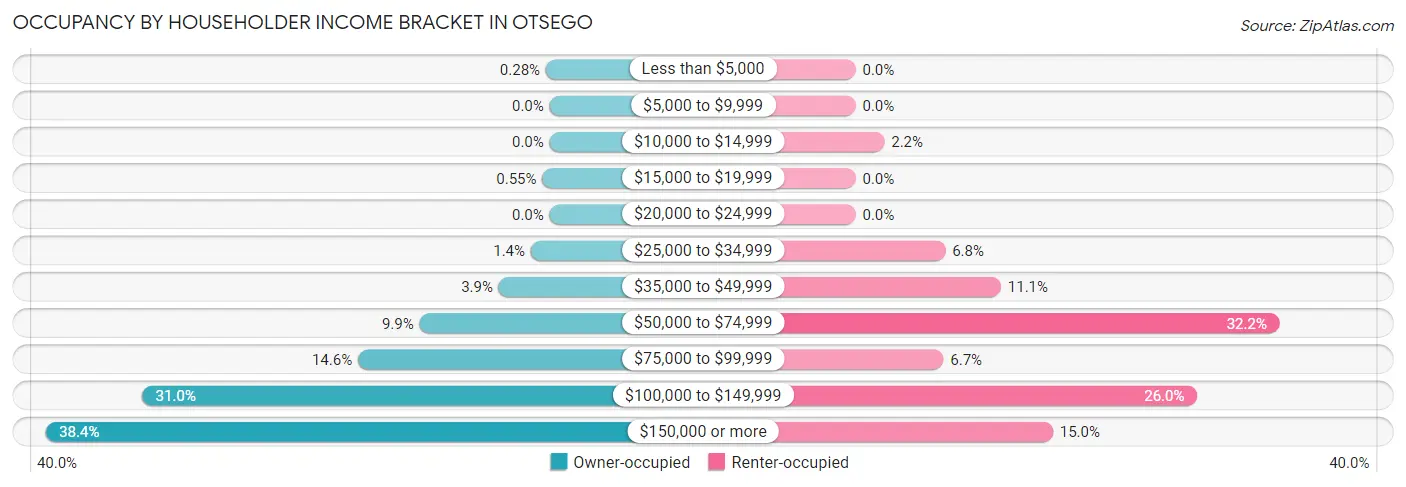
| Income Bracket | Owner-occupied | Renter-occupied |
| Less than $5,000 | 17 (0.3%) | 0 (0.0%) |
| $5,000 to $9,999 | 0 (0.0%) | 0 (0.0%) |
| $10,000 to $14,999 | 0 (0.0%) | 16 (2.2%) |
| $15,000 to $19,999 | 33 (0.5%) | 0 (0.0%) |
| $20,000 to $24,999 | 0 (0.0%) | 0 (0.0%) |
| $25,000 to $34,999 | 86 (1.4%) | 50 (6.8%) |
| $35,000 to $49,999 | 233 (3.9%) | 81 (11.1%) |
| $50,000 to $74,999 | 597 (9.9%) | 236 (32.2%) |
| $75,000 to $99,999 | 880 (14.6%) | 49 (6.7%) |
| $100,000 to $149,999 | 1,869 (31.0%) | 190 (26.0%) |
| $150,000 or more | 2,312 (38.4%) | 110 (15.0%) |
| Total | 6,027 (100.0%) | 732 (100.0%) |
Monthly Housing Cost Tiers in Otsego
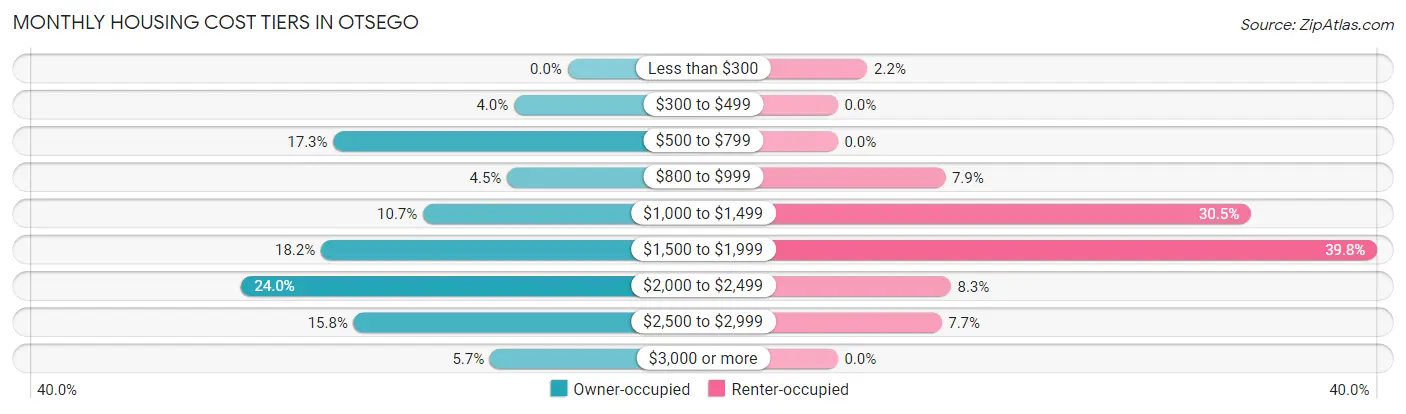
| Monthly Cost | Owner-occupied | Renter-occupied |
| Less than $300 | 0 (0.0%) | 16 (2.2%) |
| $300 to $499 | 238 (4.0%) | 0 (0.0%) |
| $500 to $799 | 1,040 (17.3%) | 0 (0.0%) |
| $800 to $999 | 269 (4.5%) | 58 (7.9%) |
| $1,000 to $1,499 | 642 (10.6%) | 223 (30.5%) |
| $1,500 to $1,999 | 1,095 (18.2%) | 291 (39.8%) |
| $2,000 to $2,499 | 1,448 (24.0%) | 61 (8.3%) |
| $2,500 to $2,999 | 950 (15.8%) | 56 (7.6%) |
| $3,000 or more | 345 (5.7%) | 0 (0.0%) |
| Total | 6,027 (100.0%) | 732 (100.0%) |
Physical Housing Characteristics in Otsego
Housing Structures in Otsego
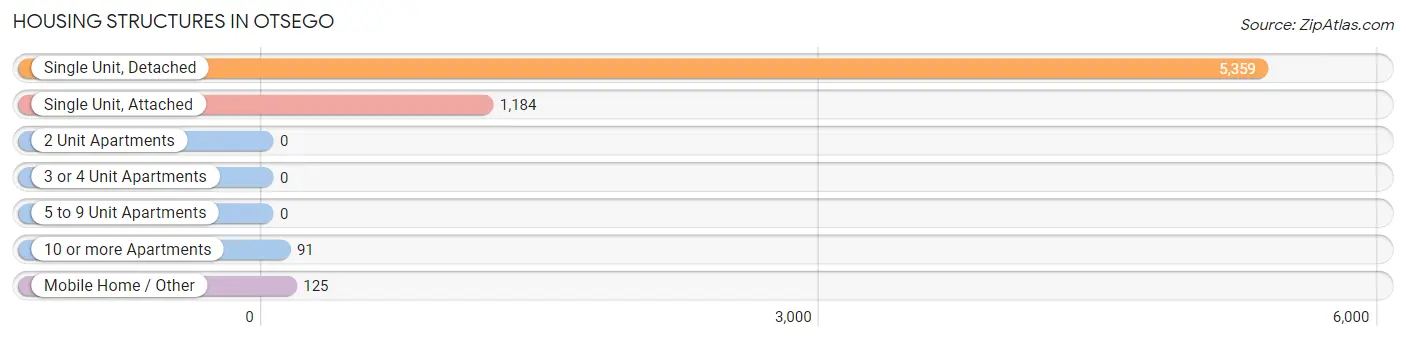
| Structure Type | # Housing Units | % Housing Units |
| Single Unit, Detached | 5,359 | 79.3% |
| Single Unit, Attached | 1,184 | 17.5% |
| 2 Unit Apartments | 0 | 0.0% |
| 3 or 4 Unit Apartments | 0 | 0.0% |
| 5 to 9 Unit Apartments | 0 | 0.0% |
| 10 or more Apartments | 91 | 1.3% |
| Mobile Home / Other | 125 | 1.8% |
| Total | 6,759 | 100.0% |
Housing Structures by Occupancy in Otsego
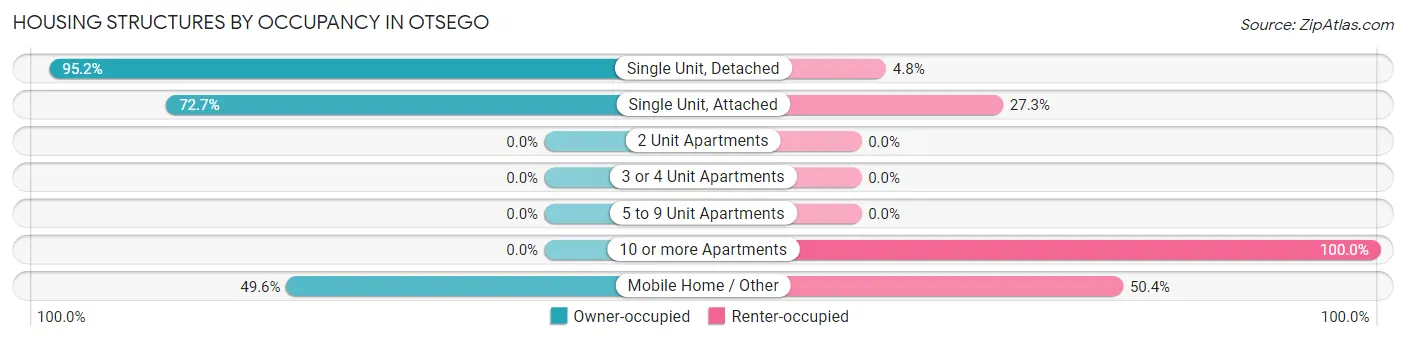
| Structure Type | Owner-occupied | Renter-occupied |
| Single Unit, Detached | 5,104 (95.2%) | 255 (4.8%) |
| Single Unit, Attached | 861 (72.7%) | 323 (27.3%) |
| 2 Unit Apartments | 0 (0.0%) | 0 (0.0%) |
| 3 or 4 Unit Apartments | 0 (0.0%) | 0 (0.0%) |
| 5 to 9 Unit Apartments | 0 (0.0%) | 0 (0.0%) |
| 10 or more Apartments | 0 (0.0%) | 91 (100.0%) |
| Mobile Home / Other | 62 (49.6%) | 63 (50.4%) |
| Total | 6,027 (89.2%) | 732 (10.8%) |
Housing Structures by Number of Rooms in Otsego
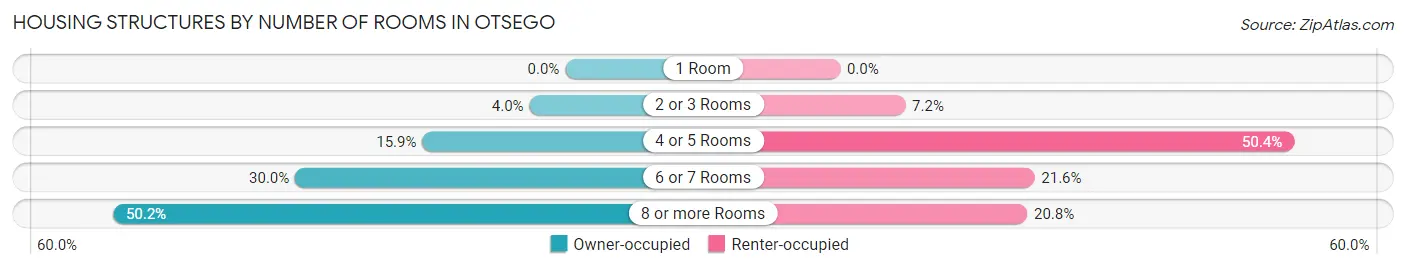
| Number of Rooms | Owner-occupied | Renter-occupied |
| 1 Room | 0 (0.0%) | 0 (0.0%) |
| 2 or 3 Rooms | 239 (4.0%) | 53 (7.2%) |
| 4 or 5 Rooms | 956 (15.9%) | 369 (50.4%) |
| 6 or 7 Rooms | 1,807 (30.0%) | 158 (21.6%) |
| 8 or more Rooms | 3,025 (50.2%) | 152 (20.8%) |
| Total | 6,027 (100.0%) | 732 (100.0%) |
Housing Structure by Heating Type in Otsego
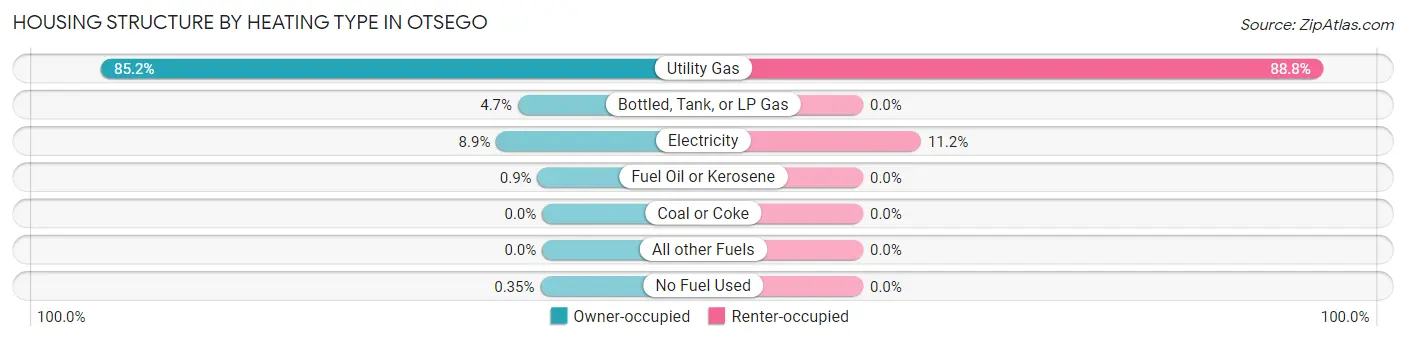
| Heating Type | Owner-occupied | Renter-occupied |
| Utility Gas | 5,136 (85.2%) | 650 (88.8%) |
| Bottled, Tank, or LP Gas | 282 (4.7%) | 0 (0.0%) |
| Electricity | 534 (8.9%) | 82 (11.2%) |
| Fuel Oil or Kerosene | 54 (0.9%) | 0 (0.0%) |
| Coal or Coke | 0 (0.0%) | 0 (0.0%) |
| All other Fuels | 0 (0.0%) | 0 (0.0%) |
| No Fuel Used | 21 (0.4%) | 0 (0.0%) |
| Total | 6,027 (100.0%) | 732 (100.0%) |
Household Vehicle Usage in Otsego
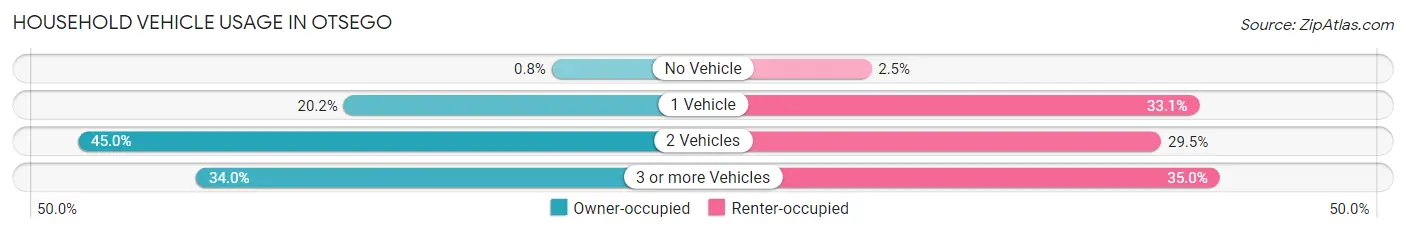
| Vehicles per Household | Owner-occupied | Renter-occupied |
| No Vehicle | 48 (0.8%) | 18 (2.5%) |
| 1 Vehicle | 1,219 (20.2%) | 242 (33.1%) |
| 2 Vehicles | 2,712 (45.0%) | 216 (29.5%) |
| 3 or more Vehicles | 2,048 (34.0%) | 256 (35.0%) |
| Total | 6,027 (100.0%) | 732 (100.0%) |
Real Estate & Mortgages in Otsego
Real Estate and Mortgage Overview in Otsego
| Characteristic | Without Mortgage | With Mortgage |
| Housing Units | 1,404 | 4,623 |
| Median Property Value | $306,700 | $359,300 |
| Median Household Income | $105,642 | $1,997 |
| Monthly Housing Costs | $678 | $320 |
| Real Estate Taxes | $3,431 | $22 |
Property Value by Mortgage Status in Otsego
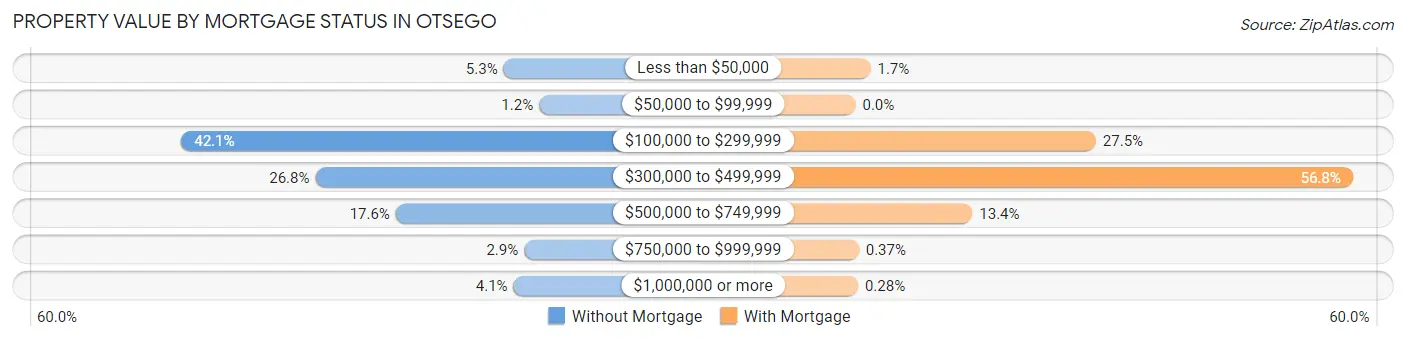
| Property Value | Without Mortgage | With Mortgage |
| Less than $50,000 | 74 (5.3%) | 79 (1.7%) |
| $50,000 to $99,999 | 17 (1.2%) | 0 (0.0%) |
| $100,000 to $299,999 | 591 (42.1%) | 1,270 (27.5%) |
| $300,000 to $499,999 | 376 (26.8%) | 2,627 (56.8%) |
| $500,000 to $749,999 | 247 (17.6%) | 617 (13.4%) |
| $750,000 to $999,999 | 41 (2.9%) | 17 (0.4%) |
| $1,000,000 or more | 58 (4.1%) | 13 (0.3%) |
| Total | 1,404 (100.0%) | 4,623 (100.0%) |
Household Income by Mortgage Status in Otsego
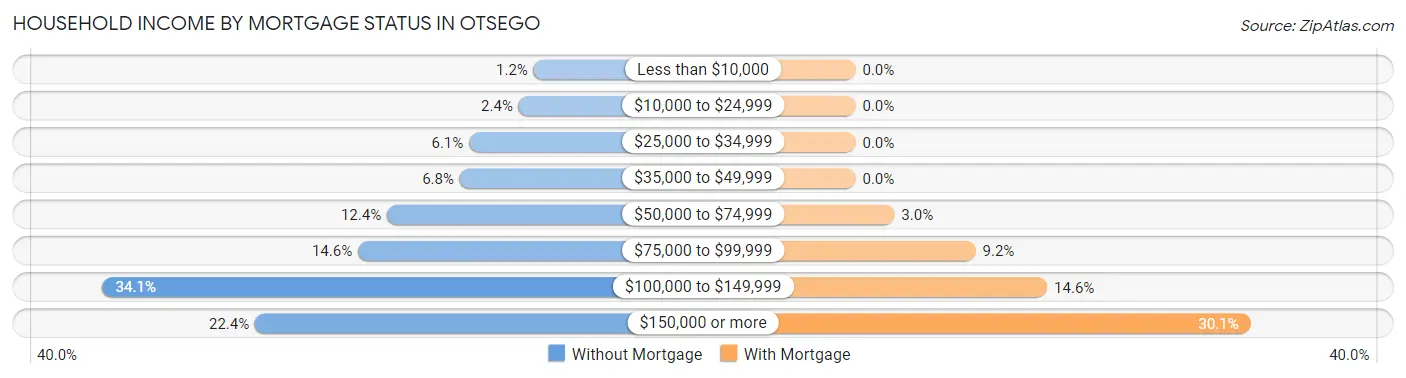
| Household Income | Without Mortgage | With Mortgage |
| Less than $10,000 | 17 (1.2%) | 0 (0.0%) |
| $10,000 to $24,999 | 33 (2.4%) | 0 (0.0%) |
| $25,000 to $34,999 | 86 (6.1%) | 0 (0.0%) |
| $35,000 to $49,999 | 96 (6.8%) | 0 (0.0%) |
| $50,000 to $74,999 | 174 (12.4%) | 137 (3.0%) |
| $75,000 to $99,999 | 205 (14.6%) | 423 (9.1%) |
| $100,000 to $149,999 | 478 (34.1%) | 675 (14.6%) |
| $150,000 or more | 315 (22.4%) | 1,391 (30.1%) |
| Total | 1,404 (100.0%) | 4,623 (100.0%) |
Property Value to Household Income Ratio in Otsego
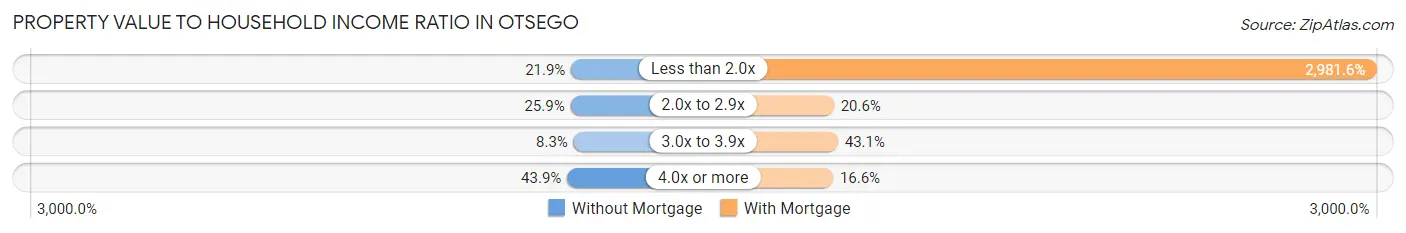
| Value-to-Income Ratio | Without Mortgage | With Mortgage |
| Less than 2.0x | 308 (21.9%) | 137,841 (2,981.6%) |
| 2.0x to 2.9x | 364 (25.9%) | 954 (20.6%) |
| 3.0x to 3.9x | 116 (8.3%) | 1,992 (43.1%) |
| 4.0x or more | 616 (43.9%) | 766 (16.6%) |
| Total | 1,404 (100.0%) | 4,623 (100.0%) |
Real Estate Taxes by Mortgage Status in Otsego
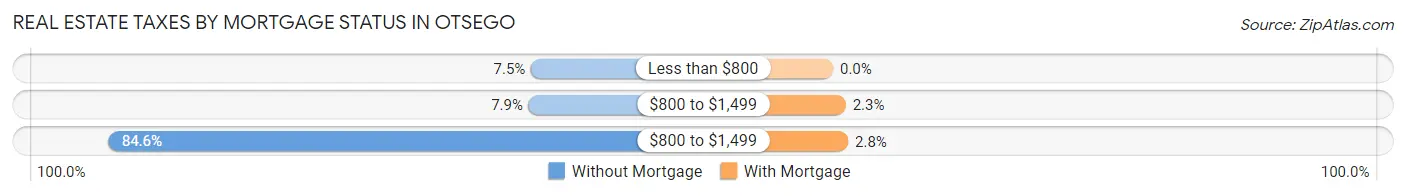
| Property Taxes | Without Mortgage | With Mortgage |
| Less than $800 | 105 (7.5%) | 0 (0.0%) |
| $800 to $1,499 | 111 (7.9%) | 107 (2.3%) |
| $800 to $1,499 | 1,188 (84.6%) | 127 (2.8%) |
| Total | 1,404 (100.0%) | 4,623 (100.0%) |
Health & Disability in Otsego
Health Insurance Coverage by Age in Otsego
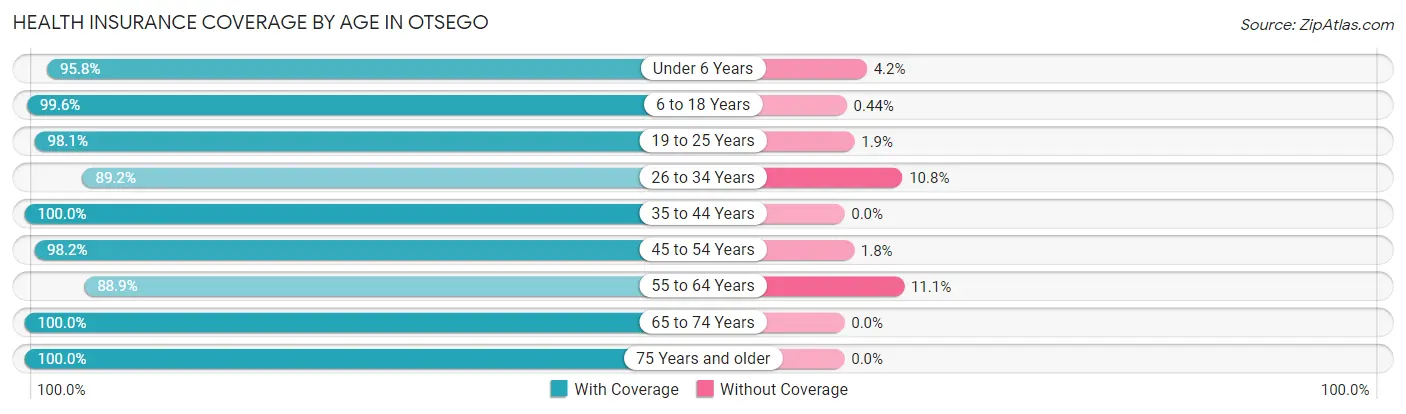
| Age Bracket | With Coverage | Without Coverage |
| Under 6 Years | 2,084 (95.8%) | 91 (4.2%) |
| 6 to 18 Years | 4,072 (99.6%) | 18 (0.4%) |
| 19 to 25 Years | 1,213 (98.1%) | 23 (1.9%) |
| 26 to 34 Years | 2,526 (89.2%) | 306 (10.8%) |
| 35 to 44 Years | 3,528 (100.0%) | 0 (0.0%) |
| 45 to 54 Years | 2,260 (98.2%) | 41 (1.8%) |
| 55 to 64 Years | 1,981 (88.9%) | 248 (11.1%) |
| 65 to 74 Years | 1,321 (100.0%) | 0 (0.0%) |
| 75 Years and older | 725 (100.0%) | 0 (0.0%) |
| Total | 19,710 (96.4%) | 727 (3.6%) |
Health Insurance Coverage by Citizenship Status in Otsego
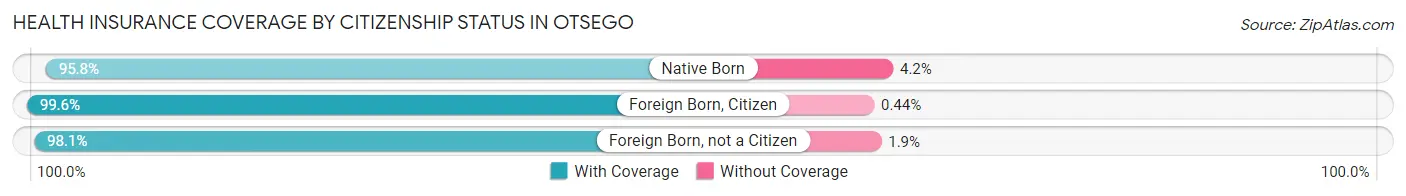
| Citizenship Status | With Coverage | Without Coverage |
| Native Born | 2,084 (95.8%) | 91 (4.2%) |
| Foreign Born, Citizen | 4,072 (99.6%) | 18 (0.4%) |
| Foreign Born, not a Citizen | 1,213 (98.1%) | 23 (1.9%) |
Health Insurance Coverage by Household Income in Otsego
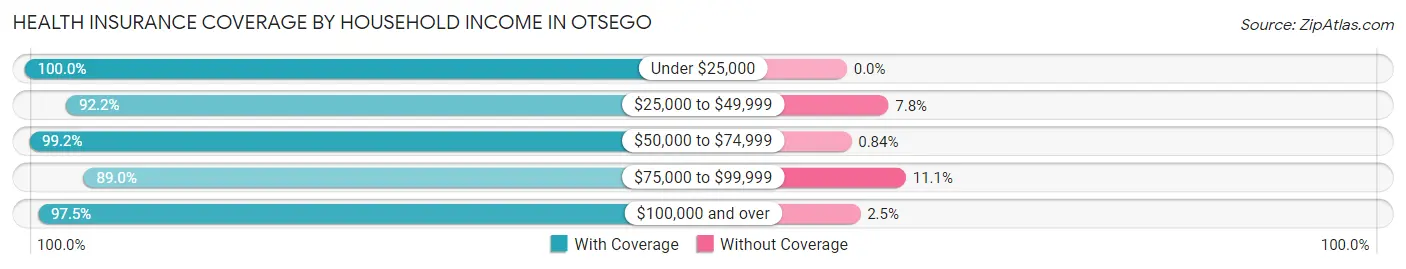
| Household Income | With Coverage | Without Coverage |
| Under $25,000 | 66 (100.0%) | 0 (0.0%) |
| $25,000 to $49,999 | 592 (92.2%) | 50 (7.8%) |
| $50,000 to $74,999 | 1,660 (99.2%) | 14 (0.8%) |
| $75,000 to $99,999 | 2,197 (88.9%) | 273 (11.1%) |
| $100,000 and over | 15,174 (97.5%) | 390 (2.5%) |
Public vs Private Health Insurance Coverage by Age in Otsego
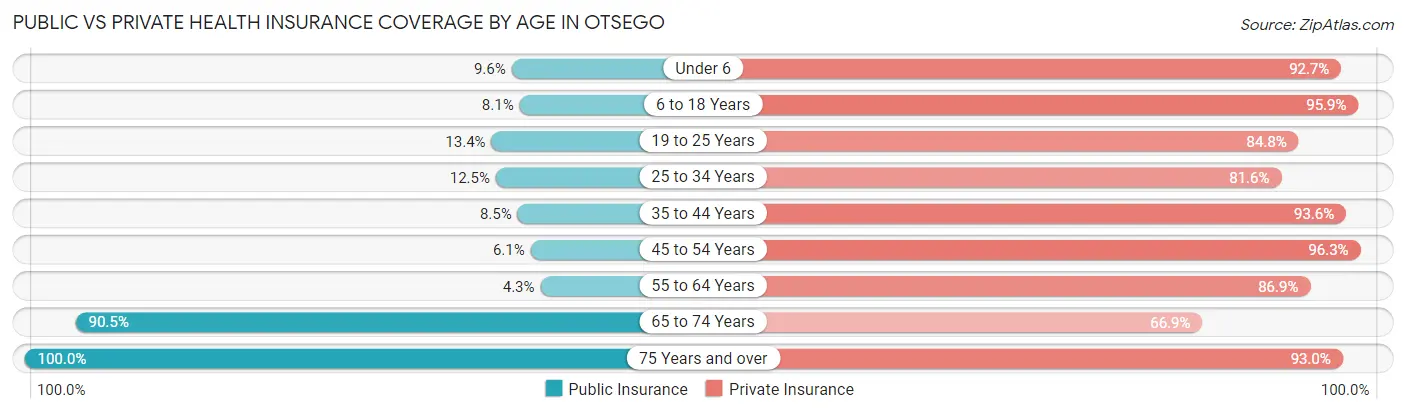
| Age Bracket | Public Insurance | Private Insurance |
| Under 6 | 209 (9.6%) | 2,016 (92.7%) |
| 6 to 18 Years | 333 (8.1%) | 3,921 (95.9%) |
| 19 to 25 Years | 165 (13.4%) | 1,048 (84.8%) |
| 25 to 34 Years | 355 (12.5%) | 2,310 (81.6%) |
| 35 to 44 Years | 300 (8.5%) | 3,302 (93.6%) |
| 45 to 54 Years | 140 (6.1%) | 2,215 (96.3%) |
| 55 to 64 Years | 95 (4.3%) | 1,938 (86.9%) |
| 65 to 74 Years | 1,196 (90.5%) | 884 (66.9%) |
| 75 Years and over | 725 (100.0%) | 674 (93.0%) |
| Total | 3,518 (17.2%) | 18,308 (89.6%) |
Disability Status by Sex by Age in Otsego
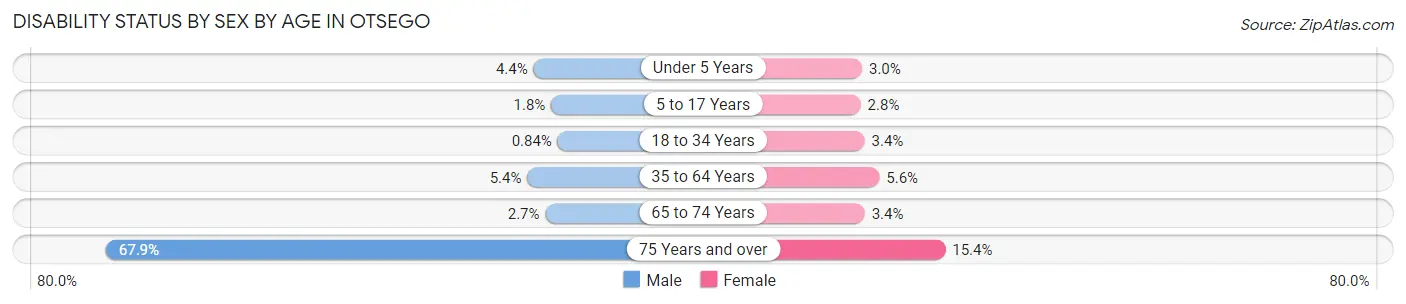
| Age Bracket | Male | Female |
| Under 5 Years | 42 (4.4%) | 22 (3.0%) |
| 5 to 17 Years | 34 (1.8%) | 72 (2.8%) |
| 18 to 34 Years | 21 (0.8%) | 58 (3.4%) |
| 35 to 64 Years | 222 (5.3%) | 218 (5.6%) |
| 65 to 74 Years | 18 (2.7%) | 22 (3.4%) |
| 75 Years and over | 161 (67.9%) | 75 (15.4%) |
Disability Class by Sex by Age in Otsego
Disability Class: Hearing Difficulty
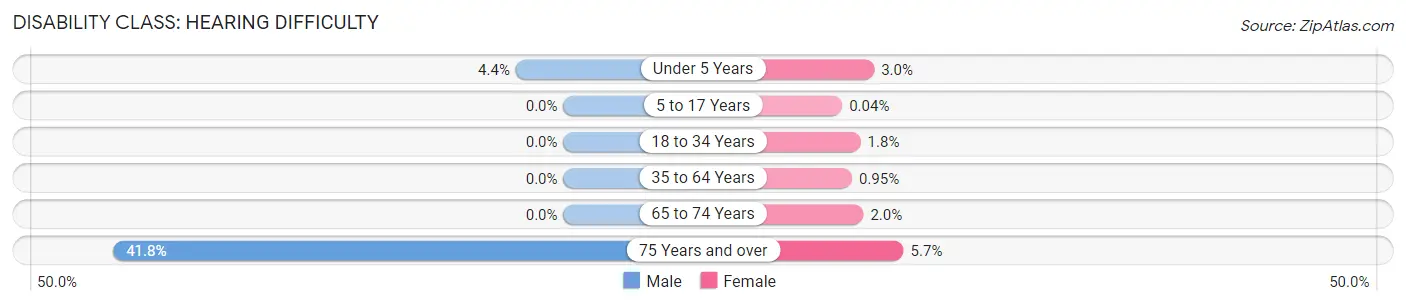
| Age Bracket | Male | Female |
| Under 5 Years | 42 (4.4%) | 22 (3.0%) |
| 5 to 17 Years | 0 (0.0%) | 1 (0.0%) |
| 18 to 34 Years | 0 (0.0%) | 30 (1.8%) |
| 35 to 64 Years | 0 (0.0%) | 37 (0.9%) |
| 65 to 74 Years | 0 (0.0%) | 13 (2.0%) |
| 75 Years and over | 99 (41.8%) | 28 (5.7%) |
Disability Class: Vision Difficulty
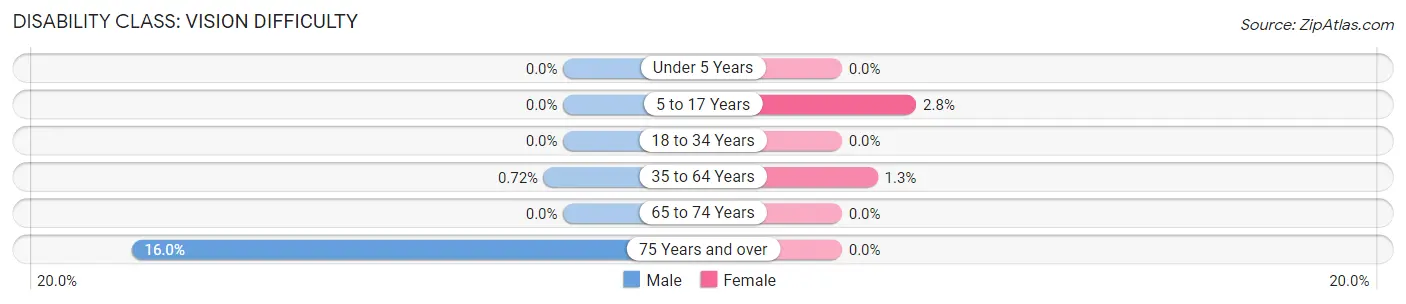
| Age Bracket | Male | Female |
| Under 5 Years | 0 (0.0%) | 0 (0.0%) |
| 5 to 17 Years | 0 (0.0%) | 71 (2.8%) |
| 18 to 34 Years | 0 (0.0%) | 0 (0.0%) |
| 35 to 64 Years | 30 (0.7%) | 52 (1.3%) |
| 65 to 74 Years | 0 (0.0%) | 0 (0.0%) |
| 75 Years and over | 38 (16.0%) | 0 (0.0%) |
Disability Class: Cognitive Difficulty
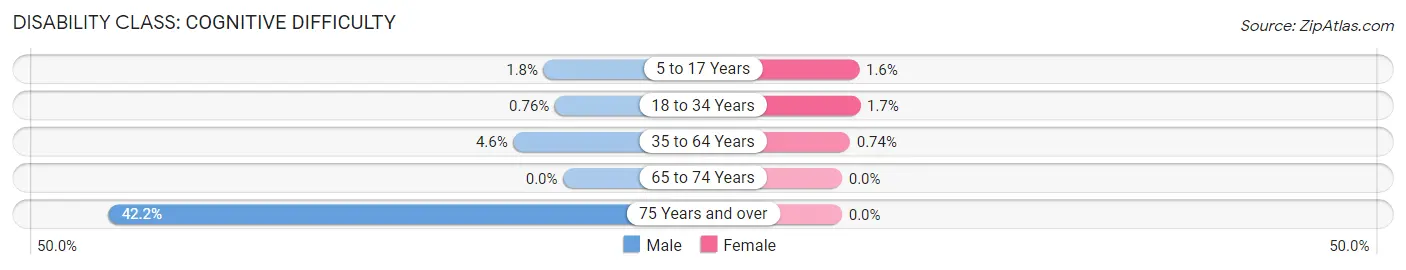
| Age Bracket | Male | Female |
| 5 to 17 Years | 34 (1.8%) | 41 (1.6%) |
| 18 to 34 Years | 19 (0.8%) | 29 (1.7%) |
| 35 to 64 Years | 192 (4.6%) | 29 (0.7%) |
| 65 to 74 Years | 0 (0.0%) | 0 (0.0%) |
| 75 Years and over | 100 (42.2%) | 0 (0.0%) |
Disability Class: Ambulatory Difficulty
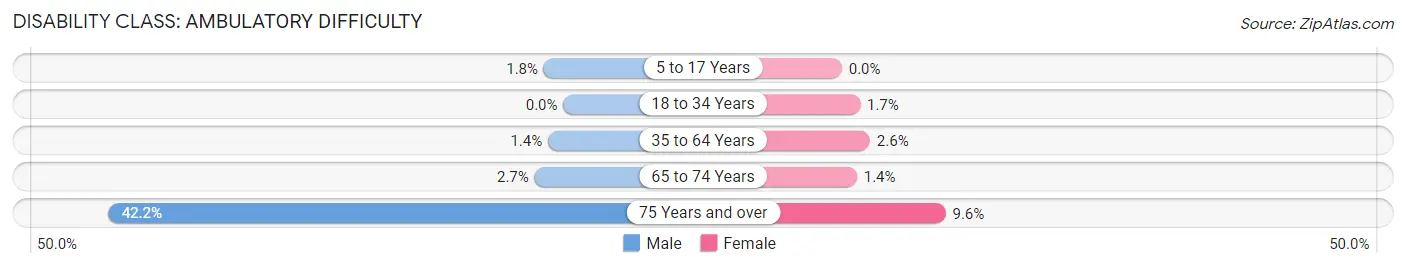
| Age Bracket | Male | Female |
| 5 to 17 Years | 34 (1.8%) | 0 (0.0%) |
| 18 to 34 Years | 0 (0.0%) | 29 (1.7%) |
| 35 to 64 Years | 59 (1.4%) | 102 (2.6%) |
| 65 to 74 Years | 18 (2.7%) | 9 (1.4%) |
| 75 Years and over | 100 (42.2%) | 47 (9.6%) |
Disability Class: Self-Care Difficulty
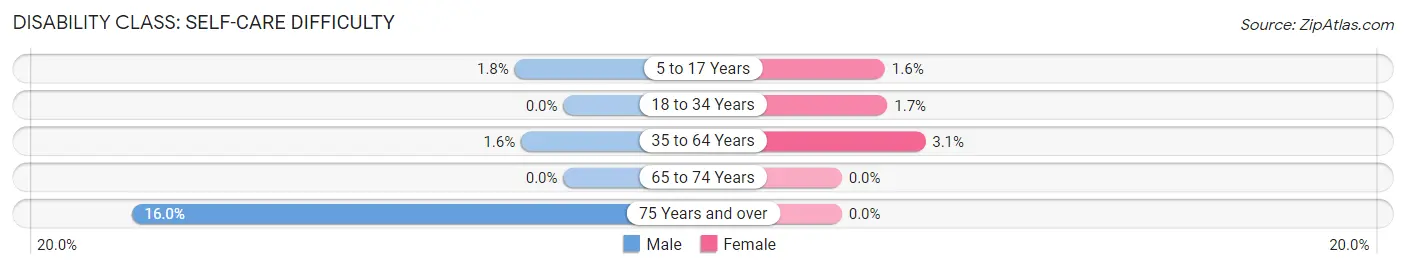
| Age Bracket | Male | Female |
| 5 to 17 Years | 34 (1.8%) | 41 (1.6%) |
| 18 to 34 Years | 0 (0.0%) | 29 (1.7%) |
| 35 to 64 Years | 65 (1.6%) | 121 (3.1%) |
| 65 to 74 Years | 0 (0.0%) | 0 (0.0%) |
| 75 Years and over | 38 (16.0%) | 0 (0.0%) |
Technology Access in Otsego
Computing Device Access in Otsego
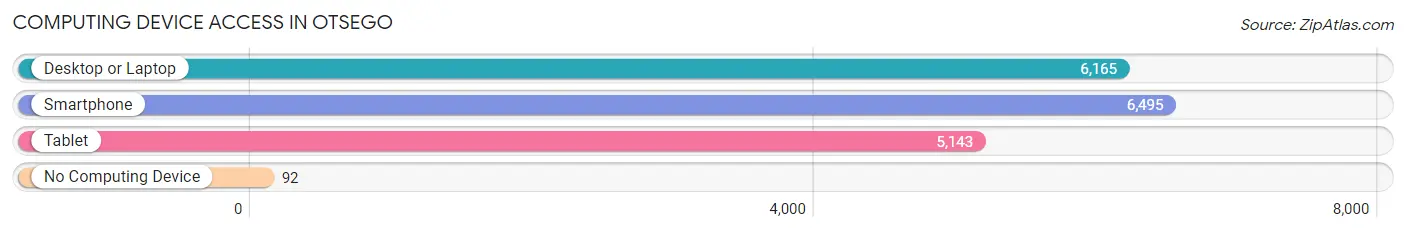
| Device Type | # Households | % Households |
| Desktop or Laptop | 6,165 | 91.2% |
| Smartphone | 6,495 | 96.1% |
| Tablet | 5,143 | 76.1% |
| No Computing Device | 92 | 1.4% |
| Total | 6,759 | 100.0% |
Internet Access in Otsego
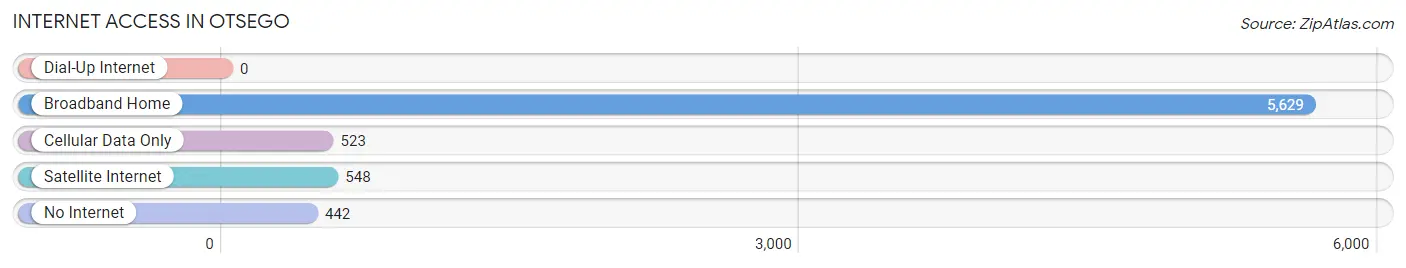
| Internet Type | # Households | % Households |
| Dial-Up Internet | 0 | 0.0% |
| Broadband Home | 5,629 | 83.3% |
| Cellular Data Only | 523 | 7.7% |
| Satellite Internet | 548 | 8.1% |
| No Internet | 442 | 6.5% |
| Total | 6,759 | 100.0% |
Otsego Summary
Otsego is a city located in the state of Minnesota, in the United States of America. It is located in Wright County, and is part of the Twin Cities metropolitan area. The population of Otsego was 8,845 at the 2010 census.
History
Otsego was first settled in 1855 by a group of settlers from New York. The town was named after the Otsego County in New York. The first post office was established in 1856. The town was incorporated in 1858.
In the late 19th century, Otsego was a thriving agricultural community. The town was home to several grain mills, a creamery, and a cheese factory. The town also had a sawmill, a blacksmith shop, and a general store.
In the early 20th century, Otsego began to grow and develop. The town was home to several churches, a bank, a newspaper, and a library. The town also had a movie theater, a bowling alley, and a roller skating rink.
Geography
Otsego is located in Wright County, in the state of Minnesota. The city is situated on the north side of the Crow River, about 25 miles northwest of Minneapolis. The city has a total area of 4.2 square miles, all of which is land.
The city is located in the Central Hardwood Forest ecoregion. The terrain is mostly flat, with some rolling hills. The climate is humid continental, with cold winters and warm summers.
Economy
The economy of Otsego is largely based on agriculture and manufacturing. The city is home to several large farms, which produce corn, soybeans, and other crops. The city is also home to several manufacturing companies, which produce a variety of products, including furniture, plastics, and automotive parts.
The city is also home to several retail stores, restaurants, and other businesses. The city is served by several major highways, which provide access to the Twin Cities metropolitan area.
Demographics
As of the 2010 census, the population of Otsego was 8,845. The racial makeup of the city was 94.3% White, 1.2% African American, 0.4% Native American, 1.2% Asian, 0.1% Pacific Islander, 1.2% from other races, and 1.6% from two or more races. Hispanic or Latino of any race were 3.2% of the population.
The median household income in Otsego was $60,945, and the median family income was $71,917. The per capita income was $27,945. About 4.2% of families and 5.7% of the population were below the poverty line.
Conclusion
Otsego is a city located in Wright County, Minnesota. The city has a population of 8,845, and is part of the Twin Cities metropolitan area. The economy of Otsego is largely based on agriculture and manufacturing. The city is home to several large farms, and several manufacturing companies. The racial makeup of the city is 94.3% White, 1.2% African American, 0.4% Native American, 1.2% Asian, 0.1% Pacific Islander, 1.2% from other races, and 1.6% from two or more races. The median household income in Otsego was $60,945, and the median family income was $71,917.
Common Questions
What is the Total Population of Otsego?
Total Population of Otsego is 20,455.
What is the Total Male Population of Otsego?
Total Male Population of Otsego is 10,403.
What is the Total Female Population of Otsego?
Total Female Population of Otsego is 10,052.
What is the Ratio of Males per 100 Females in Otsego?
There are 103.49 Males per 100 Females in Otsego.
What is the Ratio of Females per 100 Males in Otsego?
There are 96.63 Females per 100 Males in Otsego.
What is the Median Population Age in Otsego?
Median Population Age in Otsego is 34.6 Years.
What is the Average Family Size in Otsego
Average Family Size in Otsego is 3.5 People.
What is the Average Household Size in Otsego
Average Household Size in Otsego is 3.0 People.
What is Per Capita Income in Otsego?
Per Capita income in Otsego is $45,856.
What is the Median Family Income in Otsego?
Median Family Income in Otsego is $136,489.
What is the Median Household income in Otsego?
Median Household Income in Otsego is $122,420.
What is Income or Wage Gap in Otsego?
Income or Wage Gap in Otsego is 33.2%.
Women in Otsego earn 66.8 cents for every dollar earned by a man.
What is Inequality or Gini Index in Otsego?
Inequality or Gini Index in Otsego is 0.30.
How Large is the Labor Force in Otsego?
There are 11,390 People in the Labor Forcein in Otsego.
What is the Percentage of People in the Labor Force in Otsego?
75.7% of People are in the Labor Force in Otsego.
What is the Unemployment Rate in Otsego?
Unemployment Rate in Otsego is 1.5%.