Marine on St Croix, MN
Marine on St Croix Map
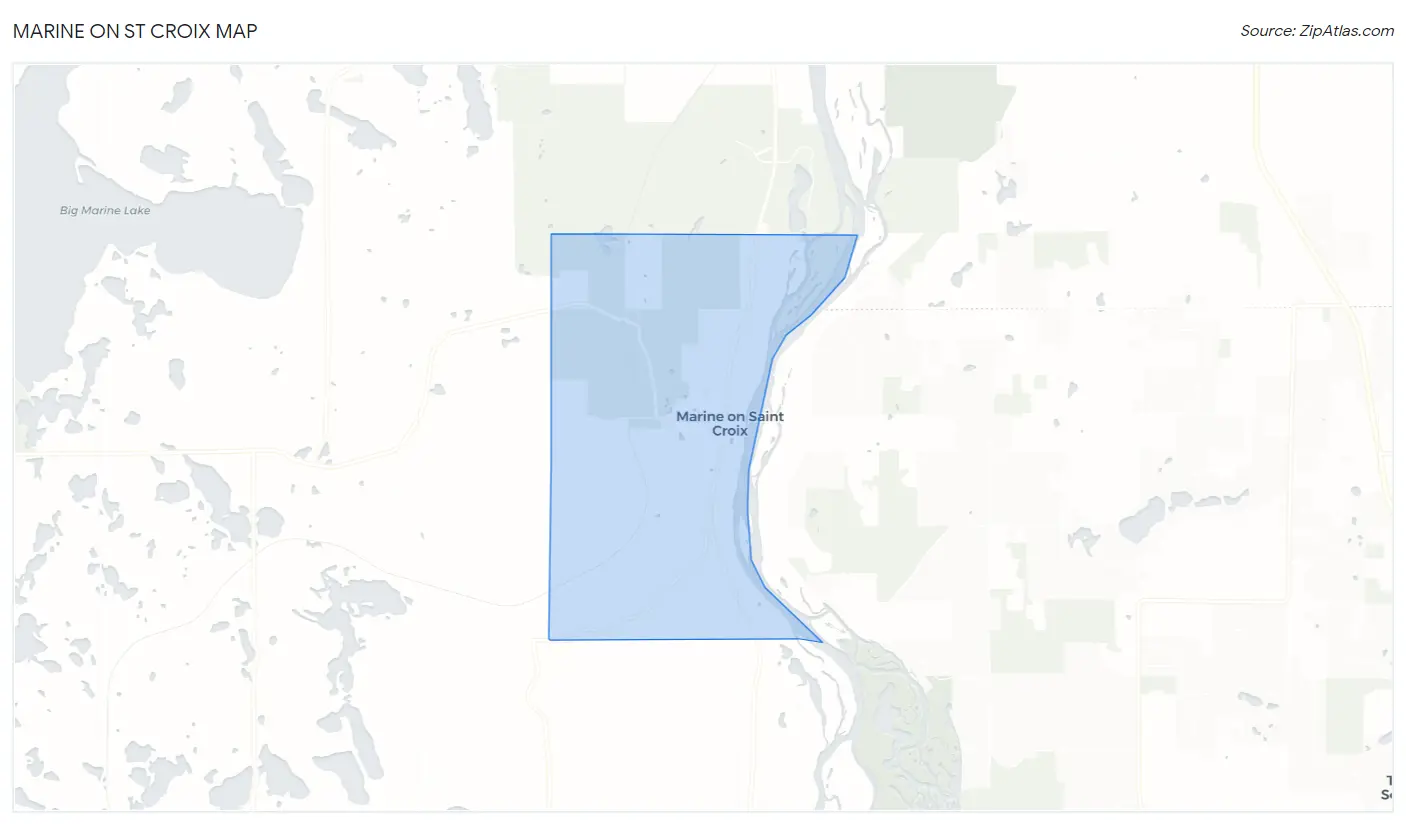
Marine on St Croix Overview
721
TOTAL POPULATION
343
MALE POPULATION
378
FEMALE POPULATION
90.74
MALES / 100 FEMALES
110.20
FEMALES / 100 MALES
57.0
MEDIAN AGE
2.9
AVG FAMILY SIZE
2.3
AVG HOUSEHOLD SIZE
$64,061
PER CAPITA INCOME
$145,625
AVG FAMILY INCOME
$135,242
AVG HOUSEHOLD INCOME
32.9%
WAGE / INCOME GAP [ % ]
67.1¢/ $1
WAGE / INCOME GAP [ $ ]
0.39
INEQUALITY / GINI INDEX
360
LABOR FORCE [ PEOPLE ]
58.8%
PERCENT IN LABOR FORCE
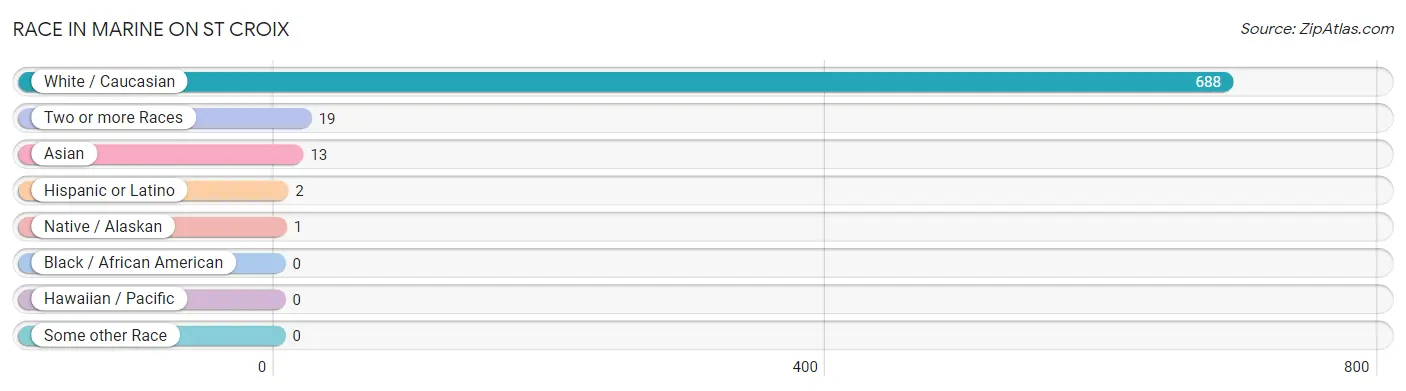
Race in Marine on St Croix
The most populous races in Marine on St Croix are White / Caucasian (688 | 95.4%), Two or more Races (19 | 2.6%), and Asian (13 | 1.8%).
| Race | # Population | % Population |
| Asian | 13 | 1.8% |
| Black / African American | 0 | 0.0% |
| Hawaiian / Pacific | 0 | 0.0% |
| Hispanic or Latino | 2 | 0.3% |
| Native / Alaskan | 1 | 0.1% |
| White / Caucasian | 688 | 95.4% |
| Two or more Races | 19 | 2.6% |
| Some other Race | 0 | 0.0% |
| Total | 721 | 100.0% |
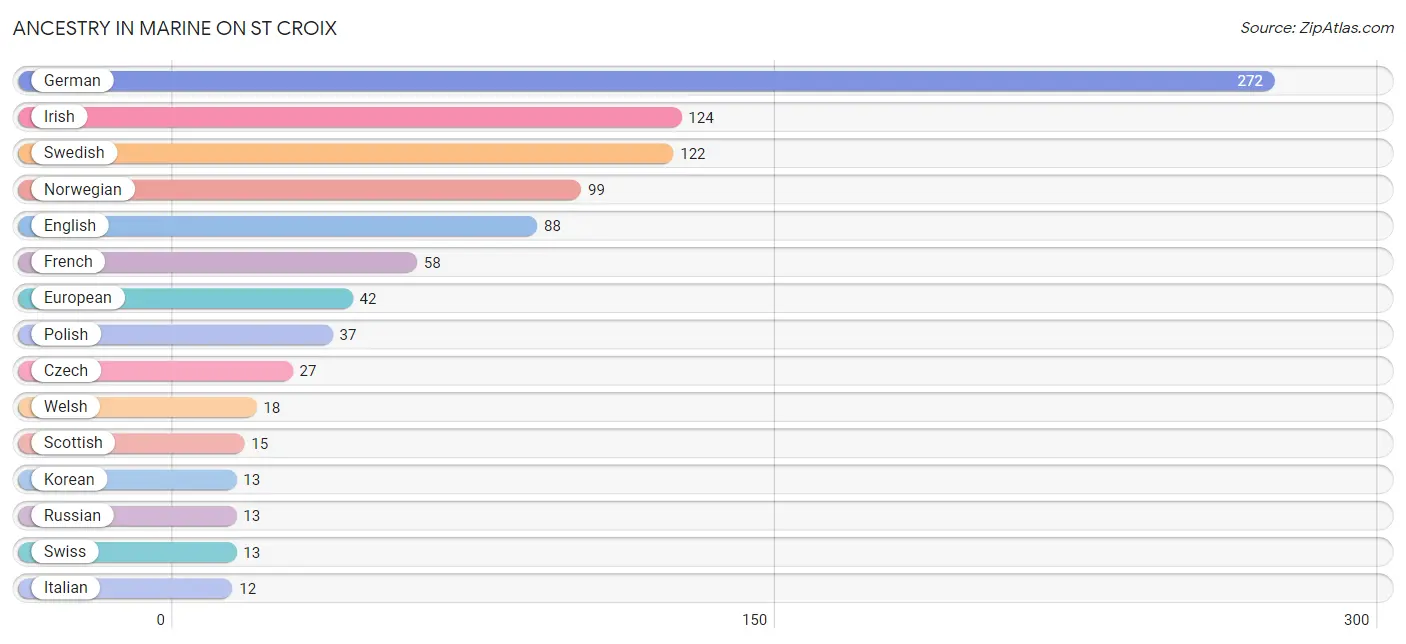
Ancestry in Marine on St Croix
The most populous ancestries reported in Marine on St Croix are German (272 | 37.7%), Irish (124 | 17.2%), Swedish (122 | 16.9%), Norwegian (99 | 13.7%), and English (88 | 12.2%), together accounting for 97.8% of all Marine on St Croix residents.
| Ancestry | # Population | % Population |
| American | 9 | 1.3% |
| Austrian | 1 | 0.1% |
| Belgian | 2 | 0.3% |
| Brazilian | 4 | 0.5% |
| Bulgarian | 1 | 0.1% |
| Burmese | 1 | 0.1% |
| Canadian | 3 | 0.4% |
| Chippewa | 7 | 1.0% |
| Choctaw | 2 | 0.3% |
| Czech | 27 | 3.7% |
| Danish | 2 | 0.3% |
| Dutch | 8 | 1.1% |
| Eastern European | 8 | 1.1% |
| English | 88 | 12.2% |
| European | 42 | 5.8% |
| Finnish | 8 | 1.1% |
| French | 58 | 8.0% |
| French Canadian | 2 | 0.3% |
| German | 272 | 37.7% |
| Greek | 9 | 1.3% |
| Indian (Asian) | 2 | 0.3% |
| Irish | 124 | 17.2% |
| Italian | 12 | 1.7% |
| Korean | 13 | 1.8% |
| Mexican | 2 | 0.3% |
| Norwegian | 99 | 13.7% |
| Pennsylvania German | 2 | 0.3% |
| Polish | 37 | 5.1% |
| Russian | 13 | 1.8% |
| Samoan | 3 | 0.4% |
| Scandinavian | 9 | 1.3% |
| Scotch-Irish | 3 | 0.4% |
| Scottish | 15 | 2.1% |
| Slovak | 2 | 0.3% |
| Swedish | 122 | 16.9% |
| Swiss | 13 | 1.8% |
| Ukrainian | 1 | 0.1% |
| Welsh | 18 | 2.5% | View All 38 Rows |
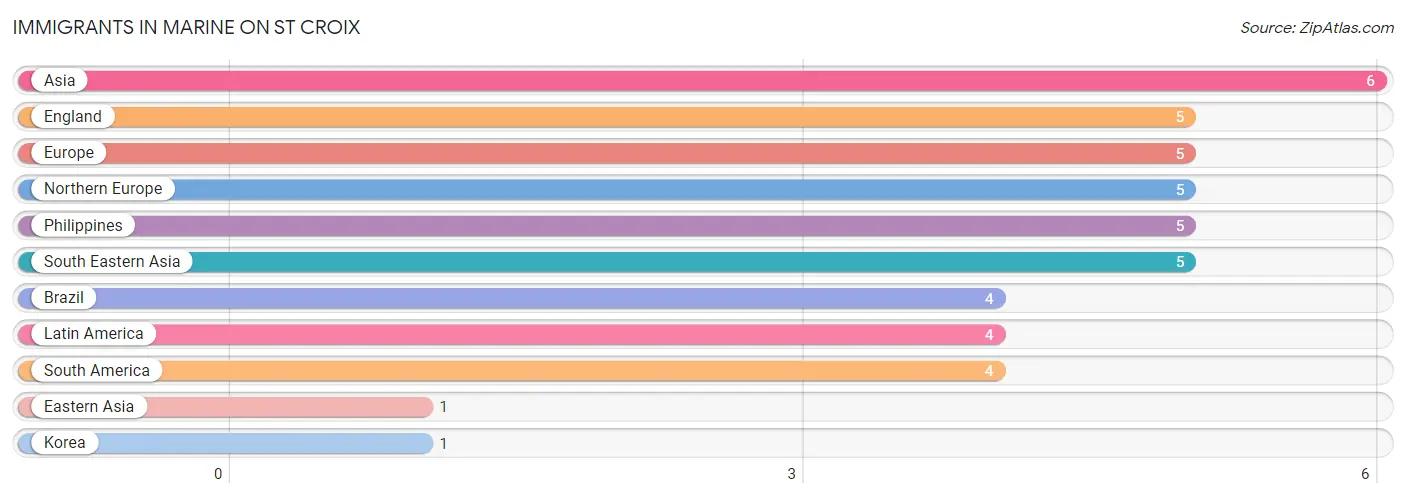
Immigrants in Marine on St Croix
The most numerous immigrant groups reported in Marine on St Croix came from Asia (6 | 0.8%), England (5 | 0.7%), Europe (5 | 0.7%), Northern Europe (5 | 0.7%), and Philippines (5 | 0.7%), together accounting for 3.6% of all Marine on St Croix residents.
| Immigration Origin | # Population | % Population |
| Asia | 6 | 0.8% |
| Brazil | 4 | 0.5% |
| Eastern Asia | 1 | 0.1% |
| England | 5 | 0.7% |
| Europe | 5 | 0.7% |
| Korea | 1 | 0.1% |
| Latin America | 4 | 0.5% |
| Northern Europe | 5 | 0.7% |
| Philippines | 5 | 0.7% |
| South America | 4 | 0.5% |
| South Eastern Asia | 5 | 0.7% | View All 11 Rows |
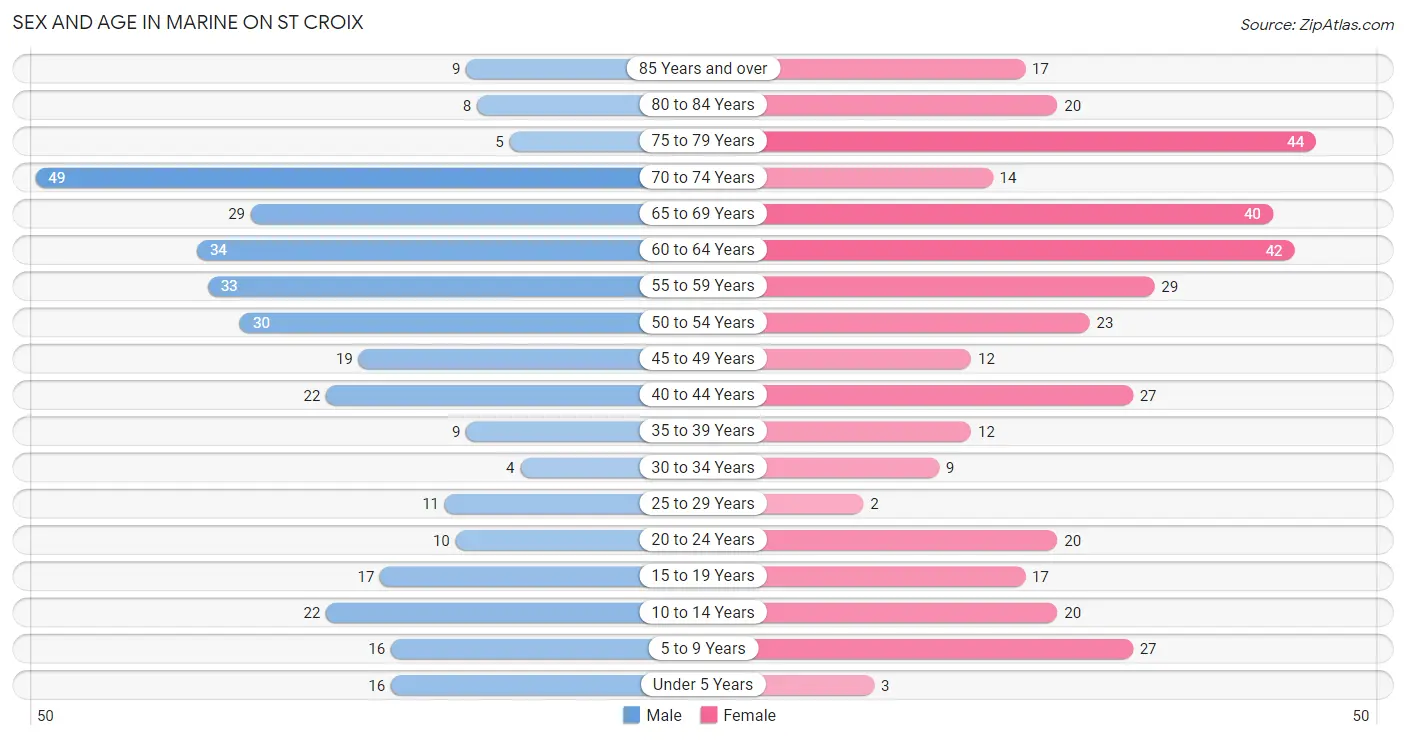
Sex and Age in Marine on St Croix
Sex and Age in Marine on St Croix
The most populous age groups in Marine on St Croix are 70 to 74 Years (49 | 14.3%) for men and 75 to 79 Years (44 | 11.6%) for women.
| Age Bracket | Male | Female |
| Under 5 Years | 16 (4.7%) | 3 (0.8%) |
| 5 to 9 Years | 16 (4.7%) | 27 (7.1%) |
| 10 to 14 Years | 22 (6.4%) | 20 (5.3%) |
| 15 to 19 Years | 17 (5.0%) | 17 (4.5%) |
| 20 to 24 Years | 10 (2.9%) | 20 (5.3%) |
| 25 to 29 Years | 11 (3.2%) | 2 (0.5%) |
| 30 to 34 Years | 4 (1.2%) | 9 (2.4%) |
| 35 to 39 Years | 9 (2.6%) | 12 (3.2%) |
| 40 to 44 Years | 22 (6.4%) | 27 (7.1%) |
| 45 to 49 Years | 19 (5.5%) | 12 (3.2%) |
| 50 to 54 Years | 30 (8.7%) | 23 (6.1%) |
| 55 to 59 Years | 33 (9.6%) | 29 (7.7%) |
| 60 to 64 Years | 34 (9.9%) | 42 (11.1%) |
| 65 to 69 Years | 29 (8.5%) | 40 (10.6%) |
| 70 to 74 Years | 49 (14.3%) | 14 (3.7%) |
| 75 to 79 Years | 5 (1.5%) | 44 (11.6%) |
| 80 to 84 Years | 8 (2.3%) | 20 (5.3%) |
| 85 Years and over | 9 (2.6%) | 17 (4.5%) |
| Total | 343 (100.0%) | 378 (100.0%) |
Families and Households in Marine on St Croix
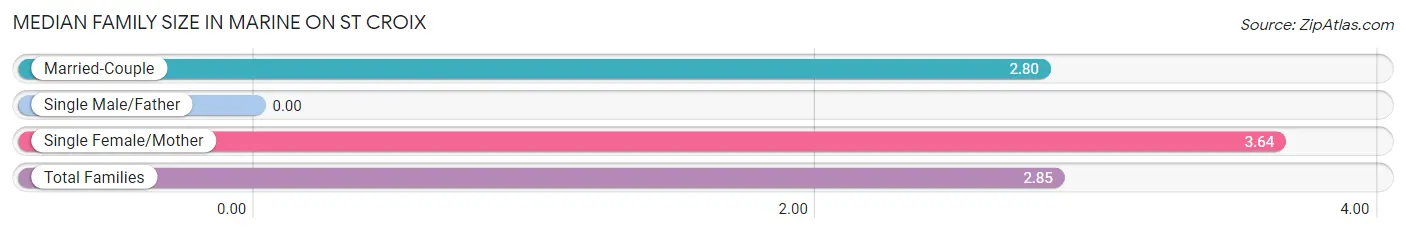
Median Family Size in Marine on St Croix
| Family Type | # Families | Family Size |
| Married-Couple | 202 (94.8%) | 2.80 |
| Single Male/Father | 0 (0.0%) | - |
| Single Female/Mother | 11 (5.2%) | 3.64 |
| Total Families | 213 (100.0%) | 2.85 |
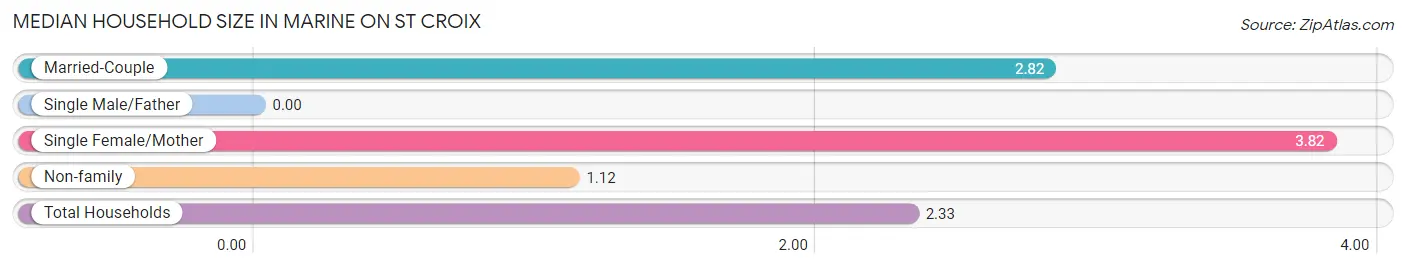
Median Household Size in Marine on St Croix
| Household Type | # Households | Household Size |
| Married-Couple | 202 (65.2%) | 2.82 |
| Single Male/Father | 0 (0.0%) | - |
| Single Female/Mother | 11 (3.5%) | 3.82 |
| Non-family | 97 (31.3%) | 1.12 |
| Total Households | 310 (100.0%) | 2.33 |
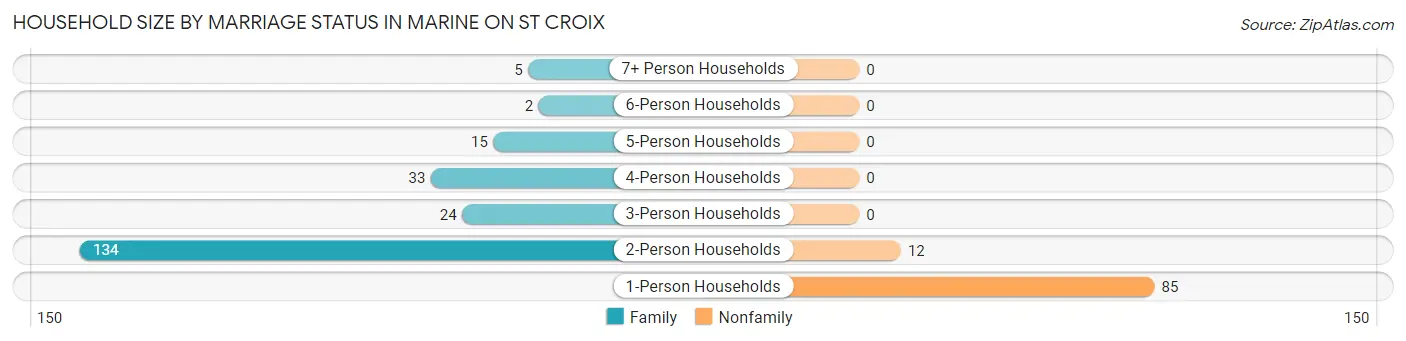
Household Size by Marriage Status in Marine on St Croix
Out of a total of 310 households in Marine on St Croix, 213 (68.7%) are family households, while 97 (31.3%) are nonfamily households. The most numerous type of family households are 2-person households, comprising 134, and the most common type of nonfamily households are 1-person households, comprising 85.
| Household Size | Family Households | Nonfamily Households |
| 1-Person Households | - | 85 (27.4%) |
| 2-Person Households | 134 (43.2%) | 12 (3.9%) |
| 3-Person Households | 24 (7.7%) | 0 (0.0%) |
| 4-Person Households | 33 (10.6%) | 0 (0.0%) |
| 5-Person Households | 15 (4.8%) | 0 (0.0%) |
| 6-Person Households | 2 (0.6%) | 0 (0.0%) |
| 7+ Person Households | 5 (1.6%) | 0 (0.0%) |
| Total | 213 (68.7%) | 97 (31.3%) |
Female Fertility in Marine on St Croix
Fertility by Age in Marine on St Croix
Average fertility rate in Marine on St Croix is 29.0 births per 1,000 women. Women in the age bracket of 35 to 50 years have the highest fertility rate with 37.0 births per 1,000 women. Women in the age bracket of 35 to 50 years acount for 66.7% of all women with births.
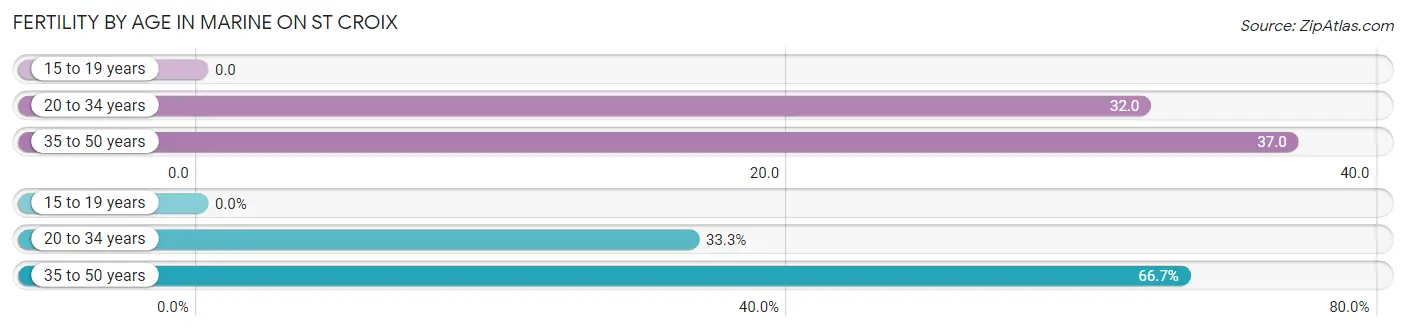
| Age Bracket | Women with Births | Births / 1,000 Women |
| 15 to 19 years | 0 (0.0%) | 0.0 |
| 20 to 34 years | 1 (33.3%) | 32.0 |
| 35 to 50 years | 2 (66.7%) | 37.0 |
| Total | 3 (100.0%) | 29.0 |
Fertility by Age by Marriage Status in Marine on St Croix
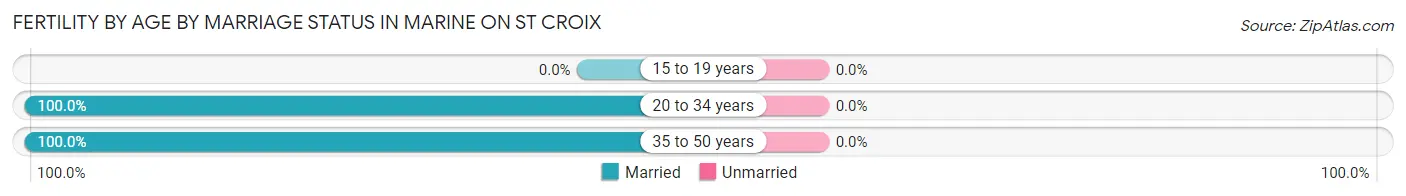
| Age Bracket | Married | Unmarried |
| 15 to 19 years | 0 (0.0%) | 0 (0.0%) |
| 20 to 34 years | 1 (100.0%) | 0 (0.0%) |
| 35 to 50 years | 2 (100.0%) | 0 (0.0%) |
| Total | 3 (100.0%) | 0 (0.0%) |
Fertility by Education in Marine on St Croix
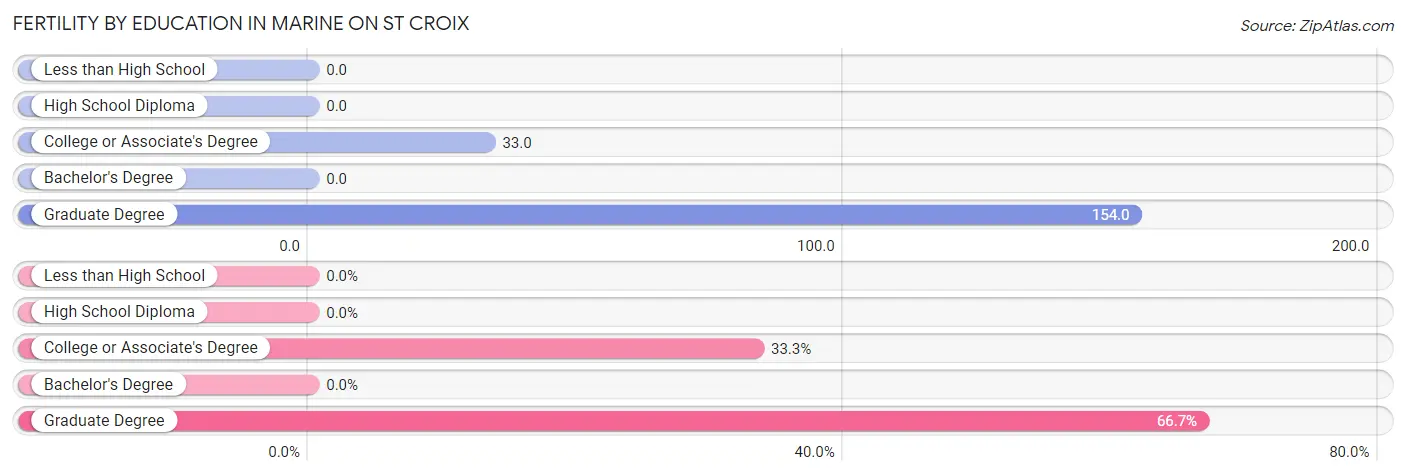
| Educational Attainment | Women with Births | Births / 1,000 Women |
| Less than High School | 0 (0.0%) | 0.0 |
| High School Diploma | 0 (0.0%) | 0.0 |
| College or Associate's Degree | 1 (33.3%) | 33.0 |
| Bachelor's Degree | 0 (0.0%) | 0.0 |
| Graduate Degree | 2 (66.7%) | 154.0 |
| Total | 3 (100.0%) | 29.0 |
Fertility by Education by Marriage Status in Marine on St Croix
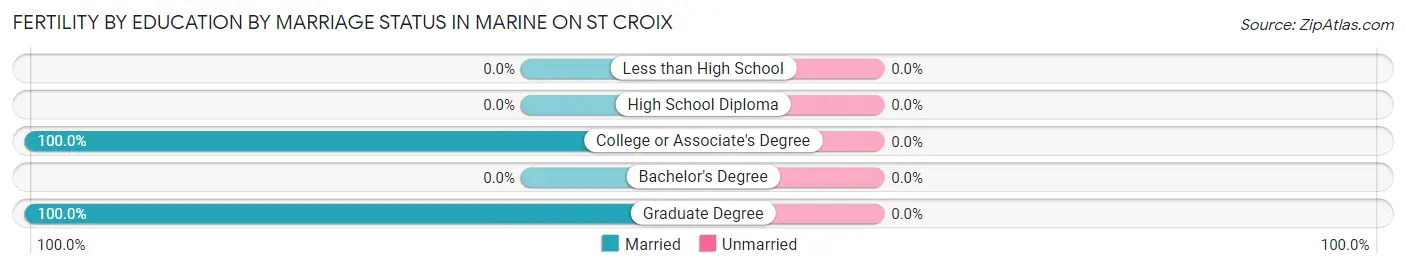
| Educational Attainment | Married | Unmarried |
| Less than High School | 0 (0.0%) | 0 (0.0%) |
| High School Diploma | 0 (0.0%) | 0 (0.0%) |
| College or Associate's Degree | 1 (100.0%) | 0 (0.0%) |
| Bachelor's Degree | 0 (0.0%) | 0 (0.0%) |
| Graduate Degree | 2 (100.0%) | 0 (0.0%) |
| Total | 3 (100.0%) | 0 (0.0%) |
Income in Marine on St Croix
Income Overview in Marine on St Croix
Per Capita Income in Marine on St Croix is $64,061, while median incomes of families and households are $145,625 and $135,242 respectively.
| Characteristic | Number | Measure |
| Per Capita Income | 721 | $64,061 |
| Median Family Income | 213 | $145,625 |
| Mean Family Income | 213 | $169,206 |
| Median Household Income | 310 | $135,242 |
| Mean Household Income | 310 | $145,664 |
| Income Deficit | 213 | $0 |
| Wage / Income Gap (%) | 721 | 32.90% |
| Wage / Income Gap ($) | 721 | 67.10¢ per $1 |
| Gini / Inequality Index | 721 | 0.39 |
Earnings by Sex in Marine on St Croix
Average Earnings in Marine on St Croix are $56,250, $68,000 for men and $45,625 for women, a difference of 32.9%.
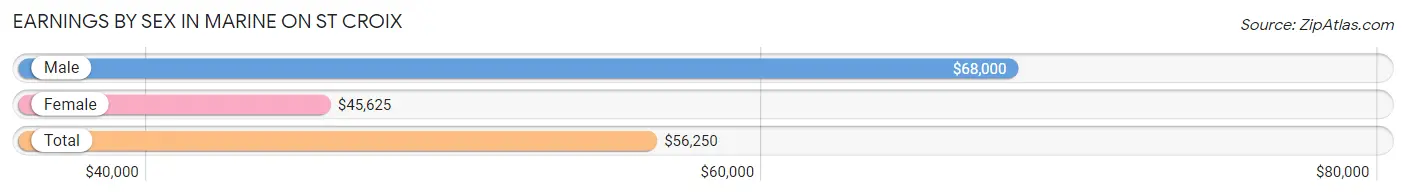
| Sex | Number | Average Earnings |
| Male | 196 (51.6%) | $68,000 |
| Female | 184 (48.4%) | $45,625 |
| Total | 380 (100.0%) | $56,250 |
Earnings by Sex by Income Bracket in Marine on St Croix
The most common earnings brackets in Marine on St Croix are $100,000+ for men (52 | 26.5%) and $100,000+ for women (41 | 22.3%).
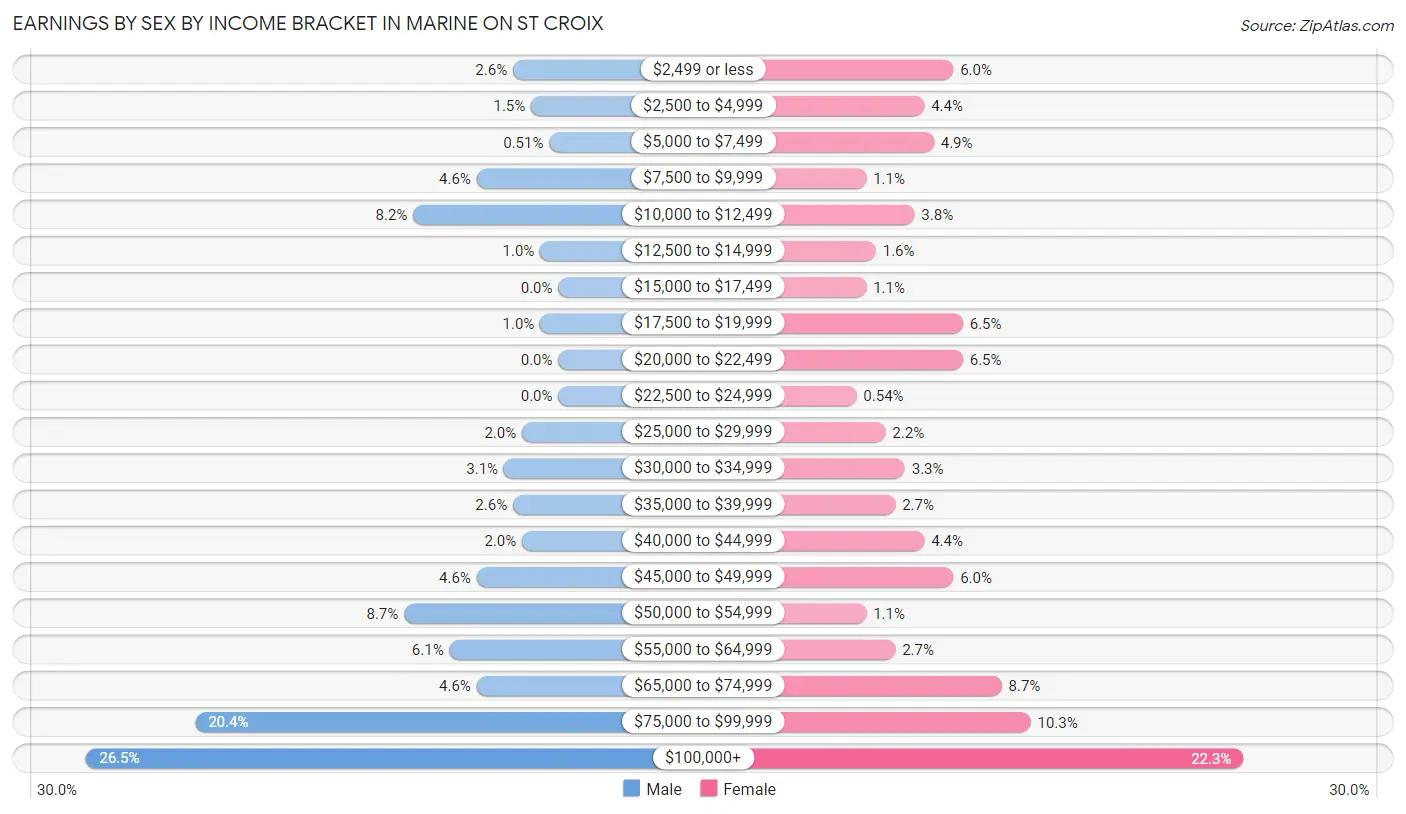
| Income | Male | Female |
| $2,499 or less | 5 (2.5%) | 11 (6.0%) |
| $2,500 to $4,999 | 3 (1.5%) | 8 (4.3%) |
| $5,000 to $7,499 | 1 (0.5%) | 9 (4.9%) |
| $7,500 to $9,999 | 9 (4.6%) | 2 (1.1%) |
| $10,000 to $12,499 | 16 (8.2%) | 7 (3.8%) |
| $12,500 to $14,999 | 2 (1.0%) | 3 (1.6%) |
| $15,000 to $17,499 | 0 (0.0%) | 2 (1.1%) |
| $17,500 to $19,999 | 2 (1.0%) | 12 (6.5%) |
| $20,000 to $22,499 | 0 (0.0%) | 12 (6.5%) |
| $22,500 to $24,999 | 0 (0.0%) | 1 (0.5%) |
| $25,000 to $29,999 | 4 (2.0%) | 4 (2.2%) |
| $30,000 to $34,999 | 6 (3.1%) | 6 (3.3%) |
| $35,000 to $39,999 | 5 (2.5%) | 5 (2.7%) |
| $40,000 to $44,999 | 4 (2.0%) | 8 (4.3%) |
| $45,000 to $49,999 | 9 (4.6%) | 11 (6.0%) |
| $50,000 to $54,999 | 17 (8.7%) | 2 (1.1%) |
| $55,000 to $64,999 | 12 (6.1%) | 5 (2.7%) |
| $65,000 to $74,999 | 9 (4.6%) | 16 (8.7%) |
| $75,000 to $99,999 | 40 (20.4%) | 19 (10.3%) |
| $100,000+ | 52 (26.5%) | 41 (22.3%) |
| Total | 196 (100.0%) | 184 (100.0%) |
Earnings by Sex by Educational Attainment in Marine on St Croix
Average earnings in Marine on St Croix are $81,250 for men and $61,250 for women, a difference of 24.6%. Men with an educational attainment of bachelor's degree enjoy the highest average annual earnings of $94,375, while those with high school diploma education earn the least with $50,694. Women with an educational attainment of graduate degree earn the most with the average annual earnings of $89,250, while those with high school diploma education have the smallest earnings of $38,750.
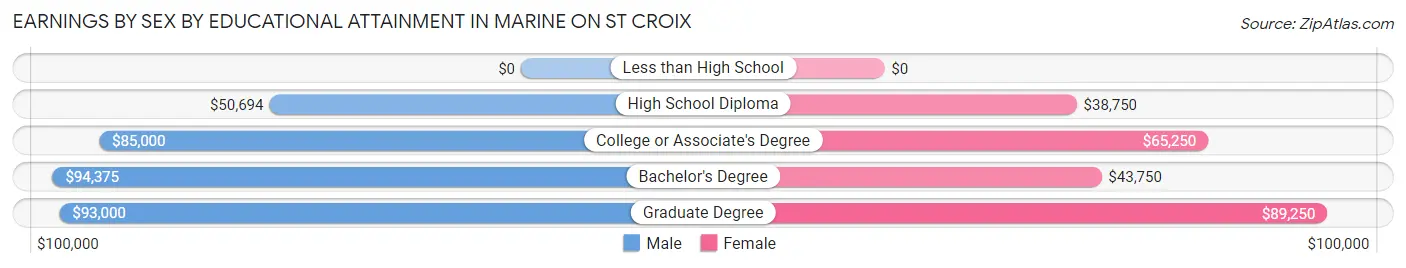
| Educational Attainment | Male Income | Female Income |
| Less than High School | - | - |
| High School Diploma | $50,694 | $38,750 |
| College or Associate's Degree | $85,000 | $65,250 |
| Bachelor's Degree | $94,375 | $43,750 |
| Graduate Degree | $93,000 | $89,250 |
| Total | $81,250 | $61,250 |
Family Income in Marine on St Croix
Family Income Brackets in Marine on St Croix
According to the Marine on St Croix family income data, there are 58 families falling into the $200,000+ income range, which is the most common income bracket and makes up 27.2% of all families. Conversely, the less than $10,000 income bracket is the least frequent group with only 2 families (0.9%) belonging to this category.
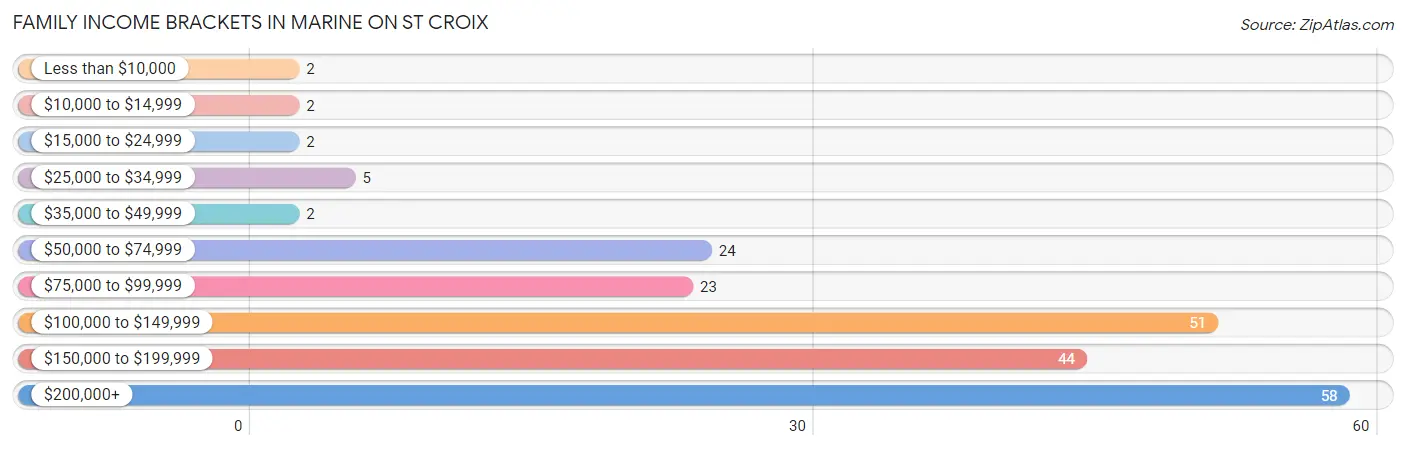
| Income Bracket | # Families | % Families |
| Less than $10,000 | 2 | 0.9% |
| $10,000 to $14,999 | 2 | 0.9% |
| $15,000 to $24,999 | 2 | 0.9% |
| $25,000 to $34,999 | 5 | 2.3% |
| $35,000 to $49,999 | 2 | 0.9% |
| $50,000 to $74,999 | 24 | 11.3% |
| $75,000 to $99,999 | 23 | 10.8% |
| $100,000 to $149,999 | 51 | 23.9% |
| $150,000 to $199,999 | 44 | 20.7% |
| $200,000+ | 58 | 27.2% |
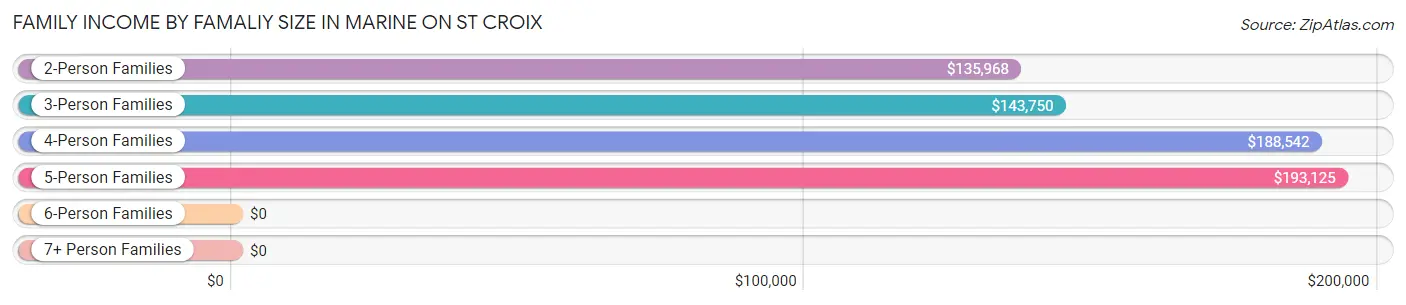
Family Income by Famaliy Size in Marine on St Croix
5-person families (17 | 8.0%) account for the highest median family income in Marine on St Croix with $193,125 per family, while 2-person families (134 | 62.9%) have the highest median income of $67,984 per family member.
| Income Bracket | # Families | Median Income |
| 2-Person Families | 134 (62.9%) | $135,968 |
| 3-Person Families | 26 (12.2%) | $143,750 |
| 4-Person Families | 31 (14.5%) | $188,542 |
| 5-Person Families | 17 (8.0%) | $193,125 |
| 6-Person Families | 0 (0.0%) | $0 |
| 7+ Person Families | 5 (2.4%) | $0 |
| Total | 213 (100.0%) | $145,625 |
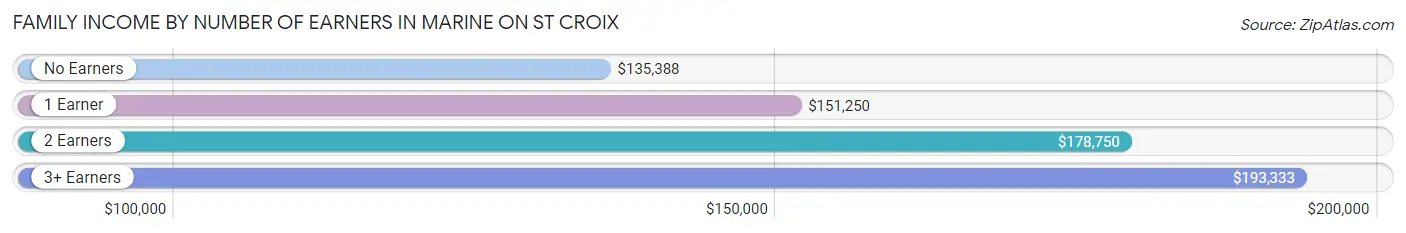
Family Income by Number of Earners in Marine on St Croix
The median family income in Marine on St Croix is $145,625, with families comprising 3+ earners (34) having the highest median family income of $193,333, while families with no earners (59) have the lowest median family income of $135,388, accounting for 16.0% and 27.7% of families, respectively.
| Number of Earners | # Families | Median Income |
| No Earners | 59 (27.7%) | $135,388 |
| 1 Earner | 36 (16.9%) | $151,250 |
| 2 Earners | 84 (39.4%) | $178,750 |
| 3+ Earners | 34 (16.0%) | $193,333 |
| Total | 213 (100.0%) | $145,625 |
Household Income in Marine on St Croix
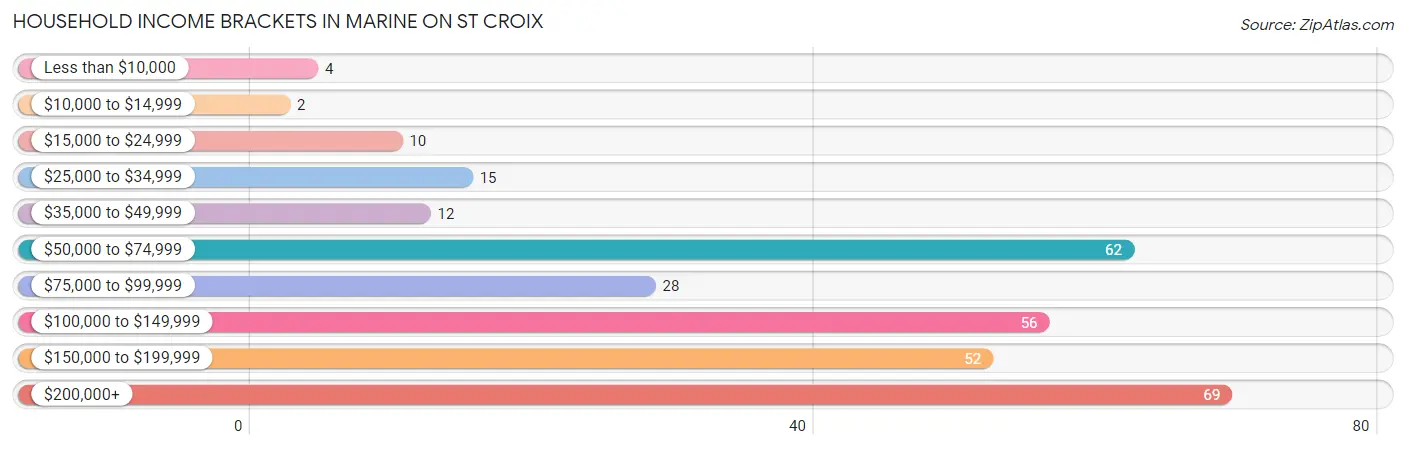
Household Income Brackets in Marine on St Croix
With 69 households falling in the category, the $200,000+ income range is the most frequent in Marine on St Croix, accounting for 22.3% of all households. In contrast, only 2 households (0.6%) fall into the $10,000 to $14,999 income bracket, making it the least populous group.
| Income Bracket | # Households | % Households |
| Less than $10,000 | 4 | 1.3% |
| $10,000 to $14,999 | 2 | 0.6% |
| $15,000 to $24,999 | 10 | 3.2% |
| $25,000 to $34,999 | 15 | 4.8% |
| $35,000 to $49,999 | 12 | 3.9% |
| $50,000 to $74,999 | 62 | 20.0% |
| $75,000 to $99,999 | 28 | 9.0% |
| $100,000 to $149,999 | 56 | 18.1% |
| $150,000 to $199,999 | 52 | 16.8% |
| $200,000+ | 69 | 22.3% |
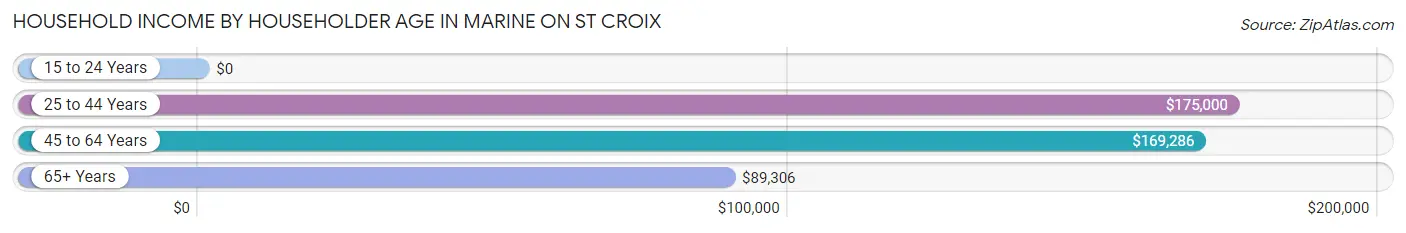
Household Income by Householder Age in Marine on St Croix
The median household income in Marine on St Croix is $135,242, with the highest median household income of $175,000 found in the 25 to 44 years age bracket for the primary householder. A total of 34 households (11.0%) fall into this category. Meanwhile, the 15 to 24 years age bracket for the primary householder has the lowest median household income of $0, with 3 households (1.0%) in this group.
| Income Bracket | # Households | Median Income |
| 15 to 24 Years | 3 (1.0%) | $0 |
| 25 to 44 Years | 34 (11.0%) | $175,000 |
| 45 to 64 Years | 128 (41.3%) | $169,286 |
| 65+ Years | 145 (46.8%) | $89,306 |
| Total | 310 (100.0%) | $135,242 |
Poverty in Marine on St Croix
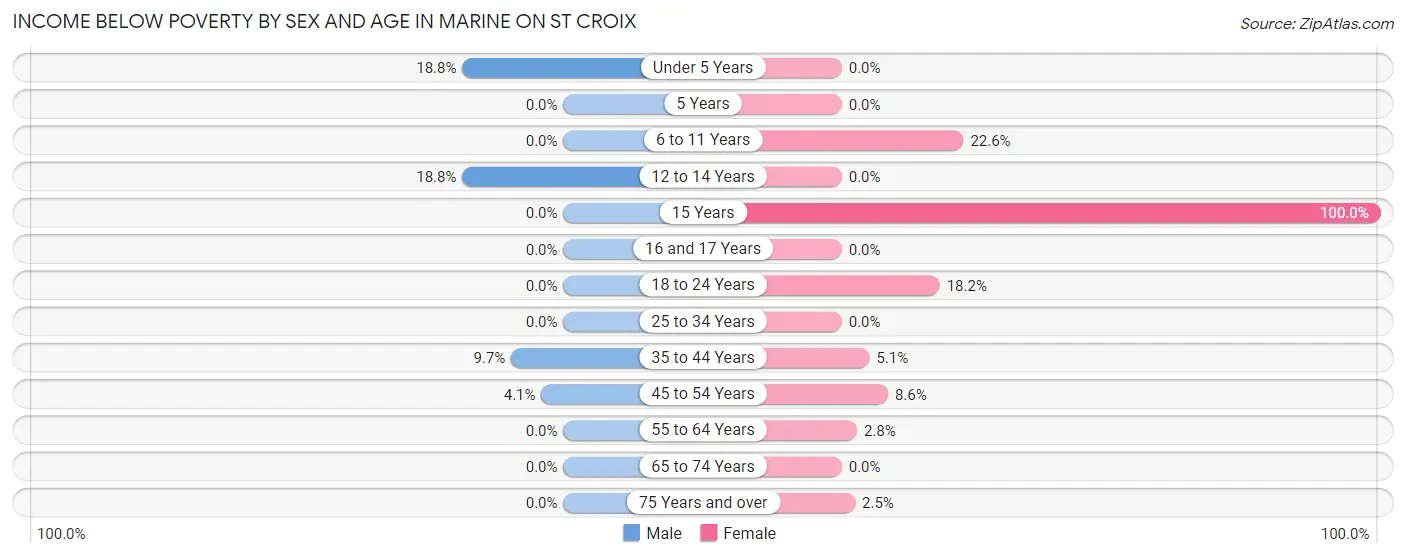
Income Below Poverty by Sex and Age in Marine on St Croix
With 3.2% poverty level for males and 5.8% for females among the residents of Marine on St Croix, under 5 year old males and 15 year old females are the most vulnerable to poverty, with 3 males (18.8%) and 2 females (100.0%) in their respective age groups living below the poverty level.
| Age Bracket | Male | Female |
| Under 5 Years | 3 (18.8%) | 0 (0.0%) |
| 5 Years | 0 (0.0%) | 0 (0.0%) |
| 6 to 11 Years | 0 (0.0%) | 7 (22.6%) |
| 12 to 14 Years | 3 (18.8%) | 0 (0.0%) |
| 15 Years | 0 (0.0%) | 2 (100.0%) |
| 16 and 17 Years | 0 (0.0%) | 0 (0.0%) |
| 18 to 24 Years | 0 (0.0%) | 4 (18.2%) |
| 25 to 34 Years | 0 (0.0%) | 0 (0.0%) |
| 35 to 44 Years | 3 (9.7%) | 2 (5.1%) |
| 45 to 54 Years | 2 (4.1%) | 3 (8.6%) |
| 55 to 64 Years | 0 (0.0%) | 2 (2.8%) |
| 65 to 74 Years | 0 (0.0%) | 0 (0.0%) |
| 75 Years and over | 0 (0.0%) | 2 (2.5%) |
| Total | 11 (3.2%) | 22 (5.8%) |
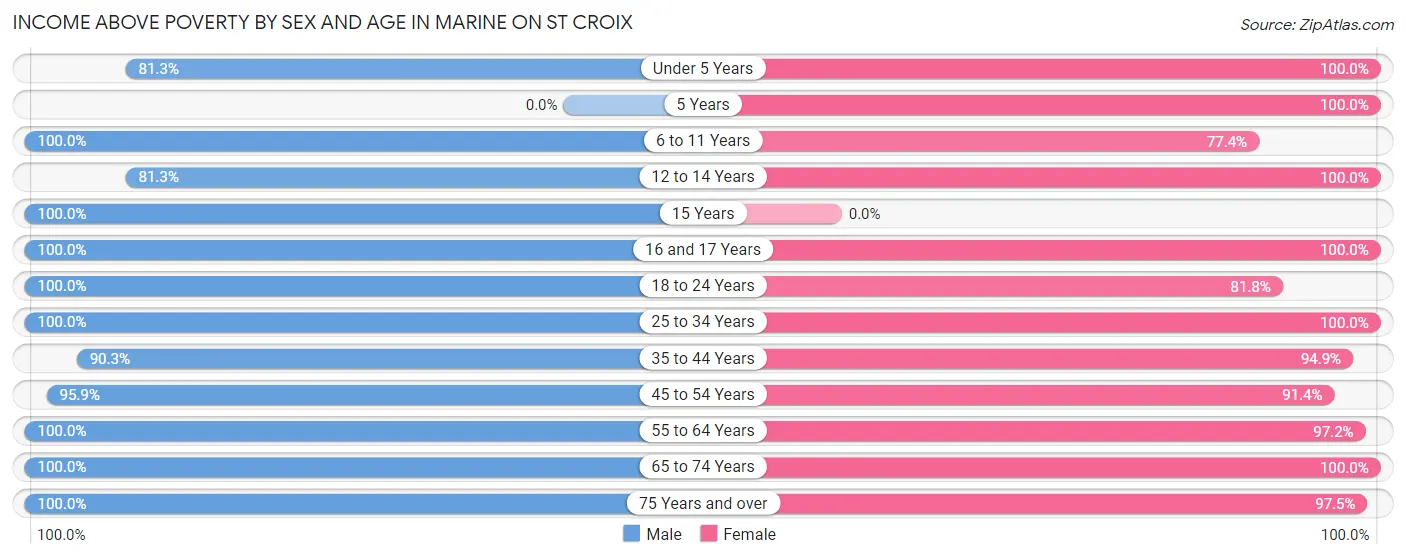
Income Above Poverty by Sex and Age in Marine on St Croix
According to the poverty statistics in Marine on St Croix, males aged 6 to 11 years and females aged under 5 years are the age groups that are most secure financially, with 100.0% of males and 100.0% of females in these age groups living above the poverty line.
| Age Bracket | Male | Female |
| Under 5 Years | 13 (81.2%) | 3 (100.0%) |
| 5 Years | 0 (0.0%) | 6 (100.0%) |
| 6 to 11 Years | 22 (100.0%) | 24 (77.4%) |
| 12 to 14 Years | 13 (81.2%) | 10 (100.0%) |
| 15 Years | 3 (100.0%) | 0 (0.0%) |
| 16 and 17 Years | 14 (100.0%) | 13 (100.0%) |
| 18 to 24 Years | 10 (100.0%) | 18 (81.8%) |
| 25 to 34 Years | 15 (100.0%) | 11 (100.0%) |
| 35 to 44 Years | 28 (90.3%) | 37 (94.9%) |
| 45 to 54 Years | 47 (95.9%) | 32 (91.4%) |
| 55 to 64 Years | 67 (100.0%) | 69 (97.2%) |
| 65 to 74 Years | 78 (100.0%) | 54 (100.0%) |
| 75 Years and over | 22 (100.0%) | 79 (97.5%) |
| Total | 332 (96.8%) | 356 (94.2%) |
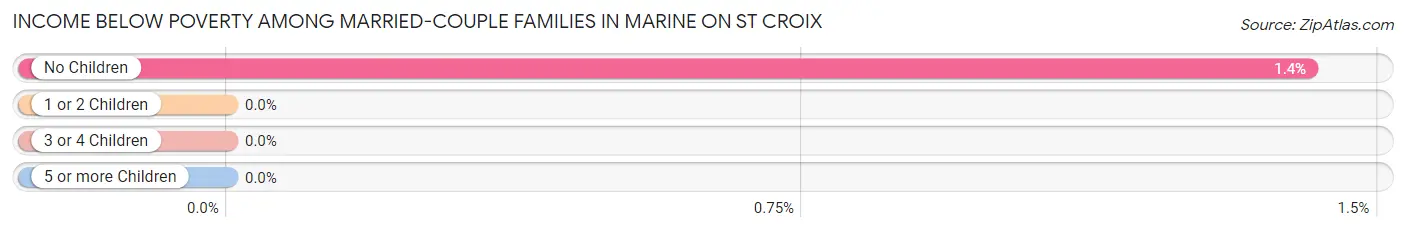
Income Below Poverty Among Married-Couple Families in Marine on St Croix
The poverty statistics for married-couple families in Marine on St Croix show that 1.0% or 2 of the total 202 families live below the poverty line. Families with no children have the highest poverty rate of 1.4%, comprising of 2 families. On the other hand, families with 1 or 2 children have the lowest poverty rate of 0.0%, which includes 0 families.
| Children | Above Poverty | Below Poverty |
| No Children | 140 (98.6%) | 2 (1.4%) |
| 1 or 2 Children | 51 (100.0%) | 0 (0.0%) |
| 3 or 4 Children | 9 (100.0%) | 0 (0.0%) |
| 5 or more Children | 0 (0.0%) | 0 (0.0%) |
| Total | 200 (99.0%) | 2 (1.0%) |
Income Below Poverty Among Single-Parent Households in Marine on St Croix

| Children | Single Father | Single Mother |
| No Children | 0 (0.0%) | 0 (0.0%) |
| 1 or 2 Children | 0 (0.0%) | 2 (33.3%) |
| 3 or 4 Children | 0 (0.0%) | 2 (100.0%) |
| 5 or more Children | 0 (0.0%) | 0 (0.0%) |
| Total | 0 (0.0%) | 4 (36.4%) |
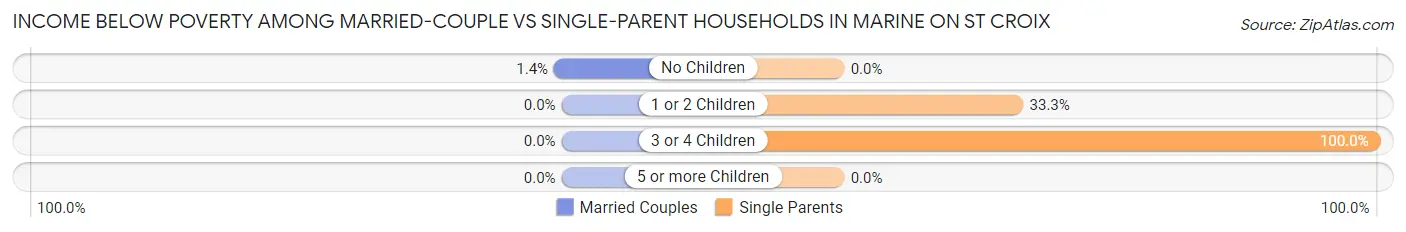
Income Below Poverty Among Married-Couple vs Single-Parent Households in Marine on St Croix
The poverty data for Marine on St Croix shows that 2 of the married-couple family households (1.0%) and 4 of the single-parent households (36.4%) are living below the poverty level. Within the married-couple family households, those with no children have the highest poverty rate, with 2 households (1.4%) falling below the poverty line. Among the single-parent households, those with 3 or 4 children have the highest poverty rate, with 2 household (100.0%) living below poverty.
| Children | Married-Couple Families | Single-Parent Households |
| No Children | 2 (1.4%) | 0 (0.0%) |
| 1 or 2 Children | 0 (0.0%) | 2 (33.3%) |
| 3 or 4 Children | 0 (0.0%) | 2 (100.0%) |
| 5 or more Children | 0 (0.0%) | 0 (0.0%) |
| Total | 2 (1.0%) | 4 (36.4%) |
Employment Characteristics in Marine on St Croix
Employment by Class of Employer in Marine on St Croix
Among the 347 employed individuals in Marine on St Croix, private company employees (202 | 58.2%), not-for-profit organizations (41 | 11.8%), and self-employed (not incorporated) (28 | 8.1%) make up the most common classes of employment.
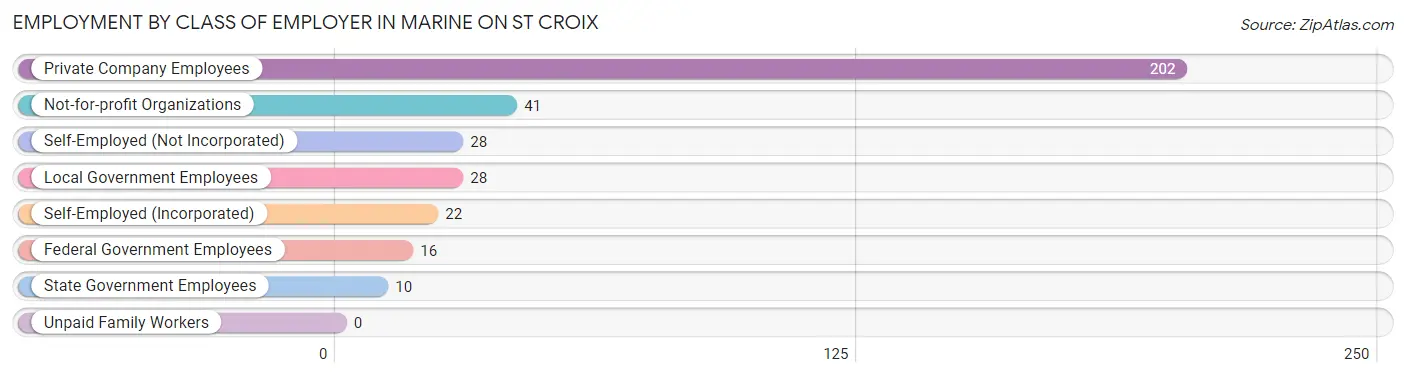
| Employer Class | # Employees | % Employees |
| Private Company Employees | 202 | 58.2% |
| Self-Employed (Incorporated) | 22 | 6.3% |
| Self-Employed (Not Incorporated) | 28 | 8.1% |
| Not-for-profit Organizations | 41 | 11.8% |
| Local Government Employees | 28 | 8.1% |
| State Government Employees | 10 | 2.9% |
| Federal Government Employees | 16 | 4.6% |
| Unpaid Family Workers | 0 | 0.0% |
| Total | 347 | 100.0% |
Employment Status by Age in Marine on St Croix
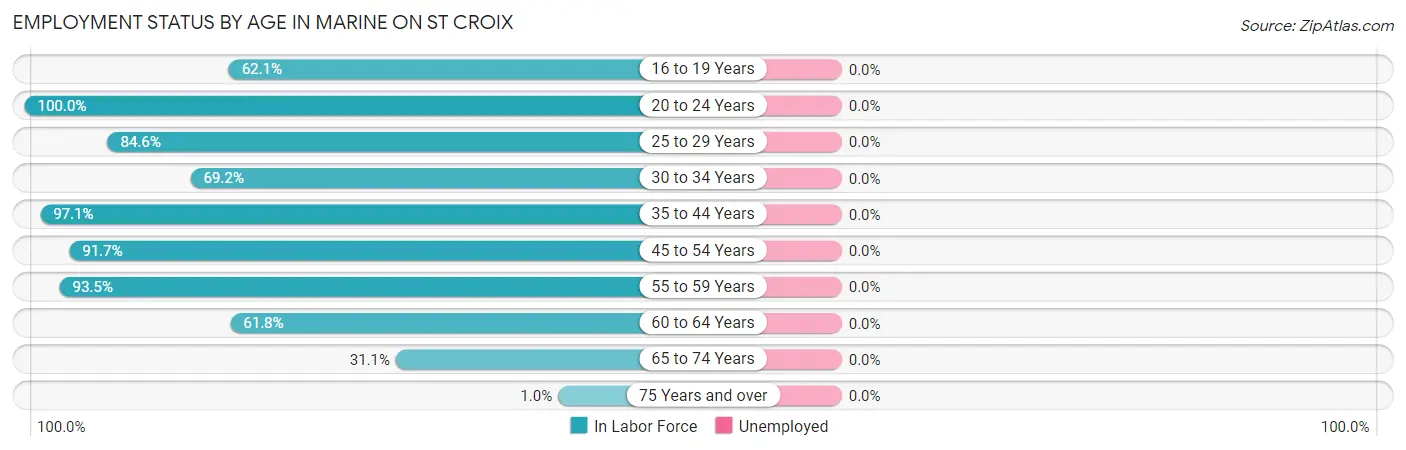
| Age Bracket | In Labor Force | Unemployed |
| 16 to 19 Years | 18 (62.1%) | 0 (0.0%) |
| 20 to 24 Years | 30 (100.0%) | 0 (0.0%) |
| 25 to 29 Years | 11 (84.6%) | 0 (0.0%) |
| 30 to 34 Years | 9 (69.2%) | 0 (0.0%) |
| 35 to 44 Years | 68 (97.1%) | 0 (0.0%) |
| 45 to 54 Years | 77 (91.7%) | 0 (0.0%) |
| 55 to 59 Years | 58 (93.5%) | 0 (0.0%) |
| 60 to 64 Years | 47 (61.8%) | 0 (0.0%) |
| 65 to 74 Years | 41 (31.1%) | 0 (0.0%) |
| 75 Years and over | 1 (1.0%) | 0 (0.0%) |
| Total | 360 (58.8%) | 0 (0.0%) |
Employment Status by Educational Attainment in Marine on St Croix
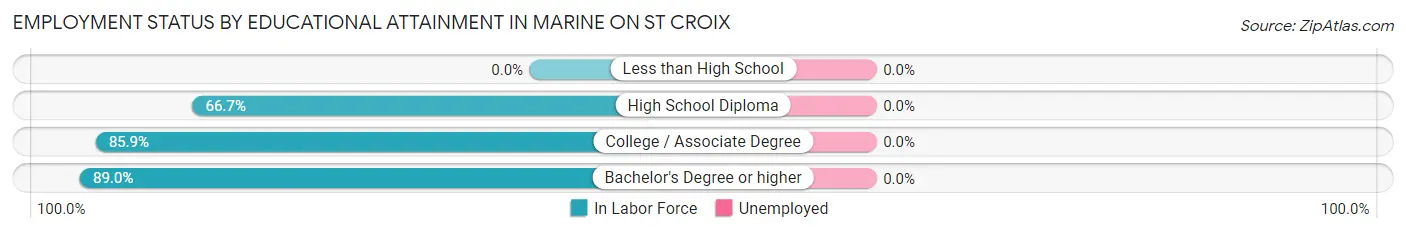
| Educational Attainment | In Labor Force | Unemployed |
| Less than High School | 0 (0.0%) | 0 (0.0%) |
| High School Diploma | 22 (66.7%) | 0 (0.0%) |
| College / Associate Degree | 61 (85.9%) | 0 (0.0%) |
| Bachelor's Degree or higher | 187 (89.0%) | 0 (0.0%) |
| Total | 270 (84.9%) | 0 (0.0%) |
Employment Occupations by Sex in Marine on St Croix
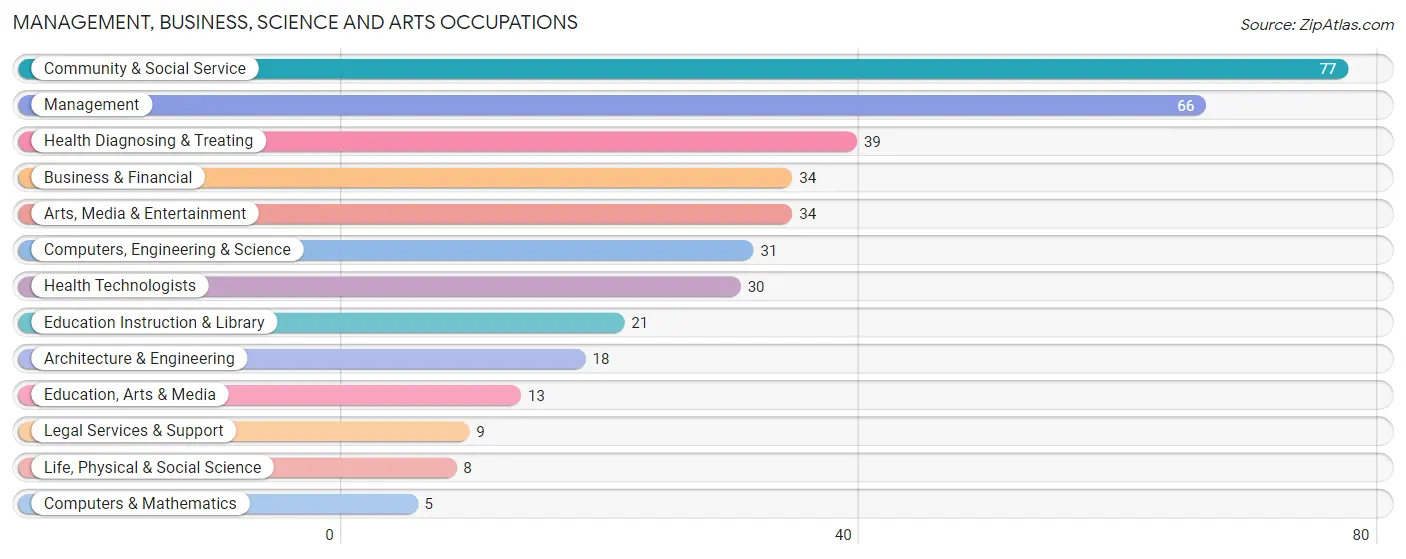
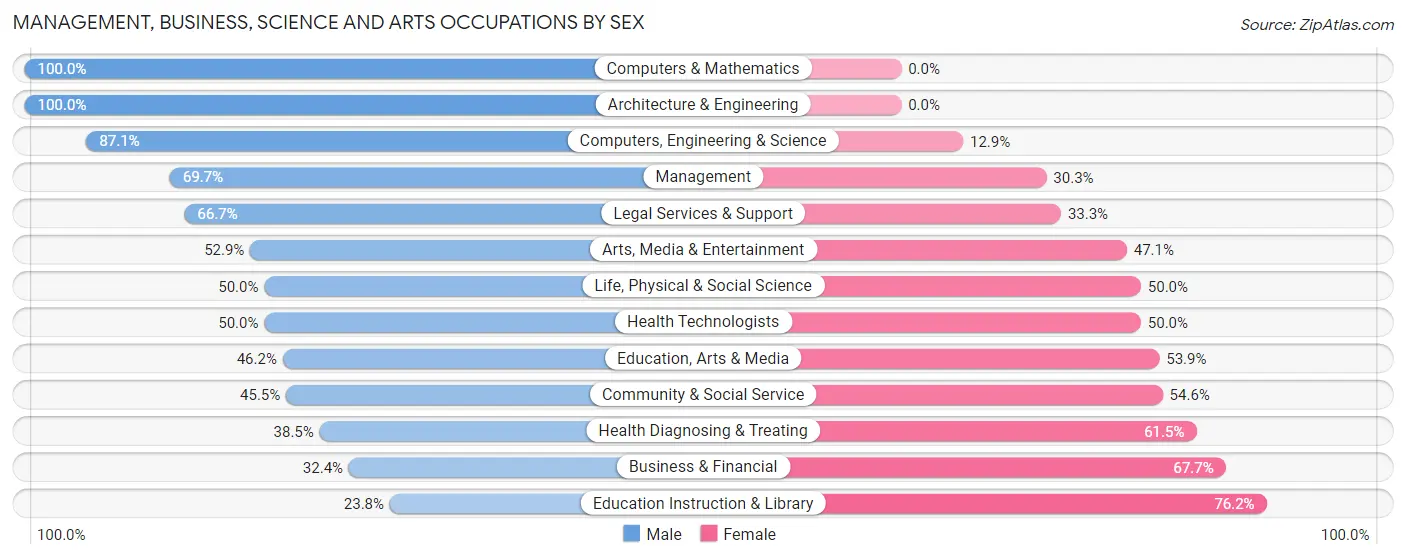
Management, Business, Science and Arts Occupations
The most common Management, Business, Science and Arts occupations in Marine on St Croix are Community & Social Service (77 | 21.4%), Management (66 | 18.3%), Health Diagnosing & Treating (39 | 10.8%), Business & Financial (34 | 9.4%), and Arts, Media & Entertainment (34 | 9.4%).
Management, Business, Science and Arts Occupations by Sex
Within the Management, Business, Science and Arts occupations in Marine on St Croix, the most male-oriented occupations are Computers & Mathematics (100.0%), Architecture & Engineering (100.0%), and Computers, Engineering & Science (87.1%), while the most female-oriented occupations are Education Instruction & Library (76.2%), Business & Financial (67.6%), and Health Diagnosing & Treating (61.5%).
| Occupation | Male | Female |
| Management | 46 (69.7%) | 20 (30.3%) |
| Business & Financial | 11 (32.4%) | 23 (67.6%) |
| Computers, Engineering & Science | 27 (87.1%) | 4 (12.9%) |
| Computers & Mathematics | 5 (100.0%) | 0 (0.0%) |
| Architecture & Engineering | 18 (100.0%) | 0 (0.0%) |
| Life, Physical & Social Science | 4 (50.0%) | 4 (50.0%) |
| Community & Social Service | 35 (45.5%) | 42 (54.5%) |
| Education, Arts & Media | 6 (46.2%) | 7 (53.8%) |
| Legal Services & Support | 6 (66.7%) | 3 (33.3%) |
| Education Instruction & Library | 5 (23.8%) | 16 (76.2%) |
| Arts, Media & Entertainment | 18 (52.9%) | 16 (47.1%) |
| Health Diagnosing & Treating | 15 (38.5%) | 24 (61.5%) |
| Health Technologists | 15 (50.0%) | 15 (50.0%) |
| Total (Category) | 134 (54.2%) | 113 (45.8%) |
| Total (Overall) | 187 (51.9%) | 173 (48.1%) |
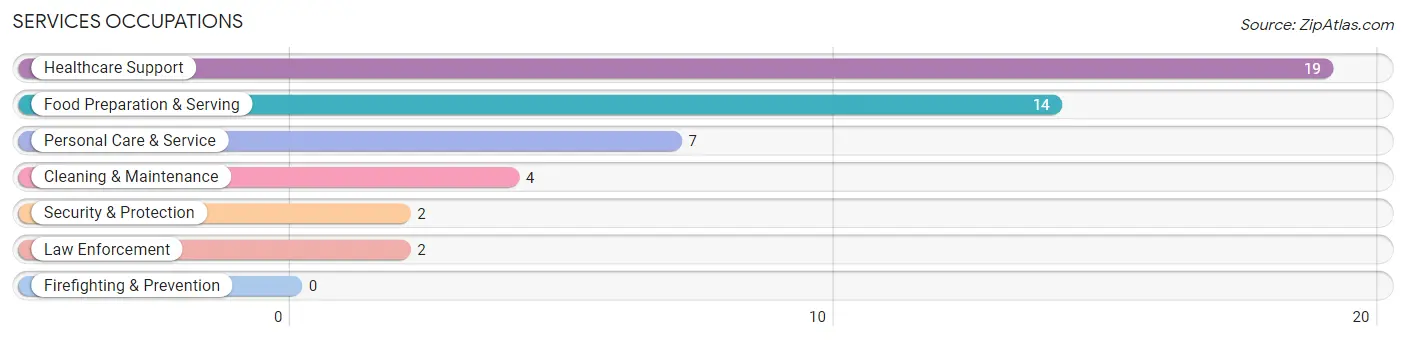
Services Occupations
The most common Services occupations in Marine on St Croix are Healthcare Support (19 | 5.3%), Food Preparation & Serving (14 | 3.9%), Personal Care & Service (7 | 1.9%), Cleaning & Maintenance (4 | 1.1%), and Security & Protection (2 | 0.6%).
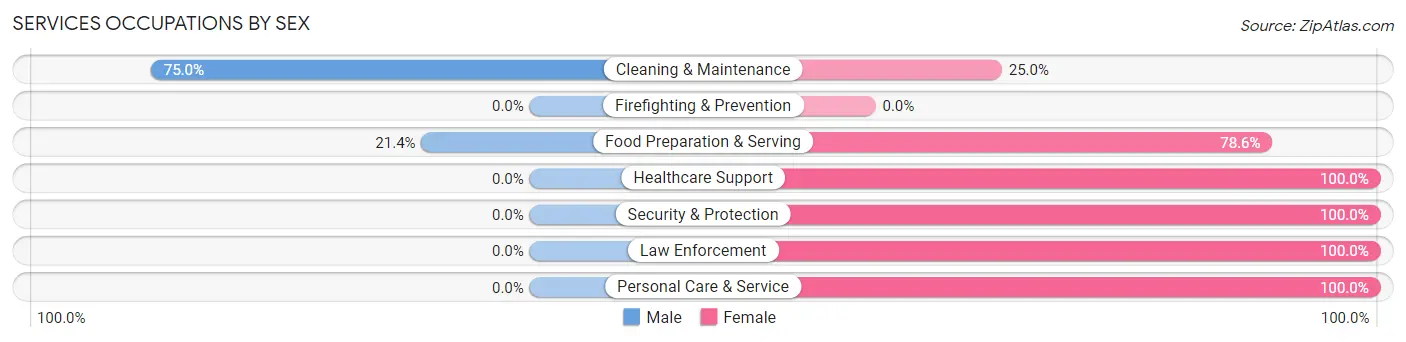
Services Occupations by Sex
Within the Services occupations in Marine on St Croix, the most male-oriented occupations are Cleaning & Maintenance (75.0%), and Food Preparation & Serving (21.4%), while the most female-oriented occupations are Healthcare Support (100.0%), Security & Protection (100.0%), and Law Enforcement (100.0%).
| Occupation | Male | Female |
| Healthcare Support | 0 (0.0%) | 19 (100.0%) |
| Security & Protection | 0 (0.0%) | 2 (100.0%) |
| Firefighting & Prevention | 0 (0.0%) | 0 (0.0%) |
| Law Enforcement | 0 (0.0%) | 2 (100.0%) |
| Food Preparation & Serving | 3 (21.4%) | 11 (78.6%) |
| Cleaning & Maintenance | 3 (75.0%) | 1 (25.0%) |
| Personal Care & Service | 0 (0.0%) | 7 (100.0%) |
| Total (Category) | 6 (13.0%) | 40 (87.0%) |
| Total (Overall) | 187 (51.9%) | 173 (48.1%) |
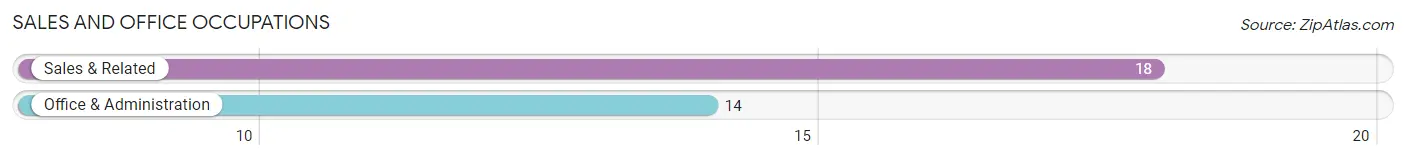
Sales and Office Occupations
The most common Sales and Office occupations in Marine on St Croix are Sales & Related (18 | 5.0%), and Office & Administration (14 | 3.9%).
Sales and Office Occupations by Sex
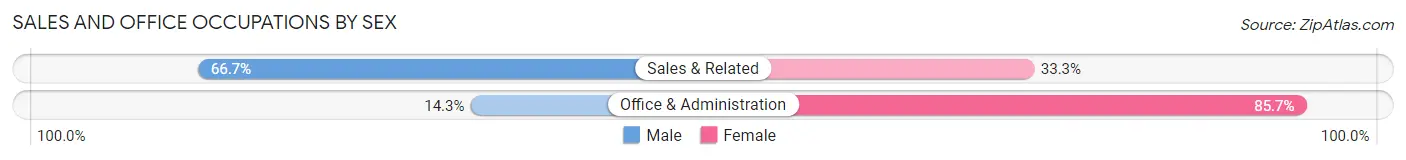
| Occupation | Male | Female |
| Sales & Related | 12 (66.7%) | 6 (33.3%) |
| Office & Administration | 2 (14.3%) | 12 (85.7%) |
| Total (Category) | 14 (43.8%) | 18 (56.2%) |
| Total (Overall) | 187 (51.9%) | 173 (48.1%) |
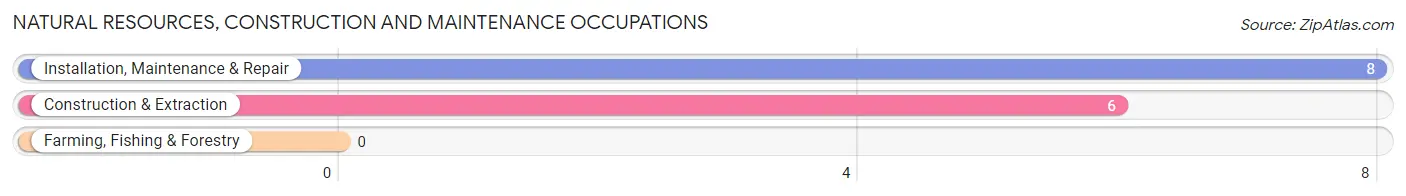
Natural Resources, Construction and Maintenance Occupations
The most common Natural Resources, Construction and Maintenance occupations in Marine on St Croix are Installation, Maintenance & Repair (8 | 2.2%), and Construction & Extraction (6 | 1.7%).
Natural Resources, Construction and Maintenance Occupations by Sex
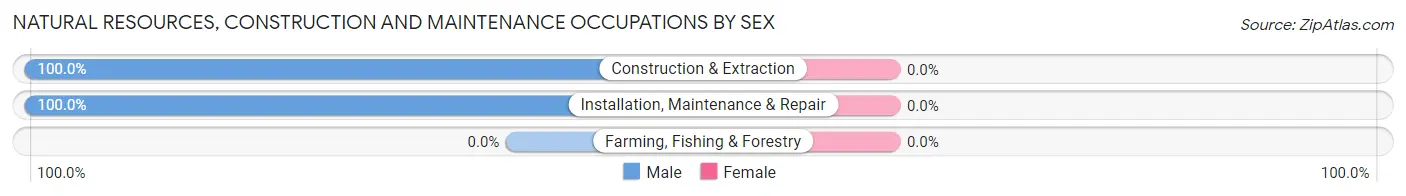
| Occupation | Male | Female |
| Farming, Fishing & Forestry | 0 (0.0%) | 0 (0.0%) |
| Construction & Extraction | 6 (100.0%) | 0 (0.0%) |
| Installation, Maintenance & Repair | 8 (100.0%) | 0 (0.0%) |
| Total (Category) | 14 (100.0%) | 0 (0.0%) |
| Total (Overall) | 187 (51.9%) | 173 (48.1%) |
Production, Transportation and Moving Occupations
The most common Production, Transportation and Moving occupations in Marine on St Croix are Transportation (12 | 3.3%), Production (5 | 1.4%), and Material Moving (4 | 1.1%).
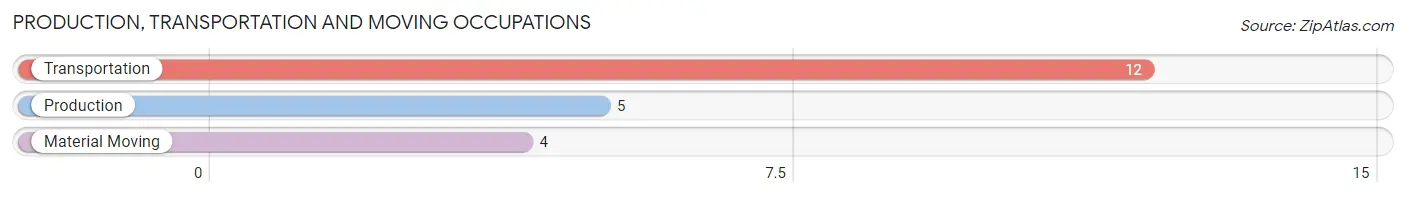
Production, Transportation and Moving Occupations by Sex
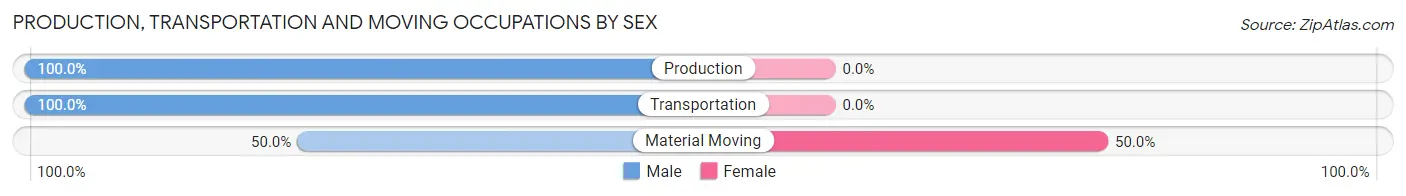
| Occupation | Male | Female |
| Production | 5 (100.0%) | 0 (0.0%) |
| Transportation | 12 (100.0%) | 0 (0.0%) |
| Material Moving | 2 (50.0%) | 2 (50.0%) |
| Total (Category) | 19 (90.5%) | 2 (9.5%) |
| Total (Overall) | 187 (51.9%) | 173 (48.1%) |
Employment Industries by Sex in Marine on St Croix
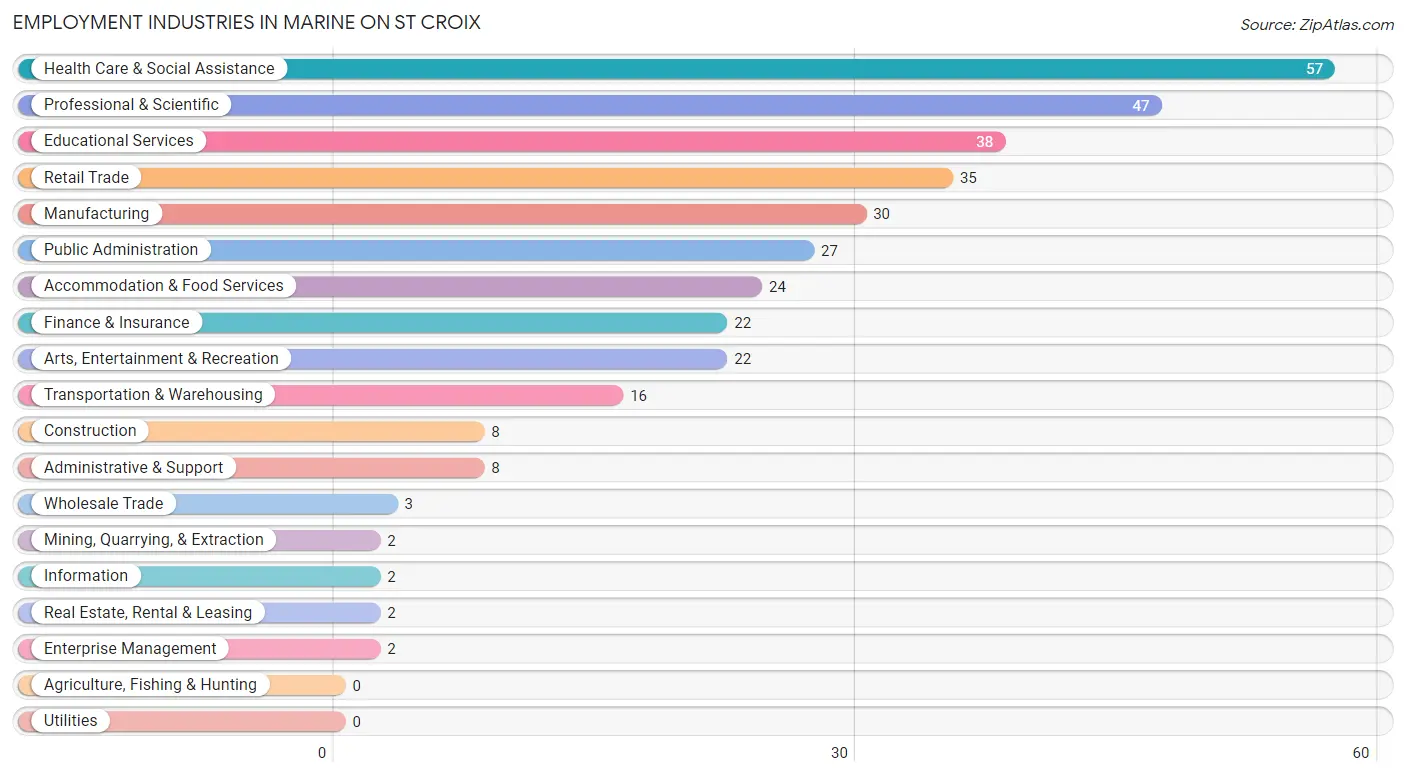
Employment Industries in Marine on St Croix
The major employment industries in Marine on St Croix include Health Care & Social Assistance (57 | 15.8%), Professional & Scientific (47 | 13.1%), Educational Services (38 | 10.6%), Retail Trade (35 | 9.7%), and Manufacturing (30 | 8.3%).
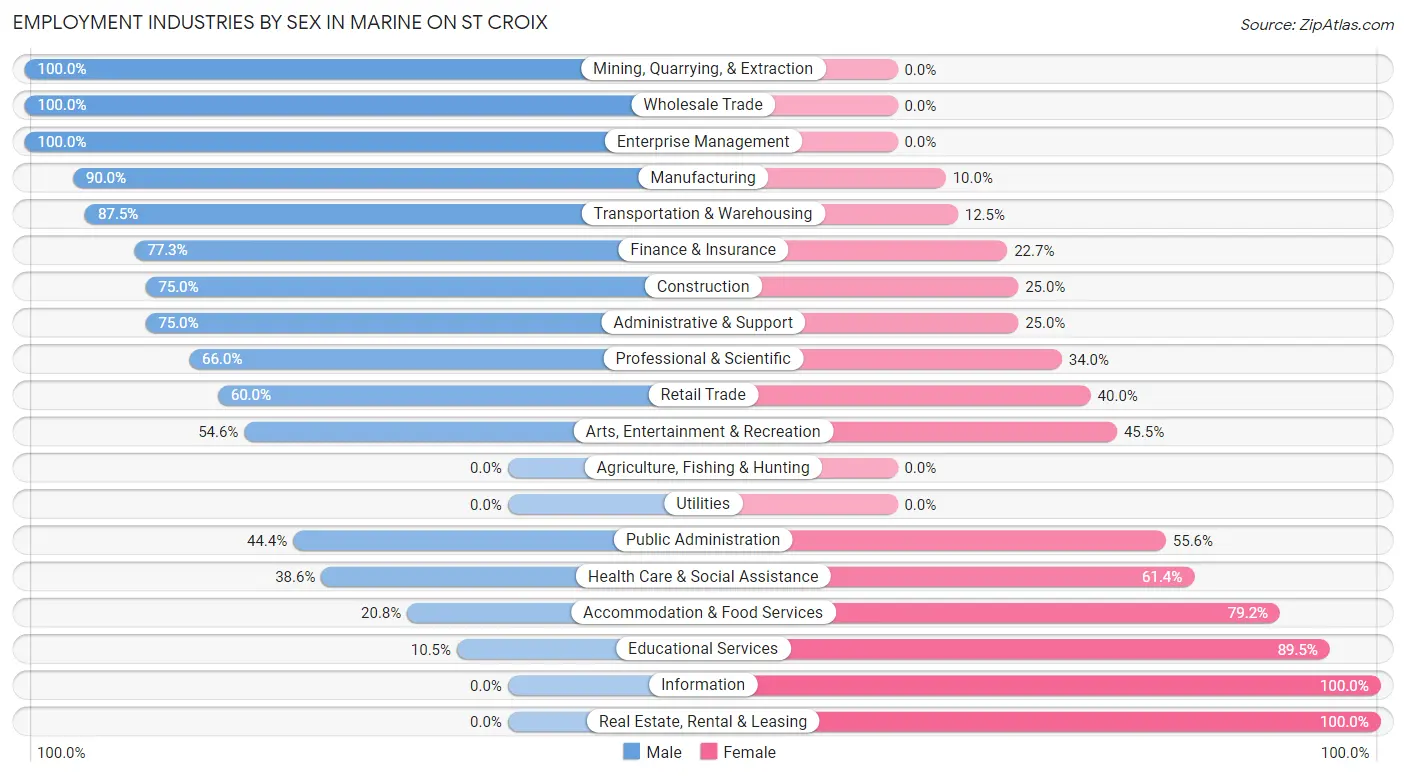
Employment Industries by Sex in Marine on St Croix
The Marine on St Croix industries that see more men than women are Mining, Quarrying, & Extraction (100.0%), Wholesale Trade (100.0%), and Enterprise Management (100.0%), whereas the industries that tend to have a higher number of women are Information (100.0%), Real Estate, Rental & Leasing (100.0%), and Educational Services (89.5%).
| Industry | Male | Female |
| Agriculture, Fishing & Hunting | 0 (0.0%) | 0 (0.0%) |
| Mining, Quarrying, & Extraction | 2 (100.0%) | 0 (0.0%) |
| Construction | 6 (75.0%) | 2 (25.0%) |
| Manufacturing | 27 (90.0%) | 3 (10.0%) |
| Wholesale Trade | 3 (100.0%) | 0 (0.0%) |
| Retail Trade | 21 (60.0%) | 14 (40.0%) |
| Transportation & Warehousing | 14 (87.5%) | 2 (12.5%) |
| Utilities | 0 (0.0%) | 0 (0.0%) |
| Information | 0 (0.0%) | 2 (100.0%) |
| Finance & Insurance | 17 (77.3%) | 5 (22.7%) |
| Real Estate, Rental & Leasing | 0 (0.0%) | 2 (100.0%) |
| Professional & Scientific | 31 (66.0%) | 16 (34.0%) |
| Enterprise Management | 2 (100.0%) | 0 (0.0%) |
| Administrative & Support | 6 (75.0%) | 2 (25.0%) |
| Educational Services | 4 (10.5%) | 34 (89.5%) |
| Health Care & Social Assistance | 22 (38.6%) | 35 (61.4%) |
| Arts, Entertainment & Recreation | 12 (54.5%) | 10 (45.5%) |
| Accommodation & Food Services | 5 (20.8%) | 19 (79.2%) |
| Public Administration | 12 (44.4%) | 15 (55.6%) |
| Total | 187 (51.9%) | 173 (48.1%) |
Education in Marine on St Croix
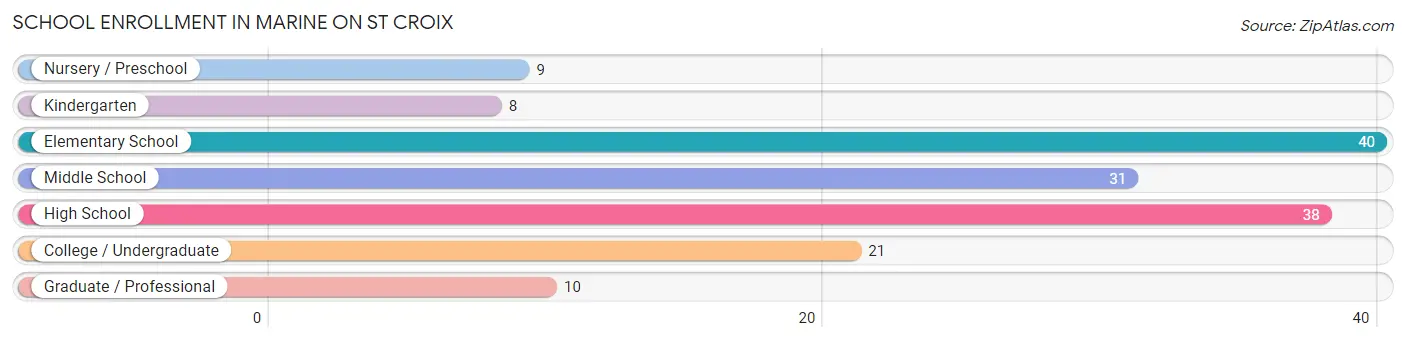
School Enrollment in Marine on St Croix
The most common levels of schooling among the 157 students in Marine on St Croix are elementary school (40 | 25.5%), high school (38 | 24.2%), and middle school (31 | 19.8%).
| School Level | # Students | % Students |
| Nursery / Preschool | 9 | 5.7% |
| Kindergarten | 8 | 5.1% |
| Elementary School | 40 | 25.5% |
| Middle School | 31 | 19.8% |
| High School | 38 | 24.2% |
| College / Undergraduate | 21 | 13.4% |
| Graduate / Professional | 10 | 6.4% |
| Total | 157 | 100.0% |
School Enrollment by Age by Funding Source in Marine on St Croix
Out of a total of 157 students who are enrolled in schools in Marine on St Croix, 48 (30.6%) attend a private institution, while the remaining 109 (69.4%) are enrolled in public schools. The age group of 3 to 4 year olds has the highest likelihood of being enrolled in private schools, with 6 (66.7% in the age bracket) enrolled. Conversely, the age group of 20 to 24 year olds has the lowest likelihood of being enrolled in a private school, with 16 (100.0% in the age bracket) attending a public institution.
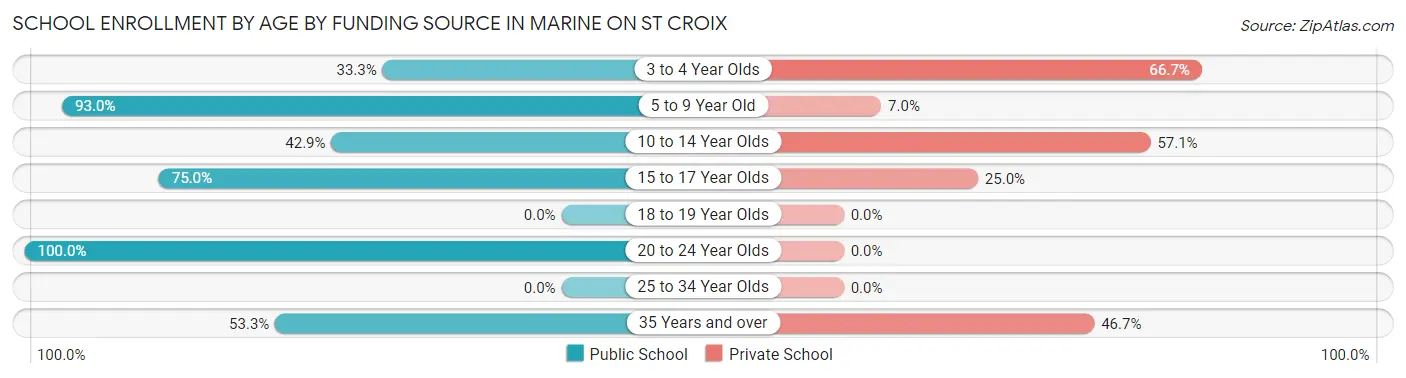
| Age Bracket | Public School | Private School |
| 3 to 4 Year Olds | 3 (33.3%) | 6 (66.7%) |
| 5 to 9 Year Old | 40 (93.0%) | 3 (7.0%) |
| 10 to 14 Year Olds | 18 (42.9%) | 24 (57.1%) |
| 15 to 17 Year Olds | 24 (75.0%) | 8 (25.0%) |
| 18 to 19 Year Olds | 0 (0.0%) | 0 (0.0%) |
| 20 to 24 Year Olds | 16 (100.0%) | 0 (0.0%) |
| 25 to 34 Year Olds | 0 (0.0%) | 0 (0.0%) |
| 35 Years and over | 8 (53.3%) | 7 (46.7%) |
| Total | 109 (69.4%) | 48 (30.6%) |
Educational Attainment by Field of Study in Marine on St Croix
Visual & performing arts (60 | 14.5%), social sciences (51 | 12.3%), science & technology (44 | 10.6%), business (36 | 8.7%), and education (36 | 8.7%) are the most common fields of study among 414 individuals in Marine on St Croix who have obtained a bachelor's degree or higher.
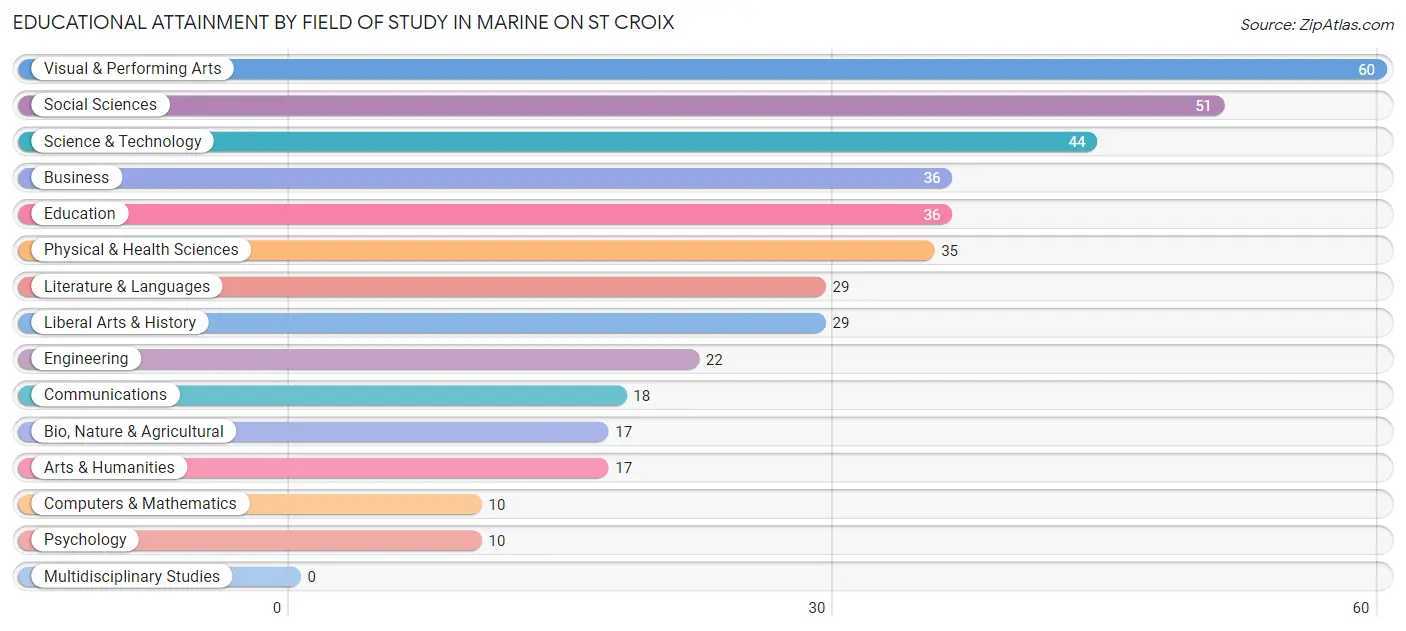
| Field of Study | # Graduates | % Graduates |
| Computers & Mathematics | 10 | 2.4% |
| Bio, Nature & Agricultural | 17 | 4.1% |
| Physical & Health Sciences | 35 | 8.5% |
| Psychology | 10 | 2.4% |
| Social Sciences | 51 | 12.3% |
| Engineering | 22 | 5.3% |
| Multidisciplinary Studies | 0 | 0.0% |
| Science & Technology | 44 | 10.6% |
| Business | 36 | 8.7% |
| Education | 36 | 8.7% |
| Literature & Languages | 29 | 7.0% |
| Liberal Arts & History | 29 | 7.0% |
| Visual & Performing Arts | 60 | 14.5% |
| Communications | 18 | 4.3% |
| Arts & Humanities | 17 | 4.1% |
| Total | 414 | 100.0% |
Transportation & Commute in Marine on St Croix
Vehicle Availability by Sex in Marine on St Croix
The most prevalent vehicle ownership categories in Marine on St Croix are males with 2 vehicles (92, accounting for 50.3%) and females with 2 vehicles (70, making up 56.1%).
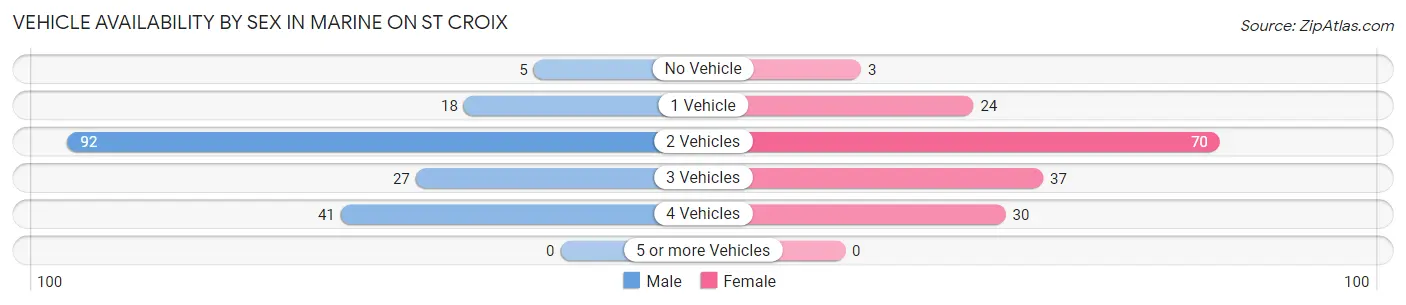
| Vehicles Available | Male | Female |
| No Vehicle | 5 (2.7%) | 3 (1.8%) |
| 1 Vehicle | 18 (9.8%) | 24 (14.6%) |
| 2 Vehicles | 92 (50.3%) | 70 (42.7%) |
| 3 Vehicles | 27 (14.7%) | 37 (22.6%) |
| 4 Vehicles | 41 (22.4%) | 30 (18.3%) |
| 5 or more Vehicles | 0 (0.0%) | 0 (0.0%) |
| Total | 183 (100.0%) | 164 (100.0%) |
Commute Time in Marine on St Croix
The most frequently occuring commute durations in Marine on St Croix are 45 to 59 minutes (66 commuters, 25.4%), 20 to 24 minutes (39 commuters, 15.0%), and 40 to 44 minutes (32 commuters, 12.3%).
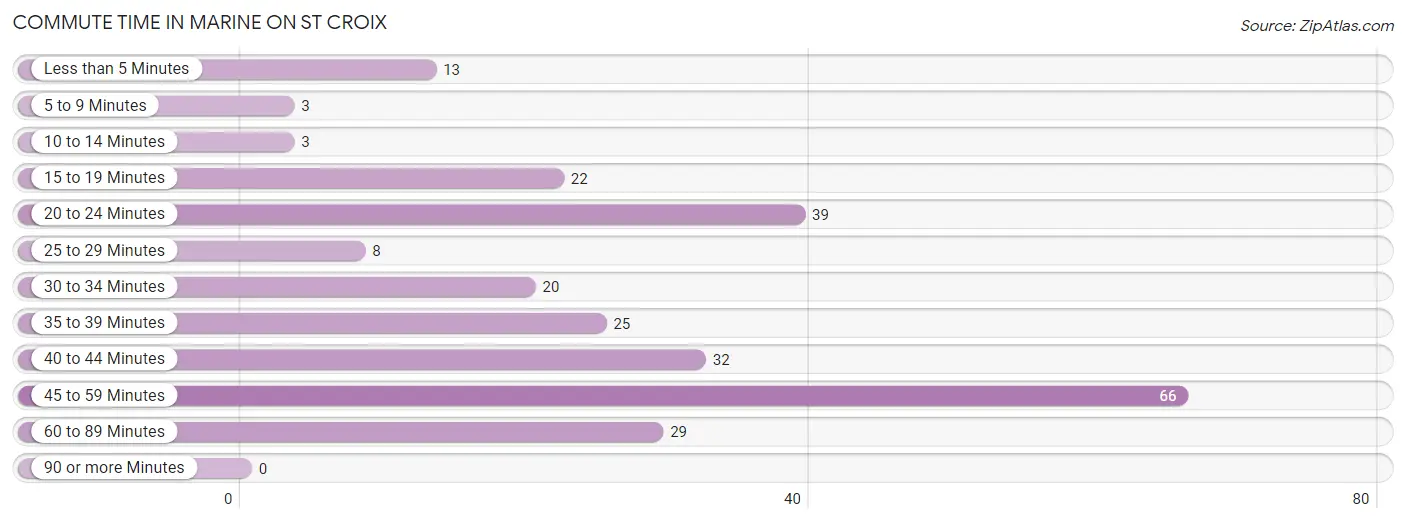
| Commute Time | # Commuters | % Commuters |
| Less than 5 Minutes | 13 | 5.0% |
| 5 to 9 Minutes | 3 | 1.1% |
| 10 to 14 Minutes | 3 | 1.1% |
| 15 to 19 Minutes | 22 | 8.5% |
| 20 to 24 Minutes | 39 | 15.0% |
| 25 to 29 Minutes | 8 | 3.1% |
| 30 to 34 Minutes | 20 | 7.7% |
| 35 to 39 Minutes | 25 | 9.6% |
| 40 to 44 Minutes | 32 | 12.3% |
| 45 to 59 Minutes | 66 | 25.4% |
| 60 to 89 Minutes | 29 | 11.2% |
| 90 or more Minutes | 0 | 0.0% |
Commute Time by Sex in Marine on St Croix
The most common commute times in Marine on St Croix are 45 to 59 minutes (47 commuters, 33.1%) for males and 20 to 24 minutes (24 commuters, 20.3%) for females.
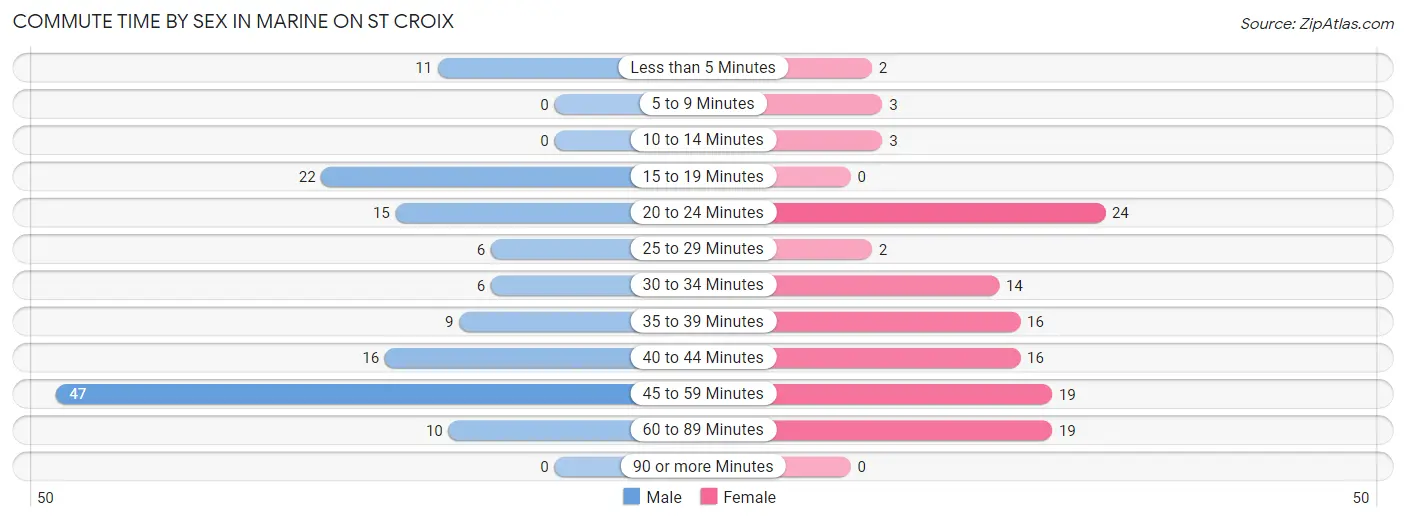
| Commute Time | Male | Female |
| Less than 5 Minutes | 11 (7.7%) | 2 (1.7%) |
| 5 to 9 Minutes | 0 (0.0%) | 3 (2.5%) |
| 10 to 14 Minutes | 0 (0.0%) | 3 (2.5%) |
| 15 to 19 Minutes | 22 (15.5%) | 0 (0.0%) |
| 20 to 24 Minutes | 15 (10.6%) | 24 (20.3%) |
| 25 to 29 Minutes | 6 (4.2%) | 2 (1.7%) |
| 30 to 34 Minutes | 6 (4.2%) | 14 (11.9%) |
| 35 to 39 Minutes | 9 (6.3%) | 16 (13.6%) |
| 40 to 44 Minutes | 16 (11.3%) | 16 (13.6%) |
| 45 to 59 Minutes | 47 (33.1%) | 19 (16.1%) |
| 60 to 89 Minutes | 10 (7.0%) | 19 (16.1%) |
| 90 or more Minutes | 0 (0.0%) | 0 (0.0%) |
Time of Departure to Work by Sex in Marine on St Croix
The most frequent times of departure to work in Marine on St Croix are 8:00 AM to 8:29 AM (28, 19.7%) for males and 8:00 AM to 8:29 AM (30, 25.4%) for females.
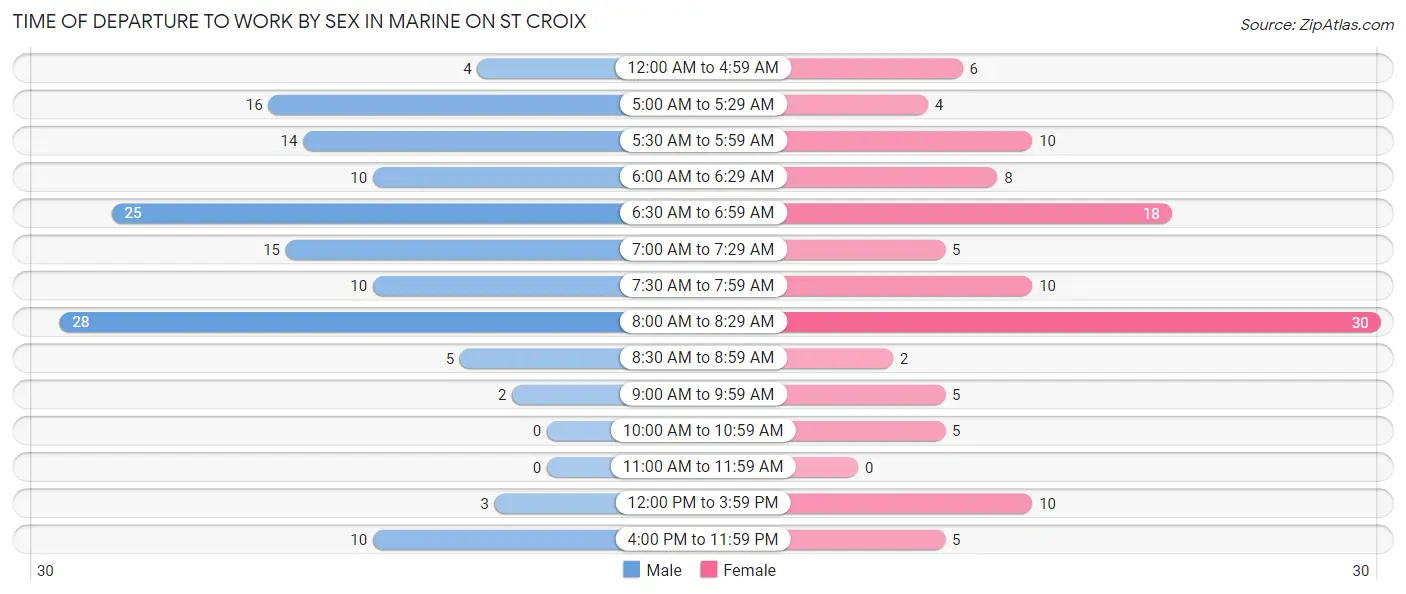
| Time of Departure | Male | Female |
| 12:00 AM to 4:59 AM | 4 (2.8%) | 6 (5.1%) |
| 5:00 AM to 5:29 AM | 16 (11.3%) | 4 (3.4%) |
| 5:30 AM to 5:59 AM | 14 (9.9%) | 10 (8.5%) |
| 6:00 AM to 6:29 AM | 10 (7.0%) | 8 (6.8%) |
| 6:30 AM to 6:59 AM | 25 (17.6%) | 18 (15.2%) |
| 7:00 AM to 7:29 AM | 15 (10.6%) | 5 (4.2%) |
| 7:30 AM to 7:59 AM | 10 (7.0%) | 10 (8.5%) |
| 8:00 AM to 8:29 AM | 28 (19.7%) | 30 (25.4%) |
| 8:30 AM to 8:59 AM | 5 (3.5%) | 2 (1.7%) |
| 9:00 AM to 9:59 AM | 2 (1.4%) | 5 (4.2%) |
| 10:00 AM to 10:59 AM | 0 (0.0%) | 5 (4.2%) |
| 11:00 AM to 11:59 AM | 0 (0.0%) | 0 (0.0%) |
| 12:00 PM to 3:59 PM | 3 (2.1%) | 10 (8.5%) |
| 4:00 PM to 11:59 PM | 10 (7.0%) | 5 (4.2%) |
| Total | 142 (100.0%) | 118 (100.0%) |
Housing Occupancy in Marine on St Croix
Occupancy by Ownership in Marine on St Croix
Of the total 310 dwellings in Marine on St Croix, owner-occupied units account for 297 (95.8%), while renter-occupied units make up 13 (4.2%).
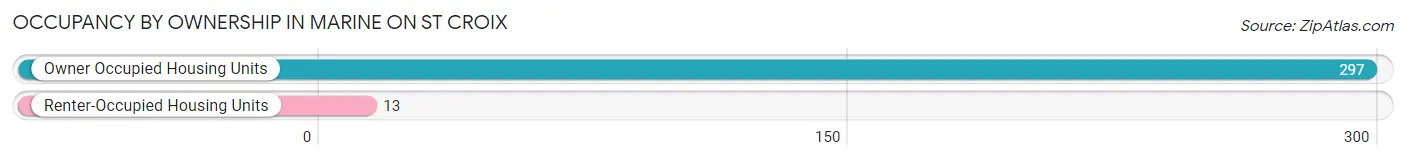
| Occupancy | # Housing Units | % Housing Units |
| Owner Occupied Housing Units | 297 | 95.8% |
| Renter-Occupied Housing Units | 13 | 4.2% |
| Total Occupied Housing Units | 310 | 100.0% |
Occupancy by Household Size in Marine on St Croix
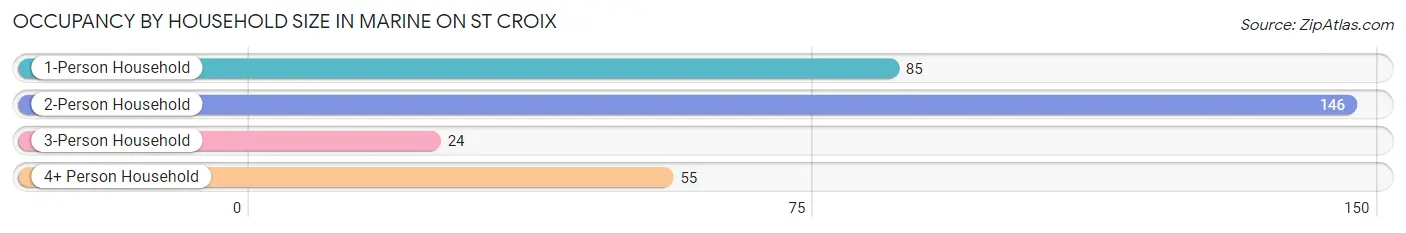
| Household Size | # Housing Units | % Housing Units |
| 1-Person Household | 85 | 27.4% |
| 2-Person Household | 146 | 47.1% |
| 3-Person Household | 24 | 7.7% |
| 4+ Person Household | 55 | 17.7% |
| Total Housing Units | 310 | 100.0% |
Occupancy by Ownership by Household Size in Marine on St Croix
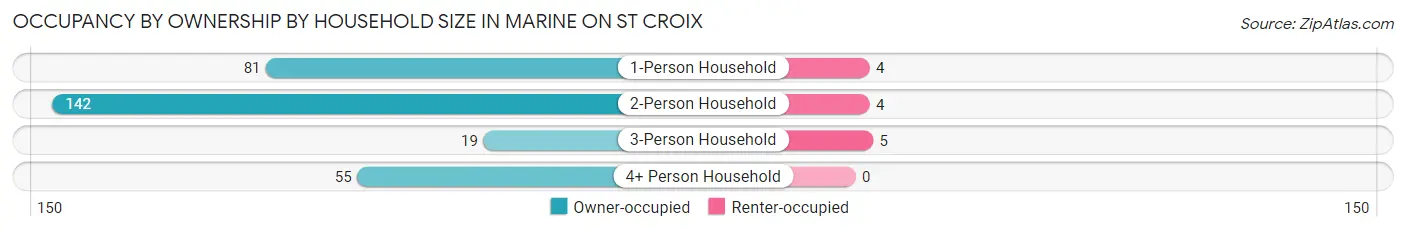
| Household Size | Owner-occupied | Renter-occupied |
| 1-Person Household | 81 (95.3%) | 4 (4.7%) |
| 2-Person Household | 142 (97.3%) | 4 (2.7%) |
| 3-Person Household | 19 (79.2%) | 5 (20.8%) |
| 4+ Person Household | 55 (100.0%) | 0 (0.0%) |
| Total Housing Units | 297 (95.8%) | 13 (4.2%) |
Occupancy by Educational Attainment in Marine on St Croix
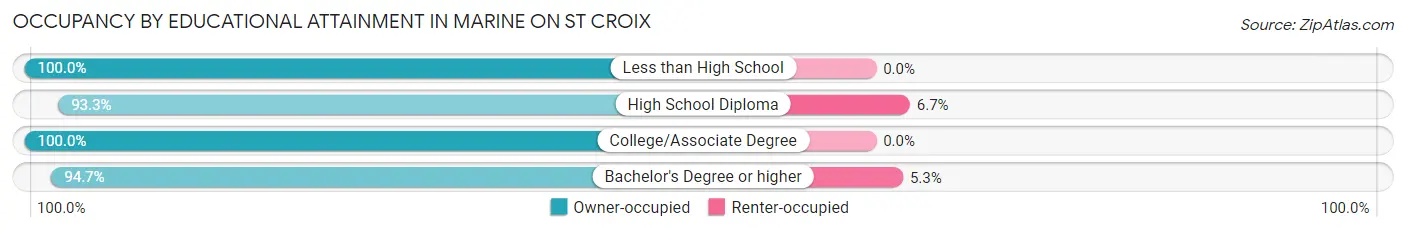
| Household Size | Owner-occupied | Renter-occupied |
| Less than High School | 2 (100.0%) | 0 (0.0%) |
| High School Diploma | 28 (93.3%) | 2 (6.7%) |
| College/Associate Degree | 71 (100.0%) | 0 (0.0%) |
| Bachelor's Degree or higher | 196 (94.7%) | 11 (5.3%) |
Occupancy by Age of Householder in Marine on St Croix
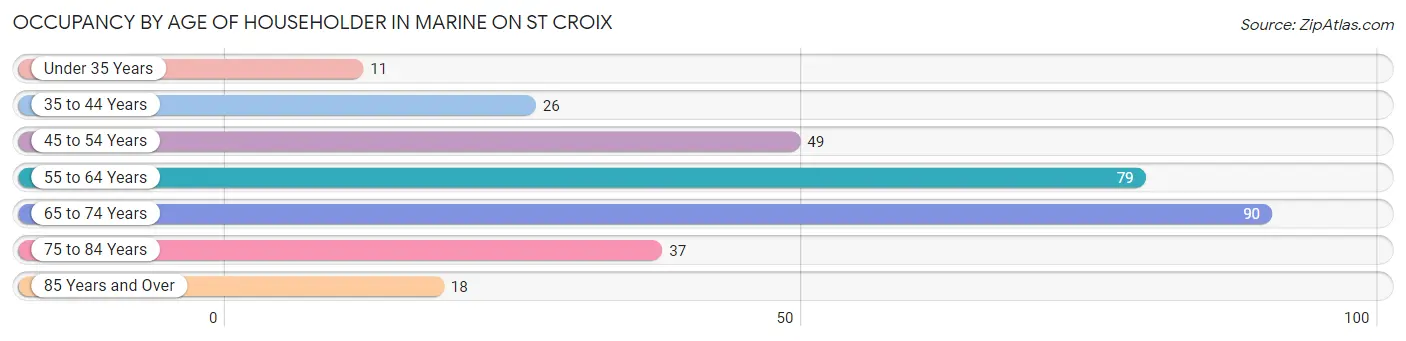
| Age Bracket | # Households | % Households |
| Under 35 Years | 11 | 3.5% |
| 35 to 44 Years | 26 | 8.4% |
| 45 to 54 Years | 49 | 15.8% |
| 55 to 64 Years | 79 | 25.5% |
| 65 to 74 Years | 90 | 29.0% |
| 75 to 84 Years | 37 | 11.9% |
| 85 Years and Over | 18 | 5.8% |
| Total | 310 | 100.0% |
Housing Finances in Marine on St Croix
Median Income by Occupancy in Marine on St Croix
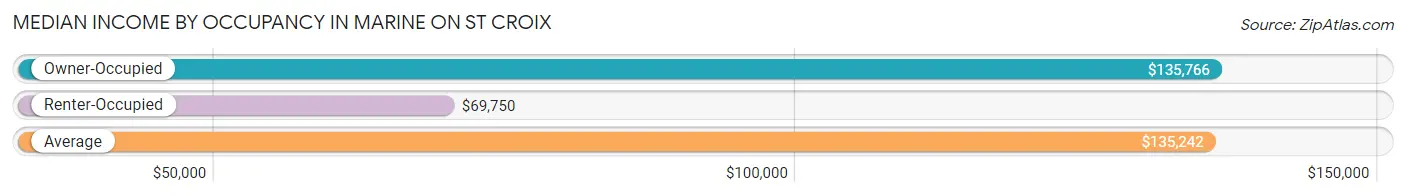
| Occupancy Type | # Households | Median Income |
| Owner-Occupied | 297 (95.8%) | $135,766 |
| Renter-Occupied | 13 (4.2%) | $69,750 |
| Average | 310 (100.0%) | $135,242 |
Occupancy by Householder Income Bracket in Marine on St Croix
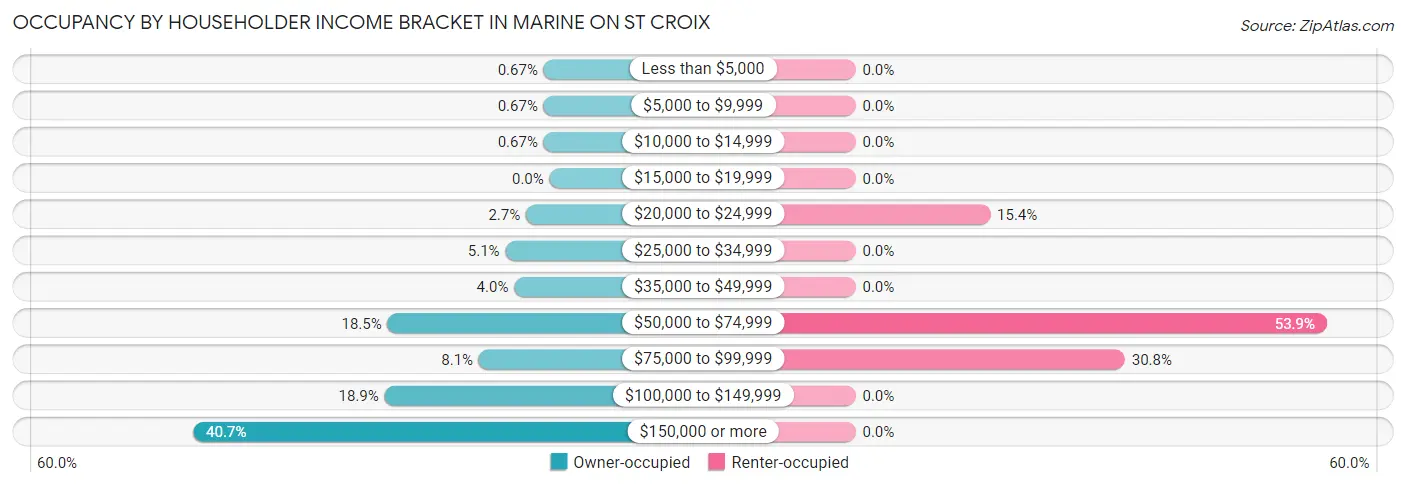
| Income Bracket | Owner-occupied | Renter-occupied |
| Less than $5,000 | 2 (0.7%) | 0 (0.0%) |
| $5,000 to $9,999 | 2 (0.7%) | 0 (0.0%) |
| $10,000 to $14,999 | 2 (0.7%) | 0 (0.0%) |
| $15,000 to $19,999 | 0 (0.0%) | 0 (0.0%) |
| $20,000 to $24,999 | 8 (2.7%) | 2 (15.4%) |
| $25,000 to $34,999 | 15 (5.1%) | 0 (0.0%) |
| $35,000 to $49,999 | 12 (4.0%) | 0 (0.0%) |
| $50,000 to $74,999 | 55 (18.5%) | 7 (53.8%) |
| $75,000 to $99,999 | 24 (8.1%) | 4 (30.8%) |
| $100,000 to $149,999 | 56 (18.9%) | 0 (0.0%) |
| $150,000 or more | 121 (40.7%) | 0 (0.0%) |
| Total | 297 (100.0%) | 13 (100.0%) |
Monthly Housing Cost Tiers in Marine on St Croix
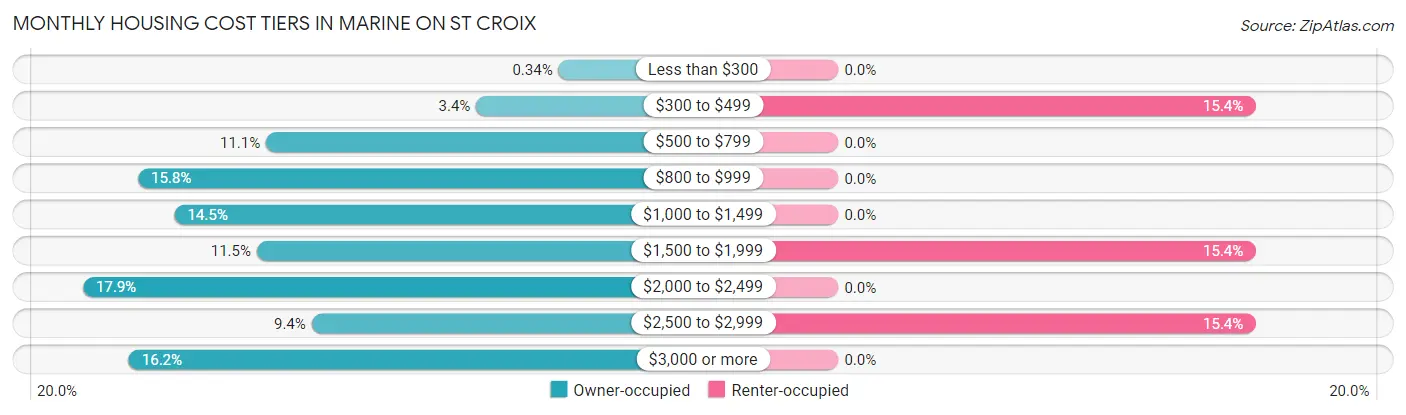
| Monthly Cost | Owner-occupied | Renter-occupied |
| Less than $300 | 1 (0.3%) | 0 (0.0%) |
| $300 to $499 | 10 (3.4%) | 2 (15.4%) |
| $500 to $799 | 33 (11.1%) | 0 (0.0%) |
| $800 to $999 | 47 (15.8%) | 0 (0.0%) |
| $1,000 to $1,499 | 43 (14.5%) | 0 (0.0%) |
| $1,500 to $1,999 | 34 (11.5%) | 2 (15.4%) |
| $2,000 to $2,499 | 53 (17.8%) | 0 (0.0%) |
| $2,500 to $2,999 | 28 (9.4%) | 2 (15.4%) |
| $3,000 or more | 48 (16.2%) | 0 (0.0%) |
| Total | 297 (100.0%) | 13 (100.0%) |
Physical Housing Characteristics in Marine on St Croix
Housing Structures in Marine on St Croix
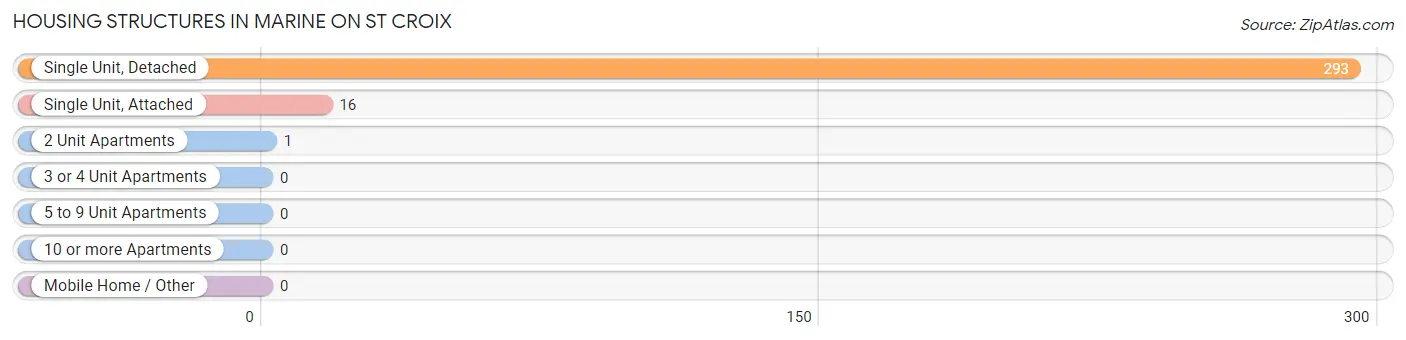
| Structure Type | # Housing Units | % Housing Units |
| Single Unit, Detached | 293 | 94.5% |
| Single Unit, Attached | 16 | 5.2% |
| 2 Unit Apartments | 1 | 0.3% |
| 3 or 4 Unit Apartments | 0 | 0.0% |
| 5 to 9 Unit Apartments | 0 | 0.0% |
| 10 or more Apartments | 0 | 0.0% |
| Mobile Home / Other | 0 | 0.0% |
| Total | 310 | 100.0% |
Housing Structures by Occupancy in Marine on St Croix
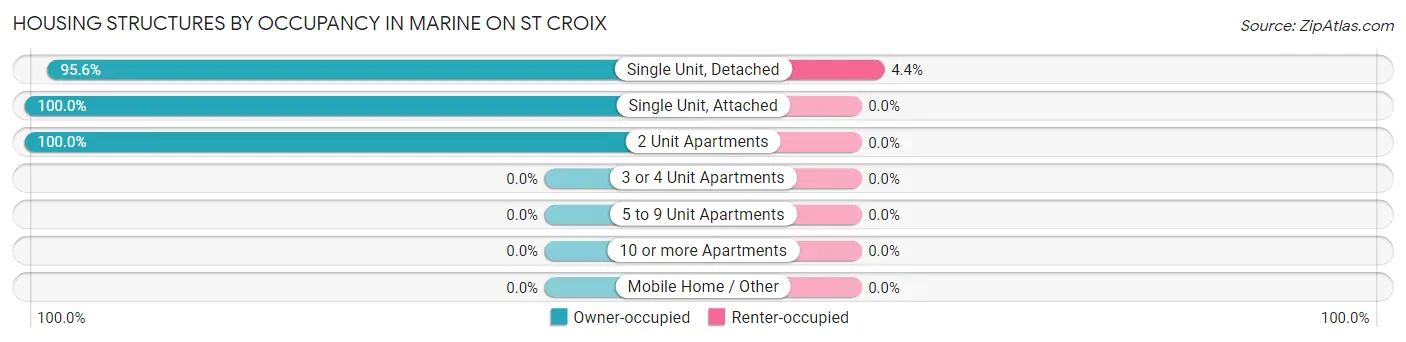
| Structure Type | Owner-occupied | Renter-occupied |
| Single Unit, Detached | 280 (95.6%) | 13 (4.4%) |
| Single Unit, Attached | 16 (100.0%) | 0 (0.0%) |
| 2 Unit Apartments | 1 (100.0%) | 0 (0.0%) |
| 3 or 4 Unit Apartments | 0 (0.0%) | 0 (0.0%) |
| 5 to 9 Unit Apartments | 0 (0.0%) | 0 (0.0%) |
| 10 or more Apartments | 0 (0.0%) | 0 (0.0%) |
| Mobile Home / Other | 0 (0.0%) | 0 (0.0%) |
| Total | 297 (95.8%) | 13 (4.2%) |
Housing Structures by Number of Rooms in Marine on St Croix
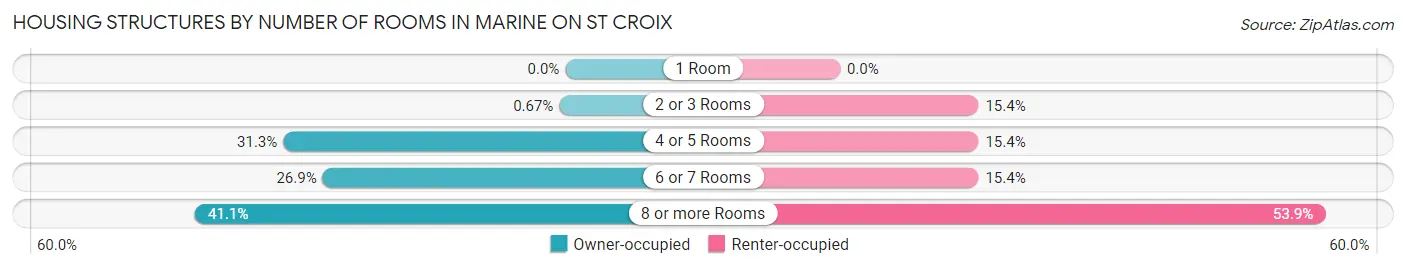
| Number of Rooms | Owner-occupied | Renter-occupied |
| 1 Room | 0 (0.0%) | 0 (0.0%) |
| 2 or 3 Rooms | 2 (0.7%) | 2 (15.4%) |
| 4 or 5 Rooms | 93 (31.3%) | 2 (15.4%) |
| 6 or 7 Rooms | 80 (26.9%) | 2 (15.4%) |
| 8 or more Rooms | 122 (41.1%) | 7 (53.8%) |
| Total | 297 (100.0%) | 13 (100.0%) |
Housing Structure by Heating Type in Marine on St Croix
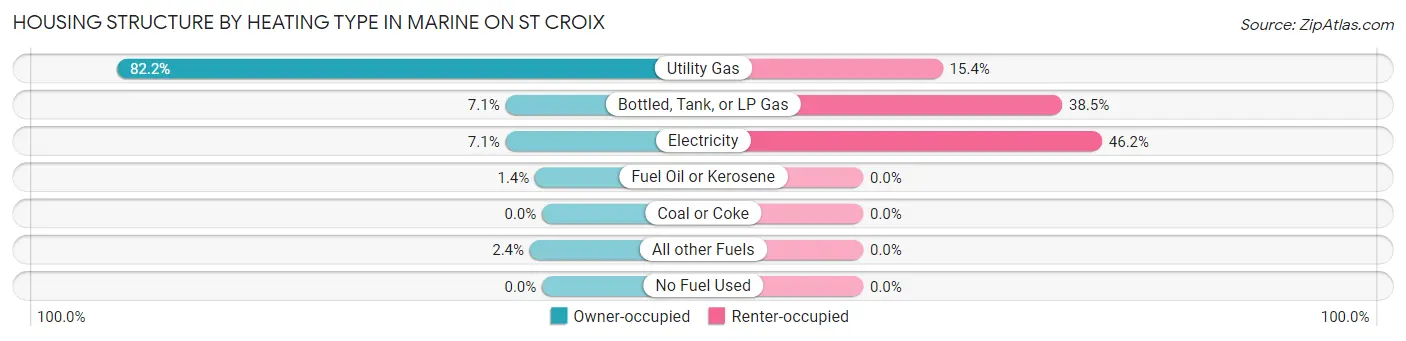
| Heating Type | Owner-occupied | Renter-occupied |
| Utility Gas | 244 (82.2%) | 2 (15.4%) |
| Bottled, Tank, or LP Gas | 21 (7.1%) | 5 (38.5%) |
| Electricity | 21 (7.1%) | 6 (46.2%) |
| Fuel Oil or Kerosene | 4 (1.3%) | 0 (0.0%) |
| Coal or Coke | 0 (0.0%) | 0 (0.0%) |
| All other Fuels | 7 (2.4%) | 0 (0.0%) |
| No Fuel Used | 0 (0.0%) | 0 (0.0%) |
| Total | 297 (100.0%) | 13 (100.0%) |
Household Vehicle Usage in Marine on St Croix
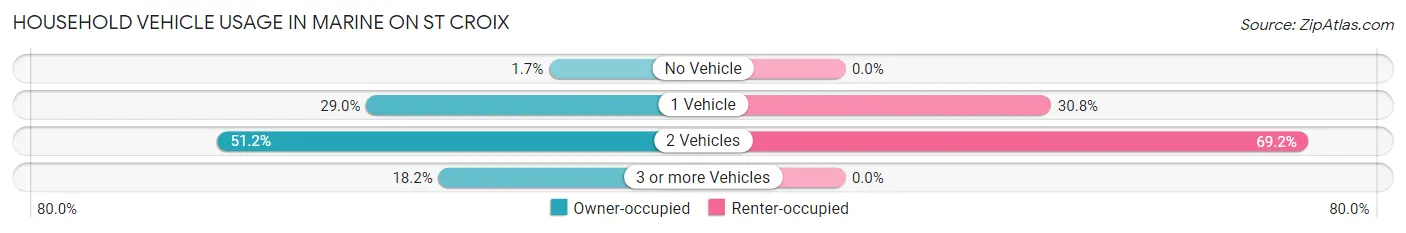
| Vehicles per Household | Owner-occupied | Renter-occupied |
| No Vehicle | 5 (1.7%) | 0 (0.0%) |
| 1 Vehicle | 86 (29.0%) | 4 (30.8%) |
| 2 Vehicles | 152 (51.2%) | 9 (69.2%) |
| 3 or more Vehicles | 54 (18.2%) | 0 (0.0%) |
| Total | 297 (100.0%) | 13 (100.0%) |
Real Estate & Mortgages in Marine on St Croix
Real Estate and Mortgage Overview in Marine on St Croix
| Characteristic | Without Mortgage | With Mortgage |
| Housing Units | 116 | 181 |
| Median Property Value | $421,400 | $479,200 |
| Median Household Income | $118,750 | $97 |
| Monthly Housing Costs | $842 | $48 |
| Real Estate Taxes | $3,863 | $2 |
Property Value by Mortgage Status in Marine on St Croix
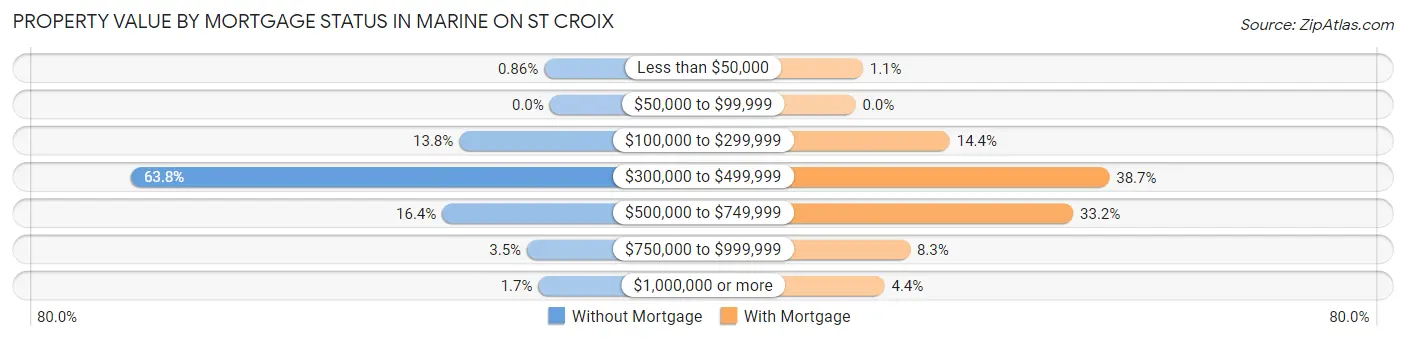
| Property Value | Without Mortgage | With Mortgage |
| Less than $50,000 | 1 (0.9%) | 2 (1.1%) |
| $50,000 to $99,999 | 0 (0.0%) | 0 (0.0%) |
| $100,000 to $299,999 | 16 (13.8%) | 26 (14.4%) |
| $300,000 to $499,999 | 74 (63.8%) | 70 (38.7%) |
| $500,000 to $749,999 | 19 (16.4%) | 60 (33.2%) |
| $750,000 to $999,999 | 4 (3.5%) | 15 (8.3%) |
| $1,000,000 or more | 2 (1.7%) | 8 (4.4%) |
| Total | 116 (100.0%) | 181 (100.0%) |
Household Income by Mortgage Status in Marine on St Croix
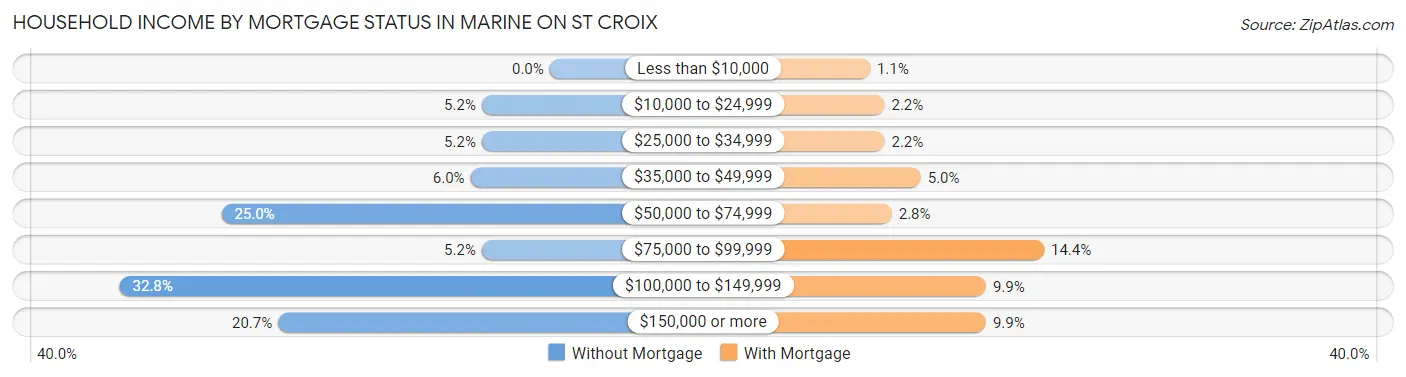
| Household Income | Without Mortgage | With Mortgage |
| Less than $10,000 | 0 (0.0%) | 2 (1.1%) |
| $10,000 to $24,999 | 6 (5.2%) | 4 (2.2%) |
| $25,000 to $34,999 | 6 (5.2%) | 4 (2.2%) |
| $35,000 to $49,999 | 7 (6.0%) | 9 (5.0%) |
| $50,000 to $74,999 | 29 (25.0%) | 5 (2.8%) |
| $75,000 to $99,999 | 6 (5.2%) | 26 (14.4%) |
| $100,000 to $149,999 | 38 (32.8%) | 18 (9.9%) |
| $150,000 or more | 24 (20.7%) | 18 (9.9%) |
| Total | 116 (100.0%) | 181 (100.0%) |
Property Value to Household Income Ratio in Marine on St Croix
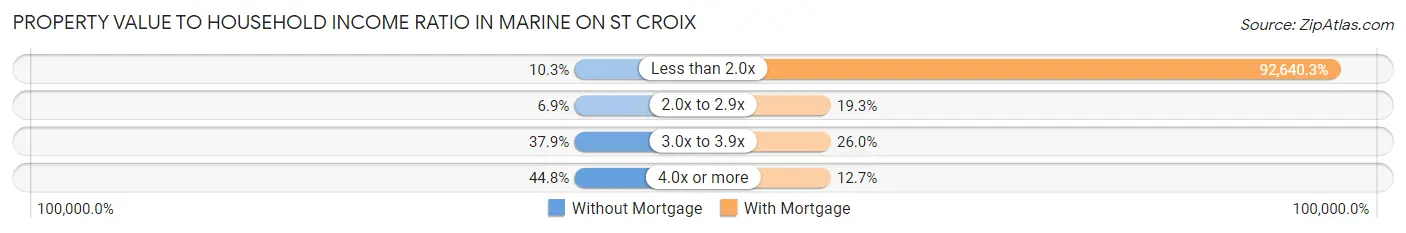
| Value-to-Income Ratio | Without Mortgage | With Mortgage |
| Less than 2.0x | 12 (10.3%) | 167,679 (92,640.3%) |
| 2.0x to 2.9x | 8 (6.9%) | 35 (19.3%) |
| 3.0x to 3.9x | 44 (37.9%) | 47 (26.0%) |
| 4.0x or more | 52 (44.8%) | 23 (12.7%) |
| Total | 116 (100.0%) | 181 (100.0%) |
Real Estate Taxes by Mortgage Status in Marine on St Croix
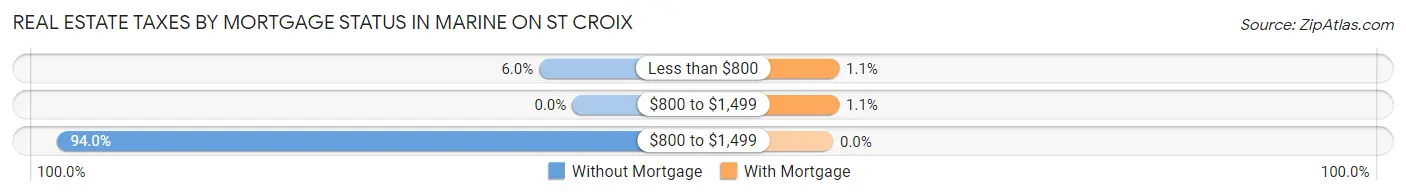
| Property Taxes | Without Mortgage | With Mortgage |
| Less than $800 | 7 (6.0%) | 2 (1.1%) |
| $800 to $1,499 | 0 (0.0%) | 2 (1.1%) |
| $800 to $1,499 | 109 (94.0%) | 0 (0.0%) |
| Total | 116 (100.0%) | 181 (100.0%) |
Health & Disability in Marine on St Croix
Health Insurance Coverage by Age in Marine on St Croix
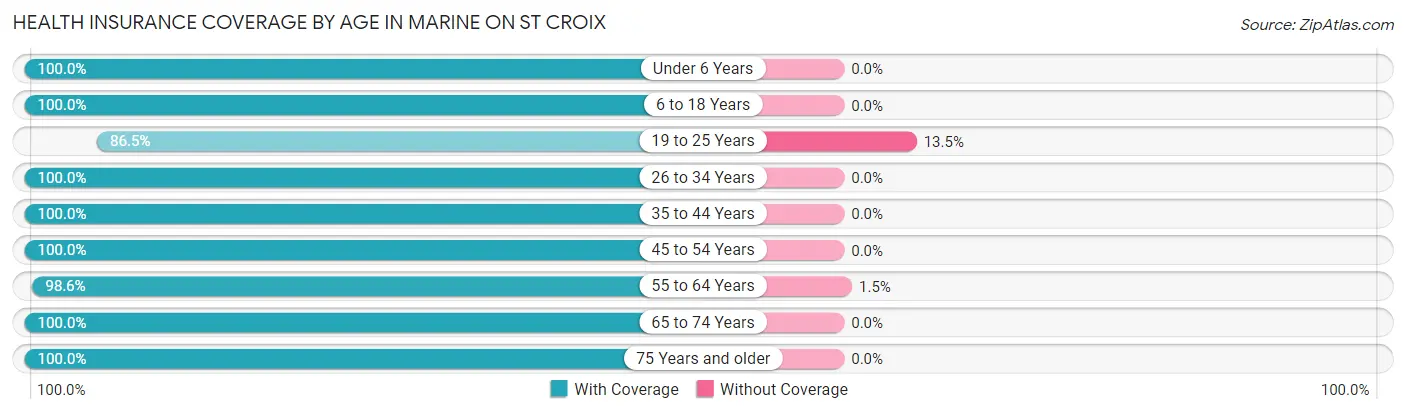
| Age Bracket | With Coverage | Without Coverage |
| Under 6 Years | 25 (100.0%) | 0 (0.0%) |
| 6 to 18 Years | 113 (100.0%) | 0 (0.0%) |
| 19 to 25 Years | 32 (86.5%) | 5 (13.5%) |
| 26 to 34 Years | 19 (100.0%) | 0 (0.0%) |
| 35 to 44 Years | 70 (100.0%) | 0 (0.0%) |
| 45 to 54 Years | 84 (100.0%) | 0 (0.0%) |
| 55 to 64 Years | 136 (98.6%) | 2 (1.5%) |
| 65 to 74 Years | 132 (100.0%) | 0 (0.0%) |
| 75 Years and older | 103 (100.0%) | 0 (0.0%) |
| Total | 714 (99.0%) | 7 (1.0%) |
Health Insurance Coverage by Citizenship Status in Marine on St Croix
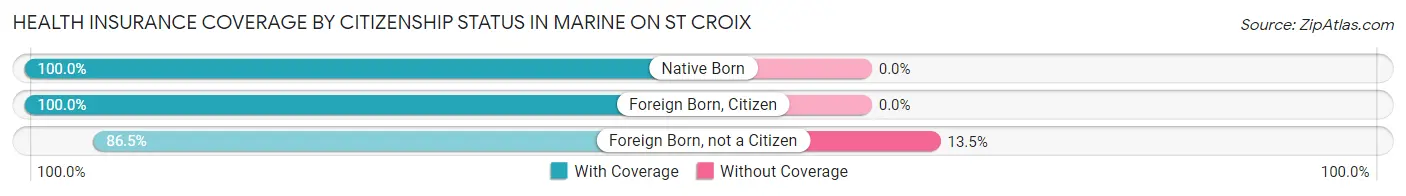
| Citizenship Status | With Coverage | Without Coverage |
| Native Born | 25 (100.0%) | 0 (0.0%) |
| Foreign Born, Citizen | 113 (100.0%) | 0 (0.0%) |
| Foreign Born, not a Citizen | 32 (86.5%) | 5 (13.5%) |
Health Insurance Coverage by Household Income in Marine on St Croix
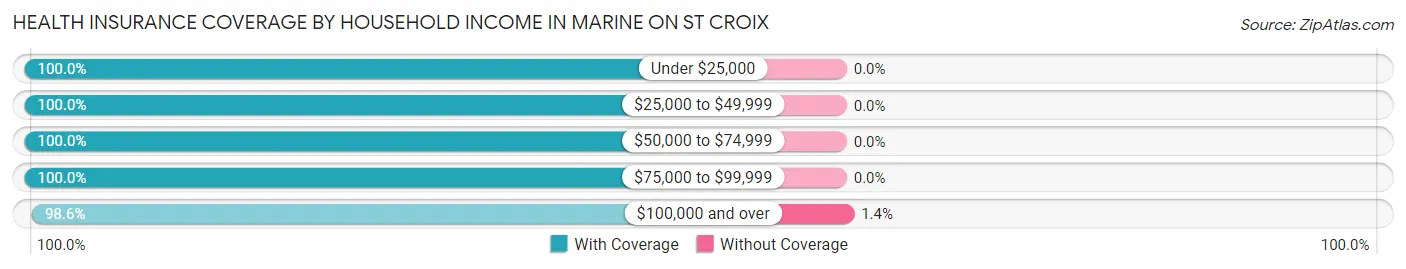
| Household Income | With Coverage | Without Coverage |
| Under $25,000 | 24 (100.0%) | 0 (0.0%) |
| $25,000 to $49,999 | 45 (100.0%) | 0 (0.0%) |
| $50,000 to $74,999 | 96 (100.0%) | 0 (0.0%) |
| $75,000 to $99,999 | 51 (100.0%) | 0 (0.0%) |
| $100,000 and over | 498 (98.6%) | 7 (1.4%) |
Public vs Private Health Insurance Coverage by Age in Marine on St Croix
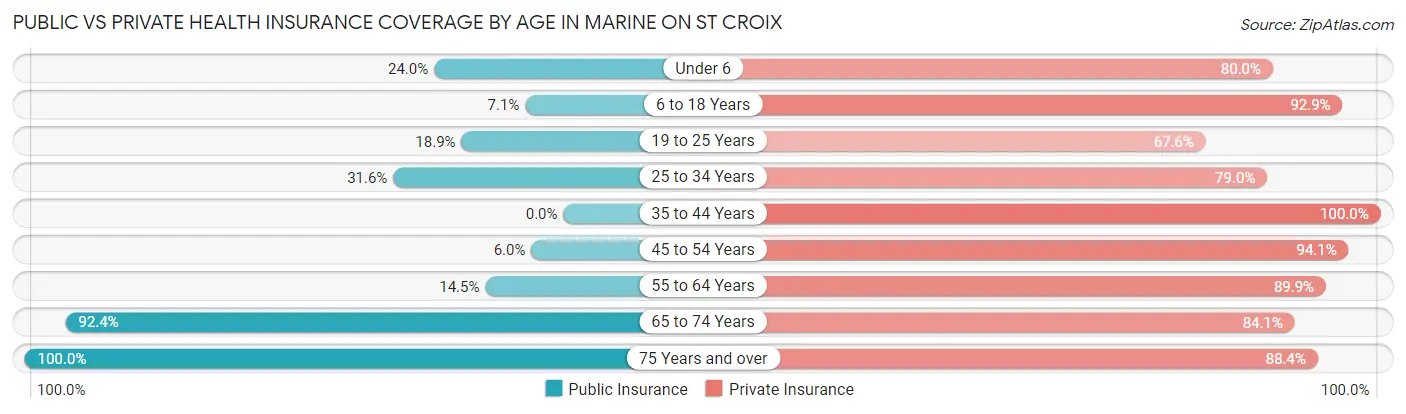
| Age Bracket | Public Insurance | Private Insurance |
| Under 6 | 6 (24.0%) | 20 (80.0%) |
| 6 to 18 Years | 8 (7.1%) | 105 (92.9%) |
| 19 to 25 Years | 7 (18.9%) | 25 (67.6%) |
| 25 to 34 Years | 6 (31.6%) | 15 (78.9%) |
| 35 to 44 Years | 0 (0.0%) | 70 (100.0%) |
| 45 to 54 Years | 5 (5.9%) | 79 (94.1%) |
| 55 to 64 Years | 20 (14.5%) | 124 (89.9%) |
| 65 to 74 Years | 122 (92.4%) | 111 (84.1%) |
| 75 Years and over | 103 (100.0%) | 91 (88.3%) |
| Total | 277 (38.4%) | 640 (88.8%) |
Disability Status by Sex by Age in Marine on St Croix
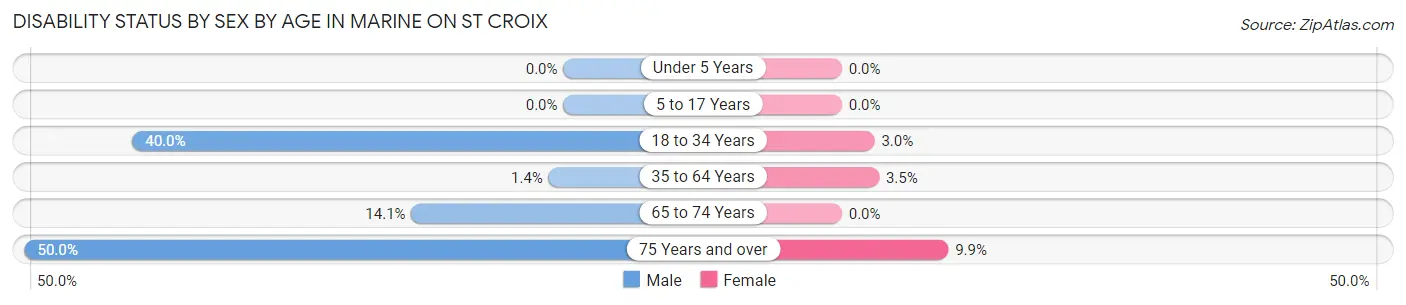
| Age Bracket | Male | Female |
| Under 5 Years | 0 (0.0%) | 0 (0.0%) |
| 5 to 17 Years | 0 (0.0%) | 0 (0.0%) |
| 18 to 34 Years | 10 (40.0%) | 1 (3.0%) |
| 35 to 64 Years | 2 (1.4%) | 5 (3.5%) |
| 65 to 74 Years | 11 (14.1%) | 0 (0.0%) |
| 75 Years and over | 11 (50.0%) | 8 (9.9%) |
Disability Class by Sex by Age in Marine on St Croix
Disability Class: Hearing Difficulty
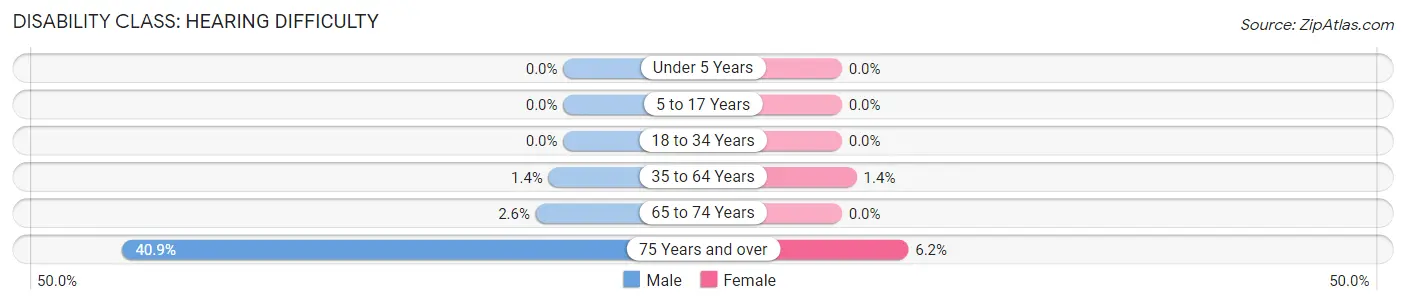
| Age Bracket | Male | Female |
| Under 5 Years | 0 (0.0%) | 0 (0.0%) |
| 5 to 17 Years | 0 (0.0%) | 0 (0.0%) |
| 18 to 34 Years | 0 (0.0%) | 0 (0.0%) |
| 35 to 64 Years | 2 (1.4%) | 2 (1.4%) |
| 65 to 74 Years | 2 (2.6%) | 0 (0.0%) |
| 75 Years and over | 9 (40.9%) | 5 (6.2%) |
Disability Class: Vision Difficulty
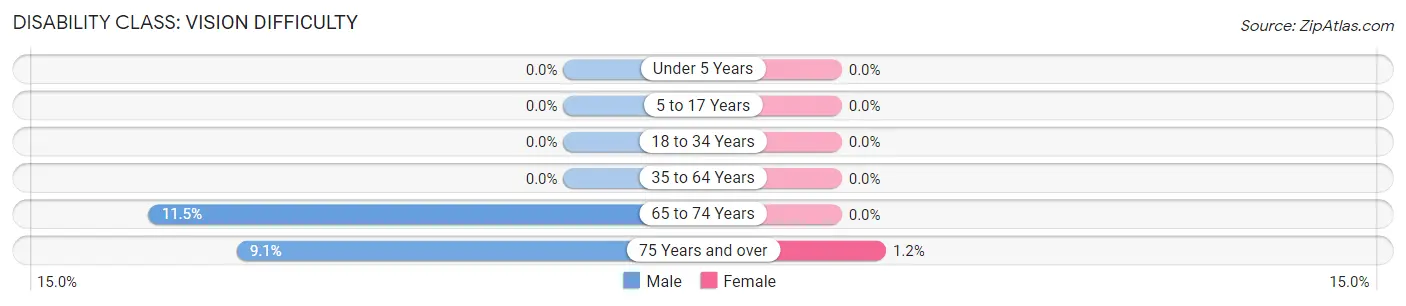
| Age Bracket | Male | Female |
| Under 5 Years | 0 (0.0%) | 0 (0.0%) |
| 5 to 17 Years | 0 (0.0%) | 0 (0.0%) |
| 18 to 34 Years | 0 (0.0%) | 0 (0.0%) |
| 35 to 64 Years | 0 (0.0%) | 0 (0.0%) |
| 65 to 74 Years | 9 (11.5%) | 0 (0.0%) |
| 75 Years and over | 2 (9.1%) | 1 (1.2%) |
Disability Class: Cognitive Difficulty
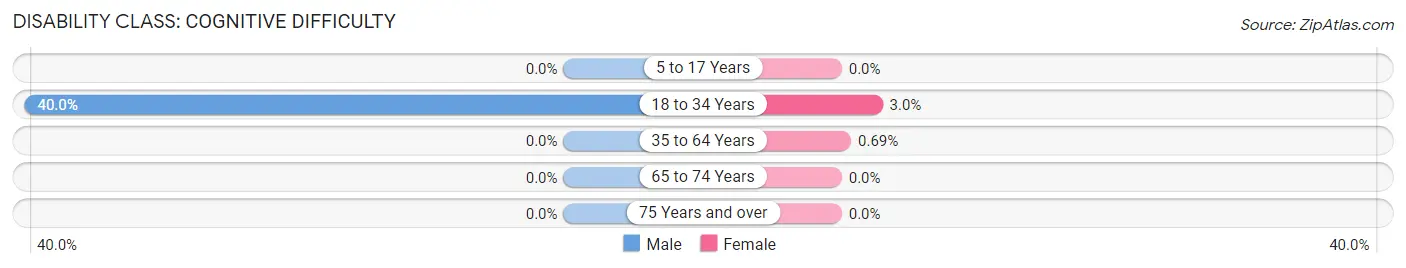
| Age Bracket | Male | Female |
| 5 to 17 Years | 0 (0.0%) | 0 (0.0%) |
| 18 to 34 Years | 10 (40.0%) | 1 (3.0%) |
| 35 to 64 Years | 0 (0.0%) | 1 (0.7%) |
| 65 to 74 Years | 0 (0.0%) | 0 (0.0%) |
| 75 Years and over | 0 (0.0%) | 0 (0.0%) |
Disability Class: Ambulatory Difficulty

| Age Bracket | Male | Female |
| 5 to 17 Years | 0 (0.0%) | 0 (0.0%) |
| 18 to 34 Years | 0 (0.0%) | 0 (0.0%) |
| 35 to 64 Years | 0 (0.0%) | 0 (0.0%) |
| 65 to 74 Years | 0 (0.0%) | 0 (0.0%) |
| 75 Years and over | 2 (9.1%) | 1 (1.2%) |
Disability Class: Self-Care Difficulty
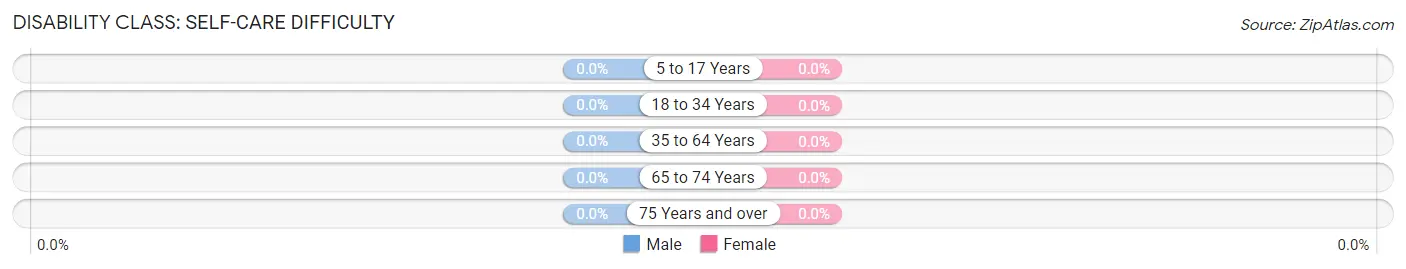
| Age Bracket | Male | Female |
| 5 to 17 Years | 0 (0.0%) | 0 (0.0%) |
| 18 to 34 Years | 0 (0.0%) | 0 (0.0%) |
| 35 to 64 Years | 0 (0.0%) | 0 (0.0%) |
| 65 to 74 Years | 0 (0.0%) | 0 (0.0%) |
| 75 Years and over | 0 (0.0%) | 0 (0.0%) |
Technology Access in Marine on St Croix
Computing Device Access in Marine on St Croix
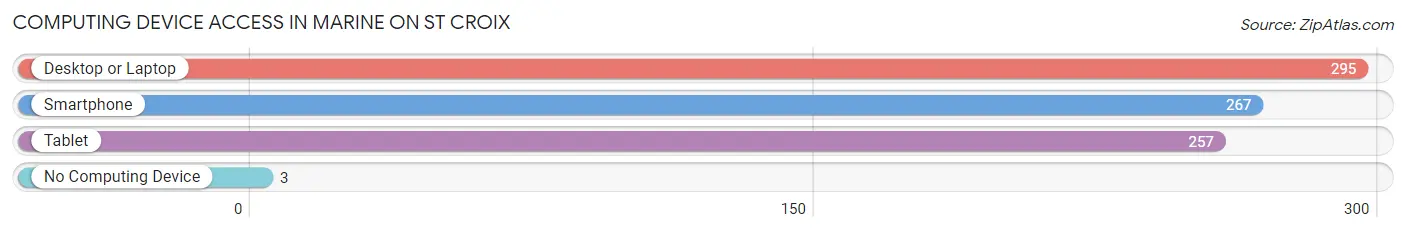
| Device Type | # Households | % Households |
| Desktop or Laptop | 295 | 95.2% |
| Smartphone | 267 | 86.1% |
| Tablet | 257 | 82.9% |
| No Computing Device | 3 | 1.0% |
| Total | 310 | 100.0% |
Internet Access in Marine on St Croix
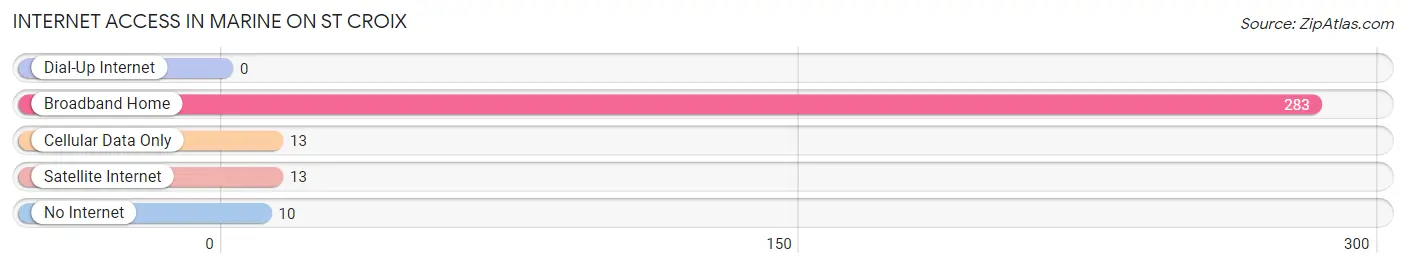
| Internet Type | # Households | % Households |
| Dial-Up Internet | 0 | 0.0% |
| Broadband Home | 283 | 91.3% |
| Cellular Data Only | 13 | 4.2% |
| Satellite Internet | 13 | 4.2% |
| No Internet | 10 | 3.2% |
| Total | 310 | 100.0% |
Marine on St Croix Summary
Marine on St. Croix is a small city located in Washington County, Minnesota. It is situated on the banks of the St. Croix River, which forms the border between Minnesota and Wisconsin. The city has a population of approximately 1,000 people and is part of the Twin Cities metropolitan area.
History
The area that is now Marine on St. Croix was first settled in the early 1800s by French-Canadian fur traders. The first permanent settlers arrived in 1844, and the town was officially incorporated in 1858. The town was named after the St. Croix River, which was named by French explorer Pierre-Charles Le Sueur in 1680.
The town was originally a lumbering and milling center, and the first sawmill was built in 1854. The town grew rapidly in the late 19th century, and by the early 20th century, it had become a popular summer resort destination. The town was also home to a number of resorts, including the Marine Hotel, which was built in 1891 and was one of the first resorts in the area.
Geography
Marine on St. Croix is located in the St. Croix River Valley, which is part of the Driftless Area of Minnesota. The city is situated on the banks of the St. Croix River, which forms the border between Minnesota and Wisconsin. The city is surrounded by rolling hills and wooded areas, and is located approximately 25 miles northeast of Minneapolis.
The city has a total area of 1.2 square miles, all of which is land. The city is located at an elevation of 890 feet above sea level.
Economy
The economy of Marine on St. Croix is largely based on tourism and retail. The city is home to a number of small businesses, including restaurants, shops, and galleries. The city is also home to a number of historic sites, including the Marine Hotel, which is listed on the National Register of Historic Places.
The city is also home to a number of parks and outdoor recreation areas, including the St. Croix State Park, which is located just outside of town. The park offers a variety of activities, including camping, hiking, fishing, and boating.
Demographics
As of the 2010 census, the population of Marine on St. Croix was 1,042. The racial makeup of the city was 97.2% White, 0.7% African American, 0.2% Native American, 0.4% Asian, 0.1% Pacific Islander, 0.3% from other races, and 1.1% from two or more races. Hispanic or Latino of any race were 1.2% of the population.
The median household income in Marine on St. Croix was $50,938, and the median family income was $60,000. The per capita income for the city was $25,938. About 4.3% of families and 5.7% of the population were below the poverty line, including 6.3% of those under age 18 and 4.2% of those age 65 or over.
Common Questions
What is the Total Population of Marine on St Croix?
Total Population of Marine on St Croix is 721.
What is the Total Male Population of Marine on St Croix?
Total Male Population of Marine on St Croix is 343.
What is the Total Female Population of Marine on St Croix?
Total Female Population of Marine on St Croix is 378.
What is the Ratio of Males per 100 Females in Marine on St Croix?
There are 90.74 Males per 100 Females in Marine on St Croix.
What is the Ratio of Females per 100 Males in Marine on St Croix?
There are 110.20 Females per 100 Males in Marine on St Croix.
What is the Median Population Age in Marine on St Croix?
Median Population Age in Marine on St Croix is 57.0 Years.
What is the Average Family Size in Marine on St Croix
Average Family Size in Marine on St Croix is 2.9 People.
What is the Average Household Size in Marine on St Croix
Average Household Size in Marine on St Croix is 2.3 People.
What is Per Capita Income in Marine on St Croix?
Per Capita income in Marine on St Croix is $64,061.
What is the Median Family Income in Marine on St Croix?
Median Family Income in Marine on St Croix is $145,625.
What is the Median Household income in Marine on St Croix?
Median Household Income in Marine on St Croix is $135,242.
What is Income or Wage Gap in Marine on St Croix?
Income or Wage Gap in Marine on St Croix is 32.9%.
Women in Marine on St Croix earn 67.1 cents for every dollar earned by a man.
What is Inequality or Gini Index in Marine on St Croix?
Inequality or Gini Index in Marine on St Croix is 0.39.
How Large is the Labor Force in Marine on St Croix?
There are 360 People in the Labor Forcein in Marine on St Croix.
What is the Percentage of People in the Labor Force in Marine on St Croix?
58.8% of People are in the Labor Force in Marine on St Croix.