Mendota Heights, MN
Mendota Heights Map
Mendota Heights Overview
11,642
TOTAL POPULATION
5,660
MALE POPULATION
5,982
FEMALE POPULATION
94.62
MALES / 100 FEMALES
105.69
FEMALES / 100 MALES
47.0
MEDIAN AGE
2.9
AVG FAMILY SIZE
2.4
AVG HOUSEHOLD SIZE
$69,385
PER CAPITA INCOME
$165,931
AVG FAMILY INCOME
$129,800
AVG HOUSEHOLD INCOME
44.3%
WAGE / INCOME GAP [ % ]
55.7¢/ $1
WAGE / INCOME GAP [ $ ]
0.43
INEQUALITY / GINI INDEX
6,147
LABOR FORCE [ PEOPLE ]
64.5%
PERCENT IN LABOR FORCE
0.9%
UNEMPLOYMENT RATE
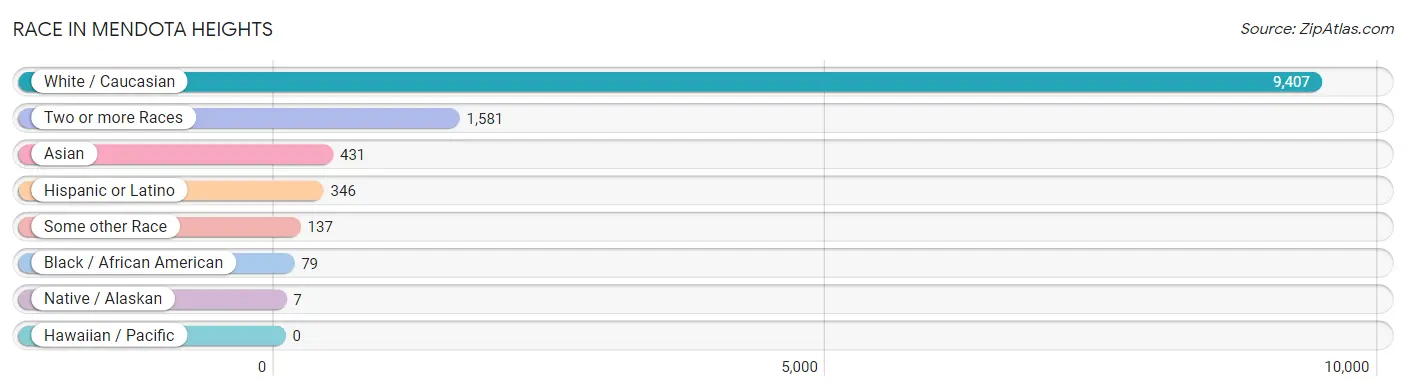
Race in Mendota Heights
The most populous races in Mendota Heights are White / Caucasian (9,407 | 80.8%), Two or more Races (1,581 | 13.6%), and Asian (431 | 3.7%).
| Race | # Population | % Population |
| Asian | 431 | 3.7% |
| Black / African American | 79 | 0.7% |
| Hawaiian / Pacific | 0 | 0.0% |
| Hispanic or Latino | 346 | 3.0% |
| Native / Alaskan | 7 | 0.1% |
| White / Caucasian | 9,407 | 80.8% |
| Two or more Races | 1,581 | 13.6% |
| Some other Race | 137 | 1.2% |
| Total | 11,642 | 100.0% |
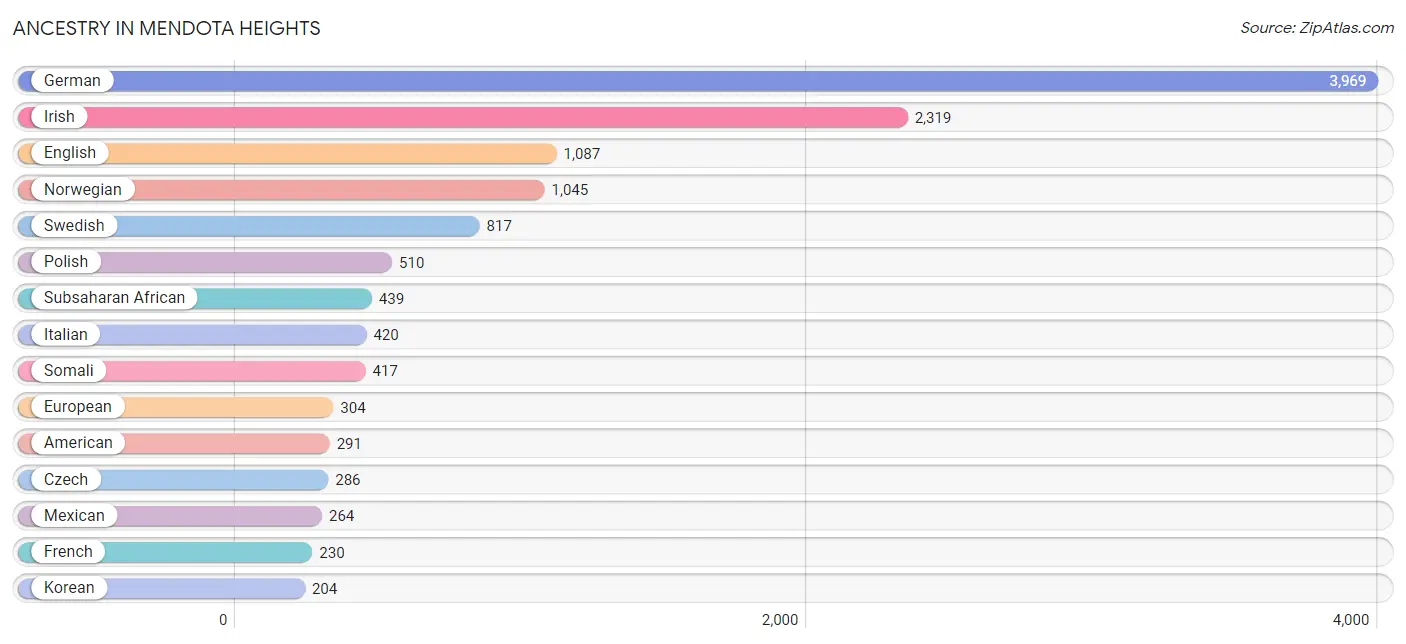
Ancestry in Mendota Heights
The most populous ancestries reported in Mendota Heights are German (3,969 | 34.1%), Irish (2,319 | 19.9%), English (1,087 | 9.3%), Norwegian (1,045 | 9.0%), and Swedish (817 | 7.0%), together accounting for 79.4% of all Mendota Heights residents.
| Ancestry | # Population | % Population |
| African | 22 | 0.2% |
| American | 291 | 2.5% |
| Arab | 57 | 0.5% |
| Armenian | 3 | 0.0% |
| Austrian | 170 | 1.5% |
| Belgian | 15 | 0.1% |
| Bhutanese | 59 | 0.5% |
| British | 64 | 0.5% |
| Burmese | 44 | 0.4% |
| Central American | 6 | 0.1% |
| Chilean | 10 | 0.1% |
| Colombian | 16 | 0.1% |
| Czech | 286 | 2.5% |
| Czechoslovakian | 5 | 0.0% |
| Danish | 137 | 1.2% |
| Dutch | 97 | 0.8% |
| Eastern European | 146 | 1.3% |
| English | 1,087 | 9.3% |
| European | 304 | 2.6% |
| Finnish | 126 | 1.1% |
| French | 230 | 2.0% |
| French Canadian | 143 | 1.2% |
| German | 3,969 | 34.1% |
| Greek | 25 | 0.2% |
| Hungarian | 26 | 0.2% |
| Icelander | 8 | 0.1% |
| Indian (Asian) | 101 | 0.9% |
| Iranian | 28 | 0.2% |
| Irish | 2,319 | 19.9% |
| Italian | 420 | 3.6% |
| Korean | 204 | 1.8% |
| Lebanese | 18 | 0.2% |
| Lithuanian | 36 | 0.3% |
| Mexican | 264 | 2.3% |
| Native Hawaiian | 166 | 1.4% |
| Northern European | 58 | 0.5% |
| Norwegian | 1,045 | 9.0% |
| Pakistani | 13 | 0.1% |
| Palestinian | 33 | 0.3% |
| Polish | 510 | 4.4% |
| Portuguese | 10 | 0.1% |
| Puerto Rican | 12 | 0.1% |
| Romanian | 12 | 0.1% |
| Russian | 90 | 0.8% |
| Salvadoran | 6 | 0.1% |
| Scandinavian | 157 | 1.3% |
| Scotch-Irish | 16 | 0.1% |
| Scottish | 172 | 1.5% |
| Serbian | 6 | 0.1% |
| Slovene | 27 | 0.2% |
| Somali | 417 | 3.6% |
| South American | 26 | 0.2% |
| Spaniard | 19 | 0.2% |
| Spanish | 7 | 0.1% |
| Sri Lankan | 79 | 0.7% |
| Subsaharan African | 439 | 3.8% |
| Swedish | 817 | 7.0% |
| Swiss | 57 | 0.5% |
| Ukrainian | 40 | 0.3% |
| Vietnamese | 13 | 0.1% |
| Welsh | 73 | 0.6% | View All 61 Rows |
Immigrants in Mendota Heights
The most numerous immigrant groups reported in Mendota Heights came from Asia (245 | 2.1%), South Eastern Asia (131 | 1.1%), Europe (114 | 1.0%), Africa (97 | 0.8%), and Eastern Africa (97 | 0.8%), together accounting for 5.9% of all Mendota Heights residents.

| Immigration Origin | # Population | % Population |
| Africa | 97 | 0.8% |
| Asia | 245 | 2.1% |
| Bangladesh | 18 | 0.2% |
| Canada | 18 | 0.2% |
| Central America | 49 | 0.4% |
| China | 26 | 0.2% |
| Colombia | 10 | 0.1% |
| Eastern Africa | 97 | 0.8% |
| Eastern Asia | 63 | 0.5% |
| Eastern Europe | 57 | 0.5% |
| El Salvador | 6 | 0.1% |
| England | 4 | 0.0% |
| Europe | 114 | 1.0% |
| Hungary | 4 | 0.0% |
| Iran | 9 | 0.1% |
| Iraq | 15 | 0.1% |
| Ireland | 5 | 0.0% |
| Japan | 12 | 0.1% |
| Korea | 25 | 0.2% |
| Latin America | 59 | 0.5% |
| Lebanon | 9 | 0.1% |
| Mexico | 43 | 0.4% |
| Northern Europe | 57 | 0.5% |
| Philippines | 66 | 0.6% |
| Poland | 15 | 0.1% |
| Russia | 20 | 0.2% |
| Somalia | 97 | 0.8% |
| South America | 10 | 0.1% |
| South Central Asia | 27 | 0.2% |
| South Eastern Asia | 131 | 1.1% |
| Sweden | 8 | 0.1% |
| Thailand | 13 | 0.1% |
| Ukraine | 18 | 0.2% |
| Vietnam | 52 | 0.4% |
| Western Asia | 24 | 0.2% | View All 35 Rows |
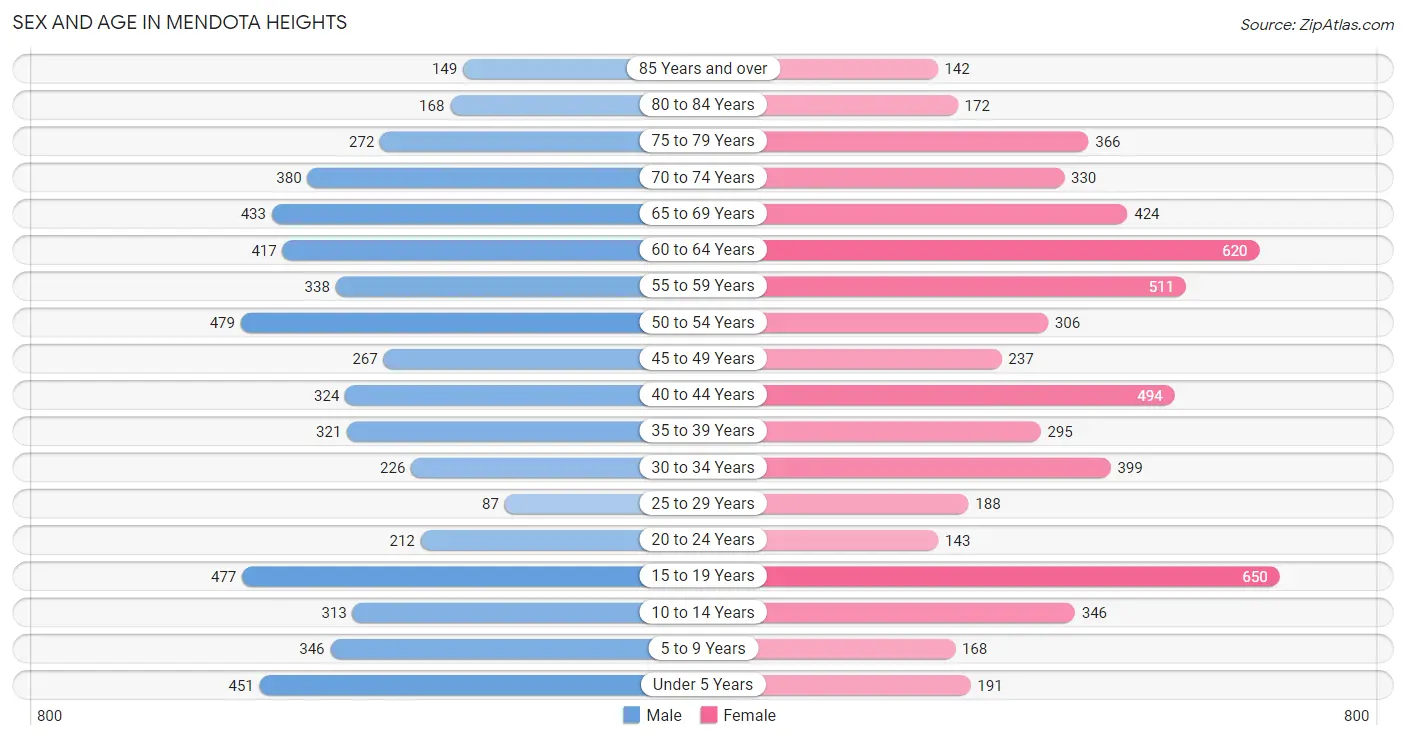
Sex and Age in Mendota Heights
Sex and Age in Mendota Heights
The most populous age groups in Mendota Heights are 50 to 54 Years (479 | 8.5%) for men and 15 to 19 Years (650 | 10.9%) for women.
| Age Bracket | Male | Female |
| Under 5 Years | 451 (8.0%) | 191 (3.2%) |
| 5 to 9 Years | 346 (6.1%) | 168 (2.8%) |
| 10 to 14 Years | 313 (5.5%) | 346 (5.8%) |
| 15 to 19 Years | 477 (8.4%) | 650 (10.9%) |
| 20 to 24 Years | 212 (3.7%) | 143 (2.4%) |
| 25 to 29 Years | 87 (1.5%) | 188 (3.1%) |
| 30 to 34 Years | 226 (4.0%) | 399 (6.7%) |
| 35 to 39 Years | 321 (5.7%) | 295 (4.9%) |
| 40 to 44 Years | 324 (5.7%) | 494 (8.3%) |
| 45 to 49 Years | 267 (4.7%) | 237 (4.0%) |
| 50 to 54 Years | 479 (8.5%) | 306 (5.1%) |
| 55 to 59 Years | 338 (6.0%) | 511 (8.5%) |
| 60 to 64 Years | 417 (7.4%) | 620 (10.4%) |
| 65 to 69 Years | 433 (7.6%) | 424 (7.1%) |
| 70 to 74 Years | 380 (6.7%) | 330 (5.5%) |
| 75 to 79 Years | 272 (4.8%) | 366 (6.1%) |
| 80 to 84 Years | 168 (3.0%) | 172 (2.9%) |
| 85 Years and over | 149 (2.6%) | 142 (2.4%) |
| Total | 5,660 (100.0%) | 5,982 (100.0%) |
Families and Households in Mendota Heights
Median Family Size in Mendota Heights
The median family size in Mendota Heights is 2.94 persons per family, with married-couple families (2,882 | 84.2%) accounting for the largest median family size of 2.96 persons per family. On the other hand, single male/father families (73 | 2.1%) represent the smallest median family size with 2.19 persons per family.
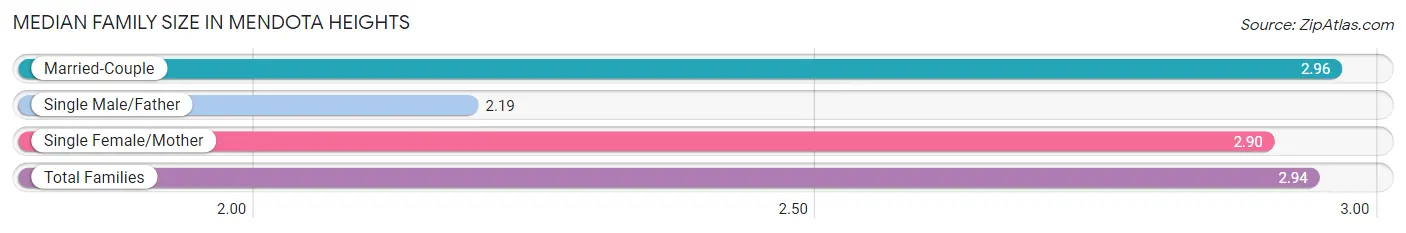
| Family Type | # Families | Family Size |
| Married-Couple | 2,882 (84.2%) | 2.96 |
| Single Male/Father | 73 (2.1%) | 2.19 |
| Single Female/Mother | 467 (13.7%) | 2.90 |
| Total Families | 3,422 (100.0%) | 2.94 |
Median Household Size in Mendota Heights
The median household size in Mendota Heights is 2.44 persons per household, with married-couple households (2,882 | 60.9%) accounting for the largest median household size of 2.96 persons per household. non-family households (1,313 | 27.7%) represent the smallest median household size with 1.11 persons per household.
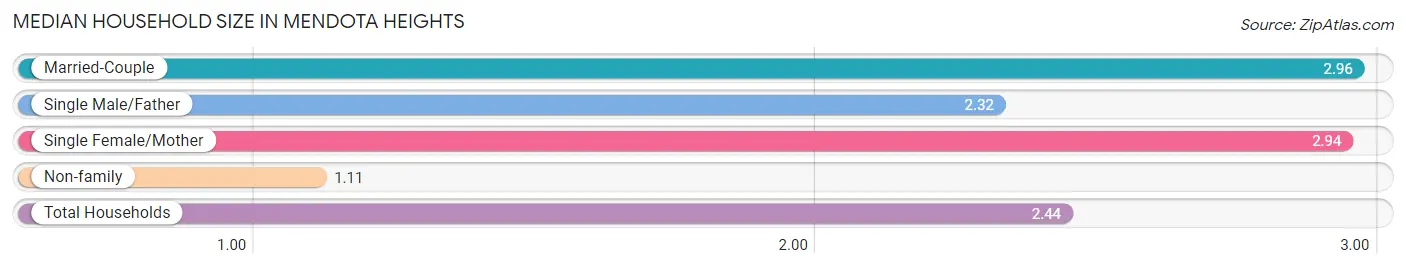
| Household Type | # Households | Household Size |
| Married-Couple | 2,882 (60.9%) | 2.96 |
| Single Male/Father | 73 (1.5%) | 2.32 |
| Single Female/Mother | 467 (9.9%) | 2.94 |
| Non-family | 1,313 (27.7%) | 1.11 |
| Total Households | 4,735 (100.0%) | 2.44 |
Household Size by Marriage Status in Mendota Heights
Out of a total of 4,735 households in Mendota Heights, 3,422 (72.3%) are family households, while 1,313 (27.7%) are nonfamily households. The most numerous type of family households are 2-person households, comprising 1,812, and the most common type of nonfamily households are 1-person households, comprising 1,190.
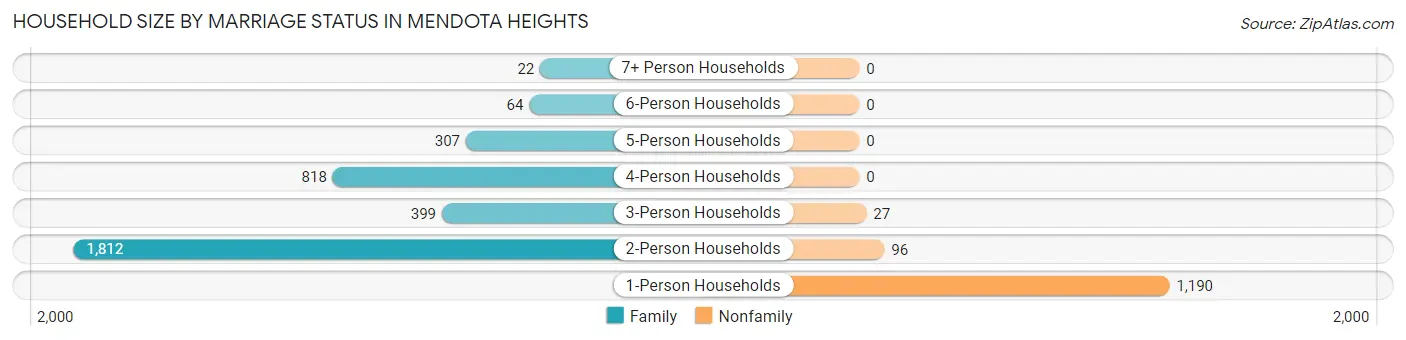
| Household Size | Family Households | Nonfamily Households |
| 1-Person Households | - | 1,190 (25.1%) |
| 2-Person Households | 1,812 (38.3%) | 96 (2.0%) |
| 3-Person Households | 399 (8.4%) | 27 (0.6%) |
| 4-Person Households | 818 (17.3%) | 0 (0.0%) |
| 5-Person Households | 307 (6.5%) | 0 (0.0%) |
| 6-Person Households | 64 (1.3%) | 0 (0.0%) |
| 7+ Person Households | 22 (0.5%) | 0 (0.0%) |
| Total | 3,422 (72.3%) | 1,313 (27.7%) |
Female Fertility in Mendota Heights
Fertility by Age in Mendota Heights
Average fertility rate in Mendota Heights is 35.0 births per 1,000 women. Women in the age bracket of 35 to 50 years have the highest fertility rate with 64.0 births per 1,000 women. Women in the age bracket of 35 to 50 years acount for 81.2% of all women with births.
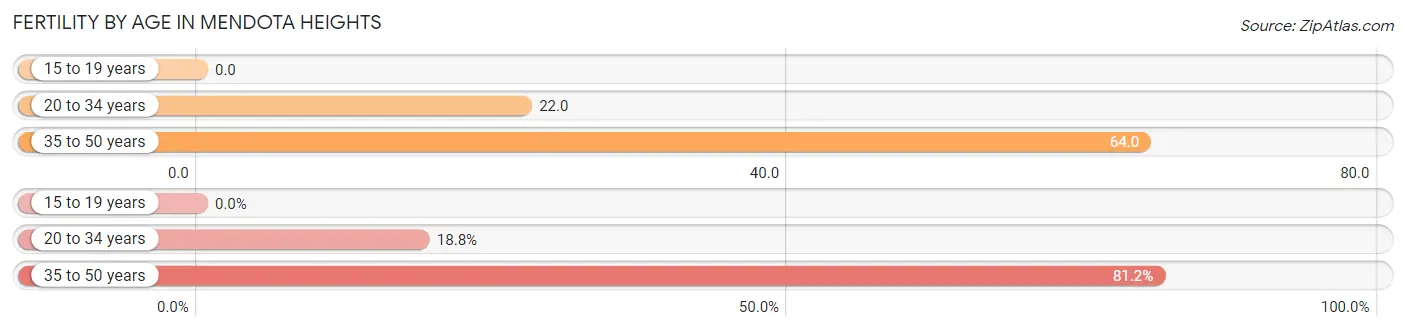
| Age Bracket | Women with Births | Births / 1,000 Women |
| 15 to 19 years | 0 (0.0%) | 0.0 |
| 20 to 34 years | 16 (18.8%) | 22.0 |
| 35 to 50 years | 69 (81.2%) | 64.0 |
| Total | 85 (100.0%) | 35.0 |
Fertility by Age by Marriage Status in Mendota Heights
85.9% of women with births (85) in Mendota Heights are married. The highest percentage of unmarried women with births falls into 20 to 34 years age bracket with 37.5% of them unmarried at the time of birth, while the lowest percentage of unmarried women with births belong to 35 to 50 years age bracket with 8.7% of them unmarried.
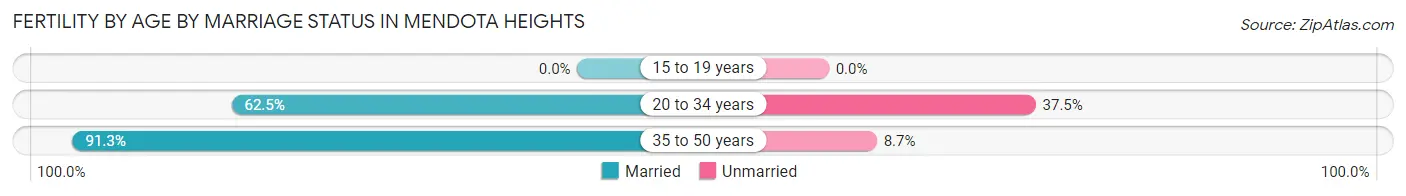
| Age Bracket | Married | Unmarried |
| 15 to 19 years | 0 (0.0%) | 0 (0.0%) |
| 20 to 34 years | 10 (62.5%) | 6 (37.5%) |
| 35 to 50 years | 63 (91.3%) | 6 (8.7%) |
| Total | 73 (85.9%) | 12 (14.1%) |
Fertility by Education in Mendota Heights
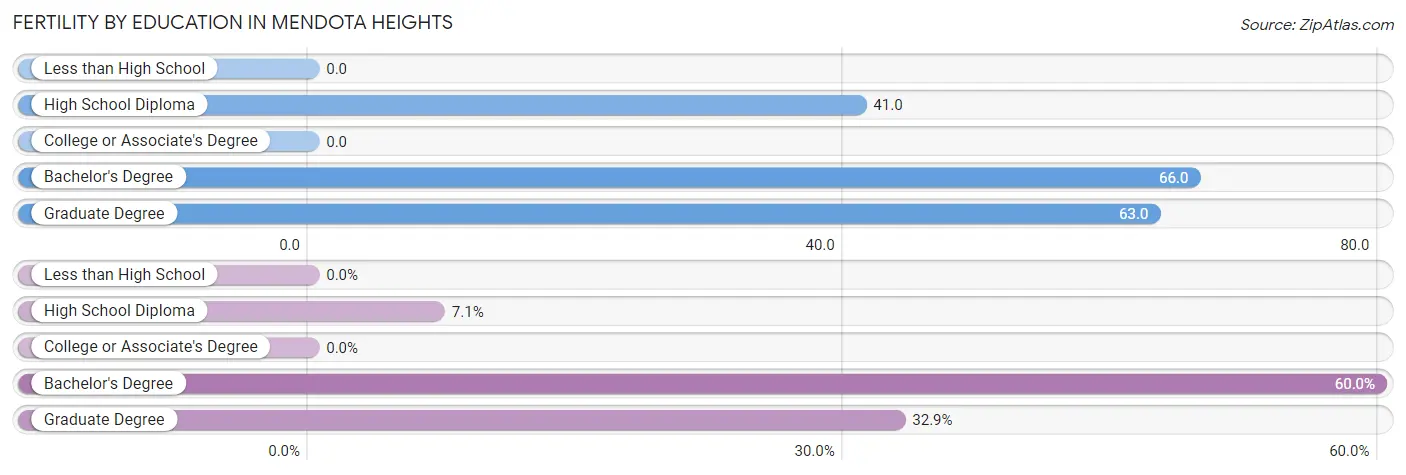
| Educational Attainment | Women with Births | Births / 1,000 Women |
| Less than High School | 0 (0.0%) | 0.0 |
| High School Diploma | 6 (7.1%) | 41.0 |
| College or Associate's Degree | 0 (0.0%) | 0.0 |
| Bachelor's Degree | 51 (60.0%) | 66.0 |
| Graduate Degree | 28 (32.9%) | 63.0 |
| Total | 85 (100.0%) | 35.0 |
Fertility by Education by Marriage Status in Mendota Heights
14.1% of women with births in Mendota Heights are unmarried. Women with the educational attainment of graduate degree are most likely to be married with 100.0% of them married at childbirth, while women with the educational attainment of high school diploma are least likely to be married with 100.0% of them unmarried at childbirth.
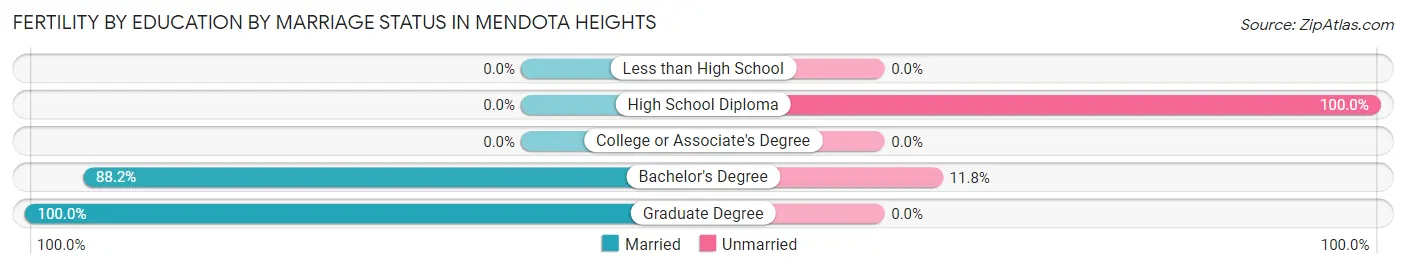
| Educational Attainment | Married | Unmarried |
| Less than High School | 0 (0.0%) | 0 (0.0%) |
| High School Diploma | 0 (0.0%) | 6 (100.0%) |
| College or Associate's Degree | 0 (0.0%) | 0 (0.0%) |
| Bachelor's Degree | 45 (88.2%) | 6 (11.8%) |
| Graduate Degree | 28 (100.0%) | 0 (0.0%) |
| Total | 73 (85.9%) | 12 (14.1%) |
Income in Mendota Heights
Income Overview in Mendota Heights
Per Capita Income in Mendota Heights is $69,385, while median incomes of families and households are $165,931 and $129,800 respectively.
| Characteristic | Number | Measure |
| Per Capita Income | 11,642 | $69,385 |
| Median Family Income | 3,422 | $165,931 |
| Mean Family Income | 3,422 | $199,677 |
| Median Household Income | 4,735 | $129,800 |
| Mean Household Income | 4,735 | $168,330 |
| Income Deficit | 3,422 | $0 |
| Wage / Income Gap (%) | 11,642 | 44.35% |
| Wage / Income Gap ($) | 11,642 | 55.65¢ per $1 |
| Gini / Inequality Index | 11,642 | 0.43 |
Earnings by Sex in Mendota Heights
Average Earnings in Mendota Heights are $63,276, $88,911 for men and $49,480 for women, a difference of 44.4%.
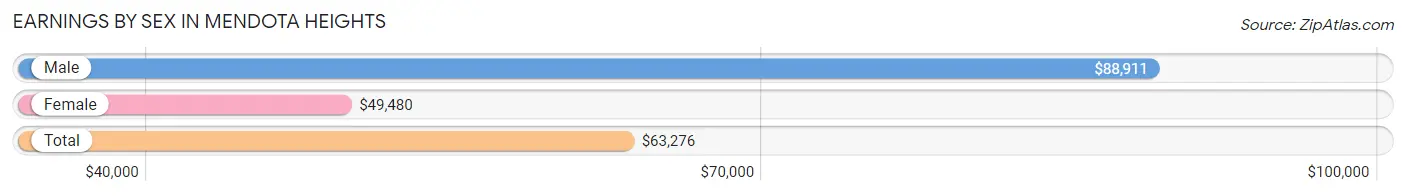
| Sex | Number | Average Earnings |
| Male | 3,211 (47.8%) | $88,911 |
| Female | 3,511 (52.2%) | $49,480 |
| Total | 6,722 (100.0%) | $63,276 |
Earnings by Sex by Income Bracket in Mendota Heights
The most common earnings brackets in Mendota Heights are $100,000+ for men (1,410 | 43.9%) and $100,000+ for women (770 | 21.9%).
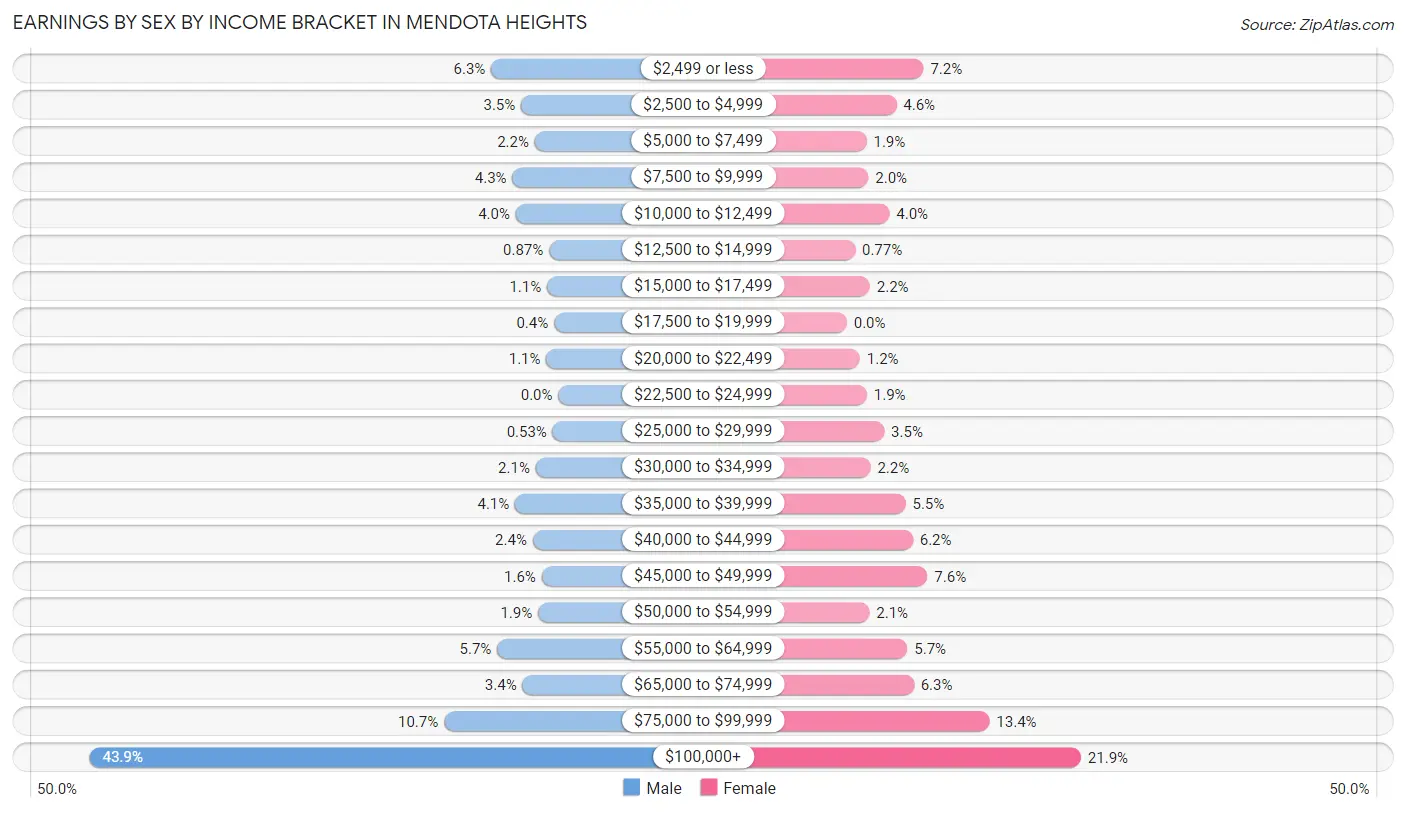
| Income | Male | Female |
| $2,499 or less | 202 (6.3%) | 252 (7.2%) |
| $2,500 to $4,999 | 112 (3.5%) | 163 (4.6%) |
| $5,000 to $7,499 | 71 (2.2%) | 65 (1.8%) |
| $7,500 to $9,999 | 138 (4.3%) | 71 (2.0%) |
| $10,000 to $12,499 | 128 (4.0%) | 140 (4.0%) |
| $12,500 to $14,999 | 28 (0.9%) | 27 (0.8%) |
| $15,000 to $17,499 | 34 (1.1%) | 76 (2.2%) |
| $17,500 to $19,999 | 13 (0.4%) | 0 (0.0%) |
| $20,000 to $22,499 | 36 (1.1%) | 43 (1.2%) |
| $22,500 to $24,999 | 0 (0.0%) | 66 (1.9%) |
| $25,000 to $29,999 | 17 (0.5%) | 123 (3.5%) |
| $30,000 to $34,999 | 68 (2.1%) | 78 (2.2%) |
| $35,000 to $39,999 | 130 (4.1%) | 193 (5.5%) |
| $40,000 to $44,999 | 77 (2.4%) | 217 (6.2%) |
| $45,000 to $49,999 | 50 (1.6%) | 265 (7.5%) |
| $50,000 to $54,999 | 61 (1.9%) | 74 (2.1%) |
| $55,000 to $64,999 | 184 (5.7%) | 199 (5.7%) |
| $65,000 to $74,999 | 108 (3.4%) | 220 (6.3%) |
| $75,000 to $99,999 | 344 (10.7%) | 469 (13.4%) |
| $100,000+ | 1,410 (43.9%) | 770 (21.9%) |
| Total | 3,211 (100.0%) | 3,511 (100.0%) |
Earnings by Sex by Educational Attainment in Mendota Heights
Average earnings in Mendota Heights are $107,273 for men and $61,530 for women, a difference of 42.6%. Men with an educational attainment of graduate degree enjoy the highest average annual earnings of $124,886, while those with high school diploma education earn the least with $57,386. Women with an educational attainment of graduate degree earn the most with the average annual earnings of $88,102, while those with less than high school education have the smallest earnings of $16,518.
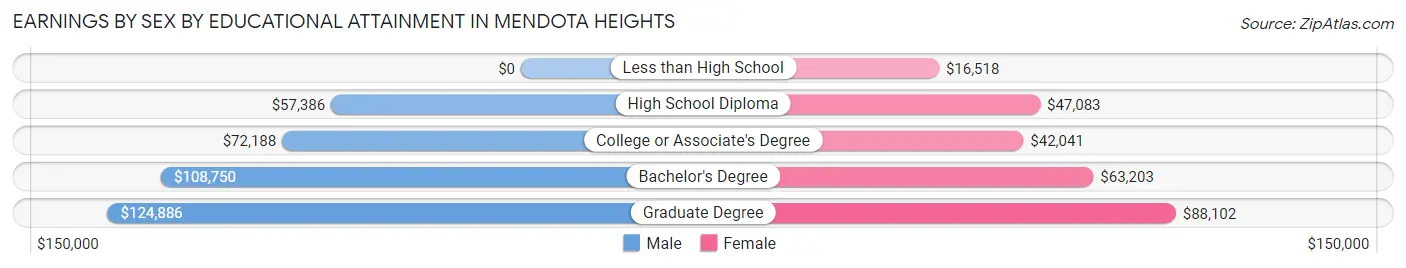
| Educational Attainment | Male Income | Female Income |
| Less than High School | - | - |
| High School Diploma | $57,386 | $47,083 |
| College or Associate's Degree | $72,188 | $42,041 |
| Bachelor's Degree | $108,750 | $63,203 |
| Graduate Degree | $124,886 | $88,102 |
| Total | $107,273 | $61,530 |
Family Income in Mendota Heights
Family Income Brackets in Mendota Heights
According to the Mendota Heights family income data, there are 1,335 families falling into the $200,000+ income range, which is the most common income bracket and makes up 39.0% of all families.
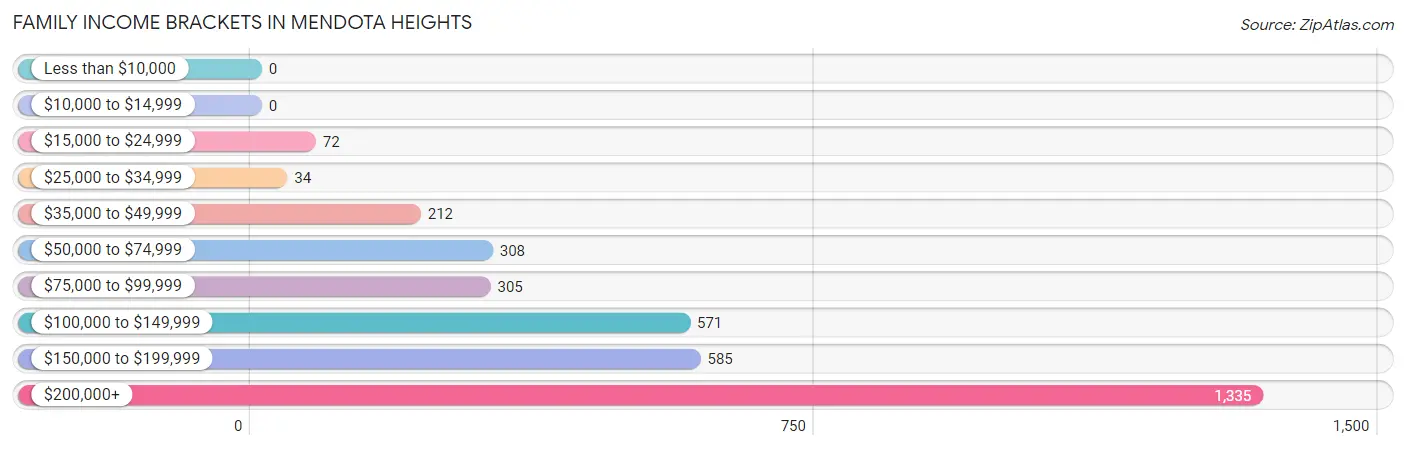
| Income Bracket | # Families | % Families |
| Less than $10,000 | 0 | 0.0% |
| $10,000 to $14,999 | 0 | 0.0% |
| $15,000 to $24,999 | 72 | 2.1% |
| $25,000 to $34,999 | 34 | 1.0% |
| $35,000 to $49,999 | 212 | 6.2% |
| $50,000 to $74,999 | 308 | 9.0% |
| $75,000 to $99,999 | 305 | 8.9% |
| $100,000 to $149,999 | 571 | 16.7% |
| $150,000 to $199,999 | 585 | 17.1% |
| $200,000+ | 1,335 | 39.0% |
Family Income by Famaliy Size in Mendota Heights
7+ person families (22 | 0.6%) account for the highest median family income in Mendota Heights with $250,001 per family, while 2-person families (1,821 | 53.2%) have the highest median income of $77,136 per family member.
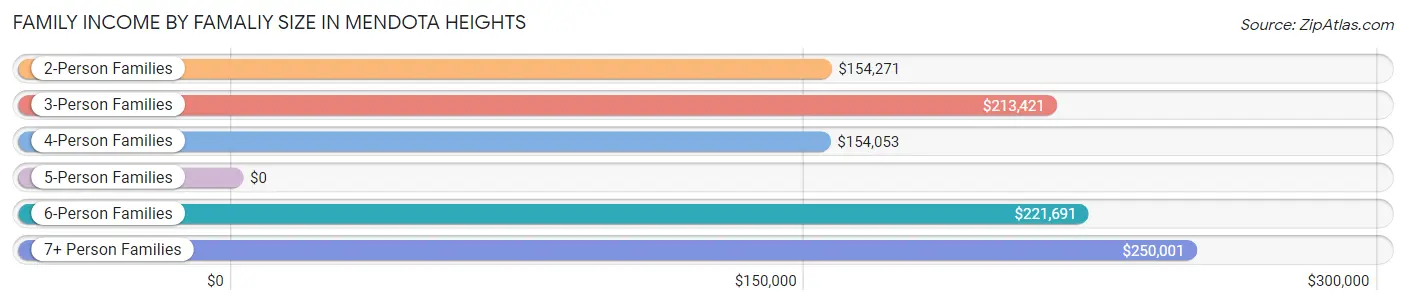
| Income Bracket | # Families | Median Income |
| 2-Person Families | 1,821 (53.2%) | $154,271 |
| 3-Person Families | 406 (11.9%) | $213,421 |
| 4-Person Families | 807 (23.6%) | $154,053 |
| 5-Person Families | 309 (9.0%) | $0 |
| 6-Person Families | 57 (1.7%) | $221,691 |
| 7+ Person Families | 22 (0.6%) | $250,001 |
| Total | 3,422 (100.0%) | $165,931 |
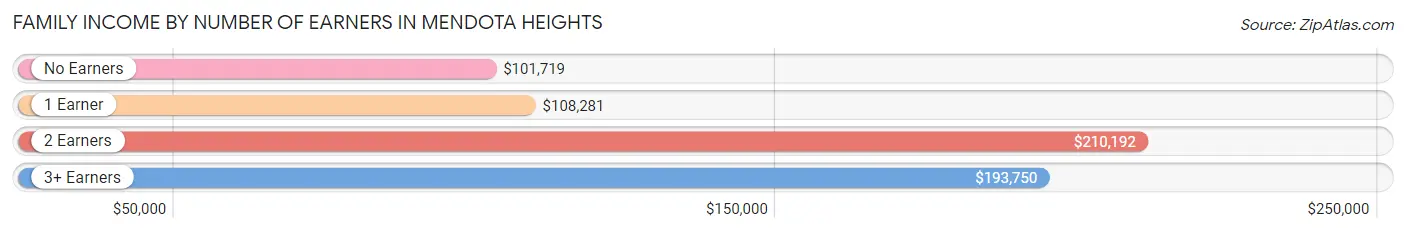
Family Income by Number of Earners in Mendota Heights
The median family income in Mendota Heights is $165,931, with families comprising 2 earners (1,560) having the highest median family income of $210,192, while families with no earners (550) have the lowest median family income of $101,719, accounting for 45.6% and 16.1% of families, respectively.
| Number of Earners | # Families | Median Income |
| No Earners | 550 (16.1%) | $101,719 |
| 1 Earner | 741 (21.6%) | $108,281 |
| 2 Earners | 1,560 (45.6%) | $210,192 |
| 3+ Earners | 571 (16.7%) | $193,750 |
| Total | 3,422 (100.0%) | $165,931 |
Household Income in Mendota Heights
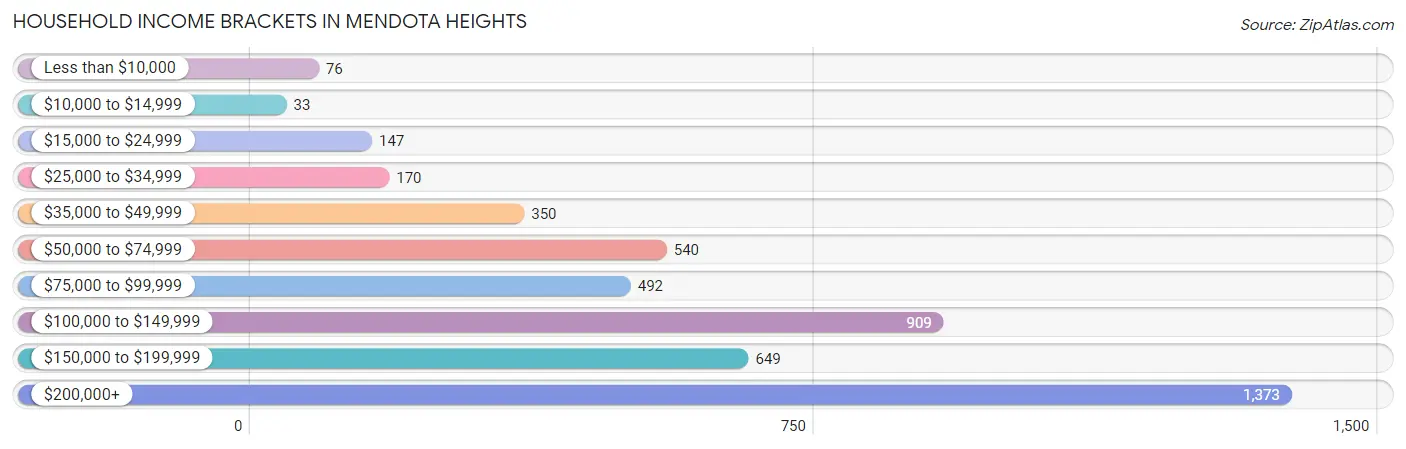
Household Income Brackets in Mendota Heights
With 1,373 households falling in the category, the $200,000+ income range is the most frequent in Mendota Heights, accounting for 29.0% of all households. In contrast, only 33 households (0.7%) fall into the $10,000 to $14,999 income bracket, making it the least populous group.
| Income Bracket | # Households | % Households |
| Less than $10,000 | 76 | 1.6% |
| $10,000 to $14,999 | 33 | 0.7% |
| $15,000 to $24,999 | 147 | 3.1% |
| $25,000 to $34,999 | 170 | 3.6% |
| $35,000 to $49,999 | 350 | 7.4% |
| $50,000 to $74,999 | 540 | 11.4% |
| $75,000 to $99,999 | 492 | 10.4% |
| $100,000 to $149,999 | 909 | 19.2% |
| $150,000 to $199,999 | 649 | 13.7% |
| $200,000+ | 1,373 | 29.0% |
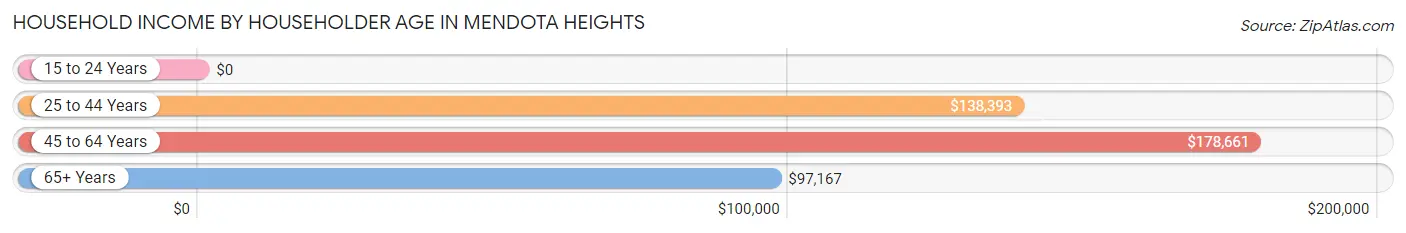
Household Income by Householder Age in Mendota Heights
The median household income in Mendota Heights is $129,800, with the highest median household income of $178,661 found in the 45 to 64 years age bracket for the primary householder. A total of 1,747 households (36.9%) fall into this category. Meanwhile, the 15 to 24 years age bracket for the primary householder has the lowest median household income of $0, with 13 households (0.3%) in this group.
| Income Bracket | # Households | Median Income |
| 15 to 24 Years | 13 (0.3%) | $0 |
| 25 to 44 Years | 1,185 (25.0%) | $138,393 |
| 45 to 64 Years | 1,747 (36.9%) | $178,661 |
| 65+ Years | 1,790 (37.8%) | $97,167 |
| Total | 4,735 (100.0%) | $129,800 |
Poverty in Mendota Heights
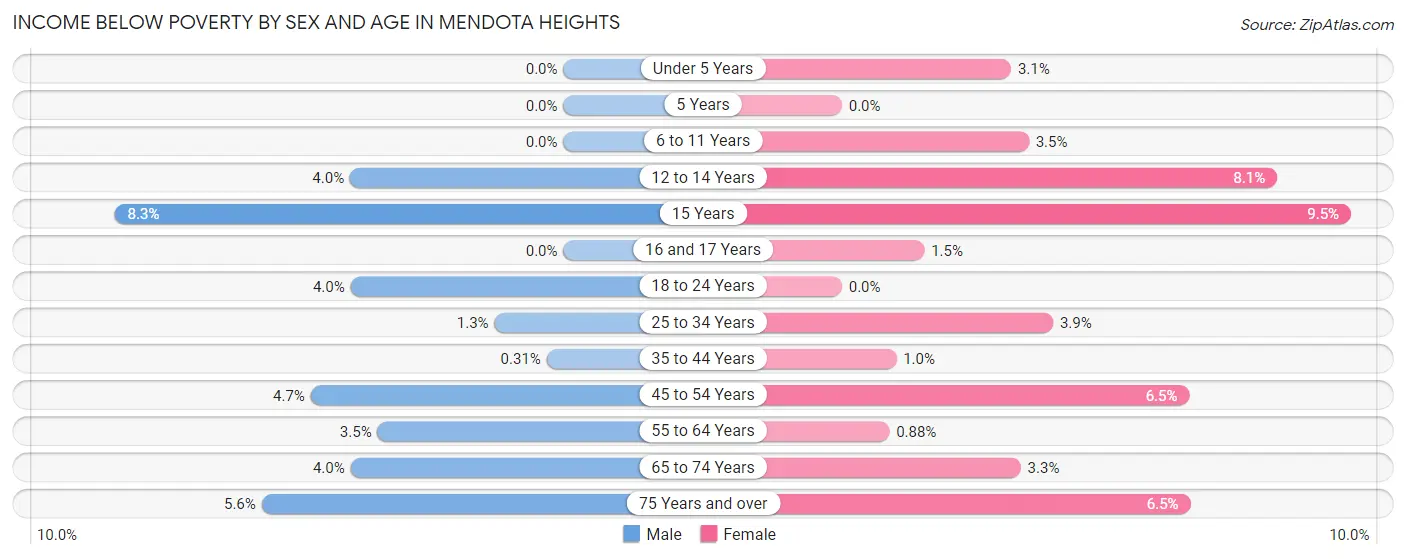
Income Below Poverty by Sex and Age in Mendota Heights
With 3.0% poverty level for males and 3.4% for females among the residents of Mendota Heights, 15 year old males and 15 year old females are the most vulnerable to poverty, with 8 males (8.3%) and 19 females (9.5%) in their respective age groups living below the poverty level.
| Age Bracket | Male | Female |
| Under 5 Years | 0 (0.0%) | 6 (3.1%) |
| 5 Years | 0 (0.0%) | 0 (0.0%) |
| 6 to 11 Years | 0 (0.0%) | 7 (3.5%) |
| 12 to 14 Years | 9 (4.0%) | 21 (8.1%) |
| 15 Years | 8 (8.3%) | 19 (9.5%) |
| 16 and 17 Years | 0 (0.0%) | 4 (1.5%) |
| 18 to 24 Years | 20 (4.0%) | 0 (0.0%) |
| 25 to 34 Years | 4 (1.3%) | 23 (3.9%) |
| 35 to 44 Years | 2 (0.3%) | 8 (1.0%) |
| 45 to 54 Years | 35 (4.7%) | 35 (6.5%) |
| 55 to 64 Years | 26 (3.5%) | 10 (0.9%) |
| 65 to 74 Years | 32 (4.0%) | 25 (3.3%) |
| 75 Years and over | 33 (5.6%) | 44 (6.5%) |
| Total | 169 (3.0%) | 202 (3.4%) |
Income Above Poverty by Sex and Age in Mendota Heights
According to the poverty statistics in Mendota Heights, males aged under 5 years and females aged 5 years are the age groups that are most secure financially, with 100.0% of males and 100.0% of females in these age groups living above the poverty line.
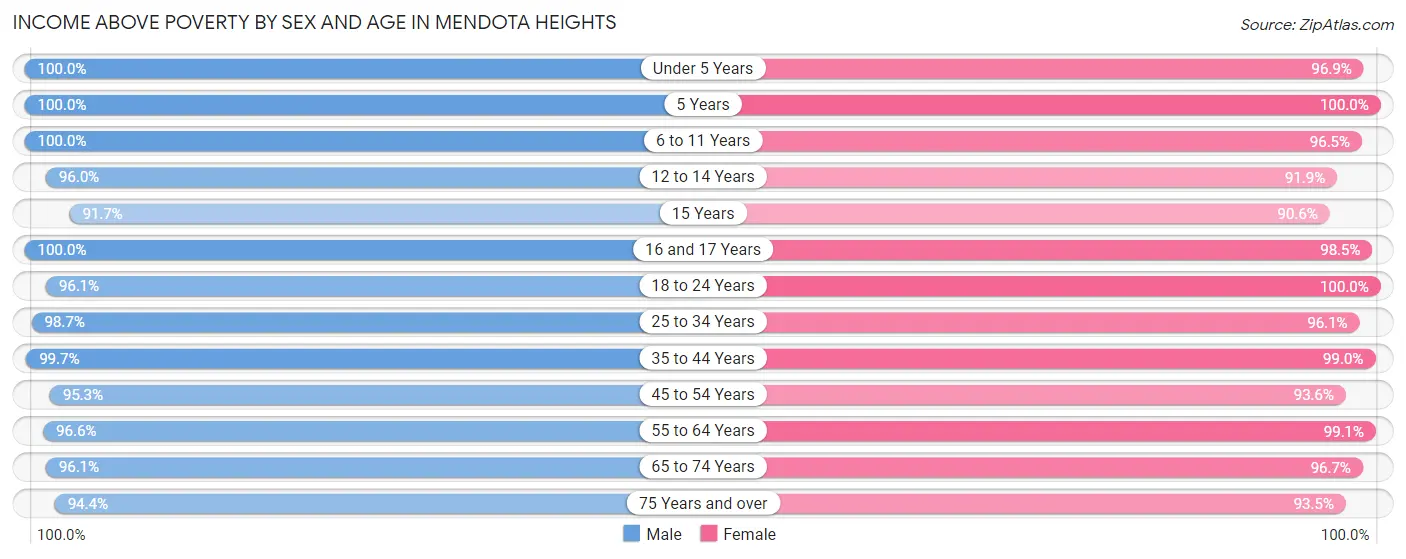
| Age Bracket | Male | Female |
| Under 5 Years | 447 (100.0%) | 185 (96.9%) |
| 5 Years | 15 (100.0%) | 52 (100.0%) |
| 6 to 11 Years | 417 (100.0%) | 195 (96.5%) |
| 12 to 14 Years | 218 (96.0%) | 239 (91.9%) |
| 15 Years | 88 (91.7%) | 182 (90.5%) |
| 16 and 17 Years | 85 (100.0%) | 258 (98.5%) |
| 18 to 24 Years | 486 (96.1%) | 330 (100.0%) |
| 25 to 34 Years | 309 (98.7%) | 564 (96.1%) |
| 35 to 44 Years | 643 (99.7%) | 781 (99.0%) |
| 45 to 54 Years | 711 (95.3%) | 508 (93.5%) |
| 55 to 64 Years | 727 (96.6%) | 1,121 (99.1%) |
| 65 to 74 Years | 779 (96.1%) | 729 (96.7%) |
| 75 Years and over | 556 (94.4%) | 636 (93.5%) |
| Total | 5,481 (97.0%) | 5,780 (96.6%) |
Income Below Poverty Among Married-Couple Families in Mendota Heights
The poverty statistics for married-couple families in Mendota Heights show that 0.7% or 21 of the total 2,882 families live below the poverty line. Families with 3 or 4 children have the highest poverty rate of 4.2%, comprising of 9 families. On the other hand, families with no children have the lowest poverty rate of 0.0%, which includes 0 families.
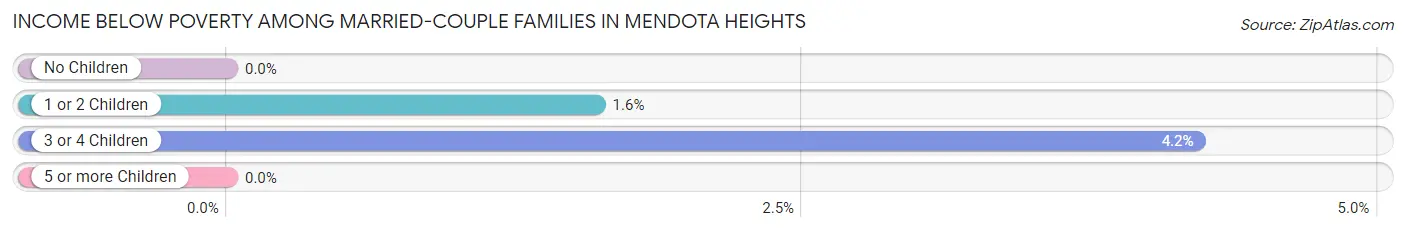
| Children | Above Poverty | Below Poverty |
| No Children | 1,899 (100.0%) | 0 (0.0%) |
| 1 or 2 Children | 739 (98.4%) | 12 (1.6%) |
| 3 or 4 Children | 205 (95.8%) | 9 (4.2%) |
| 5 or more Children | 18 (100.0%) | 0 (0.0%) |
| Total | 2,861 (99.3%) | 21 (0.7%) |
Income Below Poverty Among Single-Parent Households in Mendota Heights
According to the poverty data in Mendota Heights, 24.7% or 18 single-father households and 1.5% or 7 single-mother households are living below the poverty line. Among single-father households, those with 1 or 2 children have the highest poverty rate, with 9 households (29.0%) experiencing poverty. Likewise, among single-mother households, those with 3 or 4 children have the highest poverty rate, with 7 households (5.0%) falling below the poverty line.
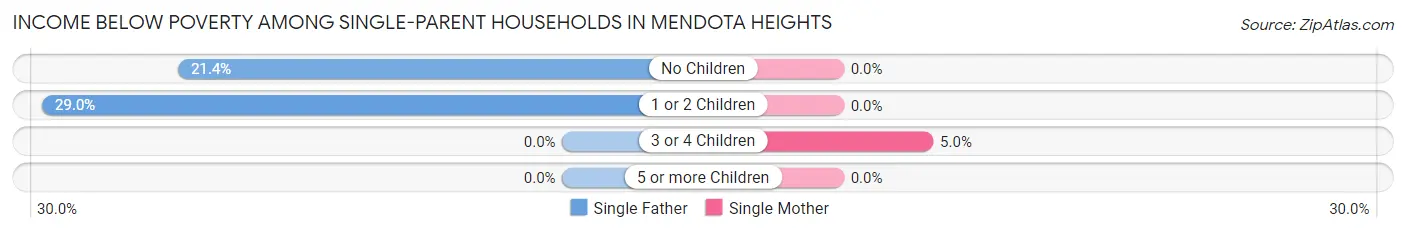
| Children | Single Father | Single Mother |
| No Children | 9 (21.4%) | 0 (0.0%) |
| 1 or 2 Children | 9 (29.0%) | 0 (0.0%) |
| 3 or 4 Children | 0 (0.0%) | 7 (5.0%) |
| 5 or more Children | 0 (0.0%) | 0 (0.0%) |
| Total | 18 (24.7%) | 7 (1.5%) |
Income Below Poverty Among Married-Couple vs Single-Parent Households in Mendota Heights
The poverty data for Mendota Heights shows that 21 of the married-couple family households (0.7%) and 25 of the single-parent households (4.6%) are living below the poverty level. Within the married-couple family households, those with 3 or 4 children have the highest poverty rate, with 9 households (4.2%) falling below the poverty line. Among the single-parent households, those with 3 or 4 children have the highest poverty rate, with 7 household (5.0%) living below poverty.
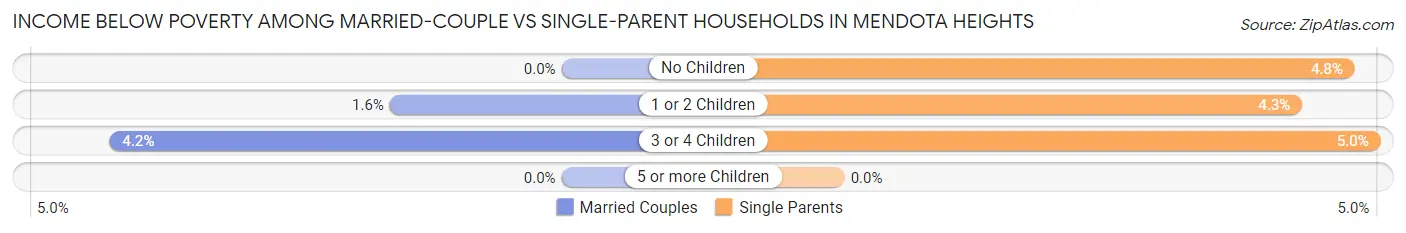
| Children | Married-Couple Families | Single-Parent Households |
| No Children | 0 (0.0%) | 9 (4.8%) |
| 1 or 2 Children | 12 (1.6%) | 9 (4.3%) |
| 3 or 4 Children | 9 (4.2%) | 7 (5.0%) |
| 5 or more Children | 0 (0.0%) | 0 (0.0%) |
| Total | 21 (0.7%) | 25 (4.6%) |
Employment Characteristics in Mendota Heights
Employment by Class of Employer in Mendota Heights
Among the 5,940 employed individuals in Mendota Heights, private company employees (3,984 | 67.1%), not-for-profit organizations (707 | 11.9%), and local government employees (358 | 6.0%) make up the most common classes of employment.
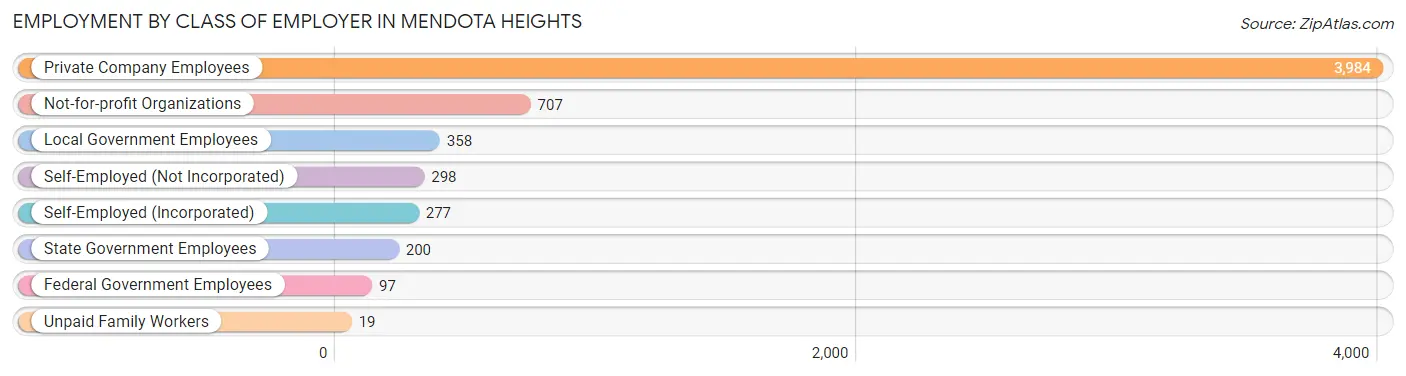
| Employer Class | # Employees | % Employees |
| Private Company Employees | 3,984 | 67.1% |
| Self-Employed (Incorporated) | 277 | 4.7% |
| Self-Employed (Not Incorporated) | 298 | 5.0% |
| Not-for-profit Organizations | 707 | 11.9% |
| Local Government Employees | 358 | 6.0% |
| State Government Employees | 200 | 3.4% |
| Federal Government Employees | 97 | 1.6% |
| Unpaid Family Workers | 19 | 0.3% |
| Total | 5,940 | 100.0% |
Employment Status by Age in Mendota Heights
According to the labor force statistics for Mendota Heights, out of the total population over 16 years of age (9,530), 64.5% or 6,147 individuals are in the labor force, with 0.9% or 55 of them unemployed. The age group with the highest labor force participation rate is 30 to 34 years, with 95.0% or 594 individuals in the labor force. Within the labor force, the 75 years and over age range has the highest percentage of unemployed individuals, with 6.6% or 7 of them being unemployed.
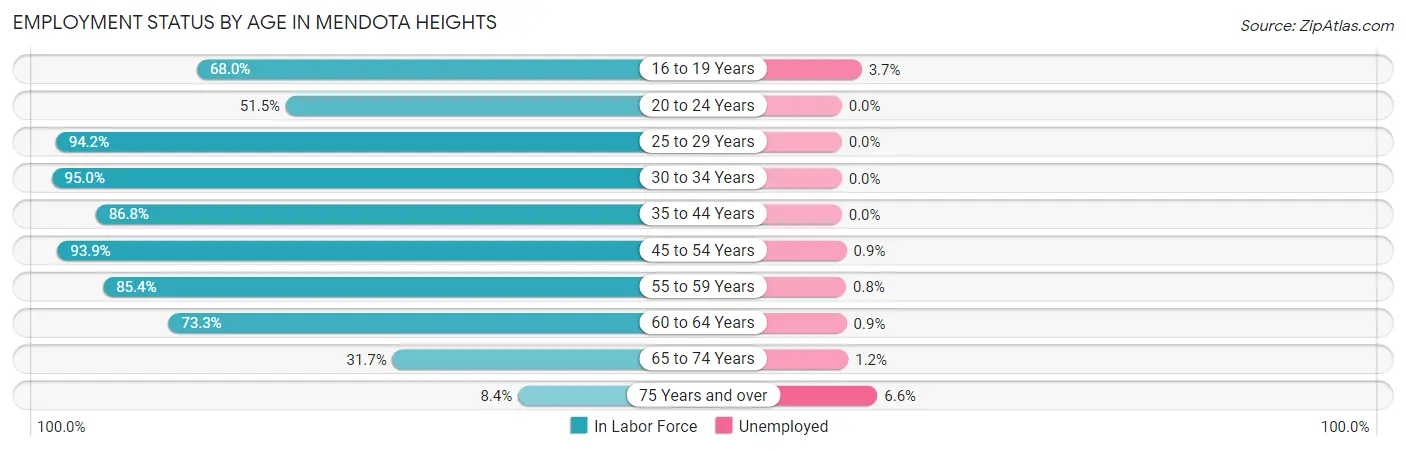
| Age Bracket | In Labor Force | Unemployed |
| 16 to 19 Years | 564 (68.0%) | 21 (3.7%) |
| 20 to 24 Years | 183 (51.5%) | 0 (0.0%) |
| 25 to 29 Years | 259 (94.2%) | 0 (0.0%) |
| 30 to 34 Years | 594 (95.0%) | 0 (0.0%) |
| 35 to 44 Years | 1,245 (86.8%) | 0 (0.0%) |
| 45 to 54 Years | 1,210 (93.9%) | 11 (0.9%) |
| 55 to 59 Years | 725 (85.4%) | 6 (0.8%) |
| 60 to 64 Years | 760 (73.3%) | 7 (0.9%) |
| 65 to 74 Years | 497 (31.7%) | 6 (1.2%) |
| 75 Years and over | 107 (8.4%) | 7 (6.6%) |
| Total | 6,147 (64.5%) | 55 (0.9%) |
Employment Status by Educational Attainment in Mendota Heights
According to labor force statistics for Mendota Heights, 87.0% of individuals (4,793) out of the total population between 25 and 64 years of age (5,509) are in the labor force, with 0.5% or 24 of them being unemployed. The group with the highest labor force participation rate are those with the educational attainment of less than high school, with 89.2% or 33 individuals in the labor force. Within the labor force, individuals with college / associate degree education have the highest percentage of unemployment, with 1.5% or 16 of them being unemployed.
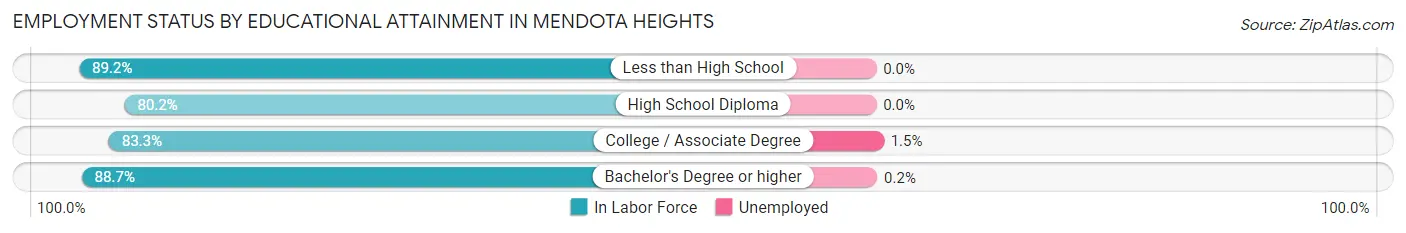
| Educational Attainment | In Labor Force | Unemployed |
| Less than High School | 33 (89.2%) | 0 (0.0%) |
| High School Diploma | 231 (80.2%) | 0 (0.0%) |
| College / Associate Degree | 1,075 (83.3%) | 19 (1.5%) |
| Bachelor's Degree or higher | 3,454 (88.7%) | 8 (0.2%) |
| Total | 4,793 (87.0%) | 28 (0.5%) |
Employment Occupations by Sex in Mendota Heights
Management, Business, Science and Arts Occupations
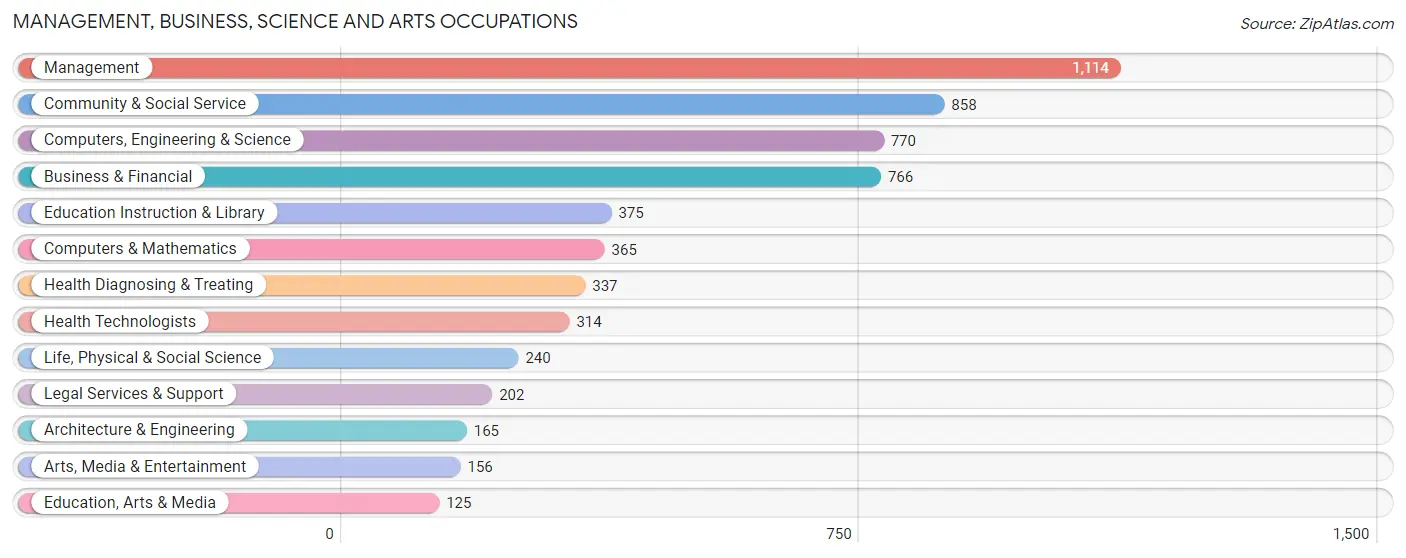
The most common Management, Business, Science and Arts occupations in Mendota Heights are Management (1,114 | 18.3%), Community & Social Service (858 | 14.1%), Computers, Engineering & Science (770 | 12.7%), Business & Financial (766 | 12.6%), and Education Instruction & Library (375 | 6.2%).
Management, Business, Science and Arts Occupations by Sex
Within the Management, Business, Science and Arts occupations in Mendota Heights, the most male-oriented occupations are Computers & Mathematics (83.6%), Computers, Engineering & Science (74.9%), and Life, Physical & Social Science (71.7%), while the most female-oriented occupations are Health Technologists (81.2%), Health Diagnosing & Treating (79.5%), and Education Instruction & Library (77.3%).
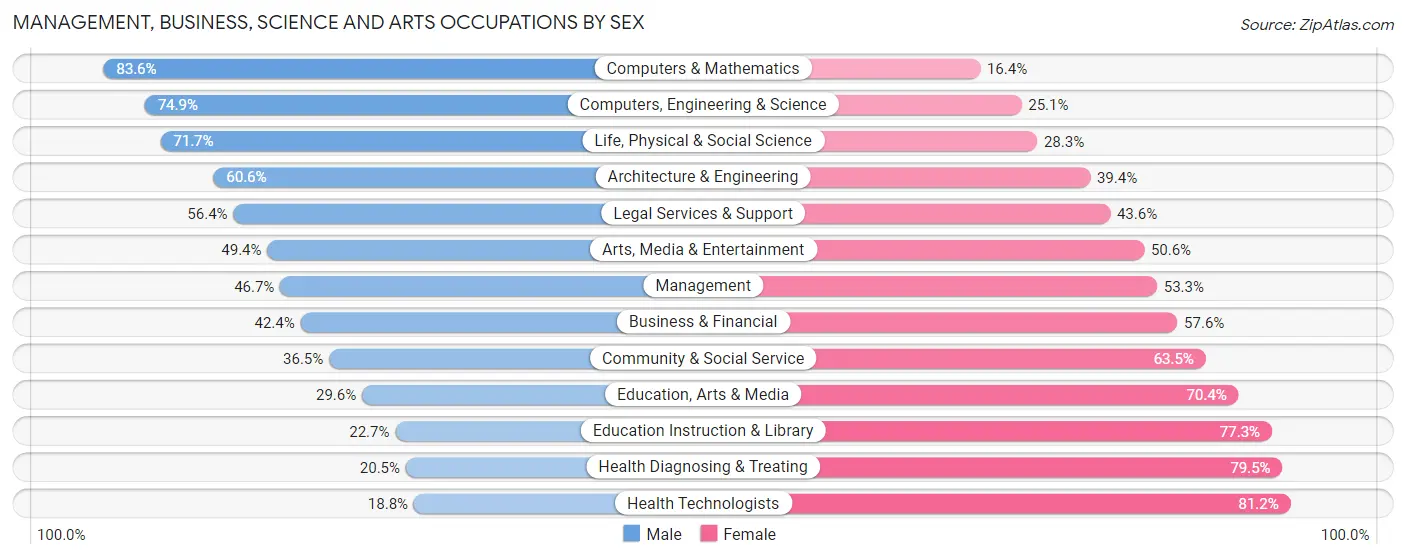
| Occupation | Male | Female |
| Management | 520 (46.7%) | 594 (53.3%) |
| Business & Financial | 325 (42.4%) | 441 (57.6%) |
| Computers, Engineering & Science | 577 (74.9%) | 193 (25.1%) |
| Computers & Mathematics | 305 (83.6%) | 60 (16.4%) |
| Architecture & Engineering | 100 (60.6%) | 65 (39.4%) |
| Life, Physical & Social Science | 172 (71.7%) | 68 (28.3%) |
| Community & Social Service | 313 (36.5%) | 545 (63.5%) |
| Education, Arts & Media | 37 (29.6%) | 88 (70.4%) |
| Legal Services & Support | 114 (56.4%) | 88 (43.6%) |
| Education Instruction & Library | 85 (22.7%) | 290 (77.3%) |
| Arts, Media & Entertainment | 77 (49.4%) | 79 (50.6%) |
| Health Diagnosing & Treating | 69 (20.5%) | 268 (79.5%) |
| Health Technologists | 59 (18.8%) | 255 (81.2%) |
| Total (Category) | 1,804 (46.9%) | 2,041 (53.1%) |
| Total (Overall) | 2,932 (48.3%) | 3,139 (51.7%) |
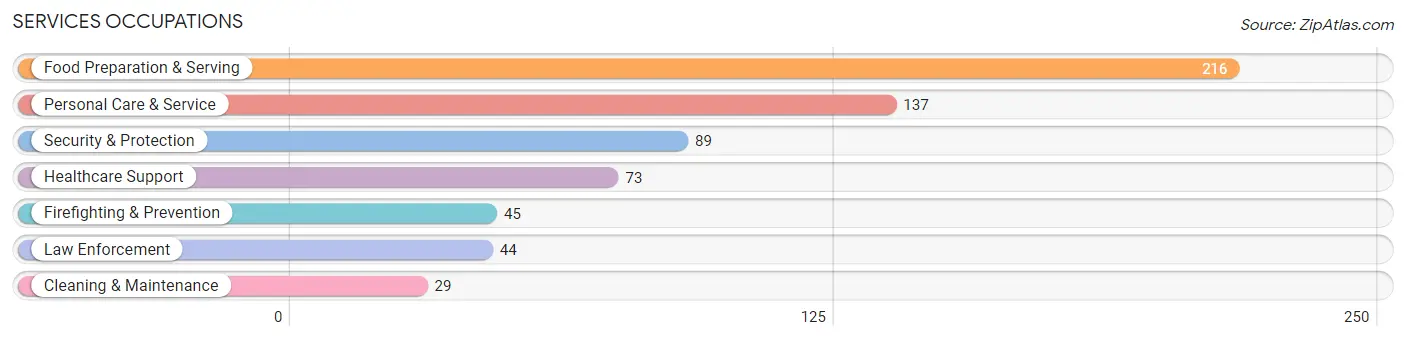
Services Occupations
The most common Services occupations in Mendota Heights are Food Preparation & Serving (216 | 3.6%), Personal Care & Service (137 | 2.3%), Security & Protection (89 | 1.5%), Healthcare Support (73 | 1.2%), and Firefighting & Prevention (45 | 0.7%).
Services Occupations by Sex
Within the Services occupations in Mendota Heights, the most male-oriented occupations are Law Enforcement (100.0%), Cleaning & Maintenance (100.0%), and Security & Protection (88.8%), while the most female-oriented occupations are Personal Care & Service (100.0%), Healthcare Support (84.9%), and Food Preparation & Serving (41.2%).
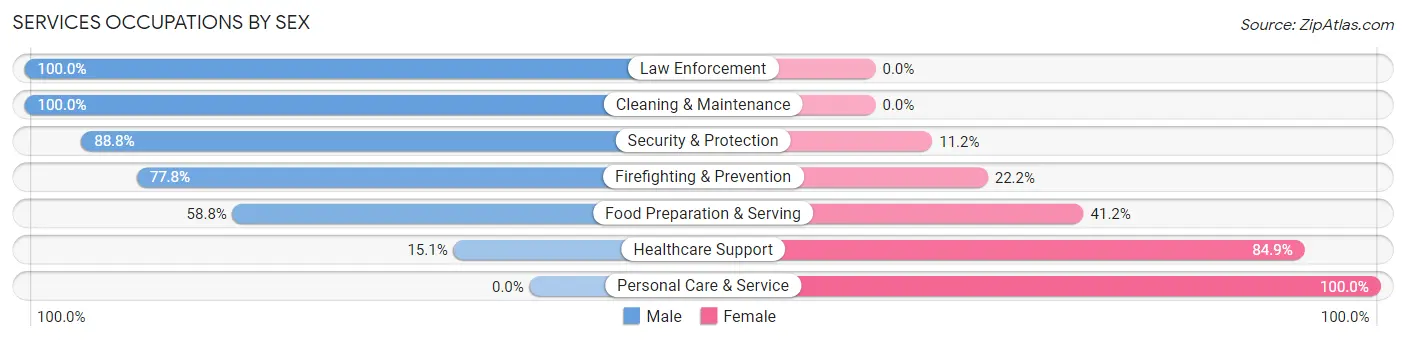
| Occupation | Male | Female |
| Healthcare Support | 11 (15.1%) | 62 (84.9%) |
| Security & Protection | 79 (88.8%) | 10 (11.2%) |
| Firefighting & Prevention | 35 (77.8%) | 10 (22.2%) |
| Law Enforcement | 44 (100.0%) | 0 (0.0%) |
| Food Preparation & Serving | 127 (58.8%) | 89 (41.2%) |
| Cleaning & Maintenance | 29 (100.0%) | 0 (0.0%) |
| Personal Care & Service | 0 (0.0%) | 137 (100.0%) |
| Total (Category) | 246 (45.2%) | 298 (54.8%) |
| Total (Overall) | 2,932 (48.3%) | 3,139 (51.7%) |
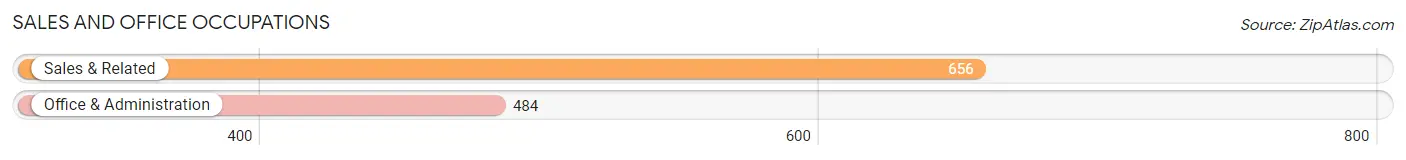
Sales and Office Occupations
The most common Sales and Office occupations in Mendota Heights are Sales & Related (656 | 10.8%), and Office & Administration (484 | 8.0%).
Sales and Office Occupations by Sex
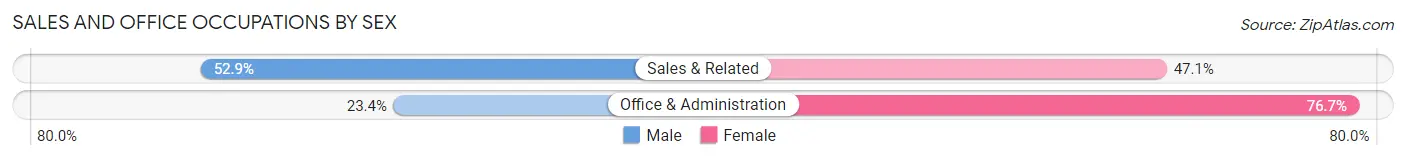
| Occupation | Male | Female |
| Sales & Related | 347 (52.9%) | 309 (47.1%) |
| Office & Administration | 113 (23.4%) | 371 (76.6%) |
| Total (Category) | 460 (40.4%) | 680 (59.7%) |
| Total (Overall) | 2,932 (48.3%) | 3,139 (51.7%) |
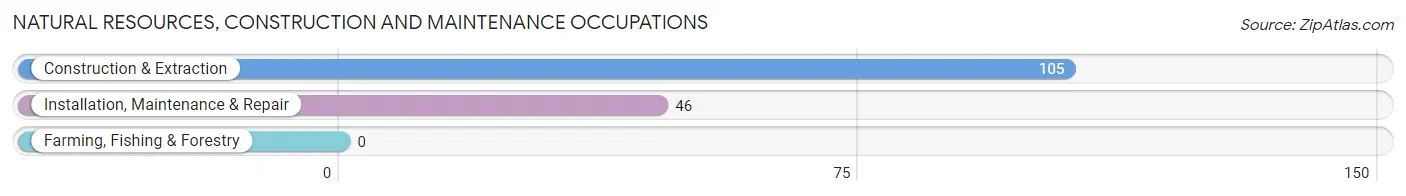
Natural Resources, Construction and Maintenance Occupations
The most common Natural Resources, Construction and Maintenance occupations in Mendota Heights are Construction & Extraction (105 | 1.7%), and Installation, Maintenance & Repair (46 | 0.8%).
Natural Resources, Construction and Maintenance Occupations by Sex
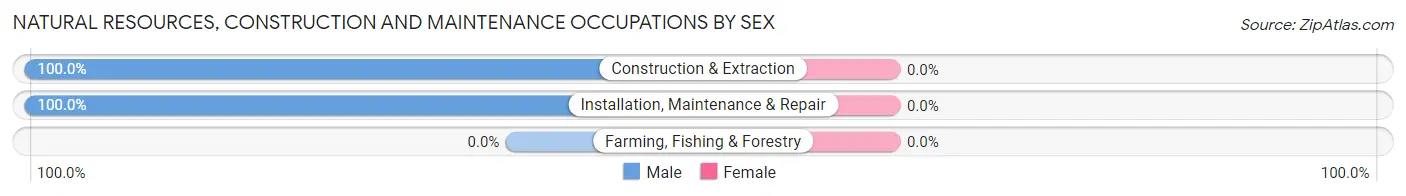
| Occupation | Male | Female |
| Farming, Fishing & Forestry | 0 (0.0%) | 0 (0.0%) |
| Construction & Extraction | 105 (100.0%) | 0 (0.0%) |
| Installation, Maintenance & Repair | 46 (100.0%) | 0 (0.0%) |
| Total (Category) | 151 (100.0%) | 0 (0.0%) |
| Total (Overall) | 2,932 (48.3%) | 3,139 (51.7%) |
Production, Transportation and Moving Occupations
The most common Production, Transportation and Moving occupations in Mendota Heights are Material Moving (144 | 2.4%), Production (127 | 2.1%), and Transportation (120 | 2.0%).
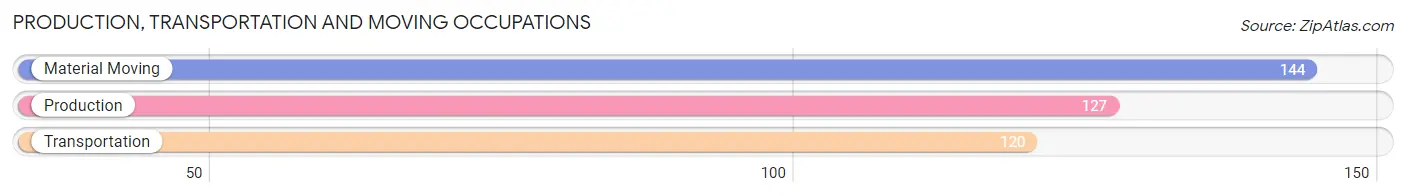
Production, Transportation and Moving Occupations by Sex
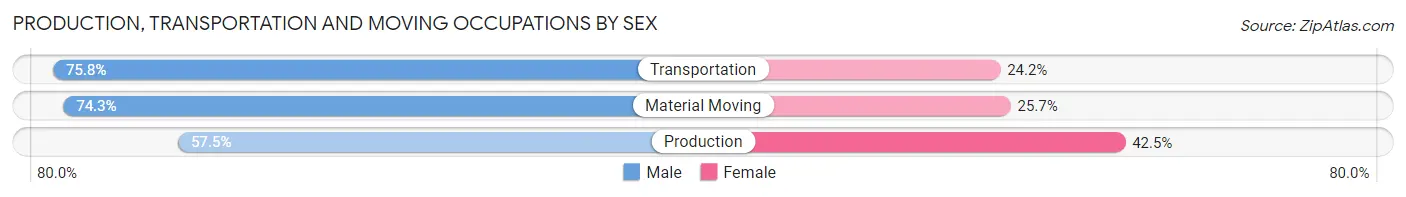
| Occupation | Male | Female |
| Production | 73 (57.5%) | 54 (42.5%) |
| Transportation | 91 (75.8%) | 29 (24.2%) |
| Material Moving | 107 (74.3%) | 37 (25.7%) |
| Total (Category) | 271 (69.3%) | 120 (30.7%) |
| Total (Overall) | 2,932 (48.3%) | 3,139 (51.7%) |
Employment Industries by Sex in Mendota Heights
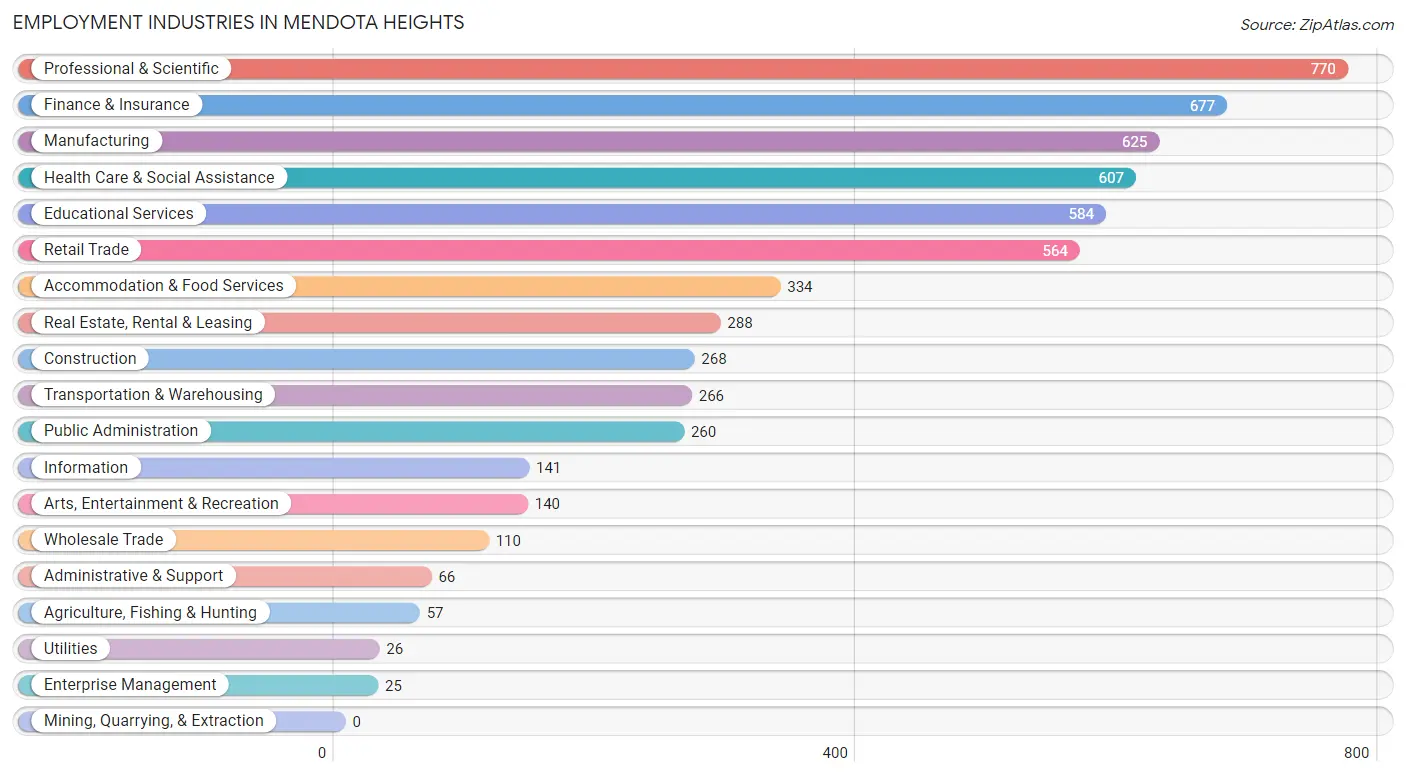
Employment Industries in Mendota Heights
The major employment industries in Mendota Heights include Professional & Scientific (770 | 12.7%), Finance & Insurance (677 | 11.2%), Manufacturing (625 | 10.3%), Health Care & Social Assistance (607 | 10.0%), and Educational Services (584 | 9.6%).
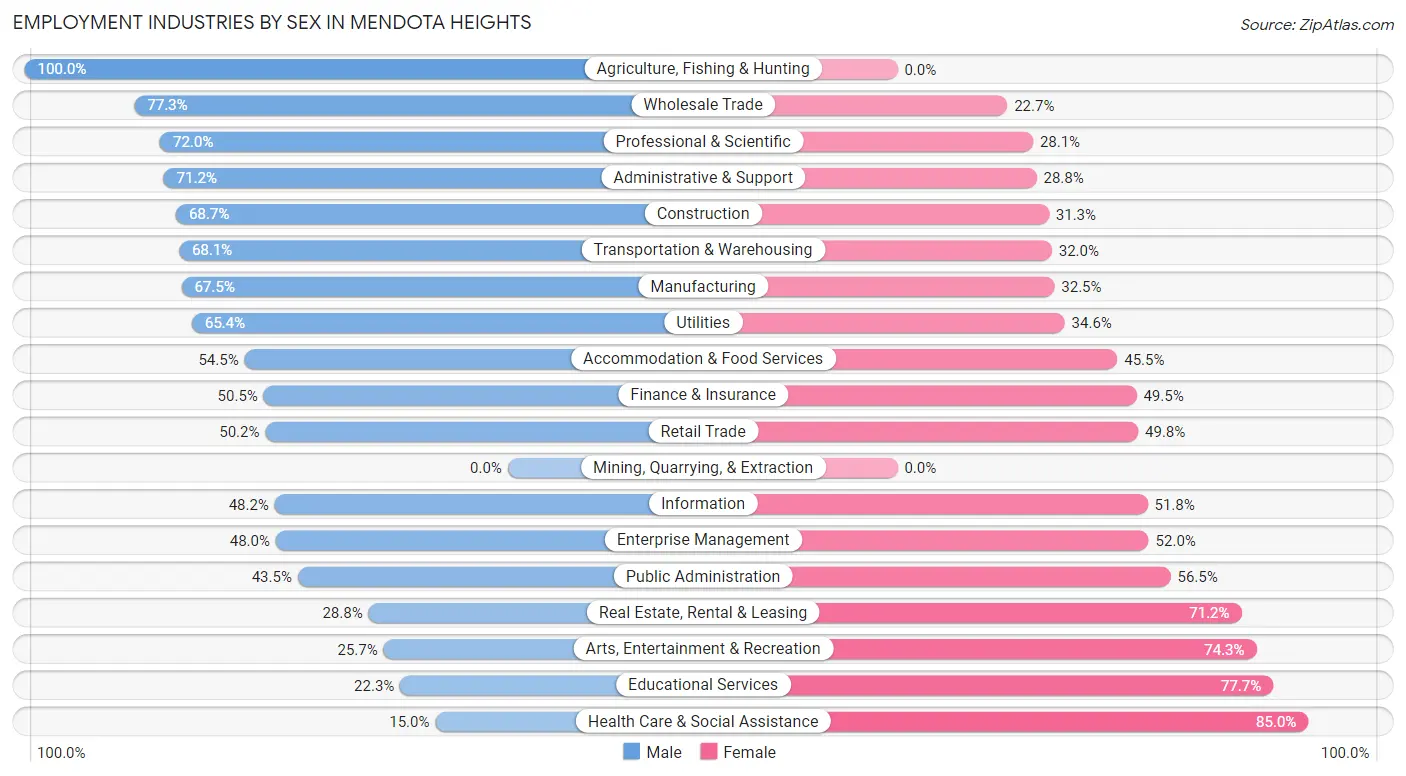
Employment Industries by Sex in Mendota Heights
The Mendota Heights industries that see more men than women are Agriculture, Fishing & Hunting (100.0%), Wholesale Trade (77.3%), and Professional & Scientific (72.0%), whereas the industries that tend to have a higher number of women are Health Care & Social Assistance (85.0%), Educational Services (77.7%), and Arts, Entertainment & Recreation (74.3%).
| Industry | Male | Female |
| Agriculture, Fishing & Hunting | 57 (100.0%) | 0 (0.0%) |
| Mining, Quarrying, & Extraction | 0 (0.0%) | 0 (0.0%) |
| Construction | 184 (68.7%) | 84 (31.3%) |
| Manufacturing | 422 (67.5%) | 203 (32.5%) |
| Wholesale Trade | 85 (77.3%) | 25 (22.7%) |
| Retail Trade | 283 (50.2%) | 281 (49.8%) |
| Transportation & Warehousing | 181 (68.0%) | 85 (32.0%) |
| Utilities | 17 (65.4%) | 9 (34.6%) |
| Information | 68 (48.2%) | 73 (51.8%) |
| Finance & Insurance | 342 (50.5%) | 335 (49.5%) |
| Real Estate, Rental & Leasing | 83 (28.8%) | 205 (71.2%) |
| Professional & Scientific | 554 (72.0%) | 216 (28.1%) |
| Enterprise Management | 12 (48.0%) | 13 (52.0%) |
| Administrative & Support | 47 (71.2%) | 19 (28.8%) |
| Educational Services | 130 (22.3%) | 454 (77.7%) |
| Health Care & Social Assistance | 91 (15.0%) | 516 (85.0%) |
| Arts, Entertainment & Recreation | 36 (25.7%) | 104 (74.3%) |
| Accommodation & Food Services | 182 (54.5%) | 152 (45.5%) |
| Public Administration | 113 (43.5%) | 147 (56.5%) |
| Total | 2,932 (48.3%) | 3,139 (51.7%) |
Education in Mendota Heights
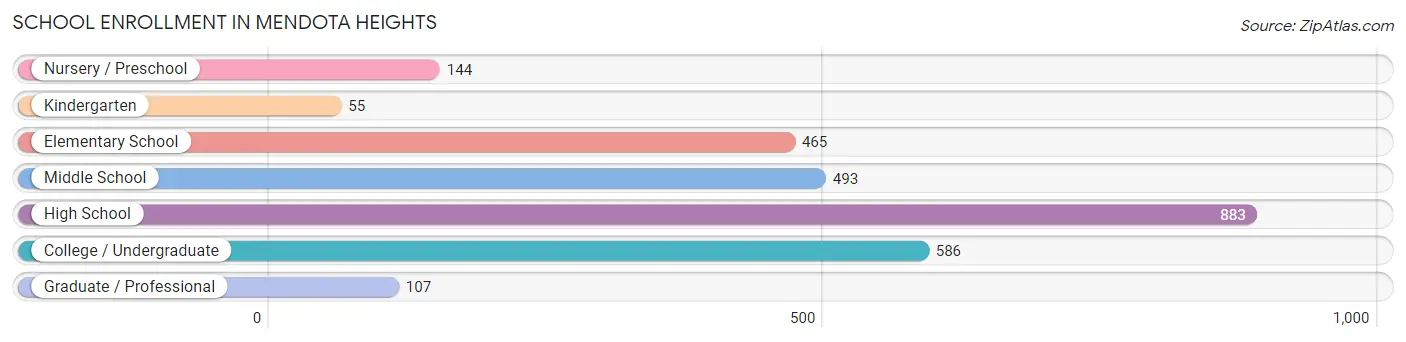
School Enrollment in Mendota Heights
The most common levels of schooling among the 2,733 students in Mendota Heights are high school (883 | 32.3%), college / undergraduate (586 | 21.4%), and middle school (493 | 18.0%).
| School Level | # Students | % Students |
| Nursery / Preschool | 144 | 5.3% |
| Kindergarten | 55 | 2.0% |
| Elementary School | 465 | 17.0% |
| Middle School | 493 | 18.0% |
| High School | 883 | 32.3% |
| College / Undergraduate | 586 | 21.4% |
| Graduate / Professional | 107 | 3.9% |
| Total | 2,733 | 100.0% |
School Enrollment by Age by Funding Source in Mendota Heights
Out of a total of 2,733 students who are enrolled in schools in Mendota Heights, 894 (32.7%) attend a private institution, while the remaining 1,839 (67.3%) are enrolled in public schools. The age group of 3 to 4 year olds has the highest likelihood of being enrolled in private schools, with 114 (83.8% in the age bracket) enrolled. Conversely, the age group of 20 to 24 year olds has the lowest likelihood of being enrolled in a private school, with 213 (80.4% in the age bracket) attending a public institution.
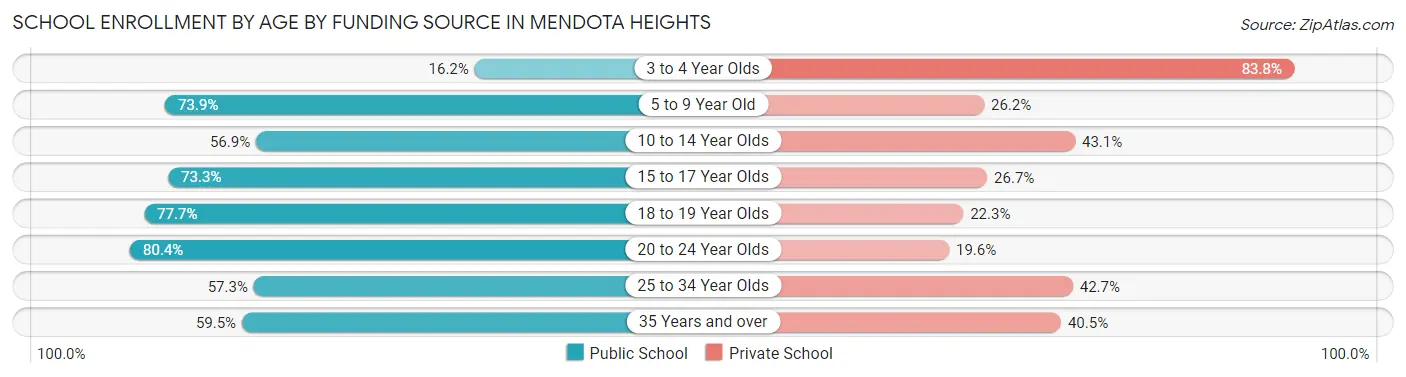
| Age Bracket | Public School | Private School |
| 3 to 4 Year Olds | 22 (16.2%) | 114 (83.8%) |
| 5 to 9 Year Old | 336 (73.9%) | 119 (26.2%) |
| 10 to 14 Year Olds | 375 (56.9%) | 284 (43.1%) |
| 15 to 17 Year Olds | 466 (73.3%) | 170 (26.7%) |
| 18 to 19 Year Olds | 356 (77.7%) | 102 (22.3%) |
| 20 to 24 Year Olds | 213 (80.4%) | 52 (19.6%) |
| 25 to 34 Year Olds | 47 (57.3%) | 35 (42.7%) |
| 35 Years and over | 25 (59.5%) | 17 (40.5%) |
| Total | 1,839 (67.3%) | 894 (32.7%) |
Educational Attainment by Field of Study in Mendota Heights
Business (1,275 | 20.4%), social sciences (678 | 10.9%), education (577 | 9.3%), literature & languages (467 | 7.5%), and science & technology (431 | 6.9%) are the most common fields of study among 6,234 individuals in Mendota Heights who have obtained a bachelor's degree or higher.
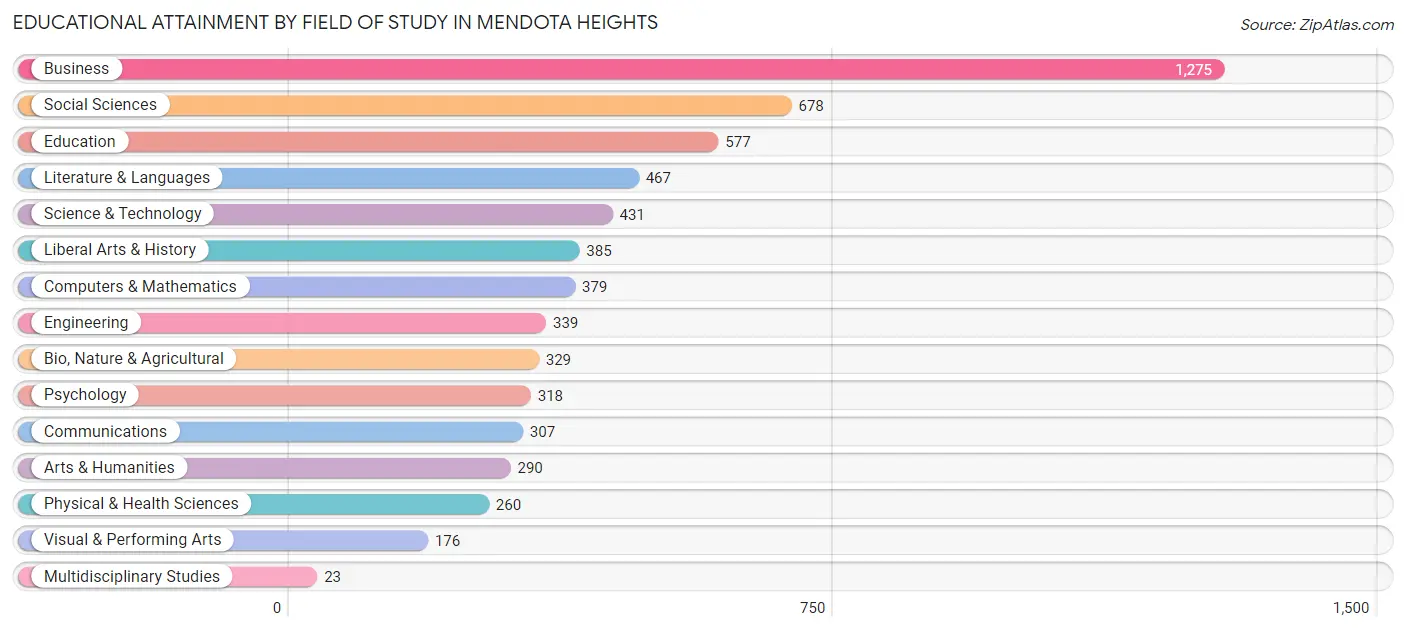
| Field of Study | # Graduates | % Graduates |
| Computers & Mathematics | 379 | 6.1% |
| Bio, Nature & Agricultural | 329 | 5.3% |
| Physical & Health Sciences | 260 | 4.2% |
| Psychology | 318 | 5.1% |
| Social Sciences | 678 | 10.9% |
| Engineering | 339 | 5.4% |
| Multidisciplinary Studies | 23 | 0.4% |
| Science & Technology | 431 | 6.9% |
| Business | 1,275 | 20.4% |
| Education | 577 | 9.3% |
| Literature & Languages | 467 | 7.5% |
| Liberal Arts & History | 385 | 6.2% |
| Visual & Performing Arts | 176 | 2.8% |
| Communications | 307 | 4.9% |
| Arts & Humanities | 290 | 4.6% |
| Total | 6,234 | 100.0% |
Transportation & Commute in Mendota Heights
Vehicle Availability by Sex in Mendota Heights
The most prevalent vehicle ownership categories in Mendota Heights are males with 2 vehicles (1,676, accounting for 57.1%) and females with 2 vehicles (1,471, making up 56.0%).
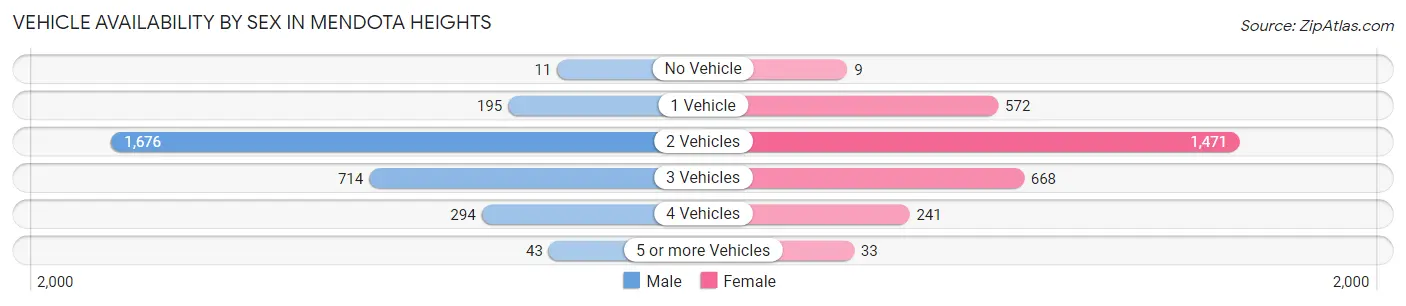
| Vehicles Available | Male | Female |
| No Vehicle | 11 (0.4%) | 9 (0.3%) |
| 1 Vehicle | 195 (6.7%) | 572 (19.1%) |
| 2 Vehicles | 1,676 (57.1%) | 1,471 (49.1%) |
| 3 Vehicles | 714 (24.3%) | 668 (22.3%) |
| 4 Vehicles | 294 (10.0%) | 241 (8.1%) |
| 5 or more Vehicles | 43 (1.5%) | 33 (1.1%) |
| Total | 2,933 (100.0%) | 2,994 (100.0%) |
Commute Time in Mendota Heights
The most frequently occuring commute durations in Mendota Heights are 15 to 19 minutes (1,143 commuters, 24.8%), 10 to 14 minutes (748 commuters, 16.3%), and 20 to 24 minutes (741 commuters, 16.1%).
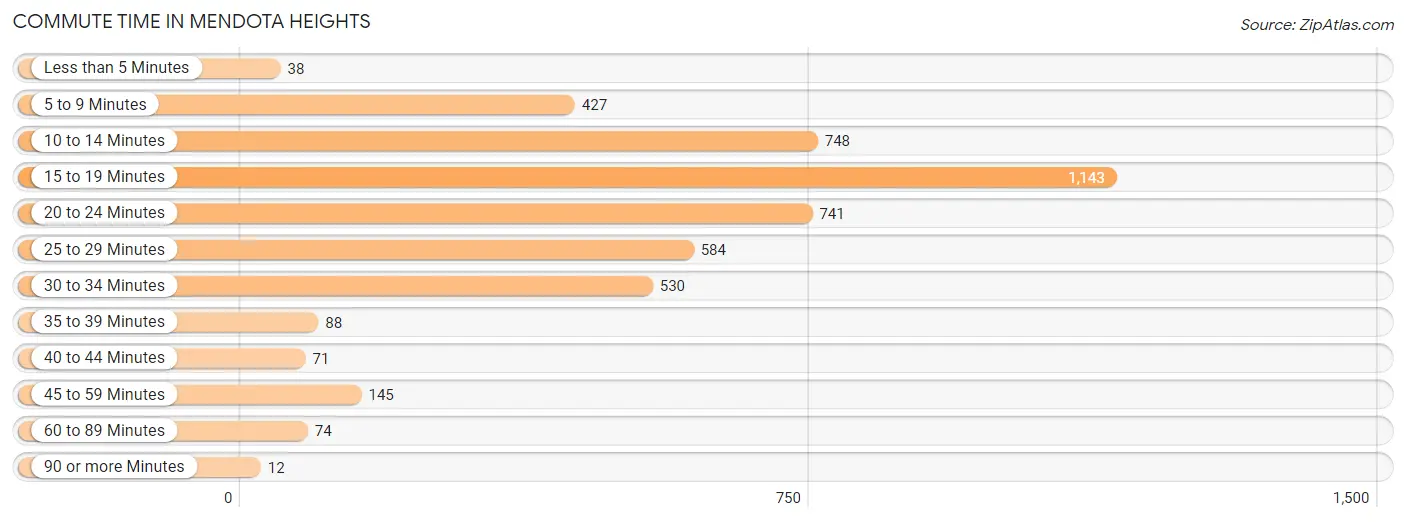
| Commute Time | # Commuters | % Commuters |
| Less than 5 Minutes | 38 | 0.8% |
| 5 to 9 Minutes | 427 | 9.3% |
| 10 to 14 Minutes | 748 | 16.3% |
| 15 to 19 Minutes | 1,143 | 24.8% |
| 20 to 24 Minutes | 741 | 16.1% |
| 25 to 29 Minutes | 584 | 12.7% |
| 30 to 34 Minutes | 530 | 11.5% |
| 35 to 39 Minutes | 88 | 1.9% |
| 40 to 44 Minutes | 71 | 1.5% |
| 45 to 59 Minutes | 145 | 3.2% |
| 60 to 89 Minutes | 74 | 1.6% |
| 90 or more Minutes | 12 | 0.3% |
Commute Time by Sex in Mendota Heights
The most common commute times in Mendota Heights are 15 to 19 minutes (626 commuters, 27.6%) for males and 15 to 19 minutes (517 commuters, 22.2%) for females.
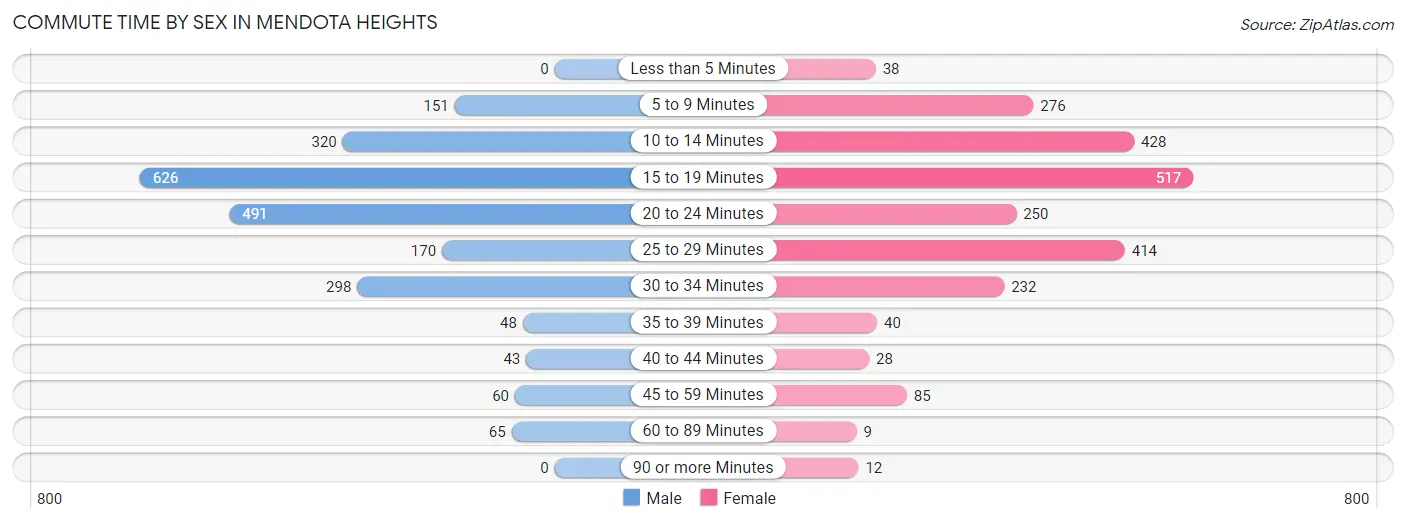
| Commute Time | Male | Female |
| Less than 5 Minutes | 0 (0.0%) | 38 (1.6%) |
| 5 to 9 Minutes | 151 (6.7%) | 276 (11.8%) |
| 10 to 14 Minutes | 320 (14.1%) | 428 (18.4%) |
| 15 to 19 Minutes | 626 (27.6%) | 517 (22.2%) |
| 20 to 24 Minutes | 491 (21.6%) | 250 (10.7%) |
| 25 to 29 Minutes | 170 (7.5%) | 414 (17.8%) |
| 30 to 34 Minutes | 298 (13.1%) | 232 (10.0%) |
| 35 to 39 Minutes | 48 (2.1%) | 40 (1.7%) |
| 40 to 44 Minutes | 43 (1.9%) | 28 (1.2%) |
| 45 to 59 Minutes | 60 (2.6%) | 85 (3.6%) |
| 60 to 89 Minutes | 65 (2.9%) | 9 (0.4%) |
| 90 or more Minutes | 0 (0.0%) | 12 (0.5%) |
Time of Departure to Work by Sex in Mendota Heights
The most frequent times of departure to work in Mendota Heights are 7:30 AM to 7:59 AM (445, 19.6%) for males and 7:30 AM to 7:59 AM (488, 20.9%) for females.
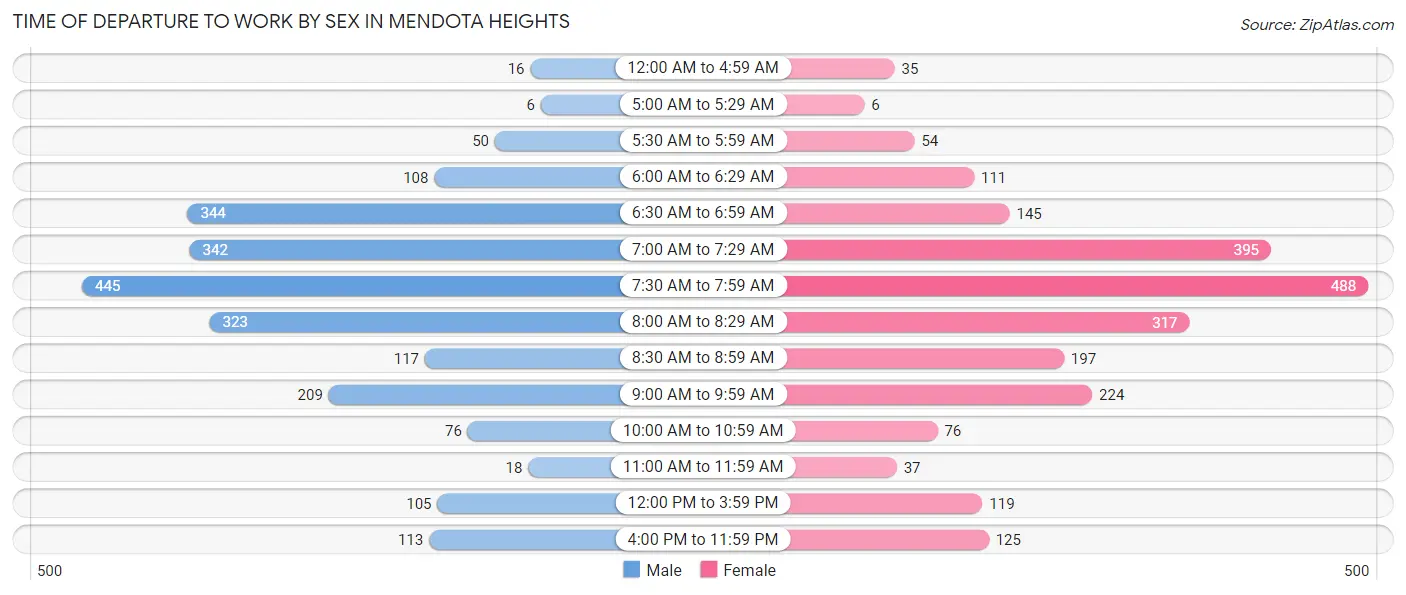
| Time of Departure | Male | Female |
| 12:00 AM to 4:59 AM | 16 (0.7%) | 35 (1.5%) |
| 5:00 AM to 5:29 AM | 6 (0.3%) | 6 (0.3%) |
| 5:30 AM to 5:59 AM | 50 (2.2%) | 54 (2.3%) |
| 6:00 AM to 6:29 AM | 108 (4.8%) | 111 (4.8%) |
| 6:30 AM to 6:59 AM | 344 (15.1%) | 145 (6.2%) |
| 7:00 AM to 7:29 AM | 342 (15.0%) | 395 (17.0%) |
| 7:30 AM to 7:59 AM | 445 (19.6%) | 488 (20.9%) |
| 8:00 AM to 8:29 AM | 323 (14.2%) | 317 (13.6%) |
| 8:30 AM to 8:59 AM | 117 (5.1%) | 197 (8.5%) |
| 9:00 AM to 9:59 AM | 209 (9.2%) | 224 (9.6%) |
| 10:00 AM to 10:59 AM | 76 (3.4%) | 76 (3.3%) |
| 11:00 AM to 11:59 AM | 18 (0.8%) | 37 (1.6%) |
| 12:00 PM to 3:59 PM | 105 (4.6%) | 119 (5.1%) |
| 4:00 PM to 11:59 PM | 113 (5.0%) | 125 (5.4%) |
| Total | 2,272 (100.0%) | 2,329 (100.0%) |
Housing Occupancy in Mendota Heights
Occupancy by Ownership in Mendota Heights
Of the total 4,735 dwellings in Mendota Heights, owner-occupied units account for 3,904 (82.5%), while renter-occupied units make up 831 (17.5%).
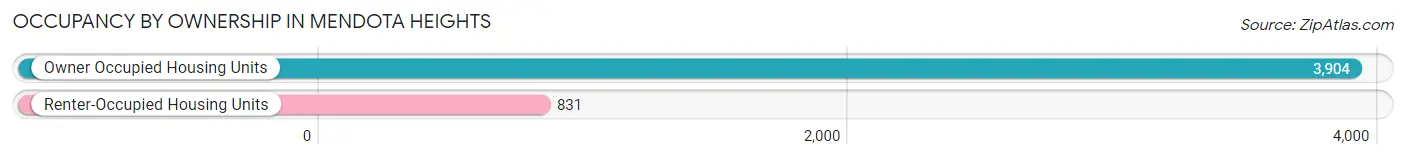
| Occupancy | # Housing Units | % Housing Units |
| Owner Occupied Housing Units | 3,904 | 82.5% |
| Renter-Occupied Housing Units | 831 | 17.5% |
| Total Occupied Housing Units | 4,735 | 100.0% |
Occupancy by Household Size in Mendota Heights
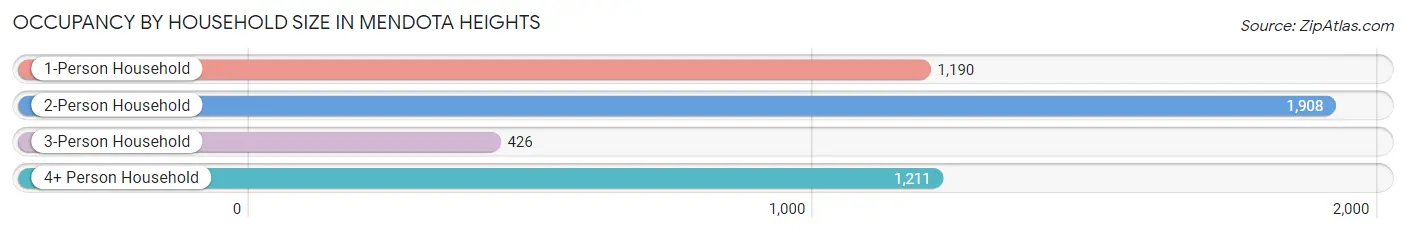
| Household Size | # Housing Units | % Housing Units |
| 1-Person Household | 1,190 | 25.1% |
| 2-Person Household | 1,908 | 40.3% |
| 3-Person Household | 426 | 9.0% |
| 4+ Person Household | 1,211 | 25.6% |
| Total Housing Units | 4,735 | 100.0% |
Occupancy by Ownership by Household Size in Mendota Heights
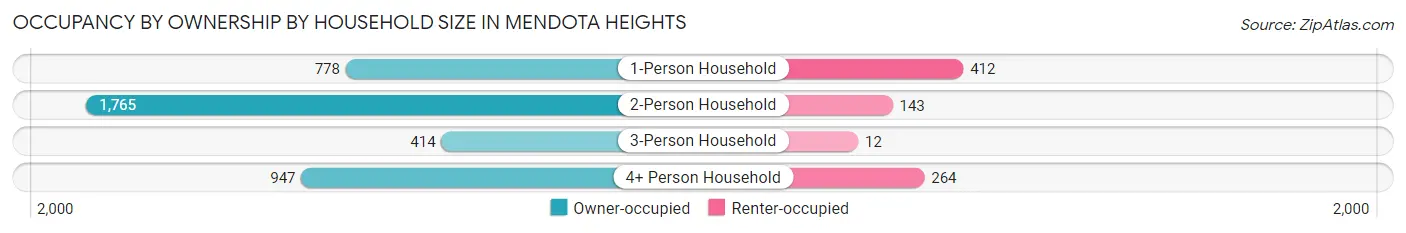
| Household Size | Owner-occupied | Renter-occupied |
| 1-Person Household | 778 (65.4%) | 412 (34.6%) |
| 2-Person Household | 1,765 (92.5%) | 143 (7.5%) |
| 3-Person Household | 414 (97.2%) | 12 (2.8%) |
| 4+ Person Household | 947 (78.2%) | 264 (21.8%) |
| Total Housing Units | 3,904 (82.5%) | 831 (17.5%) |
Occupancy by Educational Attainment in Mendota Heights
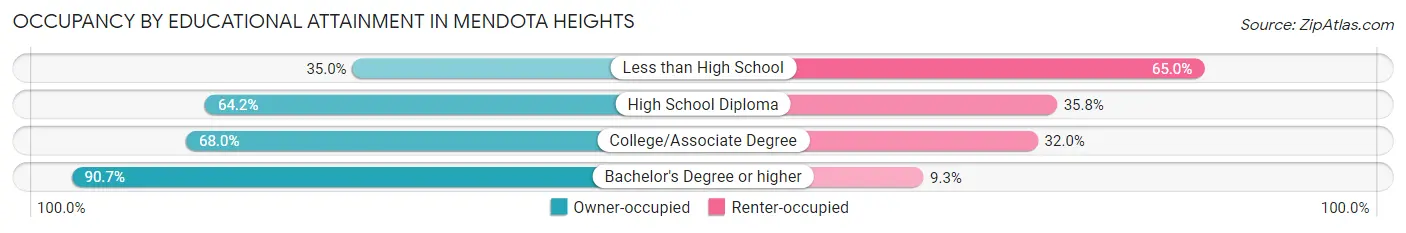
| Household Size | Owner-occupied | Renter-occupied |
| Less than High School | 14 (35.0%) | 26 (65.0%) |
| High School Diploma | 192 (64.2%) | 107 (35.8%) |
| College/Associate Degree | 864 (68.0%) | 407 (32.0%) |
| Bachelor's Degree or higher | 2,834 (90.7%) | 291 (9.3%) |
Occupancy by Age of Householder in Mendota Heights
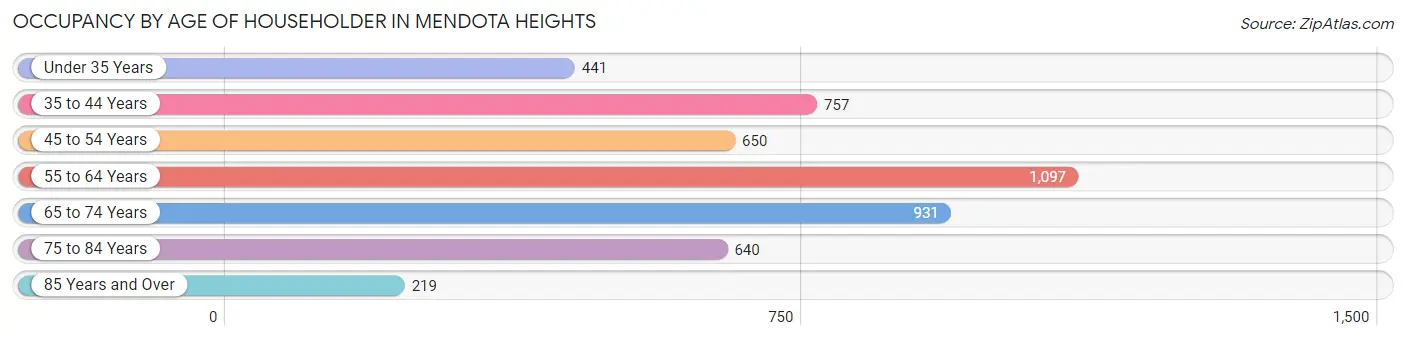
| Age Bracket | # Households | % Households |
| Under 35 Years | 441 | 9.3% |
| 35 to 44 Years | 757 | 16.0% |
| 45 to 54 Years | 650 | 13.7% |
| 55 to 64 Years | 1,097 | 23.2% |
| 65 to 74 Years | 931 | 19.7% |
| 75 to 84 Years | 640 | 13.5% |
| 85 Years and Over | 219 | 4.6% |
| Total | 4,735 | 100.0% |
Housing Finances in Mendota Heights
Median Income by Occupancy in Mendota Heights
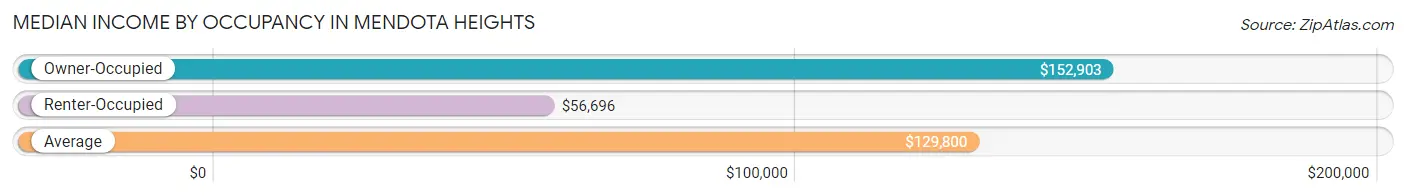
| Occupancy Type | # Households | Median Income |
| Owner-Occupied | 3,904 (82.5%) | $152,903 |
| Renter-Occupied | 831 (17.5%) | $56,696 |
| Average | 4,735 (100.0%) | $129,800 |
Occupancy by Householder Income Bracket in Mendota Heights
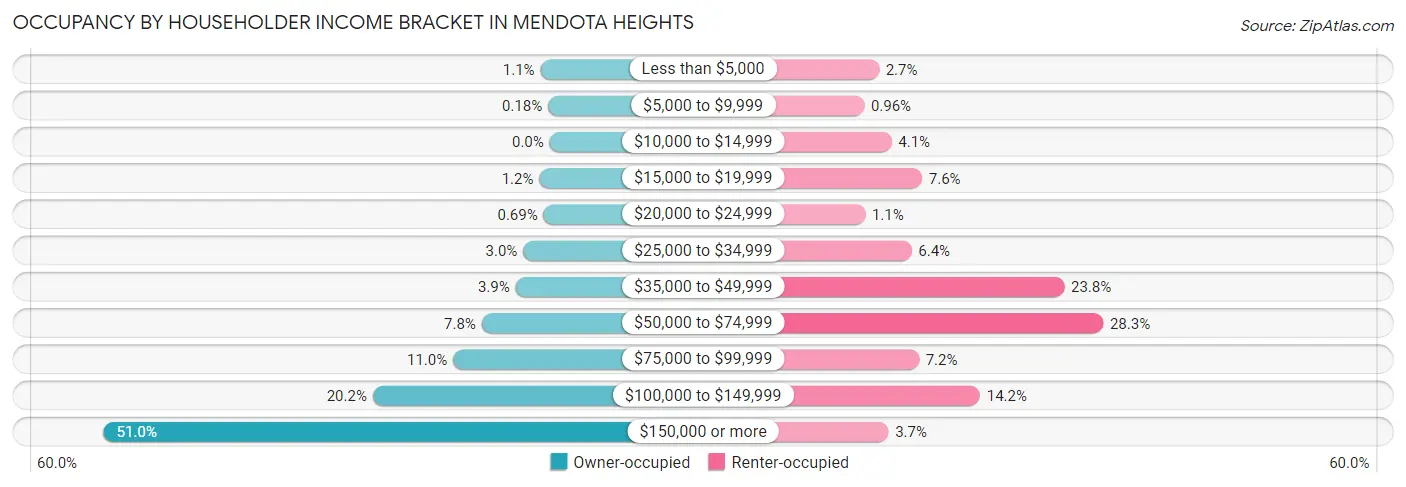
| Income Bracket | Owner-occupied | Renter-occupied |
| Less than $5,000 | 41 (1.1%) | 22 (2.6%) |
| $5,000 to $9,999 | 7 (0.2%) | 8 (1.0%) |
| $10,000 to $14,999 | 0 (0.0%) | 34 (4.1%) |
| $15,000 to $19,999 | 46 (1.2%) | 63 (7.6%) |
| $20,000 to $24,999 | 27 (0.7%) | 9 (1.1%) |
| $25,000 to $34,999 | 118 (3.0%) | 53 (6.4%) |
| $35,000 to $49,999 | 152 (3.9%) | 198 (23.8%) |
| $50,000 to $74,999 | 303 (7.8%) | 235 (28.3%) |
| $75,000 to $99,999 | 431 (11.0%) | 60 (7.2%) |
| $100,000 to $149,999 | 789 (20.2%) | 118 (14.2%) |
| $150,000 or more | 1,990 (51.0%) | 31 (3.7%) |
| Total | 3,904 (100.0%) | 831 (100.0%) |
Monthly Housing Cost Tiers in Mendota Heights
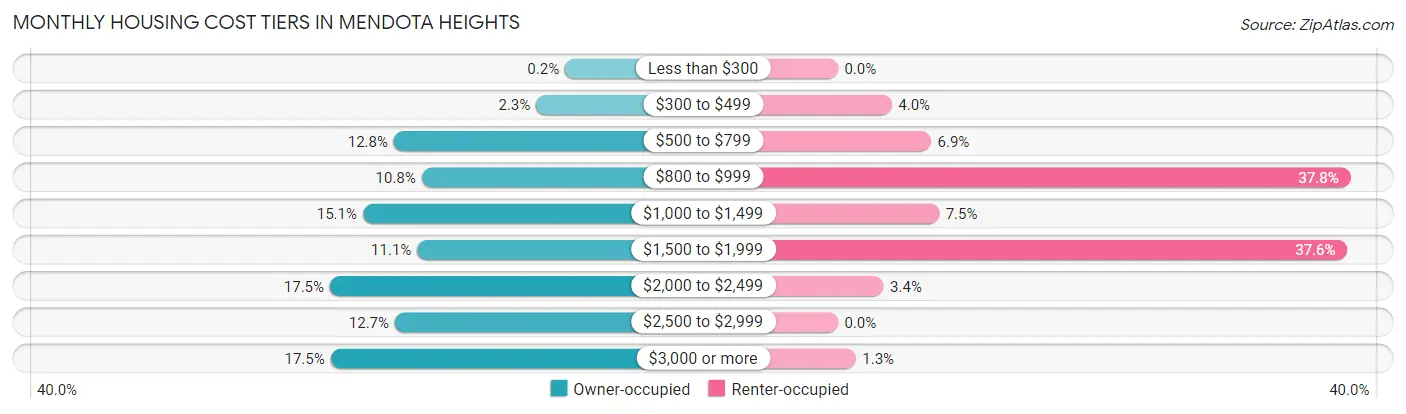
| Monthly Cost | Owner-occupied | Renter-occupied |
| Less than $300 | 8 (0.2%) | 0 (0.0%) |
| $300 to $499 | 91 (2.3%) | 33 (4.0%) |
| $500 to $799 | 500 (12.8%) | 57 (6.9%) |
| $800 to $999 | 420 (10.8%) | 314 (37.8%) |
| $1,000 to $1,499 | 589 (15.1%) | 62 (7.5%) |
| $1,500 to $1,999 | 433 (11.1%) | 312 (37.6%) |
| $2,000 to $2,499 | 684 (17.5%) | 28 (3.4%) |
| $2,500 to $2,999 | 497 (12.7%) | 0 (0.0%) |
| $3,000 or more | 682 (17.5%) | 11 (1.3%) |
| Total | 3,904 (100.0%) | 831 (100.0%) |
Physical Housing Characteristics in Mendota Heights
Housing Structures in Mendota Heights
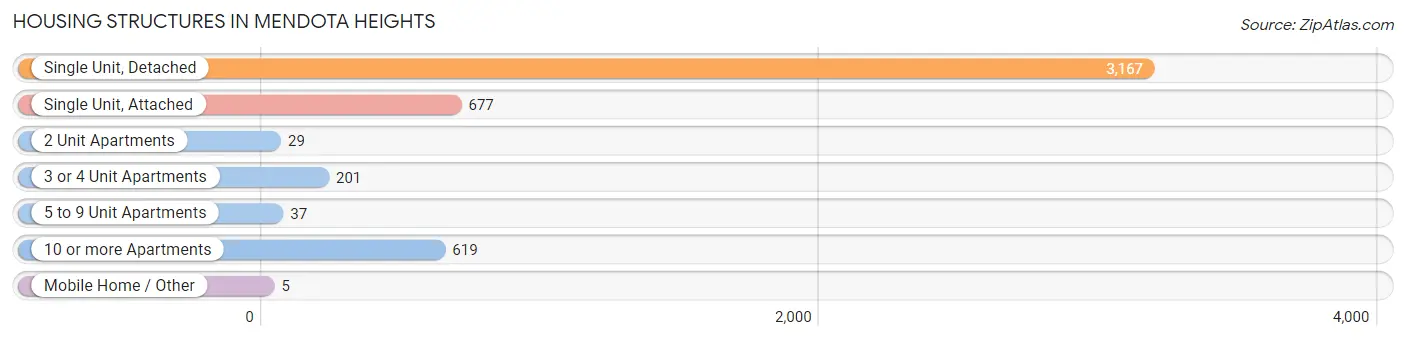
| Structure Type | # Housing Units | % Housing Units |
| Single Unit, Detached | 3,167 | 66.9% |
| Single Unit, Attached | 677 | 14.3% |
| 2 Unit Apartments | 29 | 0.6% |
| 3 or 4 Unit Apartments | 201 | 4.2% |
| 5 to 9 Unit Apartments | 37 | 0.8% |
| 10 or more Apartments | 619 | 13.1% |
| Mobile Home / Other | 5 | 0.1% |
| Total | 4,735 | 100.0% |
Housing Structures by Occupancy in Mendota Heights
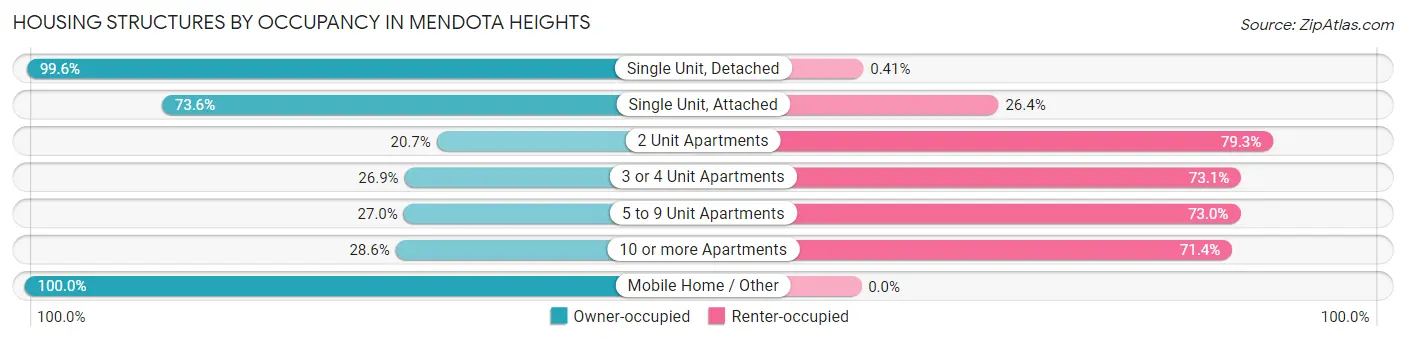
| Structure Type | Owner-occupied | Renter-occupied |
| Single Unit, Detached | 3,154 (99.6%) | 13 (0.4%) |
| Single Unit, Attached | 498 (73.6%) | 179 (26.4%) |
| 2 Unit Apartments | 6 (20.7%) | 23 (79.3%) |
| 3 or 4 Unit Apartments | 54 (26.9%) | 147 (73.1%) |
| 5 to 9 Unit Apartments | 10 (27.0%) | 27 (73.0%) |
| 10 or more Apartments | 177 (28.6%) | 442 (71.4%) |
| Mobile Home / Other | 5 (100.0%) | 0 (0.0%) |
| Total | 3,904 (82.5%) | 831 (17.5%) |
Housing Structures by Number of Rooms in Mendota Heights
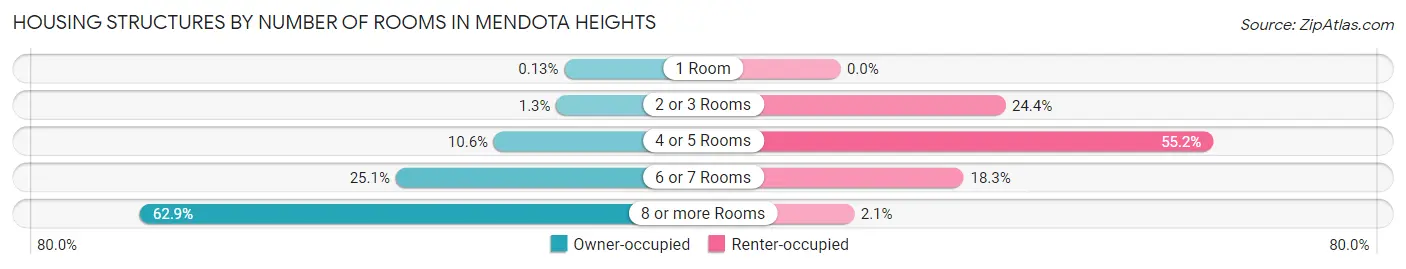
| Number of Rooms | Owner-occupied | Renter-occupied |
| 1 Room | 5 (0.1%) | 0 (0.0%) |
| 2 or 3 Rooms | 51 (1.3%) | 203 (24.4%) |
| 4 or 5 Rooms | 412 (10.5%) | 459 (55.2%) |
| 6 or 7 Rooms | 979 (25.1%) | 152 (18.3%) |
| 8 or more Rooms | 2,457 (62.9%) | 17 (2.1%) |
| Total | 3,904 (100.0%) | 831 (100.0%) |
Housing Structure by Heating Type in Mendota Heights
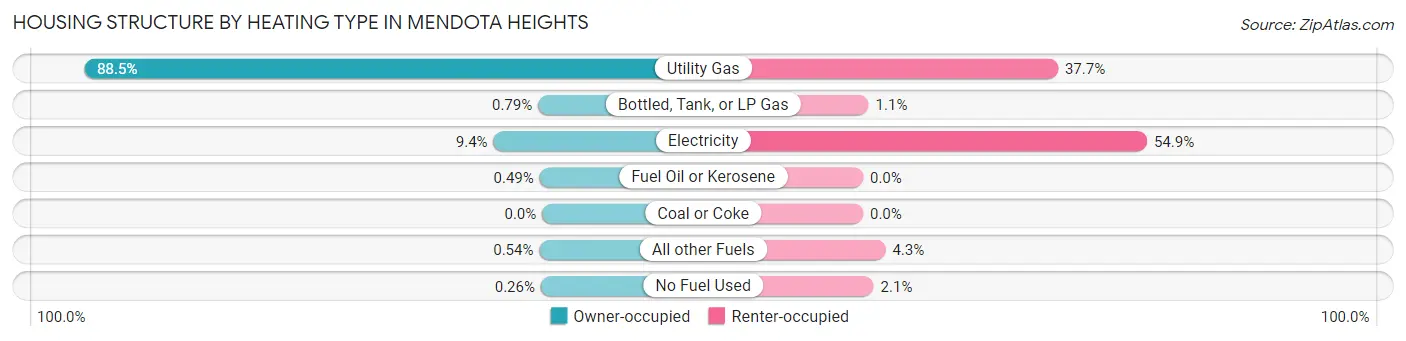
| Heating Type | Owner-occupied | Renter-occupied |
| Utility Gas | 3,456 (88.5%) | 313 (37.7%) |
| Bottled, Tank, or LP Gas | 31 (0.8%) | 9 (1.1%) |
| Electricity | 367 (9.4%) | 456 (54.9%) |
| Fuel Oil or Kerosene | 19 (0.5%) | 0 (0.0%) |
| Coal or Coke | 0 (0.0%) | 0 (0.0%) |
| All other Fuels | 21 (0.5%) | 36 (4.3%) |
| No Fuel Used | 10 (0.3%) | 17 (2.1%) |
| Total | 3,904 (100.0%) | 831 (100.0%) |
Household Vehicle Usage in Mendota Heights
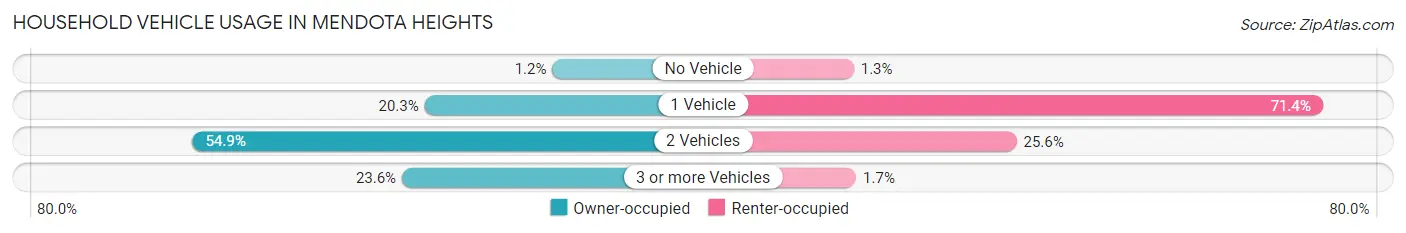
| Vehicles per Household | Owner-occupied | Renter-occupied |
| No Vehicle | 46 (1.2%) | 11 (1.3%) |
| 1 Vehicle | 791 (20.3%) | 593 (71.4%) |
| 2 Vehicles | 2,144 (54.9%) | 213 (25.6%) |
| 3 or more Vehicles | 923 (23.6%) | 14 (1.7%) |
| Total | 3,904 (100.0%) | 831 (100.0%) |
Real Estate & Mortgages in Mendota Heights
Real Estate and Mortgage Overview in Mendota Heights
| Characteristic | Without Mortgage | With Mortgage |
| Housing Units | 1,441 | 2,463 |
| Median Property Value | $466,300 | $487,700 |
| Median Household Income | $119,514 | $1,451 |
| Monthly Housing Costs | $866 | $662 |
| Real Estate Taxes | $4,387 | $37 |
Property Value by Mortgage Status in Mendota Heights
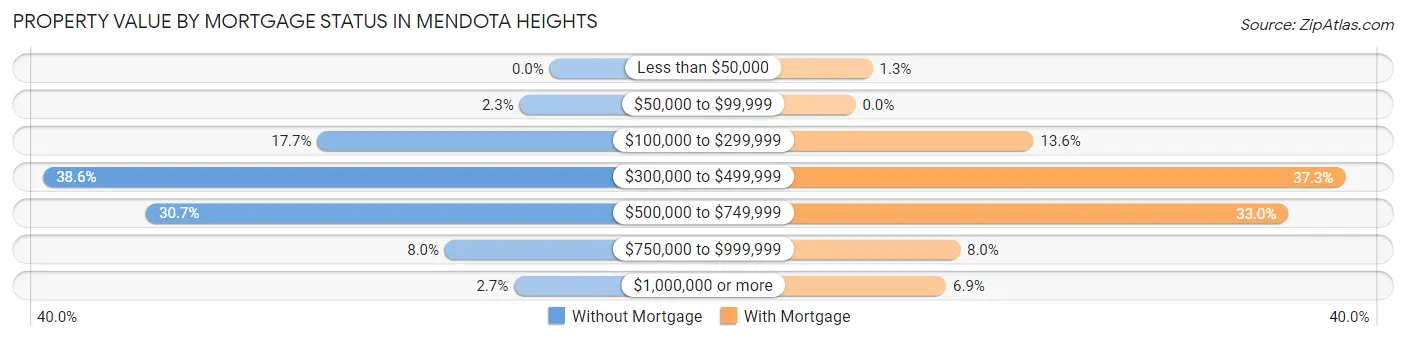
| Property Value | Without Mortgage | With Mortgage |
| Less than $50,000 | 0 (0.0%) | 32 (1.3%) |
| $50,000 to $99,999 | 33 (2.3%) | 0 (0.0%) |
| $100,000 to $299,999 | 255 (17.7%) | 334 (13.6%) |
| $300,000 to $499,999 | 556 (38.6%) | 919 (37.3%) |
| $500,000 to $749,999 | 443 (30.7%) | 812 (33.0%) |
| $750,000 to $999,999 | 115 (8.0%) | 196 (8.0%) |
| $1,000,000 or more | 39 (2.7%) | 170 (6.9%) |
| Total | 1,441 (100.0%) | 2,463 (100.0%) |
Household Income by Mortgage Status in Mendota Heights
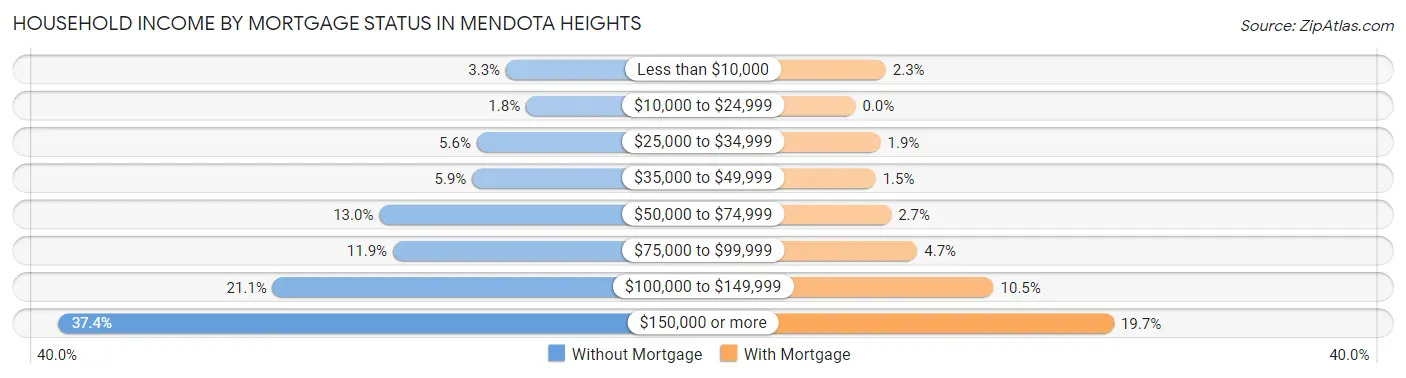
| Household Income | Without Mortgage | With Mortgage |
| Less than $10,000 | 48 (3.3%) | 57 (2.3%) |
| $10,000 to $24,999 | 26 (1.8%) | 0 (0.0%) |
| $25,000 to $34,999 | 80 (5.6%) | 47 (1.9%) |
| $35,000 to $49,999 | 85 (5.9%) | 38 (1.5%) |
| $50,000 to $74,999 | 187 (13.0%) | 67 (2.7%) |
| $75,000 to $99,999 | 172 (11.9%) | 116 (4.7%) |
| $100,000 to $149,999 | 304 (21.1%) | 259 (10.5%) |
| $150,000 or more | 539 (37.4%) | 485 (19.7%) |
| Total | 1,441 (100.0%) | 2,463 (100.0%) |
Property Value to Household Income Ratio in Mendota Heights
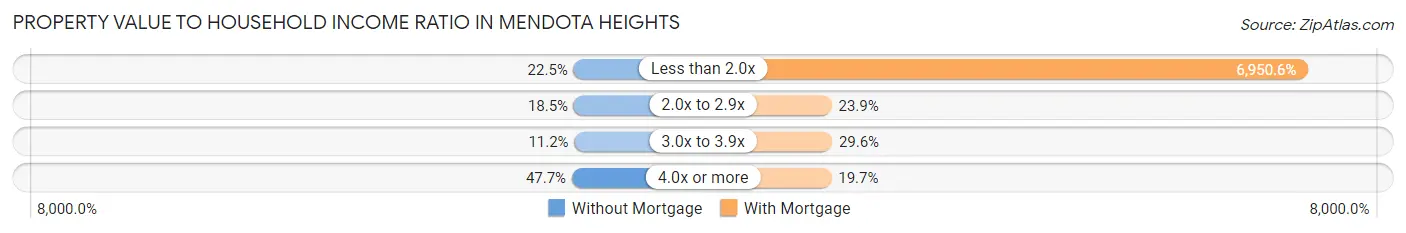
| Value-to-Income Ratio | Without Mortgage | With Mortgage |
| Less than 2.0x | 324 (22.5%) | 171,193 (6,950.6%) |
| 2.0x to 2.9x | 267 (18.5%) | 588 (23.9%) |
| 3.0x to 3.9x | 162 (11.2%) | 730 (29.6%) |
| 4.0x or more | 688 (47.7%) | 485 (19.7%) |
| Total | 1,441 (100.0%) | 2,463 (100.0%) |
Real Estate Taxes by Mortgage Status in Mendota Heights
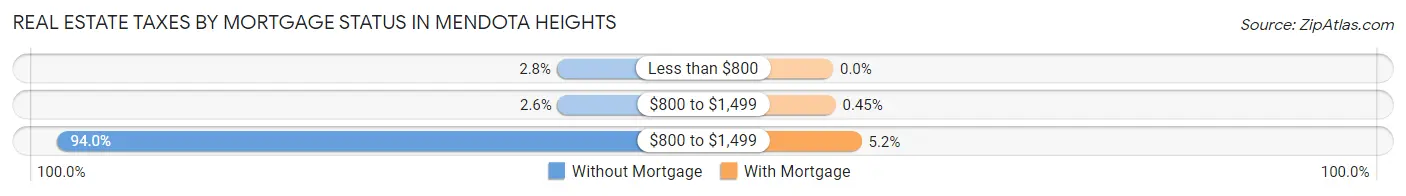
| Property Taxes | Without Mortgage | With Mortgage |
| Less than $800 | 40 (2.8%) | 0 (0.0%) |
| $800 to $1,499 | 38 (2.6%) | 11 (0.4%) |
| $800 to $1,499 | 1,354 (94.0%) | 128 (5.2%) |
| Total | 1,441 (100.0%) | 2,463 (100.0%) |
Health & Disability in Mendota Heights
Health Insurance Coverage by Age in Mendota Heights
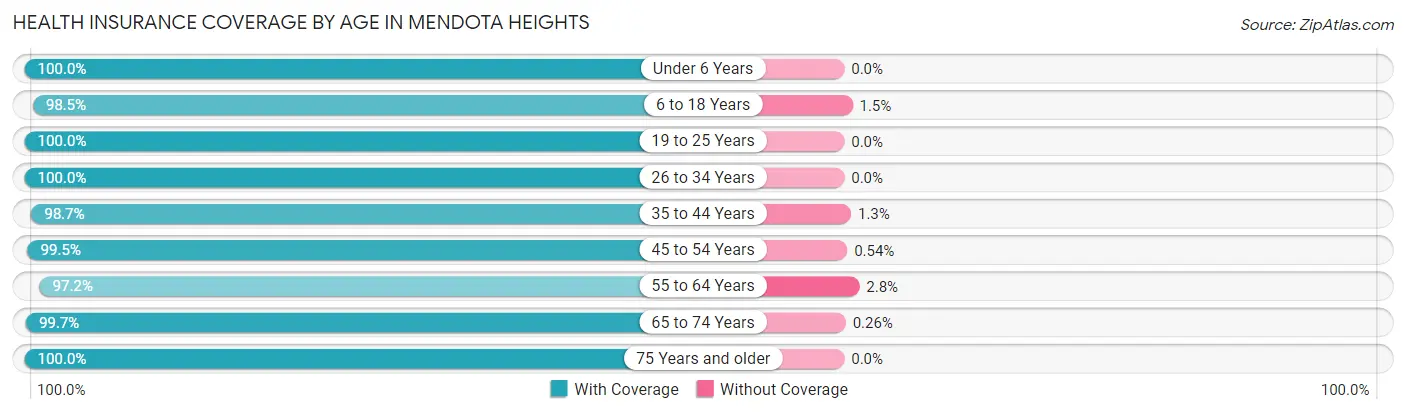
| Age Bracket | With Coverage | Without Coverage |
| Under 6 Years | 705 (100.0%) | 0 (0.0%) |
| 6 to 18 Years | 1,982 (98.5%) | 31 (1.5%) |
| 19 to 25 Years | 607 (100.0%) | 0 (0.0%) |
| 26 to 34 Years | 852 (100.0%) | 0 (0.0%) |
| 35 to 44 Years | 1,416 (98.7%) | 18 (1.3%) |
| 45 to 54 Years | 1,282 (99.5%) | 7 (0.5%) |
| 55 to 64 Years | 1,831 (97.2%) | 53 (2.8%) |
| 65 to 74 Years | 1,561 (99.7%) | 4 (0.3%) |
| 75 Years and older | 1,269 (100.0%) | 0 (0.0%) |
| Total | 11,505 (99.0%) | 113 (1.0%) |
Health Insurance Coverage by Citizenship Status in Mendota Heights
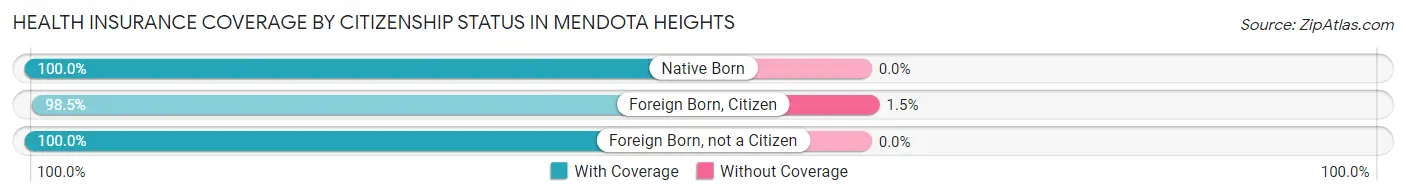
| Citizenship Status | With Coverage | Without Coverage |
| Native Born | 705 (100.0%) | 0 (0.0%) |
| Foreign Born, Citizen | 1,982 (98.5%) | 31 (1.5%) |
| Foreign Born, not a Citizen | 607 (100.0%) | 0 (0.0%) |
Health Insurance Coverage by Household Income in Mendota Heights
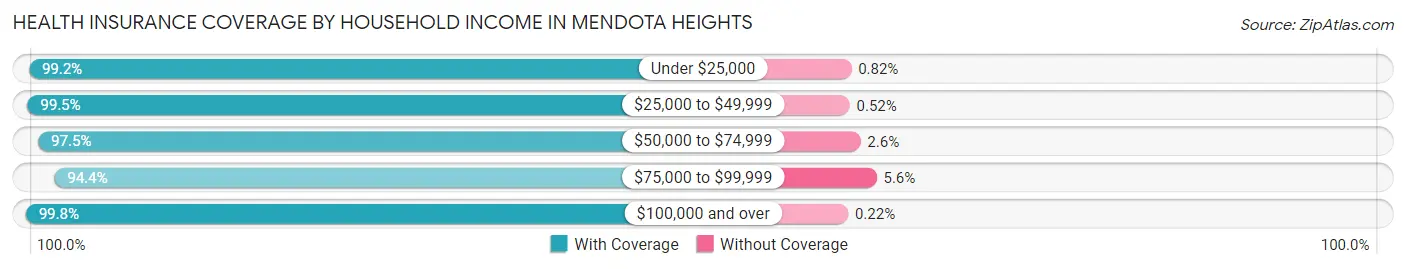
| Household Income | With Coverage | Without Coverage |
| Under $25,000 | 362 (99.2%) | 3 (0.8%) |
| $25,000 to $49,999 | 950 (99.5%) | 5 (0.5%) |
| $50,000 to $74,999 | 1,146 (97.5%) | 30 (2.5%) |
| $75,000 to $99,999 | 966 (94.4%) | 57 (5.6%) |
| $100,000 and over | 7,996 (99.8%) | 18 (0.2%) |
Public vs Private Health Insurance Coverage by Age in Mendota Heights
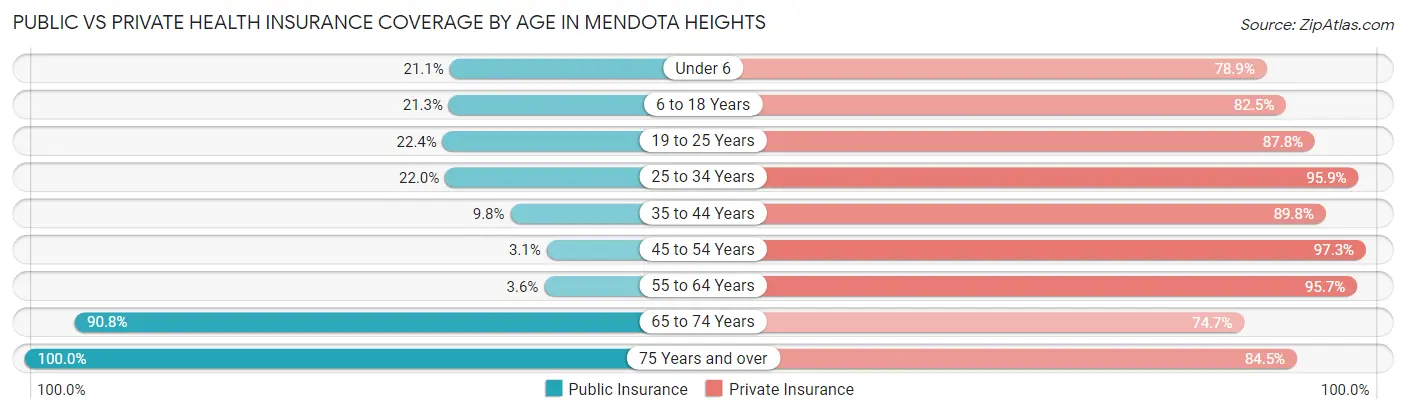
| Age Bracket | Public Insurance | Private Insurance |
| Under 6 | 149 (21.1%) | 556 (78.9%) |
| 6 to 18 Years | 428 (21.3%) | 1,660 (82.5%) |
| 19 to 25 Years | 136 (22.4%) | 533 (87.8%) |
| 25 to 34 Years | 187 (22.0%) | 817 (95.9%) |
| 35 to 44 Years | 141 (9.8%) | 1,288 (89.8%) |
| 45 to 54 Years | 40 (3.1%) | 1,254 (97.3%) |
| 55 to 64 Years | 67 (3.6%) | 1,802 (95.7%) |
| 65 to 74 Years | 1,421 (90.8%) | 1,169 (74.7%) |
| 75 Years and over | 1,269 (100.0%) | 1,072 (84.5%) |
| Total | 3,838 (33.0%) | 10,151 (87.4%) |
Disability Status by Sex by Age in Mendota Heights
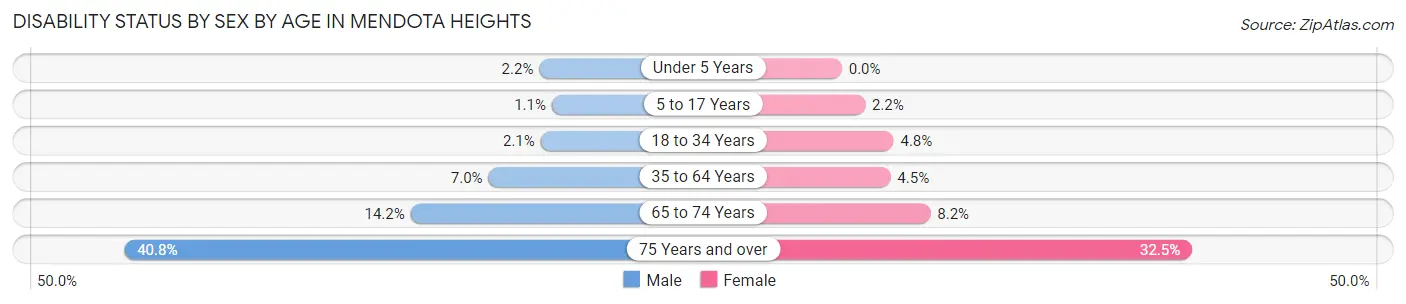
| Age Bracket | Male | Female |
| Under 5 Years | 10 (2.2%) | 0 (0.0%) |
| 5 to 17 Years | 9 (1.1%) | 21 (2.1%) |
| 18 to 34 Years | 17 (2.1%) | 44 (4.8%) |
| 35 to 64 Years | 149 (7.0%) | 111 (4.5%) |
| 65 to 74 Years | 115 (14.2%) | 62 (8.2%) |
| 75 Years and over | 240 (40.7%) | 221 (32.5%) |
Disability Class by Sex by Age in Mendota Heights
Disability Class: Hearing Difficulty
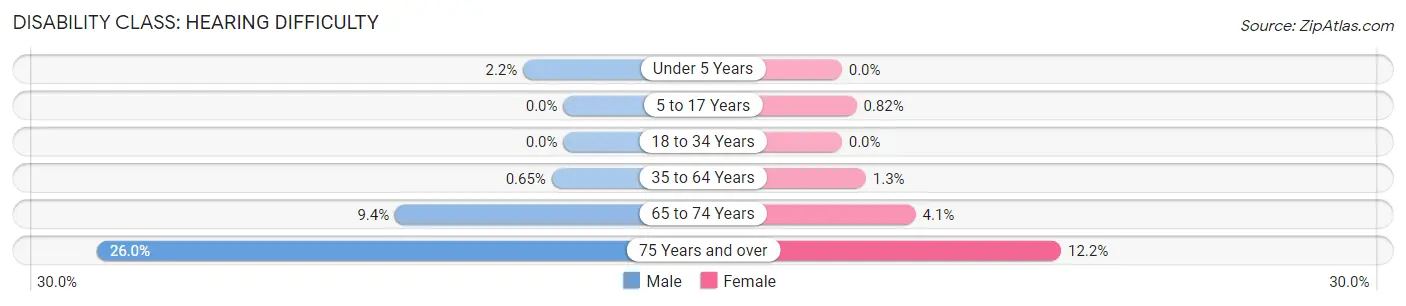
| Age Bracket | Male | Female |
| Under 5 Years | 10 (2.2%) | 0 (0.0%) |
| 5 to 17 Years | 0 (0.0%) | 8 (0.8%) |
| 18 to 34 Years | 0 (0.0%) | 0 (0.0%) |
| 35 to 64 Years | 14 (0.6%) | 33 (1.3%) |
| 65 to 74 Years | 76 (9.4%) | 31 (4.1%) |
| 75 Years and over | 153 (26.0%) | 83 (12.2%) |
Disability Class: Vision Difficulty
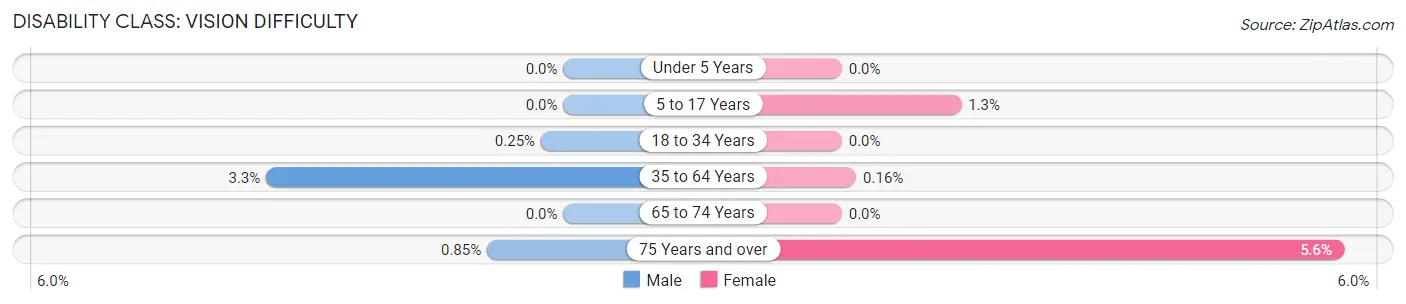
| Age Bracket | Male | Female |
| Under 5 Years | 0 (0.0%) | 0 (0.0%) |
| 5 to 17 Years | 0 (0.0%) | 13 (1.3%) |
| 18 to 34 Years | 2 (0.3%) | 0 (0.0%) |
| 35 to 64 Years | 71 (3.3%) | 4 (0.2%) |
| 65 to 74 Years | 0 (0.0%) | 0 (0.0%) |
| 75 Years and over | 5 (0.9%) | 38 (5.6%) |
Disability Class: Cognitive Difficulty
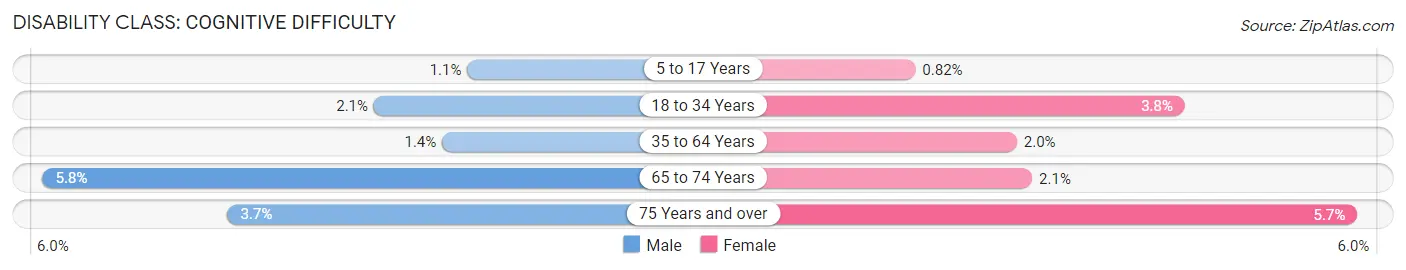
| Age Bracket | Male | Female |
| 5 to 17 Years | 9 (1.1%) | 8 (0.8%) |
| 18 to 34 Years | 17 (2.1%) | 35 (3.8%) |
| 35 to 64 Years | 29 (1.3%) | 48 (1.9%) |
| 65 to 74 Years | 47 (5.8%) | 16 (2.1%) |
| 75 Years and over | 22 (3.7%) | 39 (5.7%) |
Disability Class: Ambulatory Difficulty
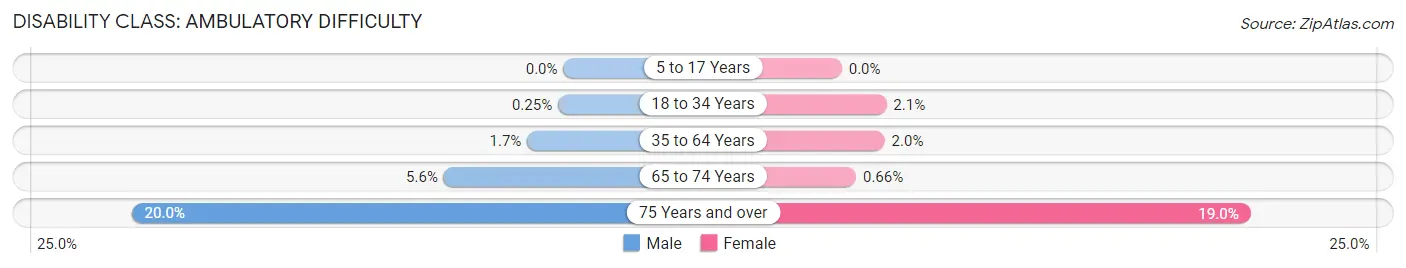
| Age Bracket | Male | Female |
| 5 to 17 Years | 0 (0.0%) | 0 (0.0%) |
| 18 to 34 Years | 2 (0.3%) | 19 (2.1%) |
| 35 to 64 Years | 36 (1.7%) | 49 (2.0%) |
| 65 to 74 Years | 45 (5.6%) | 5 (0.7%) |
| 75 Years and over | 118 (20.0%) | 129 (19.0%) |
Disability Class: Self-Care Difficulty
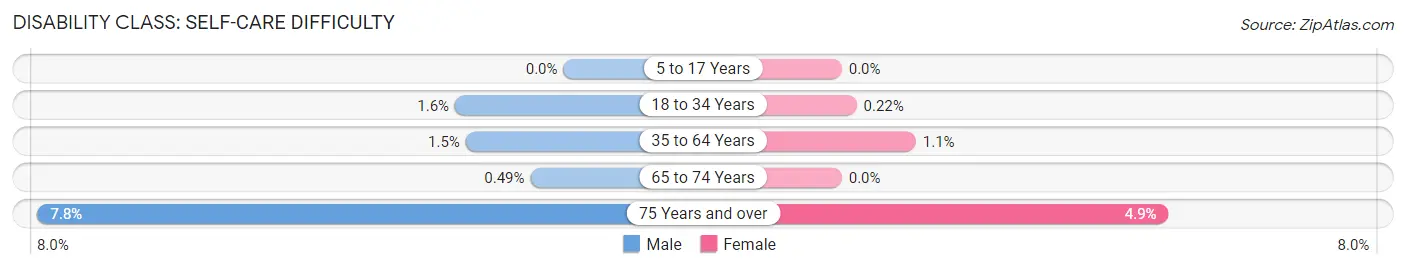
| Age Bracket | Male | Female |
| 5 to 17 Years | 0 (0.0%) | 0 (0.0%) |
| 18 to 34 Years | 13 (1.6%) | 2 (0.2%) |
| 35 to 64 Years | 31 (1.5%) | 27 (1.1%) |
| 65 to 74 Years | 4 (0.5%) | 0 (0.0%) |
| 75 Years and over | 46 (7.8%) | 33 (4.9%) |
Technology Access in Mendota Heights
Computing Device Access in Mendota Heights
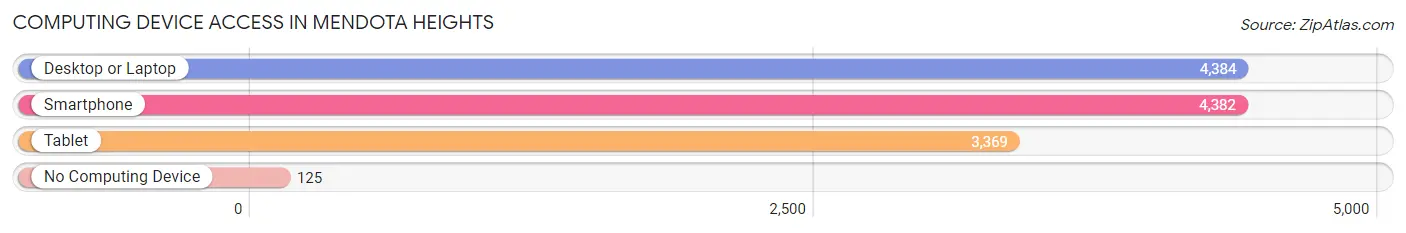
| Device Type | # Households | % Households |
| Desktop or Laptop | 4,384 | 92.6% |
| Smartphone | 4,382 | 92.5% |
| Tablet | 3,369 | 71.2% |
| No Computing Device | 125 | 2.6% |
| Total | 4,735 | 100.0% |
Internet Access in Mendota Heights
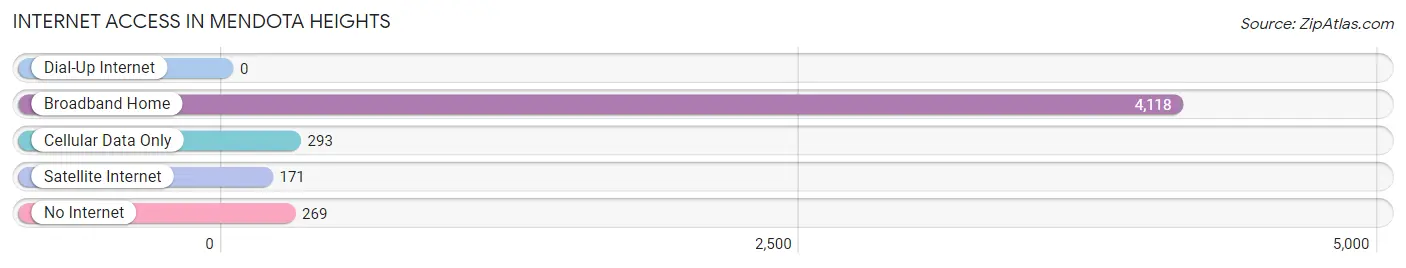
| Internet Type | # Households | % Households |
| Dial-Up Internet | 0 | 0.0% |
| Broadband Home | 4,118 | 87.0% |
| Cellular Data Only | 293 | 6.2% |
| Satellite Internet | 171 | 3.6% |
| No Internet | 269 | 5.7% |
| Total | 4,735 | 100.0% |
Mendota Heights Summary
Mendota Heights is a city located in Dakota County, Minnesota, United States. The city is situated on the south bank of the Mississippi River, just south of the Twin Cities metropolitan area. The population was 11,521 at the 2010 census.
History
Mendota Heights was first settled in 1851 by a group of settlers from New England. The settlers were attracted to the area by the abundance of natural resources, including timber, fish, and wild game. The area was originally known as "Mendota," after the nearby Mendota Mission, which was established by the Catholic Church in 1841. The mission was named after the Dakota word for "meeting place."
In 1858, the first post office was established in Mendota, and the town was officially incorporated in 1887. The city was named after the nearby Mendota Mission.
In the early 1900s, Mendota Heights began to grow rapidly, as the city became a popular destination for wealthy families from the Twin Cities. The city was home to several large estates, including the historic James J. Hill House, which was built in 1891.
Geography
Mendota Heights is located in Dakota County, Minnesota, United States. The city is situated on the south bank of the Mississippi River, just south of the Twin Cities metropolitan area. The city is bordered by the cities of West St. Paul, Inver Grove Heights, and Eagan.
The city has a total area of 8.2 square miles, of which 8.1 square miles is land and 0.1 square miles is water. The city is located in the St. Croix River Valley, and is surrounded by rolling hills and bluffs.
Economy
Mendota Heights is home to a variety of businesses, including retail stores, restaurants, and professional services. The city is also home to several large employers, including the headquarters of 3M, the Minnesota Department of Transportation, and the Minnesota State Lottery.
The city is also home to several educational institutions, including the University of St. Thomas, the University of Minnesota, and the Minnesota School of Business.
Demographics
As of the 2010 census, there were 11,521 people, 4,845 households, and 3,072 families residing in the city. The population density was 1,420.3 people per square mile. The racial makeup of the city was 87.2% White, 4.3% African American, 0.3% Native American, 5.2% Asian, 0.7% from other races, and 2.3% from two or more races. Hispanic or Latino of any race were 2.7% of the population.
The median income for a household in the city was $76,945, and the median income for a family was $95,945. The per capita income for the city was $41,945. About 2.7% of families and 4.2% of the population were below the poverty line, including 4.7% of those under age 18 and 4.2% of those age 65 or over.
Common Questions
What is the Total Population of Mendota Heights?
Total Population of Mendota Heights is 11,642.
What is the Total Male Population of Mendota Heights?
Total Male Population of Mendota Heights is 5,660.
What is the Total Female Population of Mendota Heights?
Total Female Population of Mendota Heights is 5,982.
What is the Ratio of Males per 100 Females in Mendota Heights?
There are 94.62 Males per 100 Females in Mendota Heights.
What is the Ratio of Females per 100 Males in Mendota Heights?
There are 105.69 Females per 100 Males in Mendota Heights.
What is the Median Population Age in Mendota Heights?
Median Population Age in Mendota Heights is 47.0 Years.
What is the Average Family Size in Mendota Heights
Average Family Size in Mendota Heights is 2.9 People.
What is the Average Household Size in Mendota Heights
Average Household Size in Mendota Heights is 2.4 People.
What is Per Capita Income in Mendota Heights?
Per Capita income in Mendota Heights is $69,385.
What is the Median Family Income in Mendota Heights?
Median Family Income in Mendota Heights is $165,931.
What is the Median Household income in Mendota Heights?
Median Household Income in Mendota Heights is $129,800.
What is Income or Wage Gap in Mendota Heights?
Income or Wage Gap in Mendota Heights is 44.3%.
Women in Mendota Heights earn 55.7 cents for every dollar earned by a man.
What is Inequality or Gini Index in Mendota Heights?
Inequality or Gini Index in Mendota Heights is 0.43.
How Large is the Labor Force in Mendota Heights?
There are 6,147 People in the Labor Forcein in Mendota Heights.
What is the Percentage of People in the Labor Force in Mendota Heights?
64.5% of People are in the Labor Force in Mendota Heights.
What is the Unemployment Rate in Mendota Heights?
Unemployment Rate in Mendota Heights is 0.9%.