New Trier, MN
New Trier Map
New Trier Overview
72
TOTAL POPULATION
33
MALE POPULATION
39
FEMALE POPULATION
84.62
MALES / 100 FEMALES
118.18
FEMALES / 100 MALES
40.0
MEDIAN AGE
2.7
AVG FAMILY SIZE
2.6
AVG HOUSEHOLD SIZE
$34,451
PER CAPITA INCOME
$83,750
AVG FAMILY INCOME
$91,250
AVG HOUSEHOLD INCOME
0.27
INEQUALITY / GINI INDEX
46
LABOR FORCE [ PEOPLE ]
70.8%
PERCENT IN LABOR FORCE
4.3%
UNEMPLOYMENT RATE
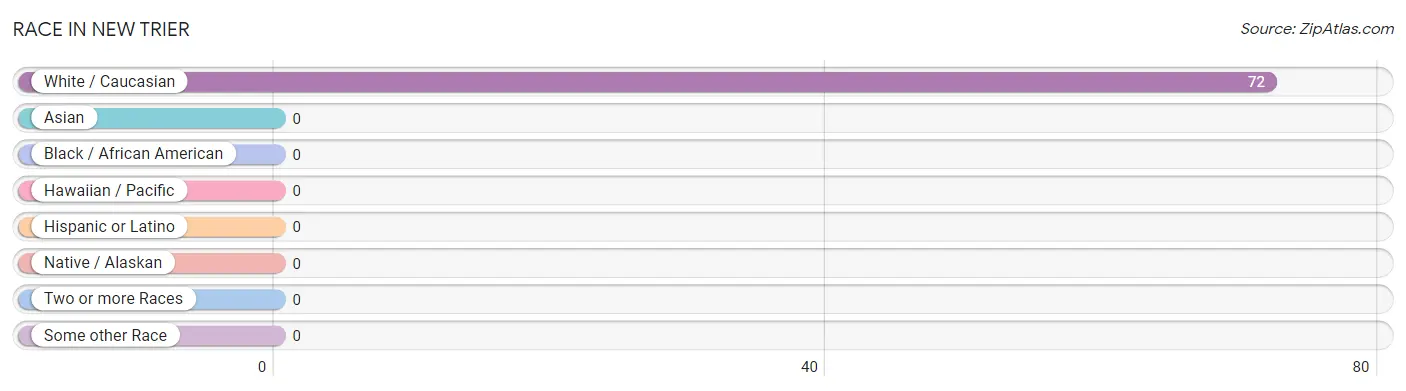
Race in New Trier
The most populous races in New Trier are , and White / Caucasian (72 | 100.0%).
| Race | # Population | % Population |
| Asian | 0 | 0.0% |
| Black / African American | 0 | 0.0% |
| Hawaiian / Pacific | 0 | 0.0% |
| Hispanic or Latino | 0 | 0.0% |
| Native / Alaskan | 0 | 0.0% |
| White / Caucasian | 72 | 100.0% |
| Two or more Races | 0 | 0.0% |
| Some other Race | 0 | 0.0% |
| Total | 72 | 100.0% |
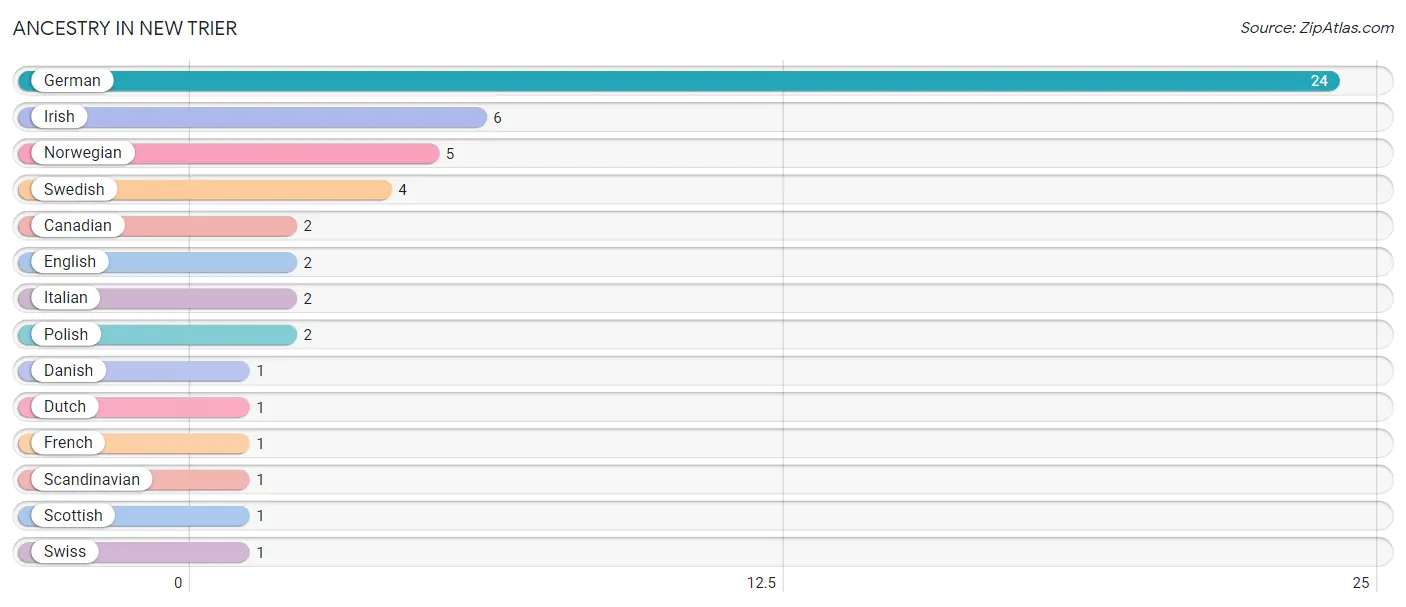
Ancestry in New Trier
The most populous ancestries reported in New Trier are German (24 | 33.3%), Irish (6 | 8.3%), Norwegian (5 | 6.9%), Swedish (4 | 5.6%), and Canadian (2 | 2.8%), together accounting for 56.9% of all New Trier residents.
| Ancestry | # Population | % Population |
| Canadian | 2 | 2.8% |
| Danish | 1 | 1.4% |
| Dutch | 1 | 1.4% |
| English | 2 | 2.8% |
| French | 1 | 1.4% |
| German | 24 | 33.3% |
| Irish | 6 | 8.3% |
| Italian | 2 | 2.8% |
| Norwegian | 5 | 6.9% |
| Polish | 2 | 2.8% |
| Scandinavian | 1 | 1.4% |
| Scottish | 1 | 1.4% |
| Swedish | 4 | 5.6% |
| Swiss | 1 | 1.4% | View All 14 Rows |
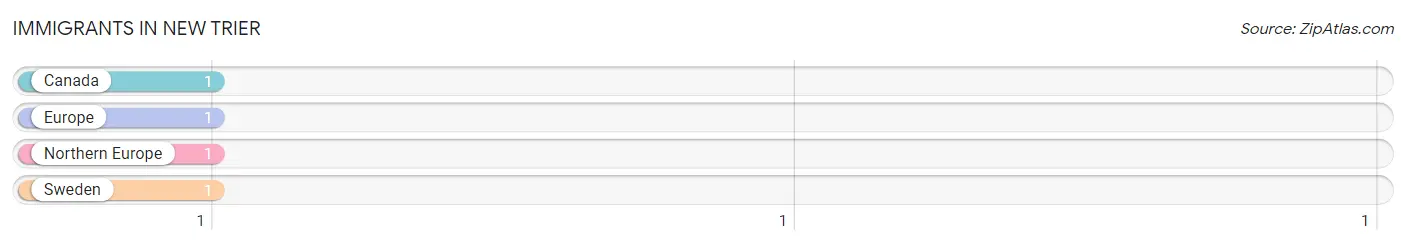
Immigrants in New Trier
The most numerous immigrant groups reported in New Trier came from Canada (1 | 1.4%), Europe (1 | 1.4%), Northern Europe (1 | 1.4%), and Sweden (1 | 1.4%), together accounting for 5.6% of all New Trier residents.
| Immigration Origin | # Population | % Population |
| Canada | 1 | 1.4% |
| Europe | 1 | 1.4% |
| Northern Europe | 1 | 1.4% |
| Sweden | 1 | 1.4% | View All 4 Rows |
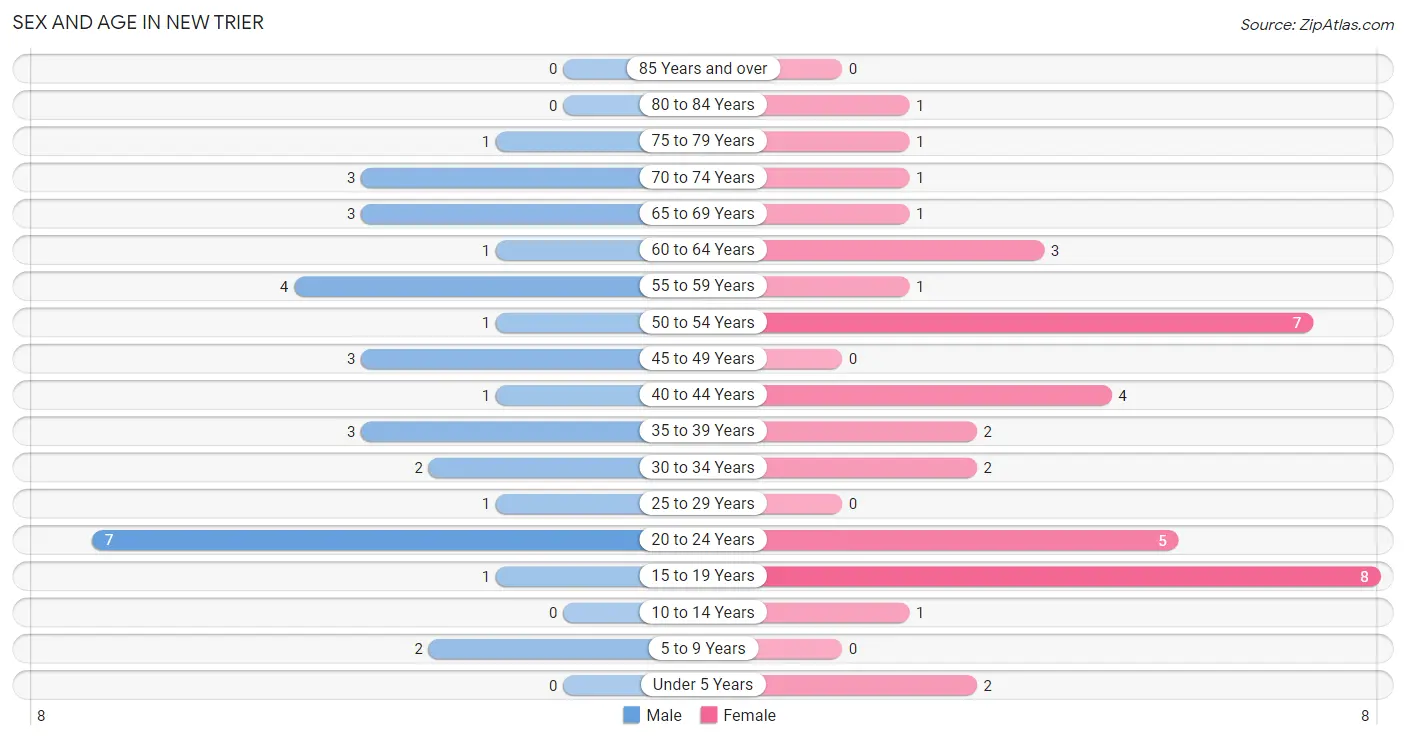
Sex and Age in New Trier
Sex and Age in New Trier
The most populous age groups in New Trier are 20 to 24 Years (7 | 21.2%) for men and 15 to 19 Years (8 | 20.5%) for women.
| Age Bracket | Male | Female |
| Under 5 Years | 0 (0.0%) | 2 (5.1%) |
| 5 to 9 Years | 2 (6.1%) | 0 (0.0%) |
| 10 to 14 Years | 0 (0.0%) | 1 (2.6%) |
| 15 to 19 Years | 1 (3.0%) | 8 (20.5%) |
| 20 to 24 Years | 7 (21.2%) | 5 (12.8%) |
| 25 to 29 Years | 1 (3.0%) | 0 (0.0%) |
| 30 to 34 Years | 2 (6.1%) | 2 (5.1%) |
| 35 to 39 Years | 3 (9.1%) | 2 (5.1%) |
| 40 to 44 Years | 1 (3.0%) | 4 (10.3%) |
| 45 to 49 Years | 3 (9.1%) | 0 (0.0%) |
| 50 to 54 Years | 1 (3.0%) | 7 (17.9%) |
| 55 to 59 Years | 4 (12.1%) | 1 (2.6%) |
| 60 to 64 Years | 1 (3.0%) | 3 (7.7%) |
| 65 to 69 Years | 3 (9.1%) | 1 (2.6%) |
| 70 to 74 Years | 3 (9.1%) | 1 (2.6%) |
| 75 to 79 Years | 1 (3.0%) | 1 (2.6%) |
| 80 to 84 Years | 0 (0.0%) | 1 (2.6%) |
| 85 Years and over | 0 (0.0%) | 0 (0.0%) |
| Total | 33 (100.0%) | 39 (100.0%) |
Families and Households in New Trier
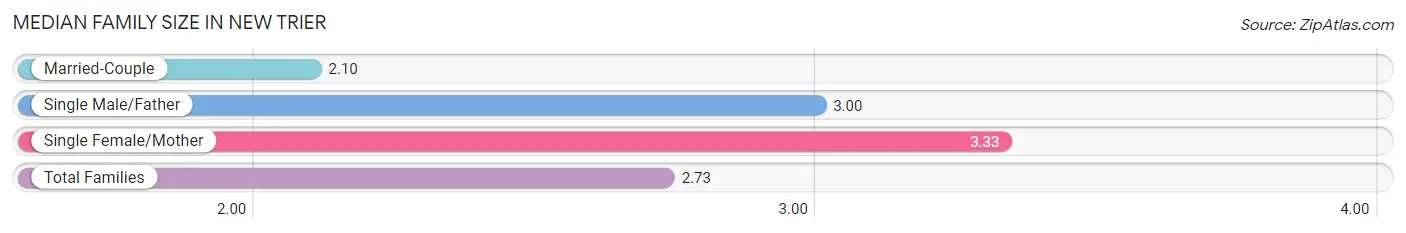
Median Family Size in New Trier
The median family size in New Trier is 2.73 persons per family, with single female/mother families (9 | 40.9%) accounting for the largest median family size of 3.33 persons per family. On the other hand, married-couple families (10 | 45.5%) represent the smallest median family size with 2.10 persons per family.
| Family Type | # Families | Family Size |
| Married-Couple | 10 (45.5%) | 2.10 |
| Single Male/Father | 3 (13.6%) | 3.00 |
| Single Female/Mother | 9 (40.9%) | 3.33 |
| Total Families | 22 (100.0%) | 2.73 |
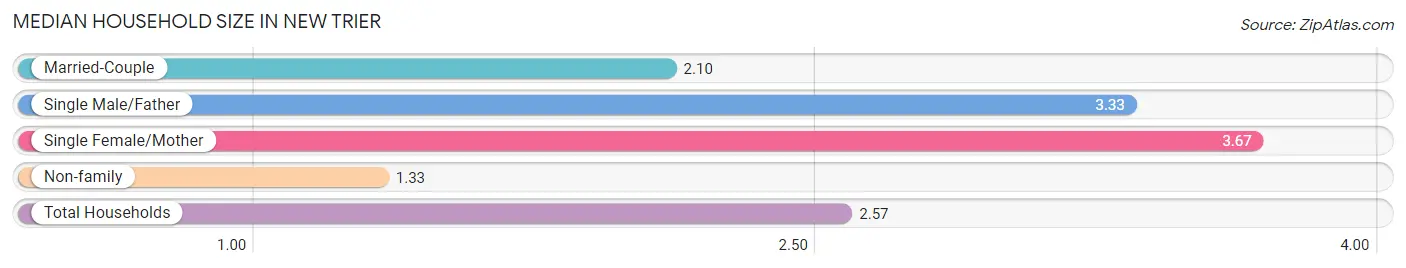
Median Household Size in New Trier
The median household size in New Trier is 2.57 persons per household, with single female/mother households (9 | 32.1%) accounting for the largest median household size of 3.67 persons per household. non-family households (6 | 21.4%) represent the smallest median household size with 1.33 persons per household.
| Household Type | # Households | Household Size |
| Married-Couple | 10 (35.7%) | 2.10 |
| Single Male/Father | 3 (10.7%) | 3.33 |
| Single Female/Mother | 9 (32.1%) | 3.67 |
| Non-family | 6 (21.4%) | 1.33 |
| Total Households | 28 (100.0%) | 2.57 |
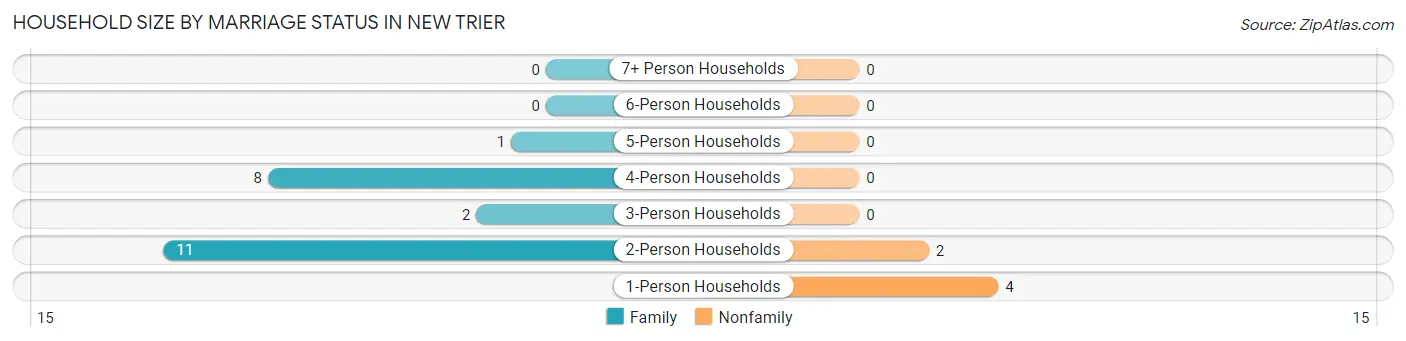
Household Size by Marriage Status in New Trier
Out of a total of 28 households in New Trier, 22 (78.6%) are family households, while 6 (21.4%) are nonfamily households. The most numerous type of family households are 2-person households, comprising 11, and the most common type of nonfamily households are 1-person households, comprising 4.
| Household Size | Family Households | Nonfamily Households |
| 1-Person Households | - | 4 (14.3%) |
| 2-Person Households | 11 (39.3%) | 2 (7.1%) |
| 3-Person Households | 2 (7.1%) | 0 (0.0%) |
| 4-Person Households | 8 (28.6%) | 0 (0.0%) |
| 5-Person Households | 1 (3.6%) | 0 (0.0%) |
| 6-Person Households | 0 (0.0%) | 0 (0.0%) |
| 7+ Person Households | 0 (0.0%) | 0 (0.0%) |
| Total | 22 (78.6%) | 6 (21.4%) |
Female Fertility in New Trier
Fertility by Age in New Trier
| Age Bracket | Women with Births | Births / 1,000 Women |
| 15 to 19 years | 0 (0.0%) | 0.0 |
| 20 to 34 years | 0 (0.0%) | 0.0 |
| 35 to 50 years | 0 (0.0%) | 0.0 |
| Total | 0 (0.0%) | 0.0 |
Fertility by Age by Marriage Status in New Trier
| Age Bracket | Married | Unmarried |
| 15 to 19 years | 0 (0.0%) | 0 (0.0%) |
| 20 to 34 years | 0 (0.0%) | 0 (0.0%) |
| 35 to 50 years | 0 (0.0%) | 0 (0.0%) |
| Total | 0 (0.0%) | 0 (0.0%) |
Fertility by Education in New Trier
| Educational Attainment | Women with Births | Births / 1,000 Women |
| Less than High School | 0 (0.0%) | 0.0 |
| High School Diploma | 0 (0.0%) | 0.0 |
| College or Associate's Degree | 0 (0.0%) | 0.0 |
| Bachelor's Degree | 0 (0.0%) | 0.0 |
| Graduate Degree | 0 (0.0%) | 0.0 |
| Total | 0 (0.0%) | 0.0 |
Fertility by Education by Marriage Status in New Trier
| Educational Attainment | Married | Unmarried |
| Less than High School | 0 (0.0%) | 0 (0.0%) |
| High School Diploma | 0 (0.0%) | 0 (0.0%) |
| College or Associate's Degree | 0 (0.0%) | 0 (0.0%) |
| Bachelor's Degree | 0 (0.0%) | 0 (0.0%) |
| Graduate Degree | 0 (0.0%) | 0 (0.0%) |
| Total | 0 (0.0%) | 0 (0.0%) |
Income in New Trier
Income Overview in New Trier
Per Capita Income in New Trier is $34,451, while median incomes of families and households are $83,750 and $91,250 respectively.
| Characteristic | Number | Measure |
| Per Capita Income | 72 | $34,451 |
| Median Family Income | 22 | $83,750 |
| Mean Family Income | 22 | $88,714 |
| Median Household Income | 28 | $91,250 |
| Mean Household Income | 28 | $94,596 |
| Income Deficit | 22 | $0 |
| Wage / Income Gap (%) | 72 | 0.00% |
| Wage / Income Gap ($) | 72 | 100.00¢ per $1 |
| Gini / Inequality Index | 72 | 0.27 |
Earnings by Sex in New Trier
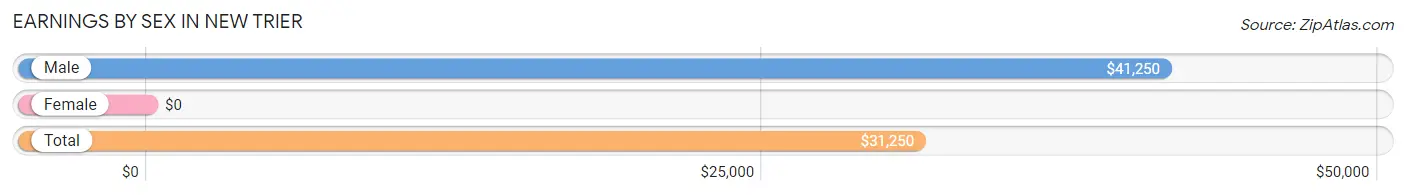
| Sex | Number | Average Earnings |
| Male | 24 (47.1%) | $41,250 |
| Female | 27 (52.9%) | $0 |
| Total | 51 (100.0%) | $31,250 |
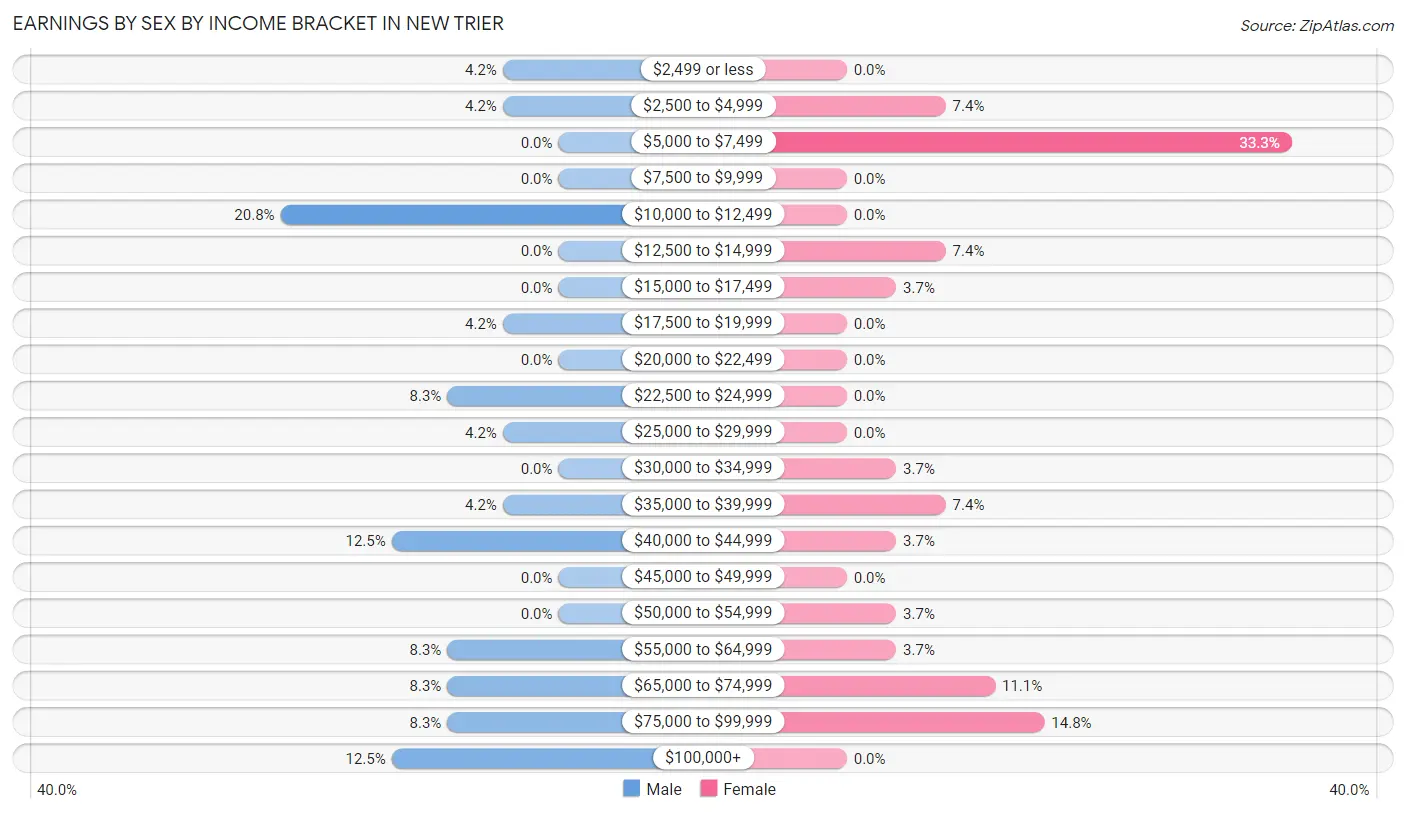
Earnings by Sex by Income Bracket in New Trier
The most common earnings brackets in New Trier are $10,000 to $12,499 for men (5 | 20.8%) and $5,000 to $7,499 for women (9 | 33.3%).
| Income | Male | Female |
| $2,499 or less | 1 (4.2%) | 0 (0.0%) |
| $2,500 to $4,999 | 1 (4.2%) | 2 (7.4%) |
| $5,000 to $7,499 | 0 (0.0%) | 9 (33.3%) |
| $7,500 to $9,999 | 0 (0.0%) | 0 (0.0%) |
| $10,000 to $12,499 | 5 (20.8%) | 0 (0.0%) |
| $12,500 to $14,999 | 0 (0.0%) | 2 (7.4%) |
| $15,000 to $17,499 | 0 (0.0%) | 1 (3.7%) |
| $17,500 to $19,999 | 1 (4.2%) | 0 (0.0%) |
| $20,000 to $22,499 | 0 (0.0%) | 0 (0.0%) |
| $22,500 to $24,999 | 2 (8.3%) | 0 (0.0%) |
| $25,000 to $29,999 | 1 (4.2%) | 0 (0.0%) |
| $30,000 to $34,999 | 0 (0.0%) | 1 (3.7%) |
| $35,000 to $39,999 | 1 (4.2%) | 2 (7.4%) |
| $40,000 to $44,999 | 3 (12.5%) | 1 (3.7%) |
| $45,000 to $49,999 | 0 (0.0%) | 0 (0.0%) |
| $50,000 to $54,999 | 0 (0.0%) | 1 (3.7%) |
| $55,000 to $64,999 | 2 (8.3%) | 1 (3.7%) |
| $65,000 to $74,999 | 2 (8.3%) | 3 (11.1%) |
| $75,000 to $99,999 | 2 (8.3%) | 4 (14.8%) |
| $100,000+ | 3 (12.5%) | 0 (0.0%) |
| Total | 24 (100.0%) | 27 (100.0%) |
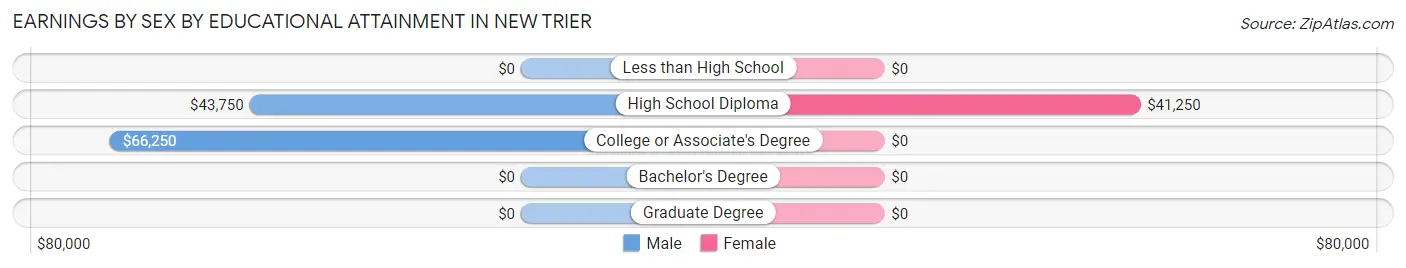
Earnings by Sex by Educational Attainment in New Trier
Average earnings in New Trier are $58,750 for men and $57,500 for women, a difference of 2.1%. Men with an educational attainment of college or associate's degree enjoy the highest average annual earnings of $66,250, while those with high school diploma education earn the least with $43,750. Women with an educational attainment of high school diploma earn the most with the average annual earnings of $41,250, while those with high school diploma education have the smallest earnings of $41,250.
| Educational Attainment | Male Income | Female Income |
| Less than High School | - | - |
| High School Diploma | $43,750 | $41,250 |
| College or Associate's Degree | $66,250 | $0 |
| Bachelor's Degree | - | - |
| Graduate Degree | - | - |
| Total | $58,750 | $57,500 |
Family Income in New Trier
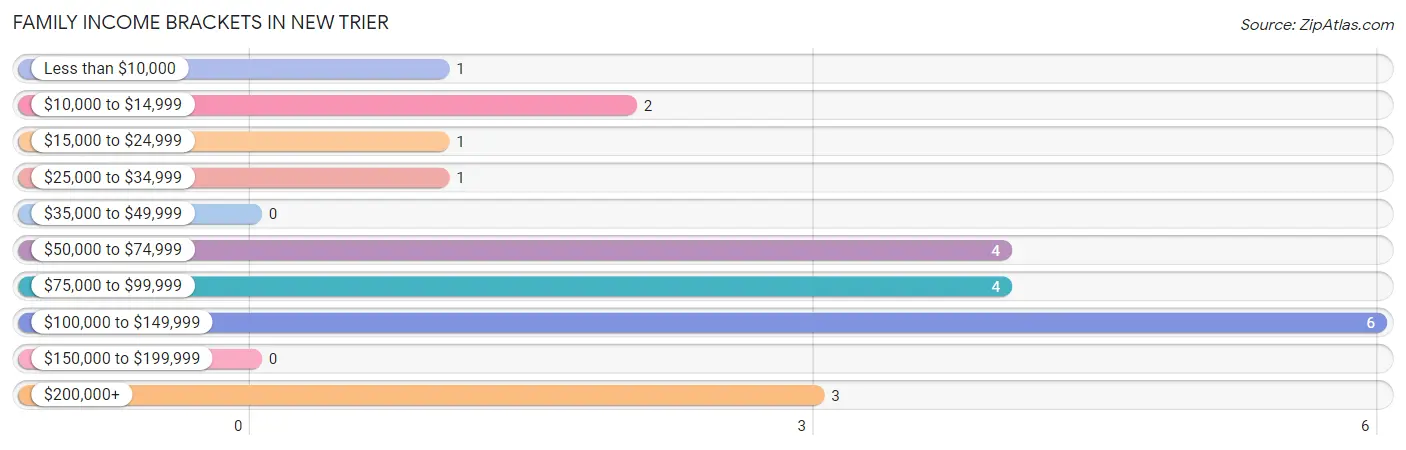
Family Income Brackets in New Trier
According to the New Trier family income data, there are 6 families falling into the $100,000 to $149,999 income range, which is the most common income bracket and makes up 27.3% of all families.
| Income Bracket | # Families | % Families |
| Less than $10,000 | 1 | 4.5% |
| $10,000 to $14,999 | 2 | 9.1% |
| $15,000 to $24,999 | 1 | 4.5% |
| $25,000 to $34,999 | 1 | 4.5% |
| $35,000 to $49,999 | 0 | 0.0% |
| $50,000 to $74,999 | 4 | 18.2% |
| $75,000 to $99,999 | 4 | 18.2% |
| $100,000 to $149,999 | 6 | 27.3% |
| $150,000 to $199,999 | 0 | 0.0% |
| $200,000+ | 3 | 13.6% |
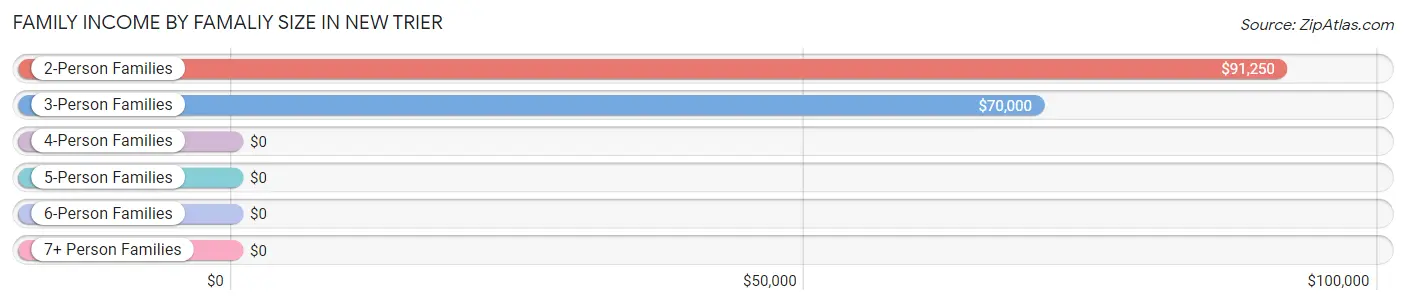
Family Income by Famaliy Size in New Trier
2-person families (11 | 50.0%) account for the highest median family income in New Trier with $91,250 per family, while 2-person families (11 | 50.0%) have the highest median income of $45,625 per family member.
| Income Bracket | # Families | Median Income |
| 2-Person Families | 11 (50.0%) | $91,250 |
| 3-Person Families | 6 (27.3%) | $70,000 |
| 4-Person Families | 5 (22.7%) | $0 |
| 5-Person Families | 0 (0.0%) | $0 |
| 6-Person Families | 0 (0.0%) | $0 |
| 7+ Person Families | 0 (0.0%) | $0 |
| Total | 22 (100.0%) | $83,750 |
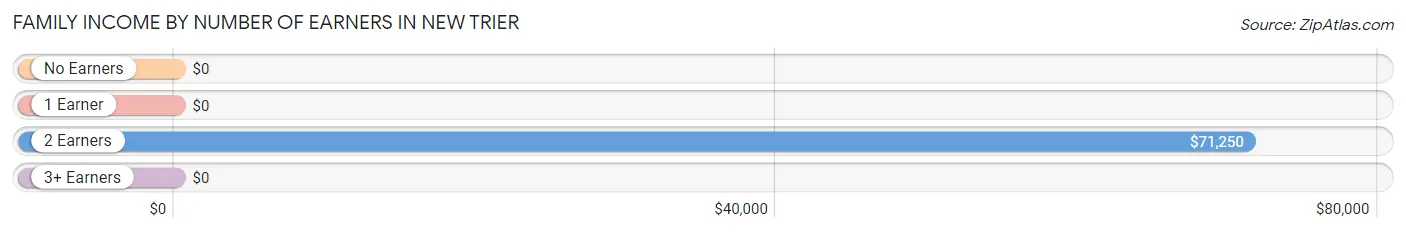
Family Income by Number of Earners in New Trier
| Number of Earners | # Families | Median Income |
| No Earners | 2 (9.1%) | $0 |
| 1 Earner | 9 (40.9%) | $0 |
| 2 Earners | 6 (27.3%) | $71,250 |
| 3+ Earners | 5 (22.7%) | $0 |
| Total | 22 (100.0%) | $83,750 |
Household Income in New Trier
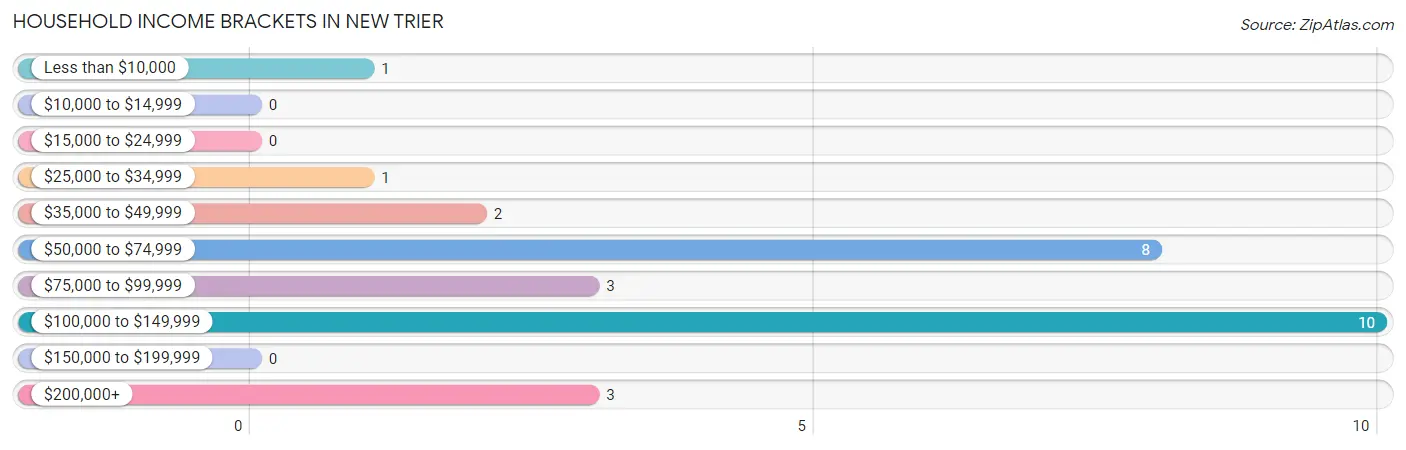
Household Income Brackets in New Trier
With 10 households falling in the category, the $100,000 to $149,999 income range is the most frequent in New Trier, accounting for 35.7% of all households.
| Income Bracket | # Households | % Households |
| Less than $10,000 | 1 | 3.6% |
| $10,000 to $14,999 | 0 | 0.0% |
| $15,000 to $24,999 | 0 | 0.0% |
| $25,000 to $34,999 | 1 | 3.6% |
| $35,000 to $49,999 | 2 | 7.1% |
| $50,000 to $74,999 | 8 | 28.6% |
| $75,000 to $99,999 | 3 | 10.7% |
| $100,000 to $149,999 | 10 | 35.7% |
| $150,000 to $199,999 | 0 | 0.0% |
| $200,000+ | 3 | 10.7% |
Household Income by Householder Age in New Trier
The median household income in New Trier is $91,250, with the highest median household income of $110,000 found in the 65+ years age bracket for the primary householder. A total of 6 households (21.4%) fall into this category.

| Income Bracket | # Households | Median Income |
| 15 to 24 Years | 0 (0.0%) | $0 |
| 25 to 44 Years | 8 (28.6%) | $82,500 |
| 45 to 64 Years | 14 (50.0%) | $92,500 |
| 65+ Years | 6 (21.4%) | $110,000 |
| Total | 28 (100.0%) | $91,250 |
Poverty in New Trier
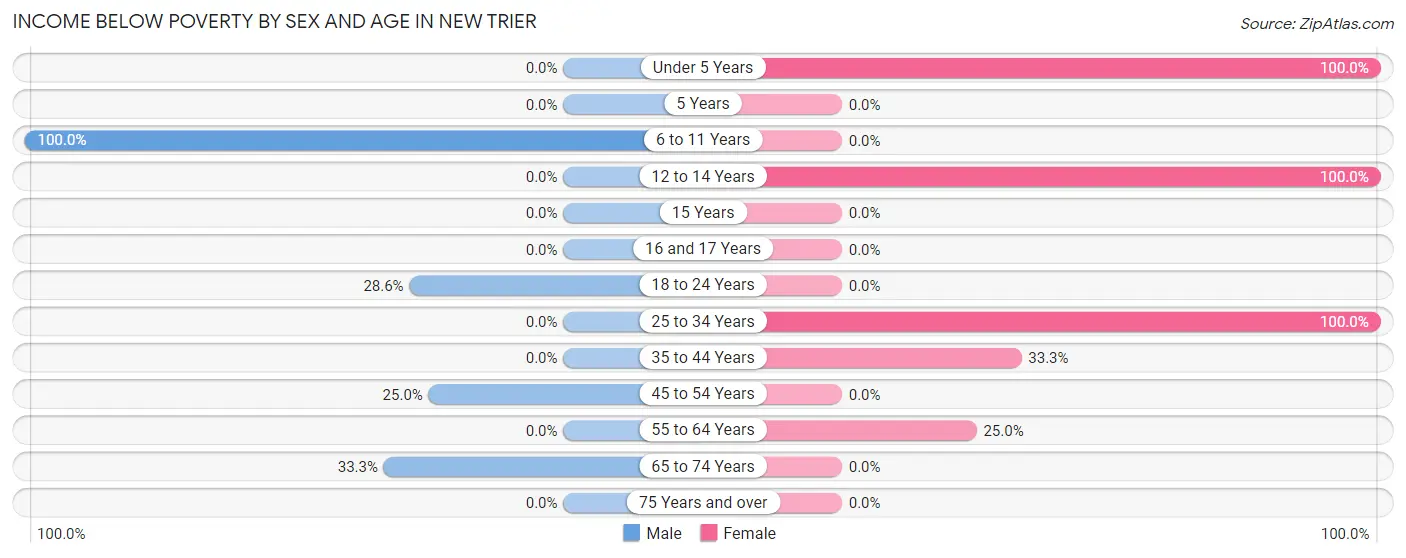
Income Below Poverty by Sex and Age in New Trier
With 21.2% poverty level for males and 20.5% for females among the residents of New Trier, 6 to 11 year old males and under 5 year old females are the most vulnerable to poverty, with 2 males (100.0%) and 2 females (100.0%) in their respective age groups living below the poverty level.
| Age Bracket | Male | Female |
| Under 5 Years | 0 (0.0%) | 2 (100.0%) |
| 5 Years | 0 (0.0%) | 0 (0.0%) |
| 6 to 11 Years | 2 (100.0%) | 0 (0.0%) |
| 12 to 14 Years | 0 (0.0%) | 1 (100.0%) |
| 15 Years | 0 (0.0%) | 0 (0.0%) |
| 16 and 17 Years | 0 (0.0%) | 0 (0.0%) |
| 18 to 24 Years | 2 (28.6%) | 0 (0.0%) |
| 25 to 34 Years | 0 (0.0%) | 2 (100.0%) |
| 35 to 44 Years | 0 (0.0%) | 2 (33.3%) |
| 45 to 54 Years | 1 (25.0%) | 0 (0.0%) |
| 55 to 64 Years | 0 (0.0%) | 1 (25.0%) |
| 65 to 74 Years | 2 (33.3%) | 0 (0.0%) |
| 75 Years and over | 0 (0.0%) | 0 (0.0%) |
| Total | 7 (21.2%) | 8 (20.5%) |
Income Above Poverty by Sex and Age in New Trier
According to the poverty statistics in New Trier, males aged 16 and 17 years and females aged 15 years are the age groups that are most secure financially, with 100.0% of males and 100.0% of females in these age groups living above the poverty line.
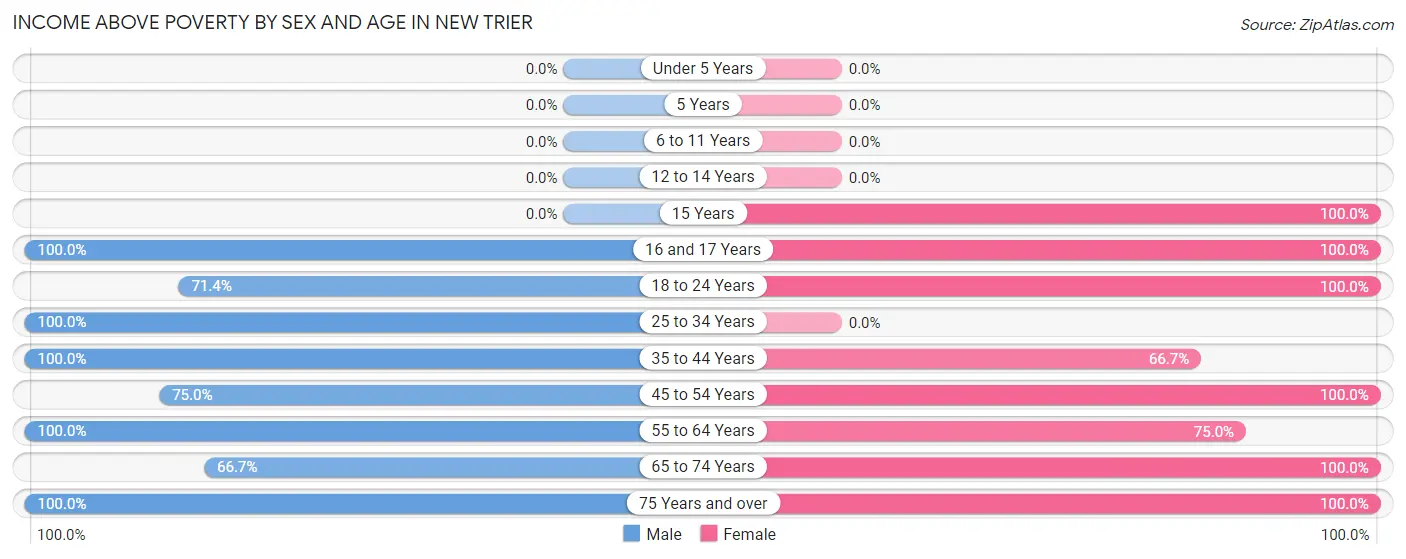
| Age Bracket | Male | Female |
| Under 5 Years | 0 (0.0%) | 0 (0.0%) |
| 5 Years | 0 (0.0%) | 0 (0.0%) |
| 6 to 11 Years | 0 (0.0%) | 0 (0.0%) |
| 12 to 14 Years | 0 (0.0%) | 0 (0.0%) |
| 15 Years | 0 (0.0%) | 2 (100.0%) |
| 16 and 17 Years | 1 (100.0%) | 6 (100.0%) |
| 18 to 24 Years | 5 (71.4%) | 5 (100.0%) |
| 25 to 34 Years | 3 (100.0%) | 0 (0.0%) |
| 35 to 44 Years | 4 (100.0%) | 4 (66.7%) |
| 45 to 54 Years | 3 (75.0%) | 7 (100.0%) |
| 55 to 64 Years | 5 (100.0%) | 3 (75.0%) |
| 65 to 74 Years | 4 (66.7%) | 2 (100.0%) |
| 75 Years and over | 1 (100.0%) | 2 (100.0%) |
| Total | 26 (78.8%) | 31 (79.5%) |
Income Below Poverty Among Married-Couple Families in New Trier
The poverty statistics for married-couple families in New Trier show that 10.0% or 1 of the total 10 families live below the poverty line. Families with no children have the highest poverty rate of 11.1%, comprising of 1 families. On the other hand, families with 1 or 2 children have the lowest poverty rate of 0.0%, which includes 0 families.
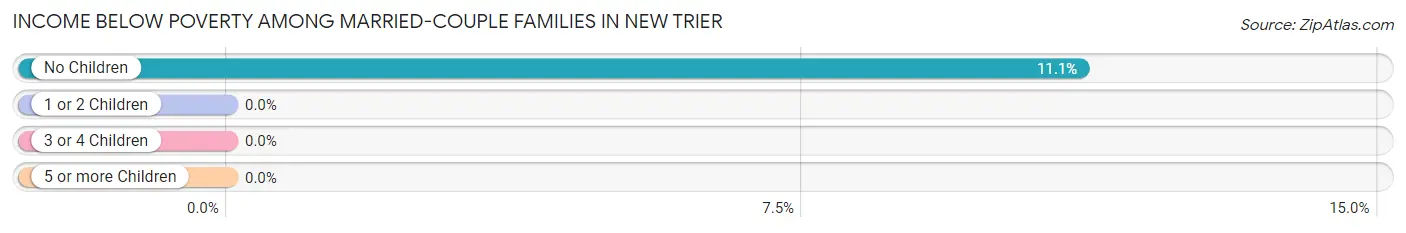
| Children | Above Poverty | Below Poverty |
| No Children | 8 (88.9%) | 1 (11.1%) |
| 1 or 2 Children | 1 (100.0%) | 0 (0.0%) |
| 3 or 4 Children | 0 (0.0%) | 0 (0.0%) |
| 5 or more Children | 0 (0.0%) | 0 (0.0%) |
| Total | 9 (90.0%) | 1 (10.0%) |
Income Below Poverty Among Single-Parent Households in New Trier
According to the poverty data in New Trier, 33.3% or 1 single-father households and 22.2% or 2 single-mother households are living below the poverty line. Among single-father households, those with 1 or 2 children have the highest poverty rate, with 1 households (100.0%) experiencing poverty. Likewise, among single-mother households, those with 1 or 2 children have the highest poverty rate, with 2 households (22.2%) falling below the poverty line.
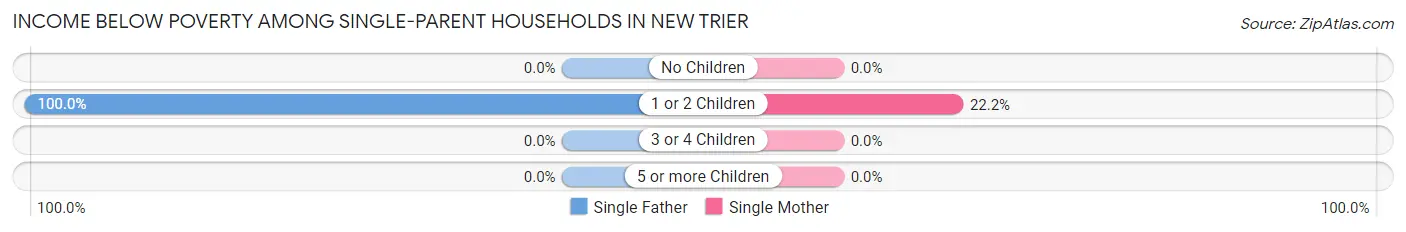
| Children | Single Father | Single Mother |
| No Children | 0 (0.0%) | 0 (0.0%) |
| 1 or 2 Children | 1 (100.0%) | 2 (22.2%) |
| 3 or 4 Children | 0 (0.0%) | 0 (0.0%) |
| 5 or more Children | 0 (0.0%) | 0 (0.0%) |
| Total | 1 (33.3%) | 2 (22.2%) |
Income Below Poverty Among Married-Couple vs Single-Parent Households in New Trier
The poverty data for New Trier shows that 1 of the married-couple family households (10.0%) and 3 of the single-parent households (25.0%) are living below the poverty level. Within the married-couple family households, those with no children have the highest poverty rate, with 1 households (11.1%) falling below the poverty line. Among the single-parent households, those with 1 or 2 children have the highest poverty rate, with 3 household (30.0%) living below poverty.
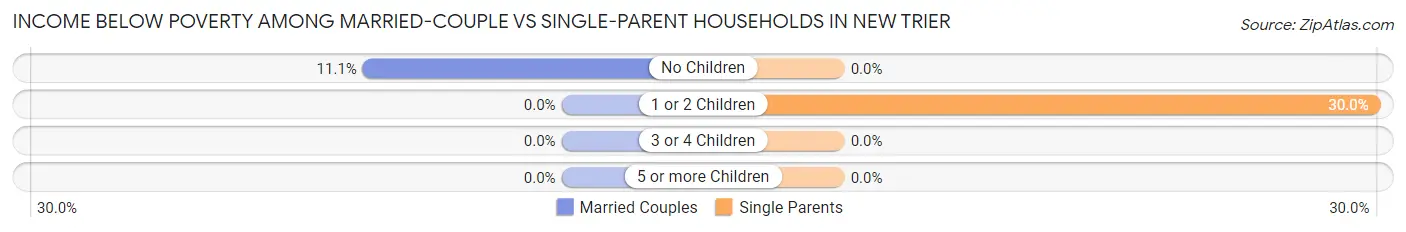
| Children | Married-Couple Families | Single-Parent Households |
| No Children | 1 (11.1%) | 0 (0.0%) |
| 1 or 2 Children | 0 (0.0%) | 3 (30.0%) |
| 3 or 4 Children | 0 (0.0%) | 0 (0.0%) |
| 5 or more Children | 0 (0.0%) | 0 (0.0%) |
| Total | 1 (10.0%) | 3 (25.0%) |
Employment Characteristics in New Trier
Employment by Class of Employer in New Trier
Among the 43 employed individuals in New Trier, private company employees (36 | 83.7%), and not-for-profit organizations (7 | 16.3%) make up the most common classes of employment.
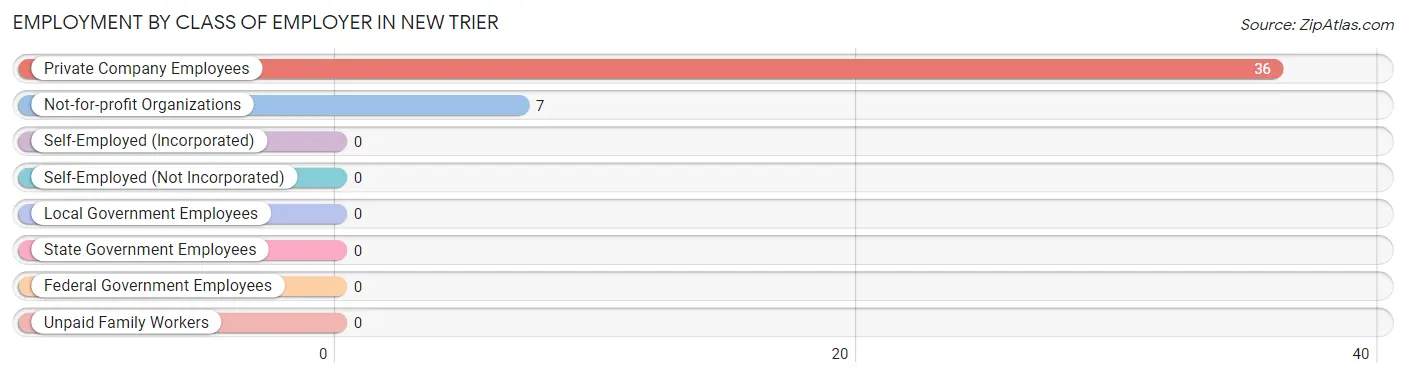
| Employer Class | # Employees | % Employees |
| Private Company Employees | 36 | 83.7% |
| Self-Employed (Incorporated) | 0 | 0.0% |
| Self-Employed (Not Incorporated) | 0 | 0.0% |
| Not-for-profit Organizations | 7 | 16.3% |
| Local Government Employees | 0 | 0.0% |
| State Government Employees | 0 | 0.0% |
| Federal Government Employees | 0 | 0.0% |
| Unpaid Family Workers | 0 | 0.0% |
| Total | 43 | 100.0% |
Employment Status by Age in New Trier
According to the labor force statistics for New Trier, out of the total population over 16 years of age (65), 70.8% or 46 individuals are in the labor force, with 4.3% or 2 of them unemployed. The age group with the highest labor force participation rate is 16 to 19 years, with 100.0% or 7 individuals in the labor force. Within the labor force, the 35 to 44 years age range has the highest percentage of unemployed individuals, with 20.0% or 2 of them being unemployed.
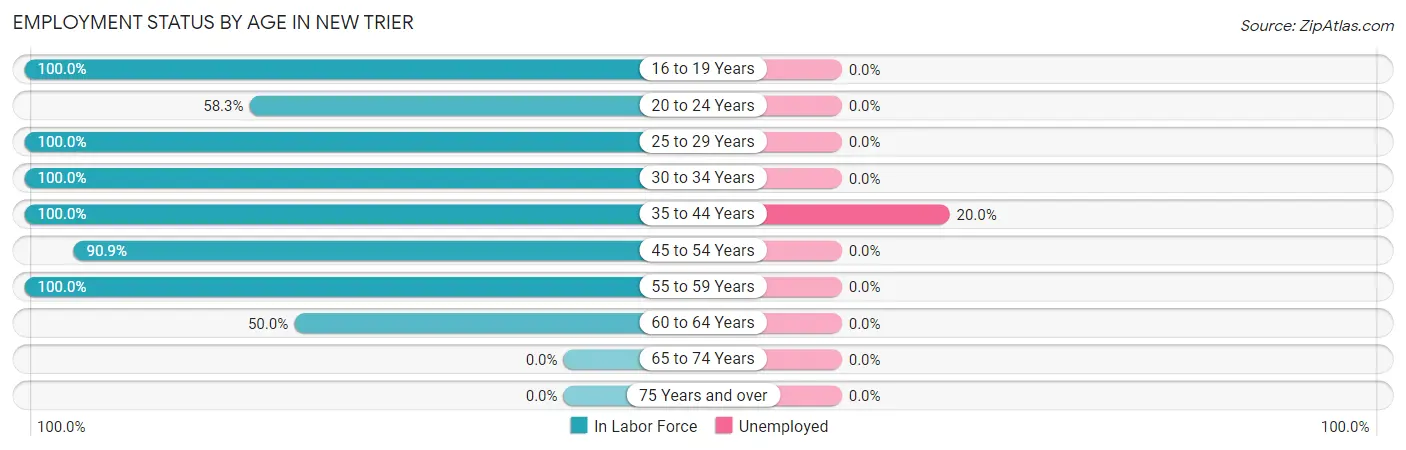
| Age Bracket | In Labor Force | Unemployed |
| 16 to 19 Years | 7 (100.0%) | 0 (0.0%) |
| 20 to 24 Years | 7 (58.3%) | 0 (0.0%) |
| 25 to 29 Years | 1 (100.0%) | 0 (0.0%) |
| 30 to 34 Years | 4 (100.0%) | 0 (0.0%) |
| 35 to 44 Years | 10 (100.0%) | 2 (20.0%) |
| 45 to 54 Years | 10 (90.9%) | 0 (0.0%) |
| 55 to 59 Years | 5 (100.0%) | 0 (0.0%) |
| 60 to 64 Years | 2 (50.0%) | 0 (0.0%) |
| 65 to 74 Years | 0 (0.0%) | 0 (0.0%) |
| 75 Years and over | 0 (0.0%) | 0 (0.0%) |
| Total | 46 (70.8%) | 2 (4.3%) |
Employment Status by Educational Attainment in New Trier
According to labor force statistics for New Trier, 91.4% of individuals (32) out of the total population between 25 and 64 years of age (35) are in the labor force, with 6.3% or 2 of them being unemployed. The group with the highest labor force participation rate are those with the educational attainment of high school diploma, with 100.0% or 10 individuals in the labor force. Within the labor force, individuals with bachelor's degree or higher education have the highest percentage of unemployment, with 20.0% or 2 of them being unemployed.
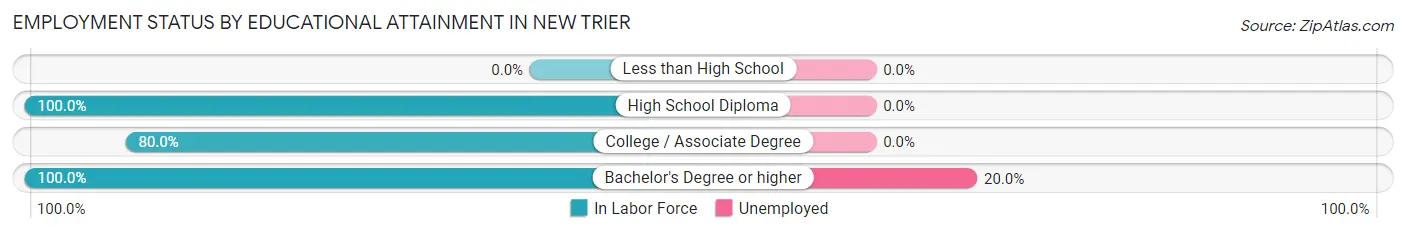
| Educational Attainment | In Labor Force | Unemployed |
| Less than High School | 0 (0.0%) | 0 (0.0%) |
| High School Diploma | 10 (100.0%) | 0 (0.0%) |
| College / Associate Degree | 12 (80.0%) | 0 (0.0%) |
| Bachelor's Degree or higher | 10 (100.0%) | 2 (20.0%) |
| Total | 32 (91.4%) | 2 (6.3%) |
Employment Occupations by Sex in New Trier
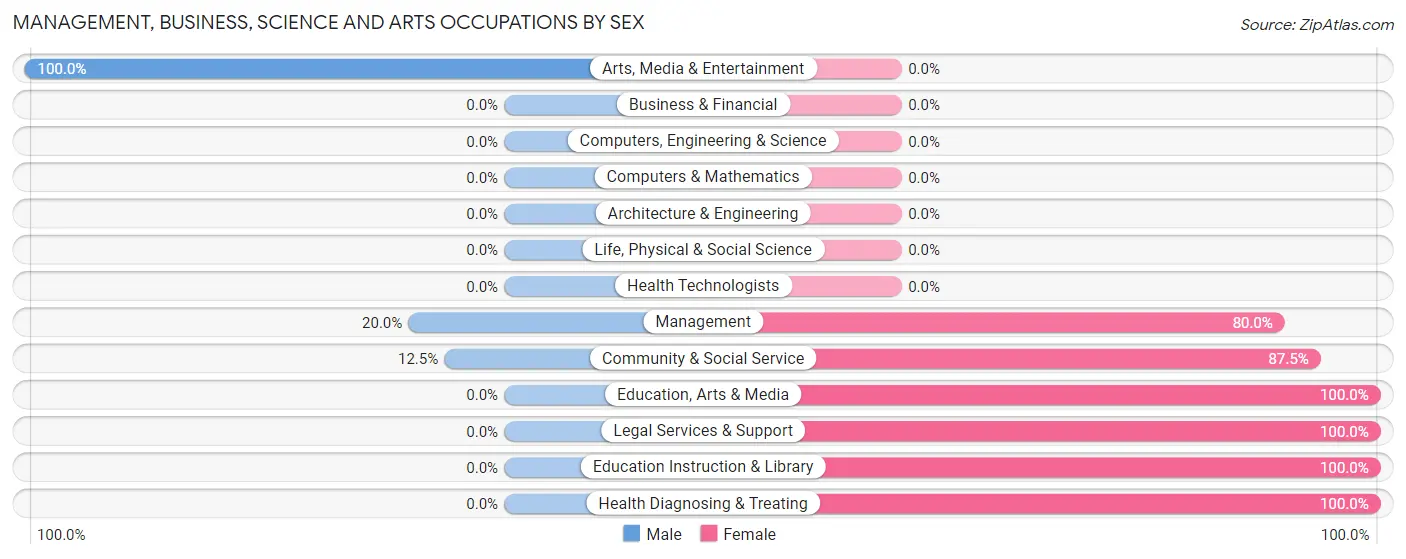
Management, Business, Science and Arts Occupations
The most common Management, Business, Science and Arts occupations in New Trier are Community & Social Service (8 | 18.2%), Management (5 | 11.4%), Legal Services & Support (4 | 9.1%), Education, Arts & Media (2 | 4.5%), and Health Diagnosing & Treating (2 | 4.5%).
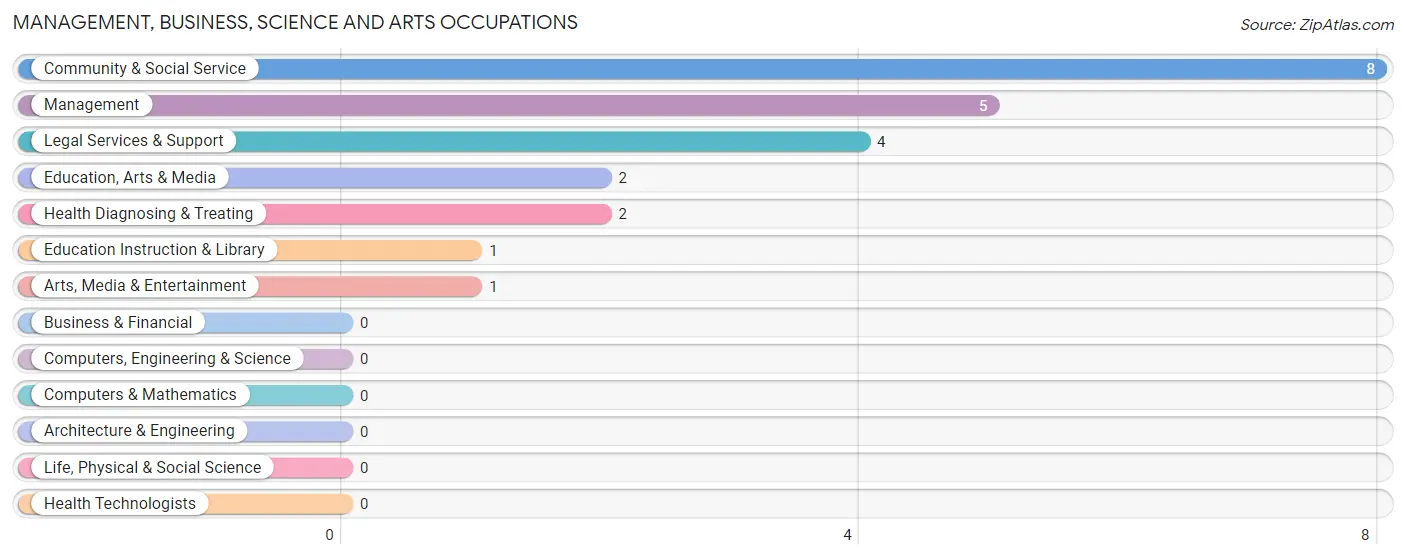
Management, Business, Science and Arts Occupations by Sex
Within the Management, Business, Science and Arts occupations in New Trier, the most male-oriented occupations are Arts, Media & Entertainment (100.0%), Management (20.0%), and Community & Social Service (12.5%), while the most female-oriented occupations are Education, Arts & Media (100.0%), Legal Services & Support (100.0%), and Education Instruction & Library (100.0%).
| Occupation | Male | Female |
| Management | 1 (20.0%) | 4 (80.0%) |
| Business & Financial | 0 (0.0%) | 0 (0.0%) |
| Computers, Engineering & Science | 0 (0.0%) | 0 (0.0%) |
| Computers & Mathematics | 0 (0.0%) | 0 (0.0%) |
| Architecture & Engineering | 0 (0.0%) | 0 (0.0%) |
| Life, Physical & Social Science | 0 (0.0%) | 0 (0.0%) |
| Community & Social Service | 1 (12.5%) | 7 (87.5%) |
| Education, Arts & Media | 0 (0.0%) | 2 (100.0%) |
| Legal Services & Support | 0 (0.0%) | 4 (100.0%) |
| Education Instruction & Library | 0 (0.0%) | 1 (100.0%) |
| Arts, Media & Entertainment | 1 (100.0%) | 0 (0.0%) |
| Health Diagnosing & Treating | 0 (0.0%) | 2 (100.0%) |
| Health Technologists | 0 (0.0%) | 0 (0.0%) |
| Total (Category) | 2 (13.3%) | 13 (86.7%) |
| Total (Overall) | 23 (52.3%) | 21 (47.7%) |
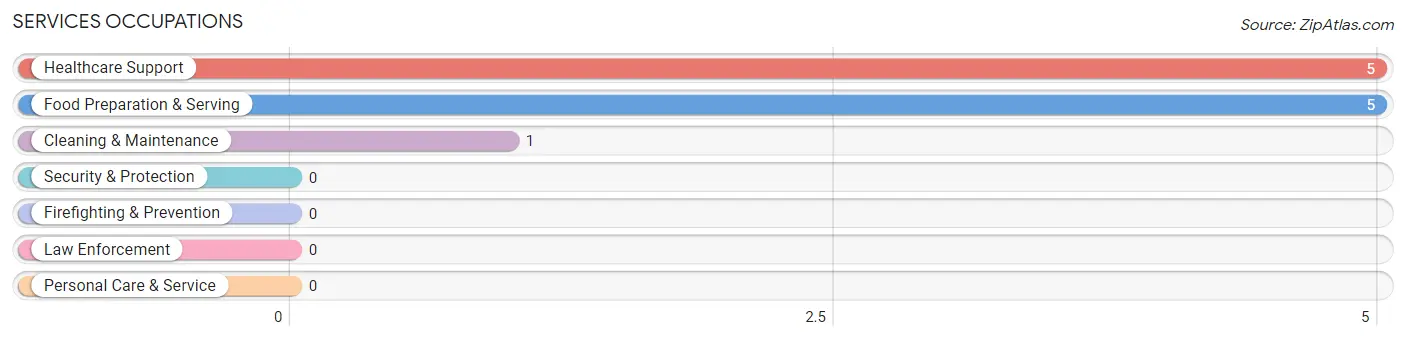
Services Occupations
The most common Services occupations in New Trier are Healthcare Support (5 | 11.4%), Food Preparation & Serving (5 | 11.4%), and Cleaning & Maintenance (1 | 2.3%).
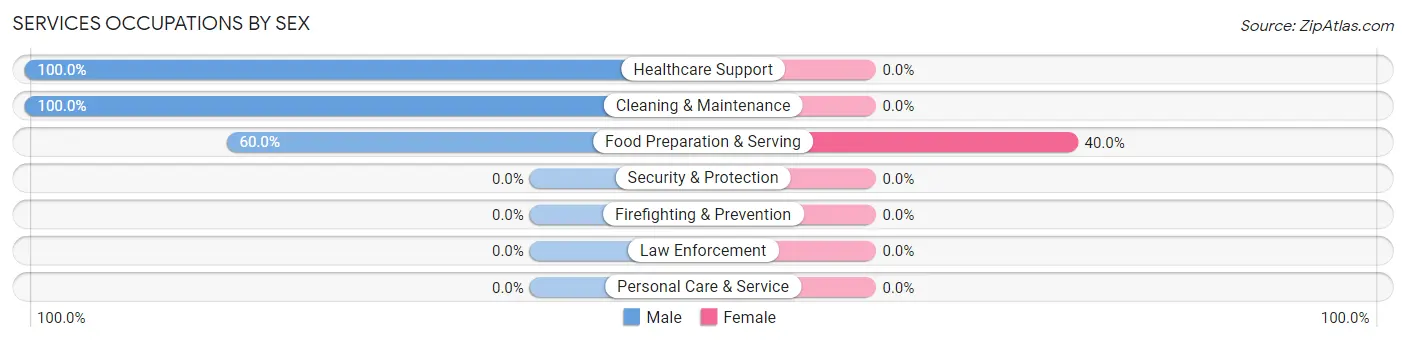
Services Occupations by Sex
| Occupation | Male | Female |
| Healthcare Support | 5 (100.0%) | 0 (0.0%) |
| Security & Protection | 0 (0.0%) | 0 (0.0%) |
| Firefighting & Prevention | 0 (0.0%) | 0 (0.0%) |
| Law Enforcement | 0 (0.0%) | 0 (0.0%) |
| Food Preparation & Serving | 3 (60.0%) | 2 (40.0%) |
| Cleaning & Maintenance | 1 (100.0%) | 0 (0.0%) |
| Personal Care & Service | 0 (0.0%) | 0 (0.0%) |
| Total (Category) | 9 (81.8%) | 2 (18.2%) |
| Total (Overall) | 23 (52.3%) | 21 (47.7%) |
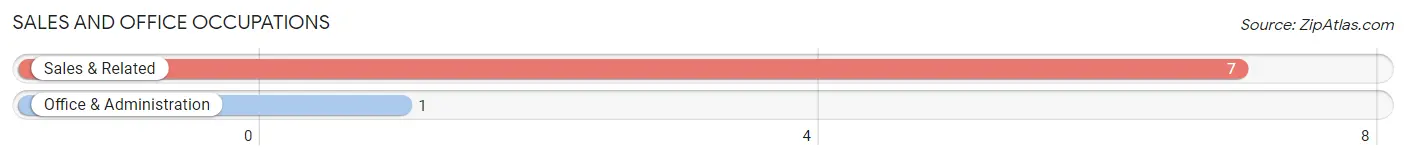
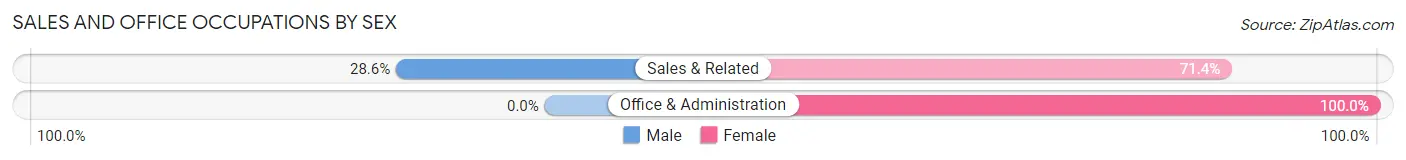
Sales and Office Occupations
The most common Sales and Office occupations in New Trier are Sales & Related (7 | 15.9%), and Office & Administration (1 | 2.3%).
Sales and Office Occupations by Sex
| Occupation | Male | Female |
| Sales & Related | 2 (28.6%) | 5 (71.4%) |
| Office & Administration | 0 (0.0%) | 1 (100.0%) |
| Total (Category) | 2 (25.0%) | 6 (75.0%) |
| Total (Overall) | 23 (52.3%) | 21 (47.7%) |
Natural Resources, Construction and Maintenance Occupations
The most common Natural Resources, Construction and Maintenance occupations in New Trier are , and Installation, Maintenance & Repair (2 | 4.5%).
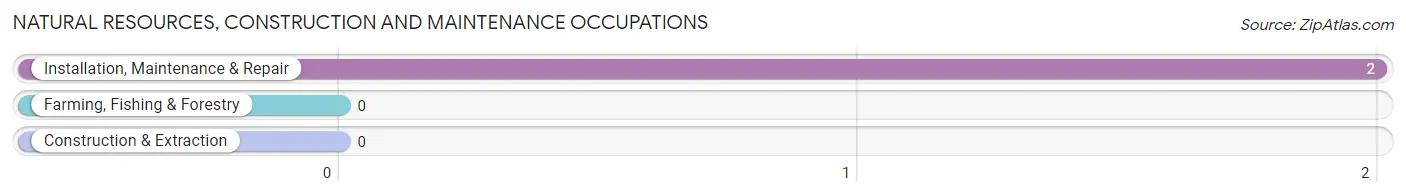
Natural Resources, Construction and Maintenance Occupations by Sex
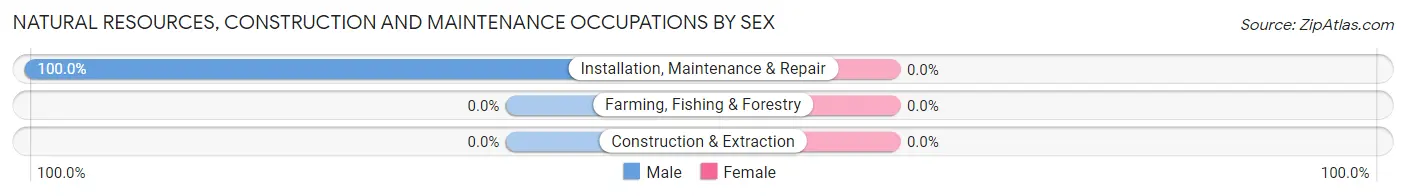
| Occupation | Male | Female |
| Farming, Fishing & Forestry | 0 (0.0%) | 0 (0.0%) |
| Construction & Extraction | 0 (0.0%) | 0 (0.0%) |
| Installation, Maintenance & Repair | 2 (100.0%) | 0 (0.0%) |
| Total (Category) | 2 (100.0%) | 0 (0.0%) |
| Total (Overall) | 23 (52.3%) | 21 (47.7%) |
Production, Transportation and Moving Occupations
The most common Production, Transportation and Moving occupations in New Trier are Production (6 | 13.6%), and Transportation (2 | 4.5%).
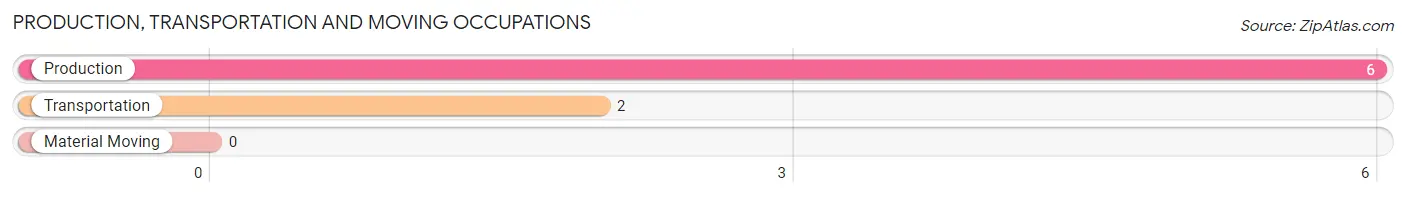
Production, Transportation and Moving Occupations by Sex
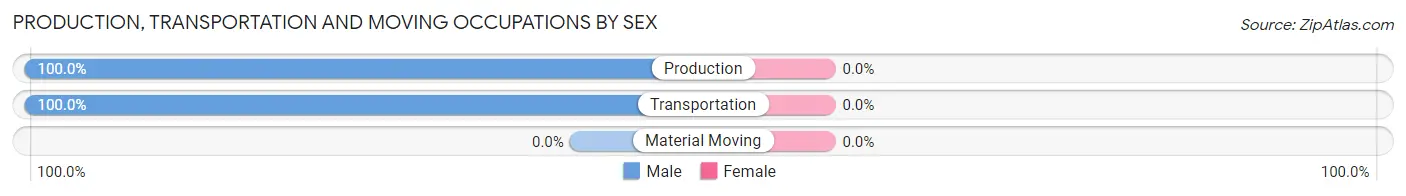
| Occupation | Male | Female |
| Production | 6 (100.0%) | 0 (0.0%) |
| Transportation | 2 (100.0%) | 0 (0.0%) |
| Material Moving | 0 (0.0%) | 0 (0.0%) |
| Total (Category) | 8 (100.0%) | 0 (0.0%) |
| Total (Overall) | 23 (52.3%) | 21 (47.7%) |
Employment Industries by Sex in New Trier
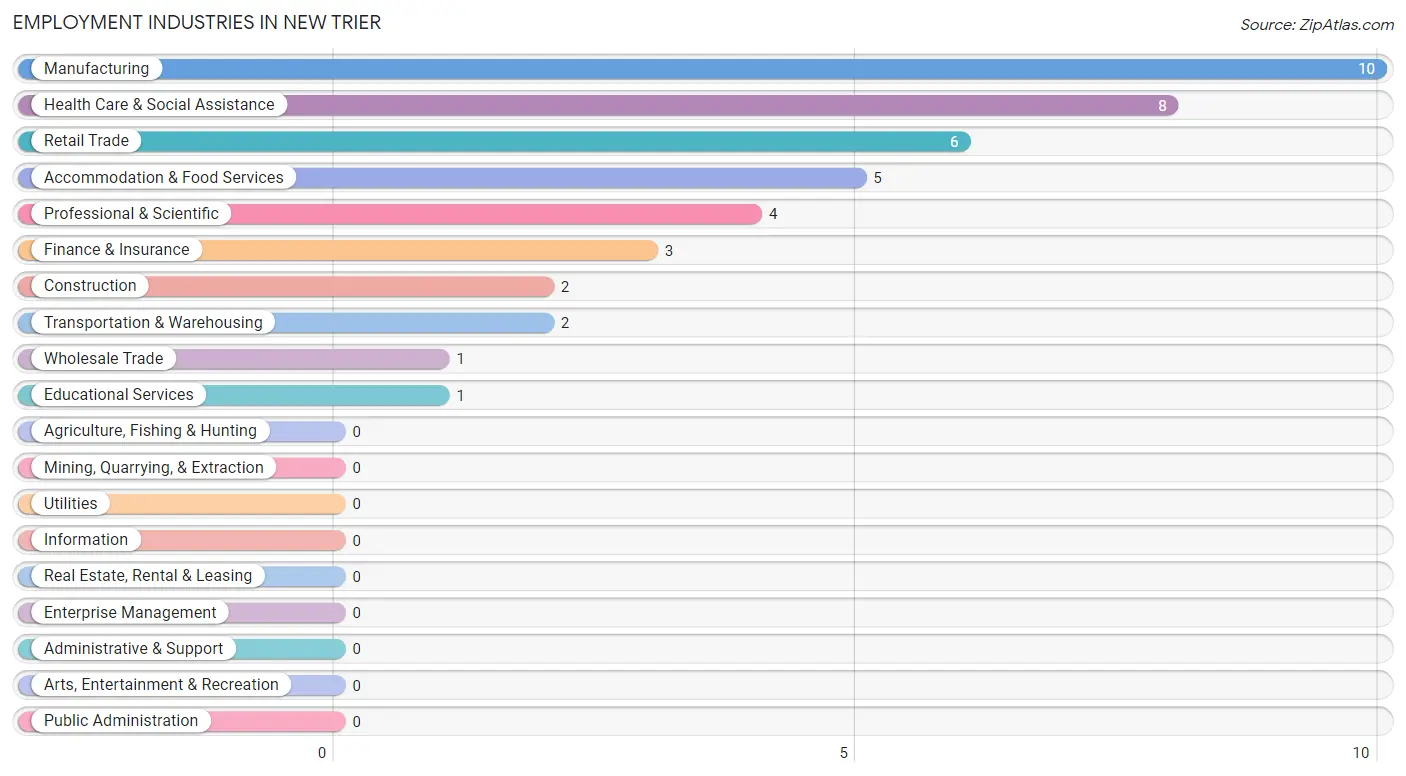
Employment Industries in New Trier
The major employment industries in New Trier include Manufacturing (10 | 22.7%), Health Care & Social Assistance (8 | 18.2%), Retail Trade (6 | 13.6%), Accommodation & Food Services (5 | 11.4%), and Professional & Scientific (4 | 9.1%).
Employment Industries by Sex in New Trier
The New Trier industries that see more men than women are Construction (100.0%), Wholesale Trade (100.0%), and Transportation & Warehousing (100.0%), whereas the industries that tend to have a higher number of women are Retail Trade (100.0%), Professional & Scientific (100.0%), and Educational Services (100.0%).
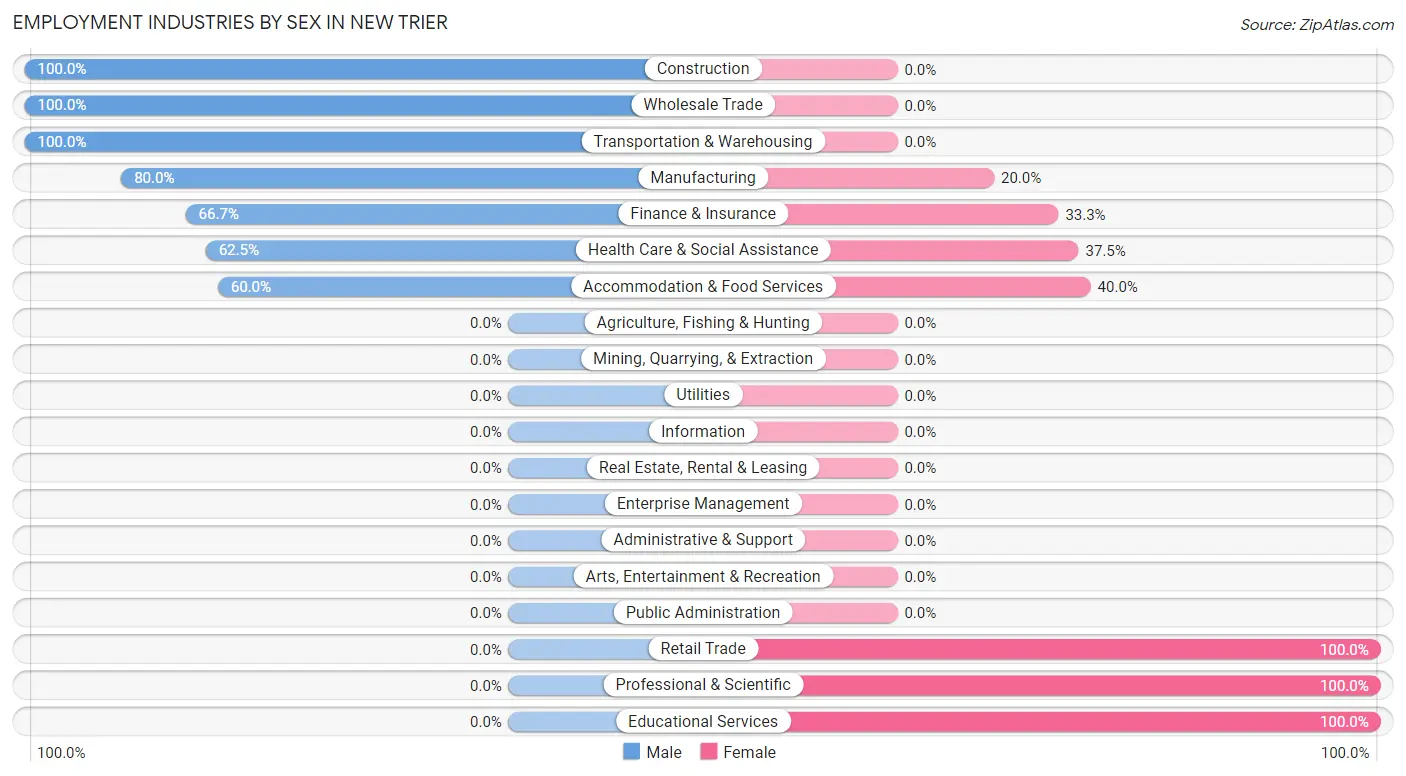
| Industry | Male | Female |
| Agriculture, Fishing & Hunting | 0 (0.0%) | 0 (0.0%) |
| Mining, Quarrying, & Extraction | 0 (0.0%) | 0 (0.0%) |
| Construction | 2 (100.0%) | 0 (0.0%) |
| Manufacturing | 8 (80.0%) | 2 (20.0%) |
| Wholesale Trade | 1 (100.0%) | 0 (0.0%) |
| Retail Trade | 0 (0.0%) | 6 (100.0%) |
| Transportation & Warehousing | 2 (100.0%) | 0 (0.0%) |
| Utilities | 0 (0.0%) | 0 (0.0%) |
| Information | 0 (0.0%) | 0 (0.0%) |
| Finance & Insurance | 2 (66.7%) | 1 (33.3%) |
| Real Estate, Rental & Leasing | 0 (0.0%) | 0 (0.0%) |
| Professional & Scientific | 0 (0.0%) | 4 (100.0%) |
| Enterprise Management | 0 (0.0%) | 0 (0.0%) |
| Administrative & Support | 0 (0.0%) | 0 (0.0%) |
| Educational Services | 0 (0.0%) | 1 (100.0%) |
| Health Care & Social Assistance | 5 (62.5%) | 3 (37.5%) |
| Arts, Entertainment & Recreation | 0 (0.0%) | 0 (0.0%) |
| Accommodation & Food Services | 3 (60.0%) | 2 (40.0%) |
| Public Administration | 0 (0.0%) | 0 (0.0%) |
| Total | 23 (52.3%) | 21 (47.7%) |
Education in New Trier
School Enrollment in New Trier
The most common levels of schooling among the 12 students in New Trier are college / undergraduate (6 | 50.0%), elementary school (2 | 16.7%), and high school (2 | 16.7%).
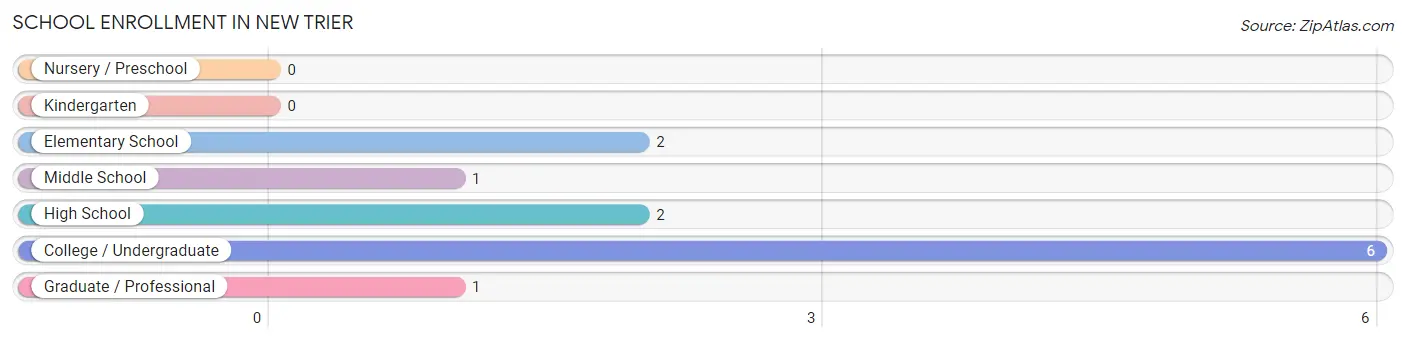
| School Level | # Students | % Students |
| Nursery / Preschool | 0 | 0.0% |
| Kindergarten | 0 | 0.0% |
| Elementary School | 2 | 16.7% |
| Middle School | 1 | 8.3% |
| High School | 2 | 16.7% |
| College / Undergraduate | 6 | 50.0% |
| Graduate / Professional | 1 | 8.3% |
| Total | 12 | 100.0% |
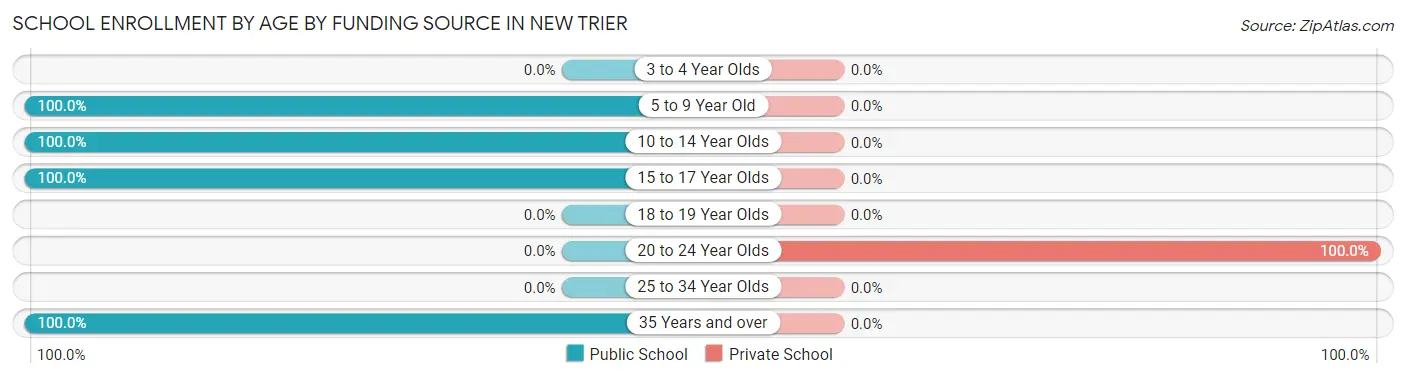
School Enrollment by Age by Funding Source in New Trier
Out of a total of 12 students who are enrolled in schools in New Trier, 5 (41.7%) attend a private institution, while the remaining 7 (58.3%) are enrolled in public schools. The age group of 20 to 24 year olds has the highest likelihood of being enrolled in private schools, with 5 (100.0% in the age bracket) enrolled. Conversely, the age group of 5 to 9 year old has the lowest likelihood of being enrolled in a private school, with 2 (100.0% in the age bracket) attending a public institution.
| Age Bracket | Public School | Private School |
| 3 to 4 Year Olds | 0 (0.0%) | 0 (0.0%) |
| 5 to 9 Year Old | 2 (100.0%) | 0 (0.0%) |
| 10 to 14 Year Olds | 1 (100.0%) | 0 (0.0%) |
| 15 to 17 Year Olds | 2 (100.0%) | 0 (0.0%) |
| 18 to 19 Year Olds | 0 (0.0%) | 0 (0.0%) |
| 20 to 24 Year Olds | 0 (0.0%) | 5 (100.0%) |
| 25 to 34 Year Olds | 0 (0.0%) | 0 (0.0%) |
| 35 Years and over | 2 (100.0%) | 0 (0.0%) |
| Total | 7 (58.3%) | 5 (41.7%) |
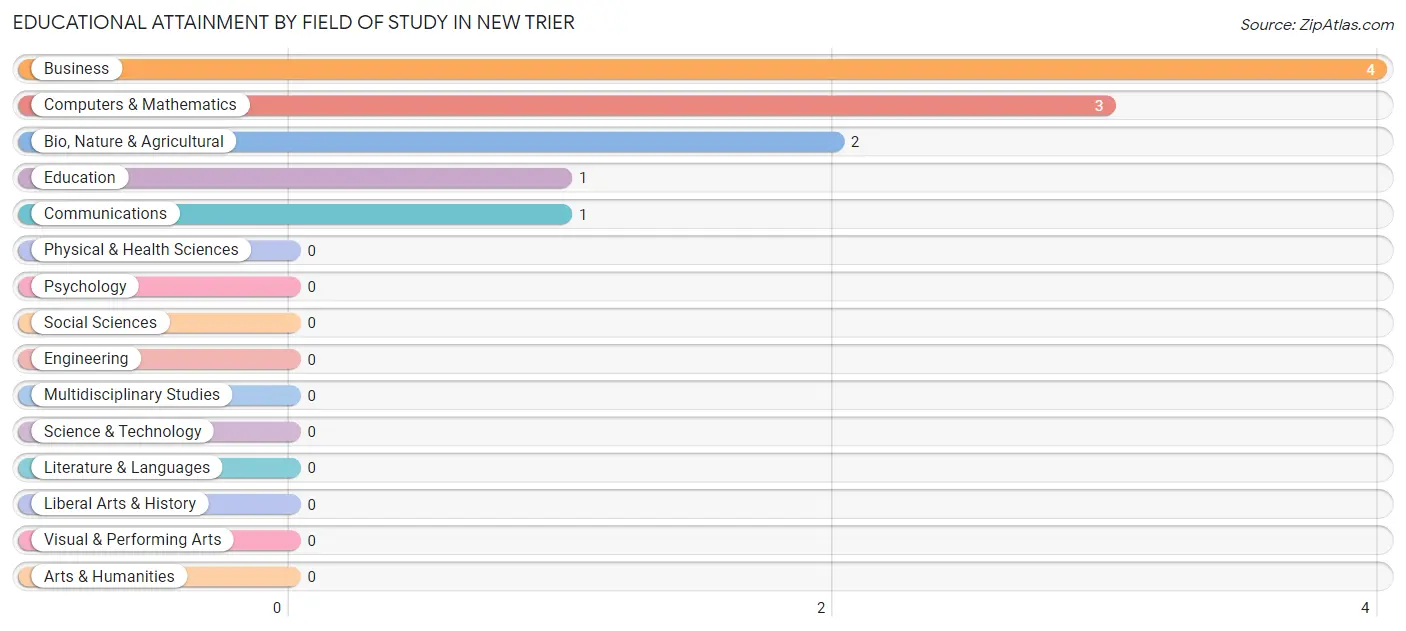
Educational Attainment by Field of Study in New Trier
Business (4 | 36.4%), computers & mathematics (3 | 27.3%), bio, nature & agricultural (2 | 18.2%), education (1 | 9.1%), and communications (1 | 9.1%) are the most common fields of study among 11 individuals in New Trier who have obtained a bachelor's degree or higher.
| Field of Study | # Graduates | % Graduates |
| Computers & Mathematics | 3 | 27.3% |
| Bio, Nature & Agricultural | 2 | 18.2% |
| Physical & Health Sciences | 0 | 0.0% |
| Psychology | 0 | 0.0% |
| Social Sciences | 0 | 0.0% |
| Engineering | 0 | 0.0% |
| Multidisciplinary Studies | 0 | 0.0% |
| Science & Technology | 0 | 0.0% |
| Business | 4 | 36.4% |
| Education | 1 | 9.1% |
| Literature & Languages | 0 | 0.0% |
| Liberal Arts & History | 0 | 0.0% |
| Visual & Performing Arts | 0 | 0.0% |
| Communications | 1 | 9.1% |
| Arts & Humanities | 0 | 0.0% |
| Total | 11 | 100.0% |
Transportation & Commute in New Trier
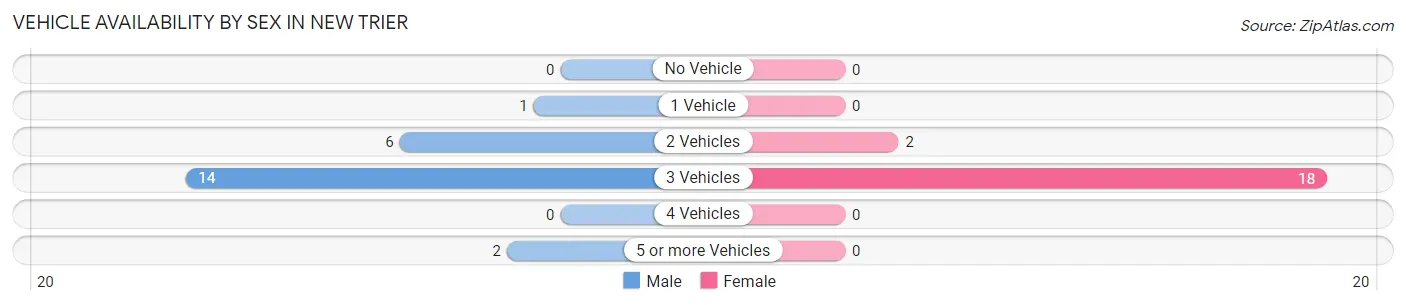
Vehicle Availability by Sex in New Trier
The most prevalent vehicle ownership categories in New Trier are males with 3 vehicles (14, accounting for 60.9%) and females with 3 vehicles (18, making up 70.0%).
| Vehicles Available | Male | Female |
| No Vehicle | 0 (0.0%) | 0 (0.0%) |
| 1 Vehicle | 1 (4.3%) | 0 (0.0%) |
| 2 Vehicles | 6 (26.1%) | 2 (10.0%) |
| 3 Vehicles | 14 (60.9%) | 18 (90.0%) |
| 4 Vehicles | 0 (0.0%) | 0 (0.0%) |
| 5 or more Vehicles | 2 (8.7%) | 0 (0.0%) |
| Total | 23 (100.0%) | 20 (100.0%) |
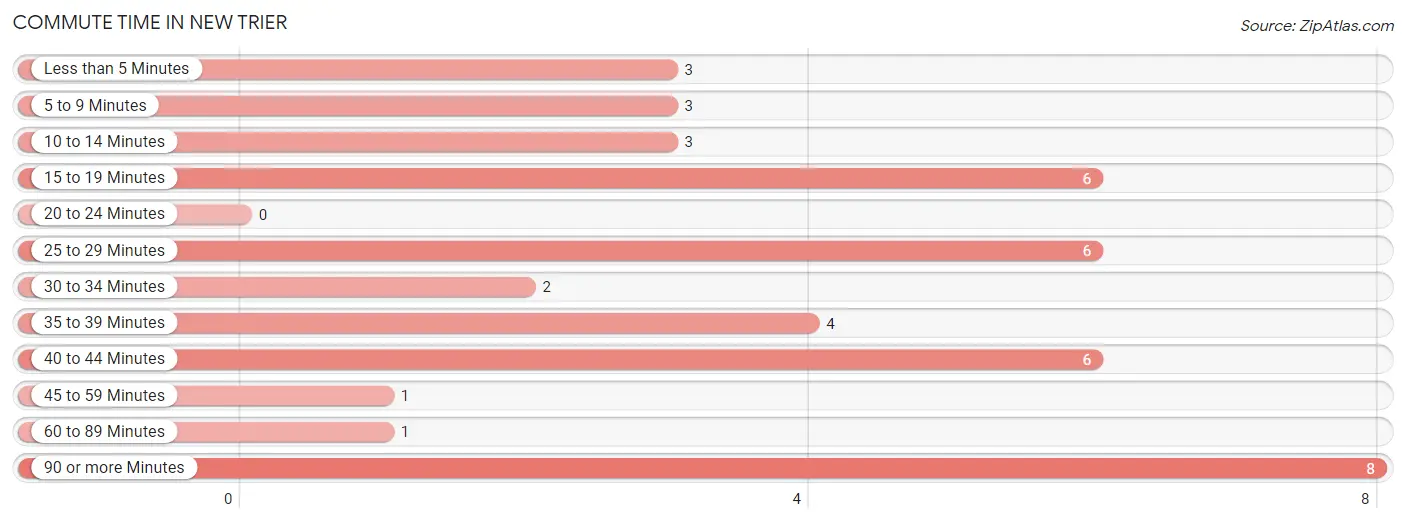
Commute Time in New Trier
The most frequently occuring commute durations in New Trier are 90 or more minutes (8 commuters, 18.6%), 15 to 19 minutes (6 commuters, 14.0%), and 25 to 29 minutes (6 commuters, 14.0%).
| Commute Time | # Commuters | % Commuters |
| Less than 5 Minutes | 3 | 7.0% |
| 5 to 9 Minutes | 3 | 7.0% |
| 10 to 14 Minutes | 3 | 7.0% |
| 15 to 19 Minutes | 6 | 14.0% |
| 20 to 24 Minutes | 0 | 0.0% |
| 25 to 29 Minutes | 6 | 14.0% |
| 30 to 34 Minutes | 2 | 4.6% |
| 35 to 39 Minutes | 4 | 9.3% |
| 40 to 44 Minutes | 6 | 14.0% |
| 45 to 59 Minutes | 1 | 2.3% |
| 60 to 89 Minutes | 1 | 2.3% |
| 90 or more Minutes | 8 | 18.6% |
Commute Time by Sex in New Trier
The most common commute times in New Trier are 15 to 19 minutes (6 commuters, 26.1%) for males and 90 or more minutes (8 commuters, 40.0%) for females.
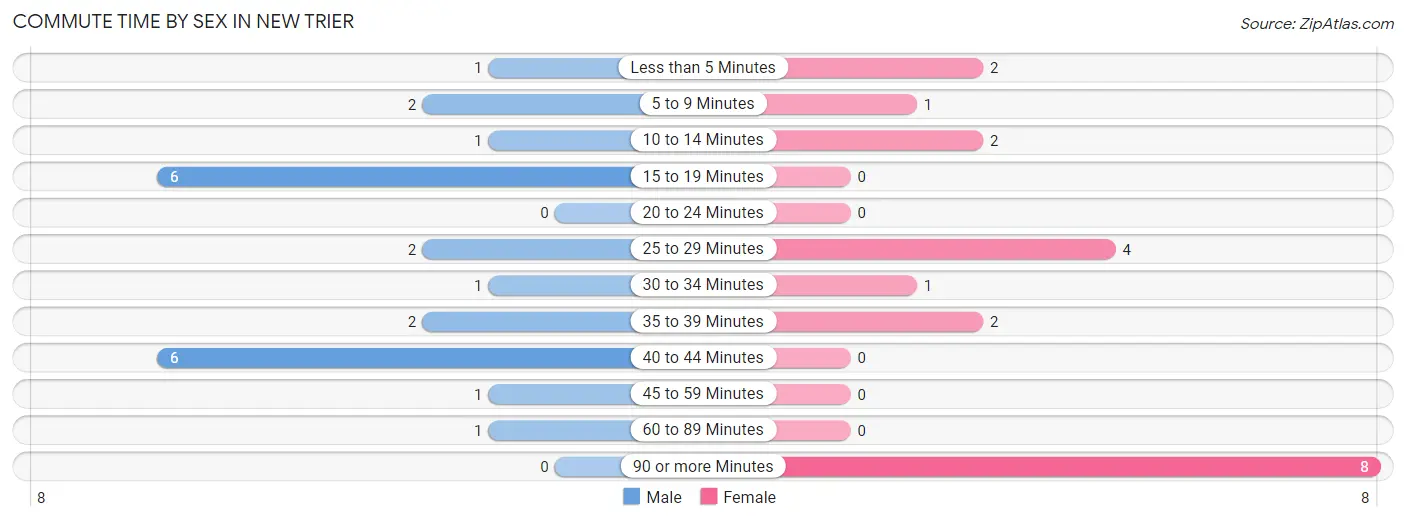
| Commute Time | Male | Female |
| Less than 5 Minutes | 1 (4.3%) | 2 (10.0%) |
| 5 to 9 Minutes | 2 (8.7%) | 1 (5.0%) |
| 10 to 14 Minutes | 1 (4.3%) | 2 (10.0%) |
| 15 to 19 Minutes | 6 (26.1%) | 0 (0.0%) |
| 20 to 24 Minutes | 0 (0.0%) | 0 (0.0%) |
| 25 to 29 Minutes | 2 (8.7%) | 4 (20.0%) |
| 30 to 34 Minutes | 1 (4.3%) | 1 (5.0%) |
| 35 to 39 Minutes | 2 (8.7%) | 2 (10.0%) |
| 40 to 44 Minutes | 6 (26.1%) | 0 (0.0%) |
| 45 to 59 Minutes | 1 (4.3%) | 0 (0.0%) |
| 60 to 89 Minutes | 1 (4.3%) | 0 (0.0%) |
| 90 or more Minutes | 0 (0.0%) | 8 (40.0%) |
Time of Departure to Work by Sex in New Trier
The most frequent times of departure to work in New Trier are 6:00 AM to 6:29 AM (6, 26.1%) for males and 7:30 AM to 7:59 AM (8, 40.0%) for females.
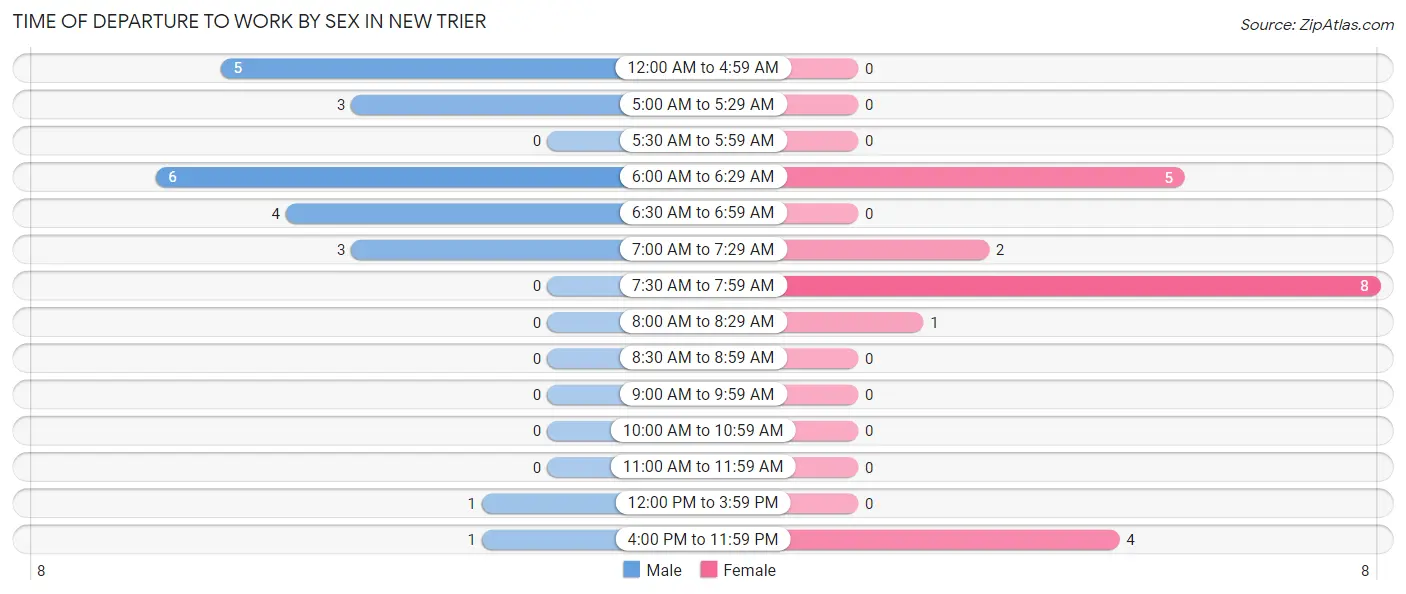
| Time of Departure | Male | Female |
| 12:00 AM to 4:59 AM | 5 (21.7%) | 0 (0.0%) |
| 5:00 AM to 5:29 AM | 3 (13.0%) | 0 (0.0%) |
| 5:30 AM to 5:59 AM | 0 (0.0%) | 0 (0.0%) |
| 6:00 AM to 6:29 AM | 6 (26.1%) | 5 (25.0%) |
| 6:30 AM to 6:59 AM | 4 (17.4%) | 0 (0.0%) |
| 7:00 AM to 7:29 AM | 3 (13.0%) | 2 (10.0%) |
| 7:30 AM to 7:59 AM | 0 (0.0%) | 8 (40.0%) |
| 8:00 AM to 8:29 AM | 0 (0.0%) | 1 (5.0%) |
| 8:30 AM to 8:59 AM | 0 (0.0%) | 0 (0.0%) |
| 9:00 AM to 9:59 AM | 0 (0.0%) | 0 (0.0%) |
| 10:00 AM to 10:59 AM | 0 (0.0%) | 0 (0.0%) |
| 11:00 AM to 11:59 AM | 0 (0.0%) | 0 (0.0%) |
| 12:00 PM to 3:59 PM | 1 (4.3%) | 0 (0.0%) |
| 4:00 PM to 11:59 PM | 1 (4.3%) | 4 (20.0%) |
| Total | 23 (100.0%) | 20 (100.0%) |
Housing Occupancy in New Trier
Occupancy by Ownership in New Trier
Of the total 28 dwellings in New Trier, owner-occupied units account for 27 (96.4%), while renter-occupied units make up 1 (3.6%).
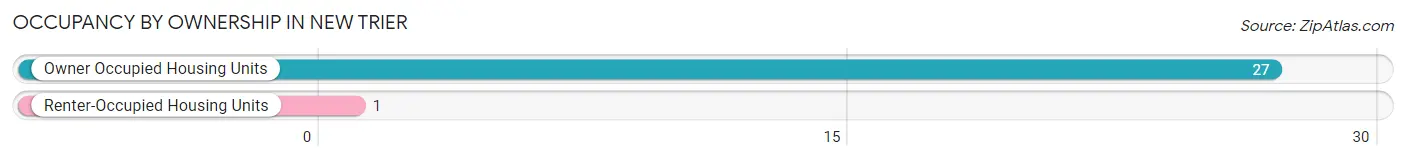
| Occupancy | # Housing Units | % Housing Units |
| Owner Occupied Housing Units | 27 | 96.4% |
| Renter-Occupied Housing Units | 1 | 3.6% |
| Total Occupied Housing Units | 28 | 100.0% |
Occupancy by Household Size in New Trier
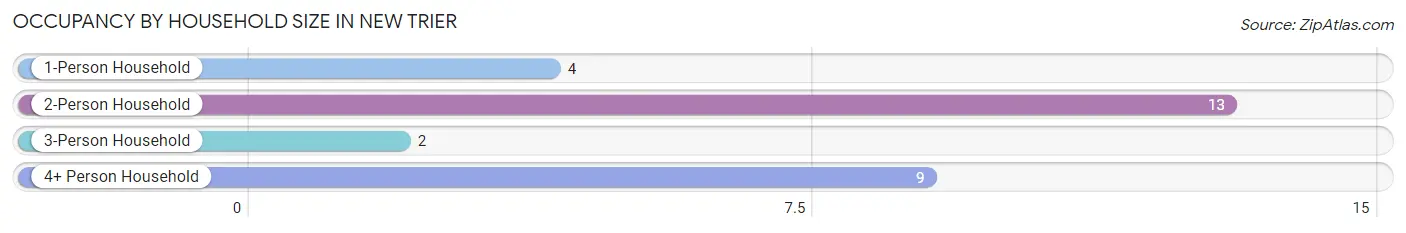
| Household Size | # Housing Units | % Housing Units |
| 1-Person Household | 4 | 14.3% |
| 2-Person Household | 13 | 46.4% |
| 3-Person Household | 2 | 7.1% |
| 4+ Person Household | 9 | 32.1% |
| Total Housing Units | 28 | 100.0% |
Occupancy by Ownership by Household Size in New Trier
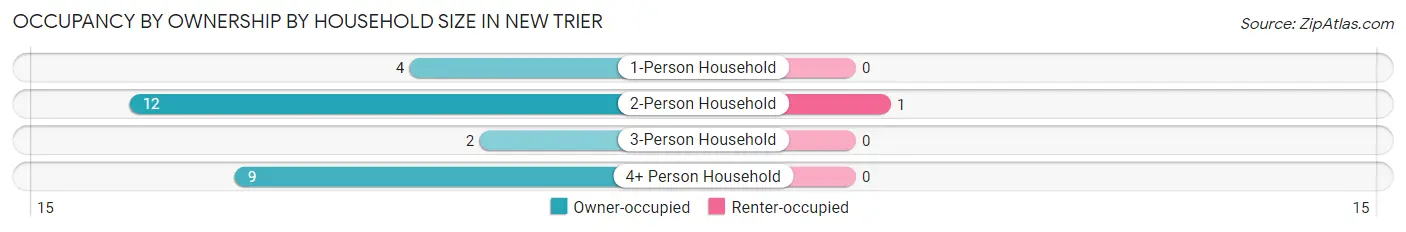
| Household Size | Owner-occupied | Renter-occupied |
| 1-Person Household | 4 (100.0%) | 0 (0.0%) |
| 2-Person Household | 12 (92.3%) | 1 (7.7%) |
| 3-Person Household | 2 (100.0%) | 0 (0.0%) |
| 4+ Person Household | 9 (100.0%) | 0 (0.0%) |
| Total Housing Units | 27 (96.4%) | 1 (3.6%) |
Occupancy by Educational Attainment in New Trier
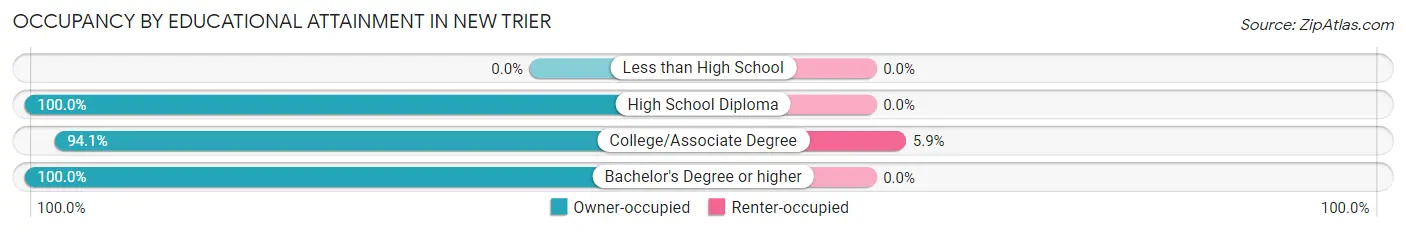
| Household Size | Owner-occupied | Renter-occupied |
| Less than High School | 0 (0.0%) | 0 (0.0%) |
| High School Diploma | 5 (100.0%) | 0 (0.0%) |
| College/Associate Degree | 16 (94.1%) | 1 (5.9%) |
| Bachelor's Degree or higher | 6 (100.0%) | 0 (0.0%) |
Occupancy by Age of Householder in New Trier
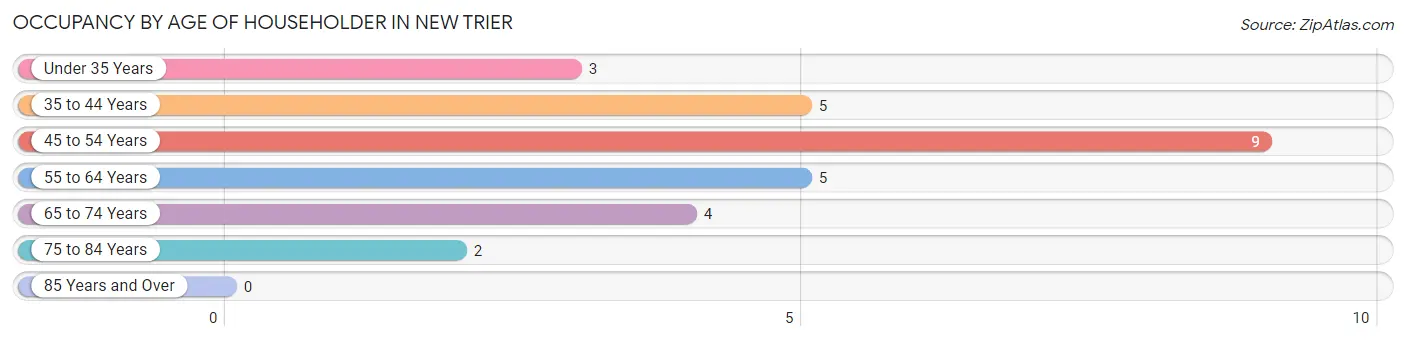
| Age Bracket | # Households | % Households |
| Under 35 Years | 3 | 10.7% |
| 35 to 44 Years | 5 | 17.9% |
| 45 to 54 Years | 9 | 32.1% |
| 55 to 64 Years | 5 | 17.9% |
| 65 to 74 Years | 4 | 14.3% |
| 75 to 84 Years | 2 | 7.1% |
| 85 Years and Over | 0 | 0.0% |
| Total | 28 | 100.0% |
Housing Finances in New Trier
Median Income by Occupancy in New Trier
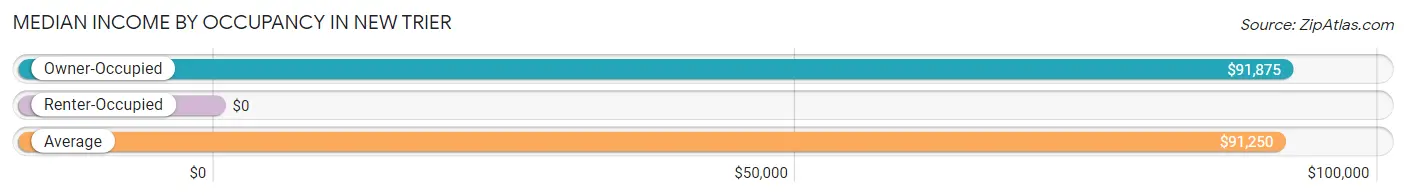
| Occupancy Type | # Households | Median Income |
| Owner-Occupied | 27 (96.4%) | $91,875 |
| Renter-Occupied | 1 (3.6%) | $0 |
| Average | 28 (100.0%) | $91,250 |
Occupancy by Householder Income Bracket in New Trier
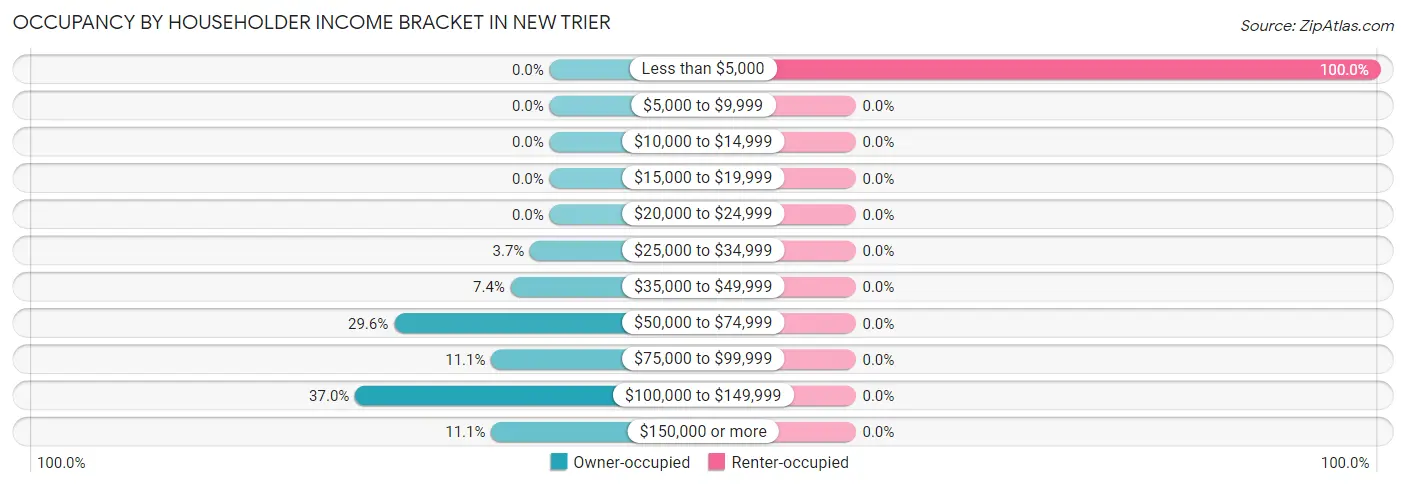
| Income Bracket | Owner-occupied | Renter-occupied |
| Less than $5,000 | 0 (0.0%) | 1 (100.0%) |
| $5,000 to $9,999 | 0 (0.0%) | 0 (0.0%) |
| $10,000 to $14,999 | 0 (0.0%) | 0 (0.0%) |
| $15,000 to $19,999 | 0 (0.0%) | 0 (0.0%) |
| $20,000 to $24,999 | 0 (0.0%) | 0 (0.0%) |
| $25,000 to $34,999 | 1 (3.7%) | 0 (0.0%) |
| $35,000 to $49,999 | 2 (7.4%) | 0 (0.0%) |
| $50,000 to $74,999 | 8 (29.6%) | 0 (0.0%) |
| $75,000 to $99,999 | 3 (11.1%) | 0 (0.0%) |
| $100,000 to $149,999 | 10 (37.0%) | 0 (0.0%) |
| $150,000 or more | 3 (11.1%) | 0 (0.0%) |
| Total | 27 (100.0%) | 1 (100.0%) |
Monthly Housing Cost Tiers in New Trier
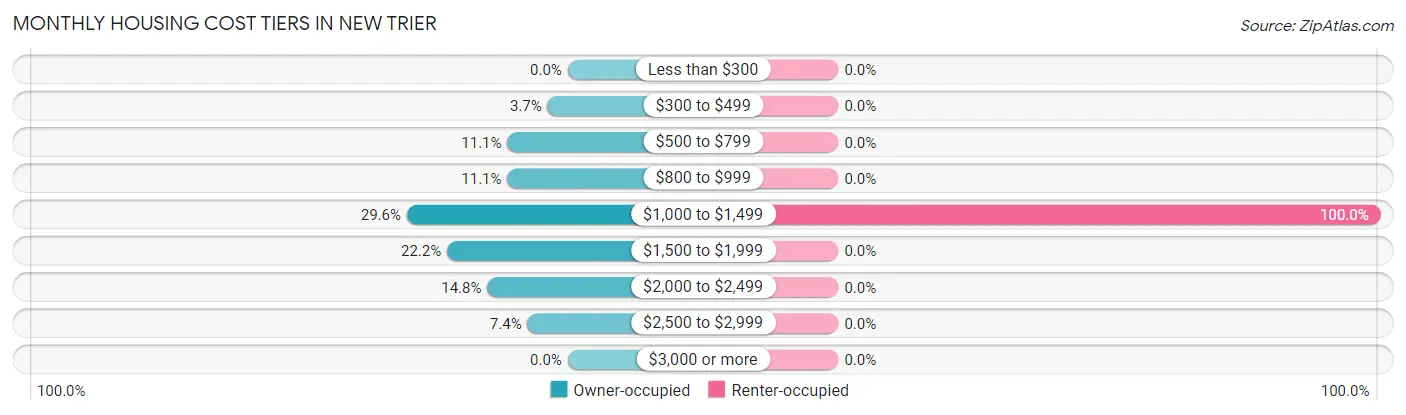
| Monthly Cost | Owner-occupied | Renter-occupied |
| Less than $300 | 0 (0.0%) | 0 (0.0%) |
| $300 to $499 | 1 (3.7%) | 0 (0.0%) |
| $500 to $799 | 3 (11.1%) | 0 (0.0%) |
| $800 to $999 | 3 (11.1%) | 0 (0.0%) |
| $1,000 to $1,499 | 8 (29.6%) | 1 (100.0%) |
| $1,500 to $1,999 | 6 (22.2%) | 0 (0.0%) |
| $2,000 to $2,499 | 4 (14.8%) | 0 (0.0%) |
| $2,500 to $2,999 | 2 (7.4%) | 0 (0.0%) |
| $3,000 or more | 0 (0.0%) | 0 (0.0%) |
| Total | 27 (100.0%) | 1 (100.0%) |
Physical Housing Characteristics in New Trier
Housing Structures in New Trier
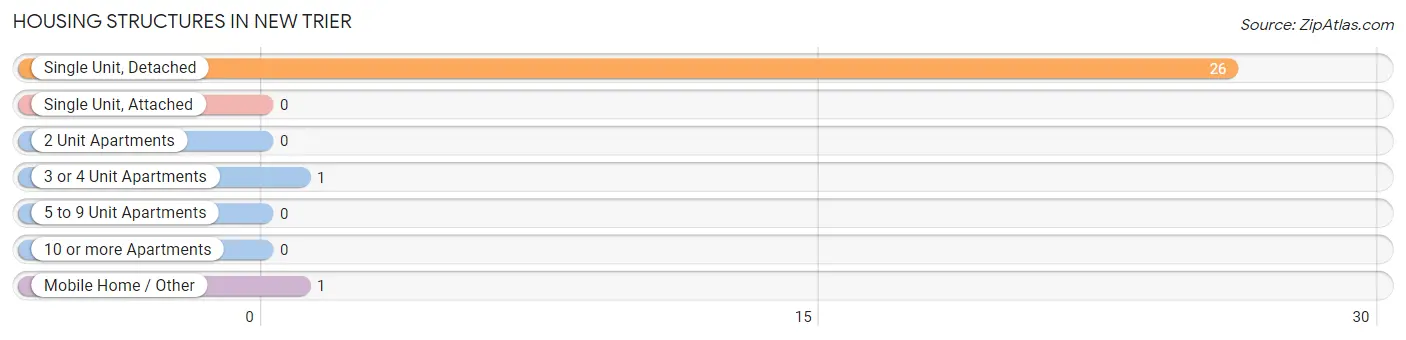
| Structure Type | # Housing Units | % Housing Units |
| Single Unit, Detached | 26 | 92.9% |
| Single Unit, Attached | 0 | 0.0% |
| 2 Unit Apartments | 0 | 0.0% |
| 3 or 4 Unit Apartments | 1 | 3.6% |
| 5 to 9 Unit Apartments | 0 | 0.0% |
| 10 or more Apartments | 0 | 0.0% |
| Mobile Home / Other | 1 | 3.6% |
| Total | 28 | 100.0% |
Housing Structures by Occupancy in New Trier
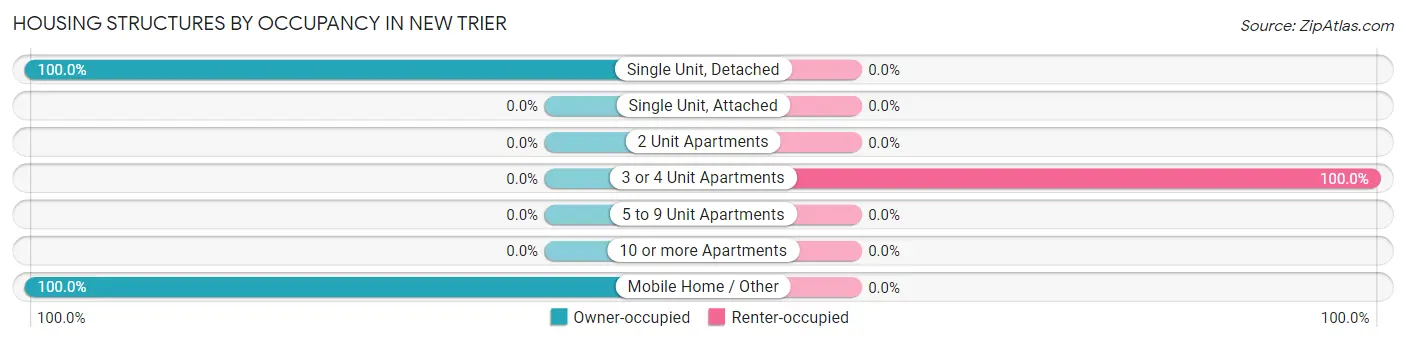
| Structure Type | Owner-occupied | Renter-occupied |
| Single Unit, Detached | 26 (100.0%) | 0 (0.0%) |
| Single Unit, Attached | 0 (0.0%) | 0 (0.0%) |
| 2 Unit Apartments | 0 (0.0%) | 0 (0.0%) |
| 3 or 4 Unit Apartments | 0 (0.0%) | 1 (100.0%) |
| 5 to 9 Unit Apartments | 0 (0.0%) | 0 (0.0%) |
| 10 or more Apartments | 0 (0.0%) | 0 (0.0%) |
| Mobile Home / Other | 1 (100.0%) | 0 (0.0%) |
| Total | 27 (96.4%) | 1 (3.6%) |
Housing Structures by Number of Rooms in New Trier
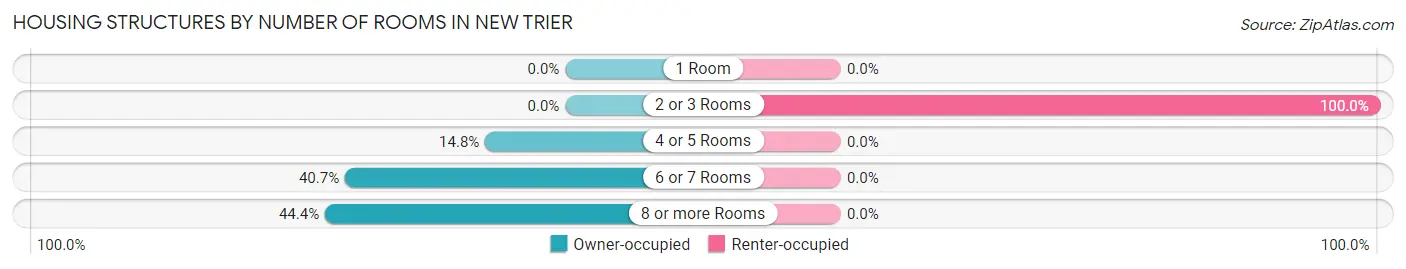
| Number of Rooms | Owner-occupied | Renter-occupied |
| 1 Room | 0 (0.0%) | 0 (0.0%) |
| 2 or 3 Rooms | 0 (0.0%) | 1 (100.0%) |
| 4 or 5 Rooms | 4 (14.8%) | 0 (0.0%) |
| 6 or 7 Rooms | 11 (40.7%) | 0 (0.0%) |
| 8 or more Rooms | 12 (44.4%) | 0 (0.0%) |
| Total | 27 (100.0%) | 1 (100.0%) |
Housing Structure by Heating Type in New Trier
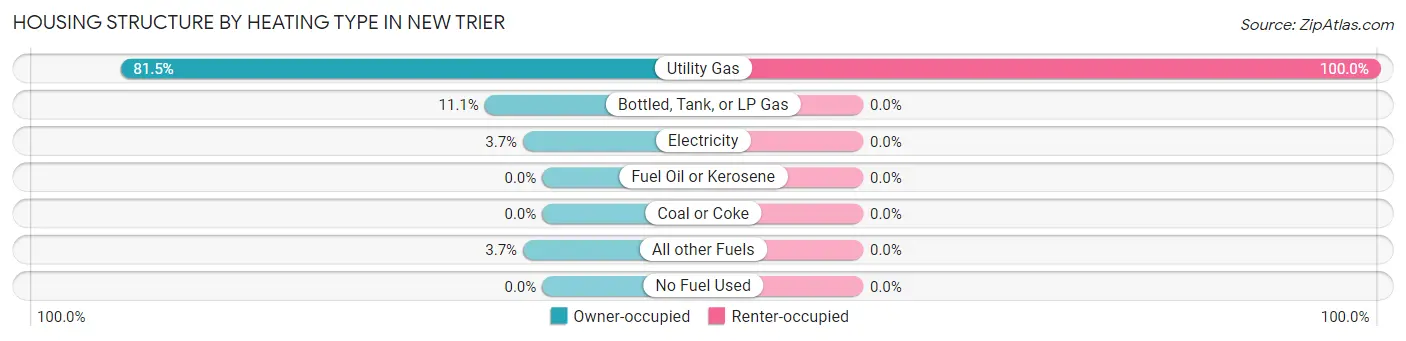
| Heating Type | Owner-occupied | Renter-occupied |
| Utility Gas | 22 (81.5%) | 1 (100.0%) |
| Bottled, Tank, or LP Gas | 3 (11.1%) | 0 (0.0%) |
| Electricity | 1 (3.7%) | 0 (0.0%) |
| Fuel Oil or Kerosene | 0 (0.0%) | 0 (0.0%) |
| Coal or Coke | 0 (0.0%) | 0 (0.0%) |
| All other Fuels | 1 (3.7%) | 0 (0.0%) |
| No Fuel Used | 0 (0.0%) | 0 (0.0%) |
| Total | 27 (100.0%) | 1 (100.0%) |
Household Vehicle Usage in New Trier
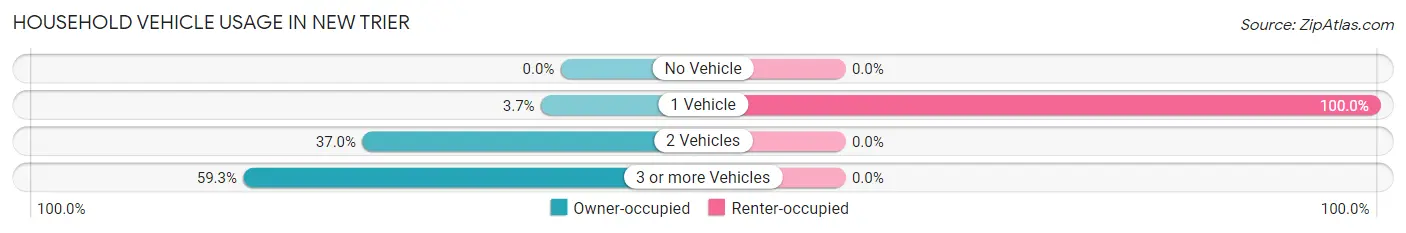
| Vehicles per Household | Owner-occupied | Renter-occupied |
| No Vehicle | 0 (0.0%) | 0 (0.0%) |
| 1 Vehicle | 1 (3.7%) | 1 (100.0%) |
| 2 Vehicles | 10 (37.0%) | 0 (0.0%) |
| 3 or more Vehicles | 16 (59.3%) | 0 (0.0%) |
| Total | 27 (100.0%) | 1 (100.0%) |
Real Estate & Mortgages in New Trier
Real Estate and Mortgage Overview in New Trier
| Characteristic | Without Mortgage | With Mortgage |
| Housing Units | 3 | 24 |
| Median Property Value | $225,000 | $191,700 |
| Median Household Income | $63,750 | $3 |
| Monthly Housing Costs | $525 | $0 |
| Real Estate Taxes | $1,750 | $0 |
Property Value by Mortgage Status in New Trier
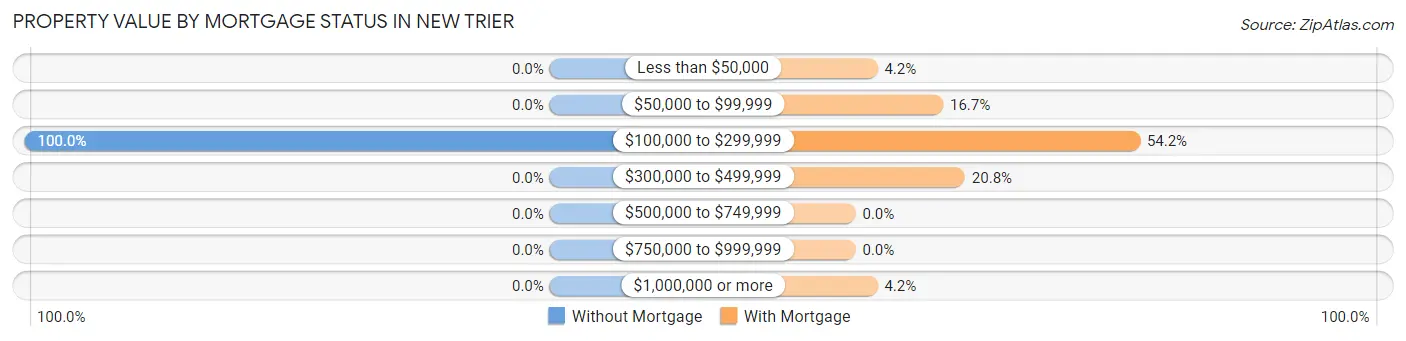
| Property Value | Without Mortgage | With Mortgage |
| Less than $50,000 | 0 (0.0%) | 1 (4.2%) |
| $50,000 to $99,999 | 0 (0.0%) | 4 (16.7%) |
| $100,000 to $299,999 | 3 (100.0%) | 13 (54.2%) |
| $300,000 to $499,999 | 0 (0.0%) | 5 (20.8%) |
| $500,000 to $749,999 | 0 (0.0%) | 0 (0.0%) |
| $750,000 to $999,999 | 0 (0.0%) | 0 (0.0%) |
| $1,000,000 or more | 0 (0.0%) | 1 (4.2%) |
| Total | 3 (100.0%) | 24 (100.0%) |
Household Income by Mortgage Status in New Trier
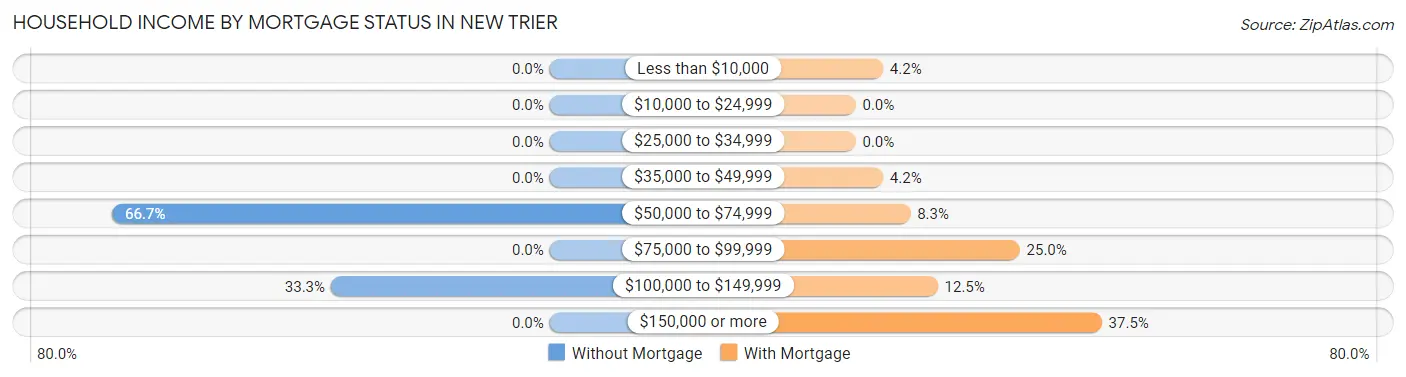
| Household Income | Without Mortgage | With Mortgage |
| Less than $10,000 | 0 (0.0%) | 1 (4.2%) |
| $10,000 to $24,999 | 0 (0.0%) | 0 (0.0%) |
| $25,000 to $34,999 | 0 (0.0%) | 0 (0.0%) |
| $35,000 to $49,999 | 0 (0.0%) | 1 (4.2%) |
| $50,000 to $74,999 | 2 (66.7%) | 2 (8.3%) |
| $75,000 to $99,999 | 0 (0.0%) | 6 (25.0%) |
| $100,000 to $149,999 | 1 (33.3%) | 3 (12.5%) |
| $150,000 or more | 0 (0.0%) | 9 (37.5%) |
| Total | 3 (100.0%) | 24 (100.0%) |
Property Value to Household Income Ratio in New Trier
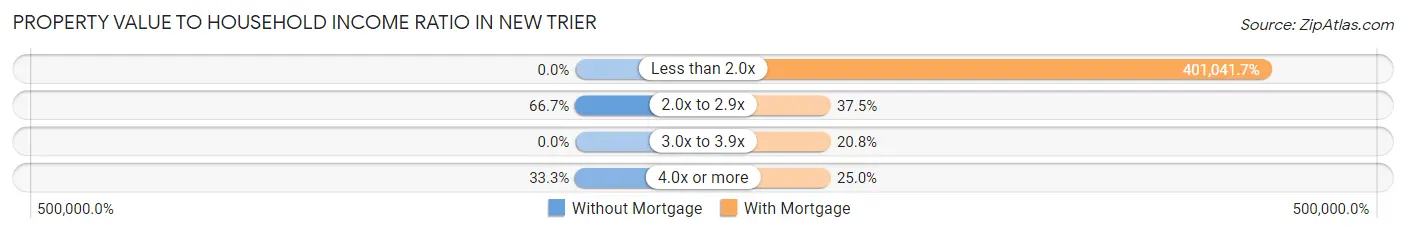
| Value-to-Income Ratio | Without Mortgage | With Mortgage |
| Less than 2.0x | 0 (0.0%) | 96,250 (401,041.7%) |
| 2.0x to 2.9x | 2 (66.7%) | 9 (37.5%) |
| 3.0x to 3.9x | 0 (0.0%) | 5 (20.8%) |
| 4.0x or more | 1 (33.3%) | 6 (25.0%) |
| Total | 3 (100.0%) | 24 (100.0%) |
Real Estate Taxes by Mortgage Status in New Trier
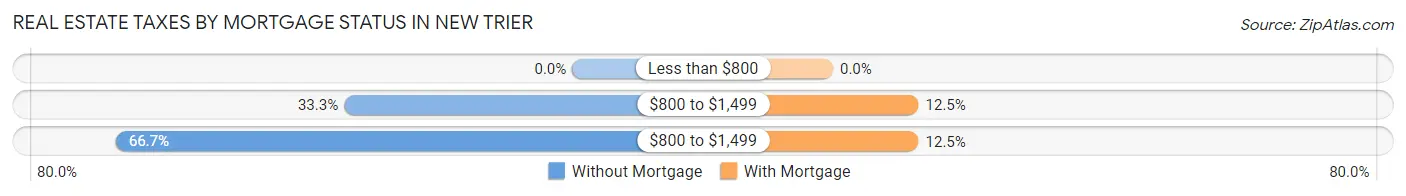
| Property Taxes | Without Mortgage | With Mortgage |
| Less than $800 | 0 (0.0%) | 0 (0.0%) |
| $800 to $1,499 | 1 (33.3%) | 3 (12.5%) |
| $800 to $1,499 | 2 (66.7%) | 3 (12.5%) |
| Total | 3 (100.0%) | 24 (100.0%) |
Health & Disability in New Trier
Health Insurance Coverage by Age in New Trier
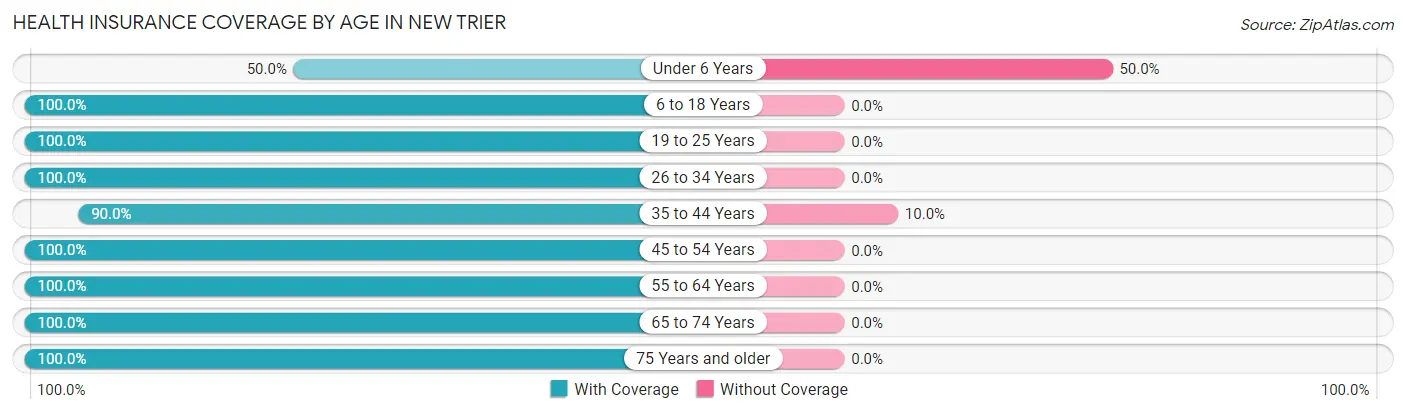
| Age Bracket | With Coverage | Without Coverage |
| Under 6 Years | 1 (50.0%) | 1 (50.0%) |
| 6 to 18 Years | 12 (100.0%) | 0 (0.0%) |
| 19 to 25 Years | 12 (100.0%) | 0 (0.0%) |
| 26 to 34 Years | 5 (100.0%) | 0 (0.0%) |
| 35 to 44 Years | 9 (90.0%) | 1 (10.0%) |
| 45 to 54 Years | 11 (100.0%) | 0 (0.0%) |
| 55 to 64 Years | 9 (100.0%) | 0 (0.0%) |
| 65 to 74 Years | 8 (100.0%) | 0 (0.0%) |
| 75 Years and older | 3 (100.0%) | 0 (0.0%) |
| Total | 70 (97.2%) | 2 (2.8%) |
Health Insurance Coverage by Citizenship Status in New Trier

| Citizenship Status | With Coverage | Without Coverage |
| Native Born | 1 (50.0%) | 1 (50.0%) |
| Foreign Born, Citizen | 12 (100.0%) | 0 (0.0%) |
| Foreign Born, not a Citizen | 12 (100.0%) | 0 (0.0%) |
Health Insurance Coverage by Household Income in New Trier
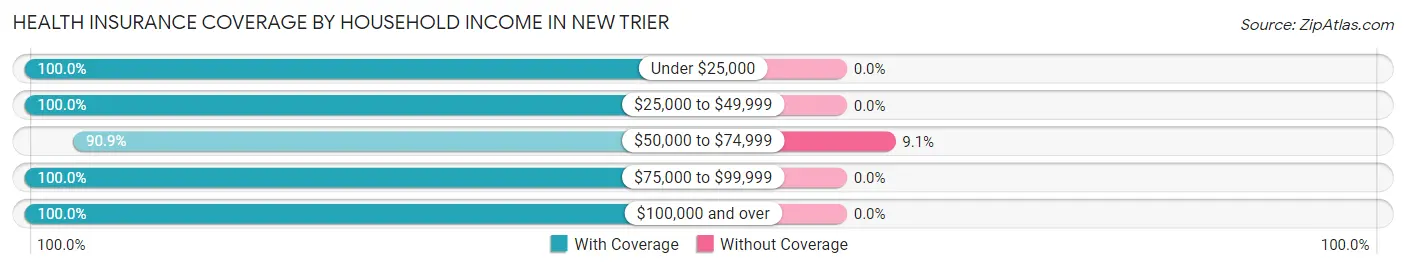
| Household Income | With Coverage | Without Coverage |
| Under $25,000 | 3 (100.0%) | 0 (0.0%) |
| $25,000 to $49,999 | 6 (100.0%) | 0 (0.0%) |
| $50,000 to $74,999 | 20 (90.9%) | 2 (9.1%) |
| $75,000 to $99,999 | 7 (100.0%) | 0 (0.0%) |
| $100,000 and over | 34 (100.0%) | 0 (0.0%) |
Public vs Private Health Insurance Coverage by Age in New Trier
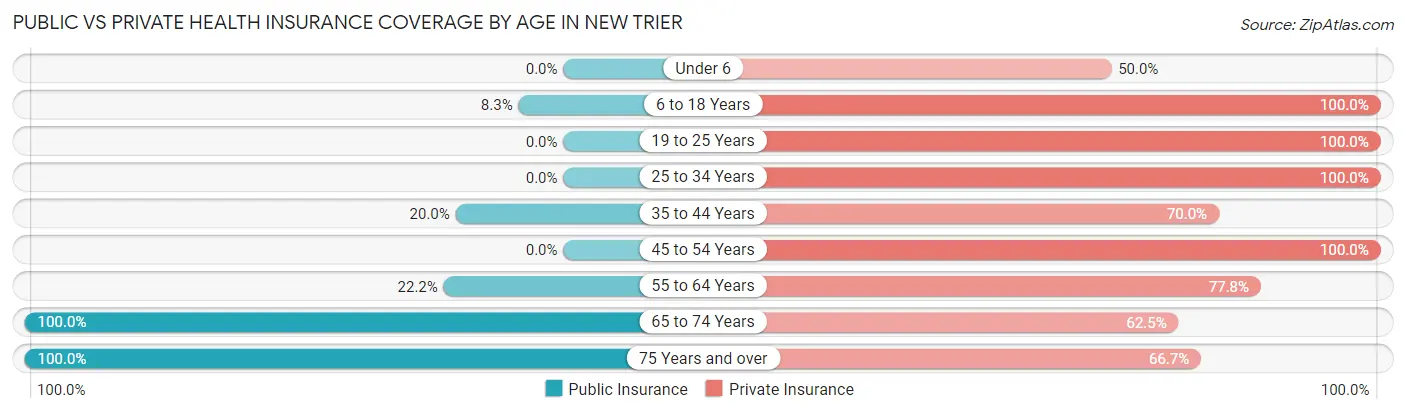
| Age Bracket | Public Insurance | Private Insurance |
| Under 6 | 0 (0.0%) | 1 (50.0%) |
| 6 to 18 Years | 1 (8.3%) | 12 (100.0%) |
| 19 to 25 Years | 0 (0.0%) | 12 (100.0%) |
| 25 to 34 Years | 0 (0.0%) | 5 (100.0%) |
| 35 to 44 Years | 2 (20.0%) | 7 (70.0%) |
| 45 to 54 Years | 0 (0.0%) | 11 (100.0%) |
| 55 to 64 Years | 2 (22.2%) | 7 (77.8%) |
| 65 to 74 Years | 8 (100.0%) | 5 (62.5%) |
| 75 Years and over | 3 (100.0%) | 2 (66.7%) |
| Total | 16 (22.2%) | 62 (86.1%) |
Disability Status by Sex by Age in New Trier
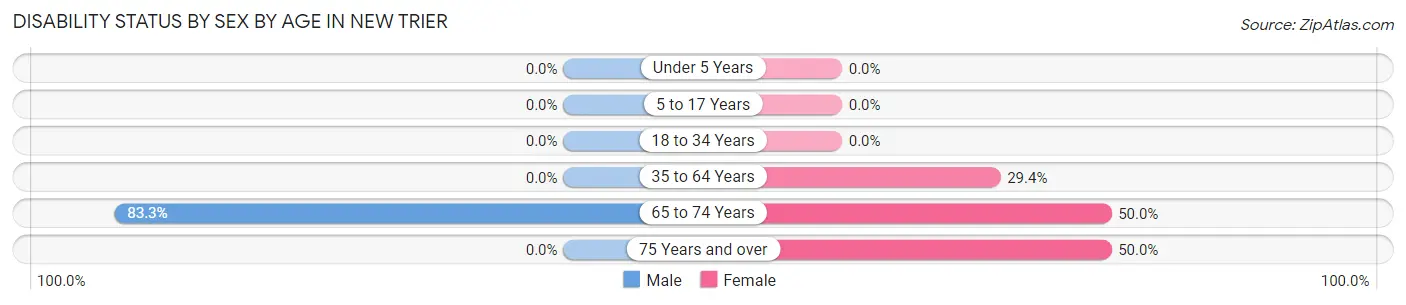
| Age Bracket | Male | Female |
| Under 5 Years | 0 (0.0%) | 0 (0.0%) |
| 5 to 17 Years | 0 (0.0%) | 0 (0.0%) |
| 18 to 34 Years | 0 (0.0%) | 0 (0.0%) |
| 35 to 64 Years | 0 (0.0%) | 5 (29.4%) |
| 65 to 74 Years | 5 (83.3%) | 1 (50.0%) |
| 75 Years and over | 0 (0.0%) | 1 (50.0%) |
Disability Class by Sex by Age in New Trier
Disability Class: Hearing Difficulty
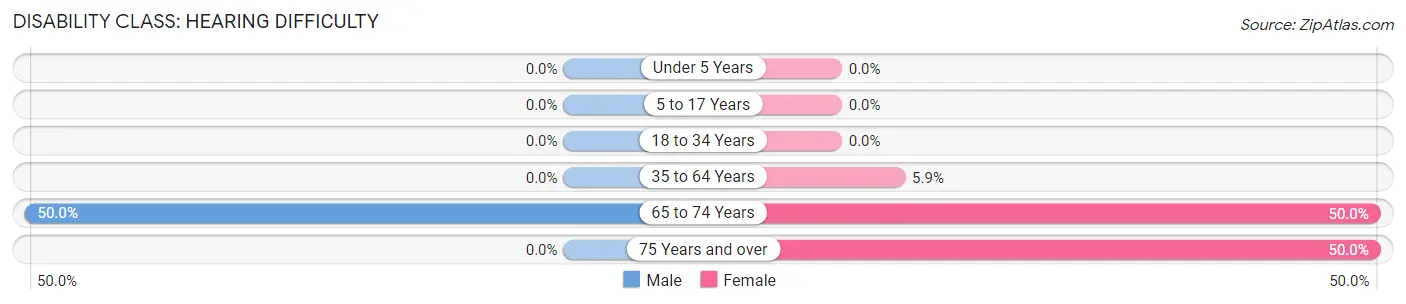
| Age Bracket | Male | Female |
| Under 5 Years | 0 (0.0%) | 0 (0.0%) |
| 5 to 17 Years | 0 (0.0%) | 0 (0.0%) |
| 18 to 34 Years | 0 (0.0%) | 0 (0.0%) |
| 35 to 64 Years | 0 (0.0%) | 1 (5.9%) |
| 65 to 74 Years | 3 (50.0%) | 1 (50.0%) |
| 75 Years and over | 0 (0.0%) | 1 (50.0%) |
Disability Class: Vision Difficulty
| Age Bracket | Male | Female |
| Under 5 Years | 0 (0.0%) | 0 (0.0%) |
| 5 to 17 Years | 0 (0.0%) | 0 (0.0%) |
| 18 to 34 Years | 0 (0.0%) | 0 (0.0%) |
| 35 to 64 Years | 0 (0.0%) | 0 (0.0%) |
| 65 to 74 Years | 0 (0.0%) | 0 (0.0%) |
| 75 Years and over | 0 (0.0%) | 0 (0.0%) |
Disability Class: Cognitive Difficulty
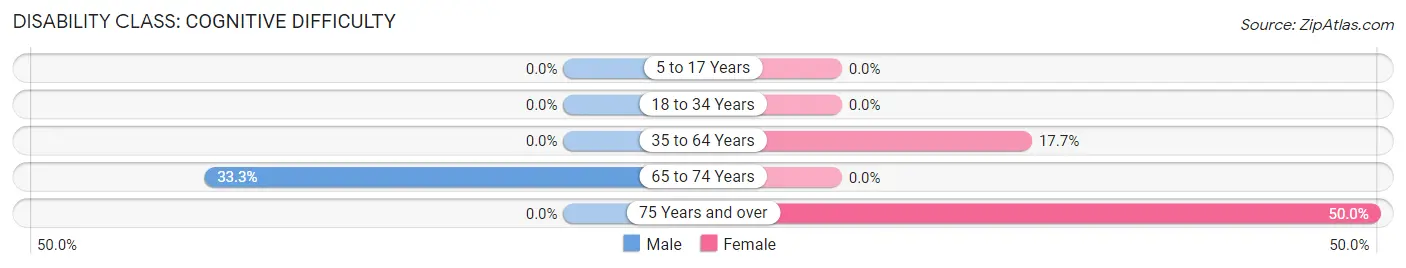
| Age Bracket | Male | Female |
| 5 to 17 Years | 0 (0.0%) | 0 (0.0%) |
| 18 to 34 Years | 0 (0.0%) | 0 (0.0%) |
| 35 to 64 Years | 0 (0.0%) | 3 (17.6%) |
| 65 to 74 Years | 2 (33.3%) | 0 (0.0%) |
| 75 Years and over | 0 (0.0%) | 1 (50.0%) |
Disability Class: Ambulatory Difficulty
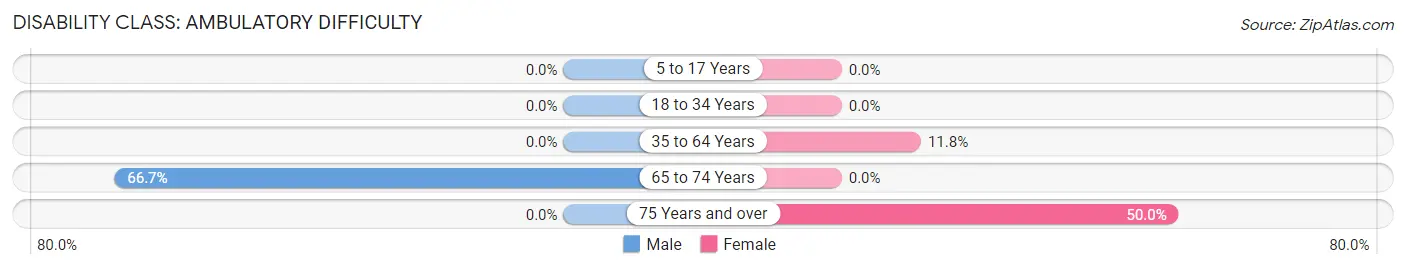
| Age Bracket | Male | Female |
| 5 to 17 Years | 0 (0.0%) | 0 (0.0%) |
| 18 to 34 Years | 0 (0.0%) | 0 (0.0%) |
| 35 to 64 Years | 0 (0.0%) | 2 (11.8%) |
| 65 to 74 Years | 4 (66.7%) | 0 (0.0%) |
| 75 Years and over | 0 (0.0%) | 1 (50.0%) |
Disability Class: Self-Care Difficulty
| Age Bracket | Male | Female |
| 5 to 17 Years | 0 (0.0%) | 0 (0.0%) |
| 18 to 34 Years | 0 (0.0%) | 0 (0.0%) |
| 35 to 64 Years | 0 (0.0%) | 0 (0.0%) |
| 65 to 74 Years | 0 (0.0%) | 0 (0.0%) |
| 75 Years and over | 0 (0.0%) | 0 (0.0%) |
Technology Access in New Trier
Computing Device Access in New Trier
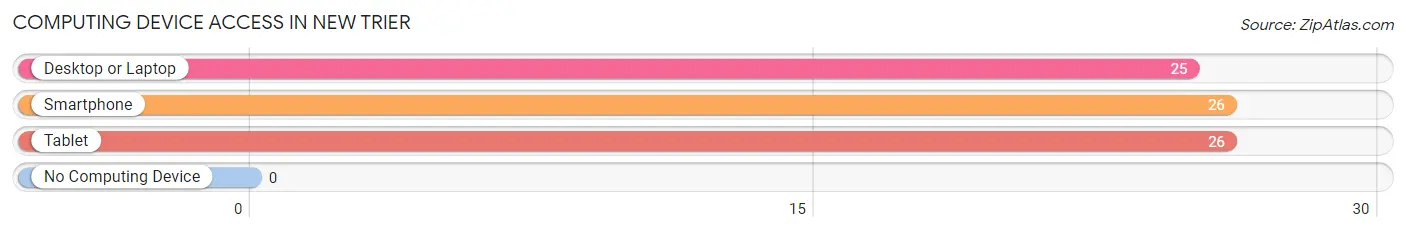
| Device Type | # Households | % Households |
| Desktop or Laptop | 25 | 89.3% |
| Smartphone | 26 | 92.9% |
| Tablet | 26 | 92.9% |
| No Computing Device | 0 | 0.0% |
| Total | 28 | 100.0% |
Internet Access in New Trier
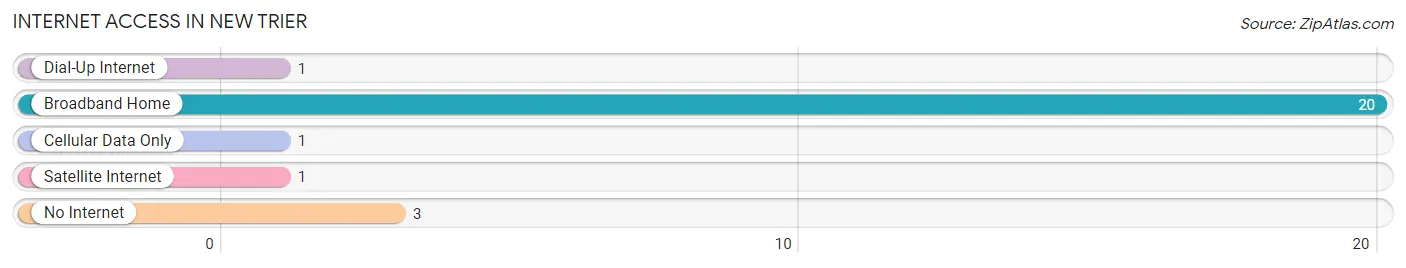
| Internet Type | # Households | % Households |
| Dial-Up Internet | 1 | 3.6% |
| Broadband Home | 20 | 71.4% |
| Cellular Data Only | 1 | 3.6% |
| Satellite Internet | 1 | 3.6% |
| No Internet | 3 | 10.7% |
| Total | 28 | 100.0% |
New Trier Summary
New Trier Township is located in Cook County, Illinois, and is a part of the Chicago metropolitan area. It is bordered by Lake Michigan to the east, Wilmette to the north, Winnetka to the south, and Glencoe to the west. The township is home to the villages of Wilmette, Kenilworth, and Winnetka, as well as the unincorporated areas of Glencoe, Indian Hill, and Northfield. The population of New Trier Township was estimated to be 32,890 in 2019.
History
New Trier Township was first settled in the early 19th century by German immigrants. The township was named after the German city of Trier, which is located on the Moselle River. The first settlers in the area were farmers, and the township was largely agricultural until the late 19th century. In 1869, the Chicago and North Western Railway built a line through the township, connecting it to Chicago and other cities in the region. This allowed for the development of the villages of Wilmette, Kenilworth, and Winnetka, which were incorporated in the late 19th and early 20th centuries.
Geography
New Trier Township is located in northeastern Illinois, in Cook County. It is bordered by Lake Michigan to the east, Wilmette to the north, Winnetka to the south, and Glencoe to the west. The township covers an area of approximately 10.5 square miles. The terrain is generally flat, with some rolling hills in the western part of the township. The Des Plaines River runs through the township, and there are several small lakes and ponds in the area.
Economy
New Trier Township is home to a variety of businesses and industries. The largest employers in the township are the North Shore University Health System, the New Trier Township High School District, and the Village of Wilmette. Other major employers include the Village of Winnetka, the Village of Kenilworth, and the North Shore Country Day School. The township is also home to a number of retail stores, restaurants, and other businesses.
Demographics
As of 2019, the population of New Trier Township was estimated to be 32,890. The population is predominantly white (86.3%), with smaller percentages of Asian (7.2%), African American (3.2%), and Hispanic (2.3%) residents. The median household income in the township is $133,845, and the median home value is $817,400. The majority of residents (90.2%) are homeowners, and the median age is 44.7 years.
Common Questions
What is the Total Population of New Trier?
Total Population of New Trier is 72.
What is the Total Male Population of New Trier?
Total Male Population of New Trier is 33.
What is the Total Female Population of New Trier?
Total Female Population of New Trier is 39.
What is the Ratio of Males per 100 Females in New Trier?
There are 84.62 Males per 100 Females in New Trier.
What is the Ratio of Females per 100 Males in New Trier?
There are 118.18 Females per 100 Males in New Trier.
What is the Median Population Age in New Trier?
Median Population Age in New Trier is 40.0 Years.
What is the Average Family Size in New Trier
Average Family Size in New Trier is 2.7 People.
What is the Average Household Size in New Trier
Average Household Size in New Trier is 2.6 People.
What is Per Capita Income in New Trier?
Per Capita income in New Trier is $34,451.
What is the Median Family Income in New Trier?
Median Family Income in New Trier is $83,750.
What is the Median Household income in New Trier?
Median Household Income in New Trier is $91,250.
What is Inequality or Gini Index in New Trier?
Inequality or Gini Index in New Trier is 0.27.
How Large is the Labor Force in New Trier?
There are 46 People in the Labor Forcein in New Trier.
What is the Percentage of People in the Labor Force in New Trier?
70.8% of People are in the Labor Force in New Trier.
What is the Unemployment Rate in New Trier?
Unemployment Rate in New Trier is 4.3%.