Cities with the Most Immigrants from Europe in Georgia
RELATED REPORTS & OPTIONS
Europe
Georgia
Compare Cities
Map of Cities with the Most Immigrants from Europe in Georgia
0
8,000
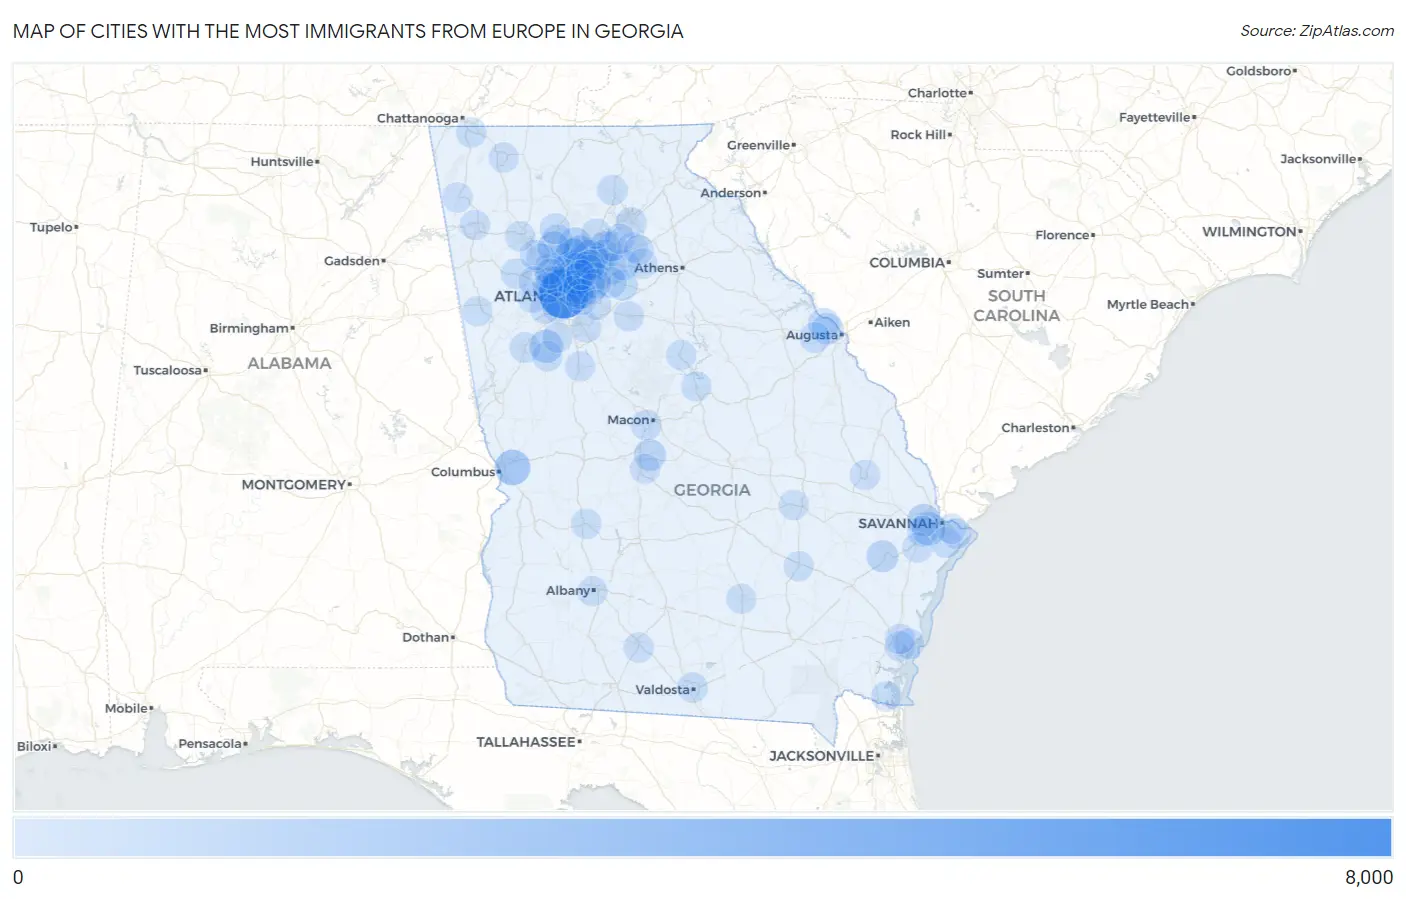
Cities with the Most Immigrants from Europe in Georgia
| City | Europe | vs State | vs National | |
| 1. | Atlanta | 6,463 | 91,342(7.08%)#1 | 4,820,287(0.13%)#47 |
| 2. | Sandy Springs | 2,518 | 91,342(2.76%)#2 | 4,820,287(0.05%)#225 |
| 3. | Roswell | 1,841 | 91,342(2.02%)#3 | 4,820,287(0.04%)#334 |
| 4. | Columbus | 1,750 | 91,342(1.92%)#4 | 4,820,287(0.04%)#355 |
| 5. | Johns Creek | 1,702 | 91,342(1.86%)#5 | 4,820,287(0.04%)#369 |
| 6. | Brookhaven | 1,600 | 91,342(1.75%)#6 | 4,820,287(0.03%)#401 |
| 7. | Alpharetta | 1,303 | 91,342(1.43%)#7 | 4,820,287(0.03%)#532 |
| 8. | Dunwoody | 1,261 | 91,342(1.38%)#8 | 4,820,287(0.03%)#556 |
| 9. | Athens-Clarke County Unified Government (Balance) | 1,168 | 91,342(1.28%)#9 | 4,820,287(0.02%)#596 |
| 10. | Savannah | 1,086 | 91,342(1.19%)#10 | 4,820,287(0.02%)#647 |
| 11. | Peachtree City | 1,057 | 91,342(1.16%)#11 | 4,820,287(0.02%)#664 |
| 12. | Augusta-Richmond County Consolidated Government (Balance) | 862 | 91,342(0.94%)#12 | 4,820,287(0.02%)#795 |
| 13. | Pooler | 826 | 91,342(0.90%)#13 | 4,820,287(0.02%)#821 |
| 14. | Milton | 823 | 91,342(0.90%)#14 | 4,820,287(0.02%)#824 |
| 15. | Smyrna | 729 | 91,342(0.80%)#15 | 4,820,287(0.02%)#935 |
| 16. | Sugar Hill | 697 | 91,342(0.76%)#16 | 4,820,287(0.01%)#992 |
| 17. | Duluth | 634 | 91,342(0.69%)#17 | 4,820,287(0.01%)#1,091 |
| 18. | Woodstock | 626 | 91,342(0.69%)#18 | 4,820,287(0.01%)#1,105 |
| 19. | Hinesville | 611 | 91,342(0.67%)#19 | 4,820,287(0.01%)#1,140 |
| 20. | Warner Robins | 604 | 91,342(0.66%)#20 | 4,820,287(0.01%)#1,153 |
| 21. | Evans | 580 | 91,342(0.63%)#21 | 4,820,287(0.01%)#1,202 |
| 22. | Lawrenceville | 572 | 91,342(0.63%)#22 | 4,820,287(0.01%)#1,221 |
| 23. | Martinez | 571 | 91,342(0.63%)#23 | 4,820,287(0.01%)#1,224 |
| 24. | Tucker | 498 | 91,342(0.55%)#24 | 4,820,287(0.01%)#1,383 |
| 25. | Marietta | 491 | 91,342(0.54%)#25 | 4,820,287(0.01%)#1,396 |
| 26. | Peachtree Corners | 482 | 91,342(0.53%)#26 | 4,820,287(0.01%)#1,422 |
| 27. | Decatur | 474 | 91,342(0.52%)#27 | 4,820,287(0.01%)#1,444 |
| 28. | North Druid Hills | 412 | 91,342(0.45%)#28 | 4,820,287(0.01%)#1,630 |
| 29. | Loganville | 350 | 91,342(0.38%)#29 | 4,820,287(0.01%)#1,856 |
| 30. | North Decatur | 322 | 91,342(0.35%)#30 | 4,820,287(0.01%)#1,995 |
| 31. | Chamblee | 320 | 91,342(0.35%)#31 | 4,820,287(0.01%)#2,005 |
| 32. | Suwanee | 309 | 91,342(0.34%)#32 | 4,820,287(0.01%)#2,053 |
| 33. | Dacula | 296 | 91,342(0.32%)#33 | 4,820,287(0.01%)#2,125 |
| 34. | Grovetown | 281 | 91,342(0.31%)#34 | 4,820,287(0.01%)#2,190 |
| 35. | Skidaway Island | 264 | 91,342(0.29%)#35 | 4,820,287(0.01%)#2,271 |
| 36. | Holly Springs | 263 | 91,342(0.29%)#36 | 4,820,287(0.01%)#2,279 |
| 37. | Snellville | 257 | 91,342(0.28%)#37 | 4,820,287(0.01%)#2,324 |
| 38. | Newnan | 252 | 91,342(0.28%)#38 | 4,820,287(0.01%)#2,358 |
| 39. | Druid Hills | 251 | 91,342(0.27%)#39 | 4,820,287(0.01%)#2,366 |
| 40. | Canton | 247 | 91,342(0.27%)#40 | 4,820,287(0.01%)#2,391 |
| 41. | Macon Bibb County | 243 | 91,342(0.27%)#41 | 4,820,287(0.01%)#2,416 |
| 42. | Henderson | 238 | 91,342(0.26%)#42 | 4,820,287(0.00%)#2,458 |
| 43. | Dahlonega | 237 | 91,342(0.26%)#43 | 4,820,287(0.00%)#2,469 |
| 44. | Gainesville | 231 | 91,342(0.25%)#44 | 4,820,287(0.00%)#2,518 |
| 45. | Vinings | 206 | 91,342(0.23%)#45 | 4,820,287(0.00%)#2,700 |
| 46. | St Simons | 203 | 91,342(0.22%)#46 | 4,820,287(0.00%)#2,725 |
| 47. | Valdosta | 189 | 91,342(0.21%)#47 | 4,820,287(0.00%)#2,844 |
| 48. | Kennesaw | 189 | 91,342(0.21%)#48 | 4,820,287(0.00%)#2,845 |
| 49. | Wilmington Island | 184 | 91,342(0.20%)#49 | 4,820,287(0.00%)#2,894 |
| 50. | Senoia | 184 | 91,342(0.20%)#50 | 4,820,287(0.00%)#2,901 |
| 51. | Douglasville | 183 | 91,342(0.20%)#51 | 4,820,287(0.00%)#2,904 |
| 52. | Norcross | 173 | 91,342(0.19%)#52 | 4,820,287(0.00%)#3,019 |
| 53. | Dallas | 170 | 91,342(0.19%)#53 | 4,820,287(0.00%)#3,054 |
| 54. | Lilburn | 169 | 91,342(0.19%)#54 | 4,820,287(0.00%)#3,064 |
| 55. | Fort Oglethorpe | 168 | 91,342(0.18%)#55 | 4,820,287(0.00%)#3,078 |
| 56. | Buford | 161 | 91,342(0.18%)#56 | 4,820,287(0.00%)#3,171 |
| 57. | Covington | 150 | 91,342(0.16%)#57 | 4,820,287(0.00%)#3,320 |
| 58. | Fayetteville | 147 | 91,342(0.16%)#58 | 4,820,287(0.00%)#3,362 |
| 59. | Braselton | 145 | 91,342(0.16%)#59 | 4,820,287(0.00%)#3,390 |
| 60. | Whitemarsh Island | 143 | 91,342(0.16%)#60 | 4,820,287(0.00%)#3,423 |
| 61. | Statesboro | 135 | 91,342(0.15%)#61 | 4,820,287(0.00%)#3,527 |
| 62. | Cumming | 133 | 91,342(0.15%)#62 | 4,820,287(0.00%)#3,556 |
| 63. | Moultrie | 131 | 91,342(0.14%)#63 | 4,820,287(0.00%)#3,587 |
| 64. | Brunswick | 129 | 91,342(0.14%)#64 | 4,820,287(0.00%)#3,614 |
| 65. | Vidalia | 123 | 91,342(0.13%)#65 | 4,820,287(0.00%)#3,730 |
| 66. | Acworth | 119 | 91,342(0.13%)#66 | 4,820,287(0.00%)#3,802 |
| 67. | Powder Springs | 118 | 91,342(0.13%)#67 | 4,820,287(0.00%)#3,830 |
| 68. | Mableton | 112 | 91,342(0.12%)#68 | 4,820,287(0.00%)#3,916 |
| 69. | Rome | 111 | 91,342(0.12%)#69 | 4,820,287(0.00%)#3,941 |
| 70. | East Point | 110 | 91,342(0.12%)#70 | 4,820,287(0.00%)#3,959 |
| 71. | Griffin | 105 | 91,342(0.11%)#71 | 4,820,287(0.00%)#4,055 |
| 72. | Americus | 105 | 91,342(0.11%)#72 | 4,820,287(0.00%)#4,058 |
| 73. | Cusseta Chattahoochee County Unified Government | 105 | 91,342(0.11%)#73 | 4,820,287(0.00%)#4,061 |
| 74. | Richmond Hill | 104 | 91,342(0.11%)#74 | 4,820,287(0.00%)#4,080 |
| 75. | St Marys | 100 | 91,342(0.11%)#75 | 4,820,287(0.00%)#4,178 |
| 76. | Berkeley Lake | 96 | 91,342(0.11%)#76 | 4,820,287(0.00%)#4,291 |
| 77. | Stockbridge | 94 | 91,342(0.10%)#77 | 4,820,287(0.00%)#4,312 |
| 78. | Stone Mountain | 92 | 91,342(0.10%)#78 | 4,820,287(0.00%)#4,377 |
| 79. | Mountain Park | 91 | 91,342(0.10%)#79 | 4,820,287(0.00%)#4,399 |
| 80. | Milledgeville | 88 | 91,342(0.10%)#80 | 4,820,287(0.00%)#4,474 |
| 81. | Albany | 85 | 91,342(0.09%)#81 | 4,820,287(0.00%)#4,561 |
| 82. | Fairfield Plantation | 81 | 91,342(0.09%)#82 | 4,820,287(0.00%)#4,678 |
| 83. | Mount Zion | 80 | 91,342(0.09%)#83 | 4,820,287(0.00%)#4,723 |
| 84. | Avondale Estates | 78 | 91,342(0.09%)#84 | 4,820,287(0.00%)#4,781 |
| 85. | Cartersville | 77 | 91,342(0.08%)#85 | 4,820,287(0.00%)#4,792 |
| 86. | Perry | 76 | 91,342(0.08%)#86 | 4,820,287(0.00%)#4,823 |
| 87. | Winder | 75 | 91,342(0.08%)#87 | 4,820,287(0.00%)#4,848 |
| 88. | Flowery Branch | 75 | 91,342(0.08%)#88 | 4,820,287(0.00%)#4,859 |
| 89. | Candler Mcafee | 74 | 91,342(0.08%)#89 | 4,820,287(0.00%)#4,880 |
| 90. | Country Club Estates | 73 | 91,342(0.08%)#90 | 4,820,287(0.00%)#4,908 |
| 91. | Hoschton | 73 | 91,342(0.08%)#91 | 4,820,287(0.00%)#4,914 |
| 92. | Stonecrest | 72 | 91,342(0.08%)#92 | 4,820,287(0.00%)#4,923 |
| 93. | Dalton | 72 | 91,342(0.08%)#93 | 4,820,287(0.00%)#4,925 |
| 94. | Douglas | 72 | 91,342(0.08%)#94 | 4,820,287(0.00%)#4,934 |
| 95. | Doraville | 71 | 91,342(0.08%)#95 | 4,820,287(0.00%)#4,969 |
| 96. | South Fulton | 69 | 91,342(0.08%)#96 | 4,820,287(0.00%)#5,027 |
| 97. | Summerville | 67 | 91,342(0.07%)#97 | 4,820,287(0.00%)#5,117 |
| 98. | Fair Oaks | 63 | 91,342(0.07%)#98 | 4,820,287(0.00%)#5,235 |
| 99. | Eatonton | 61 | 91,342(0.07%)#99 | 4,820,287(0.00%)#5,312 |
| 100. | Baxley | 61 | 91,342(0.07%)#100 | 4,820,287(0.00%)#5,321 |
Common Questions
What are the Top 10 Cities with the Most Immigrants from Europe in Georgia?
Top 10 Cities with the Most Immigrants from Europe in Georgia are:
#1
6,463
#2
2,518
#3
1,841
#4
1,750
#5
1,702
#6
1,600
#7
1,303
#8
1,261
#9
1,086
#10
1,057
What city has the Most Immigrants from Europe in Georgia?
Atlanta has the Most Immigrants from Europe in Georgia with 6,463.
What is the Total Immigrants from Europe in the State of Georgia?
Total Immigrants from Europe in Georgia is 91,342.
What is the Total Immigrants from Europe in the United States?
Total Immigrants from Europe in the United States is 4,820,287.