Cities with the Most Immigrants from Europe in West Virginia
RELATED REPORTS & OPTIONS
Europe
West Virginia
Compare Cities
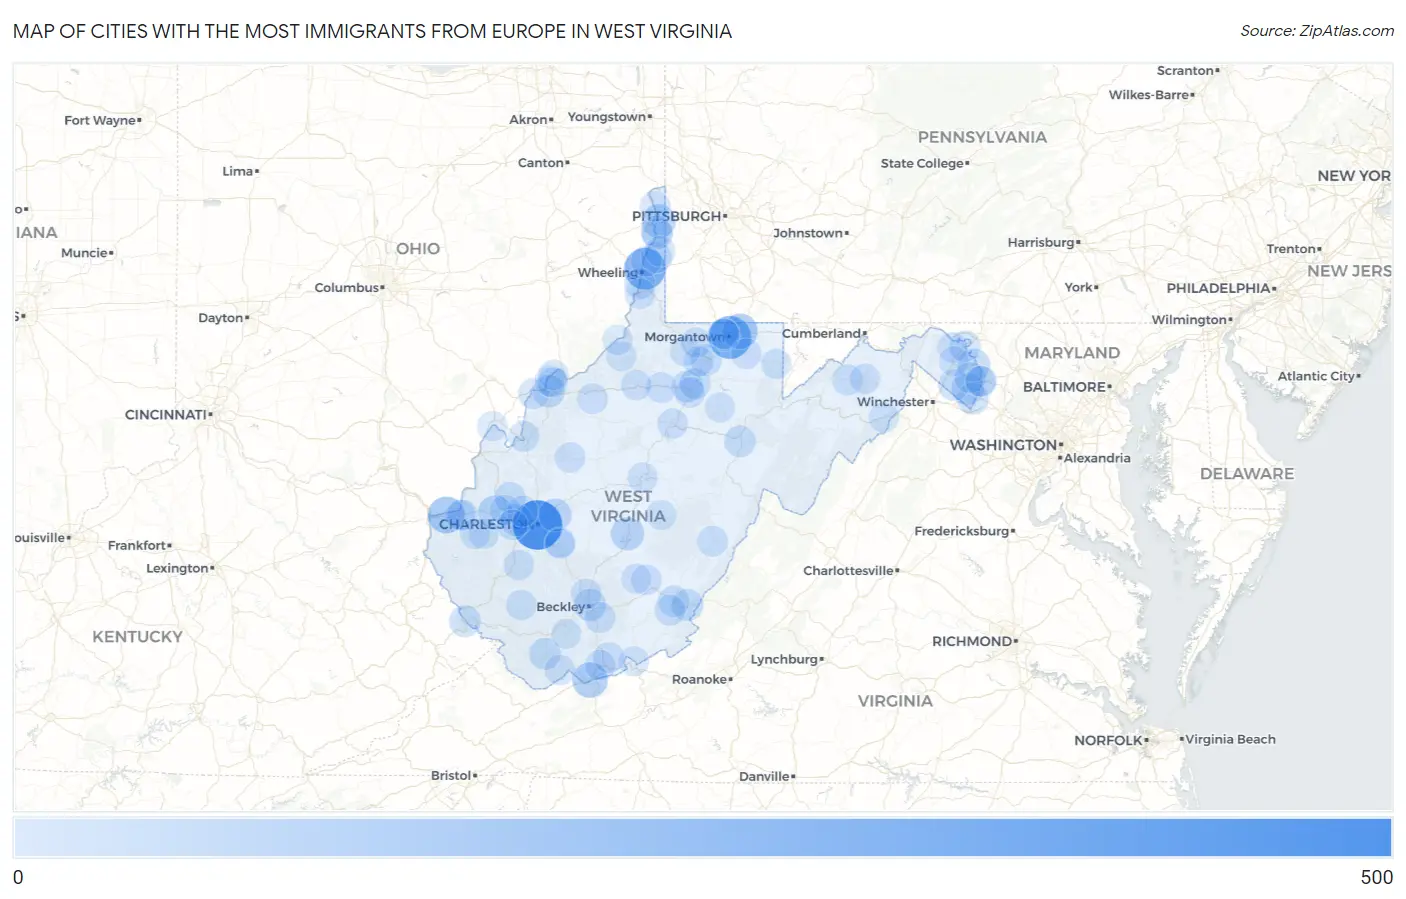
Map of Cities with the Most Immigrants from Europe in West Virginia
0
500
Cities with the Most Immigrants from Europe in West Virginia
| City | Europe | vs State | vs National | |
| 1. | Charleston | 442 | 5,297(8.34%)#1 | 4,820,287(0.01%)#1,518 |
| 2. | Morgantown | 283 | 5,297(5.34%)#2 | 4,820,287(0.01%)#2,181 |
| 3. | Wheeling | 255 | 5,297(4.81%)#3 | 4,820,287(0.01%)#2,336 |
| 4. | Huntington | 144 | 5,297(2.72%)#4 | 4,820,287(0.00%)#3,400 |
| 5. | Bluefield | 115 | 5,297(2.17%)#5 | 4,820,287(0.00%)#3,870 |
| 6. | Cheat Lake | 114 | 5,297(2.15%)#6 | 4,820,287(0.00%)#3,883 |
| 7. | Hurricane | 84 | 5,297(1.59%)#7 | 4,820,287(0.00%)#4,601 |
| 8. | Weirton | 81 | 5,297(1.53%)#8 | 4,820,287(0.00%)#4,670 |
| 9. | Summersville | 69 | 5,297(1.30%)#9 | 4,820,287(0.00%)#5,049 |
| 10. | Pinch | 59 | 5,297(1.11%)#10 | 4,820,287(0.00%)#5,412 |
| 11. | Shepherdstown | 49 | 5,297(0.93%)#11 | 4,820,287(0.00%)#5,901 |
| 12. | Parkersburg | 47 | 5,297(0.89%)#12 | 4,820,287(0.00%)#5,962 |
| 13. | Charles Town | 47 | 5,297(0.89%)#13 | 4,820,287(0.00%)#5,987 |
| 14. | Beckley | 44 | 5,297(0.83%)#14 | 4,820,287(0.00%)#6,129 |
| 15. | Westover | 39 | 5,297(0.74%)#15 | 4,820,287(0.00%)#6,495 |
| 16. | St Albans | 38 | 5,297(0.72%)#16 | 4,820,287(0.00%)#6,542 |
| 17. | White Sulphur Springs | 36 | 5,297(0.68%)#17 | 4,820,287(0.00%)#6,743 |
| 18. | Welch | 34 | 5,297(0.64%)#18 | 4,820,287(0.00%)#6,886 |
| 19. | Clarksburg | 32 | 5,297(0.60%)#19 | 4,820,287(0.00%)#7,001 |
| 20. | Elkins | 31 | 5,297(0.59%)#20 | 4,820,287(0.00%)#7,086 |
| 21. | Shannondale | 31 | 5,297(0.59%)#21 | 4,820,287(0.00%)#7,111 |
| 22. | Williamson | 31 | 5,297(0.59%)#22 | 4,820,287(0.00%)#7,117 |
| 23. | Follansbee | 30 | 5,297(0.57%)#23 | 4,820,287(0.00%)#7,189 |
| 24. | Fairmont | 25 | 5,297(0.47%)#24 | 4,820,287(0.00%)#7,601 |
| 25. | Lewisburg | 25 | 5,297(0.47%)#25 | 4,820,287(0.00%)#7,631 |
| 26. | Middleway | 24 | 5,297(0.45%)#26 | 4,820,287(0.00%)#7,790 |
| 27. | Shenandoah Junction | 23 | 5,297(0.43%)#27 | 4,820,287(0.00%)#7,889 |
| 28. | Ranson Corporation | 22 | 5,297(0.42%)#28 | 4,820,287(0.00%)#7,946 |
| 29. | Bridgeport | 21 | 5,297(0.40%)#29 | 4,820,287(0.00%)#8,073 |
| 30. | Falling Waters | 21 | 5,297(0.40%)#30 | 4,820,287(0.00%)#8,142 |
| 31. | Winfield | 20 | 5,297(0.38%)#31 | 4,820,287(0.00%)#8,261 |
| 32. | Ravenswood | 18 | 5,297(0.34%)#32 | 4,820,287(0.00%)#8,531 |
| 33. | Shady Spring | 18 | 5,297(0.34%)#33 | 4,820,287(0.00%)#8,534 |
| 34. | West Liberty | 18 | 5,297(0.34%)#34 | 4,820,287(0.00%)#8,580 |
| 35. | Ronceverte | 18 | 5,297(0.34%)#35 | 4,820,287(0.00%)#8,592 |
| 36. | Cross Lanes | 17 | 5,297(0.32%)#36 | 4,820,287(0.00%)#8,645 |
| 37. | Barboursville | 17 | 5,297(0.32%)#37 | 4,820,287(0.00%)#8,674 |
| 38. | Mcmechen | 17 | 5,297(0.32%)#38 | 4,820,287(0.00%)#8,729 |
| 39. | Washington | 17 | 5,297(0.32%)#39 | 4,820,287(0.00%)#8,755 |
| 40. | Burlington | 17 | 5,297(0.32%)#40 | 4,820,287(0.00%)#8,798 |
| 41. | Hooverson Heights | 15 | 5,297(0.28%)#41 | 4,820,287(0.00%)#9,062 |
| 42. | Marlinton | 15 | 5,297(0.28%)#42 | 4,820,287(0.00%)#9,119 |
| 43. | Salem | 14 | 5,297(0.26%)#43 | 4,820,287(0.00%)#9,268 |
| 44. | Bolivar | 13 | 5,297(0.25%)#44 | 4,820,287(0.00%)#9,498 |
| 45. | Athens | 13 | 5,297(0.25%)#45 | 4,820,287(0.00%)#9,506 |
| 46. | Cairo | 11 | 5,297(0.21%)#46 | 4,820,287(0.00%)#10,028 |
| 47. | Vienna | 10 | 5,297(0.19%)#47 | 4,820,287(0.00%)#10,046 |
| 48. | Bradley | 10 | 5,297(0.19%)#48 | 4,820,287(0.00%)#10,163 |
| 49. | New Cumberland | 9 | 5,297(0.17%)#49 | 4,820,287(0.00%)#10,493 |
| 50. | Weston | 8 | 5,297(0.15%)#50 | 4,820,287(0.00%)#10,647 |
| 51. | Spencer | 8 | 5,297(0.15%)#51 | 4,820,287(0.00%)#10,714 |
| 52. | Arthurdale | 8 | 5,297(0.15%)#52 | 4,820,287(0.00%)#10,803 |
| 53. | West Union | 8 | 5,297(0.15%)#53 | 4,820,287(0.00%)#10,816 |
| 54. | Teays Valley | 7 | 5,297(0.13%)#54 | 4,820,287(0.00%)#10,924 |
| 55. | Pea Ridge | 7 | 5,297(0.13%)#55 | 4,820,287(0.00%)#10,944 |
| 56. | Princeton | 7 | 5,297(0.13%)#56 | 4,820,287(0.00%)#10,949 |
| 57. | Boaz | 7 | 5,297(0.13%)#57 | 4,820,287(0.00%)#11,090 |
| 58. | Granville | 7 | 5,297(0.13%)#58 | 4,820,287(0.00%)#11,094 |
| 59. | Bethany | 7 | 5,297(0.13%)#59 | 4,820,287(0.00%)#11,119 |
| 60. | Tornado | 7 | 5,297(0.13%)#60 | 4,820,287(0.00%)#11,131 |
| 61. | Reedsville | 7 | 5,297(0.13%)#61 | 4,820,287(0.00%)#11,185 |
| 62. | Clearview | 7 | 5,297(0.13%)#62 | 4,820,287(0.00%)#11,192 |
| 63. | East View | 7 | 5,297(0.13%)#63 | 4,820,287(0.00%)#11,226 |
| 64. | Moundsville | 6 | 5,297(0.11%)#64 | 4,820,287(0.00%)#11,289 |
| 65. | Rupert | 6 | 5,297(0.11%)#65 | 4,820,287(0.00%)#11,500 |
| 66. | Harpers Ferry | 6 | 5,297(0.11%)#66 | 4,820,287(0.00%)#11,635 |
| 67. | Madison | 5 | 5,297(0.09%)#67 | 4,820,287(0.00%)#11,740 |
| 68. | Stonewood | 5 | 5,297(0.09%)#68 | 4,820,287(0.00%)#11,770 |
| 69. | Hamlin | 5 | 5,297(0.09%)#69 | 4,820,287(0.00%)#11,853 |
| 70. | West Hamlin | 5 | 5,297(0.09%)#70 | 4,820,287(0.00%)#11,990 |
| 71. | Fairview | 5 | 5,297(0.09%)#71 | 4,820,287(0.00%)#12,051 |
| 72. | Anawalt | 5 | 5,297(0.09%)#72 | 4,820,287(0.00%)#12,065 |
| 73. | Romney | 4 | 5,297(0.08%)#73 | 4,820,287(0.00%)#12,174 |
| 74. | Terra Alta | 4 | 5,297(0.08%)#74 | 4,820,287(0.00%)#12,182 |
| 75. | Monongah | 4 | 5,297(0.08%)#75 | 4,820,287(0.00%)#12,310 |
| 76. | Robinette | 4 | 5,297(0.08%)#76 | 4,820,287(0.00%)#12,456 |
| 77. | Hedgesville | 4 | 5,297(0.08%)#77 | 4,820,287(0.00%)#12,523 |
| 78. | Mannington | 3 | 5,297(0.06%)#78 | 4,820,287(0.00%)#12,667 |
| 79. | Rainelle | 3 | 5,297(0.06%)#79 | 4,820,287(0.00%)#12,721 |
| 80. | Middlebourne | 3 | 5,297(0.06%)#80 | 4,820,287(0.00%)#12,865 |
| 81. | Mason | 3 | 5,297(0.06%)#81 | 4,820,287(0.00%)#12,871 |
| 82. | Cedar Grove | 3 | 5,297(0.06%)#82 | 4,820,287(0.00%)#12,979 |
| 83. | Martinsburg | 2 | 5,297(0.04%)#83 | 4,820,287(0.00%)#13,161 |
| 84. | Mullens | 2 | 5,297(0.04%)#84 | 4,820,287(0.00%)#13,197 |
| 85. | North Hills | 2 | 5,297(0.04%)#85 | 4,820,287(0.00%)#13,337 |
| 86. | East Bank | 2 | 5,297(0.04%)#86 | 4,820,287(0.00%)#13,422 |
| 87. | Cowen | 2 | 5,297(0.04%)#87 | 4,820,287(0.00%)#13,555 |
| 88. | Institute | 2 | 5,297(0.04%)#88 | 4,820,287(0.00%)#13,560 |
| 89. | Philippi | 1 | 5,297(0.02%)#89 | 4,820,287(0.00%)#13,999 |
| 90. | Paden City | 1 | 5,297(0.02%)#90 | 4,820,287(0.00%)#14,001 |
| 91. | Sutton | 1 | 5,297(0.02%)#91 | 4,820,287(0.00%)#14,080 |
| 92. | Peterstown | 1 | 5,297(0.02%)#92 | 4,820,287(0.00%)#14,108 |
| 93. | Wardensville | 1 | 5,297(0.02%)#93 | 4,820,287(0.00%)#14,212 |
| 94. | Newark | 1 | 5,297(0.02%)#94 | 4,820,287(0.00%)#14,239 |
1
2Common Questions
What are the Top 10 Cities with the Most Immigrants from Europe in West Virginia?
Top 10 Cities with the Most Immigrants from Europe in West Virginia are:
#1
442
#2
283
#3
255
#4
144
#5
115
#6
114
#7
84
#8
81
#9
69
#10
59
What city has the Most Immigrants from Europe in West Virginia?
Charleston has the Most Immigrants from Europe in West Virginia with 442.
What is the Total Immigrants from Europe in the State of West Virginia?
Total Immigrants from Europe in West Virginia is 5,297.
What is the Total Immigrants from Europe in the United States?
Total Immigrants from Europe in the United States is 4,820,287.