Cities with the Most Immigrants from Europe in New Hampshire
RELATED REPORTS & OPTIONS
Europe
New Hampshire
Compare Cities
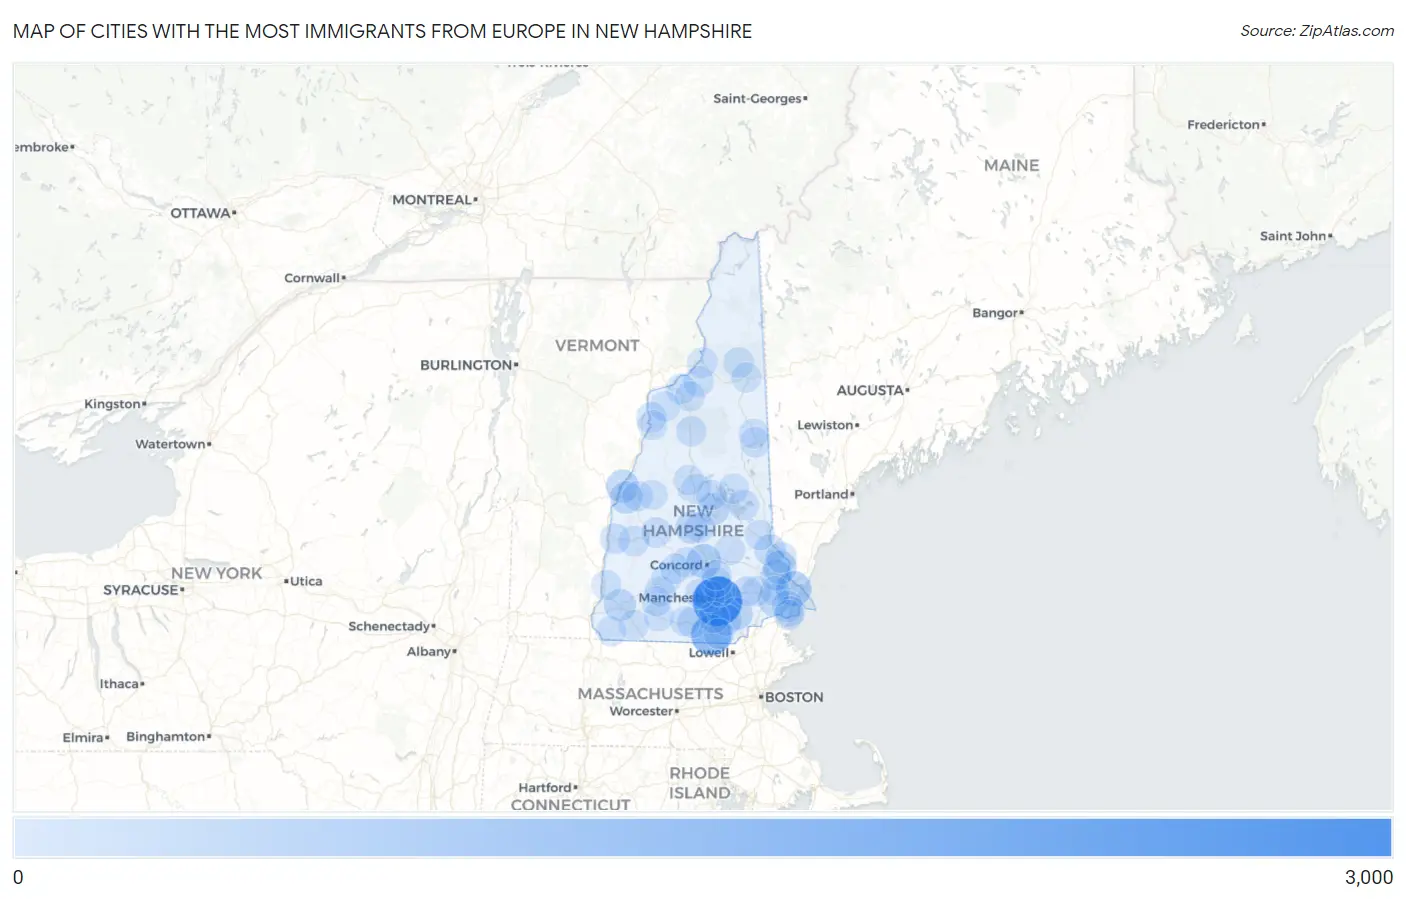
Map of Cities with the Most Immigrants from Europe in New Hampshire
0
3,000
Cities with the Most Immigrants from Europe in New Hampshire
| City | Europe | vs State | vs National | |
| 1. | Manchester | 2,889 | 19,930(14.50%)#1 | 4,820,287(0.06%)#196 |
| 2. | Nashua | 1,504 | 19,930(7.55%)#2 | 4,820,287(0.03%)#434 |
| 3. | Portsmouth | 713 | 19,930(3.58%)#3 | 4,820,287(0.01%)#963 |
| 4. | Concord | 615 | 19,930(3.09%)#4 | 4,820,287(0.01%)#1,131 |
| 5. | Dover | 473 | 19,930(2.37%)#5 | 4,820,287(0.01%)#1,447 |
| 6. | Hanover | 412 | 19,930(2.07%)#6 | 4,820,287(0.01%)#1,634 |
| 7. | Derry | 367 | 19,930(1.84%)#7 | 4,820,287(0.01%)#1,798 |
| 8. | Lebanon | 335 | 19,930(1.68%)#8 | 4,820,287(0.01%)#1,927 |
| 9. | Keene | 297 | 19,930(1.49%)#9 | 4,820,287(0.01%)#2,118 |
| 10. | Franklin | 290 | 19,930(1.46%)#10 | 4,820,287(0.01%)#2,155 |
| 11. | Laconia | 276 | 19,930(1.38%)#11 | 4,820,287(0.01%)#2,211 |
| 12. | Pinardville | 264 | 19,930(1.32%)#12 | 4,820,287(0.01%)#2,276 |
| 13. | Exeter | 238 | 19,930(1.19%)#13 | 4,820,287(0.00%)#2,456 |
| 14. | Rochester | 190 | 19,930(0.95%)#14 | 4,820,287(0.00%)#2,835 |
| 15. | Londonderry | 190 | 19,930(0.95%)#15 | 4,820,287(0.00%)#2,837 |
| 16. | Durham | 175 | 19,930(0.88%)#16 | 4,820,287(0.00%)#3,007 |
| 17. | Hampton | 154 | 19,930(0.77%)#17 | 4,820,287(0.00%)#3,272 |
| 18. | East Merrimack | 140 | 19,930(0.70%)#18 | 4,820,287(0.00%)#3,466 |
| 19. | Somersworth | 117 | 19,930(0.59%)#19 | 4,820,287(0.00%)#3,840 |
| 20. | Milford | 98 | 19,930(0.49%)#20 | 4,820,287(0.00%)#4,231 |
| 21. | Wolfeboro | 91 | 19,930(0.46%)#21 | 4,820,287(0.00%)#4,419 |
| 22. | Newport | 71 | 19,930(0.36%)#22 | 4,820,287(0.00%)#4,981 |
| 23. | Berlin | 67 | 19,930(0.34%)#23 | 4,820,287(0.00%)#5,099 |
| 24. | Lancaster | 58 | 19,930(0.29%)#24 | 4,820,287(0.00%)#5,457 |
| 25. | Tilton Northfield | 51 | 19,930(0.26%)#25 | 4,820,287(0.00%)#5,793 |
| 26. | South Hooksett | 47 | 19,930(0.24%)#26 | 4,820,287(0.00%)#5,991 |
| 27. | Contoocook | 44 | 19,930(0.22%)#27 | 4,820,287(0.00%)#6,197 |
| 28. | Meredith | 43 | 19,930(0.22%)#28 | 4,820,287(0.00%)#6,242 |
| 29. | Woodsville | 40 | 19,930(0.20%)#29 | 4,820,287(0.00%)#6,440 |
| 30. | Hudson | 38 | 19,930(0.19%)#30 | 4,820,287(0.00%)#6,550 |
| 31. | Plymouth | 37 | 19,930(0.19%)#31 | 4,820,287(0.00%)#6,633 |
| 32. | Pittsfield | 36 | 19,930(0.18%)#32 | 4,820,287(0.00%)#6,752 |
| 33. | New London | 36 | 19,930(0.18%)#33 | 4,820,287(0.00%)#6,756 |
| 34. | Lincoln | 35 | 19,930(0.18%)#34 | 4,820,287(0.00%)#6,841 |
| 35. | Hooksett | 34 | 19,930(0.17%)#35 | 4,820,287(0.00%)#6,876 |
| 36. | Claremont | 33 | 19,930(0.17%)#36 | 4,820,287(0.00%)#6,925 |
| 37. | Whitefield | 33 | 19,930(0.17%)#37 | 4,820,287(0.00%)#6,981 |
| 38. | Goffstown | 29 | 19,930(0.15%)#38 | 4,820,287(0.00%)#7,279 |
| 39. | Suncook | 27 | 19,930(0.14%)#39 | 4,820,287(0.00%)#7,433 |
| 40. | Littleton | 27 | 19,930(0.14%)#40 | 4,820,287(0.00%)#7,439 |
| 41. | Farmington | 25 | 19,930(0.13%)#41 | 4,820,287(0.00%)#7,635 |
| 42. | Hampton Beach | 25 | 19,930(0.13%)#42 | 4,820,287(0.00%)#7,651 |
| 43. | Walpole | 21 | 19,930(0.11%)#43 | 4,820,287(0.00%)#8,186 |
| 44. | Conway | 20 | 19,930(0.10%)#44 | 4,820,287(0.00%)#8,246 |
| 45. | Klondike Corner | 18 | 19,930(0.09%)#45 | 4,820,287(0.00%)#8,606 |
| 46. | Melvin Village | 18 | 19,930(0.09%)#46 | 4,820,287(0.00%)#8,634 |
| 47. | Troy | 17 | 19,930(0.09%)#47 | 4,820,287(0.00%)#8,766 |
| 48. | Hillsborough | 15 | 19,930(0.08%)#48 | 4,820,287(0.00%)#9,096 |
| 49. | Epping | 14 | 19,930(0.07%)#49 | 4,820,287(0.00%)#9,237 |
| 50. | Enfield | 13 | 19,930(0.07%)#50 | 4,820,287(0.00%)#9,447 |
| 51. | Antrim | 13 | 19,930(0.07%)#51 | 4,820,287(0.00%)#9,495 |
| 52. | Peterborough | 12 | 19,930(0.06%)#52 | 4,820,287(0.00%)#9,635 |
| 53. | Newfields | 11 | 19,930(0.06%)#53 | 4,820,287(0.00%)#10,021 |
| 54. | Gorham | 10 | 19,930(0.05%)#54 | 4,820,287(0.00%)#10,138 |
| 55. | Wilton | 10 | 19,930(0.05%)#55 | 4,820,287(0.00%)#10,194 |
| 56. | Bethlehem | 9 | 19,930(0.05%)#56 | 4,820,287(0.00%)#10,510 |
| 57. | Canaan | 9 | 19,930(0.05%)#57 | 4,820,287(0.00%)#10,595 |
| 58. | Ashland | 8 | 19,930(0.04%)#58 | 4,820,287(0.00%)#10,745 |
| 59. | Seabrook Beach | 7 | 19,930(0.04%)#59 | 4,820,287(0.00%)#11,151 |
| 60. | Raymond | 6 | 19,930(0.03%)#60 | 4,820,287(0.00%)#11,317 |
| 61. | North Conway | 6 | 19,930(0.03%)#61 | 4,820,287(0.00%)#11,391 |
| 62. | Lisbon | 6 | 19,930(0.03%)#62 | 4,820,287(0.00%)#11,533 |
| 63. | Winchester | 5 | 19,930(0.03%)#63 | 4,820,287(0.00%)#11,855 |
| 64. | Hancock | 4 | 19,930(0.02%)#64 | 4,820,287(0.00%)#12,541 |
| 65. | Henniker | 3 | 19,930(0.02%)#65 | 4,820,287(0.00%)#12,612 |
| 66. | Francestown | 3 | 19,930(0.02%)#66 | 4,820,287(0.00%)#13,138 |
| 67. | North Haverhill | 2 | 19,930(0.01%)#67 | 4,820,287(0.00%)#13,419 |
1
Common Questions
What are the Top 10 Cities with the Most Immigrants from Europe in New Hampshire?
Top 10 Cities with the Most Immigrants from Europe in New Hampshire are:
#1
2,889
#2
1,504
#3
713
#4
615
#5
473
#6
412
#7
367
#8
335
#9
297
#10
290
What city has the Most Immigrants from Europe in New Hampshire?
Manchester has the Most Immigrants from Europe in New Hampshire with 2,889.
What is the Total Immigrants from Europe in the State of New Hampshire?
Total Immigrants from Europe in New Hampshire is 19,930.
What is the Total Immigrants from Europe in the United States?
Total Immigrants from Europe in the United States is 4,820,287.