Cities with the Most Immigrants from Europe in Louisiana
RELATED REPORTS & OPTIONS
Europe
Louisiana
Compare Cities
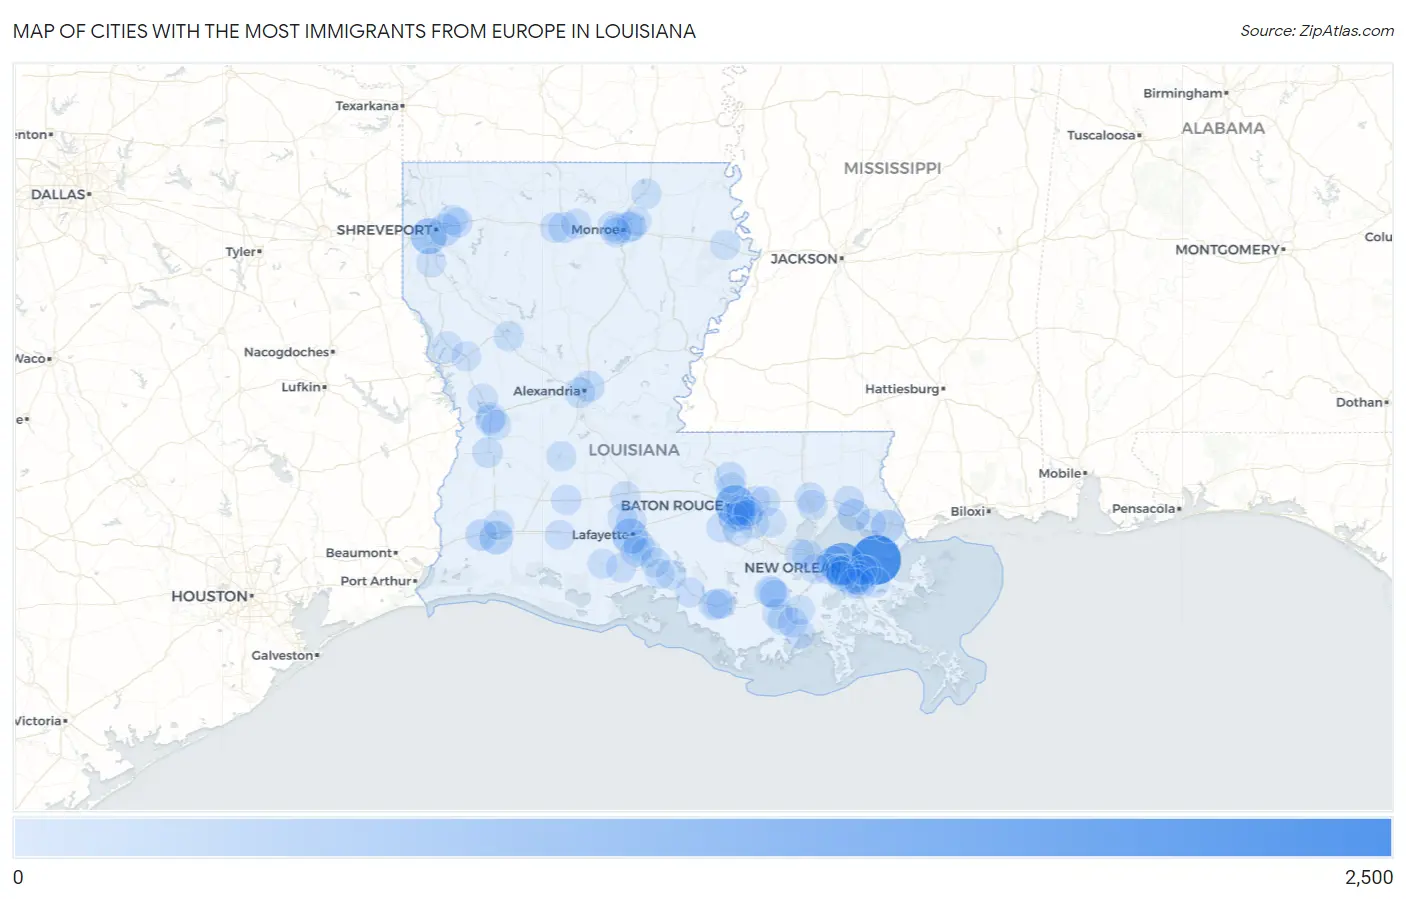
Map of Cities with the Most Immigrants from Europe in Louisiana
0
2,500
Cities with the Most Immigrants from Europe in Louisiana
| City | Europe | vs State | vs National | |
| 1. | New Orleans | 2,383 | 16,165(14.74%)#1 | 4,820,287(0.05%)#242 |
| 2. | Metairie | 1,457 | 16,165(9.01%)#2 | 4,820,287(0.03%)#455 |
| 3. | Baton Rouge | 1,113 | 16,165(6.89%)#3 | 4,820,287(0.02%)#629 |
| 4. | Shreveport | 715 | 16,165(4.42%)#4 | 4,820,287(0.01%)#957 |
| 5. | Lafayette | 637 | 16,165(3.94%)#5 | 4,820,287(0.01%)#1,085 |
| 6. | Lake Charles | 415 | 16,165(2.57%)#6 | 4,820,287(0.01%)#1,612 |
| 7. | Kenner | 380 | 16,165(2.35%)#7 | 4,820,287(0.01%)#1,753 |
| 8. | Slidell | 305 | 16,165(1.89%)#8 | 4,820,287(0.01%)#2,080 |
| 9. | Bossier City | 274 | 16,165(1.70%)#9 | 4,820,287(0.01%)#2,221 |
| 10. | Mandeville | 222 | 16,165(1.37%)#10 | 4,820,287(0.00%)#2,593 |
| 11. | Sulphur | 207 | 16,165(1.28%)#11 | 4,820,287(0.00%)#2,691 |
| 12. | Thibodaux | 170 | 16,165(1.05%)#12 | 4,820,287(0.00%)#3,053 |
| 13. | Elmwood | 160 | 16,165(0.99%)#13 | 4,820,287(0.00%)#3,196 |
| 14. | Pineville | 158 | 16,165(0.98%)#14 | 4,820,287(0.00%)#3,223 |
| 15. | Zachary | 155 | 16,165(0.96%)#15 | 4,820,287(0.00%)#3,256 |
| 16. | Gretna | 144 | 16,165(0.89%)#16 | 4,820,287(0.00%)#3,403 |
| 17. | Monroe | 132 | 16,165(0.82%)#17 | 4,820,287(0.00%)#3,564 |
| 18. | Ruston | 121 | 16,165(0.75%)#18 | 4,820,287(0.00%)#3,767 |
| 19. | Broussard | 102 | 16,165(0.63%)#19 | 4,820,287(0.00%)#4,137 |
| 20. | Alexandria | 93 | 16,165(0.58%)#20 | 4,820,287(0.00%)#4,336 |
| 21. | Oak Hills Place | 93 | 16,165(0.58%)#21 | 4,820,287(0.00%)#4,344 |
| 22. | Laplace | 87 | 16,165(0.54%)#22 | 4,820,287(0.00%)#4,498 |
| 23. | Terrytown | 76 | 16,165(0.47%)#23 | 4,820,287(0.00%)#4,819 |
| 24. | Westminster | 76 | 16,165(0.47%)#24 | 4,820,287(0.00%)#4,836 |
| 25. | Youngsville | 70 | 16,165(0.43%)#25 | 4,820,287(0.00%)#5,002 |
| 26. | Marrero | 66 | 16,165(0.41%)#26 | 4,820,287(0.00%)#5,131 |
| 27. | Covington | 66 | 16,165(0.41%)#27 | 4,820,287(0.00%)#5,139 |
| 28. | Deridder | 62 | 16,165(0.38%)#28 | 4,820,287(0.00%)#5,274 |
| 29. | St Rose | 56 | 16,165(0.35%)#29 | 4,820,287(0.00%)#5,515 |
| 30. | Houma | 54 | 16,165(0.33%)#30 | 4,820,287(0.00%)#5,593 |
| 31. | Harvey | 54 | 16,165(0.33%)#31 | 4,820,287(0.00%)#5,595 |
| 32. | Prairieville | 53 | 16,165(0.33%)#32 | 4,820,287(0.00%)#5,654 |
| 33. | River Ridge | 50 | 16,165(0.31%)#33 | 4,820,287(0.00%)#5,815 |
| 34. | Chalmette | 49 | 16,165(0.30%)#34 | 4,820,287(0.00%)#5,866 |
| 35. | Bayou Vista | 48 | 16,165(0.30%)#35 | 4,820,287(0.00%)#5,937 |
| 36. | Basile | 48 | 16,165(0.30%)#36 | 4,820,287(0.00%)#5,952 |
| 37. | Village St George | 46 | 16,165(0.28%)#37 | 4,820,287(0.00%)#6,026 |
| 38. | Grambling | 46 | 16,165(0.28%)#38 | 4,820,287(0.00%)#6,037 |
| 39. | Denham Springs | 45 | 16,165(0.28%)#39 | 4,820,287(0.00%)#6,093 |
| 40. | Carencro | 44 | 16,165(0.27%)#40 | 4,820,287(0.00%)#6,140 |
| 41. | Jefferson | 43 | 16,165(0.27%)#41 | 4,820,287(0.00%)#6,216 |
| 42. | Hammond | 42 | 16,165(0.26%)#42 | 4,820,287(0.00%)#6,265 |
| 43. | Ponchatoula | 41 | 16,165(0.25%)#43 | 4,820,287(0.00%)#6,337 |
| 44. | Bastrop | 39 | 16,165(0.24%)#44 | 4,820,287(0.00%)#6,467 |
| 45. | Bayou Cane | 38 | 16,165(0.24%)#45 | 4,820,287(0.00%)#6,533 |
| 46. | Leesville | 37 | 16,165(0.23%)#46 | 4,820,287(0.00%)#6,624 |
| 47. | Gardere | 36 | 16,165(0.22%)#47 | 4,820,287(0.00%)#6,698 |
| 48. | Red Chute | 36 | 16,165(0.22%)#48 | 4,820,287(0.00%)#6,712 |
| 49. | Claiborne | 35 | 16,165(0.22%)#49 | 4,820,287(0.00%)#6,776 |
| 50. | Abbeville | 33 | 16,165(0.20%)#50 | 4,820,287(0.00%)#6,926 |
| 51. | Belle Chasse | 33 | 16,165(0.20%)#51 | 4,820,287(0.00%)#6,930 |
| 52. | Montegut | 32 | 16,165(0.20%)#52 | 4,820,287(0.00%)#7,057 |
| 53. | Franklin | 31 | 16,165(0.19%)#53 | 4,820,287(0.00%)#7,087 |
| 54. | Choudrant | 30 | 16,165(0.19%)#54 | 4,820,287(0.00%)#7,214 |
| 55. | Walker | 29 | 16,165(0.18%)#55 | 4,820,287(0.00%)#7,249 |
| 56. | Timberlane | 28 | 16,165(0.17%)#56 | 4,820,287(0.00%)#7,333 |
| 57. | Patterson | 28 | 16,165(0.17%)#57 | 4,820,287(0.00%)#7,348 |
| 58. | Lacombe | 26 | 16,165(0.16%)#58 | 4,820,287(0.00%)#7,524 |
| 59. | Jeanerette | 26 | 16,165(0.16%)#59 | 4,820,287(0.00%)#7,537 |
| 60. | Hahnville | 26 | 16,165(0.16%)#60 | 4,820,287(0.00%)#7,549 |
| 61. | Bayou Country Club | 25 | 16,165(0.15%)#61 | 4,820,287(0.00%)#7,681 |
| 62. | Plaquemine | 24 | 16,165(0.15%)#62 | 4,820,287(0.00%)#7,731 |
| 63. | Natchitoches | 23 | 16,165(0.14%)#63 | 4,820,287(0.00%)#7,797 |
| 64. | West Monroe | 23 | 16,165(0.14%)#64 | 4,820,287(0.00%)#7,803 |
| 65. | Reserve | 23 | 16,165(0.14%)#65 | 4,820,287(0.00%)#7,816 |
| 66. | Lakeshore | 23 | 16,165(0.14%)#66 | 4,820,287(0.00%)#7,845 |
| 67. | Opelousas | 22 | 16,165(0.14%)#67 | 4,820,287(0.00%)#7,916 |
| 68. | Oakdale | 22 | 16,165(0.14%)#68 | 4,820,287(0.00%)#7,943 |
| 69. | Inniswold | 22 | 16,165(0.14%)#69 | 4,820,287(0.00%)#7,944 |
| 70. | Eastwood | 22 | 16,165(0.14%)#70 | 4,820,287(0.00%)#7,956 |
| 71. | New Llano | 22 | 16,165(0.14%)#71 | 4,820,287(0.00%)#7,996 |
| 72. | Lafourche Crossing | 21 | 16,165(0.13%)#72 | 4,820,287(0.00%)#8,138 |
| 73. | Bourg | 21 | 16,165(0.13%)#73 | 4,820,287(0.00%)#8,146 |
| 74. | Jennings | 20 | 16,165(0.12%)#74 | 4,820,287(0.00%)#8,207 |
| 75. | Old Jefferson | 18 | 16,165(0.11%)#75 | 4,820,287(0.00%)#8,483 |
| 76. | Stonewall | 18 | 16,165(0.11%)#76 | 4,820,287(0.00%)#8,559 |
| 77. | Cade | 17 | 16,165(0.11%)#77 | 4,820,287(0.00%)#8,723 |
| 78. | Anacoco | 17 | 16,165(0.11%)#78 | 4,820,287(0.00%)#8,757 |
| 79. | Harahan | 16 | 16,165(0.10%)#79 | 4,820,287(0.00%)#8,811 |
| 80. | Swartz | 16 | 16,165(0.10%)#80 | 4,820,287(0.00%)#8,825 |
| 81. | Lydia | 16 | 16,165(0.10%)#81 | 4,820,287(0.00%)#8,926 |
| 82. | Woodmere | 15 | 16,165(0.09%)#82 | 4,820,287(0.00%)#8,968 |
| 83. | Tallulah | 13 | 16,165(0.08%)#83 | 4,820,287(0.00%)#9,381 |
| 84. | Lockport Heights | 13 | 16,165(0.08%)#84 | 4,820,287(0.00%)#9,487 |
| 85. | Cankton | 13 | 16,165(0.08%)#85 | 4,820,287(0.00%)#9,531 |
| 86. | Shenandoah | 12 | 16,165(0.07%)#86 | 4,820,287(0.00%)#9,550 |
| 87. | Moss Bluff | 12 | 16,165(0.07%)#87 | 4,820,287(0.00%)#9,557 |
| 88. | Berwick | 12 | 16,165(0.07%)#88 | 4,820,287(0.00%)#9,585 |
| 89. | Arabi | 12 | 16,165(0.07%)#89 | 4,820,287(0.00%)#9,590 |
| 90. | Zwolle | 12 | 16,165(0.07%)#90 | 4,820,287(0.00%)#9,656 |
| 91. | Fort Polk South | 11 | 16,165(0.07%)#91 | 4,820,287(0.00%)#9,795 |
| 92. | Many | 11 | 16,165(0.07%)#92 | 4,820,287(0.00%)#9,877 |
| 93. | Poydras | 11 | 16,165(0.07%)#93 | 4,820,287(0.00%)#9,881 |
| 94. | New Iberia | 10 | 16,165(0.06%)#94 | 4,820,287(0.00%)#10,035 |
| 95. | Avondale | 10 | 16,165(0.06%)#95 | 4,820,287(0.00%)#10,073 |
| 96. | French Settlement | 10 | 16,165(0.06%)#96 | 4,820,287(0.00%)#10,221 |
| 97. | Baker | 9 | 16,165(0.06%)#97 | 4,820,287(0.00%)#10,309 |
| 98. | St Gabriel | 9 | 16,165(0.06%)#98 | 4,820,287(0.00%)#10,329 |
| 99. | Kaplan | 9 | 16,165(0.06%)#99 | 4,820,287(0.00%)#10,350 |
| 100. | Brownsville | 9 | 16,165(0.06%)#100 | 4,820,287(0.00%)#10,356 |
Common Questions
What are the Top 10 Cities with the Most Immigrants from Europe in Louisiana?
Top 10 Cities with the Most Immigrants from Europe in Louisiana are:
#1
2,383
#2
1,457
#3
1,113
#4
715
#5
637
#6
415
#7
380
#8
305
#9
274
#10
222
What city has the Most Immigrants from Europe in Louisiana?
New Orleans has the Most Immigrants from Europe in Louisiana with 2,383.
What is the Total Immigrants from Europe in the State of Louisiana?
Total Immigrants from Europe in Louisiana is 16,165.
What is the Total Immigrants from Europe in the United States?
Total Immigrants from Europe in the United States is 4,820,287.