Cities with the Most Immigrants from Europe in Montana
RELATED REPORTS & OPTIONS
Europe
Montana
Compare Cities
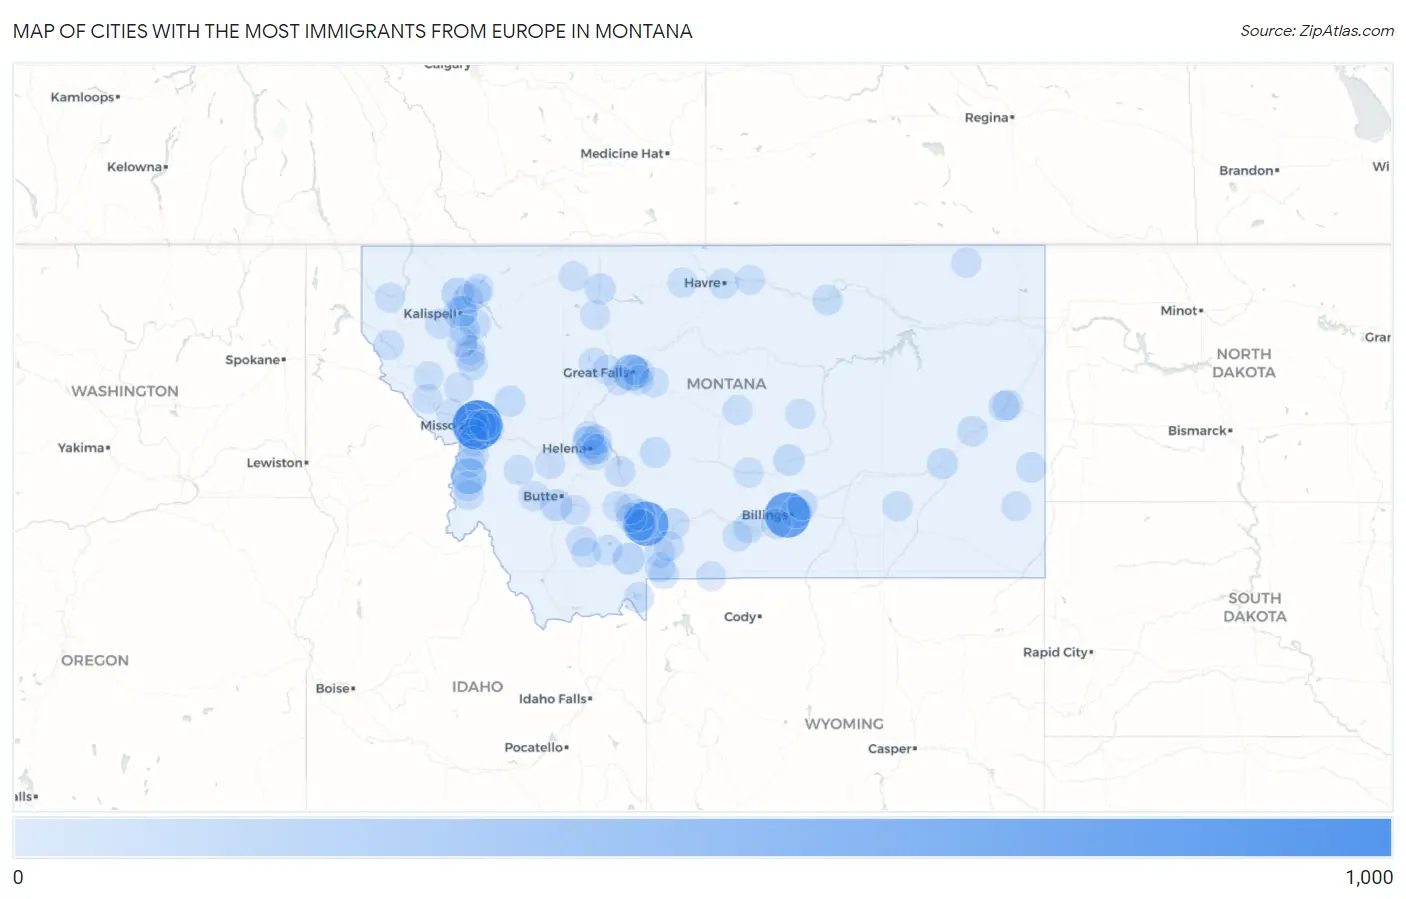
Map of Cities with the Most Immigrants from Europe in Montana
0
1,000
Cities with the Most Immigrants from Europe in Montana
| City | Europe | vs State | vs National | |
| 1. | Missoula | 935 | 7,681(12.17%)#1 | 4,820,287(0.02%)#737 |
| 2. | Billings | 734 | 7,681(9.56%)#2 | 4,820,287(0.02%)#929 |
| 3. | Bozeman | 678 | 7,681(8.83%)#3 | 4,820,287(0.01%)#1,028 |
| 4. | Great Falls | 289 | 7,681(3.76%)#4 | 4,820,287(0.01%)#2,156 |
| 5. | Hamilton | 265 | 7,681(3.45%)#5 | 4,820,287(0.01%)#2,265 |
| 6. | Helena Valley West Central | 127 | 7,681(1.65%)#6 | 4,820,287(0.00%)#3,664 |
| 7. | Four Corners | 126 | 7,681(1.64%)#7 | 4,820,287(0.00%)#3,683 |
| 8. | Kalispell | 122 | 7,681(1.59%)#8 | 4,820,287(0.00%)#3,744 |
| 9. | Helena | 112 | 7,681(1.46%)#9 | 4,820,287(0.00%)#3,917 |
| 10. | Butte Silver Bow Balance | 97 | 7,681(1.26%)#10 | 4,820,287(0.00%)#4,245 |
| 11. | Whitefish | 96 | 7,681(1.25%)#11 | 4,820,287(0.00%)#4,286 |
| 12. | Big Sky | 95 | 7,681(1.24%)#12 | 4,820,287(0.00%)#4,306 |
| 13. | Roundup | 65 | 7,681(0.85%)#13 | 4,820,287(0.00%)#5,186 |
| 14. | Belgrade | 63 | 7,681(0.82%)#14 | 4,820,287(0.00%)#5,231 |
| 15. | Lockwood | 62 | 7,681(0.81%)#15 | 4,820,287(0.00%)#5,281 |
| 16. | Turah | 54 | 7,681(0.70%)#16 | 4,820,287(0.00%)#5,650 |
| 17. | Livingston | 53 | 7,681(0.69%)#17 | 4,820,287(0.00%)#5,668 |
| 18. | Miles City | 52 | 7,681(0.68%)#18 | 4,820,287(0.00%)#5,717 |
| 19. | King Arthur Park | 52 | 7,681(0.68%)#19 | 4,820,287(0.00%)#5,743 |
| 20. | Shelby | 50 | 7,681(0.65%)#20 | 4,820,287(0.00%)#5,841 |
| 21. | Bigfork | 49 | 7,681(0.64%)#21 | 4,820,287(0.00%)#5,883 |
| 22. | Seeley Lake | 47 | 7,681(0.61%)#22 | 4,820,287(0.00%)#6,009 |
| 23. | Orchard Homes | 44 | 7,681(0.57%)#23 | 4,820,287(0.00%)#6,158 |
| 24. | Columbus | 44 | 7,681(0.57%)#24 | 4,820,287(0.00%)#6,190 |
| 25. | White Sulphur Springs | 43 | 7,681(0.56%)#25 | 4,820,287(0.00%)#6,255 |
| 26. | Evergreen | 42 | 7,681(0.55%)#26 | 4,820,287(0.00%)#6,274 |
| 27. | Lakeside | 42 | 7,681(0.55%)#27 | 4,820,287(0.00%)#6,304 |
| 28. | Wye | 37 | 7,681(0.48%)#28 | 4,820,287(0.00%)#6,676 |
| 29. | Terry | 37 | 7,681(0.48%)#29 | 4,820,287(0.00%)#6,680 |
| 30. | Townsend | 36 | 7,681(0.47%)#30 | 4,820,287(0.00%)#6,748 |
| 31. | Polson | 32 | 7,681(0.42%)#31 | 4,820,287(0.00%)#7,021 |
| 32. | Malta | 31 | 7,681(0.40%)#32 | 4,820,287(0.00%)#7,126 |
| 33. | Helena Valley Northeast | 29 | 7,681(0.38%)#33 | 4,820,287(0.00%)#7,265 |
| 34. | East Missoula | 28 | 7,681(0.36%)#34 | 4,820,287(0.00%)#7,384 |
| 35. | West Glendive | 27 | 7,681(0.35%)#35 | 4,820,287(0.00%)#7,472 |
| 36. | Malmstrom Afb | 26 | 7,681(0.34%)#36 | 4,820,287(0.00%)#7,544 |
| 37. | Glendive | 25 | 7,681(0.33%)#37 | 4,820,287(0.00%)#7,625 |
| 38. | Montana City | 25 | 7,681(0.33%)#38 | 4,820,287(0.00%)#7,648 |
| 39. | Manhattan | 24 | 7,681(0.31%)#39 | 4,820,287(0.00%)#7,763 |
| 40. | Baker | 24 | 7,681(0.31%)#40 | 4,820,287(0.00%)#7,767 |
| 41. | Helena Valley Northwest | 23 | 7,681(0.30%)#41 | 4,820,287(0.00%)#7,826 |
| 42. | Gardiner | 23 | 7,681(0.30%)#42 | 4,820,287(0.00%)#7,898 |
| 43. | Anaconda Deer Lodge County | 20 | 7,681(0.26%)#43 | 4,820,287(0.00%)#8,209 |
| 44. | Hebgen Lake Estates | 20 | 7,681(0.26%)#44 | 4,820,287(0.00%)#8,331 |
| 45. | Sun River | 20 | 7,681(0.26%)#45 | 4,820,287(0.00%)#8,332 |
| 46. | Columbia Falls | 19 | 7,681(0.25%)#46 | 4,820,287(0.00%)#8,366 |
| 47. | Stevensville | 18 | 7,681(0.23%)#47 | 4,820,287(0.00%)#8,566 |
| 48. | Marion | 18 | 7,681(0.23%)#48 | 4,820,287(0.00%)#8,598 |
| 49. | South Glastonbury | 18 | 7,681(0.23%)#49 | 4,820,287(0.00%)#8,629 |
| 50. | Sheridan | 17 | 7,681(0.22%)#50 | 4,820,287(0.00%)#8,769 |
| 51. | Carlton | 17 | 7,681(0.22%)#51 | 4,820,287(0.00%)#8,788 |
| 52. | Trout Creek | 17 | 7,681(0.22%)#52 | 4,820,287(0.00%)#8,794 |
| 53. | Laurel | 16 | 7,681(0.21%)#53 | 4,820,287(0.00%)#8,817 |
| 54. | Lolo | 16 | 7,681(0.21%)#54 | 4,820,287(0.00%)#8,831 |
| 55. | Absarokee | 16 | 7,681(0.21%)#55 | 4,820,287(0.00%)#8,934 |
| 56. | Colstrip | 15 | 7,681(0.20%)#56 | 4,820,287(0.00%)#9,063 |
| 57. | Bonner West Riverside | 15 | 7,681(0.20%)#57 | 4,820,287(0.00%)#9,112 |
| 58. | Churchill | 15 | 7,681(0.20%)#58 | 4,820,287(0.00%)#9,124 |
| 59. | Kings Point | 15 | 7,681(0.20%)#59 | 4,820,287(0.00%)#9,154 |
| 60. | Rader Creek | 13 | 7,681(0.17%)#60 | 4,820,287(0.00%)#9,535 |
| 61. | Corwin Springs | 13 | 7,681(0.17%)#61 | 4,820,287(0.00%)#9,546 |
| 62. | Libby | 12 | 7,681(0.16%)#62 | 4,820,287(0.00%)#9,617 |
| 63. | Darby | 12 | 7,681(0.16%)#63 | 4,820,287(0.00%)#9,752 |
| 64. | Huntley | 12 | 7,681(0.16%)#64 | 4,820,287(0.00%)#9,761 |
| 65. | Havre | 10 | 7,681(0.13%)#65 | 4,820,287(0.00%)#10,049 |
| 66. | Deer Lodge | 10 | 7,681(0.13%)#66 | 4,820,287(0.00%)#10,103 |
| 67. | Pray | 10 | 7,681(0.13%)#67 | 4,820,287(0.00%)#10,220 |
| 68. | Ennis | 10 | 7,681(0.13%)#68 | 4,820,287(0.00%)#10,249 |
| 69. | Coram | 10 | 7,681(0.13%)#69 | 4,820,287(0.00%)#10,272 |
| 70. | Lewistown | 9 | 7,681(0.12%)#70 | 4,820,287(0.00%)#10,334 |
| 71. | Pablo | 9 | 7,681(0.12%)#71 | 4,820,287(0.00%)#10,433 |
| 72. | Victor | 9 | 7,681(0.12%)#72 | 4,820,287(0.00%)#10,520 |
| 73. | Black Eagle | 9 | 7,681(0.12%)#73 | 4,820,287(0.00%)#10,542 |
| 74. | Philipsburg | 8 | 7,681(0.10%)#74 | 4,820,287(0.00%)#10,807 |
| 75. | Cut Bank | 7 | 7,681(0.09%)#75 | 4,820,287(0.00%)#10,986 |
| 76. | Ryegate | 7 | 7,681(0.09%)#76 | 4,820,287(0.00%)#11,254 |
| 77. | Dayton | 7 | 7,681(0.09%)#77 | 4,820,287(0.00%)#11,268 |
| 78. | Cooke City | 7 | 7,681(0.09%)#78 | 4,820,287(0.00%)#11,271 |
| 79. | Norris | 7 | 7,681(0.09%)#79 | 4,820,287(0.00%)#11,274 |
| 80. | Three Forks | 6 | 7,681(0.08%)#80 | 4,820,287(0.00%)#11,401 |
| 81. | Alberton | 6 | 7,681(0.08%)#81 | 4,820,287(0.00%)#11,593 |
| 82. | Belt | 6 | 7,681(0.08%)#82 | 4,820,287(0.00%)#11,595 |
| 83. | York | 6 | 7,681(0.08%)#83 | 4,820,287(0.00%)#11,653 |
| 84. | Pine Creek | 6 | 7,681(0.08%)#84 | 4,820,287(0.00%)#11,661 |
| 85. | Alder | 6 | 7,681(0.08%)#85 | 4,820,287(0.00%)#11,672 |
| 86. | Charlos Heights | 6 | 7,681(0.08%)#86 | 4,820,287(0.00%)#11,679 |
| 87. | Chinook | 5 | 7,681(0.07%)#87 | 4,820,287(0.00%)#11,844 |
| 88. | Scobey | 5 | 7,681(0.07%)#88 | 4,820,287(0.00%)#11,944 |
| 89. | Fairfield | 5 | 7,681(0.07%)#89 | 4,820,287(0.00%)#11,952 |
| 90. | Sand Coulee | 5 | 7,681(0.07%)#90 | 4,820,287(0.00%)#12,056 |
| 91. | Winnett | 5 | 7,681(0.07%)#91 | 4,820,287(0.00%)#12,067 |
| 92. | Hingham | 5 | 7,681(0.07%)#92 | 4,820,287(0.00%)#12,082 |
| 93. | Conrad | 4 | 7,681(0.05%)#93 | 4,820,287(0.00%)#12,144 |
| 94. | East Helena | 4 | 7,681(0.05%)#94 | 4,820,287(0.00%)#12,204 |
| 95. | Plains | 4 | 7,681(0.05%)#95 | 4,820,287(0.00%)#12,291 |
| 96. | Ulm | 4 | 7,681(0.05%)#96 | 4,820,287(0.00%)#12,343 |
| 97. | Superior | 4 | 7,681(0.05%)#97 | 4,820,287(0.00%)#12,351 |
| 98. | Ekalaka | 4 | 7,681(0.05%)#98 | 4,820,287(0.00%)#12,486 |
| 99. | Dixon | 4 | 7,681(0.05%)#99 | 4,820,287(0.00%)#12,513 |
| 100. | West Glacier | 4 | 7,681(0.05%)#100 | 4,820,287(0.00%)#12,546 |
Common Questions
What are the Top 10 Cities with the Most Immigrants from Europe in Montana?
Top 10 Cities with the Most Immigrants from Europe in Montana are:
#1
935
#2
734
#3
678
#4
289
#5
265
#6
127
#7
126
#8
122
#9
112
#10
97
What city has the Most Immigrants from Europe in Montana?
Missoula has the Most Immigrants from Europe in Montana with 935.
What is the Total Immigrants from Europe in the State of Montana?
Total Immigrants from Europe in Montana is 7,681.
What is the Total Immigrants from Europe in the United States?
Total Immigrants from Europe in the United States is 4,820,287.