Smithville Sanders, IN
Smithville Sanders Map
Smithville Sanders Overview
3,099
TOTAL POPULATION
1,558
MALE POPULATION
1,541
FEMALE POPULATION
101.10
MALES / 100 FEMALES
98.91
FEMALES / 100 MALES
38.7
MEDIAN AGE
2.8
AVG FAMILY SIZE
2.3
AVG HOUSEHOLD SIZE
$47,816
PER CAPITA INCOME
$111,671
AVG FAMILY INCOME
$67,091
AVG HOUSEHOLD INCOME
2.5%
WAGE / INCOME GAP [ % ]
97.5¢/ $1
WAGE / INCOME GAP [ $ ]
0.46
INEQUALITY / GINI INDEX
1,634
LABOR FORCE [ PEOPLE ]
71.0%
PERCENT IN LABOR FORCE
4.2%
UNEMPLOYMENT RATE
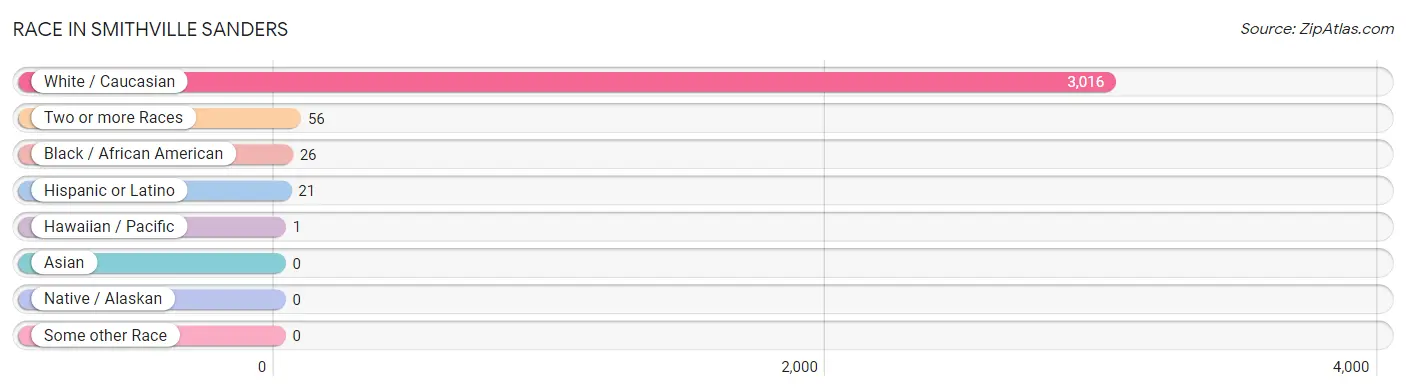
Race in Smithville Sanders
The most populous races in Smithville Sanders are White / Caucasian (3,016 | 97.3%), Two or more Races (56 | 1.8%), and Black / African American (26 | 0.8%).
| Race | # Population | % Population |
| Asian | 0 | 0.0% |
| Black / African American | 26 | 0.8% |
| Hawaiian / Pacific | 1 | 0.0% |
| Hispanic or Latino | 21 | 0.7% |
| Native / Alaskan | 0 | 0.0% |
| White / Caucasian | 3,016 | 97.3% |
| Two or more Races | 56 | 1.8% |
| Some other Race | 0 | 0.0% |
| Total | 3,099 | 100.0% |
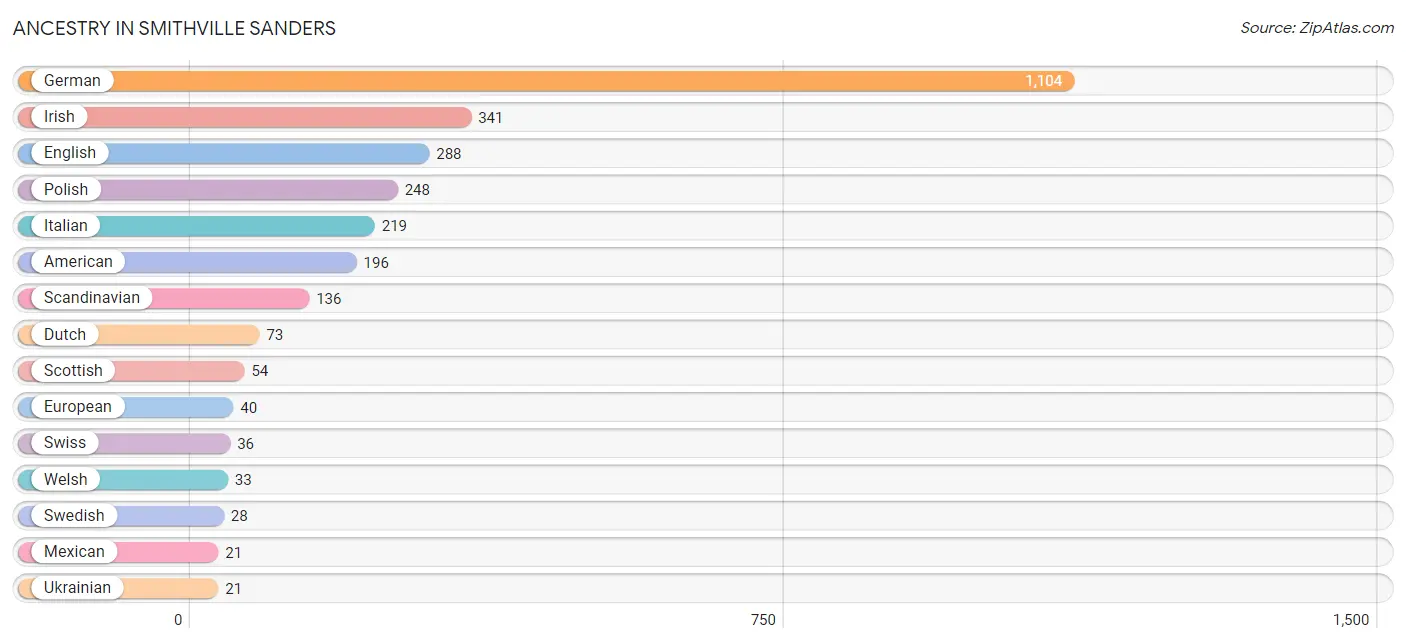
Ancestry in Smithville Sanders
The most populous ancestries reported in Smithville Sanders are German (1,104 | 35.6%), Irish (341 | 11.0%), English (288 | 9.3%), Polish (248 | 8.0%), and Italian (219 | 7.1%), together accounting for 71.0% of all Smithville Sanders residents.
| Ancestry | # Population | % Population |
| American | 196 | 6.3% |
| British | 11 | 0.4% |
| Canadian | 9 | 0.3% |
| Cherokee | 7 | 0.2% |
| Creek | 7 | 0.2% |
| Dutch | 73 | 2.4% |
| English | 288 | 9.3% |
| European | 40 | 1.3% |
| French | 9 | 0.3% |
| German | 1,104 | 35.6% |
| Irish | 341 | 11.0% |
| Italian | 219 | 7.1% |
| Korean | 15 | 0.5% |
| Marshallese | 15 | 0.5% |
| Mexican | 21 | 0.7% |
| Native Hawaiian | 1 | 0.0% |
| Norwegian | 4 | 0.1% |
| Polish | 248 | 8.0% |
| Russian | 8 | 0.3% |
| Scandinavian | 136 | 4.4% |
| Scotch-Irish | 15 | 0.5% |
| Scottish | 54 | 1.7% |
| Swedish | 28 | 0.9% |
| Swiss | 36 | 1.2% |
| Ukrainian | 21 | 0.7% |
| Welsh | 33 | 1.1% | View All 26 Rows |
Immigrants in Smithville Sanders
The most numerous immigrant groups reported in Smithville Sanders came from Micronesia (15 | 0.5%), Oceania (15 | 0.5%), and Canada (9 | 0.3%), together accounting for 1.2% of all Smithville Sanders residents.

| Immigration Origin | # Population | % Population |
| Canada | 9 | 0.3% |
| Micronesia | 15 | 0.5% |
| Oceania | 15 | 0.5% | View All 3 Rows |
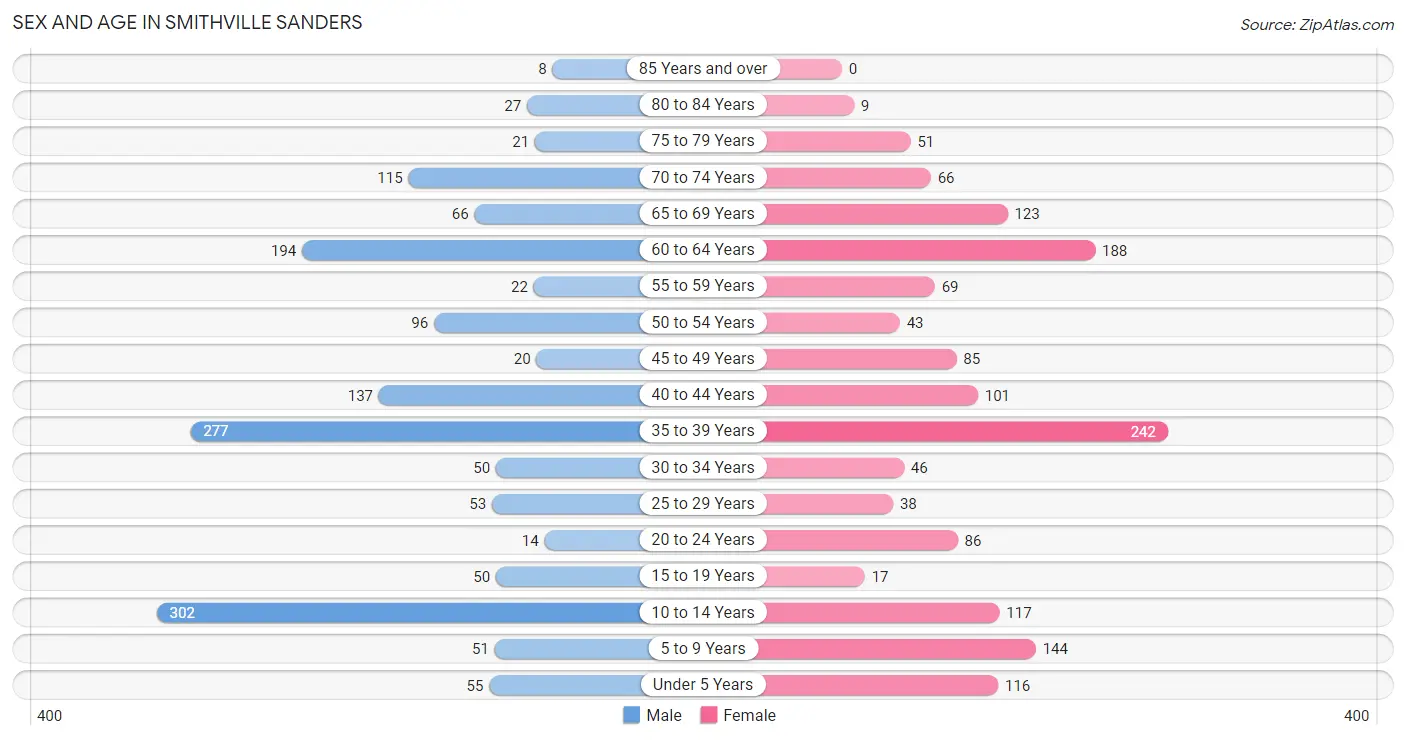
Sex and Age in Smithville Sanders
Sex and Age in Smithville Sanders
The most populous age groups in Smithville Sanders are 10 to 14 Years (302 | 19.4%) for men and 35 to 39 Years (242 | 15.7%) for women.
| Age Bracket | Male | Female |
| Under 5 Years | 55 (3.5%) | 116 (7.5%) |
| 5 to 9 Years | 51 (3.3%) | 144 (9.3%) |
| 10 to 14 Years | 302 (19.4%) | 117 (7.6%) |
| 15 to 19 Years | 50 (3.2%) | 17 (1.1%) |
| 20 to 24 Years | 14 (0.9%) | 86 (5.6%) |
| 25 to 29 Years | 53 (3.4%) | 38 (2.5%) |
| 30 to 34 Years | 50 (3.2%) | 46 (3.0%) |
| 35 to 39 Years | 277 (17.8%) | 242 (15.7%) |
| 40 to 44 Years | 137 (8.8%) | 101 (6.6%) |
| 45 to 49 Years | 20 (1.3%) | 85 (5.5%) |
| 50 to 54 Years | 96 (6.2%) | 43 (2.8%) |
| 55 to 59 Years | 22 (1.4%) | 69 (4.5%) |
| 60 to 64 Years | 194 (12.4%) | 188 (12.2%) |
| 65 to 69 Years | 66 (4.2%) | 123 (8.0%) |
| 70 to 74 Years | 115 (7.4%) | 66 (4.3%) |
| 75 to 79 Years | 21 (1.3%) | 51 (3.3%) |
| 80 to 84 Years | 27 (1.7%) | 9 (0.6%) |
| 85 Years and over | 8 (0.5%) | 0 (0.0%) |
| Total | 1,558 (100.0%) | 1,541 (100.0%) |
Families and Households in Smithville Sanders
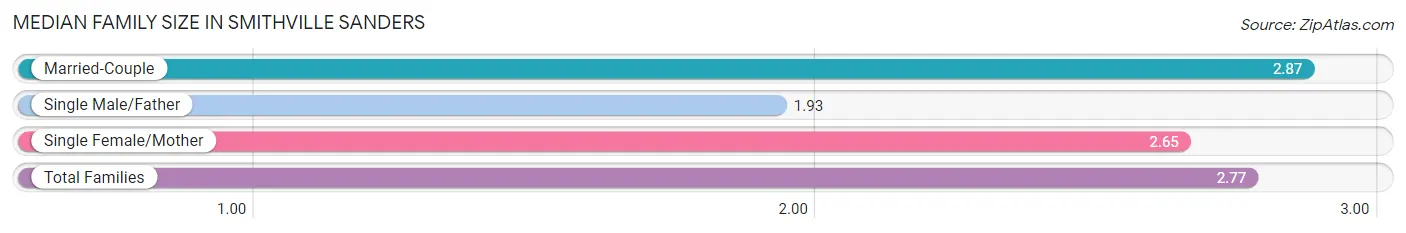
Median Family Size in Smithville Sanders
The median family size in Smithville Sanders is 2.77 persons per family, with married-couple families (616 | 72.4%) accounting for the largest median family size of 2.87 persons per family. On the other hand, single male/father families (46 | 5.4%) represent the smallest median family size with 1.93 persons per family.
| Family Type | # Families | Family Size |
| Married-Couple | 616 (72.4%) | 2.87 |
| Single Male/Father | 46 (5.4%) | 1.93 |
| Single Female/Mother | 189 (22.2%) | 2.65 |
| Total Families | 851 (100.0%) | 2.77 |
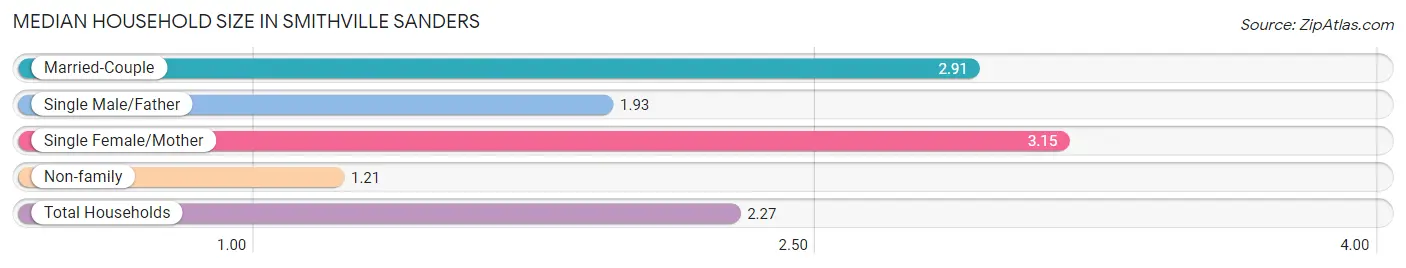
Median Household Size in Smithville Sanders
The median household size in Smithville Sanders is 2.27 persons per household, with single female/mother households (189 | 13.9%) accounting for the largest median household size of 3.15 persons per household. non-family households (513 | 37.6%) represent the smallest median household size with 1.21 persons per household.
| Household Type | # Households | Household Size |
| Married-Couple | 616 (45.2%) | 2.91 |
| Single Male/Father | 46 (3.4%) | 1.93 |
| Single Female/Mother | 189 (13.9%) | 3.15 |
| Non-family | 513 (37.6%) | 1.21 |
| Total Households | 1,364 (100.0%) | 2.27 |
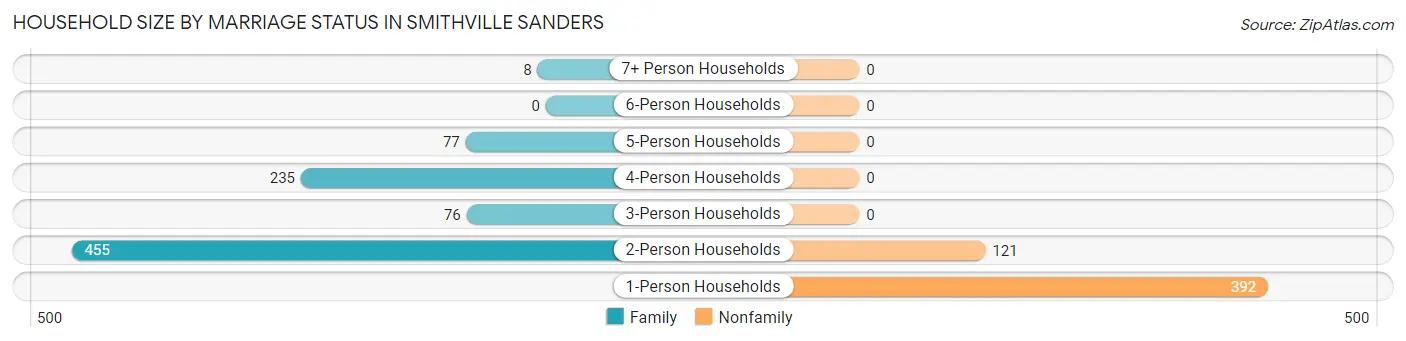
Household Size by Marriage Status in Smithville Sanders
Out of a total of 1,364 households in Smithville Sanders, 851 (62.4%) are family households, while 513 (37.6%) are nonfamily households. The most numerous type of family households are 2-person households, comprising 455, and the most common type of nonfamily households are 1-person households, comprising 392.
| Household Size | Family Households | Nonfamily Households |
| 1-Person Households | - | 392 (28.7%) |
| 2-Person Households | 455 (33.4%) | 121 (8.9%) |
| 3-Person Households | 76 (5.6%) | 0 (0.0%) |
| 4-Person Households | 235 (17.2%) | 0 (0.0%) |
| 5-Person Households | 77 (5.7%) | 0 (0.0%) |
| 6-Person Households | 0 (0.0%) | 0 (0.0%) |
| 7+ Person Households | 8 (0.6%) | 0 (0.0%) |
| Total | 851 (62.4%) | 513 (37.6%) |
Female Fertility in Smithville Sanders
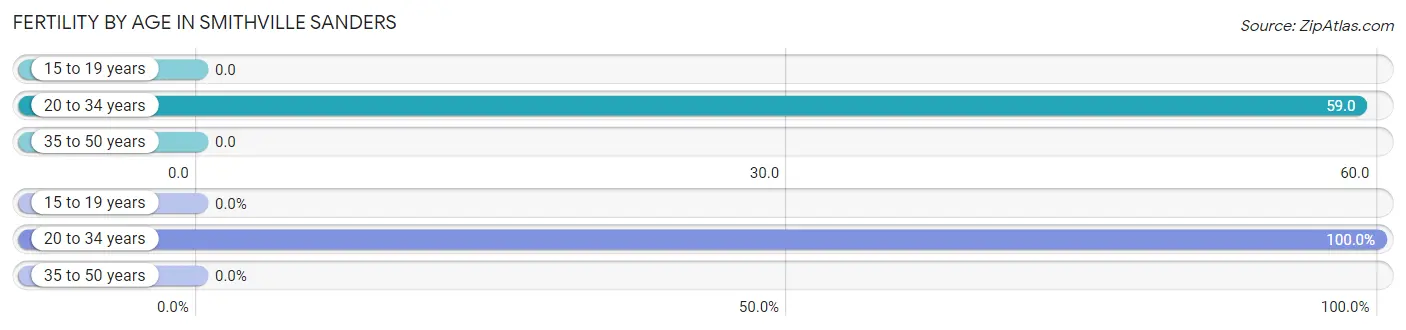
Fertility by Age in Smithville Sanders
Average fertility rate in Smithville Sanders is 16.0 births per 1,000 women. Women in the age bracket of 20 to 34 years have the highest fertility rate with 59.0 births per 1,000 women. Women in the age bracket of 20 to 34 years acount for 100.0% of all women with births.
| Age Bracket | Women with Births | Births / 1,000 Women |
| 15 to 19 years | 0 (0.0%) | 0.0 |
| 20 to 34 years | 10 (100.0%) | 59.0 |
| 35 to 50 years | 0 (0.0%) | 0.0 |
| Total | 10 (100.0%) | 16.0 |
Fertility by Age by Marriage Status in Smithville Sanders
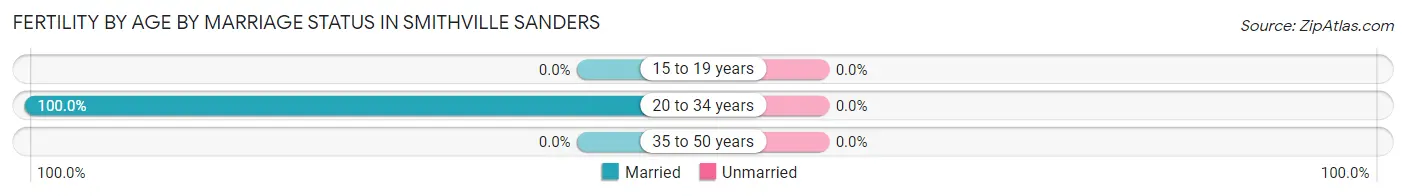
| Age Bracket | Married | Unmarried |
| 15 to 19 years | 0 (0.0%) | 0 (0.0%) |
| 20 to 34 years | 10 (100.0%) | 0 (0.0%) |
| 35 to 50 years | 0 (0.0%) | 0 (0.0%) |
| Total | 10 (100.0%) | 0 (0.0%) |
Fertility by Education in Smithville Sanders
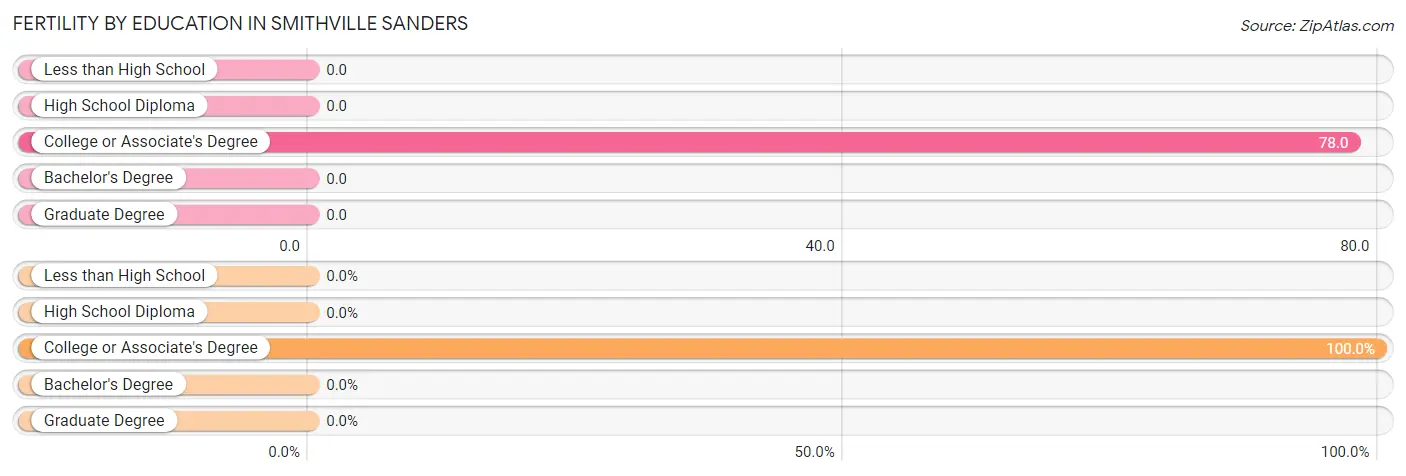
| Educational Attainment | Women with Births | Births / 1,000 Women |
| Less than High School | 0 (0.0%) | 0.0 |
| High School Diploma | 0 (0.0%) | 0.0 |
| College or Associate's Degree | 10 (100.0%) | 78.0 |
| Bachelor's Degree | 0 (0.0%) | 0.0 |
| Graduate Degree | 0 (0.0%) | 0.0 |
| Total | 10 (100.0%) | 16.0 |
Fertility by Education by Marriage Status in Smithville Sanders
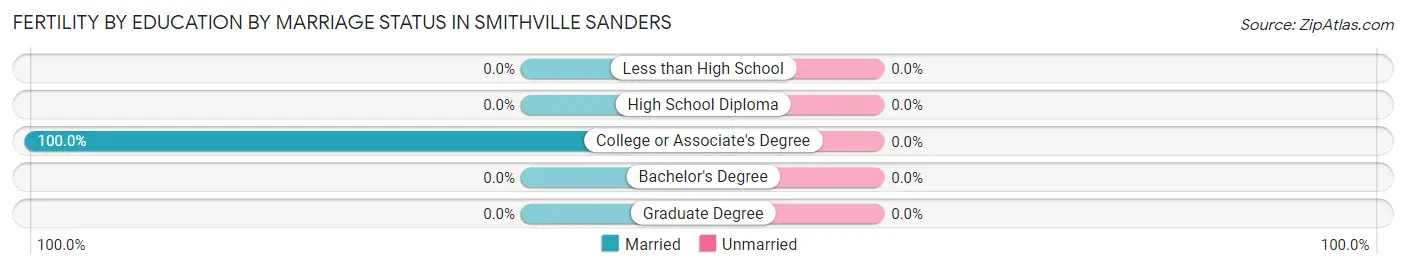
| Educational Attainment | Married | Unmarried |
| Less than High School | 0 (0.0%) | 0 (0.0%) |
| High School Diploma | 0 (0.0%) | 0 (0.0%) |
| College or Associate's Degree | 10 (100.0%) | 0 (0.0%) |
| Bachelor's Degree | 0 (0.0%) | 0 (0.0%) |
| Graduate Degree | 0 (0.0%) | 0 (0.0%) |
| Total | 10 (100.0%) | 0 (0.0%) |
Income in Smithville Sanders
Income Overview in Smithville Sanders
Per Capita Income in Smithville Sanders is $47,816, while median incomes of families and households are $111,671 and $67,091 respectively.
| Characteristic | Number | Measure |
| Per Capita Income | 3,099 | $47,816 |
| Median Family Income | 851 | $111,671 |
| Mean Family Income | 851 | $147,356 |
| Median Household Income | 1,364 | $67,091 |
| Mean Household Income | 1,364 | $110,180 |
| Income Deficit | 851 | $0 |
| Wage / Income Gap (%) | 3,099 | 2.51% |
| Wage / Income Gap ($) | 3,099 | 97.49¢ per $1 |
| Gini / Inequality Index | 3,099 | 0.46 |
Earnings by Sex in Smithville Sanders
Average Earnings in Smithville Sanders are $52,845, $52,542 for men and $53,897 for women, a difference of 2.5%.
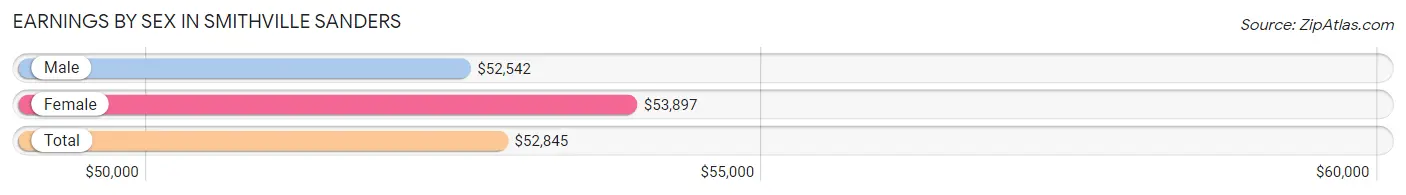
| Sex | Number | Average Earnings |
| Male | 842 (49.6%) | $52,542 |
| Female | 855 (50.4%) | $53,897 |
| Total | 1,697 (100.0%) | $52,845 |
Earnings by Sex by Income Bracket in Smithville Sanders
The most common earnings brackets in Smithville Sanders are $100,000+ for men (190 | 22.6%) and $75,000 to $99,999 for women (176 | 20.6%).
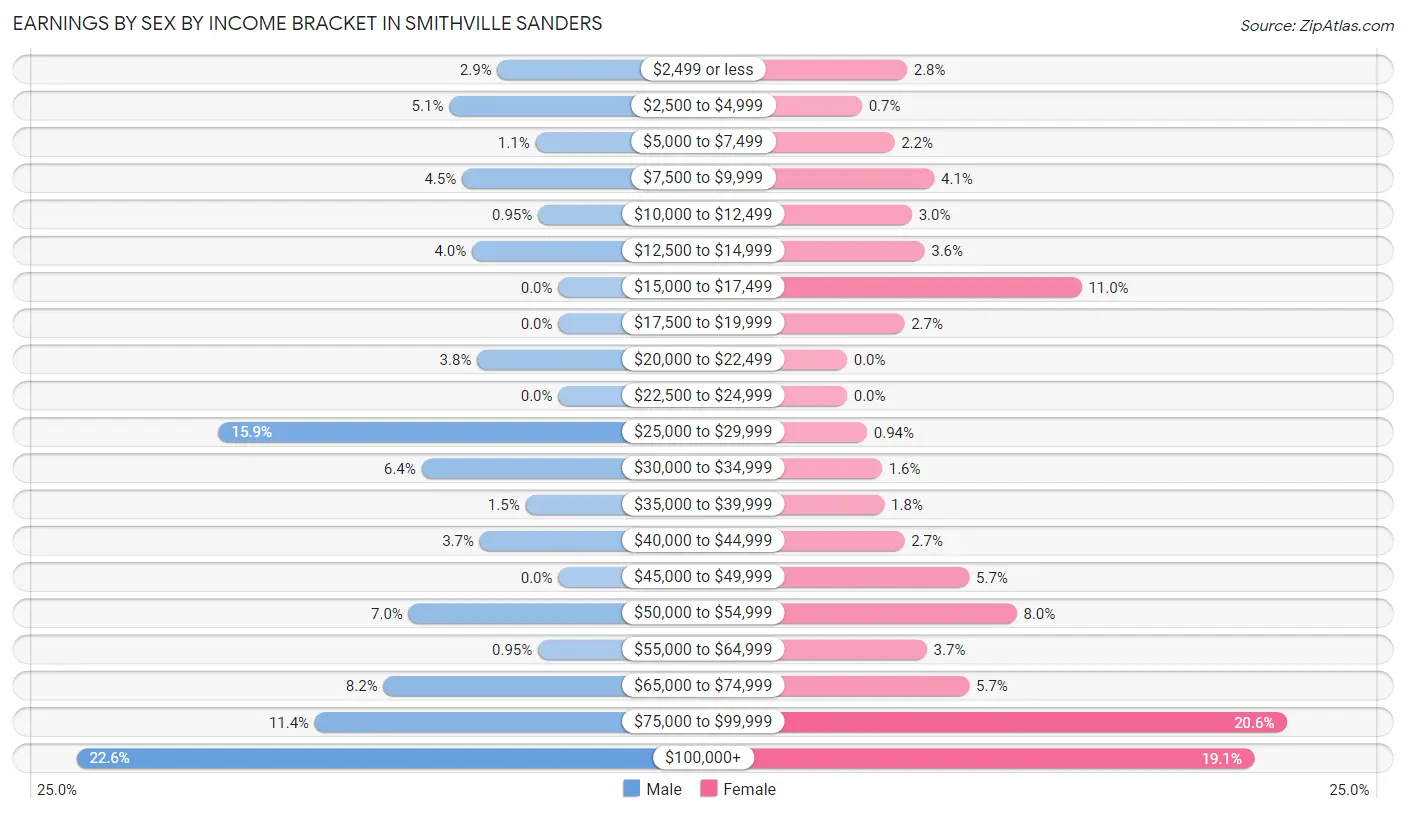
| Income | Male | Female |
| $2,499 or less | 24 (2.9%) | 24 (2.8%) |
| $2,500 to $4,999 | 43 (5.1%) | 6 (0.7%) |
| $5,000 to $7,499 | 9 (1.1%) | 19 (2.2%) |
| $7,500 to $9,999 | 38 (4.5%) | 35 (4.1%) |
| $10,000 to $12,499 | 8 (0.9%) | 26 (3.0%) |
| $12,500 to $14,999 | 34 (4.0%) | 31 (3.6%) |
| $15,000 to $17,499 | 0 (0.0%) | 94 (11.0%) |
| $17,500 to $19,999 | 0 (0.0%) | 23 (2.7%) |
| $20,000 to $22,499 | 32 (3.8%) | 0 (0.0%) |
| $22,500 to $24,999 | 0 (0.0%) | 0 (0.0%) |
| $25,000 to $29,999 | 134 (15.9%) | 8 (0.9%) |
| $30,000 to $34,999 | 54 (6.4%) | 14 (1.6%) |
| $35,000 to $39,999 | 13 (1.5%) | 15 (1.8%) |
| $40,000 to $44,999 | 31 (3.7%) | 23 (2.7%) |
| $45,000 to $49,999 | 0 (0.0%) | 49 (5.7%) |
| $50,000 to $54,999 | 59 (7.0%) | 68 (8.0%) |
| $55,000 to $64,999 | 8 (0.9%) | 32 (3.7%) |
| $65,000 to $74,999 | 69 (8.2%) | 49 (5.7%) |
| $75,000 to $99,999 | 96 (11.4%) | 176 (20.6%) |
| $100,000+ | 190 (22.6%) | 163 (19.1%) |
| Total | 842 (100.0%) | 855 (100.0%) |
Earnings by Sex by Educational Attainment in Smithville Sanders
Average earnings in Smithville Sanders are $53,559 for men and $62,009 for women, a difference of 13.6%. Men with an educational attainment of graduate degree enjoy the highest average annual earnings of $103,594, while those with high school diploma education earn the least with $32,059. Women with an educational attainment of bachelor's degree earn the most with the average annual earnings of $91,838, while those with college or associate's degree education have the smallest earnings of $51,500.
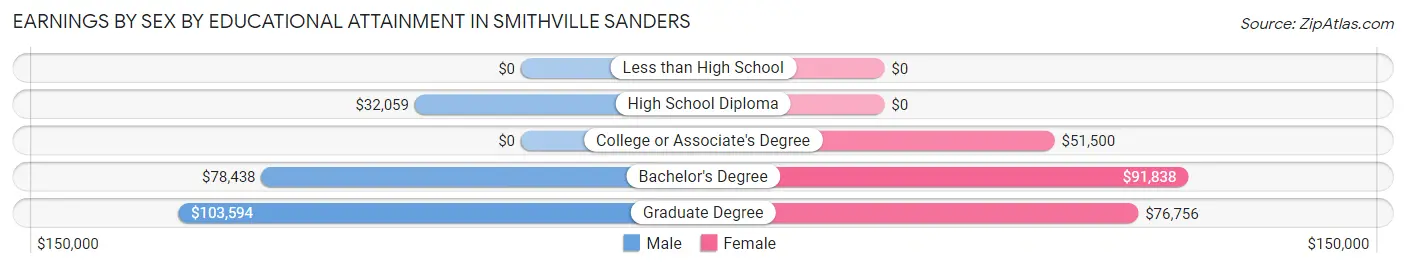
| Educational Attainment | Male Income | Female Income |
| Less than High School | - | - |
| High School Diploma | $32,059 | $0 |
| College or Associate's Degree | - | - |
| Bachelor's Degree | $78,438 | $91,838 |
| Graduate Degree | $103,594 | $76,756 |
| Total | $53,559 | $62,009 |
Family Income in Smithville Sanders
Family Income Brackets in Smithville Sanders
According to the Smithville Sanders family income data, there are 277 families falling into the $100,000 to $149,999 income range, which is the most common income bracket and makes up 32.6% of all families.
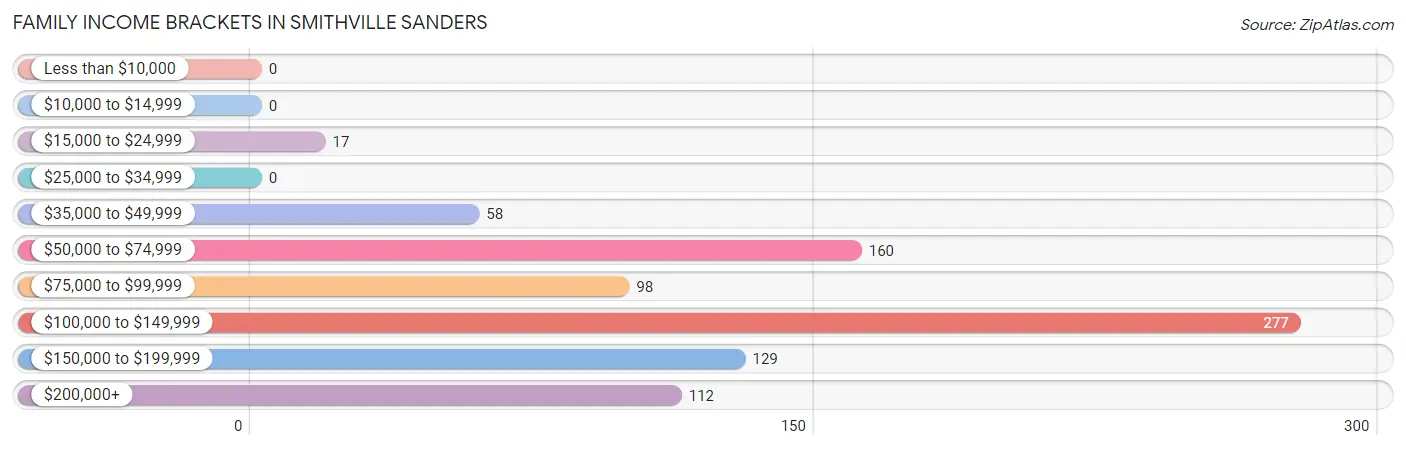
| Income Bracket | # Families | % Families |
| Less than $10,000 | 0 | 0.0% |
| $10,000 to $14,999 | 0 | 0.0% |
| $15,000 to $24,999 | 17 | 2.0% |
| $25,000 to $34,999 | 0 | 0.0% |
| $35,000 to $49,999 | 58 | 6.8% |
| $50,000 to $74,999 | 160 | 18.8% |
| $75,000 to $99,999 | 98 | 11.5% |
| $100,000 to $149,999 | 277 | 32.5% |
| $150,000 to $199,999 | 129 | 15.2% |
| $200,000+ | 112 | 13.2% |
Family Income by Famaliy Size in Smithville Sanders
5-person families (85 | 10.0%) account for the highest median family income in Smithville Sanders with $160,481 per family, while 2-person families (467 | 54.9%) have the highest median income of $40,938 per family member.
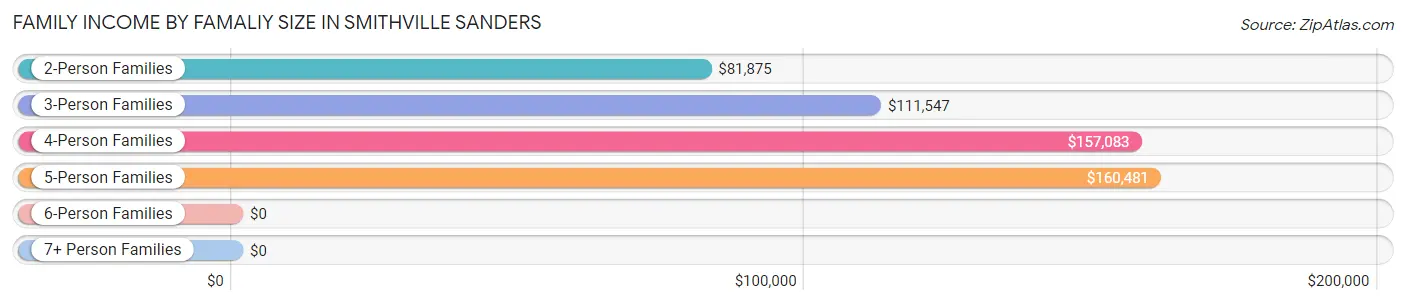
| Income Bracket | # Families | Median Income |
| 2-Person Families | 467 (54.9%) | $81,875 |
| 3-Person Families | 165 (19.4%) | $111,547 |
| 4-Person Families | 134 (15.8%) | $157,083 |
| 5-Person Families | 85 (10.0%) | $160,481 |
| 6-Person Families | 0 (0.0%) | $0 |
| 7+ Person Families | 0 (0.0%) | $0 |
| Total | 851 (100.0%) | $111,671 |
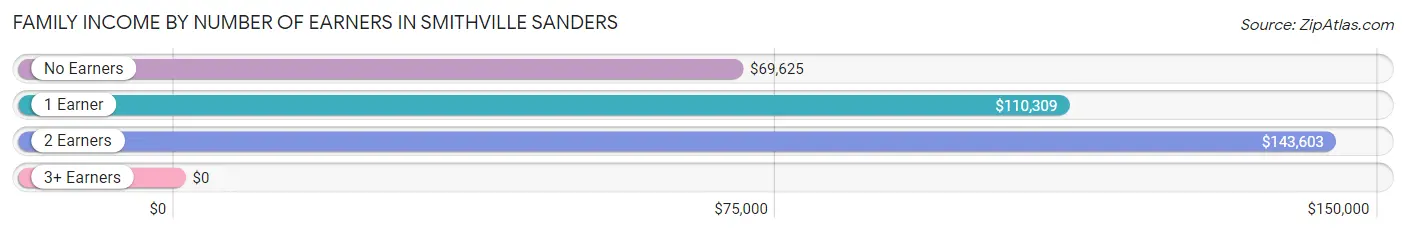
Family Income by Number of Earners in Smithville Sanders
| Number of Earners | # Families | Median Income |
| No Earners | 85 (10.0%) | $69,625 |
| 1 Earner | 313 (36.8%) | $110,309 |
| 2 Earners | 429 (50.4%) | $143,603 |
| 3+ Earners | 24 (2.8%) | $0 |
| Total | 851 (100.0%) | $111,671 |
Household Income in Smithville Sanders
Household Income Brackets in Smithville Sanders
With 331 households falling in the category, the $50,000 to $74,999 income range is the most frequent in Smithville Sanders, accounting for 24.3% of all households. In contrast, only 35 households (2.6%) fall into the $15,000 to $24,999 income bracket, making it the least populous group.

| Income Bracket | # Households | % Households |
| Less than $10,000 | 46 | 3.4% |
| $10,000 to $14,999 | 56 | 4.1% |
| $15,000 to $24,999 | 35 | 2.6% |
| $25,000 to $34,999 | 105 | 7.7% |
| $35,000 to $49,999 | 145 | 10.6% |
| $50,000 to $74,999 | 331 | 24.3% |
| $75,000 to $99,999 | 108 | 7.9% |
| $100,000 to $149,999 | 296 | 21.7% |
| $150,000 to $199,999 | 130 | 9.5% |
| $200,000+ | 112 | 8.2% |
Household Income by Householder Age in Smithville Sanders
The median household income in Smithville Sanders is $67,091, with the highest median household income of $120,938 found in the 25 to 44 years age bracket for the primary householder. A total of 551 households (40.4%) fall into this category. Meanwhile, the 15 to 24 years age bracket for the primary householder has the lowest median household income of $0, with 11 households (0.8%) in this group.

| Income Bracket | # Households | Median Income |
| 15 to 24 Years | 11 (0.8%) | $0 |
| 25 to 44 Years | 551 (40.4%) | $120,938 |
| 45 to 64 Years | 462 (33.9%) | $63,382 |
| 65+ Years | 340 (24.9%) | $57,411 |
| Total | 1,364 (100.0%) | $67,091 |
Poverty in Smithville Sanders
Income Below Poverty by Sex and Age in Smithville Sanders
With 2.8% poverty level for males and 6.2% for females among the residents of Smithville Sanders, 25 to 34 year old males and 18 to 24 year old females are the most vulnerable to poverty, with 22 males (21.4%) and 22 females (25.6%) in their respective age groups living below the poverty level.
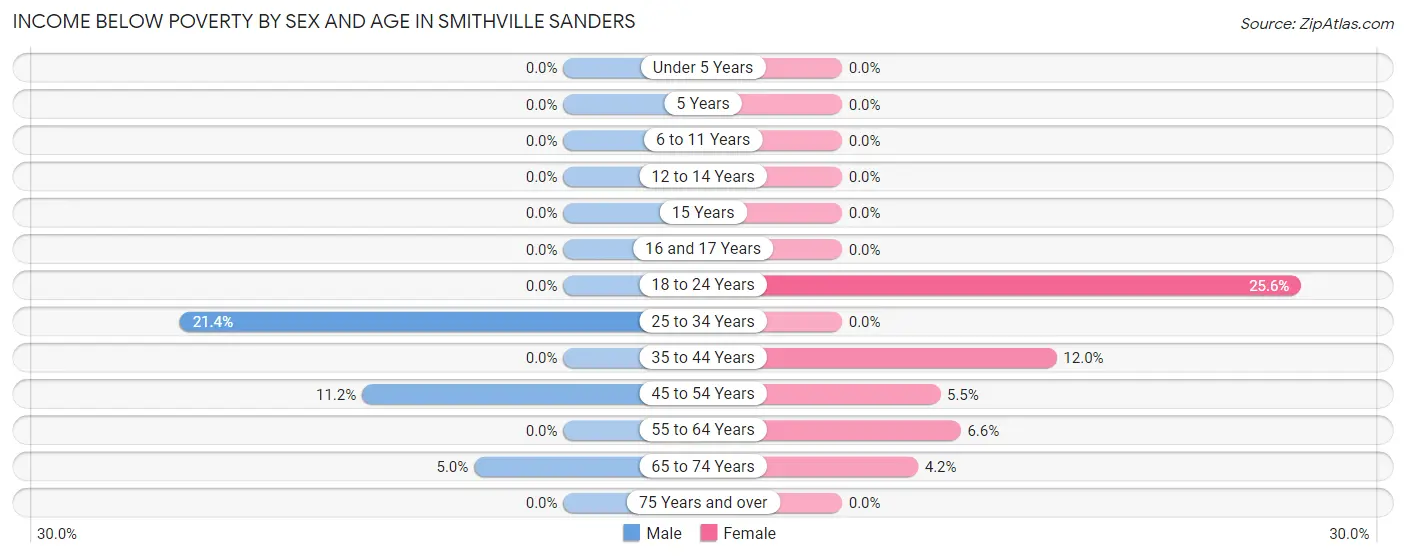
| Age Bracket | Male | Female |
| Under 5 Years | 0 (0.0%) | 0 (0.0%) |
| 5 Years | 0 (0.0%) | 0 (0.0%) |
| 6 to 11 Years | 0 (0.0%) | 0 (0.0%) |
| 12 to 14 Years | 0 (0.0%) | 0 (0.0%) |
| 15 Years | 0 (0.0%) | 0 (0.0%) |
| 16 and 17 Years | 0 (0.0%) | 0 (0.0%) |
| 18 to 24 Years | 0 (0.0%) | 22 (25.6%) |
| 25 to 34 Years | 22 (21.4%) | 0 (0.0%) |
| 35 to 44 Years | 0 (0.0%) | 41 (11.9%) |
| 45 to 54 Years | 13 (11.2%) | 7 (5.5%) |
| 55 to 64 Years | 0 (0.0%) | 17 (6.6%) |
| 65 to 74 Years | 9 (5.0%) | 8 (4.2%) |
| 75 Years and over | 0 (0.0%) | 0 (0.0%) |
| Total | 44 (2.8%) | 95 (6.2%) |
Income Above Poverty by Sex and Age in Smithville Sanders
According to the poverty statistics in Smithville Sanders, males aged under 5 years and females aged under 5 years are the age groups that are most secure financially, with 100.0% of males and 100.0% of females in these age groups living above the poverty line.
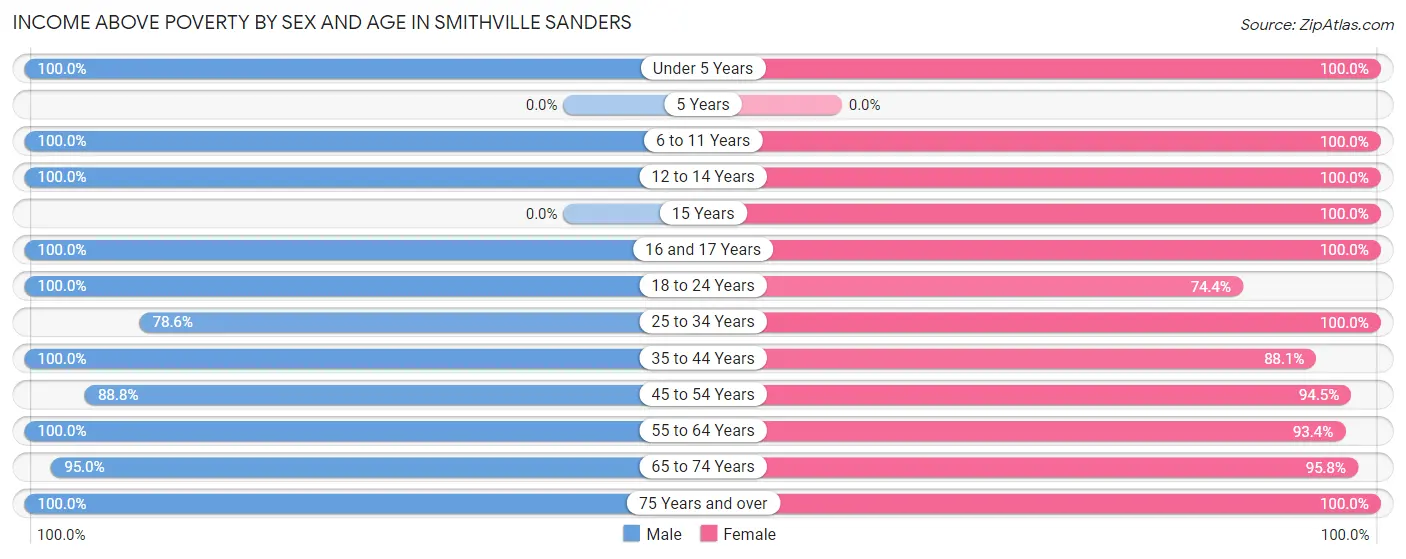
| Age Bracket | Male | Female |
| Under 5 Years | 48 (100.0%) | 97 (100.0%) |
| 5 Years | 0 (0.0%) | 0 (0.0%) |
| 6 to 11 Years | 197 (100.0%) | 186 (100.0%) |
| 12 to 14 Years | 156 (100.0%) | 75 (100.0%) |
| 15 Years | 0 (0.0%) | 12 (100.0%) |
| 16 and 17 Years | 34 (100.0%) | 5 (100.0%) |
| 18 to 24 Years | 30 (100.0%) | 64 (74.4%) |
| 25 to 34 Years | 81 (78.6%) | 84 (100.0%) |
| 35 to 44 Years | 414 (100.0%) | 302 (88.0%) |
| 45 to 54 Years | 103 (88.8%) | 121 (94.5%) |
| 55 to 64 Years | 216 (100.0%) | 240 (93.4%) |
| 65 to 74 Years | 172 (95.0%) | 181 (95.8%) |
| 75 Years and over | 56 (100.0%) | 60 (100.0%) |
| Total | 1,507 (97.2%) | 1,427 (93.8%) |
Income Below Poverty Among Married-Couple Families in Smithville Sanders
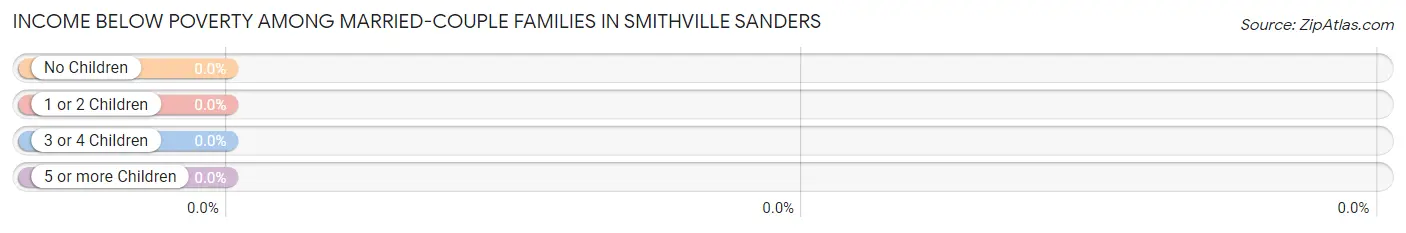
| Children | Above Poverty | Below Poverty |
| No Children | 383 (100.0%) | 0 (0.0%) |
| 1 or 2 Children | 148 (100.0%) | 0 (0.0%) |
| 3 or 4 Children | 85 (100.0%) | 0 (0.0%) |
| 5 or more Children | 0 (0.0%) | 0 (0.0%) |
| Total | 616 (100.0%) | 0 (0.0%) |
Income Below Poverty Among Single-Parent Households in Smithville Sanders
| Children | Single Father | Single Mother |
| No Children | 0 (0.0%) | 0 (0.0%) |
| 1 or 2 Children | 0 (0.0%) | 0 (0.0%) |
| 3 or 4 Children | 0 (0.0%) | 0 (0.0%) |
| 5 or more Children | 0 (0.0%) | 0 (0.0%) |
| Total | 0 (0.0%) | 0 (0.0%) |
Income Below Poverty Among Married-Couple vs Single-Parent Households in Smithville Sanders
| Children | Married-Couple Families | Single-Parent Households |
| No Children | 0 (0.0%) | 0 (0.0%) |
| 1 or 2 Children | 0 (0.0%) | 0 (0.0%) |
| 3 or 4 Children | 0 (0.0%) | 0 (0.0%) |
| 5 or more Children | 0 (0.0%) | 0 (0.0%) |
| Total | 0 (0.0%) | 0 (0.0%) |
Employment Characteristics in Smithville Sanders
Employment by Class of Employer in Smithville Sanders
Among the 1,506 employed individuals in Smithville Sanders, private company employees (828 | 55.0%), self-employed (not incorporated) (193 | 12.8%), and state government employees (170 | 11.3%) make up the most common classes of employment.
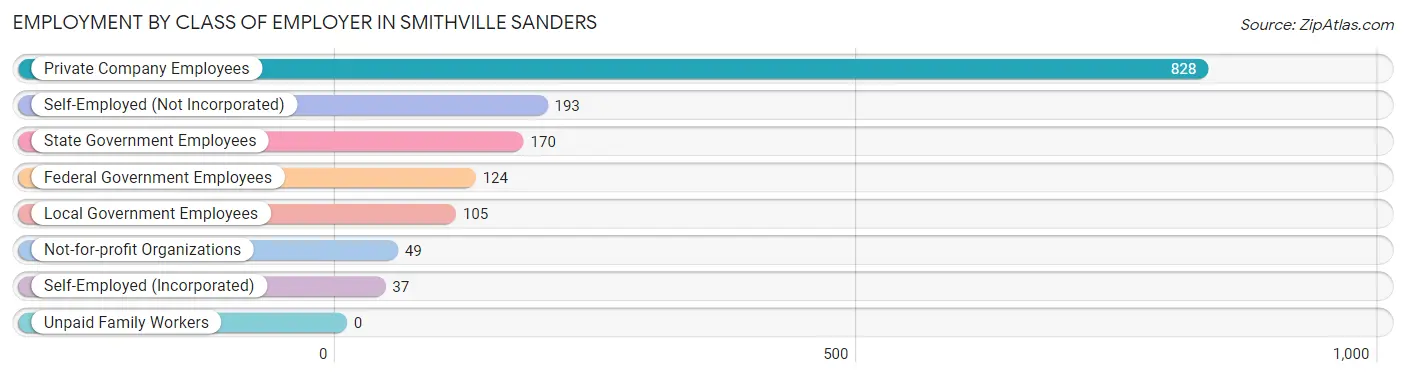
| Employer Class | # Employees | % Employees |
| Private Company Employees | 828 | 55.0% |
| Self-Employed (Incorporated) | 37 | 2.5% |
| Self-Employed (Not Incorporated) | 193 | 12.8% |
| Not-for-profit Organizations | 49 | 3.3% |
| Local Government Employees | 105 | 7.0% |
| State Government Employees | 170 | 11.3% |
| Federal Government Employees | 124 | 8.2% |
| Unpaid Family Workers | 0 | 0.0% |
| Total | 1,506 | 100.0% |
Employment Status by Age in Smithville Sanders
According to the labor force statistics for Smithville Sanders, out of the total population over 16 years of age (2,302), 71.0% or 1,634 individuals are in the labor force, with 4.2% or 69 of them unemployed. The age group with the highest labor force participation rate is 25 to 29 years, with 100.0% or 91 individuals in the labor force. Within the labor force, the 60 to 64 years age range has the highest percentage of unemployed individuals, with 7.5% or 19 of them being unemployed.
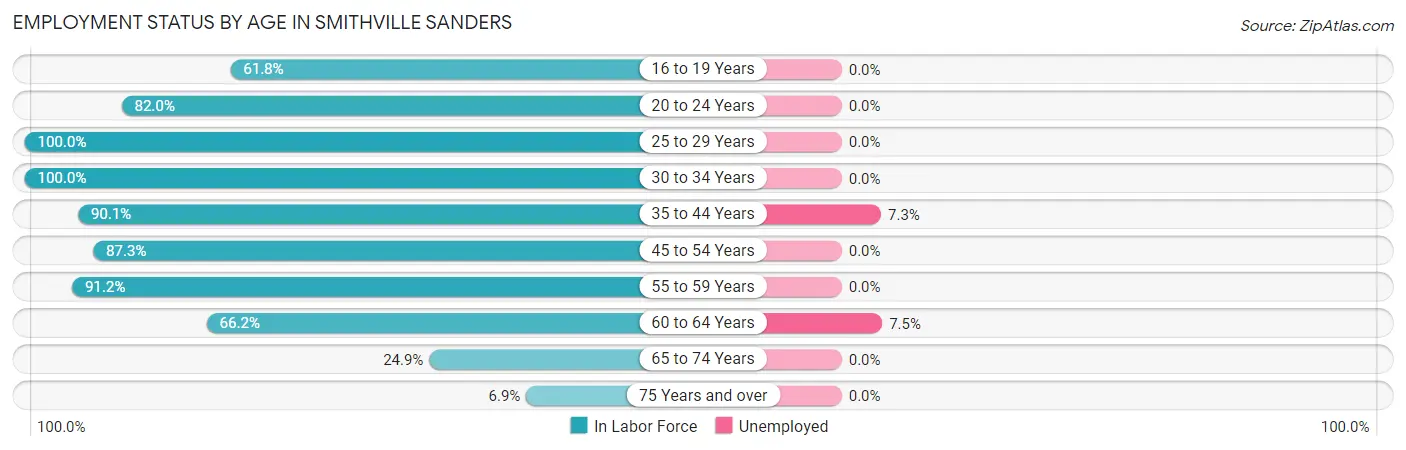
| Age Bracket | In Labor Force | Unemployed |
| 16 to 19 Years | 34 (61.8%) | 0 (0.0%) |
| 20 to 24 Years | 82 (82.0%) | 0 (0.0%) |
| 25 to 29 Years | 91 (100.0%) | 0 (0.0%) |
| 30 to 34 Years | 96 (100.0%) | 0 (0.0%) |
| 35 to 44 Years | 682 (90.1%) | 50 (7.3%) |
| 45 to 54 Years | 213 (87.3%) | 0 (0.0%) |
| 55 to 59 Years | 83 (91.2%) | 0 (0.0%) |
| 60 to 64 Years | 253 (66.2%) | 19 (7.5%) |
| 65 to 74 Years | 92 (24.9%) | 0 (0.0%) |
| 75 Years and over | 8 (6.9%) | 0 (0.0%) |
| Total | 1,634 (71.0%) | 69 (4.2%) |
Employment Status by Educational Attainment in Smithville Sanders
According to labor force statistics for Smithville Sanders, 85.4% of individuals (1,418) out of the total population between 25 and 64 years of age (1,661) are in the labor force, with 4.9% or 69 of them being unemployed. The group with the highest labor force participation rate are those with the educational attainment of bachelor's degree or higher, with 93.9% or 786 individuals in the labor force. Within the labor force, individuals with college / associate degree education have the highest percentage of unemployment, with 8.8% or 35 of them being unemployed.
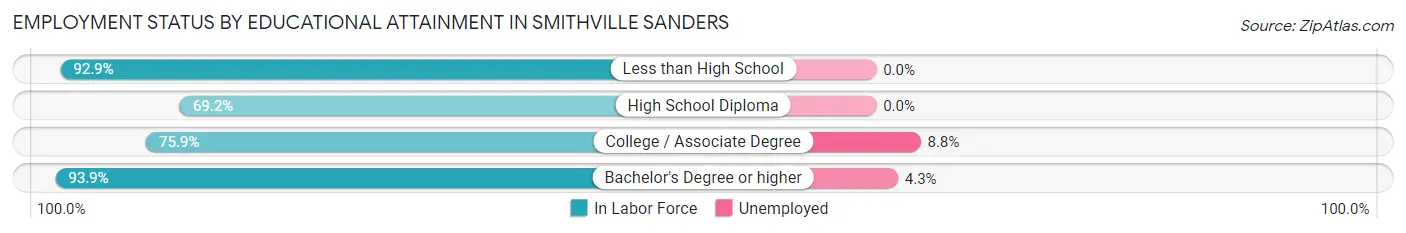
| Educational Attainment | In Labor Force | Unemployed |
| Less than High School | 105 (92.9%) | 0 (0.0%) |
| High School Diploma | 128 (69.2%) | 0 (0.0%) |
| College / Associate Degree | 399 (75.9%) | 46 (8.8%) |
| Bachelor's Degree or higher | 786 (93.9%) | 36 (4.3%) |
| Total | 1,418 (85.4%) | 81 (4.9%) |
Employment Occupations by Sex in Smithville Sanders
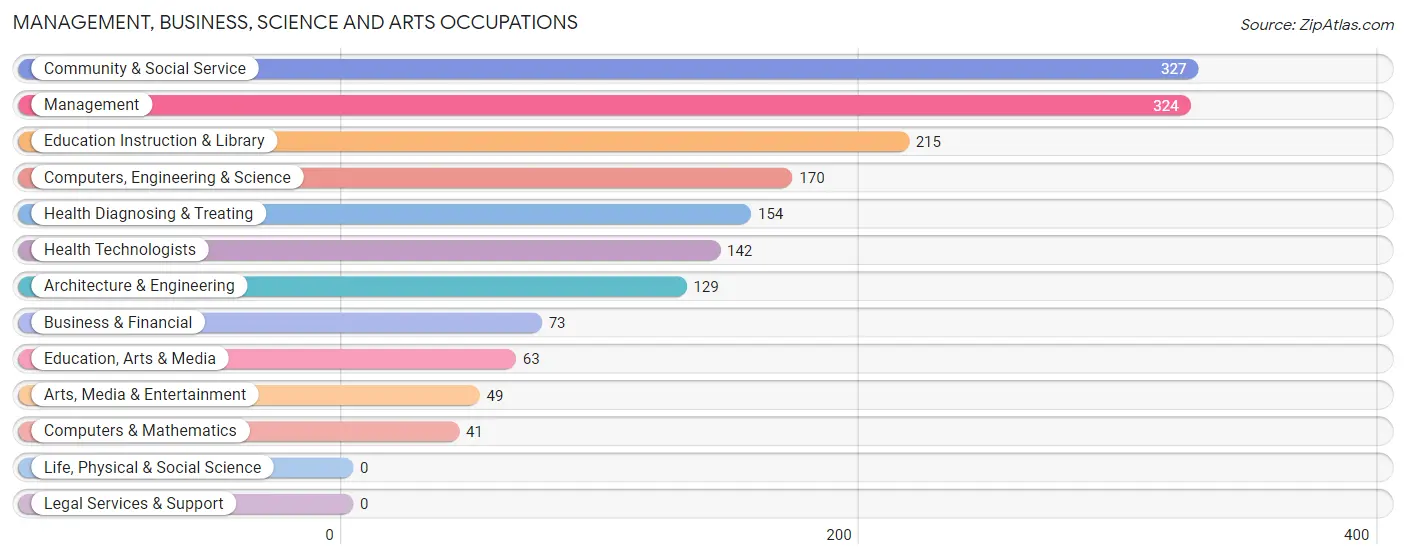
Management, Business, Science and Arts Occupations
The most common Management, Business, Science and Arts occupations in Smithville Sanders are Community & Social Service (327 | 20.9%), Management (324 | 20.7%), Education Instruction & Library (215 | 13.7%), Computers, Engineering & Science (170 | 10.9%), and Health Diagnosing & Treating (154 | 9.8%).
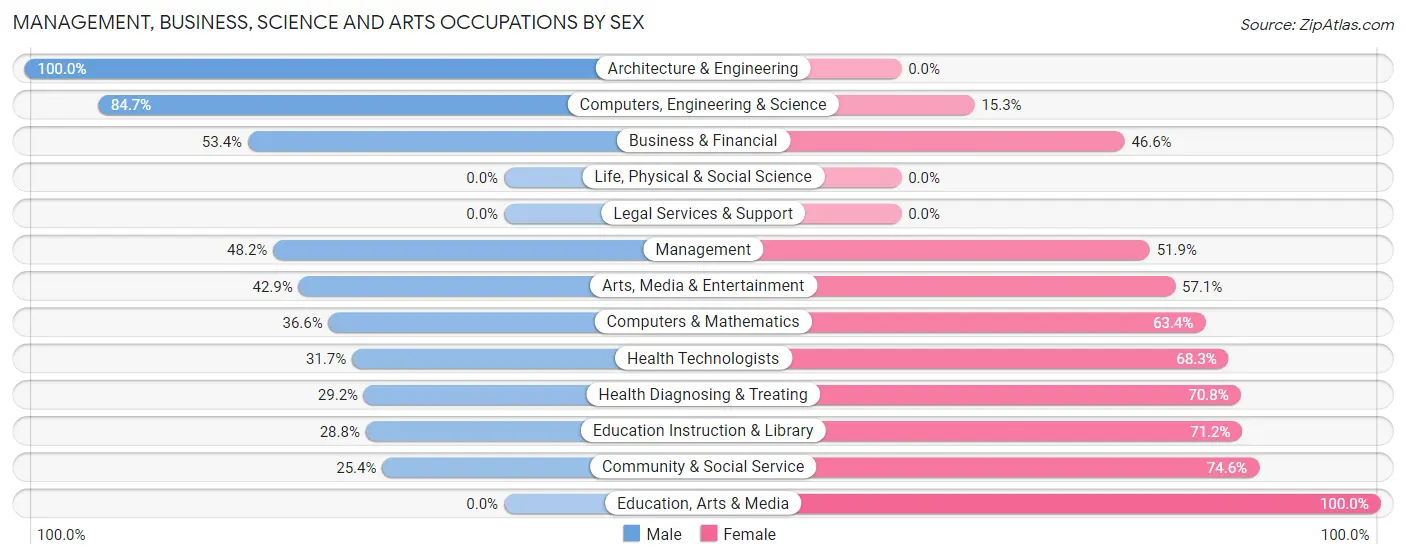
Management, Business, Science and Arts Occupations by Sex
Within the Management, Business, Science and Arts occupations in Smithville Sanders, the most male-oriented occupations are Architecture & Engineering (100.0%), Computers, Engineering & Science (84.7%), and Business & Financial (53.4%), while the most female-oriented occupations are Education, Arts & Media (100.0%), Community & Social Service (74.6%), and Education Instruction & Library (71.2%).
| Occupation | Male | Female |
| Management | 156 (48.1%) | 168 (51.8%) |
| Business & Financial | 39 (53.4%) | 34 (46.6%) |
| Computers, Engineering & Science | 144 (84.7%) | 26 (15.3%) |
| Computers & Mathematics | 15 (36.6%) | 26 (63.4%) |
| Architecture & Engineering | 129 (100.0%) | 0 (0.0%) |
| Life, Physical & Social Science | 0 (0.0%) | 0 (0.0%) |
| Community & Social Service | 83 (25.4%) | 244 (74.6%) |
| Education, Arts & Media | 0 (0.0%) | 63 (100.0%) |
| Legal Services & Support | 0 (0.0%) | 0 (0.0%) |
| Education Instruction & Library | 62 (28.8%) | 153 (71.2%) |
| Arts, Media & Entertainment | 21 (42.9%) | 28 (57.1%) |
| Health Diagnosing & Treating | 45 (29.2%) | 109 (70.8%) |
| Health Technologists | 45 (31.7%) | 97 (68.3%) |
| Total (Category) | 467 (44.6%) | 581 (55.4%) |
| Total (Overall) | 777 (49.6%) | 788 (50.3%) |
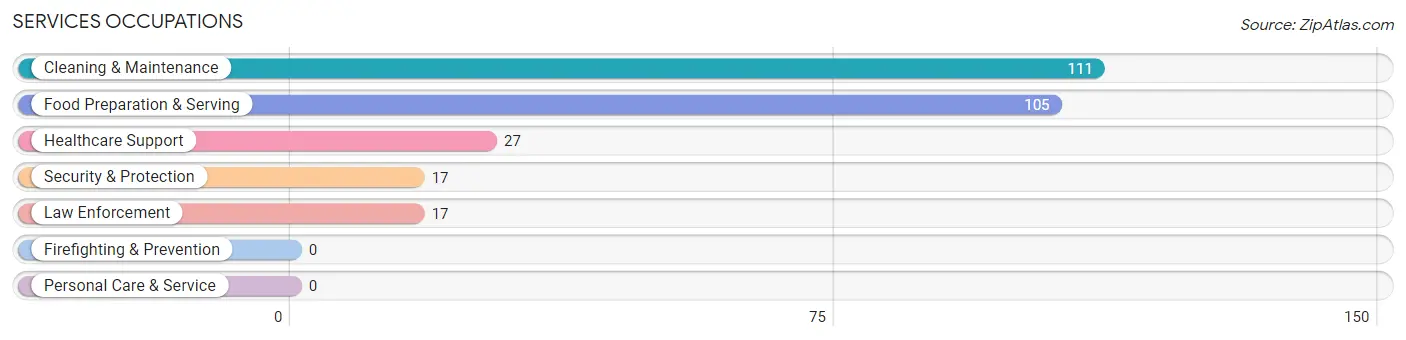
Services Occupations
The most common Services occupations in Smithville Sanders are Cleaning & Maintenance (111 | 7.1%), Food Preparation & Serving (105 | 6.7%), Healthcare Support (27 | 1.7%), Security & Protection (17 | 1.1%), and Law Enforcement (17 | 1.1%).
Services Occupations by Sex
Within the Services occupations in Smithville Sanders, the most male-oriented occupations are Security & Protection (100.0%), Law Enforcement (100.0%), and Cleaning & Maintenance (100.0%), while the most female-oriented occupations are Food Preparation & Serving (67.6%), and Healthcare Support (66.7%).
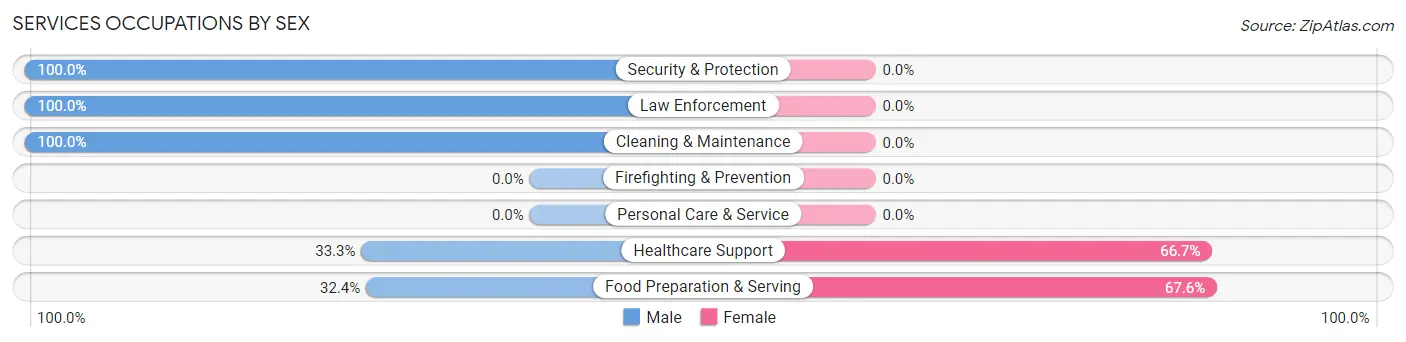
| Occupation | Male | Female |
| Healthcare Support | 9 (33.3%) | 18 (66.7%) |
| Security & Protection | 17 (100.0%) | 0 (0.0%) |
| Firefighting & Prevention | 0 (0.0%) | 0 (0.0%) |
| Law Enforcement | 17 (100.0%) | 0 (0.0%) |
| Food Preparation & Serving | 34 (32.4%) | 71 (67.6%) |
| Cleaning & Maintenance | 111 (100.0%) | 0 (0.0%) |
| Personal Care & Service | 0 (0.0%) | 0 (0.0%) |
| Total (Category) | 171 (65.8%) | 89 (34.2%) |
| Total (Overall) | 777 (49.6%) | 788 (50.3%) |
Sales and Office Occupations
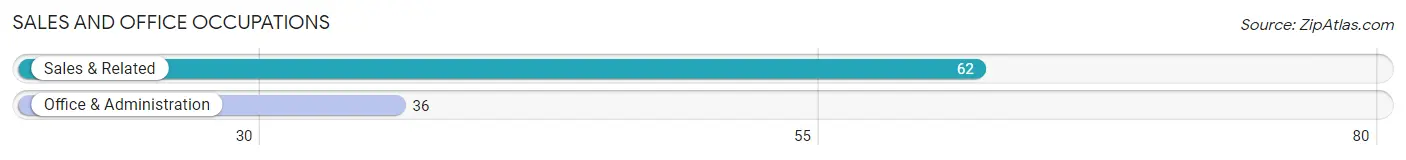
The most common Sales and Office occupations in Smithville Sanders are Sales & Related (62 | 4.0%), and Office & Administration (36 | 2.3%).
Sales and Office Occupations by Sex
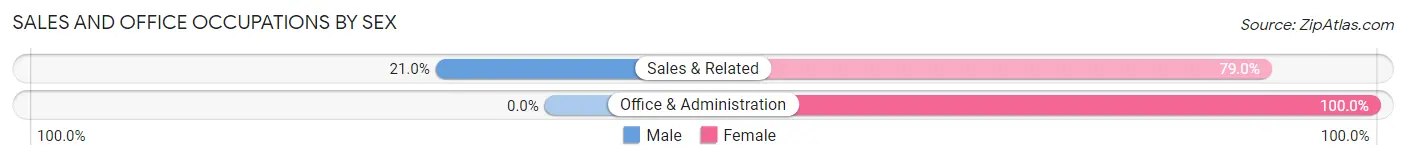
| Occupation | Male | Female |
| Sales & Related | 13 (21.0%) | 49 (79.0%) |
| Office & Administration | 0 (0.0%) | 36 (100.0%) |
| Total (Category) | 13 (13.3%) | 85 (86.7%) |
| Total (Overall) | 777 (49.6%) | 788 (50.3%) |
Natural Resources, Construction and Maintenance Occupations
The most common Natural Resources, Construction and Maintenance occupations in Smithville Sanders are Construction & Extraction (27 | 1.7%), and Installation, Maintenance & Repair (4 | 0.3%).
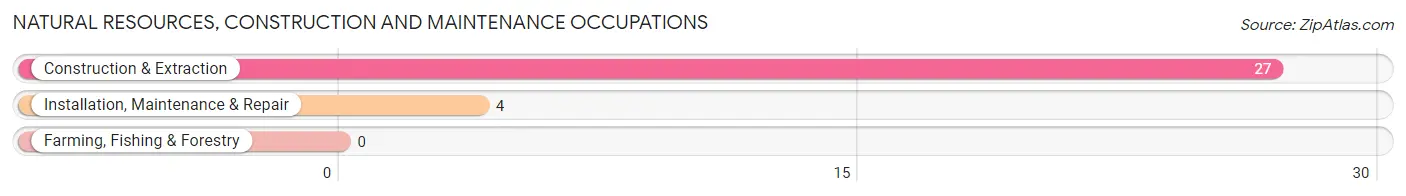
Natural Resources, Construction and Maintenance Occupations by Sex
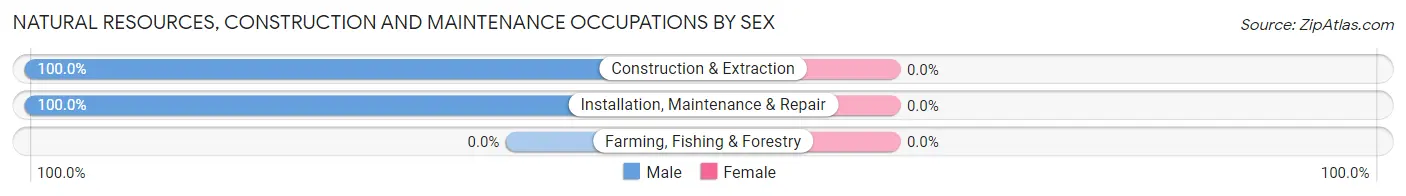
| Occupation | Male | Female |
| Farming, Fishing & Forestry | 0 (0.0%) | 0 (0.0%) |
| Construction & Extraction | 27 (100.0%) | 0 (0.0%) |
| Installation, Maintenance & Repair | 4 (100.0%) | 0 (0.0%) |
| Total (Category) | 31 (100.0%) | 0 (0.0%) |
| Total (Overall) | 777 (49.6%) | 788 (50.3%) |
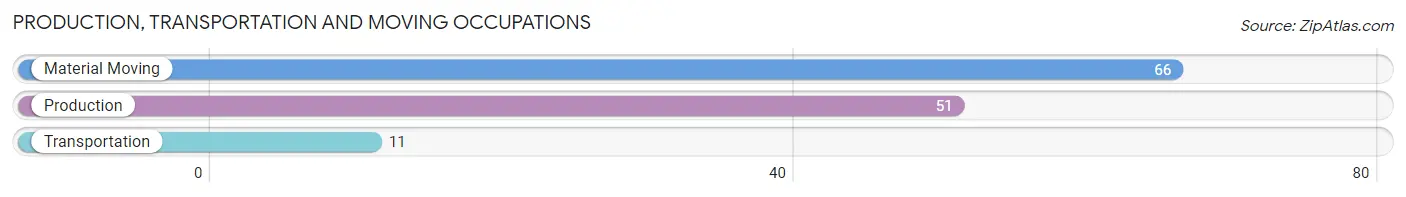
Production, Transportation and Moving Occupations
The most common Production, Transportation and Moving occupations in Smithville Sanders are Material Moving (66 | 4.2%), Production (51 | 3.3%), and Transportation (11 | 0.7%).
Production, Transportation and Moving Occupations by Sex
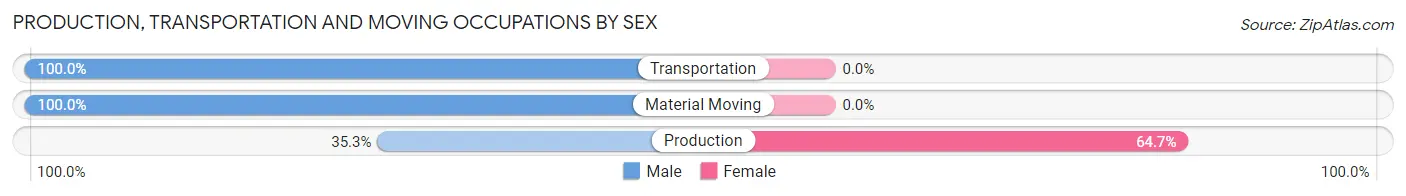
| Occupation | Male | Female |
| Production | 18 (35.3%) | 33 (64.7%) |
| Transportation | 11 (100.0%) | 0 (0.0%) |
| Material Moving | 66 (100.0%) | 0 (0.0%) |
| Total (Category) | 95 (74.2%) | 33 (25.8%) |
| Total (Overall) | 777 (49.6%) | 788 (50.3%) |
Employment Industries by Sex in Smithville Sanders
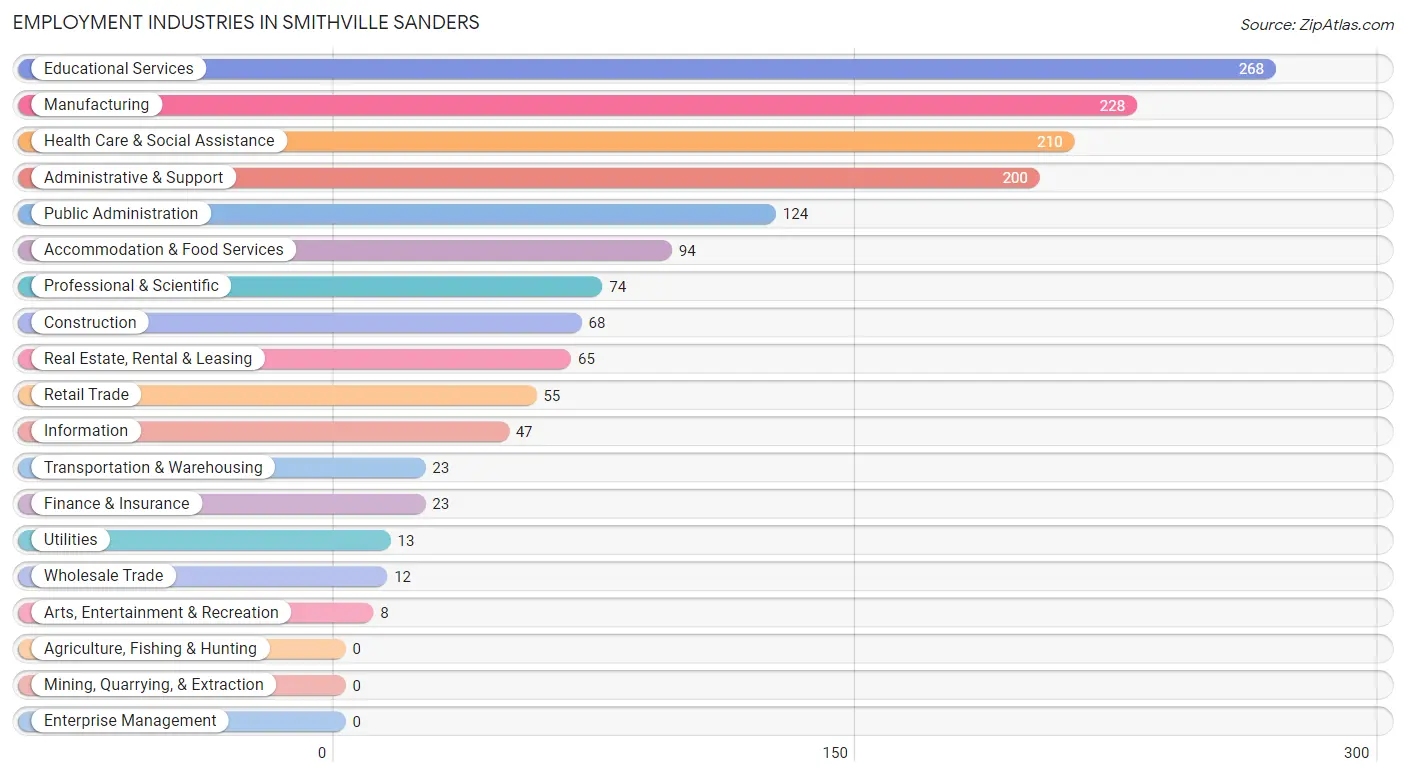
Employment Industries in Smithville Sanders
The major employment industries in Smithville Sanders include Educational Services (268 | 17.1%), Manufacturing (228 | 14.6%), Health Care & Social Assistance (210 | 13.4%), Administrative & Support (200 | 12.8%), and Public Administration (124 | 7.9%).
Employment Industries by Sex in Smithville Sanders
The Smithville Sanders industries that see more men than women are Transportation & Warehousing (100.0%), Utilities (100.0%), and Arts, Entertainment & Recreation (100.0%), whereas the industries that tend to have a higher number of women are Wholesale Trade (100.0%), Information (100.0%), and Educational Services (75.4%).

| Industry | Male | Female |
| Agriculture, Fishing & Hunting | 0 (0.0%) | 0 (0.0%) |
| Mining, Quarrying, & Extraction | 0 (0.0%) | 0 (0.0%) |
| Construction | 42 (61.8%) | 26 (38.2%) |
| Manufacturing | 83 (36.4%) | 145 (63.6%) |
| Wholesale Trade | 0 (0.0%) | 12 (100.0%) |
| Retail Trade | 48 (87.3%) | 7 (12.7%) |
| Transportation & Warehousing | 23 (100.0%) | 0 (0.0%) |
| Utilities | 13 (100.0%) | 0 (0.0%) |
| Information | 0 (0.0%) | 47 (100.0%) |
| Finance & Insurance | 13 (56.5%) | 10 (43.5%) |
| Real Estate, Rental & Leasing | 46 (70.8%) | 19 (29.2%) |
| Professional & Scientific | 69 (93.2%) | 5 (6.8%) |
| Enterprise Management | 0 (0.0%) | 0 (0.0%) |
| Administrative & Support | 167 (83.5%) | 33 (16.5%) |
| Educational Services | 66 (24.6%) | 202 (75.4%) |
| Health Care & Social Assistance | 70 (33.3%) | 140 (66.7%) |
| Arts, Entertainment & Recreation | 8 (100.0%) | 0 (0.0%) |
| Accommodation & Food Services | 52 (55.3%) | 42 (44.7%) |
| Public Administration | 67 (54.0%) | 57 (46.0%) |
| Total | 777 (49.6%) | 788 (50.3%) |
Education in Smithville Sanders
School Enrollment in Smithville Sanders
The most common levels of schooling among the 855 students in Smithville Sanders are elementary school (281 | 32.9%), middle school (250 | 29.2%), and college / undergraduate (129 | 15.1%).
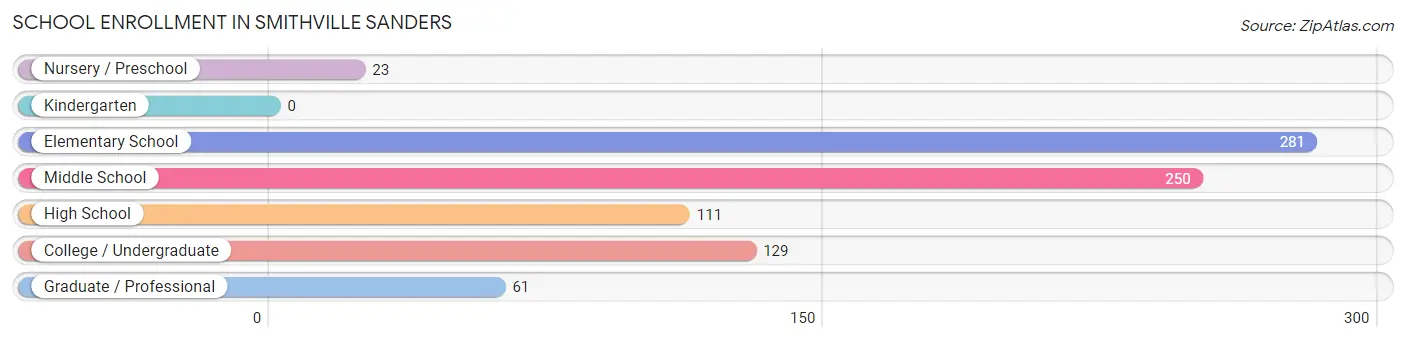
| School Level | # Students | % Students |
| Nursery / Preschool | 23 | 2.7% |
| Kindergarten | 0 | 0.0% |
| Elementary School | 281 | 32.9% |
| Middle School | 250 | 29.2% |
| High School | 111 | 13.0% |
| College / Undergraduate | 129 | 15.1% |
| Graduate / Professional | 61 | 7.1% |
| Total | 855 | 100.0% |
School Enrollment by Age by Funding Source in Smithville Sanders
Out of a total of 855 students who are enrolled in schools in Smithville Sanders, 23 (2.7%) attend a private institution, while the remaining 832 (97.3%) are enrolled in public schools. The age group of 18 to 19 year olds has the highest likelihood of being enrolled in private schools, with 16 (100.0% in the age bracket) enrolled. Conversely, the age group of 3 to 4 year olds has the lowest likelihood of being enrolled in a private school, with 16 (100.0% in the age bracket) attending a public institution.
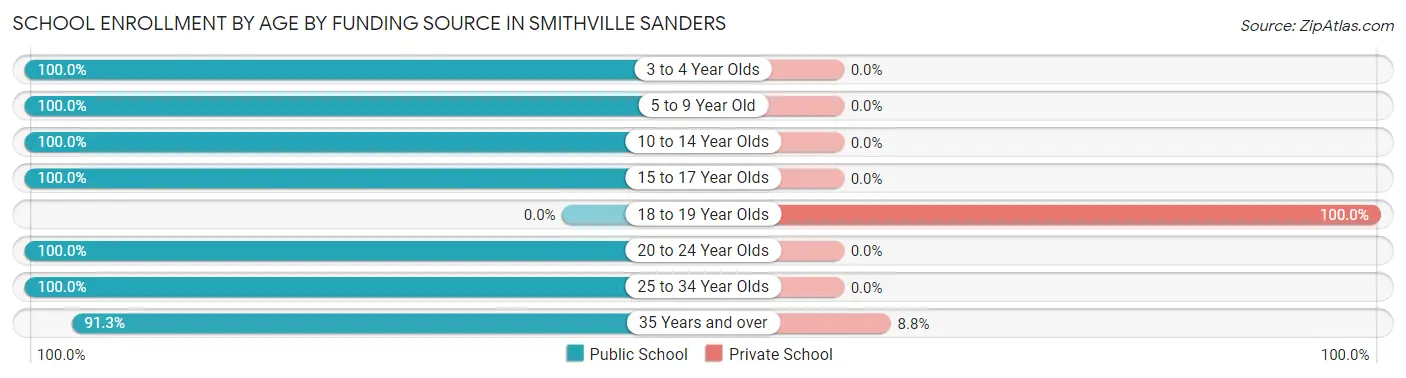
| Age Bracket | Public School | Private School |
| 3 to 4 Year Olds | 16 (100.0%) | 0 (0.0%) |
| 5 to 9 Year Old | 163 (100.0%) | 0 (0.0%) |
| 10 to 14 Year Olds | 419 (100.0%) | 0 (0.0%) |
| 15 to 17 Year Olds | 51 (100.0%) | 0 (0.0%) |
| 18 to 19 Year Olds | 0 (0.0%) | 16 (100.0%) |
| 20 to 24 Year Olds | 71 (100.0%) | 0 (0.0%) |
| 25 to 34 Year Olds | 39 (100.0%) | 0 (0.0%) |
| 35 Years and over | 73 (91.2%) | 7 (8.7%) |
| Total | 832 (97.3%) | 23 (2.7%) |
Educational Attainment by Field of Study in Smithville Sanders
Communications (179 | 15.1%), education (166 | 14.0%), science & technology (153 | 12.9%), engineering (113 | 9.6%), and social sciences (111 | 9.4%) are the most common fields of study among 1,182 individuals in Smithville Sanders who have obtained a bachelor's degree or higher.
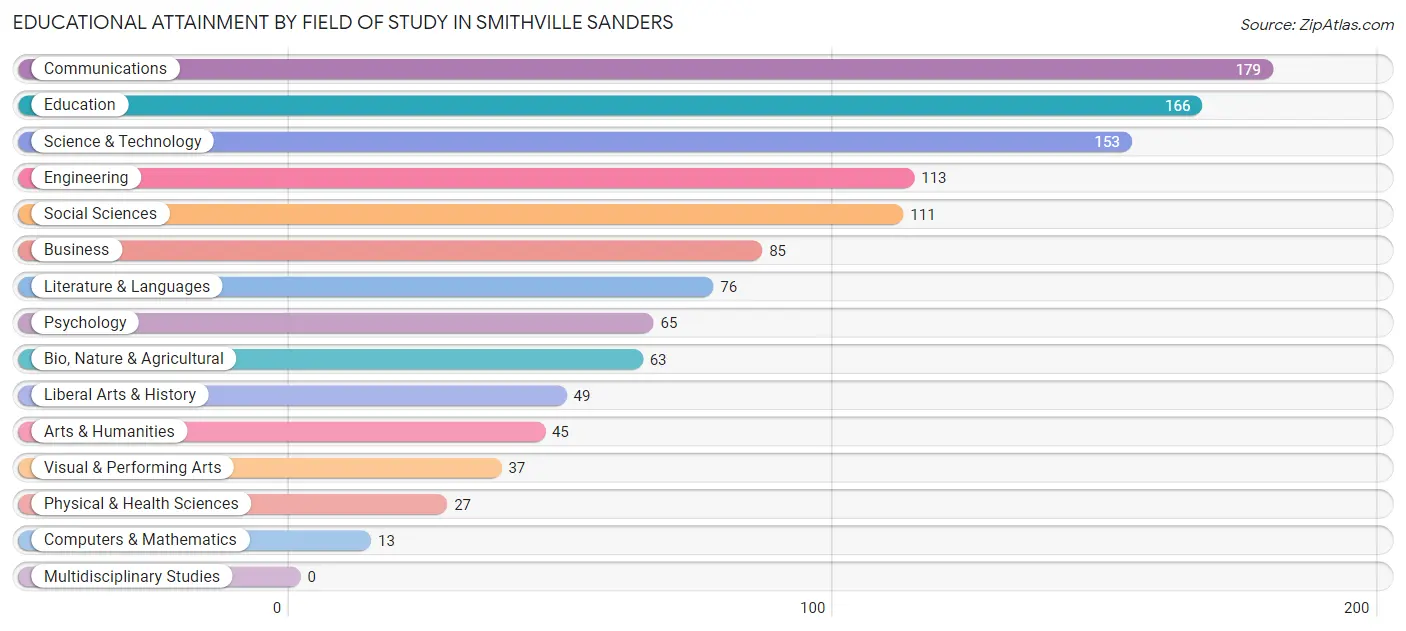
| Field of Study | # Graduates | % Graduates |
| Computers & Mathematics | 13 | 1.1% |
| Bio, Nature & Agricultural | 63 | 5.3% |
| Physical & Health Sciences | 27 | 2.3% |
| Psychology | 65 | 5.5% |
| Social Sciences | 111 | 9.4% |
| Engineering | 113 | 9.6% |
| Multidisciplinary Studies | 0 | 0.0% |
| Science & Technology | 153 | 12.9% |
| Business | 85 | 7.2% |
| Education | 166 | 14.0% |
| Literature & Languages | 76 | 6.4% |
| Liberal Arts & History | 49 | 4.2% |
| Visual & Performing Arts | 37 | 3.1% |
| Communications | 179 | 15.1% |
| Arts & Humanities | 45 | 3.8% |
| Total | 1,182 | 100.0% |
Transportation & Commute in Smithville Sanders
Vehicle Availability by Sex in Smithville Sanders
The most prevalent vehicle ownership categories in Smithville Sanders are males with 2 vehicles (363, accounting for 50.6%) and females with 2 vehicles (416, making up 46.1%).

| Vehicles Available | Male | Female |
| No Vehicle | 20 (2.8%) | 0 (0.0%) |
| 1 Vehicle | 63 (8.8%) | 145 (18.4%) |
| 2 Vehicles | 363 (50.6%) | 416 (52.8%) |
| 3 Vehicles | 202 (28.1%) | 192 (24.4%) |
| 4 Vehicles | 70 (9.8%) | 35 (4.4%) |
| 5 or more Vehicles | 0 (0.0%) | 0 (0.0%) |
| Total | 718 (100.0%) | 788 (100.0%) |
Commute Time in Smithville Sanders
The most frequently occuring commute durations in Smithville Sanders are 15 to 19 minutes (361 commuters, 26.1%), 20 to 24 minutes (269 commuters, 19.5%), and 25 to 29 minutes (255 commuters, 18.4%).
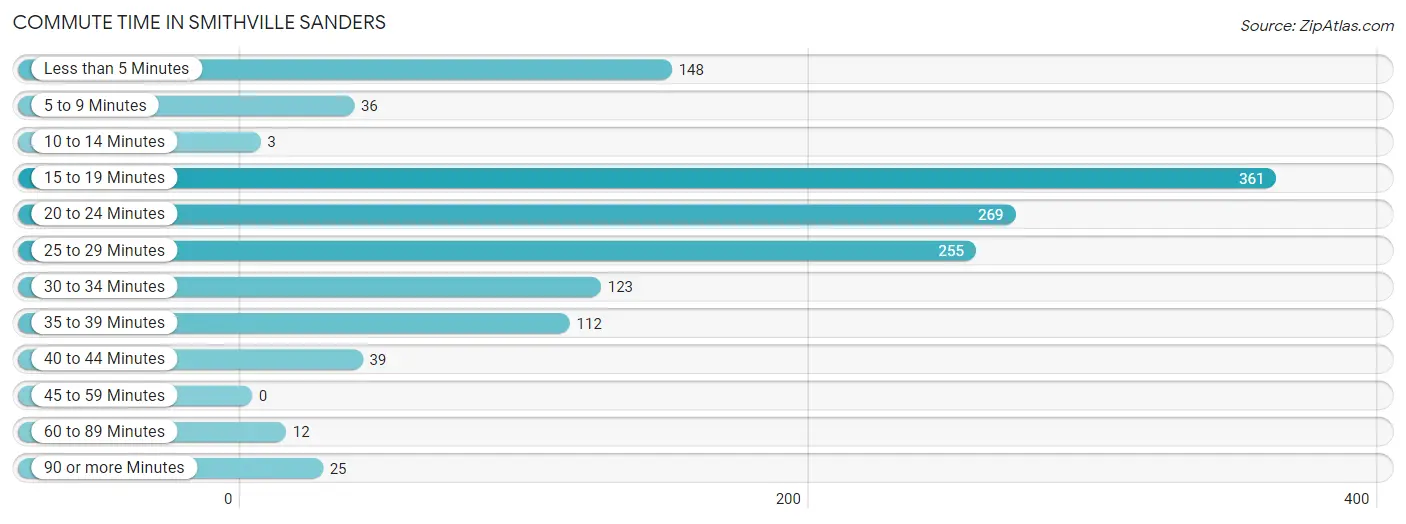
| Commute Time | # Commuters | % Commuters |
| Less than 5 Minutes | 148 | 10.7% |
| 5 to 9 Minutes | 36 | 2.6% |
| 10 to 14 Minutes | 3 | 0.2% |
| 15 to 19 Minutes | 361 | 26.1% |
| 20 to 24 Minutes | 269 | 19.5% |
| 25 to 29 Minutes | 255 | 18.4% |
| 30 to 34 Minutes | 123 | 8.9% |
| 35 to 39 Minutes | 112 | 8.1% |
| 40 to 44 Minutes | 39 | 2.8% |
| 45 to 59 Minutes | 0 | 0.0% |
| 60 to 89 Minutes | 12 | 0.9% |
| 90 or more Minutes | 25 | 1.8% |
Commute Time by Sex in Smithville Sanders
The most common commute times in Smithville Sanders are 15 to 19 minutes (151 commuters, 22.2%) for males and 15 to 19 minutes (210 commuters, 29.8%) for females.
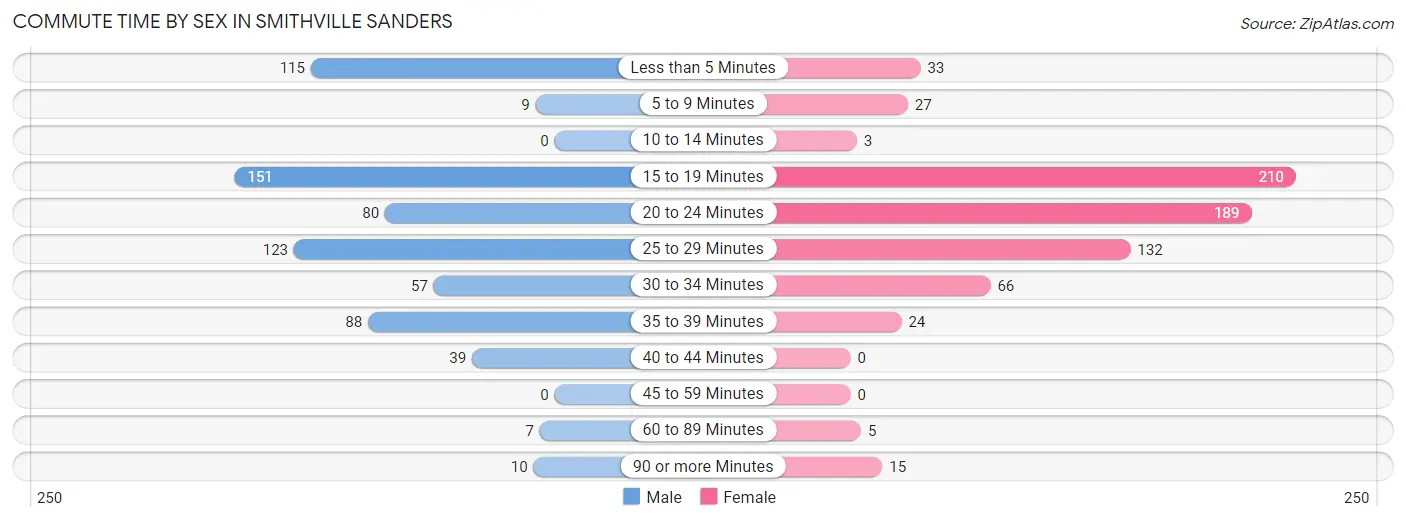
| Commute Time | Male | Female |
| Less than 5 Minutes | 115 (16.9%) | 33 (4.7%) |
| 5 to 9 Minutes | 9 (1.3%) | 27 (3.8%) |
| 10 to 14 Minutes | 0 (0.0%) | 3 (0.4%) |
| 15 to 19 Minutes | 151 (22.2%) | 210 (29.8%) |
| 20 to 24 Minutes | 80 (11.8%) | 189 (26.9%) |
| 25 to 29 Minutes | 123 (18.1%) | 132 (18.8%) |
| 30 to 34 Minutes | 57 (8.4%) | 66 (9.4%) |
| 35 to 39 Minutes | 88 (13.0%) | 24 (3.4%) |
| 40 to 44 Minutes | 39 (5.7%) | 0 (0.0%) |
| 45 to 59 Minutes | 0 (0.0%) | 0 (0.0%) |
| 60 to 89 Minutes | 7 (1.0%) | 5 (0.7%) |
| 90 or more Minutes | 10 (1.5%) | 15 (2.1%) |
Time of Departure to Work by Sex in Smithville Sanders
The most frequent times of departure to work in Smithville Sanders are 7:00 AM to 7:29 AM (191, 28.1%) for males and 8:00 AM to 8:29 AM (214, 30.4%) for females.
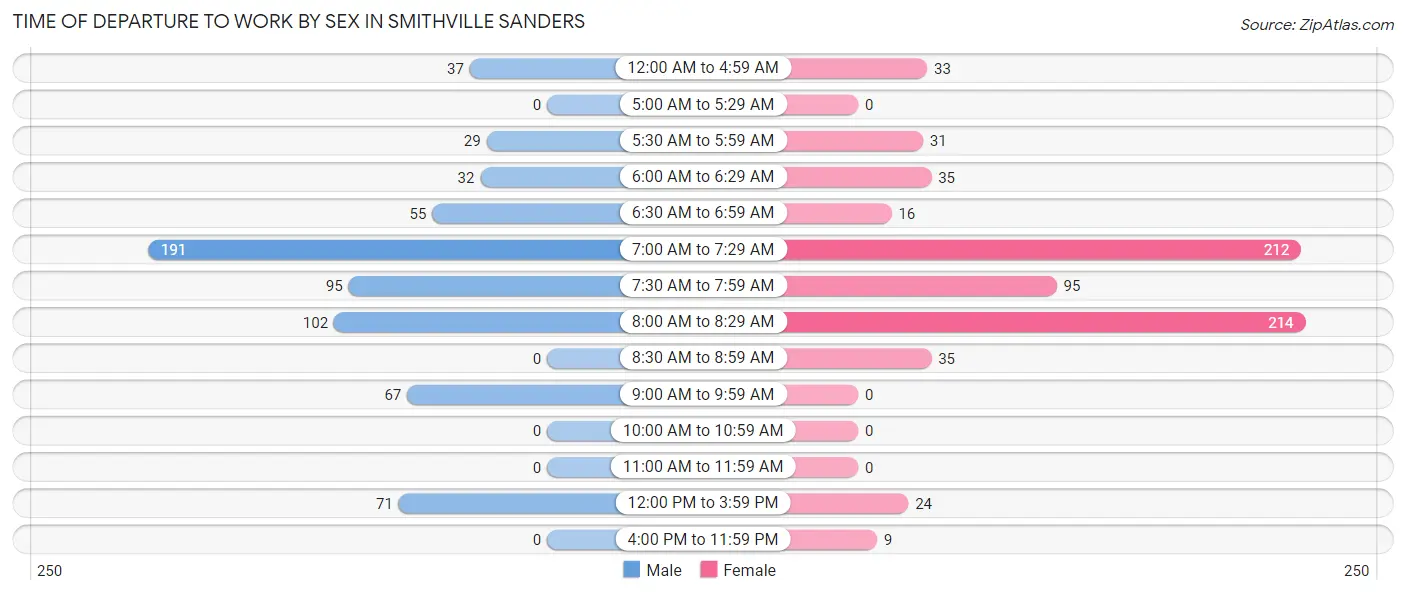
| Time of Departure | Male | Female |
| 12:00 AM to 4:59 AM | 37 (5.4%) | 33 (4.7%) |
| 5:00 AM to 5:29 AM | 0 (0.0%) | 0 (0.0%) |
| 5:30 AM to 5:59 AM | 29 (4.3%) | 31 (4.4%) |
| 6:00 AM to 6:29 AM | 32 (4.7%) | 35 (5.0%) |
| 6:30 AM to 6:59 AM | 55 (8.1%) | 16 (2.3%) |
| 7:00 AM to 7:29 AM | 191 (28.1%) | 212 (30.1%) |
| 7:30 AM to 7:59 AM | 95 (14.0%) | 95 (13.5%) |
| 8:00 AM to 8:29 AM | 102 (15.0%) | 214 (30.4%) |
| 8:30 AM to 8:59 AM | 0 (0.0%) | 35 (5.0%) |
| 9:00 AM to 9:59 AM | 67 (9.9%) | 0 (0.0%) |
| 10:00 AM to 10:59 AM | 0 (0.0%) | 0 (0.0%) |
| 11:00 AM to 11:59 AM | 0 (0.0%) | 0 (0.0%) |
| 12:00 PM to 3:59 PM | 71 (10.5%) | 24 (3.4%) |
| 4:00 PM to 11:59 PM | 0 (0.0%) | 9 (1.3%) |
| Total | 679 (100.0%) | 704 (100.0%) |
Housing Occupancy in Smithville Sanders
Occupancy by Ownership in Smithville Sanders
Of the total 1,364 dwellings in Smithville Sanders, owner-occupied units account for 1,116 (81.8%), while renter-occupied units make up 248 (18.2%).
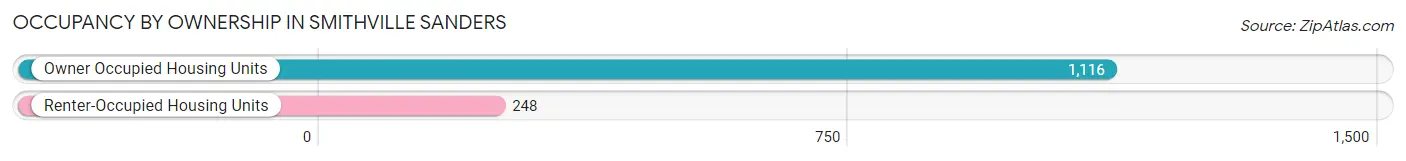
| Occupancy | # Housing Units | % Housing Units |
| Owner Occupied Housing Units | 1,116 | 81.8% |
| Renter-Occupied Housing Units | 248 | 18.2% |
| Total Occupied Housing Units | 1,364 | 100.0% |
Occupancy by Household Size in Smithville Sanders
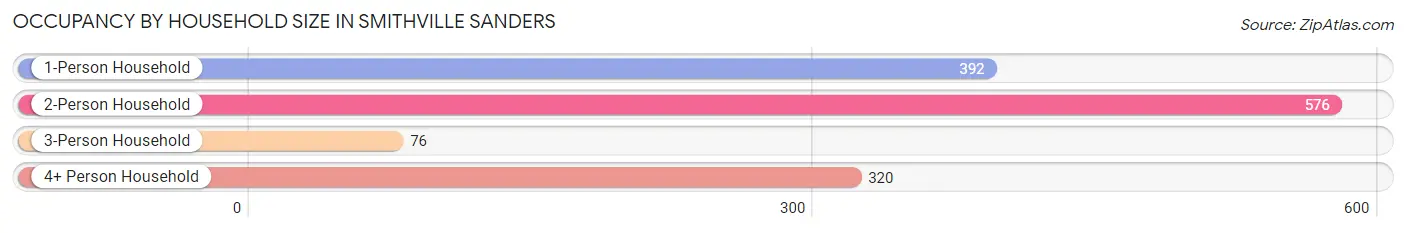
| Household Size | # Housing Units | % Housing Units |
| 1-Person Household | 392 | 28.7% |
| 2-Person Household | 576 | 42.2% |
| 3-Person Household | 76 | 5.6% |
| 4+ Person Household | 320 | 23.5% |
| Total Housing Units | 1,364 | 100.0% |
Occupancy by Ownership by Household Size in Smithville Sanders
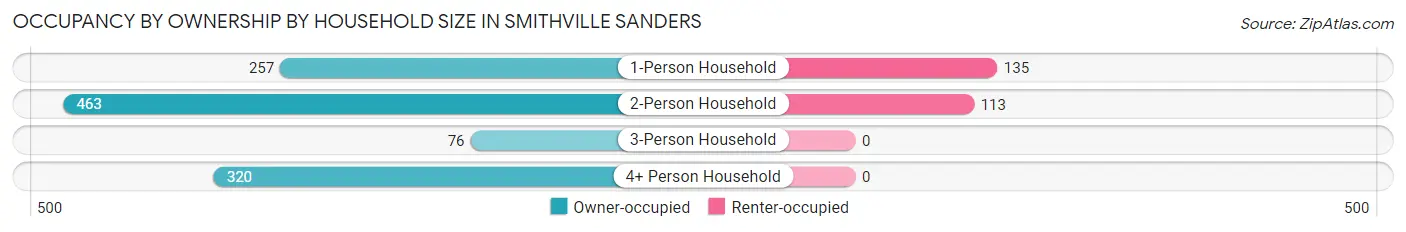
| Household Size | Owner-occupied | Renter-occupied |
| 1-Person Household | 257 (65.6%) | 135 (34.4%) |
| 2-Person Household | 463 (80.4%) | 113 (19.6%) |
| 3-Person Household | 76 (100.0%) | 0 (0.0%) |
| 4+ Person Household | 320 (100.0%) | 0 (0.0%) |
| Total Housing Units | 1,116 (81.8%) | 248 (18.2%) |
Occupancy by Educational Attainment in Smithville Sanders

| Household Size | Owner-occupied | Renter-occupied |
| Less than High School | 0 (0.0%) | 0 (0.0%) |
| High School Diploma | 112 (64.4%) | 62 (35.6%) |
| College/Associate Degree | 403 (79.3%) | 105 (20.7%) |
| Bachelor's Degree or higher | 601 (88.1%) | 81 (11.9%) |
Occupancy by Age of Householder in Smithville Sanders
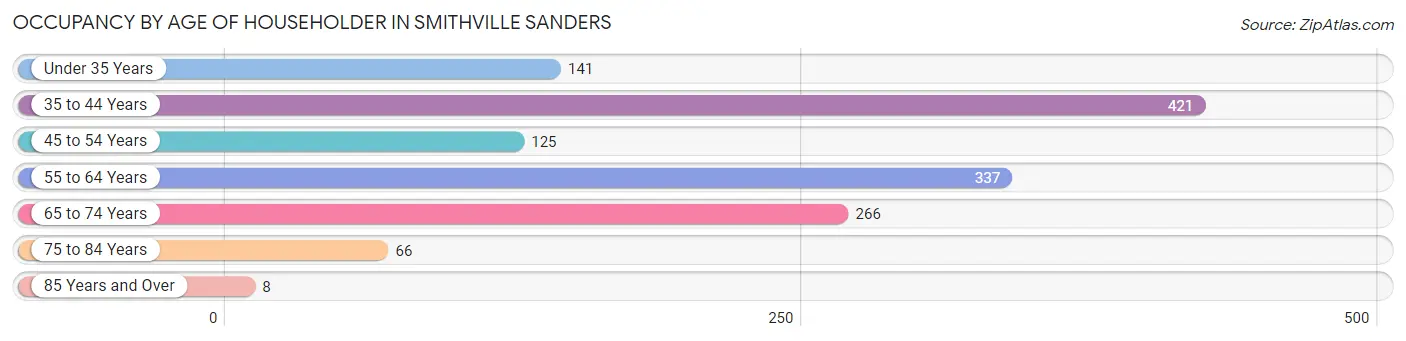
| Age Bracket | # Households | % Households |
| Under 35 Years | 141 | 10.3% |
| 35 to 44 Years | 421 | 30.9% |
| 45 to 54 Years | 125 | 9.2% |
| 55 to 64 Years | 337 | 24.7% |
| 65 to 74 Years | 266 | 19.5% |
| 75 to 84 Years | 66 | 4.8% |
| 85 Years and Over | 8 | 0.6% |
| Total | 1,364 | 100.0% |
Housing Finances in Smithville Sanders
Median Income by Occupancy in Smithville Sanders
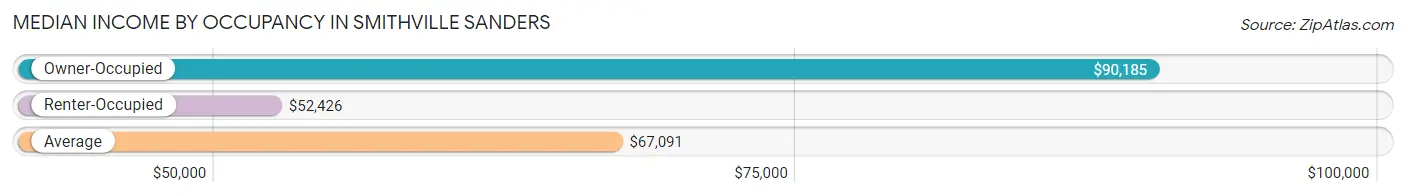
| Occupancy Type | # Households | Median Income |
| Owner-Occupied | 1,116 (81.8%) | $90,185 |
| Renter-Occupied | 248 (18.2%) | $52,426 |
| Average | 1,364 (100.0%) | $67,091 |
Occupancy by Householder Income Bracket in Smithville Sanders
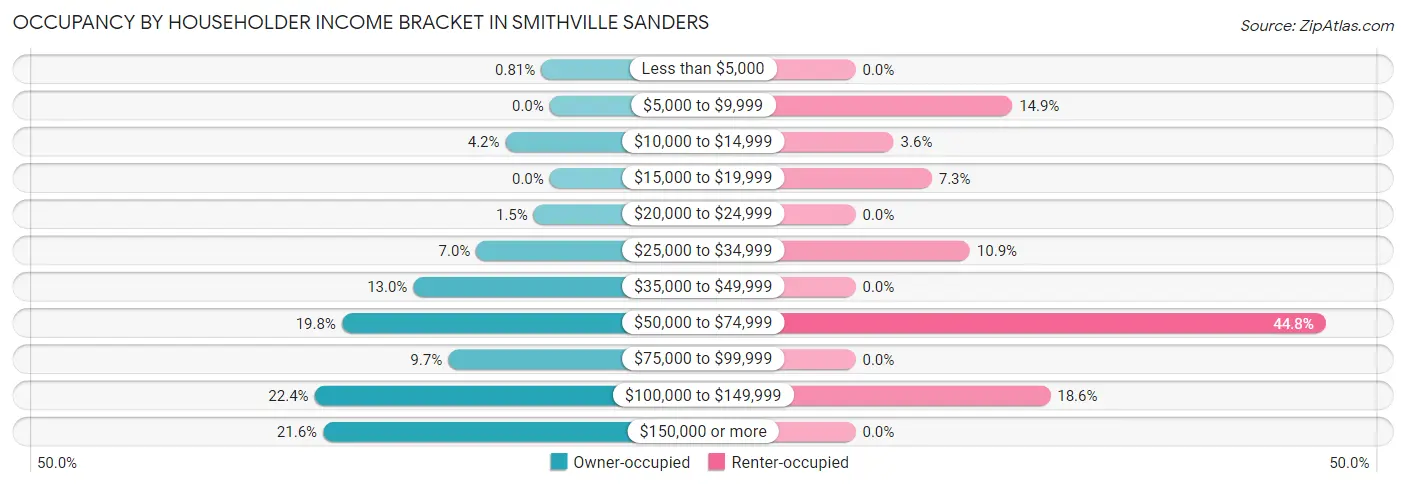
| Income Bracket | Owner-occupied | Renter-occupied |
| Less than $5,000 | 9 (0.8%) | 0 (0.0%) |
| $5,000 to $9,999 | 0 (0.0%) | 37 (14.9%) |
| $10,000 to $14,999 | 47 (4.2%) | 9 (3.6%) |
| $15,000 to $19,999 | 0 (0.0%) | 18 (7.3%) |
| $20,000 to $24,999 | 17 (1.5%) | 0 (0.0%) |
| $25,000 to $34,999 | 78 (7.0%) | 27 (10.9%) |
| $35,000 to $49,999 | 145 (13.0%) | 0 (0.0%) |
| $50,000 to $74,999 | 221 (19.8%) | 111 (44.8%) |
| $75,000 to $99,999 | 108 (9.7%) | 0 (0.0%) |
| $100,000 to $149,999 | 250 (22.4%) | 46 (18.5%) |
| $150,000 or more | 241 (21.6%) | 0 (0.0%) |
| Total | 1,116 (100.0%) | 248 (100.0%) |
Monthly Housing Cost Tiers in Smithville Sanders
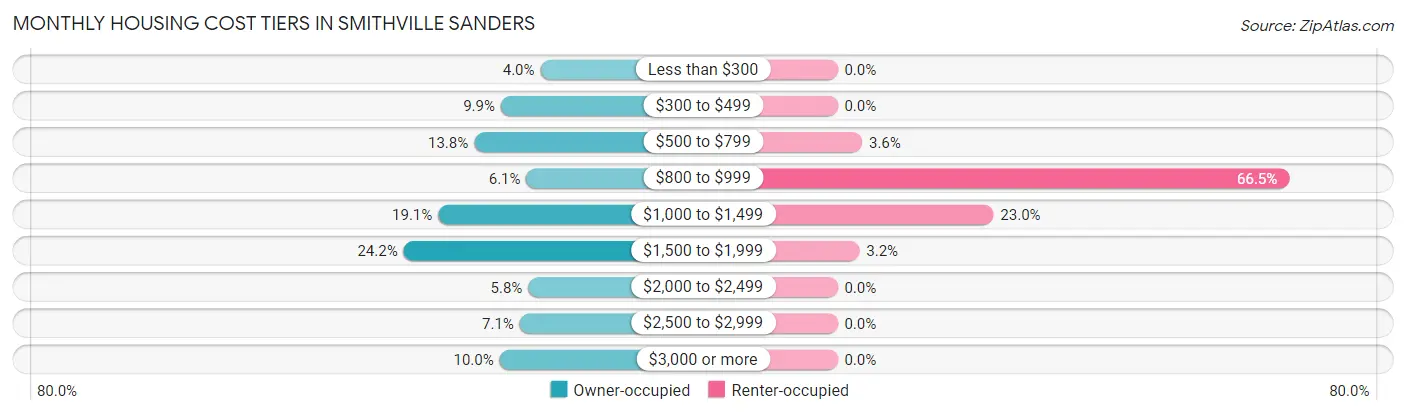
| Monthly Cost | Owner-occupied | Renter-occupied |
| Less than $300 | 45 (4.0%) | 0 (0.0%) |
| $300 to $499 | 110 (9.9%) | 0 (0.0%) |
| $500 to $799 | 154 (13.8%) | 9 (3.6%) |
| $800 to $999 | 68 (6.1%) | 165 (66.5%) |
| $1,000 to $1,499 | 213 (19.1%) | 57 (23.0%) |
| $1,500 to $1,999 | 270 (24.2%) | 8 (3.2%) |
| $2,000 to $2,499 | 65 (5.8%) | 0 (0.0%) |
| $2,500 to $2,999 | 79 (7.1%) | 0 (0.0%) |
| $3,000 or more | 112 (10.0%) | 0 (0.0%) |
| Total | 1,116 (100.0%) | 248 (100.0%) |
Physical Housing Characteristics in Smithville Sanders
Housing Structures in Smithville Sanders
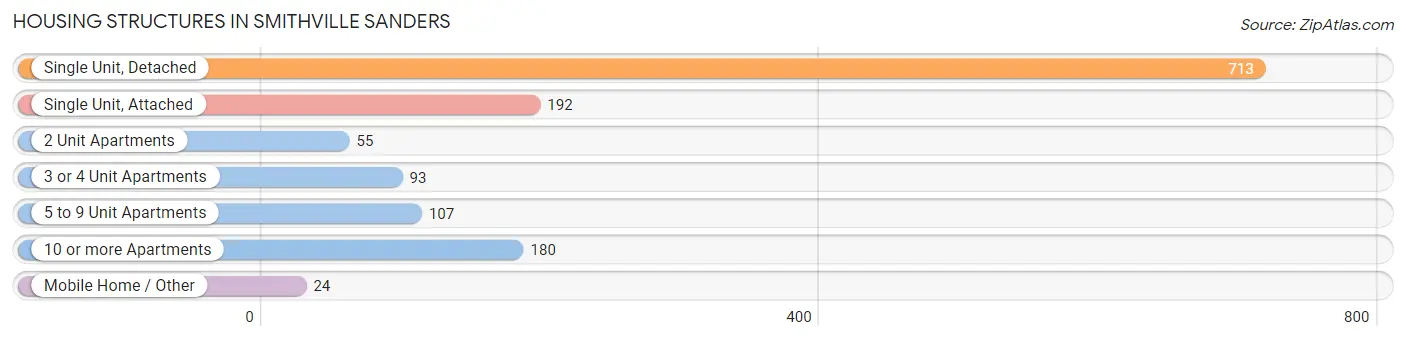
| Structure Type | # Housing Units | % Housing Units |
| Single Unit, Detached | 713 | 52.3% |
| Single Unit, Attached | 192 | 14.1% |
| 2 Unit Apartments | 55 | 4.0% |
| 3 or 4 Unit Apartments | 93 | 6.8% |
| 5 to 9 Unit Apartments | 107 | 7.8% |
| 10 or more Apartments | 180 | 13.2% |
| Mobile Home / Other | 24 | 1.8% |
| Total | 1,364 | 100.0% |
Housing Structures by Occupancy in Smithville Sanders
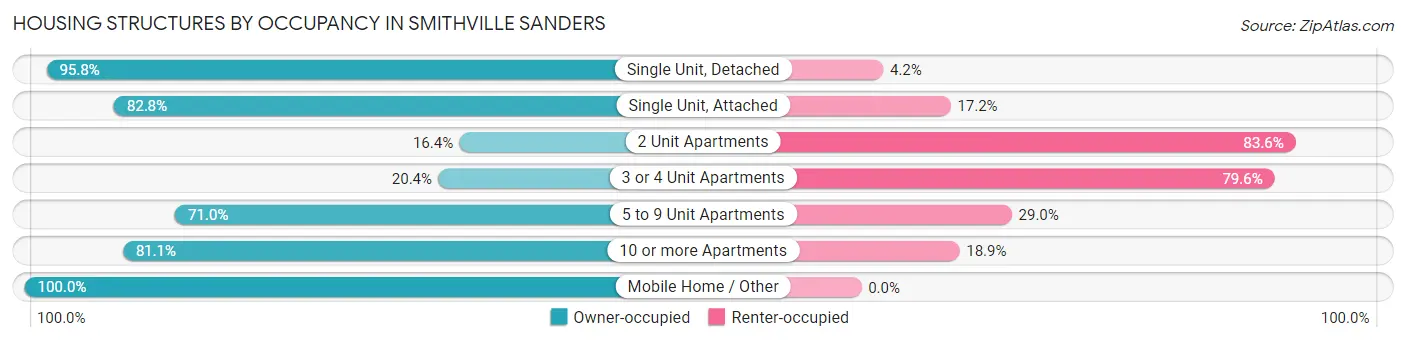
| Structure Type | Owner-occupied | Renter-occupied |
| Single Unit, Detached | 683 (95.8%) | 30 (4.2%) |
| Single Unit, Attached | 159 (82.8%) | 33 (17.2%) |
| 2 Unit Apartments | 9 (16.4%) | 46 (83.6%) |
| 3 or 4 Unit Apartments | 19 (20.4%) | 74 (79.6%) |
| 5 to 9 Unit Apartments | 76 (71.0%) | 31 (29.0%) |
| 10 or more Apartments | 146 (81.1%) | 34 (18.9%) |
| Mobile Home / Other | 24 (100.0%) | 0 (0.0%) |
| Total | 1,116 (81.8%) | 248 (18.2%) |
Housing Structures by Number of Rooms in Smithville Sanders
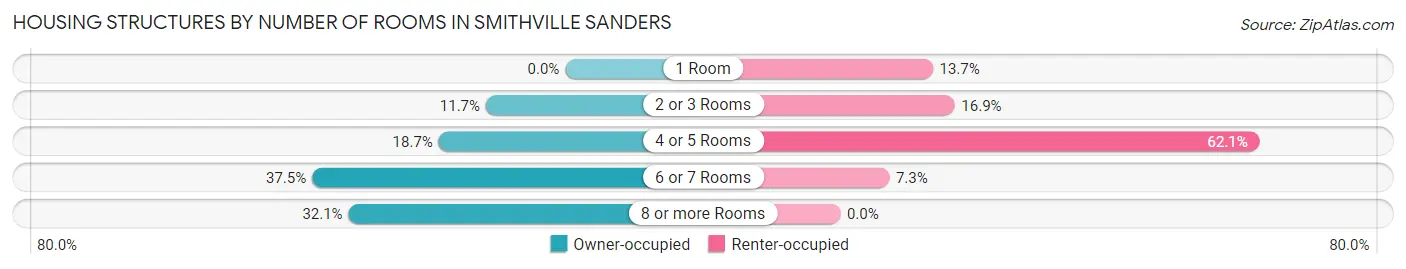
| Number of Rooms | Owner-occupied | Renter-occupied |
| 1 Room | 0 (0.0%) | 34 (13.7%) |
| 2 or 3 Rooms | 131 (11.7%) | 42 (16.9%) |
| 4 or 5 Rooms | 209 (18.7%) | 154 (62.1%) |
| 6 or 7 Rooms | 418 (37.5%) | 18 (7.3%) |
| 8 or more Rooms | 358 (32.1%) | 0 (0.0%) |
| Total | 1,116 (100.0%) | 248 (100.0%) |
Housing Structure by Heating Type in Smithville Sanders

| Heating Type | Owner-occupied | Renter-occupied |
| Utility Gas | 281 (25.2%) | 0 (0.0%) |
| Bottled, Tank, or LP Gas | 172 (15.4%) | 22 (8.9%) |
| Electricity | 663 (59.4%) | 217 (87.5%) |
| Fuel Oil or Kerosene | 0 (0.0%) | 0 (0.0%) |
| Coal or Coke | 0 (0.0%) | 0 (0.0%) |
| All other Fuels | 0 (0.0%) | 0 (0.0%) |
| No Fuel Used | 0 (0.0%) | 9 (3.6%) |
| Total | 1,116 (100.0%) | 248 (100.0%) |
Household Vehicle Usage in Smithville Sanders
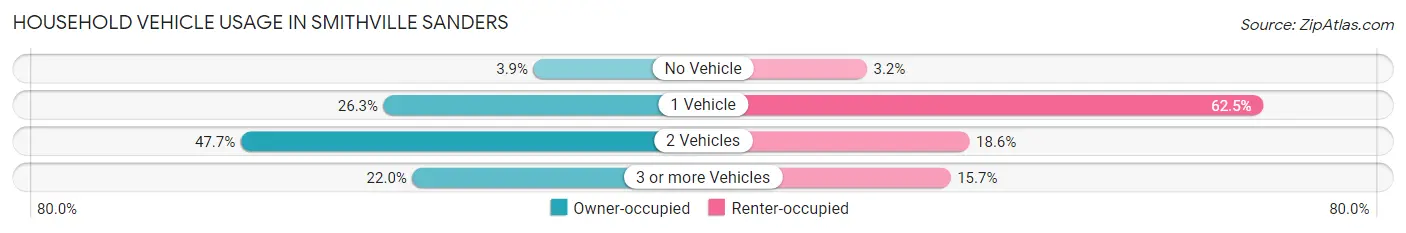
| Vehicles per Household | Owner-occupied | Renter-occupied |
| No Vehicle | 44 (3.9%) | 8 (3.2%) |
| 1 Vehicle | 294 (26.3%) | 155 (62.5%) |
| 2 Vehicles | 532 (47.7%) | 46 (18.5%) |
| 3 or more Vehicles | 246 (22.0%) | 39 (15.7%) |
| Total | 1,116 (100.0%) | 248 (100.0%) |
Real Estate & Mortgages in Smithville Sanders
Real Estate and Mortgage Overview in Smithville Sanders
| Characteristic | Without Mortgage | With Mortgage |
| Housing Units | 301 | 815 |
| Median Property Value | $135,400 | $268,200 |
| Median Household Income | $48,634 | $202 |
| Monthly Housing Costs | $489 | $112 |
| Real Estate Taxes | $939 | $32 |
Property Value by Mortgage Status in Smithville Sanders
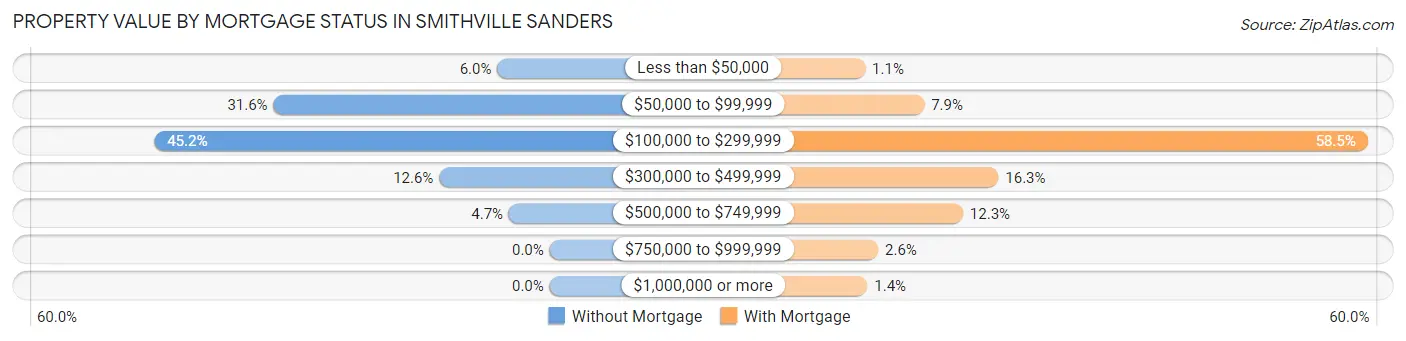
| Property Value | Without Mortgage | With Mortgage |
| Less than $50,000 | 18 (6.0%) | 9 (1.1%) |
| $50,000 to $99,999 | 95 (31.6%) | 64 (7.9%) |
| $100,000 to $299,999 | 136 (45.2%) | 477 (58.5%) |
| $300,000 to $499,999 | 38 (12.6%) | 133 (16.3%) |
| $500,000 to $749,999 | 14 (4.6%) | 100 (12.3%) |
| $750,000 to $999,999 | 0 (0.0%) | 21 (2.6%) |
| $1,000,000 or more | 0 (0.0%) | 11 (1.3%) |
| Total | 301 (100.0%) | 815 (100.0%) |
Household Income by Mortgage Status in Smithville Sanders
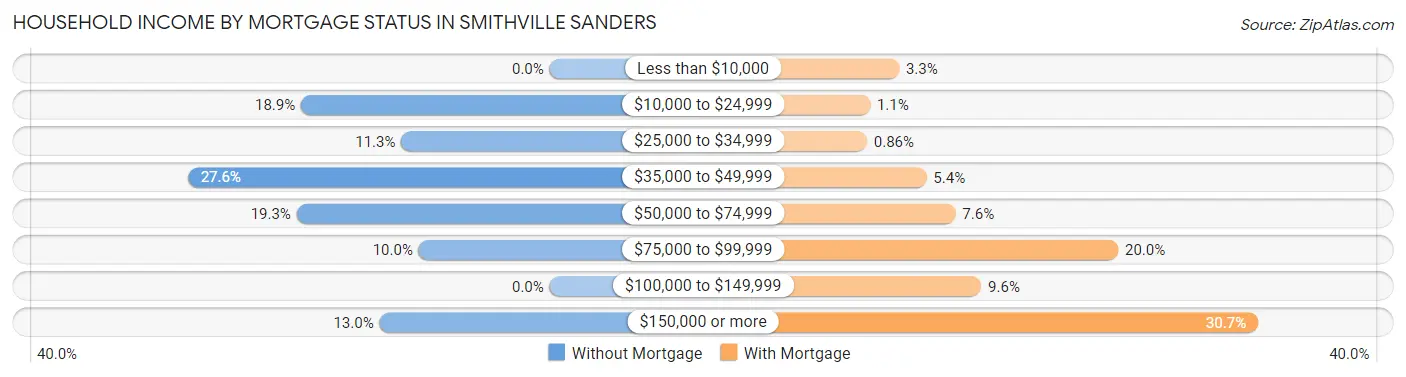
| Household Income | Without Mortgage | With Mortgage |
| Less than $10,000 | 0 (0.0%) | 27 (3.3%) |
| $10,000 to $24,999 | 57 (18.9%) | 9 (1.1%) |
| $25,000 to $34,999 | 34 (11.3%) | 7 (0.9%) |
| $35,000 to $49,999 | 83 (27.6%) | 44 (5.4%) |
| $50,000 to $74,999 | 58 (19.3%) | 62 (7.6%) |
| $75,000 to $99,999 | 30 (10.0%) | 163 (20.0%) |
| $100,000 to $149,999 | 0 (0.0%) | 78 (9.6%) |
| $150,000 or more | 39 (13.0%) | 250 (30.7%) |
| Total | 301 (100.0%) | 815 (100.0%) |
Property Value to Household Income Ratio in Smithville Sanders
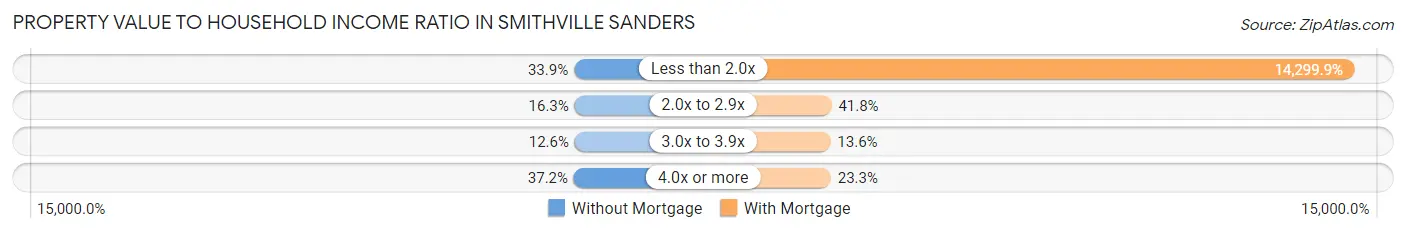
| Value-to-Income Ratio | Without Mortgage | With Mortgage |
| Less than 2.0x | 102 (33.9%) | 116,544 (14,299.9%) |
| 2.0x to 2.9x | 49 (16.3%) | 341 (41.8%) |
| 3.0x to 3.9x | 38 (12.6%) | 111 (13.6%) |
| 4.0x or more | 112 (37.2%) | 190 (23.3%) |
| Total | 301 (100.0%) | 815 (100.0%) |
Real Estate Taxes by Mortgage Status in Smithville Sanders
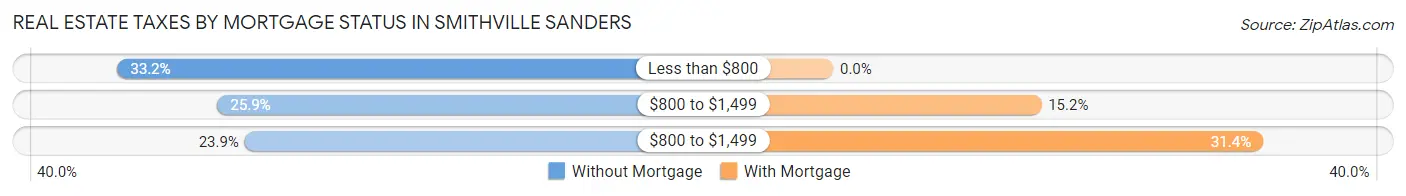
| Property Taxes | Without Mortgage | With Mortgage |
| Less than $800 | 100 (33.2%) | 0 (0.0%) |
| $800 to $1,499 | 78 (25.9%) | 124 (15.2%) |
| $800 to $1,499 | 72 (23.9%) | 256 (31.4%) |
| Total | 301 (100.0%) | 815 (100.0%) |
Health & Disability in Smithville Sanders
Health Insurance Coverage by Age in Smithville Sanders
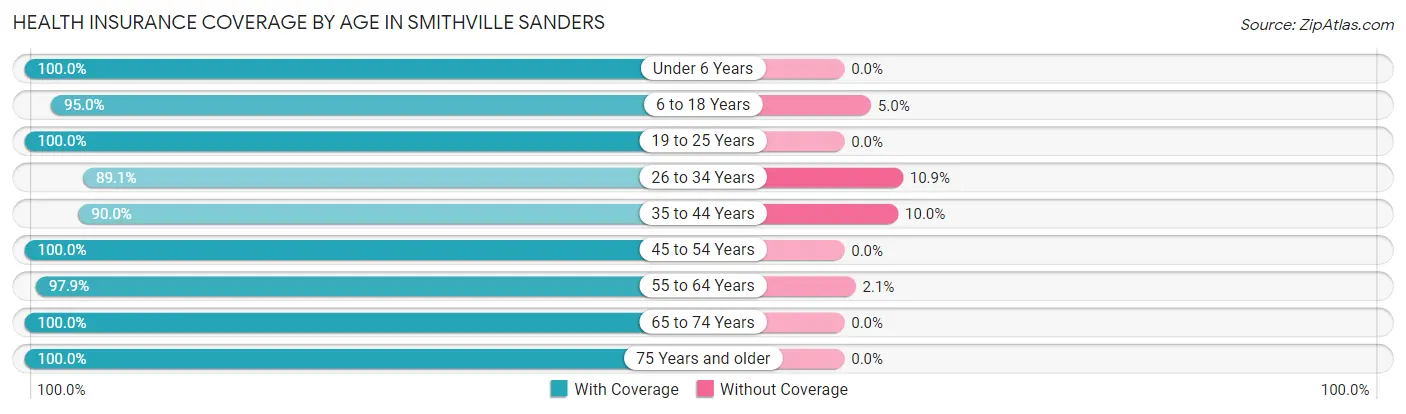
| Age Bracket | With Coverage | Without Coverage |
| Under 6 Years | 171 (100.0%) | 0 (0.0%) |
| 6 to 18 Years | 632 (95.0%) | 33 (5.0%) |
| 19 to 25 Years | 138 (100.0%) | 0 (0.0%) |
| 26 to 34 Years | 147 (89.1%) | 18 (10.9%) |
| 35 to 44 Years | 681 (90.0%) | 76 (10.0%) |
| 45 to 54 Years | 244 (100.0%) | 0 (0.0%) |
| 55 to 64 Years | 463 (97.9%) | 10 (2.1%) |
| 65 to 74 Years | 370 (100.0%) | 0 (0.0%) |
| 75 Years and older | 116 (100.0%) | 0 (0.0%) |
| Total | 2,962 (95.6%) | 137 (4.4%) |
Health Insurance Coverage by Citizenship Status in Smithville Sanders
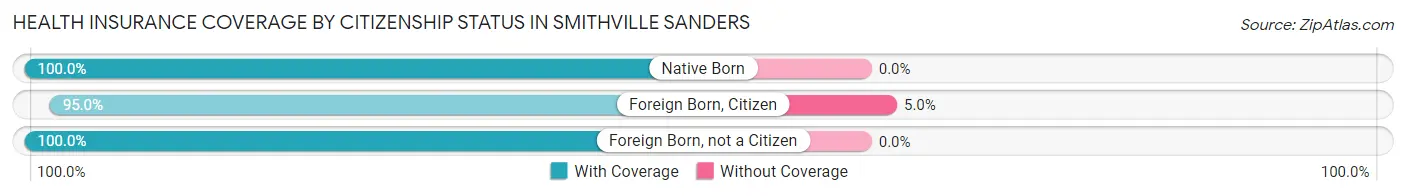
| Citizenship Status | With Coverage | Without Coverage |
| Native Born | 171 (100.0%) | 0 (0.0%) |
| Foreign Born, Citizen | 632 (95.0%) | 33 (5.0%) |
| Foreign Born, not a Citizen | 138 (100.0%) | 0 (0.0%) |
Health Insurance Coverage by Household Income in Smithville Sanders
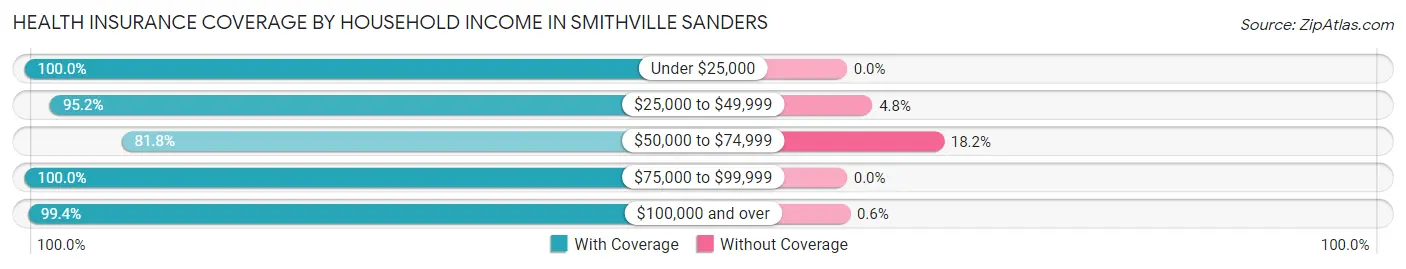
| Household Income | With Coverage | Without Coverage |
| Under $25,000 | 154 (100.0%) | 0 (0.0%) |
| $25,000 to $49,999 | 360 (95.2%) | 18 (4.8%) |
| $50,000 to $74,999 | 491 (81.8%) | 109 (18.2%) |
| $75,000 to $99,999 | 307 (100.0%) | 0 (0.0%) |
| $100,000 and over | 1,650 (99.4%) | 10 (0.6%) |
Public vs Private Health Insurance Coverage by Age in Smithville Sanders
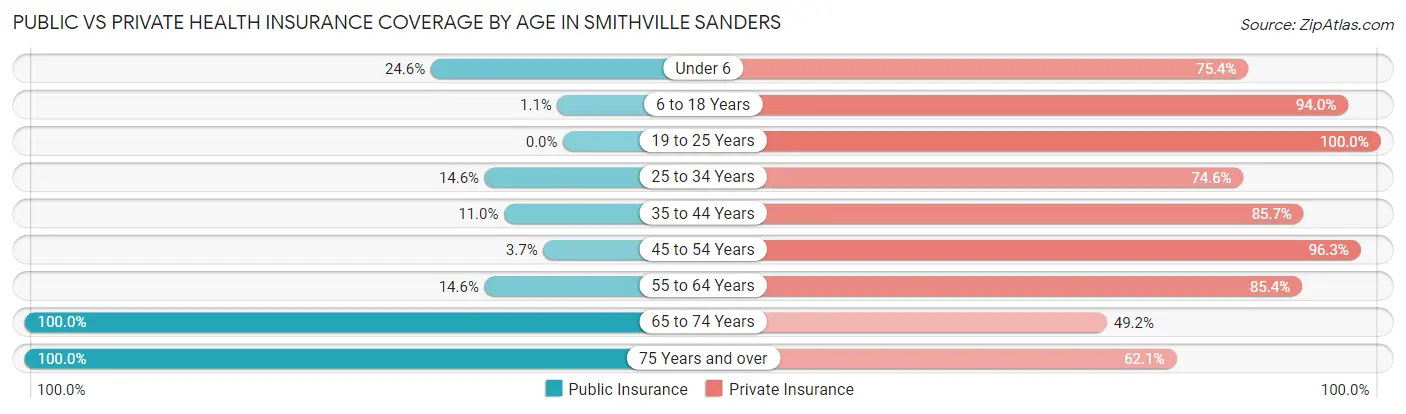
| Age Bracket | Public Insurance | Private Insurance |
| Under 6 | 42 (24.6%) | 129 (75.4%) |
| 6 to 18 Years | 7 (1.1%) | 625 (94.0%) |
| 19 to 25 Years | 0 (0.0%) | 138 (100.0%) |
| 25 to 34 Years | 24 (14.5%) | 123 (74.6%) |
| 35 to 44 Years | 83 (11.0%) | 649 (85.7%) |
| 45 to 54 Years | 9 (3.7%) | 235 (96.3%) |
| 55 to 64 Years | 69 (14.6%) | 404 (85.4%) |
| 65 to 74 Years | 370 (100.0%) | 182 (49.2%) |
| 75 Years and over | 116 (100.0%) | 72 (62.1%) |
| Total | 720 (23.2%) | 2,557 (82.5%) |
Disability Status by Sex by Age in Smithville Sanders

| Age Bracket | Male | Female |
| Under 5 Years | 0 (0.0%) | 0 (0.0%) |
| 5 to 17 Years | 25 (6.5%) | 17 (6.1%) |
| 18 to 34 Years | 0 (0.0%) | 24 (14.1%) |
| 35 to 64 Years | 118 (15.8%) | 82 (11.3%) |
| 65 to 74 Years | 59 (32.6%) | 29 (15.3%) |
| 75 Years and over | 8 (14.3%) | 28 (46.7%) |
Disability Class by Sex by Age in Smithville Sanders
Disability Class: Hearing Difficulty
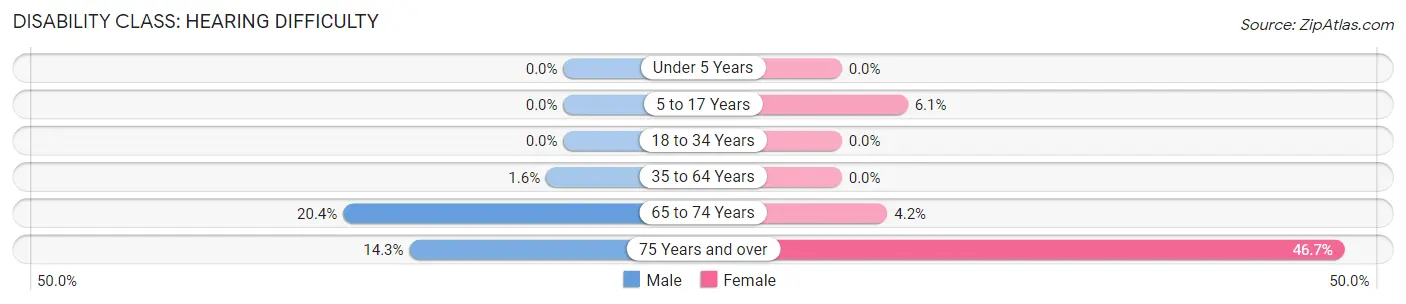
| Age Bracket | Male | Female |
| Under 5 Years | 0 (0.0%) | 0 (0.0%) |
| 5 to 17 Years | 0 (0.0%) | 17 (6.1%) |
| 18 to 34 Years | 0 (0.0%) | 0 (0.0%) |
| 35 to 64 Years | 12 (1.6%) | 0 (0.0%) |
| 65 to 74 Years | 37 (20.4%) | 8 (4.2%) |
| 75 Years and over | 8 (14.3%) | 28 (46.7%) |
Disability Class: Vision Difficulty
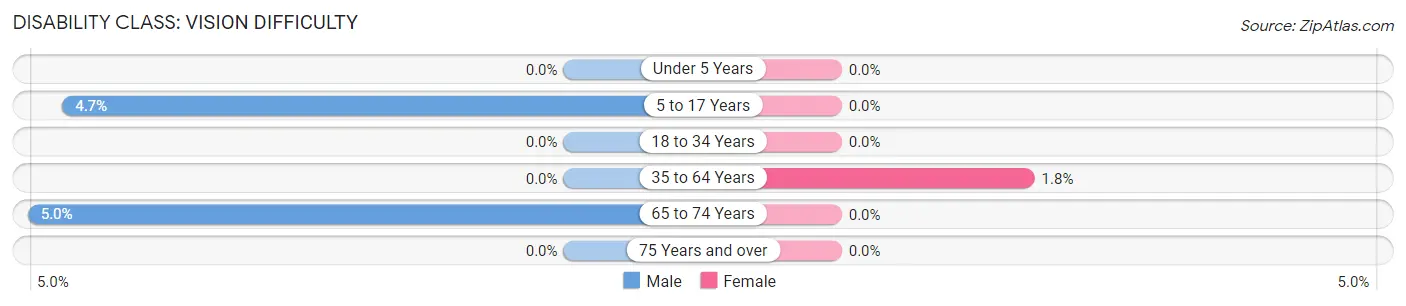
| Age Bracket | Male | Female |
| Under 5 Years | 0 (0.0%) | 0 (0.0%) |
| 5 to 17 Years | 18 (4.6%) | 0 (0.0%) |
| 18 to 34 Years | 0 (0.0%) | 0 (0.0%) |
| 35 to 64 Years | 0 (0.0%) | 13 (1.8%) |
| 65 to 74 Years | 9 (5.0%) | 0 (0.0%) |
| 75 Years and over | 0 (0.0%) | 0 (0.0%) |
Disability Class: Cognitive Difficulty
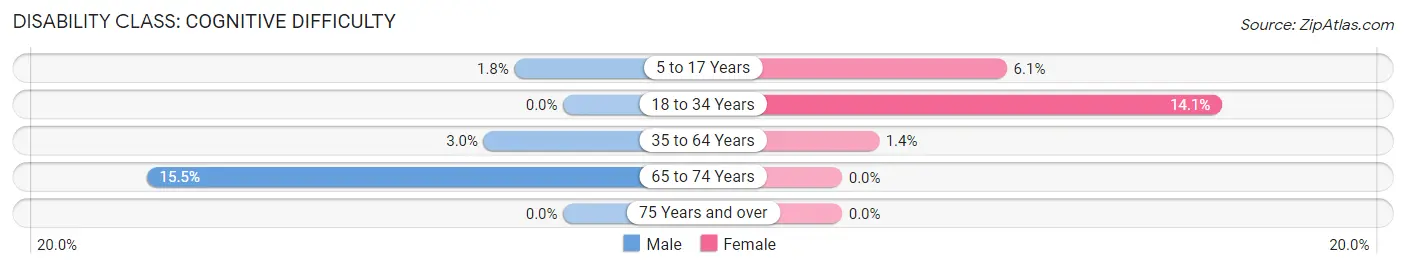
| Age Bracket | Male | Female |
| 5 to 17 Years | 7 (1.8%) | 17 (6.1%) |
| 18 to 34 Years | 0 (0.0%) | 24 (14.1%) |
| 35 to 64 Years | 22 (2.9%) | 10 (1.4%) |
| 65 to 74 Years | 28 (15.5%) | 0 (0.0%) |
| 75 Years and over | 0 (0.0%) | 0 (0.0%) |
Disability Class: Ambulatory Difficulty
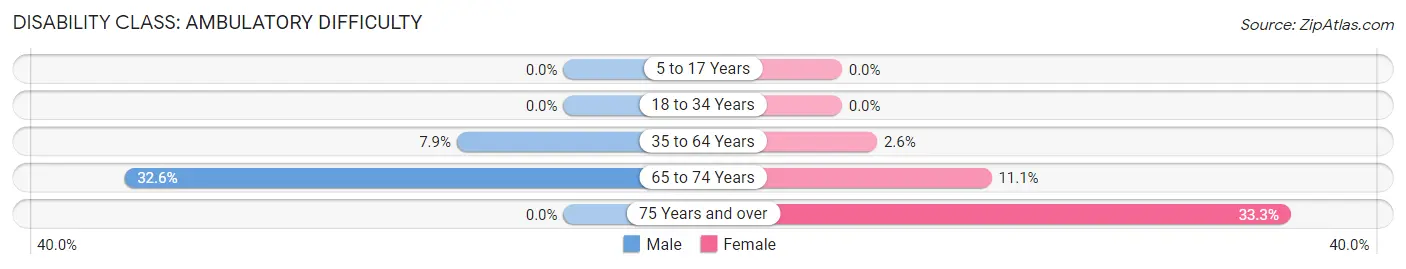
| Age Bracket | Male | Female |
| 5 to 17 Years | 0 (0.0%) | 0 (0.0%) |
| 18 to 34 Years | 0 (0.0%) | 0 (0.0%) |
| 35 to 64 Years | 59 (7.9%) | 19 (2.6%) |
| 65 to 74 Years | 59 (32.6%) | 21 (11.1%) |
| 75 Years and over | 0 (0.0%) | 20 (33.3%) |
Disability Class: Self-Care Difficulty
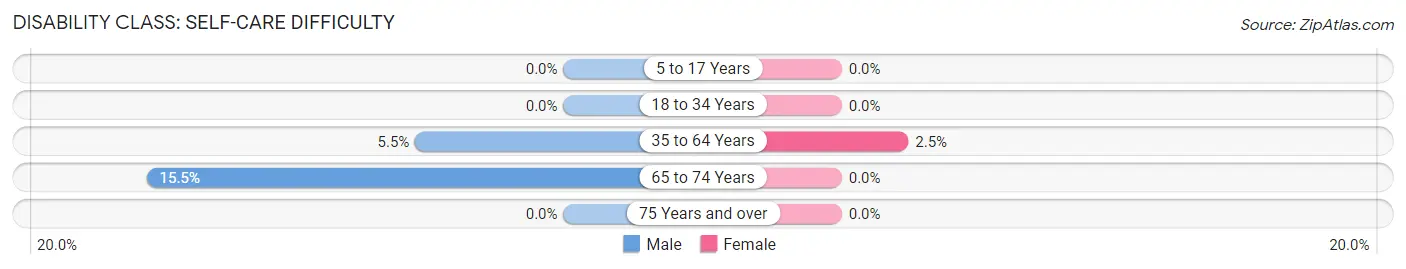
| Age Bracket | Male | Female |
| 5 to 17 Years | 0 (0.0%) | 0 (0.0%) |
| 18 to 34 Years | 0 (0.0%) | 0 (0.0%) |
| 35 to 64 Years | 41 (5.5%) | 18 (2.5%) |
| 65 to 74 Years | 28 (15.5%) | 0 (0.0%) |
| 75 Years and over | 0 (0.0%) | 0 (0.0%) |
Technology Access in Smithville Sanders
Computing Device Access in Smithville Sanders
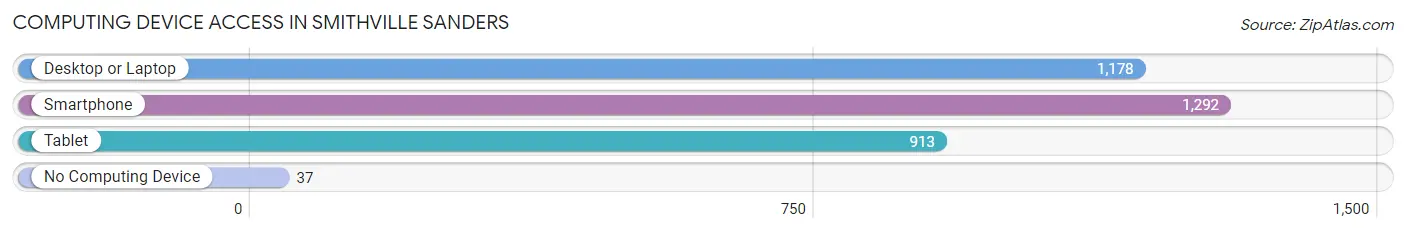
| Device Type | # Households | % Households |
| Desktop or Laptop | 1,178 | 86.4% |
| Smartphone | 1,292 | 94.7% |
| Tablet | 913 | 66.9% |
| No Computing Device | 37 | 2.7% |
| Total | 1,364 | 100.0% |
Internet Access in Smithville Sanders
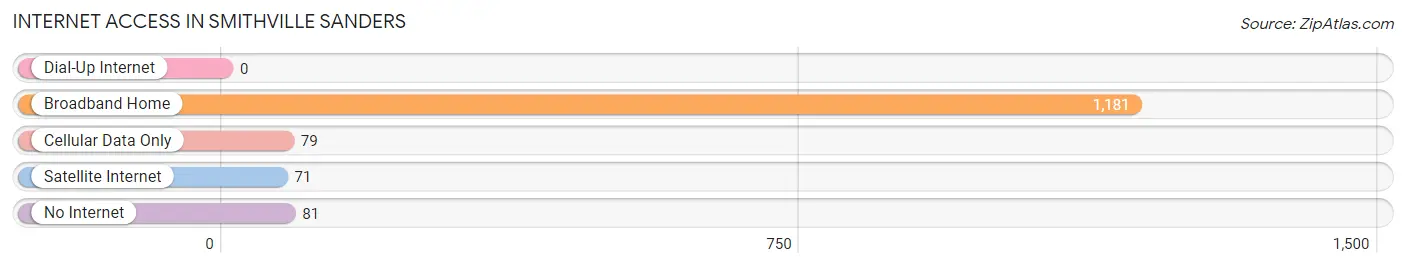
| Internet Type | # Households | % Households |
| Dial-Up Internet | 0 | 0.0% |
| Broadband Home | 1,181 | 86.6% |
| Cellular Data Only | 79 | 5.8% |
| Satellite Internet | 71 | 5.2% |
| No Internet | 81 | 5.9% |
| Total | 1,364 | 100.0% |
Smithville Sanders Summary
History
The small town of Smithville Sanders, Indiana is located in the northern part of the state, in the county of Elkhart. It is a small, rural community with a population of just over 1,000 people. The town was founded in 1837 by a man named John Sanders, who was a farmer and a blacksmith. He named the town after his father, Smith Sanders.
The town was originally a farming community, with many of the residents working in the fields and tending to their crops. As the years passed, the town began to grow and develop. In the late 1800s, the railroad came to Smithville Sanders, bringing with it new opportunities for the town. This allowed the town to become a hub for trade and commerce, and it soon became a popular destination for travelers.
In the early 1900s, Smithville Sanders began to experience a period of growth and prosperity. The town was home to several businesses, including a general store, a bank, a post office, and a hotel. The town also had a school, a library, and a church.
The town continued to grow and develop throughout the 20th century. In the 1950s, the town was home to a number of factories, including a furniture factory and a canning factory. The town also had a movie theater, a bowling alley, and a number of restaurants.
In the late 20th century, Smithville Sanders began to experience a period of decline. Many of the factories and businesses closed, and the population began to decline. In recent years, the town has seen a resurgence in population and economic activity.
Geography
Smithville Sanders is located in the northern part of Indiana, in the county of Elkhart. The town is situated on the banks of the Elkhart River, and is surrounded by rolling hills and farmland. The town is located about 25 miles north of South Bend, and about 50 miles east of Chicago.
The town has a total area of 1.2 square miles, all of which is land. The town has a humid continental climate, with hot summers and cold winters. The average temperature in the summer is around 75 degrees Fahrenheit, and the average temperature in the winter is around 25 degrees Fahrenheit.
Economy
The economy of Smithville Sanders is largely based on agriculture and tourism. The town is home to several farms, which produce a variety of crops, including corn, soybeans, and wheat. The town is also home to a number of small businesses, including restaurants, shops, and a movie theater.
The town is also home to a number of tourist attractions, including a museum, a historic district, and a number of parks. The town is also home to a number of festivals and events throughout the year, including the Smithville Sanders County Fair and the Smithville Sanders Music Festival.
Demographics
As of the 2010 census, the population of Smithville Sanders was 1,072. The racial makeup of the town was 97.3% White, 0.7% African American, 0.2% Native American, 0.2% Asian, 0.2% from other races, and 1.6% from two or more races. Hispanic or Latino of any race were 1.2% of the population.
The median household income in Smithville Sanders was $41,250, and the median family income was $45,625. The per capita income for the town was $19,845. About 11.2% of families and 13.2% of the population were below the poverty line, including 17.2% of those under age 18 and 8.3% of those age 65 or over.
Common Questions
What is the Total Population of Smithville Sanders?
Total Population of Smithville Sanders is 3,099.
What is the Total Male Population of Smithville Sanders?
Total Male Population of Smithville Sanders is 1,558.
What is the Total Female Population of Smithville Sanders?
Total Female Population of Smithville Sanders is 1,541.
What is the Ratio of Males per 100 Females in Smithville Sanders?
There are 101.10 Males per 100 Females in Smithville Sanders.
What is the Ratio of Females per 100 Males in Smithville Sanders?
There are 98.91 Females per 100 Males in Smithville Sanders.
What is the Median Population Age in Smithville Sanders?
Median Population Age in Smithville Sanders is 38.7 Years.
What is the Average Family Size in Smithville Sanders
Average Family Size in Smithville Sanders is 2.8 People.
What is the Average Household Size in Smithville Sanders
Average Household Size in Smithville Sanders is 2.3 People.
What is Per Capita Income in Smithville Sanders?
Per Capita income in Smithville Sanders is $47,816.
What is the Median Family Income in Smithville Sanders?
Median Family Income in Smithville Sanders is $111,671.
What is the Median Household income in Smithville Sanders?
Median Household Income in Smithville Sanders is $67,091.
What is Income or Wage Gap in Smithville Sanders?
Income or Wage Gap in Smithville Sanders is 2.5%.
Women in Smithville Sanders earn 97.5 cents for every dollar earned by a man.
What is Inequality or Gini Index in Smithville Sanders?
Inequality or Gini Index in Smithville Sanders is 0.46.
How Large is the Labor Force in Smithville Sanders?
There are 1,634 People in the Labor Forcein in Smithville Sanders.
What is the Percentage of People in the Labor Force in Smithville Sanders?
71.0% of People are in the Labor Force in Smithville Sanders.
What is the Unemployment Rate in Smithville Sanders?
Unemployment Rate in Smithville Sanders is 4.2%.