Russiaville, IN
Russiaville Map
Russiaville Overview
1,349
TOTAL POPULATION
654
MALE POPULATION
695
FEMALE POPULATION
94.10
MALES / 100 FEMALES
106.27
FEMALES / 100 MALES
34.5
MEDIAN AGE
3.2
AVG FAMILY SIZE
2.9
AVG HOUSEHOLD SIZE
$38,269
PER CAPITA INCOME
$87,344
AVG FAMILY INCOME
$84,032
AVG HOUSEHOLD INCOME
17.1%
WAGE / INCOME GAP [ % ]
82.9¢/ $1
WAGE / INCOME GAP [ $ ]
0.38
INEQUALITY / GINI INDEX
626
LABOR FORCE [ PEOPLE ]
61.3%
PERCENT IN LABOR FORCE
2.6%
UNEMPLOYMENT RATE
Russiaville Zip Codes
Russiaville Area Codes
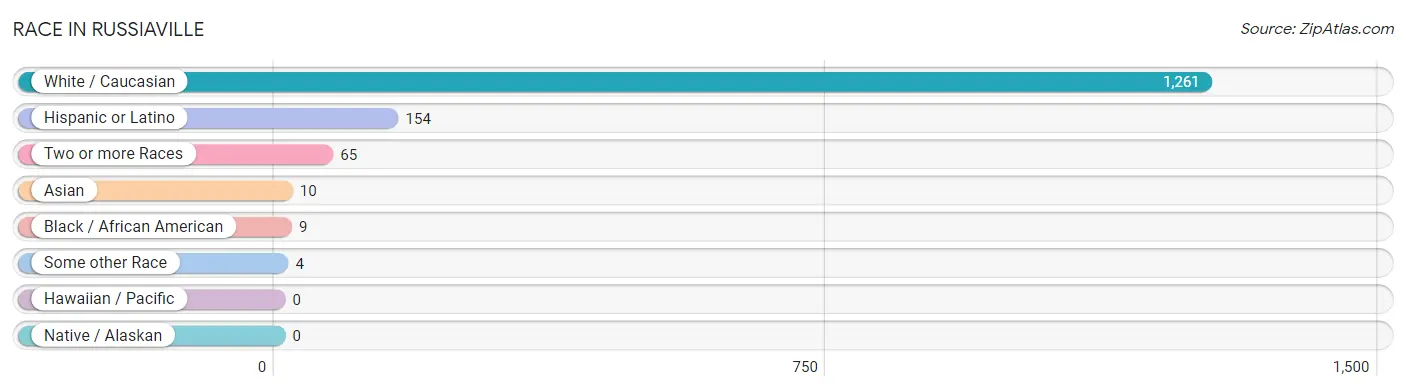
Race in Russiaville
The most populous races in Russiaville are White / Caucasian (1,261 | 93.5%), Hispanic or Latino (154 | 11.4%), and Two or more Races (65 | 4.8%).
| Race | # Population | % Population |
| Asian | 10 | 0.7% |
| Black / African American | 9 | 0.7% |
| Hawaiian / Pacific | 0 | 0.0% |
| Hispanic or Latino | 154 | 11.4% |
| Native / Alaskan | 0 | 0.0% |
| White / Caucasian | 1,261 | 93.5% |
| Two or more Races | 65 | 4.8% |
| Some other Race | 4 | 0.3% |
| Total | 1,349 | 100.0% |
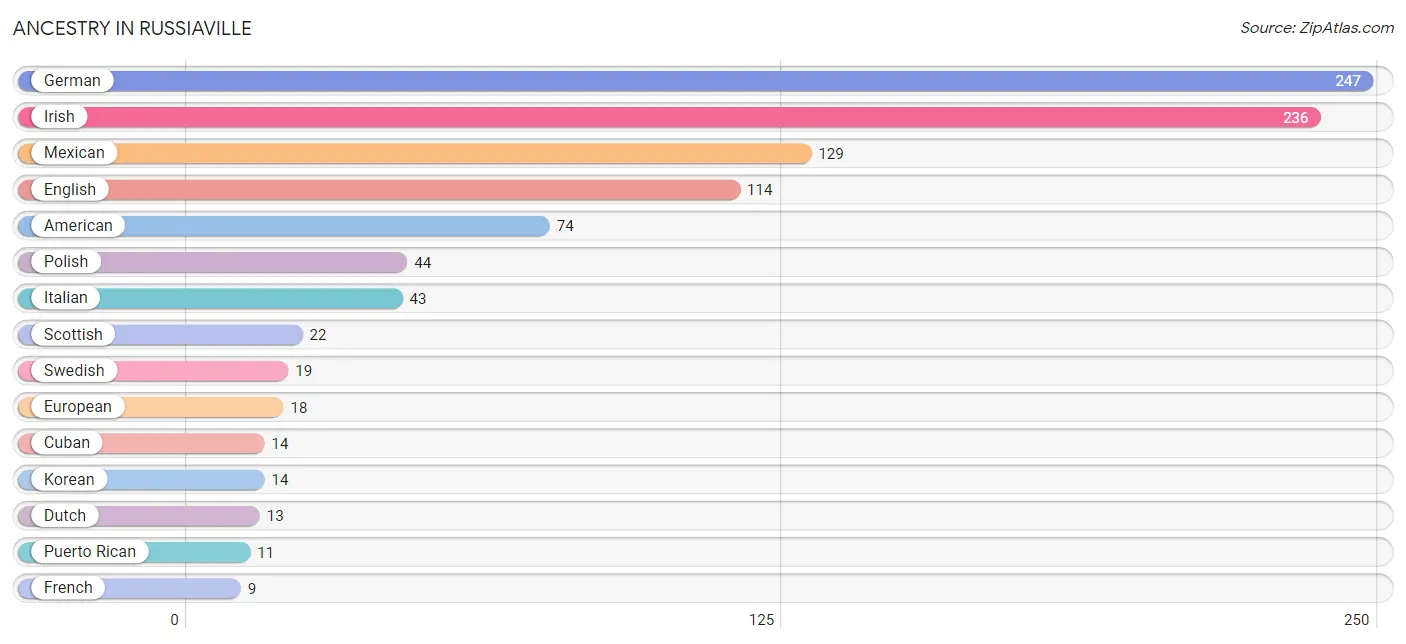
Ancestry in Russiaville
The most populous ancestries reported in Russiaville are German (247 | 18.3%), Irish (236 | 17.5%), Mexican (129 | 9.6%), English (114 | 8.5%), and American (74 | 5.5%), together accounting for 59.3% of all Russiaville residents.
| Ancestry | # Population | % Population |
| American | 74 | 5.5% |
| Cherokee | 5 | 0.4% |
| Cuban | 14 | 1.0% |
| Dutch | 13 | 1.0% |
| English | 114 | 8.5% |
| European | 18 | 1.3% |
| French | 9 | 0.7% |
| German | 247 | 18.3% |
| Indian (Asian) | 7 | 0.5% |
| Irish | 236 | 17.5% |
| Italian | 43 | 3.2% |
| Korean | 14 | 1.0% |
| Macedonian | 2 | 0.2% |
| Mexican | 129 | 9.6% |
| Polish | 44 | 3.3% |
| Puerto Rican | 11 | 0.8% |
| Scandinavian | 8 | 0.6% |
| Scotch-Irish | 5 | 0.4% |
| Scottish | 22 | 1.6% |
| Sioux | 1 | 0.1% |
| Swedish | 19 | 1.4% |
| Welsh | 7 | 0.5% | View All 22 Rows |
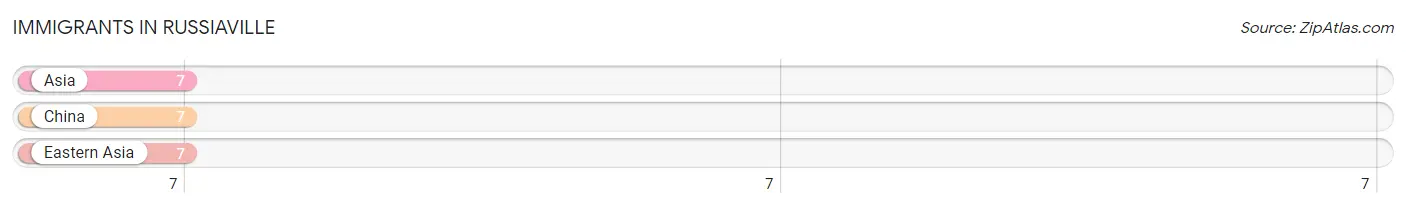
Immigrants in Russiaville
The most numerous immigrant groups reported in Russiaville came from Asia (7 | 0.5%), China (7 | 0.5%), and Eastern Asia (7 | 0.5%), together accounting for 1.6% of all Russiaville residents.
| Immigration Origin | # Population | % Population |
| Asia | 7 | 0.5% |
| China | 7 | 0.5% |
| Eastern Asia | 7 | 0.5% | View All 3 Rows |
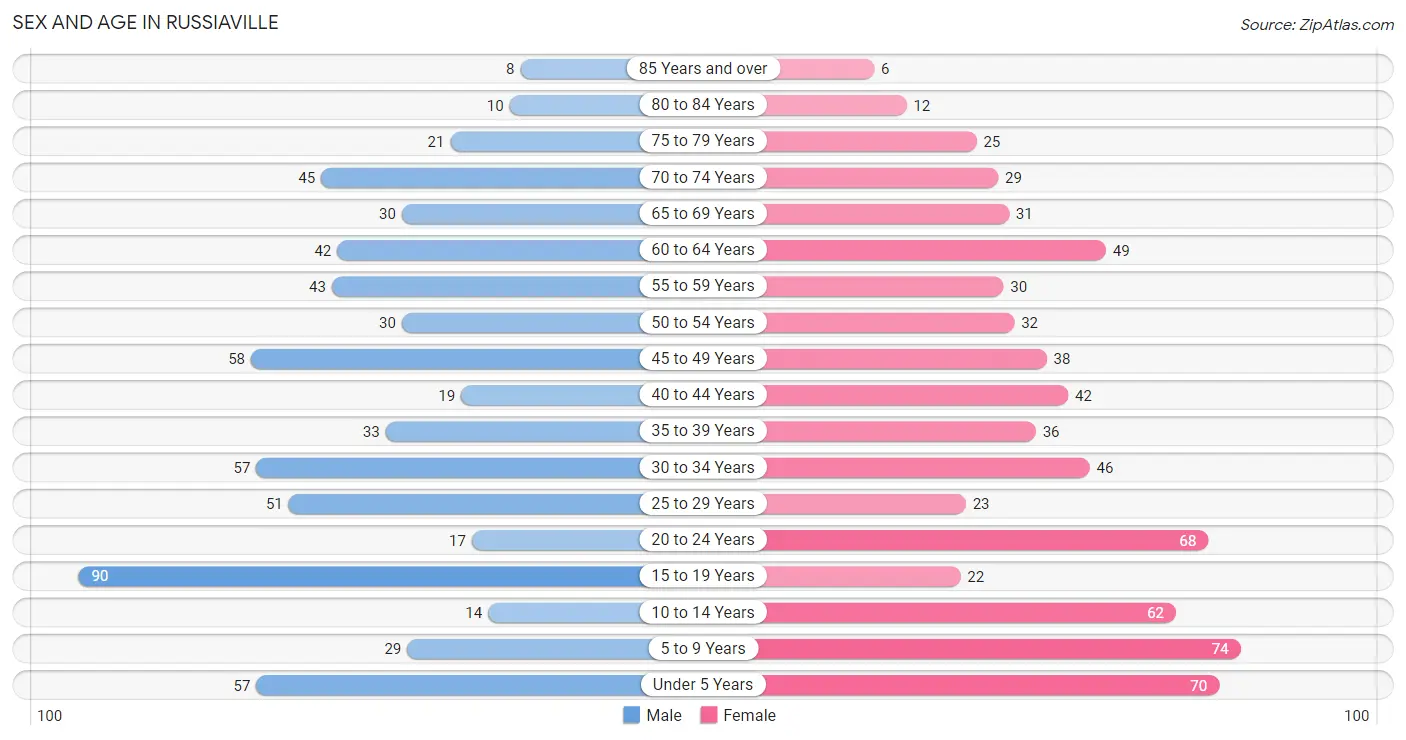
Sex and Age in Russiaville
Sex and Age in Russiaville
The most populous age groups in Russiaville are 15 to 19 Years (90 | 13.8%) for men and 5 to 9 Years (74 | 10.6%) for women.
| Age Bracket | Male | Female |
| Under 5 Years | 57 (8.7%) | 70 (10.1%) |
| 5 to 9 Years | 29 (4.4%) | 74 (10.6%) |
| 10 to 14 Years | 14 (2.1%) | 62 (8.9%) |
| 15 to 19 Years | 90 (13.8%) | 22 (3.2%) |
| 20 to 24 Years | 17 (2.6%) | 68 (9.8%) |
| 25 to 29 Years | 51 (7.8%) | 23 (3.3%) |
| 30 to 34 Years | 57 (8.7%) | 46 (6.6%) |
| 35 to 39 Years | 33 (5.1%) | 36 (5.2%) |
| 40 to 44 Years | 19 (2.9%) | 42 (6.0%) |
| 45 to 49 Years | 58 (8.9%) | 38 (5.5%) |
| 50 to 54 Years | 30 (4.6%) | 32 (4.6%) |
| 55 to 59 Years | 43 (6.6%) | 30 (4.3%) |
| 60 to 64 Years | 42 (6.4%) | 49 (7.0%) |
| 65 to 69 Years | 30 (4.6%) | 31 (4.5%) |
| 70 to 74 Years | 45 (6.9%) | 29 (4.2%) |
| 75 to 79 Years | 21 (3.2%) | 25 (3.6%) |
| 80 to 84 Years | 10 (1.5%) | 12 (1.7%) |
| 85 Years and over | 8 (1.2%) | 6 (0.9%) |
| Total | 654 (100.0%) | 695 (100.0%) |
Families and Households in Russiaville
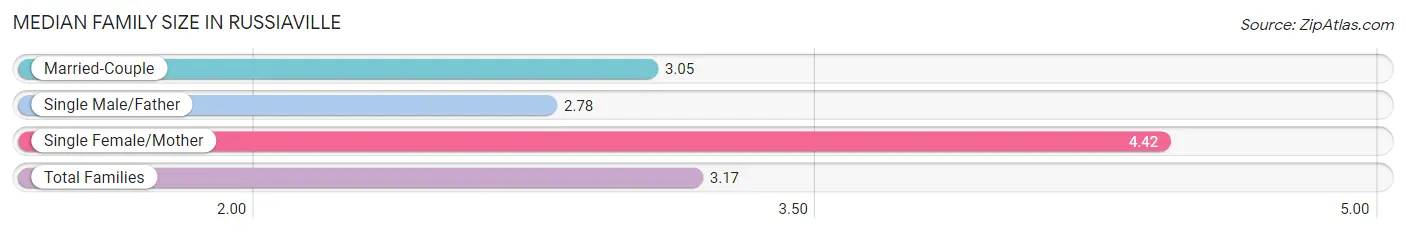
Median Family Size in Russiaville
The median family size in Russiaville is 3.17 persons per family, with single female/mother families (38 | 10.0%) accounting for the largest median family size of 4.42 persons per family. On the other hand, single male/father families (23 | 6.0%) represent the smallest median family size with 2.78 persons per family.
| Family Type | # Families | Family Size |
| Married-Couple | 320 (84.0%) | 3.05 |
| Single Male/Father | 23 (6.0%) | 2.78 |
| Single Female/Mother | 38 (10.0%) | 4.42 |
| Total Families | 381 (100.0%) | 3.17 |
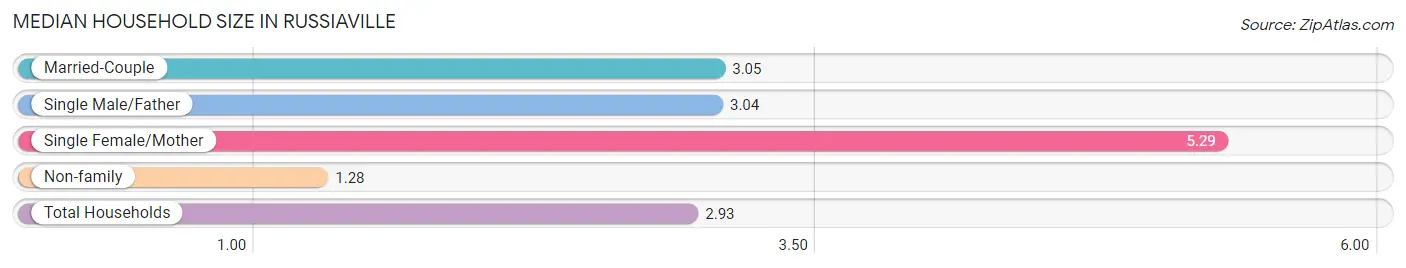
Median Household Size in Russiaville
The median household size in Russiaville is 2.93 persons per household, with single female/mother households (38 | 8.3%) accounting for the largest median household size of 5.29 persons per household. non-family households (79 | 17.2%) represent the smallest median household size with 1.28 persons per household.
| Household Type | # Households | Household Size |
| Married-Couple | 320 (69.6%) | 3.05 |
| Single Male/Father | 23 (5.0%) | 3.04 |
| Single Female/Mother | 38 (8.3%) | 5.29 |
| Non-family | 79 (17.2%) | 1.28 |
| Total Households | 460 (100.0%) | 2.93 |
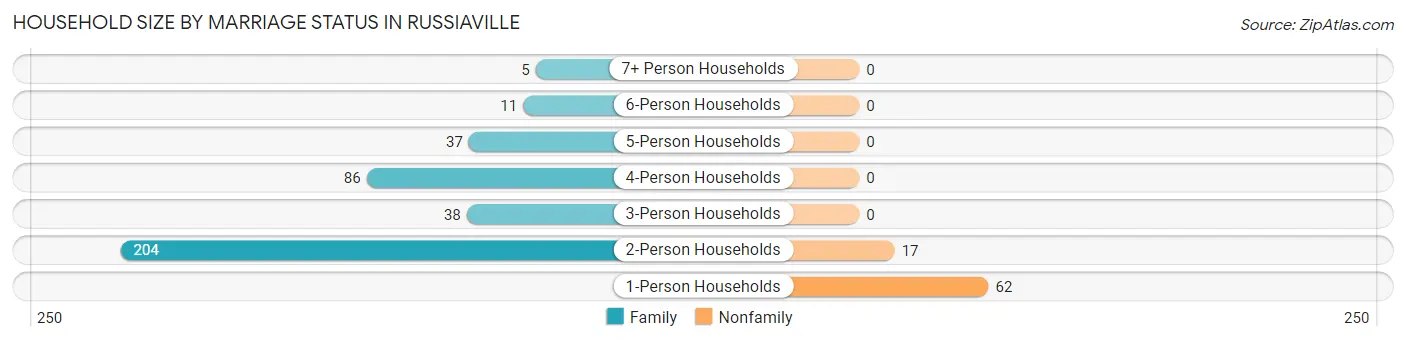
Household Size by Marriage Status in Russiaville
Out of a total of 460 households in Russiaville, 381 (82.8%) are family households, while 79 (17.2%) are nonfamily households. The most numerous type of family households are 2-person households, comprising 204, and the most common type of nonfamily households are 1-person households, comprising 62.
| Household Size | Family Households | Nonfamily Households |
| 1-Person Households | - | 62 (13.5%) |
| 2-Person Households | 204 (44.4%) | 17 (3.7%) |
| 3-Person Households | 38 (8.3%) | 0 (0.0%) |
| 4-Person Households | 86 (18.7%) | 0 (0.0%) |
| 5-Person Households | 37 (8.0%) | 0 (0.0%) |
| 6-Person Households | 11 (2.4%) | 0 (0.0%) |
| 7+ Person Households | 5 (1.1%) | 0 (0.0%) |
| Total | 381 (82.8%) | 79 (17.2%) |
Female Fertility in Russiaville
Fertility by Age in Russiaville
Average fertility rate in Russiaville is 76.0 births per 1,000 women. Women in the age bracket of 35 to 50 years have the highest fertility rate with 138.0 births per 1,000 women. Women in the age bracket of 35 to 50 years acount for 76.2% of all women with births.
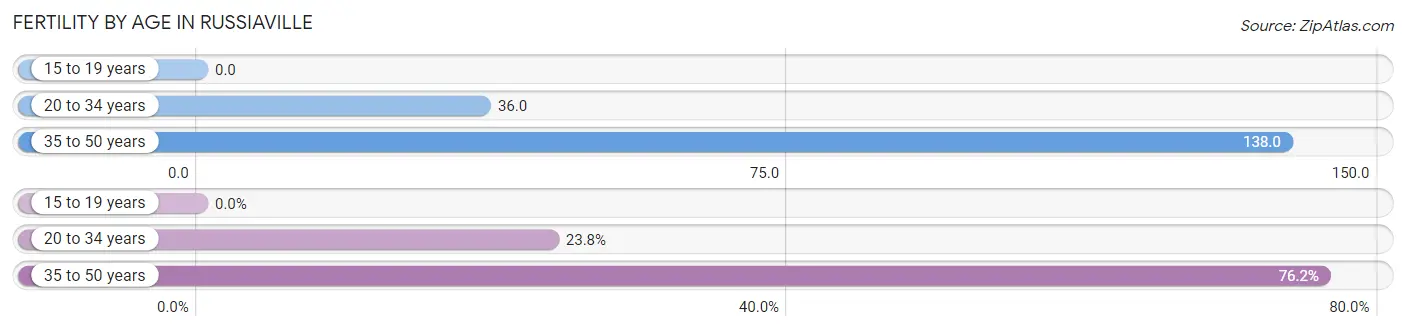
| Age Bracket | Women with Births | Births / 1,000 Women |
| 15 to 19 years | 0 (0.0%) | 0.0 |
| 20 to 34 years | 5 (23.8%) | 36.0 |
| 35 to 50 years | 16 (76.2%) | 138.0 |
| Total | 21 (100.0%) | 76.0 |
Fertility by Age by Marriage Status in Russiaville
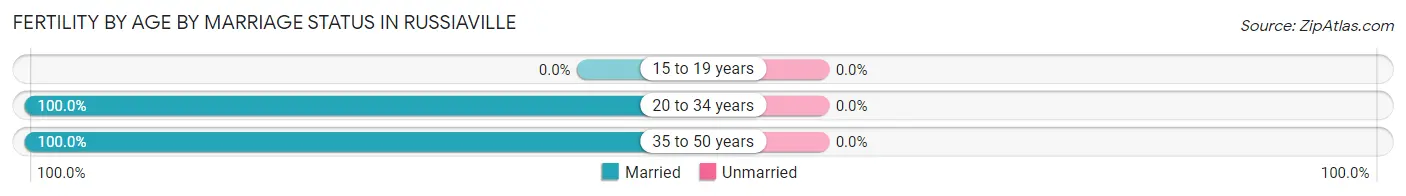
| Age Bracket | Married | Unmarried |
| 15 to 19 years | 0 (0.0%) | 0 (0.0%) |
| 20 to 34 years | 5 (100.0%) | 0 (0.0%) |
| 35 to 50 years | 16 (100.0%) | 0 (0.0%) |
| Total | 21 (100.0%) | 0 (0.0%) |
Fertility by Education in Russiaville
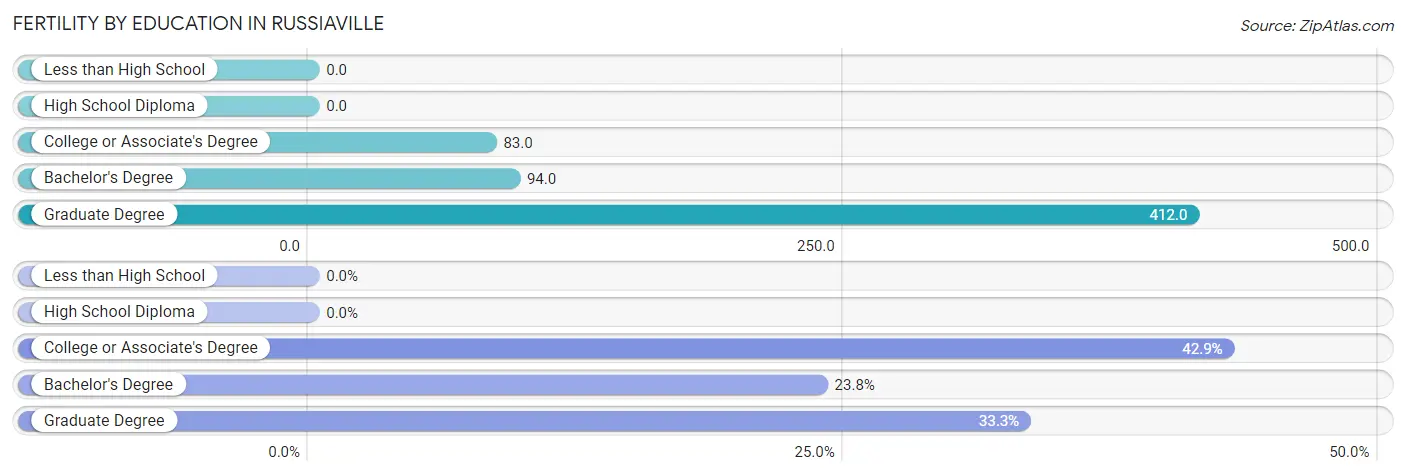
| Educational Attainment | Women with Births | Births / 1,000 Women |
| Less than High School | 0 (0.0%) | 0.0 |
| High School Diploma | 0 (0.0%) | 0.0 |
| College or Associate's Degree | 9 (42.9%) | 83.0 |
| Bachelor's Degree | 5 (23.8%) | 94.0 |
| Graduate Degree | 7 (33.3%) | 412.0 |
| Total | 21 (100.0%) | 76.0 |
Fertility by Education by Marriage Status in Russiaville
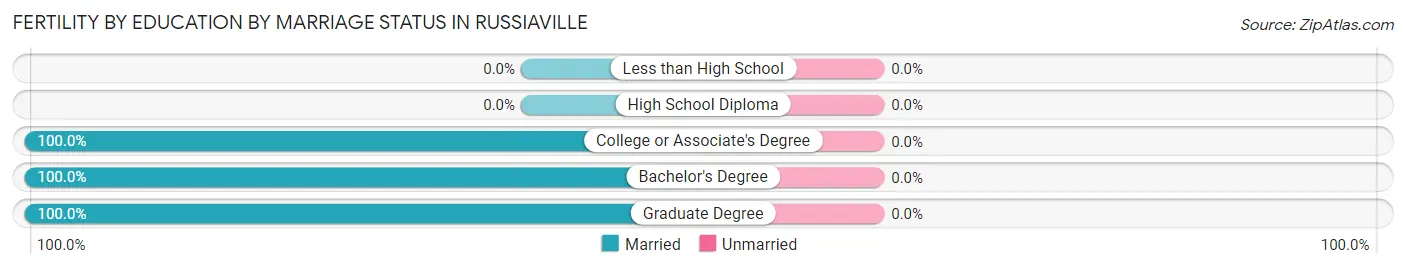
| Educational Attainment | Married | Unmarried |
| Less than High School | 0 (0.0%) | 0 (0.0%) |
| High School Diploma | 0 (0.0%) | 0 (0.0%) |
| College or Associate's Degree | 9 (100.0%) | 0 (0.0%) |
| Bachelor's Degree | 5 (100.0%) | 0 (0.0%) |
| Graduate Degree | 7 (100.0%) | 0 (0.0%) |
| Total | 21 (100.0%) | 0 (0.0%) |
Income in Russiaville
Income Overview in Russiaville
Per Capita Income in Russiaville is $38,269, while median incomes of families and households are $87,344 and $84,032 respectively.
| Characteristic | Number | Measure |
| Per Capita Income | 1,349 | $38,269 |
| Median Family Income | 381 | $87,344 |
| Mean Family Income | 381 | $119,345 |
| Median Household Income | 460 | $84,032 |
| Mean Household Income | 460 | $108,439 |
| Income Deficit | 381 | $0 |
| Wage / Income Gap (%) | 1,349 | 17.14% |
| Wage / Income Gap ($) | 1,349 | 82.86¢ per $1 |
| Gini / Inequality Index | 1,349 | 0.38 |
Earnings by Sex in Russiaville
Average Earnings in Russiaville are $47,083, $53,929 for men and $44,688 for women, a difference of 17.1%.
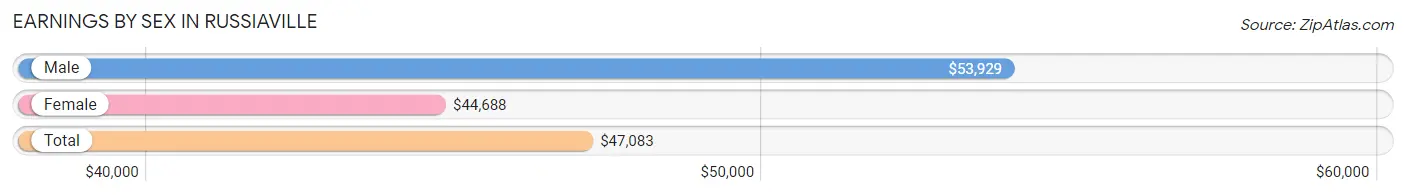
| Sex | Number | Average Earnings |
| Male | 366 (54.9%) | $53,929 |
| Female | 301 (45.1%) | $44,688 |
| Total | 667 (100.0%) | $47,083 |
Earnings by Sex by Income Bracket in Russiaville
The most common earnings brackets in Russiaville are $100,000+ for men (91 | 24.9%) and $45,000 to $49,999 for women (46 | 15.3%).
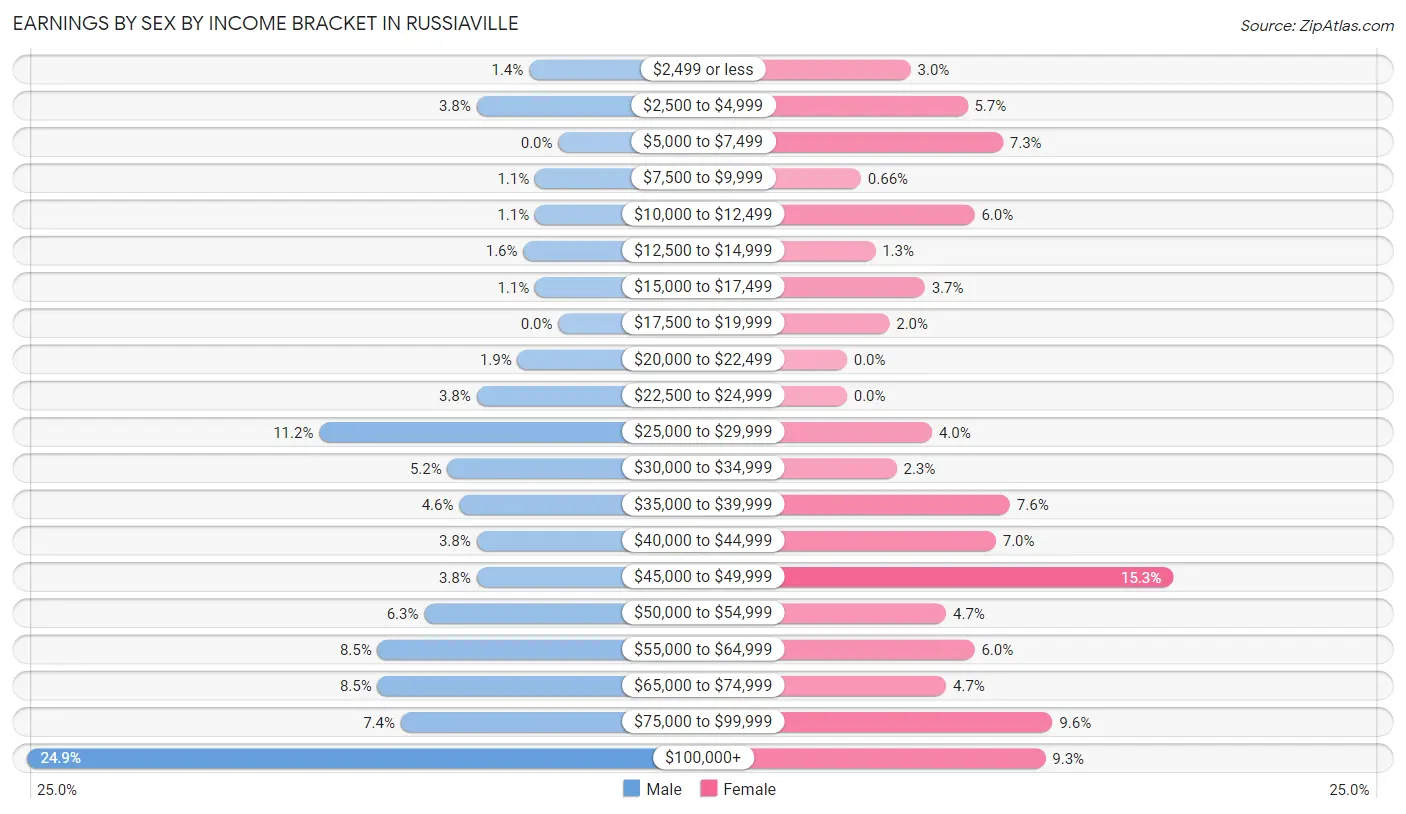
| Income | Male | Female |
| $2,499 or less | 5 (1.4%) | 9 (3.0%) |
| $2,500 to $4,999 | 14 (3.8%) | 17 (5.7%) |
| $5,000 to $7,499 | 0 (0.0%) | 22 (7.3%) |
| $7,500 to $9,999 | 4 (1.1%) | 2 (0.7%) |
| $10,000 to $12,499 | 4 (1.1%) | 18 (6.0%) |
| $12,500 to $14,999 | 6 (1.6%) | 4 (1.3%) |
| $15,000 to $17,499 | 4 (1.1%) | 11 (3.6%) |
| $17,500 to $19,999 | 0 (0.0%) | 6 (2.0%) |
| $20,000 to $22,499 | 7 (1.9%) | 0 (0.0%) |
| $22,500 to $24,999 | 14 (3.8%) | 0 (0.0%) |
| $25,000 to $29,999 | 41 (11.2%) | 12 (4.0%) |
| $30,000 to $34,999 | 19 (5.2%) | 7 (2.3%) |
| $35,000 to $39,999 | 17 (4.6%) | 23 (7.6%) |
| $40,000 to $44,999 | 14 (3.8%) | 21 (7.0%) |
| $45,000 to $49,999 | 14 (3.8%) | 46 (15.3%) |
| $50,000 to $54,999 | 23 (6.3%) | 14 (4.6%) |
| $55,000 to $64,999 | 31 (8.5%) | 18 (6.0%) |
| $65,000 to $74,999 | 31 (8.5%) | 14 (4.6%) |
| $75,000 to $99,999 | 27 (7.4%) | 29 (9.6%) |
| $100,000+ | 91 (24.9%) | 28 (9.3%) |
| Total | 366 (100.0%) | 301 (100.0%) |
Earnings by Sex by Educational Attainment in Russiaville
Average earnings in Russiaville are $61,023 for men and $47,917 for women, a difference of 21.5%. Men with an educational attainment of graduate degree enjoy the highest average annual earnings of $116,563, while those with high school diploma education earn the least with $45,156. Women with an educational attainment of bachelor's degree earn the most with the average annual earnings of $63,333, while those with college or associate's degree education have the smallest earnings of $53,750.
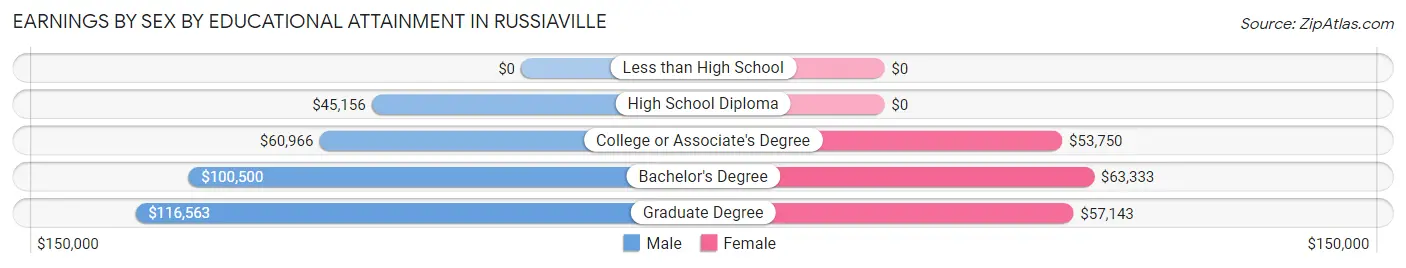
| Educational Attainment | Male Income | Female Income |
| Less than High School | - | - |
| High School Diploma | $45,156 | $0 |
| College or Associate's Degree | $60,966 | $53,750 |
| Bachelor's Degree | $100,500 | $63,333 |
| Graduate Degree | $116,563 | $57,143 |
| Total | $61,023 | $47,917 |
Family Income in Russiaville
Family Income Brackets in Russiaville
According to the Russiaville family income data, there are 102 families falling into the $75,000 to $99,999 income range, which is the most common income bracket and makes up 26.8% of all families. Conversely, the $10,000 to $14,999 income bracket is the least frequent group with only 2 families (0.5%) belonging to this category.
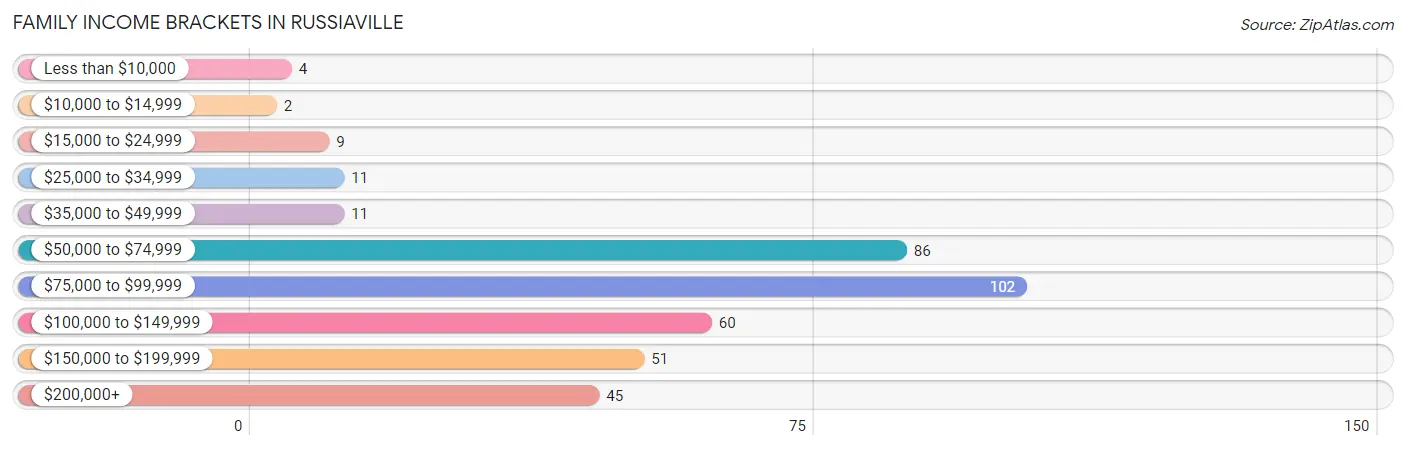
| Income Bracket | # Families | % Families |
| Less than $10,000 | 4 | 1.0% |
| $10,000 to $14,999 | 2 | 0.5% |
| $15,000 to $24,999 | 9 | 2.4% |
| $25,000 to $34,999 | 11 | 2.9% |
| $35,000 to $49,999 | 11 | 2.9% |
| $50,000 to $74,999 | 86 | 22.6% |
| $75,000 to $99,999 | 102 | 26.8% |
| $100,000 to $149,999 | 60 | 15.7% |
| $150,000 to $199,999 | 51 | 13.4% |
| $200,000+ | 45 | 11.8% |
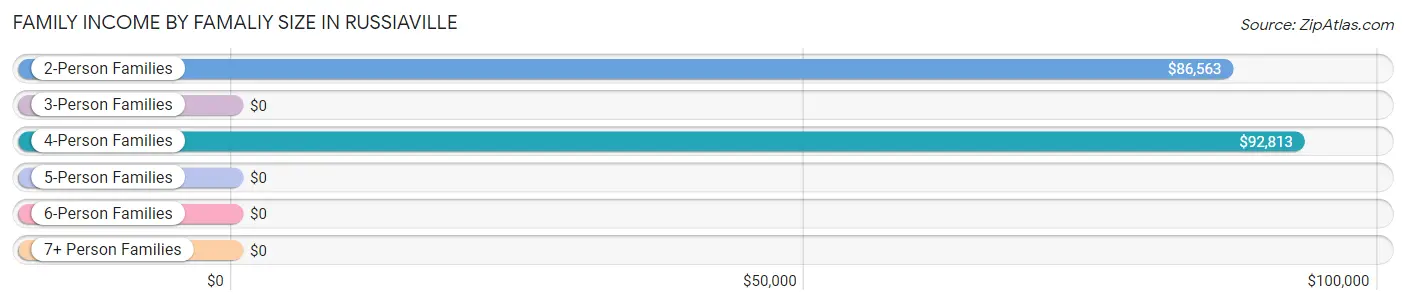
Family Income by Famaliy Size in Russiaville
4-person families (83 | 21.8%) account for the highest median family income in Russiaville with $92,813 per family, while 2-person families (210 | 55.1%) have the highest median income of $43,282 per family member.
| Income Bracket | # Families | Median Income |
| 2-Person Families | 210 (55.1%) | $86,563 |
| 3-Person Families | 36 (9.5%) | $0 |
| 4-Person Families | 83 (21.8%) | $92,813 |
| 5-Person Families | 47 (12.3%) | $0 |
| 6-Person Families | 0 (0.0%) | $0 |
| 7+ Person Families | 5 (1.3%) | $0 |
| Total | 381 (100.0%) | $87,344 |
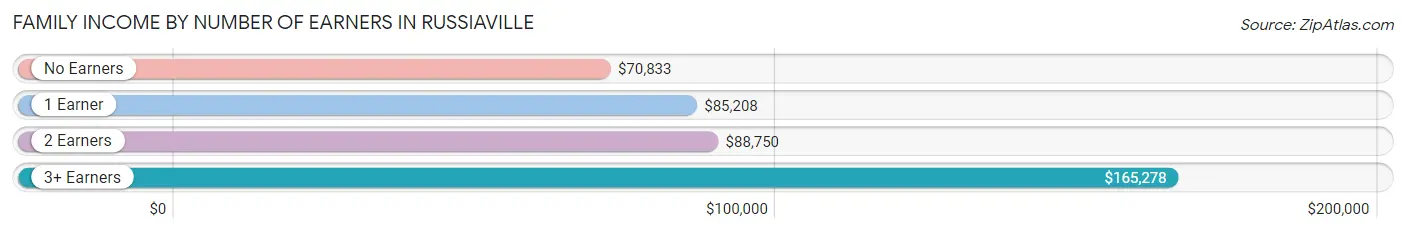
Family Income by Number of Earners in Russiaville
The median family income in Russiaville is $87,344, with families comprising 3+ earners (42) having the highest median family income of $165,278, while families with no earners (56) have the lowest median family income of $70,833, accounting for 11.0% and 14.7% of families, respectively.
| Number of Earners | # Families | Median Income |
| No Earners | 56 (14.7%) | $70,833 |
| 1 Earner | 145 (38.1%) | $85,208 |
| 2 Earners | 138 (36.2%) | $88,750 |
| 3+ Earners | 42 (11.0%) | $165,278 |
| Total | 381 (100.0%) | $87,344 |
Household Income in Russiaville
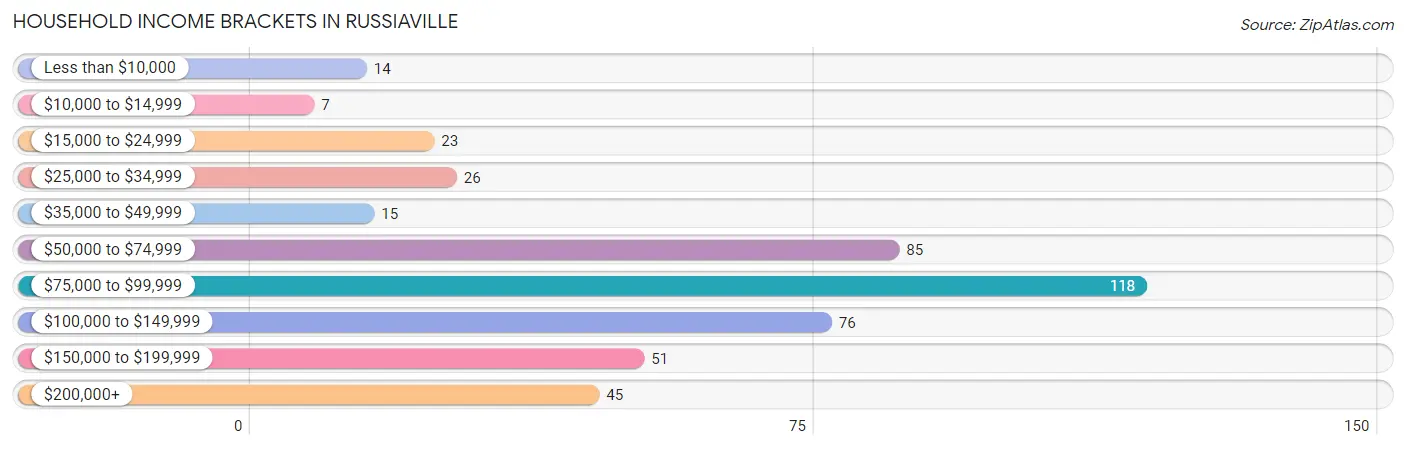
Household Income Brackets in Russiaville
With 118 households falling in the category, the $75,000 to $99,999 income range is the most frequent in Russiaville, accounting for 25.7% of all households. In contrast, only 7 households (1.5%) fall into the $10,000 to $14,999 income bracket, making it the least populous group.
| Income Bracket | # Households | % Households |
| Less than $10,000 | 14 | 3.0% |
| $10,000 to $14,999 | 7 | 1.5% |
| $15,000 to $24,999 | 23 | 5.0% |
| $25,000 to $34,999 | 26 | 5.7% |
| $35,000 to $49,999 | 15 | 3.3% |
| $50,000 to $74,999 | 85 | 18.5% |
| $75,000 to $99,999 | 118 | 25.7% |
| $100,000 to $149,999 | 76 | 16.5% |
| $150,000 to $199,999 | 51 | 11.1% |
| $200,000+ | 45 | 9.8% |
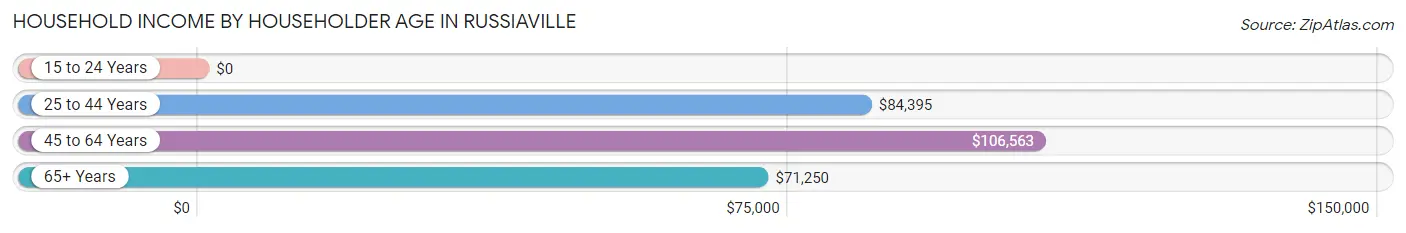
Household Income by Householder Age in Russiaville
The median household income in Russiaville is $84,032, with the highest median household income of $106,563 found in the 45 to 64 years age bracket for the primary householder. A total of 155 households (33.7%) fall into this category. Meanwhile, the 15 to 24 years age bracket for the primary householder has the lowest median household income of $0, with 9 households (2.0%) in this group.
| Income Bracket | # Households | Median Income |
| 15 to 24 Years | 9 (2.0%) | $0 |
| 25 to 44 Years | 167 (36.3%) | $84,395 |
| 45 to 64 Years | 155 (33.7%) | $106,563 |
| 65+ Years | 129 (28.0%) | $71,250 |
| Total | 460 (100.0%) | $84,032 |
Poverty in Russiaville
Income Below Poverty by Sex and Age in Russiaville
With 1.8% poverty level for males and 5.6% for females among the residents of Russiaville, 15 year old males and 16 and 17 year old females are the most vulnerable to poverty, with 9 males (47.4%) and 3 females (27.3%) in their respective age groups living below the poverty level.
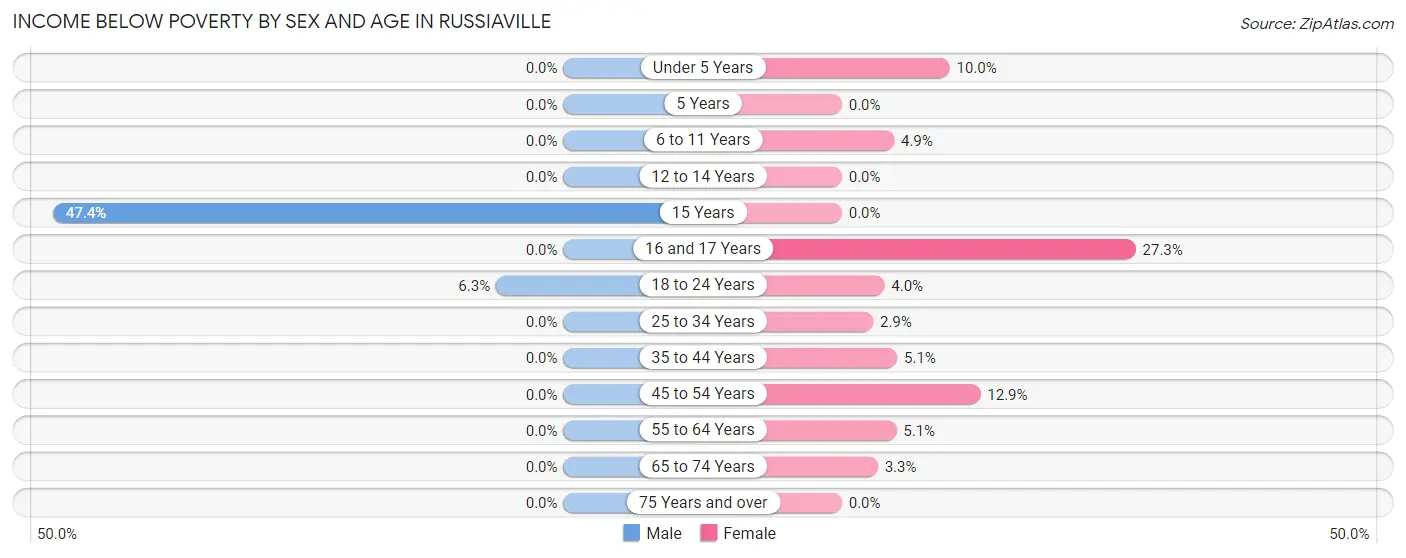
| Age Bracket | Male | Female |
| Under 5 Years | 0 (0.0%) | 7 (10.0%) |
| 5 Years | 0 (0.0%) | 0 (0.0%) |
| 6 to 11 Years | 0 (0.0%) | 5 (4.9%) |
| 12 to 14 Years | 0 (0.0%) | 0 (0.0%) |
| 15 Years | 9 (47.4%) | 0 (0.0%) |
| 16 and 17 Years | 0 (0.0%) | 3 (27.3%) |
| 18 to 24 Years | 3 (6.2%) | 3 (4.0%) |
| 25 to 34 Years | 0 (0.0%) | 2 (2.9%) |
| 35 to 44 Years | 0 (0.0%) | 4 (5.1%) |
| 45 to 54 Years | 0 (0.0%) | 9 (12.9%) |
| 55 to 64 Years | 0 (0.0%) | 4 (5.1%) |
| 65 to 74 Years | 0 (0.0%) | 2 (3.3%) |
| 75 Years and over | 0 (0.0%) | 0 (0.0%) |
| Total | 12 (1.8%) | 39 (5.6%) |
Income Above Poverty by Sex and Age in Russiaville
According to the poverty statistics in Russiaville, males aged under 5 years and females aged 5 years are the age groups that are most secure financially, with 100.0% of males and 100.0% of females in these age groups living above the poverty line.
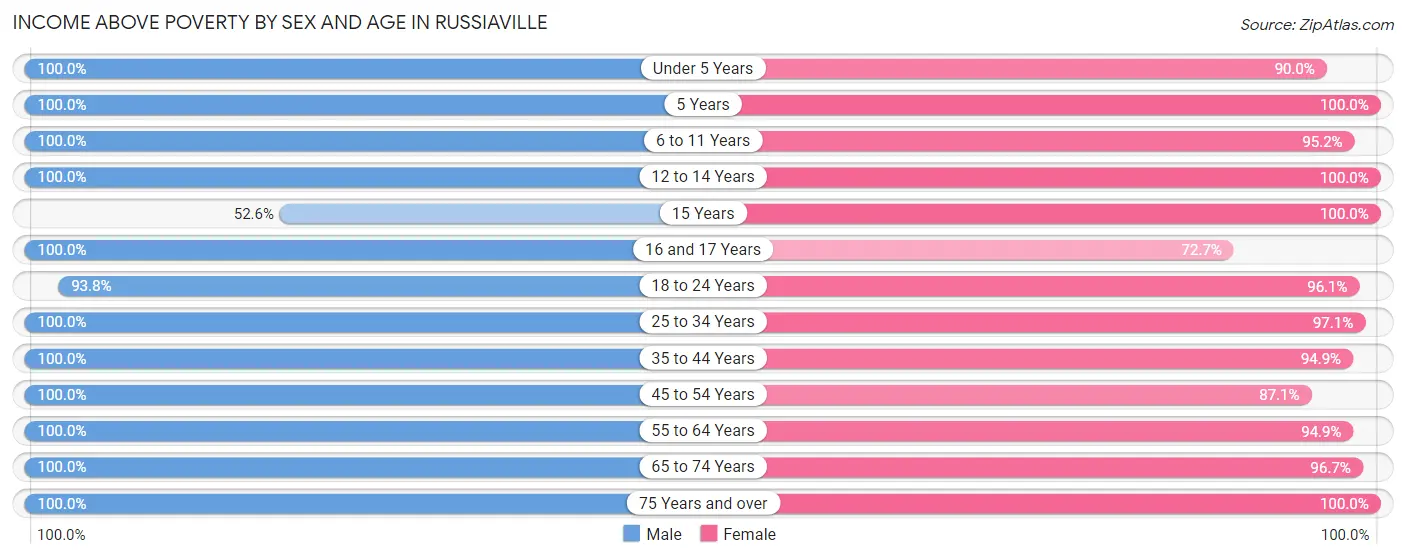
| Age Bracket | Male | Female |
| Under 5 Years | 57 (100.0%) | 63 (90.0%) |
| 5 Years | 5 (100.0%) | 9 (100.0%) |
| 6 to 11 Years | 26 (100.0%) | 98 (95.2%) |
| 12 to 14 Years | 12 (100.0%) | 24 (100.0%) |
| 15 Years | 10 (52.6%) | 3 (100.0%) |
| 16 and 17 Years | 40 (100.0%) | 8 (72.7%) |
| 18 to 24 Years | 45 (93.8%) | 73 (96.1%) |
| 25 to 34 Years | 108 (100.0%) | 67 (97.1%) |
| 35 to 44 Years | 52 (100.0%) | 74 (94.9%) |
| 45 to 54 Years | 88 (100.0%) | 61 (87.1%) |
| 55 to 64 Years | 85 (100.0%) | 75 (94.9%) |
| 65 to 74 Years | 75 (100.0%) | 58 (96.7%) |
| 75 Years and over | 39 (100.0%) | 43 (100.0%) |
| Total | 642 (98.2%) | 656 (94.4%) |
Income Below Poverty Among Married-Couple Families in Russiaville
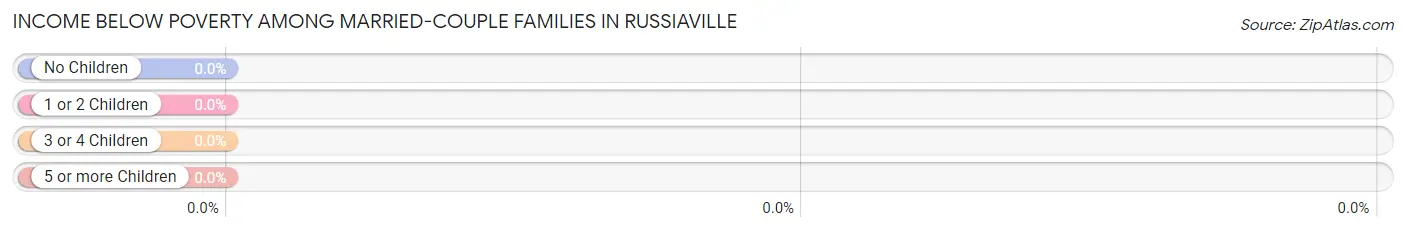
| Children | Above Poverty | Below Poverty |
| No Children | 205 (100.0%) | 0 (0.0%) |
| 1 or 2 Children | 97 (100.0%) | 0 (0.0%) |
| 3 or 4 Children | 16 (100.0%) | 0 (0.0%) |
| 5 or more Children | 2 (100.0%) | 0 (0.0%) |
| Total | 320 (100.0%) | 0 (0.0%) |
Income Below Poverty Among Single-Parent Households in Russiaville
According to the poverty data in Russiaville, 13.0% or 3 single-father households and 15.8% or 6 single-mother households are living below the poverty line. Among single-father households, those with 1 or 2 children have the highest poverty rate, with 3 households (25.0%) experiencing poverty. Likewise, among single-mother households, those with 3 or 4 children have the highest poverty rate, with 4 households (22.2%) falling below the poverty line.
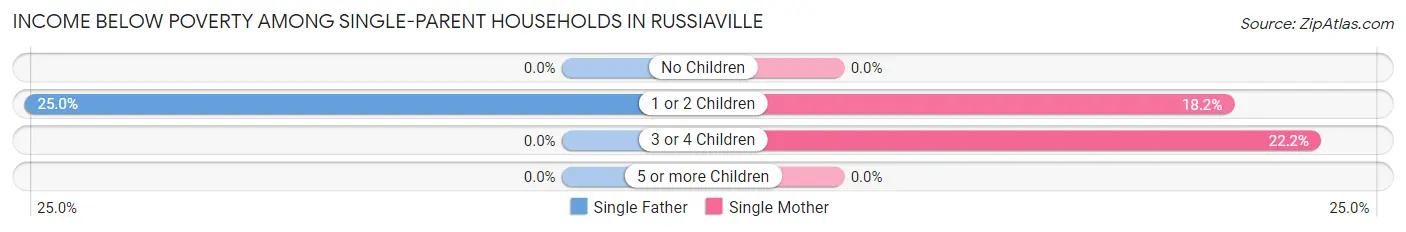
| Children | Single Father | Single Mother |
| No Children | 0 (0.0%) | 0 (0.0%) |
| 1 or 2 Children | 3 (25.0%) | 2 (18.2%) |
| 3 or 4 Children | 0 (0.0%) | 4 (22.2%) |
| 5 or more Children | 0 (0.0%) | 0 (0.0%) |
| Total | 3 (13.0%) | 6 (15.8%) |
Income Below Poverty Among Married-Couple vs Single-Parent Households in Russiaville
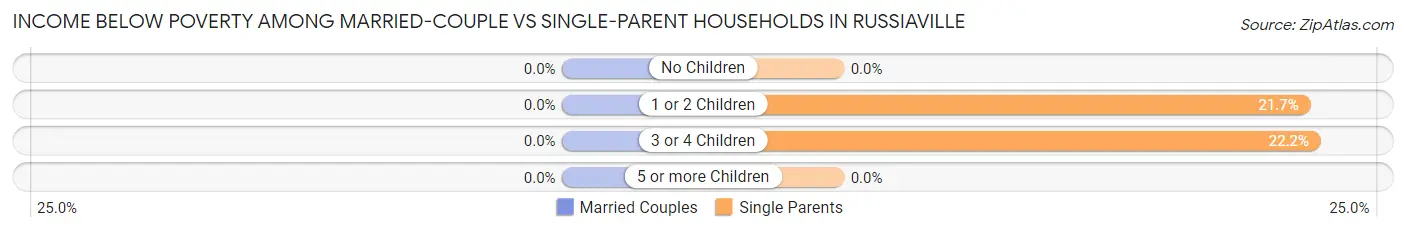
| Children | Married-Couple Families | Single-Parent Households |
| No Children | 0 (0.0%) | 0 (0.0%) |
| 1 or 2 Children | 0 (0.0%) | 5 (21.7%) |
| 3 or 4 Children | 0 (0.0%) | 4 (22.2%) |
| 5 or more Children | 0 (0.0%) | 0 (0.0%) |
| Total | 0 (0.0%) | 9 (14.7%) |
Employment Characteristics in Russiaville
Employment by Class of Employer in Russiaville
Among the 564 employed individuals in Russiaville, private company employees (420 | 74.5%), local government employees (49 | 8.7%), and not-for-profit organizations (33 | 5.9%) make up the most common classes of employment.
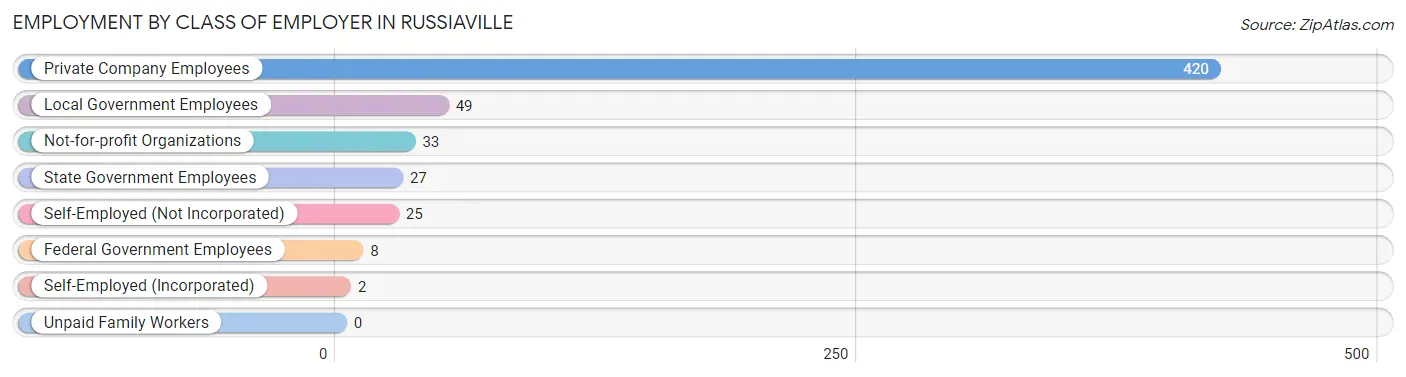
| Employer Class | # Employees | % Employees |
| Private Company Employees | 420 | 74.5% |
| Self-Employed (Incorporated) | 2 | 0.4% |
| Self-Employed (Not Incorporated) | 25 | 4.4% |
| Not-for-profit Organizations | 33 | 5.9% |
| Local Government Employees | 49 | 8.7% |
| State Government Employees | 27 | 4.8% |
| Federal Government Employees | 8 | 1.4% |
| Unpaid Family Workers | 0 | 0.0% |
| Total | 564 | 100.0% |
Employment Status by Age in Russiaville
According to the labor force statistics for Russiaville, out of the total population over 16 years of age (1,021), 61.3% or 626 individuals are in the labor force, with 2.6% or 16 of them unemployed. The age group with the highest labor force participation rate is 45 to 54 years, with 94.3% or 149 individuals in the labor force. Within the labor force, the 60 to 64 years age range has the highest percentage of unemployed individuals, with 12.3% or 7 of them being unemployed.
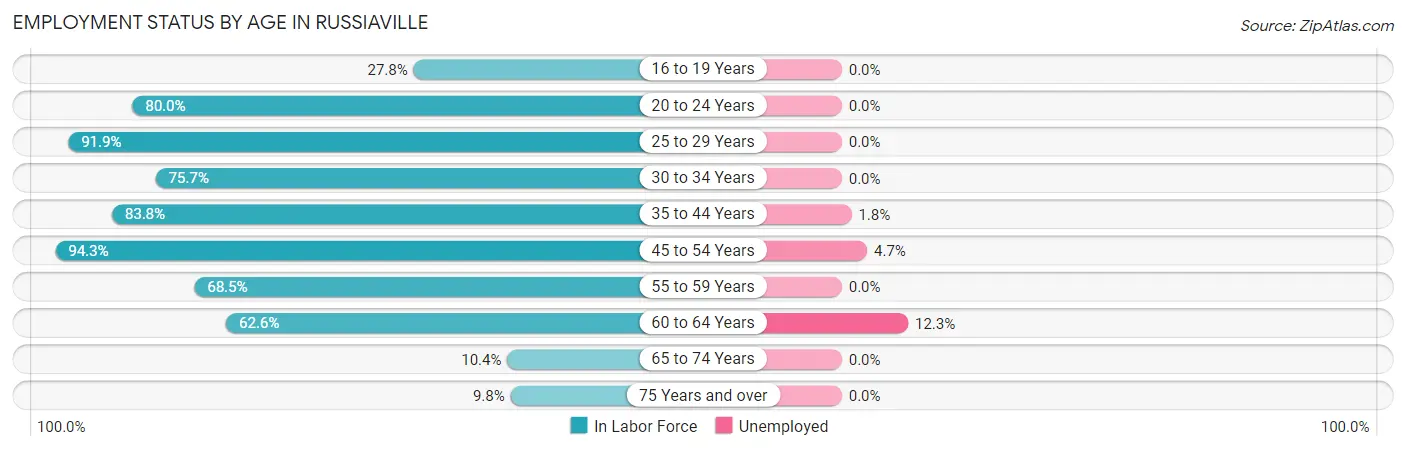
| Age Bracket | In Labor Force | Unemployed |
| 16 to 19 Years | 25 (27.8%) | 0 (0.0%) |
| 20 to 24 Years | 68 (80.0%) | 0 (0.0%) |
| 25 to 29 Years | 68 (91.9%) | 0 (0.0%) |
| 30 to 34 Years | 78 (75.7%) | 0 (0.0%) |
| 35 to 44 Years | 109 (83.8%) | 2 (1.8%) |
| 45 to 54 Years | 149 (94.3%) | 7 (4.7%) |
| 55 to 59 Years | 50 (68.5%) | 0 (0.0%) |
| 60 to 64 Years | 57 (62.6%) | 7 (12.3%) |
| 65 to 74 Years | 14 (10.4%) | 0 (0.0%) |
| 75 Years and over | 8 (9.8%) | 0 (0.0%) |
| Total | 626 (61.3%) | 16 (2.6%) |
Employment Status by Educational Attainment in Russiaville
According to labor force statistics for Russiaville, 81.2% of individuals (511) out of the total population between 25 and 64 years of age (629) are in the labor force, with 3.1% or 16 of them being unemployed. The group with the highest labor force participation rate are those with the educational attainment of bachelor's degree or higher, with 93.3% or 112 individuals in the labor force. Within the labor force, individuals with bachelor's degree or higher education have the highest percentage of unemployment, with 6.3% or 7 of them being unemployed.
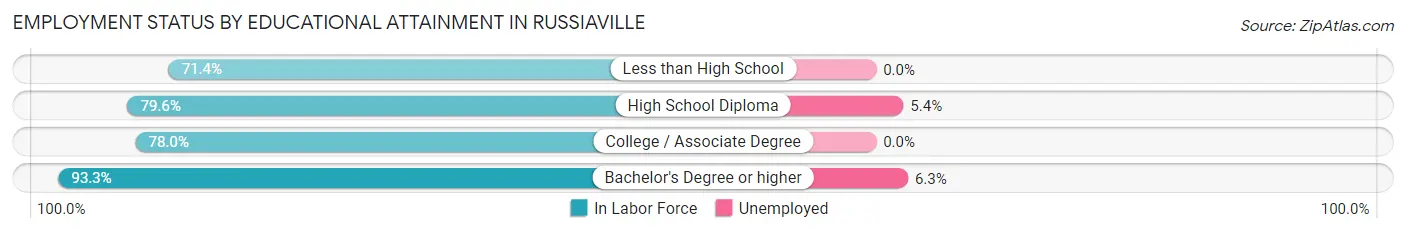
| Educational Attainment | In Labor Force | Unemployed |
| Less than High School | 15 (71.4%) | 0 (0.0%) |
| High School Diploma | 168 (79.6%) | 11 (5.4%) |
| College / Associate Degree | 216 (78.0%) | 0 (0.0%) |
| Bachelor's Degree or higher | 112 (93.3%) | 8 (6.3%) |
| Total | 511 (81.2%) | 19 (3.1%) |
Employment Occupations by Sex in Russiaville
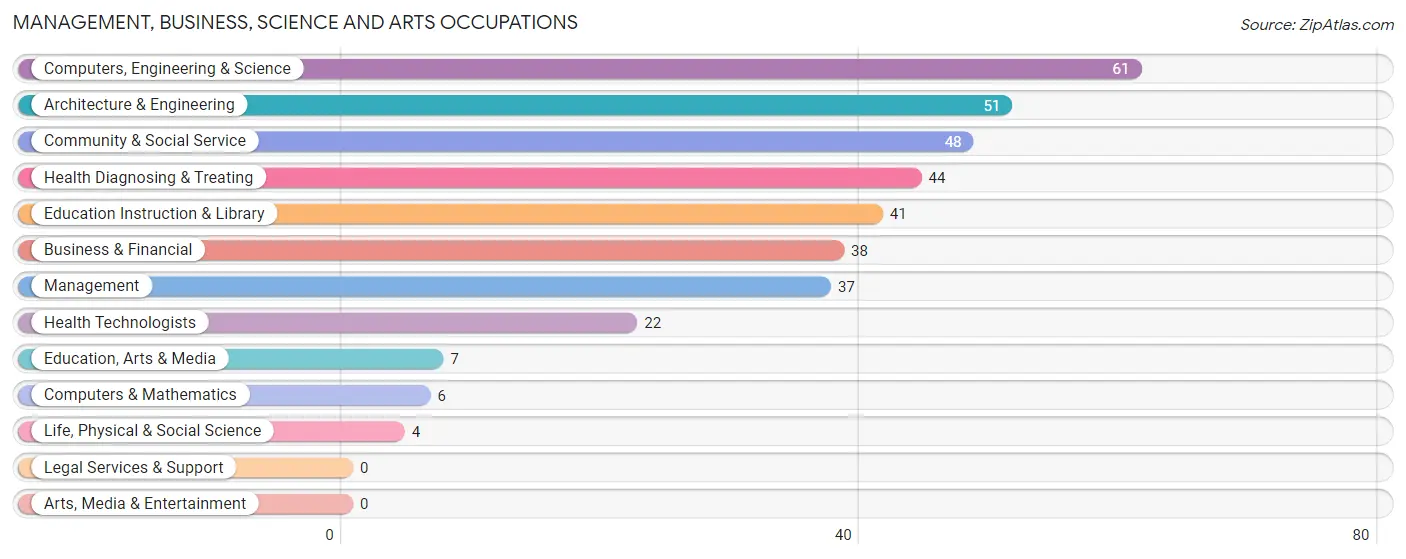
Management, Business, Science and Arts Occupations
The most common Management, Business, Science and Arts occupations in Russiaville are Computers, Engineering & Science (61 | 10.0%), Architecture & Engineering (51 | 8.4%), Community & Social Service (48 | 7.9%), Health Diagnosing & Treating (44 | 7.2%), and Education Instruction & Library (41 | 6.7%).
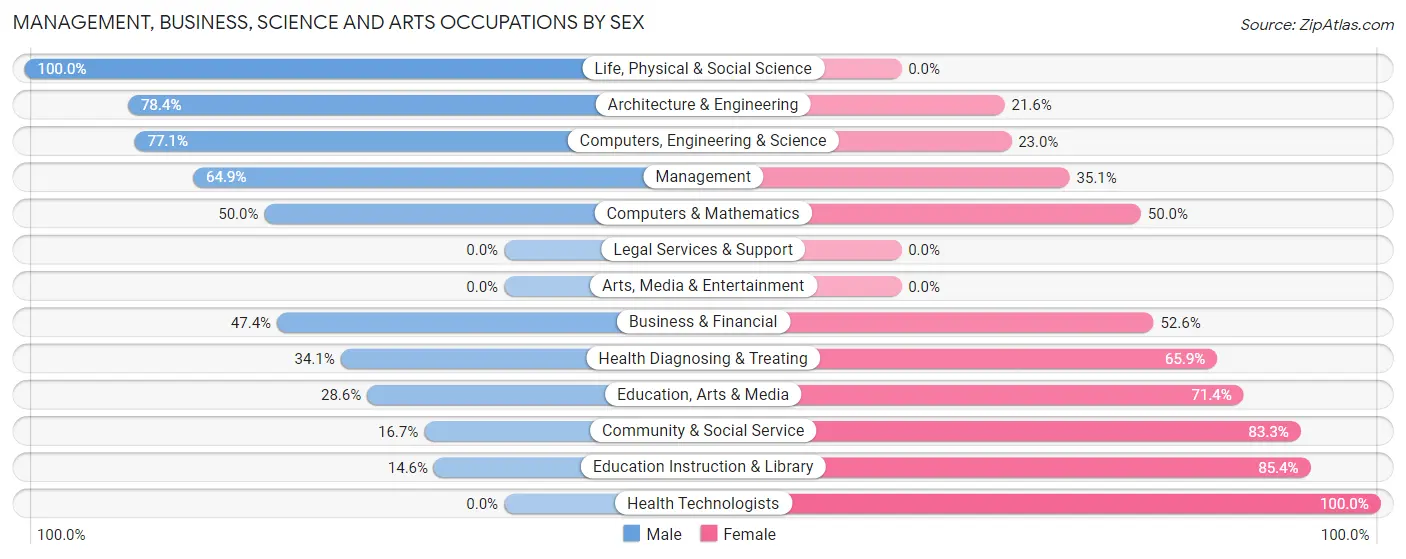
Management, Business, Science and Arts Occupations by Sex
Within the Management, Business, Science and Arts occupations in Russiaville, the most male-oriented occupations are Life, Physical & Social Science (100.0%), Architecture & Engineering (78.4%), and Computers, Engineering & Science (77.0%), while the most female-oriented occupations are Health Technologists (100.0%), Education Instruction & Library (85.4%), and Community & Social Service (83.3%).
| Occupation | Male | Female |
| Management | 24 (64.9%) | 13 (35.1%) |
| Business & Financial | 18 (47.4%) | 20 (52.6%) |
| Computers, Engineering & Science | 47 (77.0%) | 14 (23.0%) |
| Computers & Mathematics | 3 (50.0%) | 3 (50.0%) |
| Architecture & Engineering | 40 (78.4%) | 11 (21.6%) |
| Life, Physical & Social Science | 4 (100.0%) | 0 (0.0%) |
| Community & Social Service | 8 (16.7%) | 40 (83.3%) |
| Education, Arts & Media | 2 (28.6%) | 5 (71.4%) |
| Legal Services & Support | 0 (0.0%) | 0 (0.0%) |
| Education Instruction & Library | 6 (14.6%) | 35 (85.4%) |
| Arts, Media & Entertainment | 0 (0.0%) | 0 (0.0%) |
| Health Diagnosing & Treating | 15 (34.1%) | 29 (65.9%) |
| Health Technologists | 0 (0.0%) | 22 (100.0%) |
| Total (Category) | 112 (49.1%) | 116 (50.9%) |
| Total (Overall) | 335 (54.9%) | 275 (45.1%) |
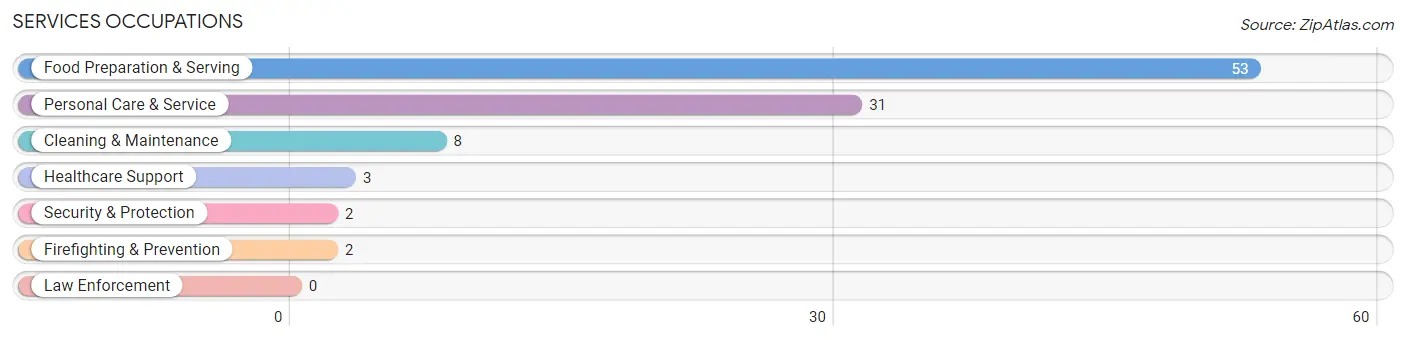
Services Occupations
The most common Services occupations in Russiaville are Food Preparation & Serving (53 | 8.7%), Personal Care & Service (31 | 5.1%), Cleaning & Maintenance (8 | 1.3%), Healthcare Support (3 | 0.5%), and Security & Protection (2 | 0.3%).
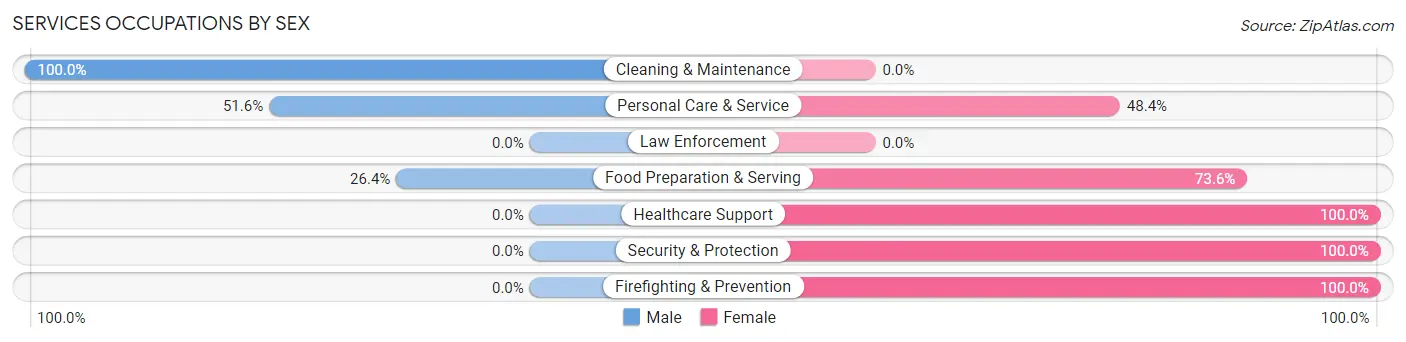
Services Occupations by Sex
Within the Services occupations in Russiaville, the most male-oriented occupations are Cleaning & Maintenance (100.0%), Personal Care & Service (51.6%), and Food Preparation & Serving (26.4%), while the most female-oriented occupations are Healthcare Support (100.0%), Security & Protection (100.0%), and Firefighting & Prevention (100.0%).
| Occupation | Male | Female |
| Healthcare Support | 0 (0.0%) | 3 (100.0%) |
| Security & Protection | 0 (0.0%) | 2 (100.0%) |
| Firefighting & Prevention | 0 (0.0%) | 2 (100.0%) |
| Law Enforcement | 0 (0.0%) | 0 (0.0%) |
| Food Preparation & Serving | 14 (26.4%) | 39 (73.6%) |
| Cleaning & Maintenance | 8 (100.0%) | 0 (0.0%) |
| Personal Care & Service | 16 (51.6%) | 15 (48.4%) |
| Total (Category) | 38 (39.2%) | 59 (60.8%) |
| Total (Overall) | 335 (54.9%) | 275 (45.1%) |
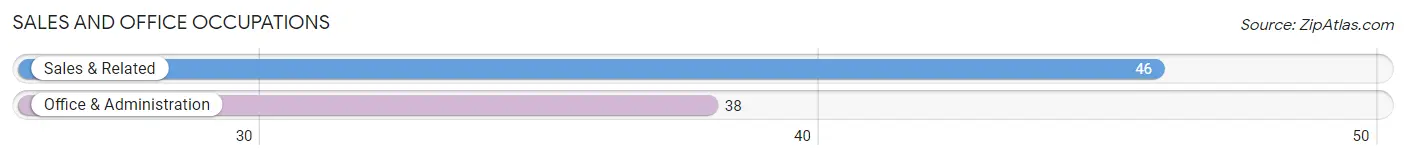
Sales and Office Occupations
The most common Sales and Office occupations in Russiaville are Sales & Related (46 | 7.5%), and Office & Administration (38 | 6.2%).
Sales and Office Occupations by Sex
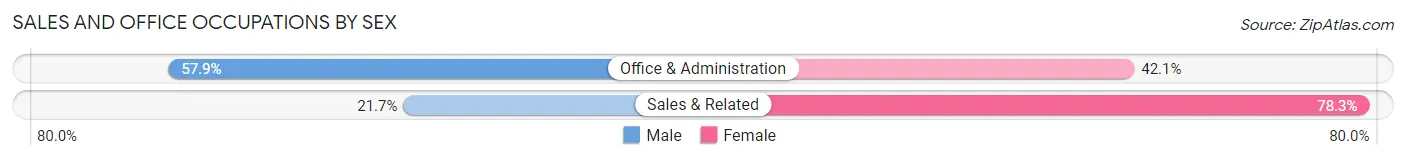
| Occupation | Male | Female |
| Sales & Related | 10 (21.7%) | 36 (78.3%) |
| Office & Administration | 22 (57.9%) | 16 (42.1%) |
| Total (Category) | 32 (38.1%) | 52 (61.9%) |
| Total (Overall) | 335 (54.9%) | 275 (45.1%) |
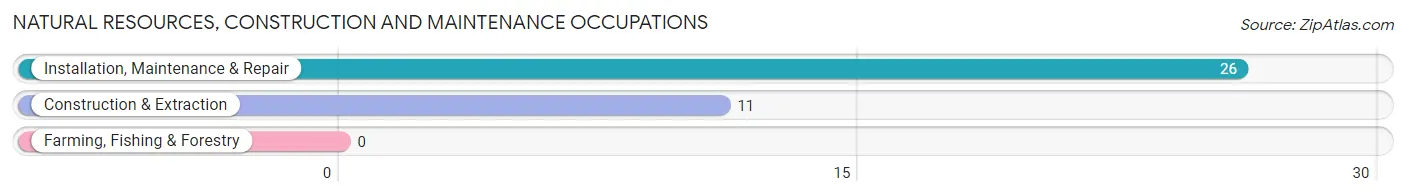
Natural Resources, Construction and Maintenance Occupations
The most common Natural Resources, Construction and Maintenance occupations in Russiaville are Installation, Maintenance & Repair (26 | 4.3%), and Construction & Extraction (11 | 1.8%).
Natural Resources, Construction and Maintenance Occupations by Sex
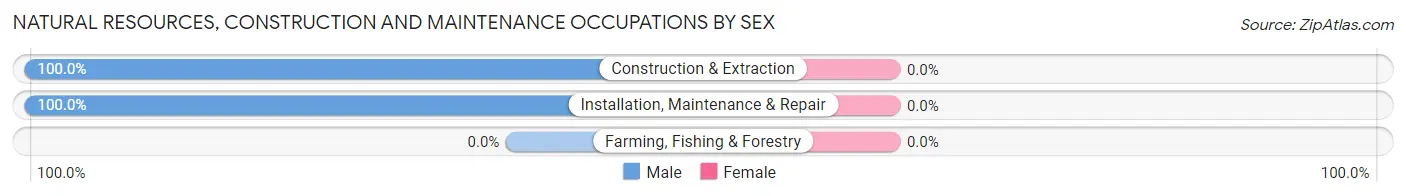
| Occupation | Male | Female |
| Farming, Fishing & Forestry | 0 (0.0%) | 0 (0.0%) |
| Construction & Extraction | 11 (100.0%) | 0 (0.0%) |
| Installation, Maintenance & Repair | 26 (100.0%) | 0 (0.0%) |
| Total (Category) | 37 (100.0%) | 0 (0.0%) |
| Total (Overall) | 335 (54.9%) | 275 (45.1%) |
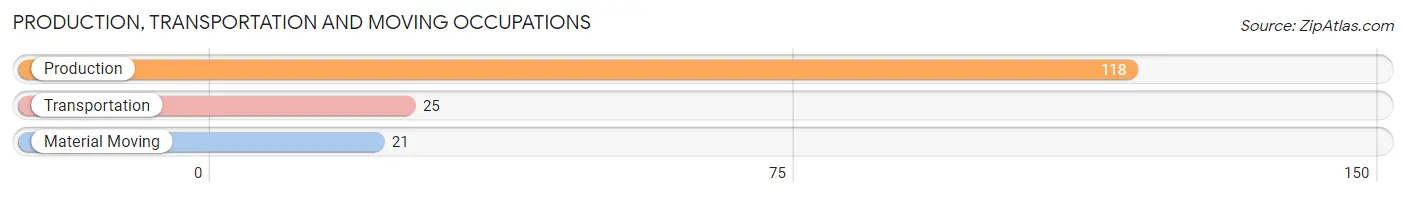
Production, Transportation and Moving Occupations
The most common Production, Transportation and Moving occupations in Russiaville are Production (118 | 19.3%), Transportation (25 | 4.1%), and Material Moving (21 | 3.4%).
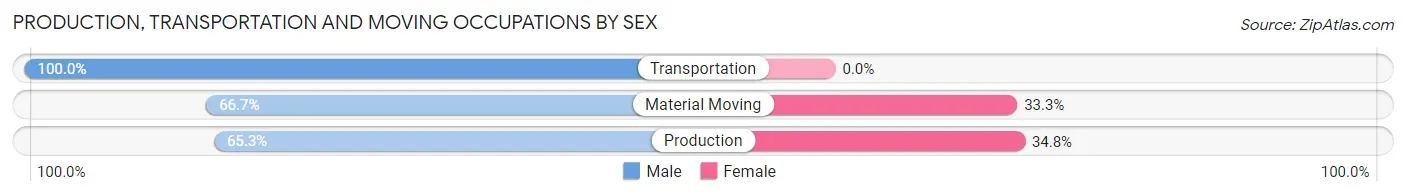
Production, Transportation and Moving Occupations by Sex
| Occupation | Male | Female |
| Production | 77 (65.2%) | 41 (34.7%) |
| Transportation | 25 (100.0%) | 0 (0.0%) |
| Material Moving | 14 (66.7%) | 7 (33.3%) |
| Total (Category) | 116 (70.7%) | 48 (29.3%) |
| Total (Overall) | 335 (54.9%) | 275 (45.1%) |
Employment Industries by Sex in Russiaville
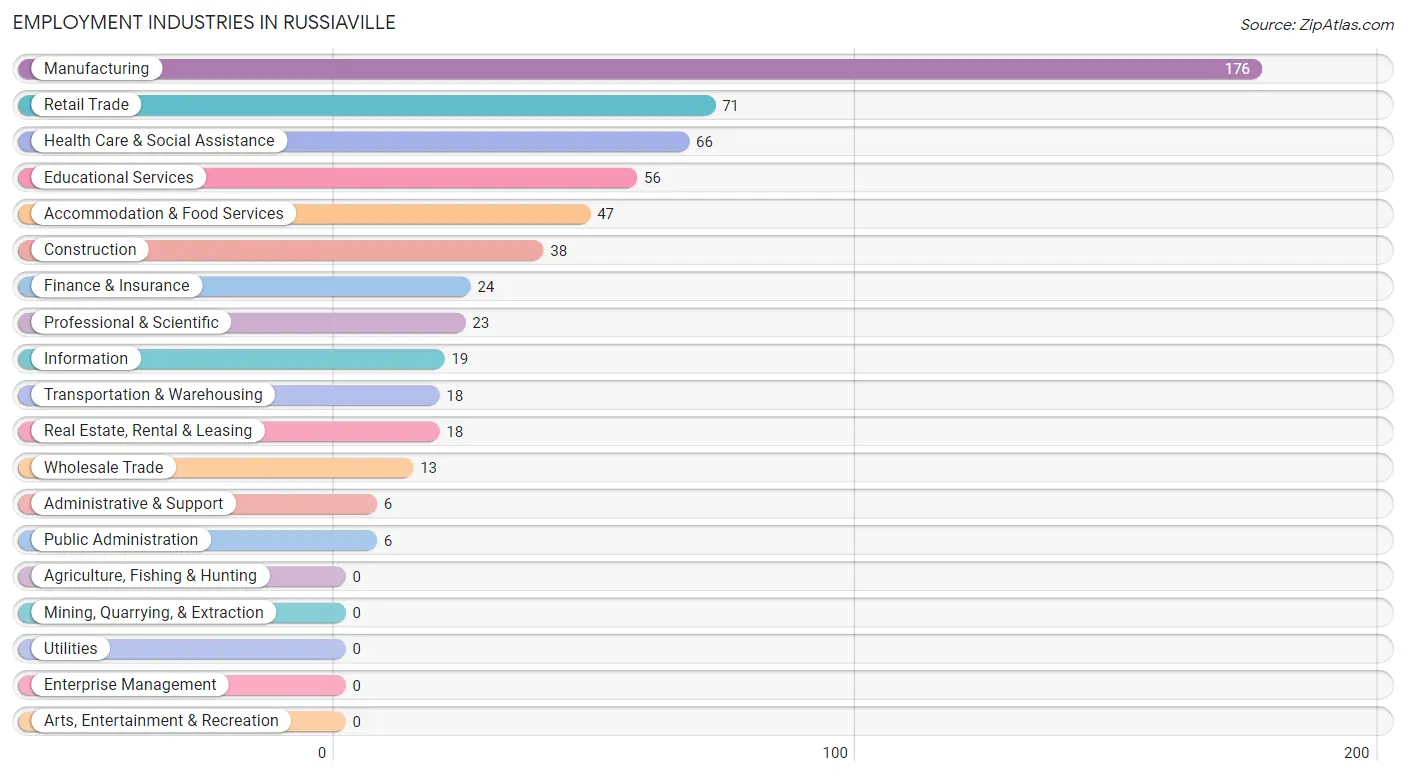
Employment Industries in Russiaville
The major employment industries in Russiaville include Manufacturing (176 | 28.8%), Retail Trade (71 | 11.6%), Health Care & Social Assistance (66 | 10.8%), Educational Services (56 | 9.2%), and Accommodation & Food Services (47 | 7.7%).
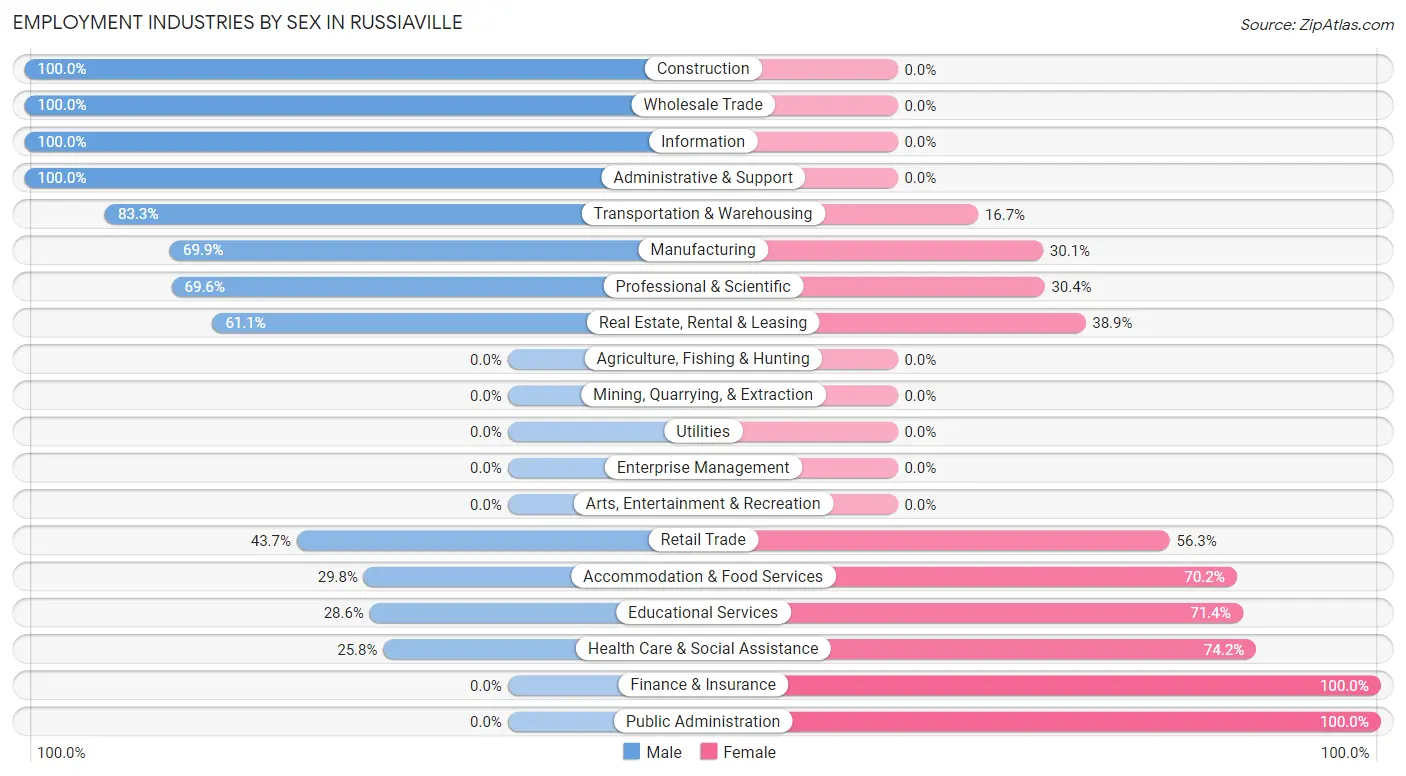
Employment Industries by Sex in Russiaville
The Russiaville industries that see more men than women are Construction (100.0%), Wholesale Trade (100.0%), and Information (100.0%), whereas the industries that tend to have a higher number of women are Finance & Insurance (100.0%), Public Administration (100.0%), and Health Care & Social Assistance (74.2%).
| Industry | Male | Female |
| Agriculture, Fishing & Hunting | 0 (0.0%) | 0 (0.0%) |
| Mining, Quarrying, & Extraction | 0 (0.0%) | 0 (0.0%) |
| Construction | 38 (100.0%) | 0 (0.0%) |
| Manufacturing | 123 (69.9%) | 53 (30.1%) |
| Wholesale Trade | 13 (100.0%) | 0 (0.0%) |
| Retail Trade | 31 (43.7%) | 40 (56.3%) |
| Transportation & Warehousing | 15 (83.3%) | 3 (16.7%) |
| Utilities | 0 (0.0%) | 0 (0.0%) |
| Information | 19 (100.0%) | 0 (0.0%) |
| Finance & Insurance | 0 (0.0%) | 24 (100.0%) |
| Real Estate, Rental & Leasing | 11 (61.1%) | 7 (38.9%) |
| Professional & Scientific | 16 (69.6%) | 7 (30.4%) |
| Enterprise Management | 0 (0.0%) | 0 (0.0%) |
| Administrative & Support | 6 (100.0%) | 0 (0.0%) |
| Educational Services | 16 (28.6%) | 40 (71.4%) |
| Health Care & Social Assistance | 17 (25.8%) | 49 (74.2%) |
| Arts, Entertainment & Recreation | 0 (0.0%) | 0 (0.0%) |
| Accommodation & Food Services | 14 (29.8%) | 33 (70.2%) |
| Public Administration | 0 (0.0%) | 6 (100.0%) |
| Total | 335 (54.9%) | 275 (45.1%) |
Education in Russiaville
School Enrollment in Russiaville
The most common levels of schooling among the 376 students in Russiaville are college / undergraduate (89 | 23.7%), high school (87 | 23.1%), and elementary school (85 | 22.6%).
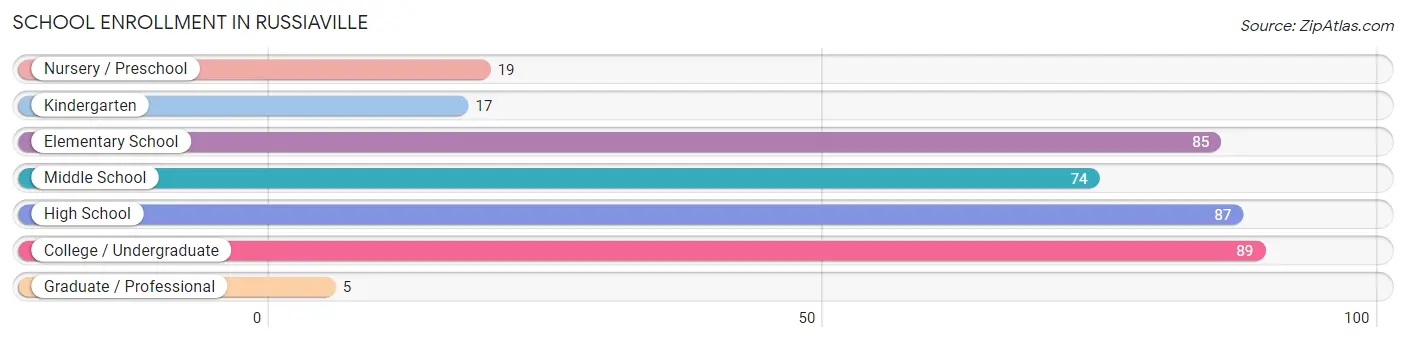
| School Level | # Students | % Students |
| Nursery / Preschool | 19 | 5.1% |
| Kindergarten | 17 | 4.5% |
| Elementary School | 85 | 22.6% |
| Middle School | 74 | 19.7% |
| High School | 87 | 23.1% |
| College / Undergraduate | 89 | 23.7% |
| Graduate / Professional | 5 | 1.3% |
| Total | 376 | 100.0% |
School Enrollment by Age by Funding Source in Russiaville
Out of a total of 376 students who are enrolled in schools in Russiaville, 31 (8.2%) attend a private institution, while the remaining 345 (91.8%) are enrolled in public schools. The age group of 18 to 19 year olds has the highest likelihood of being enrolled in private schools, with 14 (38.9% in the age bracket) enrolled. Conversely, the age group of 3 to 4 year olds has the lowest likelihood of being enrolled in a private school, with 19 (100.0% in the age bracket) attending a public institution.
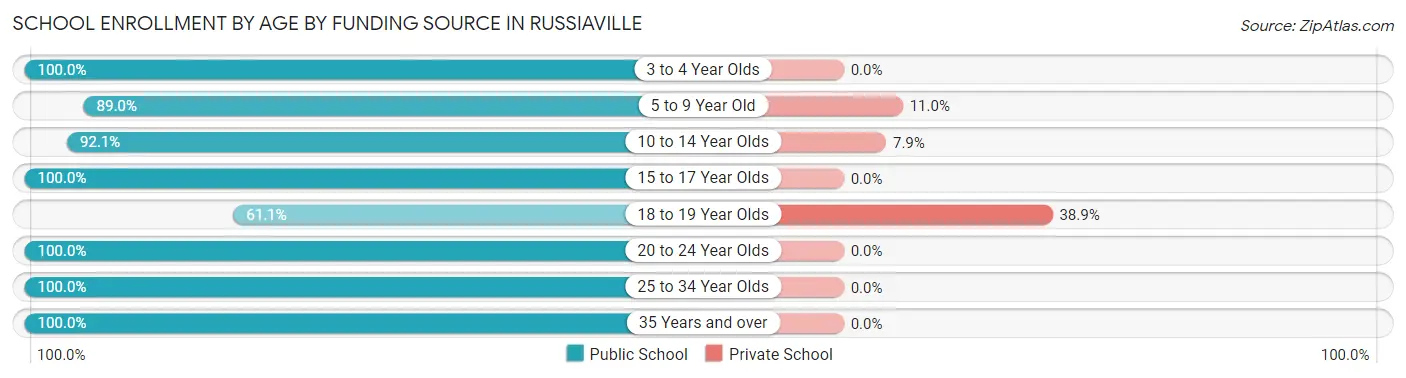
| Age Bracket | Public School | Private School |
| 3 to 4 Year Olds | 19 (100.0%) | 0 (0.0%) |
| 5 to 9 Year Old | 89 (89.0%) | 11 (11.0%) |
| 10 to 14 Year Olds | 70 (92.1%) | 6 (7.9%) |
| 15 to 17 Year Olds | 73 (100.0%) | 0 (0.0%) |
| 18 to 19 Year Olds | 22 (61.1%) | 14 (38.9%) |
| 20 to 24 Year Olds | 27 (100.0%) | 0 (0.0%) |
| 25 to 34 Year Olds | 15 (100.0%) | 0 (0.0%) |
| 35 Years and over | 30 (100.0%) | 0 (0.0%) |
| Total | 345 (91.8%) | 31 (8.2%) |
Educational Attainment by Field of Study in Russiaville
Education (35 | 23.5%), science & technology (32 | 21.5%), business (18 | 12.1%), engineering (13 | 8.7%), and bio, nature & agricultural (12 | 8.1%) are the most common fields of study among 149 individuals in Russiaville who have obtained a bachelor's degree or higher.
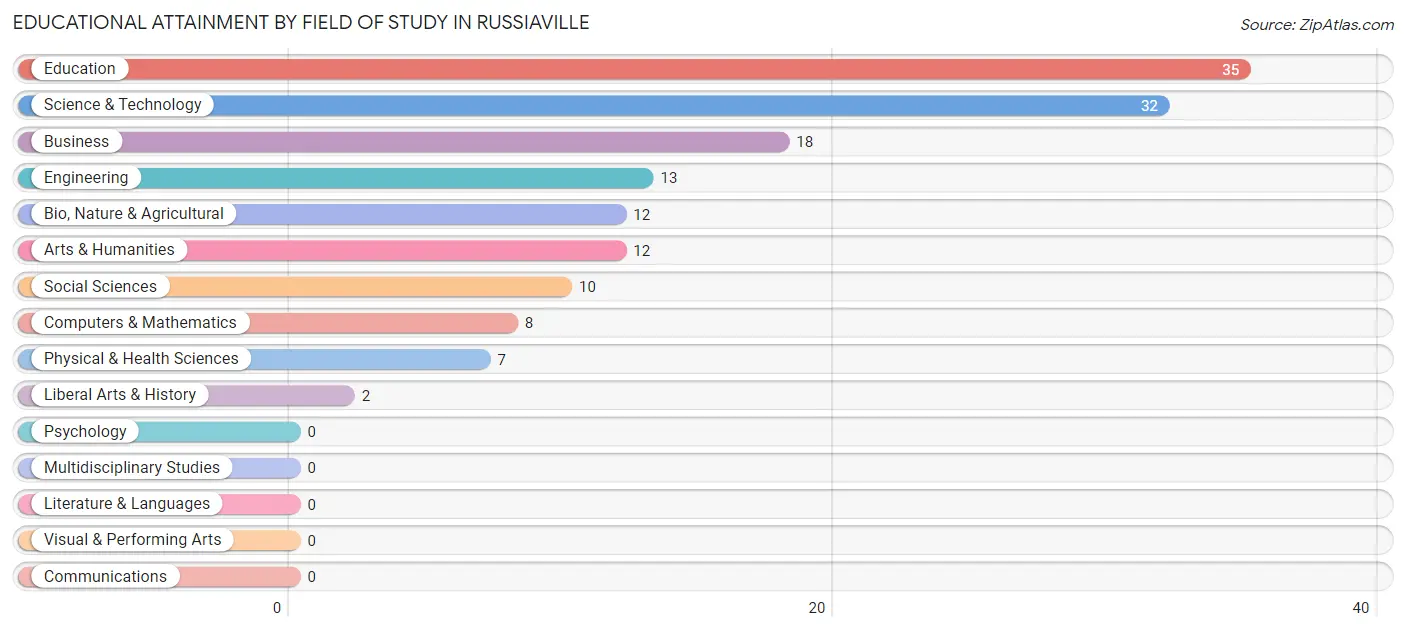
| Field of Study | # Graduates | % Graduates |
| Computers & Mathematics | 8 | 5.4% |
| Bio, Nature & Agricultural | 12 | 8.1% |
| Physical & Health Sciences | 7 | 4.7% |
| Psychology | 0 | 0.0% |
| Social Sciences | 10 | 6.7% |
| Engineering | 13 | 8.7% |
| Multidisciplinary Studies | 0 | 0.0% |
| Science & Technology | 32 | 21.5% |
| Business | 18 | 12.1% |
| Education | 35 | 23.5% |
| Literature & Languages | 0 | 0.0% |
| Liberal Arts & History | 2 | 1.3% |
| Visual & Performing Arts | 0 | 0.0% |
| Communications | 0 | 0.0% |
| Arts & Humanities | 12 | 8.1% |
| Total | 149 | 100.0% |
Transportation & Commute in Russiaville
Vehicle Availability by Sex in Russiaville
The most prevalent vehicle ownership categories in Russiaville are males with 2 vehicles (140, accounting for 45.0%) and females with 2 vehicles (91, making up 55.3%).
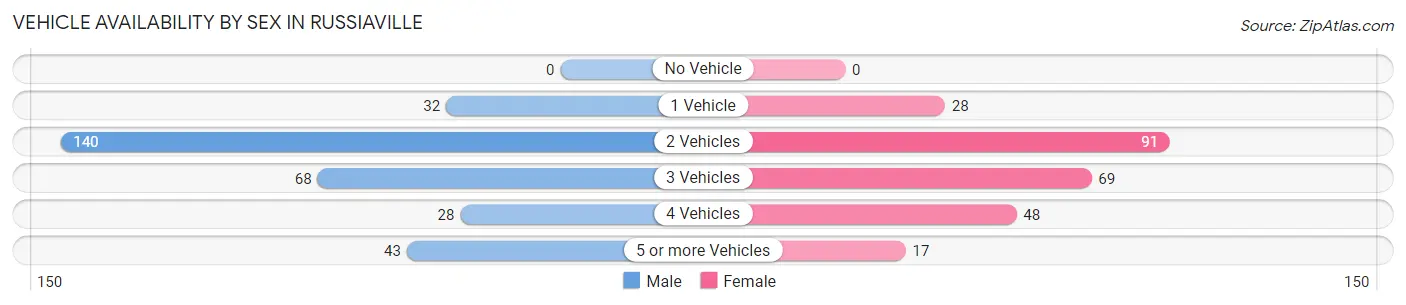
| Vehicles Available | Male | Female |
| No Vehicle | 0 (0.0%) | 0 (0.0%) |
| 1 Vehicle | 32 (10.3%) | 28 (11.1%) |
| 2 Vehicles | 140 (45.0%) | 91 (36.0%) |
| 3 Vehicles | 68 (21.9%) | 69 (27.3%) |
| 4 Vehicles | 28 (9.0%) | 48 (19.0%) |
| 5 or more Vehicles | 43 (13.8%) | 17 (6.7%) |
| Total | 311 (100.0%) | 253 (100.0%) |
Commute Time in Russiaville
The most frequently occuring commute durations in Russiaville are 15 to 19 minutes (159 commuters, 30.0%), 20 to 24 minutes (90 commuters, 17.0%), and 45 to 59 minutes (56 commuters, 10.6%).
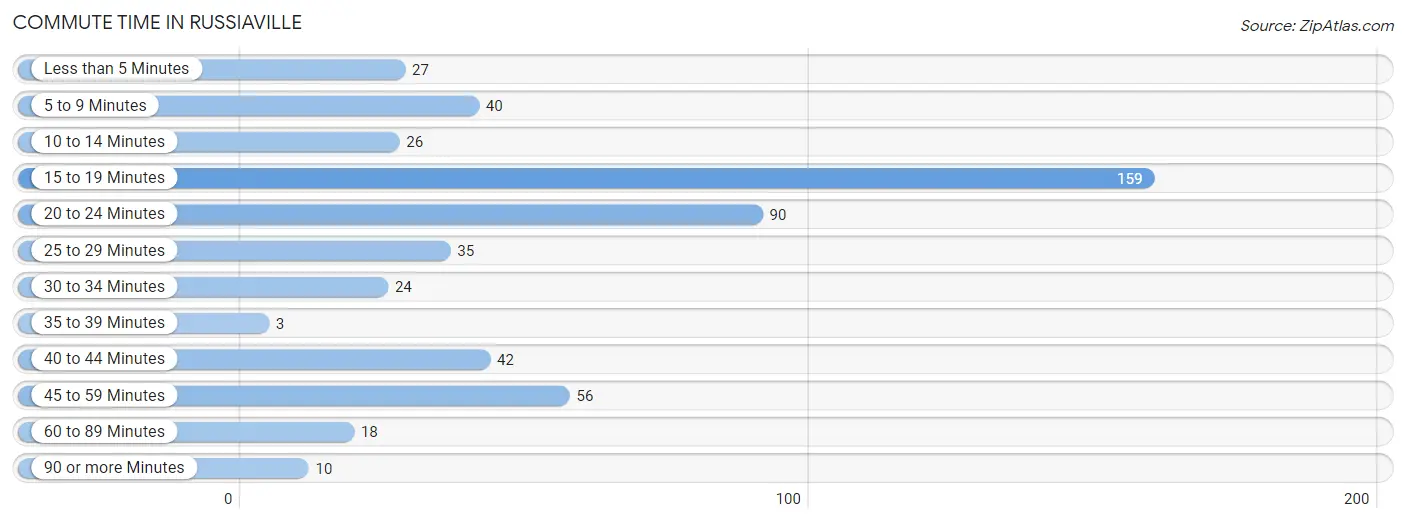
| Commute Time | # Commuters | % Commuters |
| Less than 5 Minutes | 27 | 5.1% |
| 5 to 9 Minutes | 40 | 7.5% |
| 10 to 14 Minutes | 26 | 4.9% |
| 15 to 19 Minutes | 159 | 30.0% |
| 20 to 24 Minutes | 90 | 17.0% |
| 25 to 29 Minutes | 35 | 6.6% |
| 30 to 34 Minutes | 24 | 4.5% |
| 35 to 39 Minutes | 3 | 0.6% |
| 40 to 44 Minutes | 42 | 7.9% |
| 45 to 59 Minutes | 56 | 10.6% |
| 60 to 89 Minutes | 18 | 3.4% |
| 90 or more Minutes | 10 | 1.9% |
Commute Time by Sex in Russiaville
The most common commute times in Russiaville are 20 to 24 minutes (63 commuters, 21.5%) for males and 15 to 19 minutes (102 commuters, 43.0%) for females.
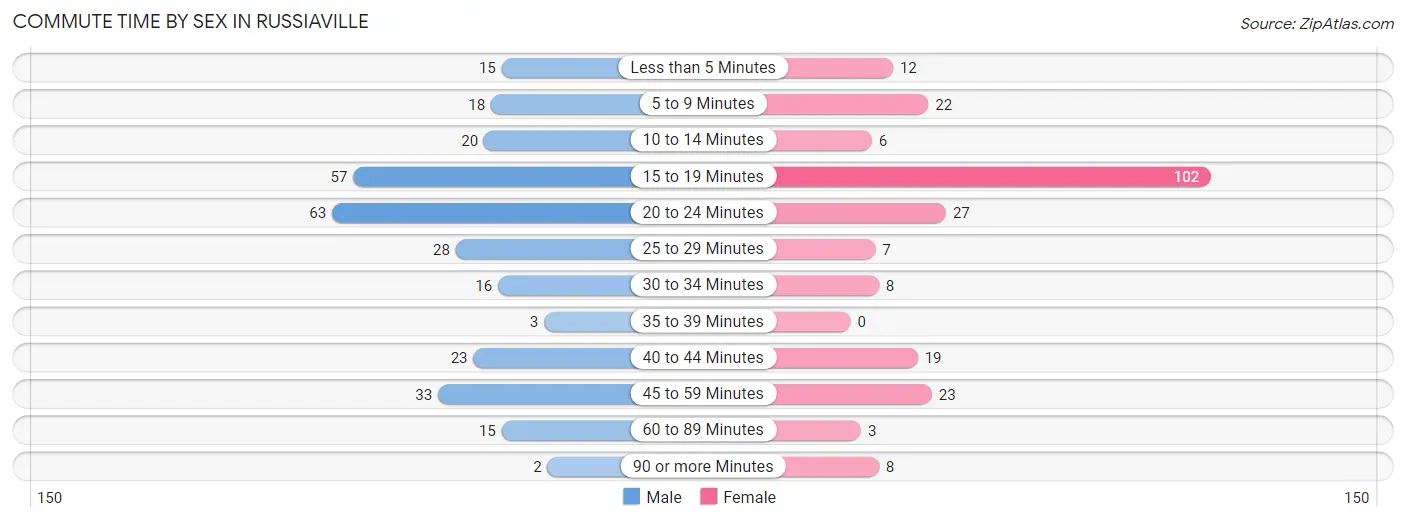
| Commute Time | Male | Female |
| Less than 5 Minutes | 15 (5.1%) | 12 (5.1%) |
| 5 to 9 Minutes | 18 (6.1%) | 22 (9.3%) |
| 10 to 14 Minutes | 20 (6.8%) | 6 (2.5%) |
| 15 to 19 Minutes | 57 (19.5%) | 102 (43.0%) |
| 20 to 24 Minutes | 63 (21.5%) | 27 (11.4%) |
| 25 to 29 Minutes | 28 (9.6%) | 7 (2.9%) |
| 30 to 34 Minutes | 16 (5.5%) | 8 (3.4%) |
| 35 to 39 Minutes | 3 (1.0%) | 0 (0.0%) |
| 40 to 44 Minutes | 23 (7.9%) | 19 (8.0%) |
| 45 to 59 Minutes | 33 (11.3%) | 23 (9.7%) |
| 60 to 89 Minutes | 15 (5.1%) | 3 (1.3%) |
| 90 or more Minutes | 2 (0.7%) | 8 (3.4%) |
Time of Departure to Work by Sex in Russiaville
The most frequent times of departure to work in Russiaville are 12:00 AM to 4:59 AM (65, 22.2%) for males and 7:00 AM to 7:29 AM (48, 20.3%) for females.
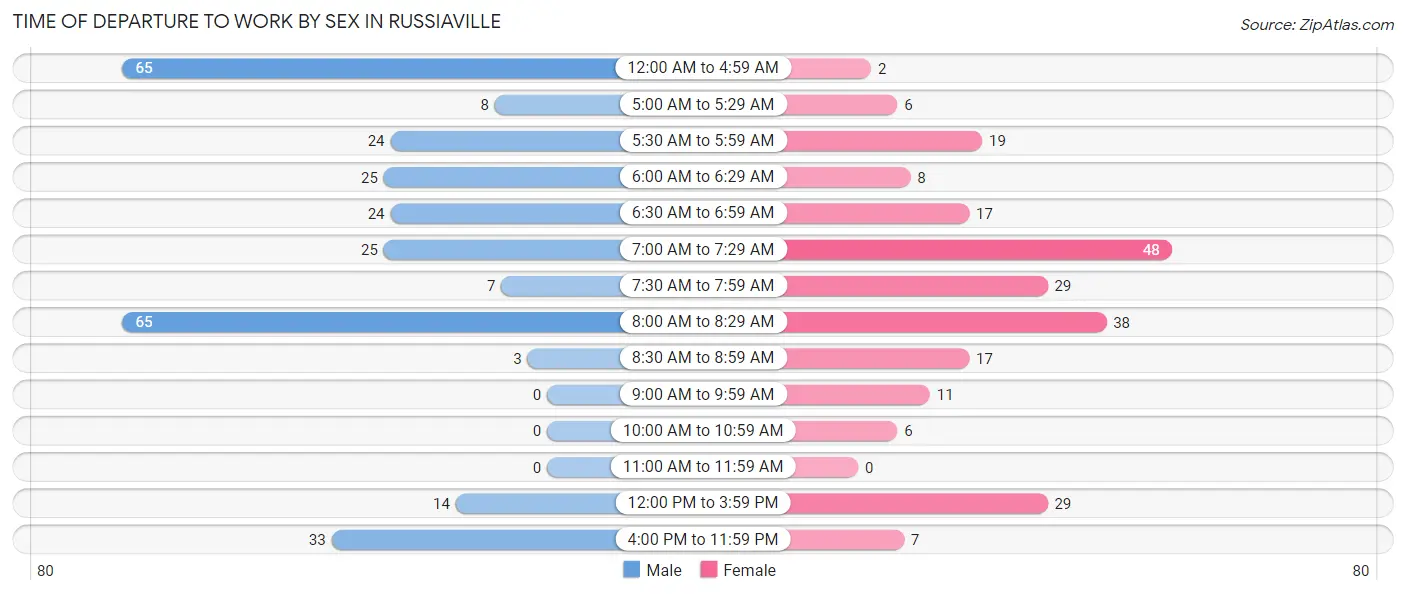
| Time of Departure | Male | Female |
| 12:00 AM to 4:59 AM | 65 (22.2%) | 2 (0.8%) |
| 5:00 AM to 5:29 AM | 8 (2.7%) | 6 (2.5%) |
| 5:30 AM to 5:59 AM | 24 (8.2%) | 19 (8.0%) |
| 6:00 AM to 6:29 AM | 25 (8.5%) | 8 (3.4%) |
| 6:30 AM to 6:59 AM | 24 (8.2%) | 17 (7.2%) |
| 7:00 AM to 7:29 AM | 25 (8.5%) | 48 (20.3%) |
| 7:30 AM to 7:59 AM | 7 (2.4%) | 29 (12.2%) |
| 8:00 AM to 8:29 AM | 65 (22.2%) | 38 (16.0%) |
| 8:30 AM to 8:59 AM | 3 (1.0%) | 17 (7.2%) |
| 9:00 AM to 9:59 AM | 0 (0.0%) | 11 (4.6%) |
| 10:00 AM to 10:59 AM | 0 (0.0%) | 6 (2.5%) |
| 11:00 AM to 11:59 AM | 0 (0.0%) | 0 (0.0%) |
| 12:00 PM to 3:59 PM | 14 (4.8%) | 29 (12.2%) |
| 4:00 PM to 11:59 PM | 33 (11.3%) | 7 (2.9%) |
| Total | 293 (100.0%) | 237 (100.0%) |
Housing Occupancy in Russiaville
Occupancy by Ownership in Russiaville
Of the total 460 dwellings in Russiaville, owner-occupied units account for 366 (79.6%), while renter-occupied units make up 94 (20.4%).
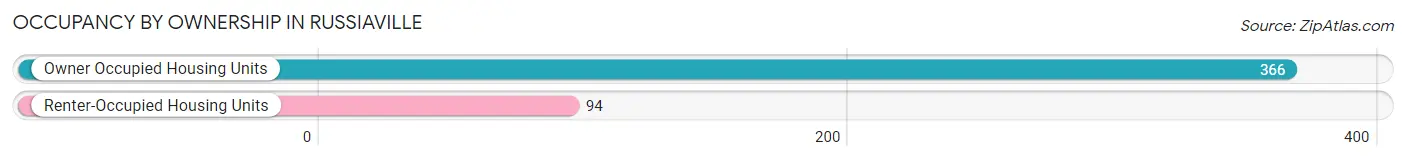
| Occupancy | # Housing Units | % Housing Units |
| Owner Occupied Housing Units | 366 | 79.6% |
| Renter-Occupied Housing Units | 94 | 20.4% |
| Total Occupied Housing Units | 460 | 100.0% |
Occupancy by Household Size in Russiaville
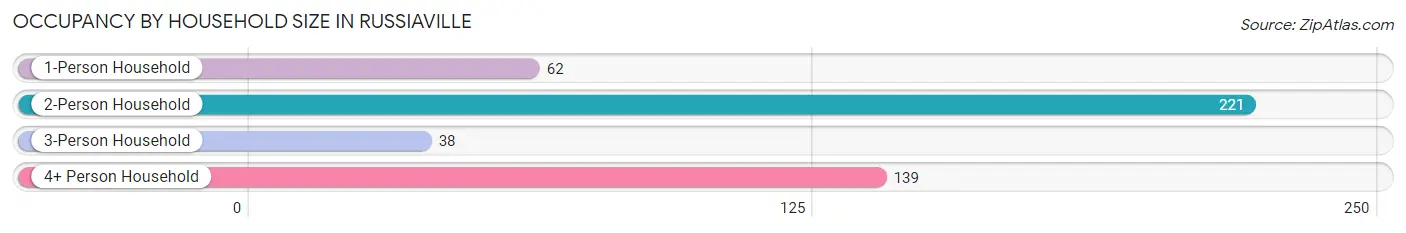
| Household Size | # Housing Units | % Housing Units |
| 1-Person Household | 62 | 13.5% |
| 2-Person Household | 221 | 48.0% |
| 3-Person Household | 38 | 8.3% |
| 4+ Person Household | 139 | 30.2% |
| Total Housing Units | 460 | 100.0% |
Occupancy by Ownership by Household Size in Russiaville
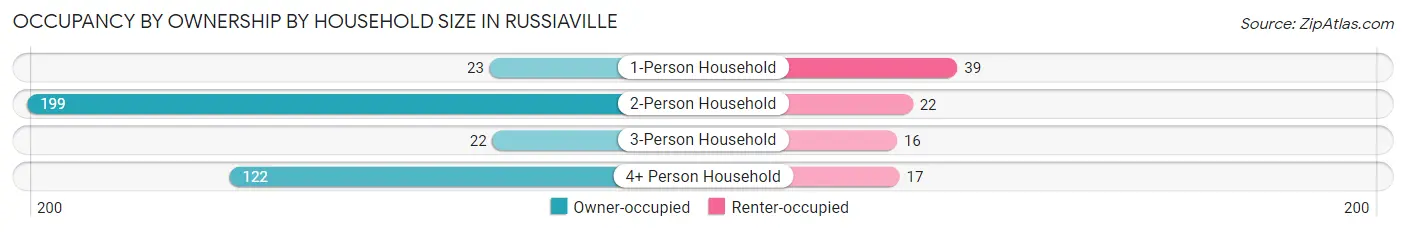
| Household Size | Owner-occupied | Renter-occupied |
| 1-Person Household | 23 (37.1%) | 39 (62.9%) |
| 2-Person Household | 199 (90.0%) | 22 (10.0%) |
| 3-Person Household | 22 (57.9%) | 16 (42.1%) |
| 4+ Person Household | 122 (87.8%) | 17 (12.2%) |
| Total Housing Units | 366 (79.6%) | 94 (20.4%) |
Occupancy by Educational Attainment in Russiaville
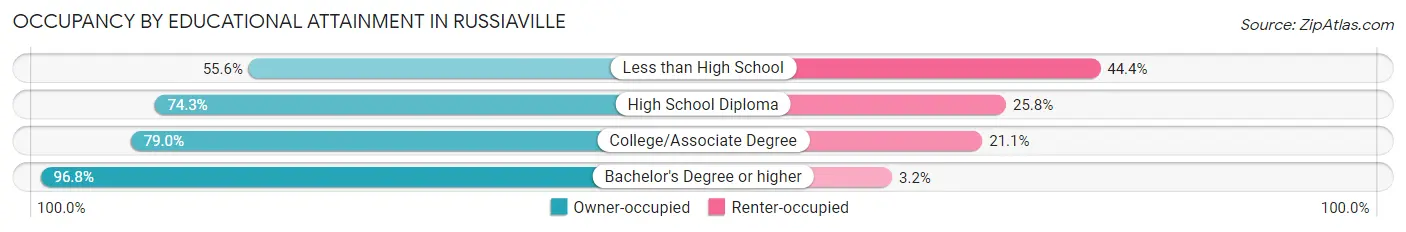
| Household Size | Owner-occupied | Renter-occupied |
| Less than High School | 15 (55.6%) | 12 (44.4%) |
| High School Diploma | 124 (74.3%) | 43 (25.8%) |
| College/Associate Degree | 135 (78.9%) | 36 (21.0%) |
| Bachelor's Degree or higher | 92 (96.8%) | 3 (3.2%) |
Occupancy by Age of Householder in Russiaville
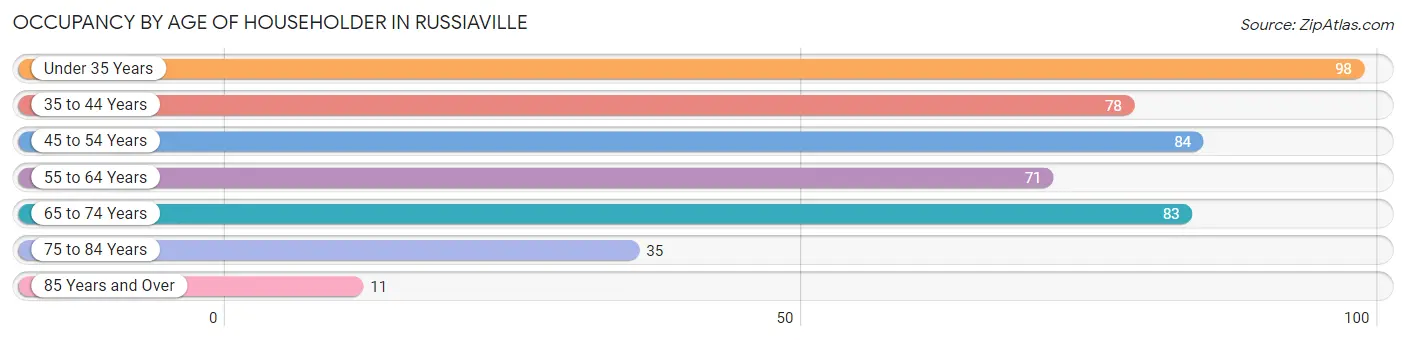
| Age Bracket | # Households | % Households |
| Under 35 Years | 98 | 21.3% |
| 35 to 44 Years | 78 | 17.0% |
| 45 to 54 Years | 84 | 18.3% |
| 55 to 64 Years | 71 | 15.4% |
| 65 to 74 Years | 83 | 18.0% |
| 75 to 84 Years | 35 | 7.6% |
| 85 Years and Over | 11 | 2.4% |
| Total | 460 | 100.0% |
Housing Finances in Russiaville
Median Income by Occupancy in Russiaville
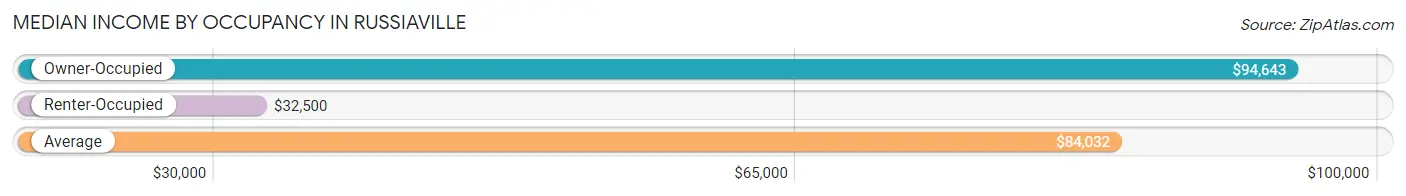
| Occupancy Type | # Households | Median Income |
| Owner-Occupied | 366 (79.6%) | $94,643 |
| Renter-Occupied | 94 (20.4%) | $32,500 |
| Average | 460 (100.0%) | $84,032 |
Occupancy by Householder Income Bracket in Russiaville
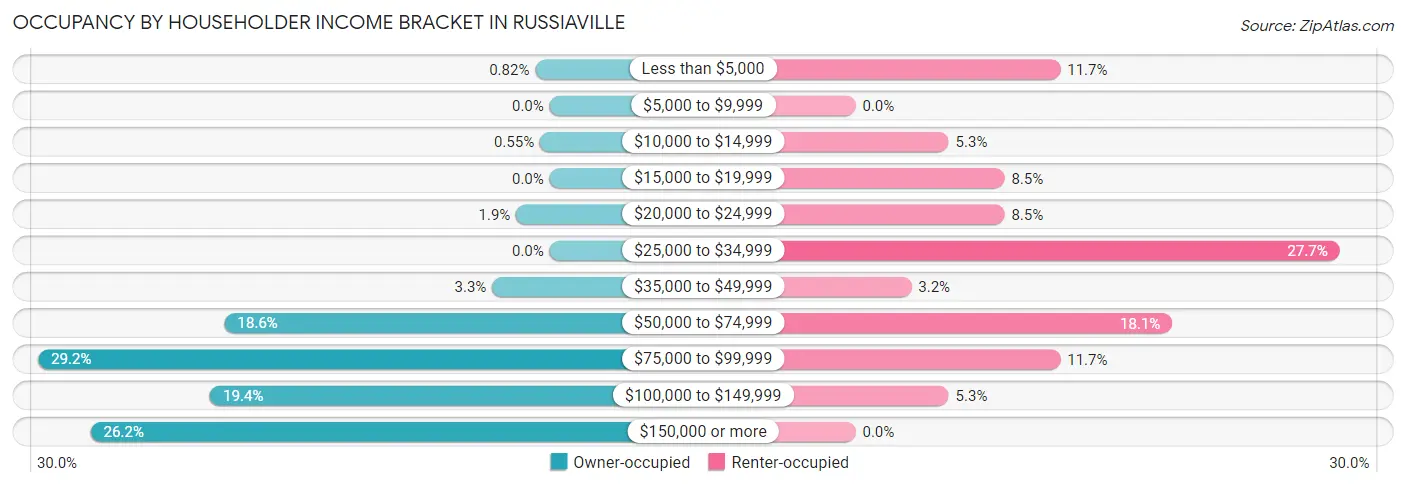
| Income Bracket | Owner-occupied | Renter-occupied |
| Less than $5,000 | 3 (0.8%) | 11 (11.7%) |
| $5,000 to $9,999 | 0 (0.0%) | 0 (0.0%) |
| $10,000 to $14,999 | 2 (0.5%) | 5 (5.3%) |
| $15,000 to $19,999 | 0 (0.0%) | 8 (8.5%) |
| $20,000 to $24,999 | 7 (1.9%) | 8 (8.5%) |
| $25,000 to $34,999 | 0 (0.0%) | 26 (27.7%) |
| $35,000 to $49,999 | 12 (3.3%) | 3 (3.2%) |
| $50,000 to $74,999 | 68 (18.6%) | 17 (18.1%) |
| $75,000 to $99,999 | 107 (29.2%) | 11 (11.7%) |
| $100,000 to $149,999 | 71 (19.4%) | 5 (5.3%) |
| $150,000 or more | 96 (26.2%) | 0 (0.0%) |
| Total | 366 (100.0%) | 94 (100.0%) |
Monthly Housing Cost Tiers in Russiaville
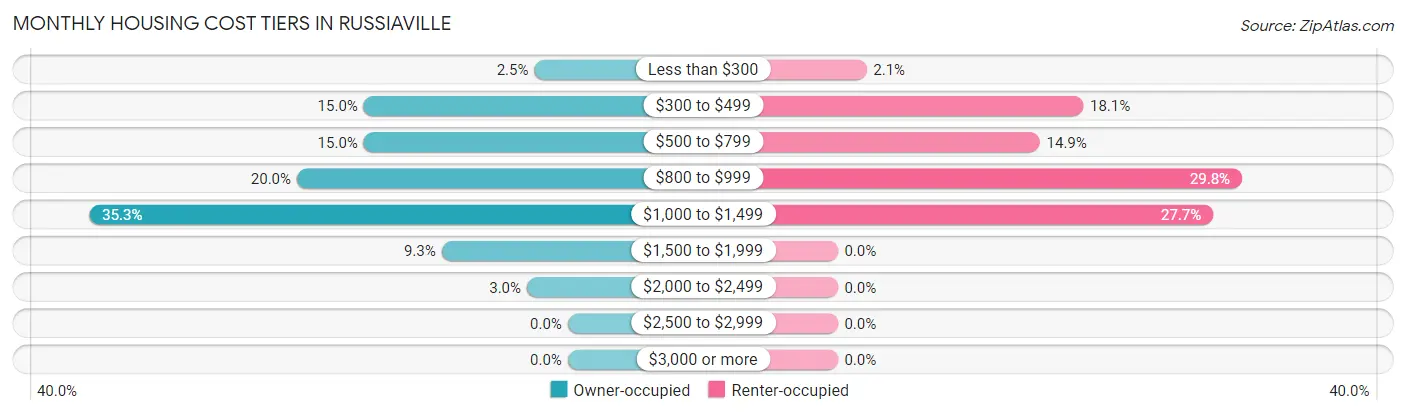
| Monthly Cost | Owner-occupied | Renter-occupied |
| Less than $300 | 9 (2.5%) | 2 (2.1%) |
| $300 to $499 | 55 (15.0%) | 17 (18.1%) |
| $500 to $799 | 55 (15.0%) | 14 (14.9%) |
| $800 to $999 | 73 (20.0%) | 28 (29.8%) |
| $1,000 to $1,499 | 129 (35.2%) | 26 (27.7%) |
| $1,500 to $1,999 | 34 (9.3%) | 0 (0.0%) |
| $2,000 to $2,499 | 11 (3.0%) | 0 (0.0%) |
| $2,500 to $2,999 | 0 (0.0%) | 0 (0.0%) |
| $3,000 or more | 0 (0.0%) | 0 (0.0%) |
| Total | 366 (100.0%) | 94 (100.0%) |
Physical Housing Characteristics in Russiaville
Housing Structures in Russiaville
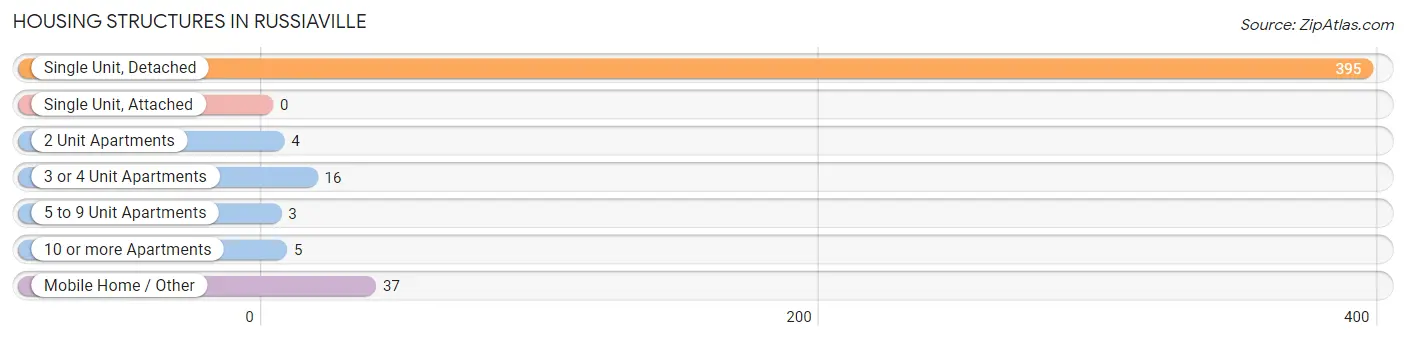
| Structure Type | # Housing Units | % Housing Units |
| Single Unit, Detached | 395 | 85.9% |
| Single Unit, Attached | 0 | 0.0% |
| 2 Unit Apartments | 4 | 0.9% |
| 3 or 4 Unit Apartments | 16 | 3.5% |
| 5 to 9 Unit Apartments | 3 | 0.6% |
| 10 or more Apartments | 5 | 1.1% |
| Mobile Home / Other | 37 | 8.0% |
| Total | 460 | 100.0% |
Housing Structures by Occupancy in Russiaville
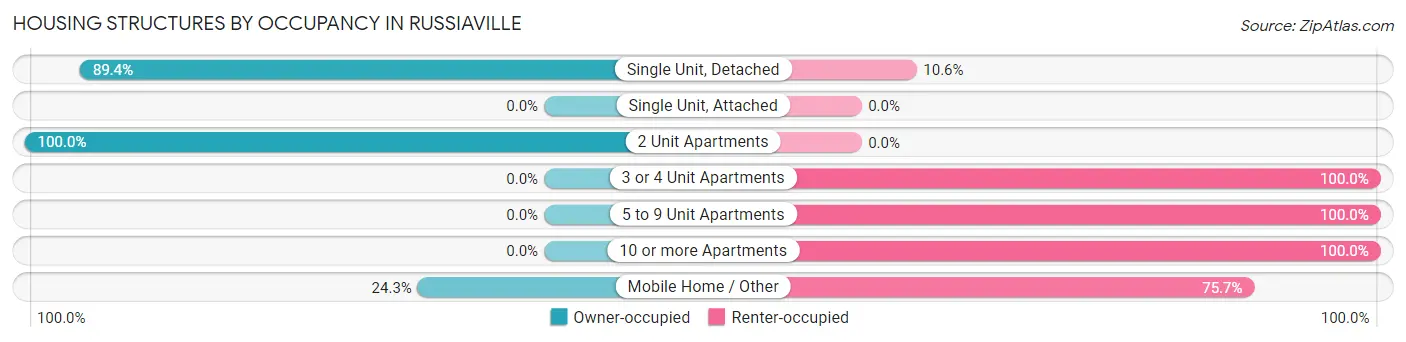
| Structure Type | Owner-occupied | Renter-occupied |
| Single Unit, Detached | 353 (89.4%) | 42 (10.6%) |
| Single Unit, Attached | 0 (0.0%) | 0 (0.0%) |
| 2 Unit Apartments | 4 (100.0%) | 0 (0.0%) |
| 3 or 4 Unit Apartments | 0 (0.0%) | 16 (100.0%) |
| 5 to 9 Unit Apartments | 0 (0.0%) | 3 (100.0%) |
| 10 or more Apartments | 0 (0.0%) | 5 (100.0%) |
| Mobile Home / Other | 9 (24.3%) | 28 (75.7%) |
| Total | 366 (79.6%) | 94 (20.4%) |
Housing Structures by Number of Rooms in Russiaville
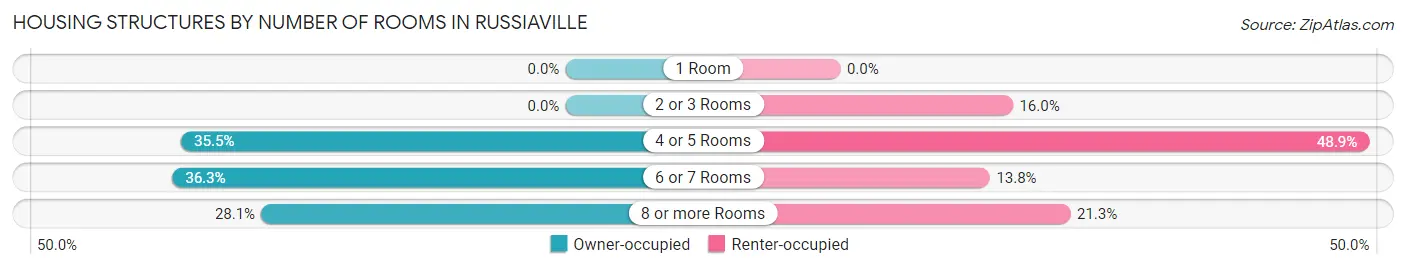
| Number of Rooms | Owner-occupied | Renter-occupied |
| 1 Room | 0 (0.0%) | 0 (0.0%) |
| 2 or 3 Rooms | 0 (0.0%) | 15 (16.0%) |
| 4 or 5 Rooms | 130 (35.5%) | 46 (48.9%) |
| 6 or 7 Rooms | 133 (36.3%) | 13 (13.8%) |
| 8 or more Rooms | 103 (28.1%) | 20 (21.3%) |
| Total | 366 (100.0%) | 94 (100.0%) |
Housing Structure by Heating Type in Russiaville
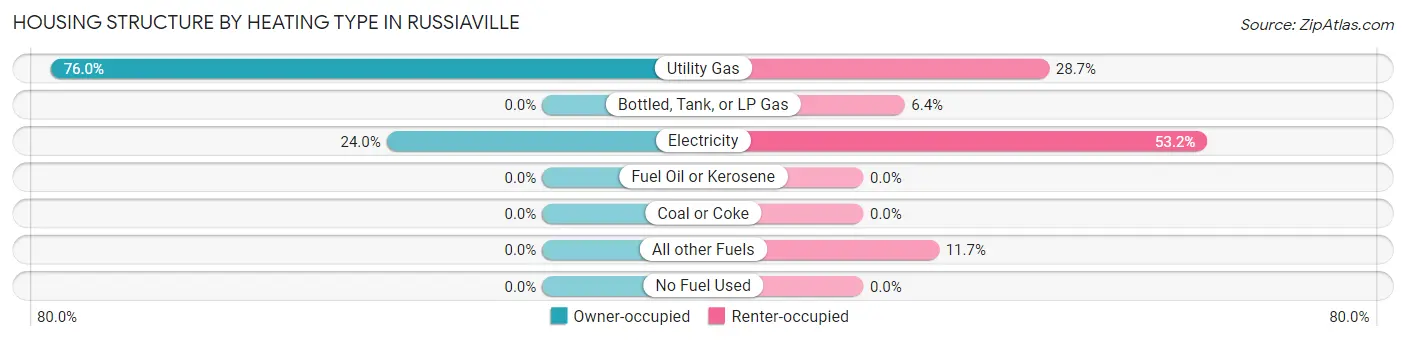
| Heating Type | Owner-occupied | Renter-occupied |
| Utility Gas | 278 (76.0%) | 27 (28.7%) |
| Bottled, Tank, or LP Gas | 0 (0.0%) | 6 (6.4%) |
| Electricity | 88 (24.0%) | 50 (53.2%) |
| Fuel Oil or Kerosene | 0 (0.0%) | 0 (0.0%) |
| Coal or Coke | 0 (0.0%) | 0 (0.0%) |
| All other Fuels | 0 (0.0%) | 11 (11.7%) |
| No Fuel Used | 0 (0.0%) | 0 (0.0%) |
| Total | 366 (100.0%) | 94 (100.0%) |
Household Vehicle Usage in Russiaville
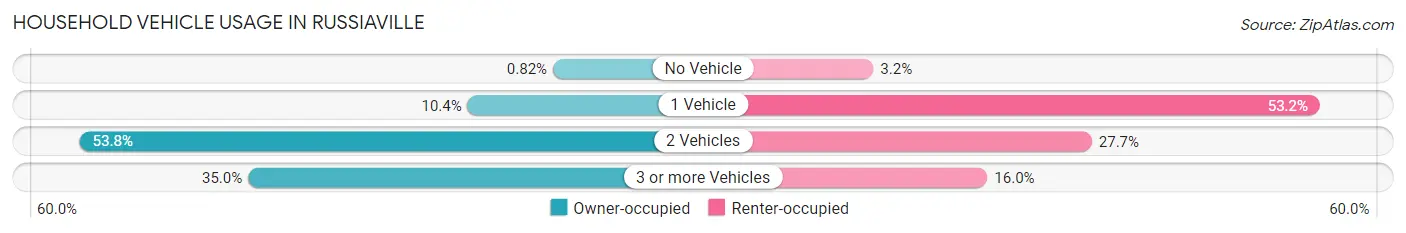
| Vehicles per Household | Owner-occupied | Renter-occupied |
| No Vehicle | 3 (0.8%) | 3 (3.2%) |
| 1 Vehicle | 38 (10.4%) | 50 (53.2%) |
| 2 Vehicles | 197 (53.8%) | 26 (27.7%) |
| 3 or more Vehicles | 128 (35.0%) | 15 (16.0%) |
| Total | 366 (100.0%) | 94 (100.0%) |
Real Estate & Mortgages in Russiaville
Real Estate and Mortgage Overview in Russiaville
| Characteristic | Without Mortgage | With Mortgage |
| Housing Units | 108 | 258 |
| Median Property Value | $172,100 | $153,900 |
| Median Household Income | $77,750 | $65 |
| Monthly Housing Costs | $477 | $0 |
| Real Estate Taxes | $1,463 | $12 |
Property Value by Mortgage Status in Russiaville
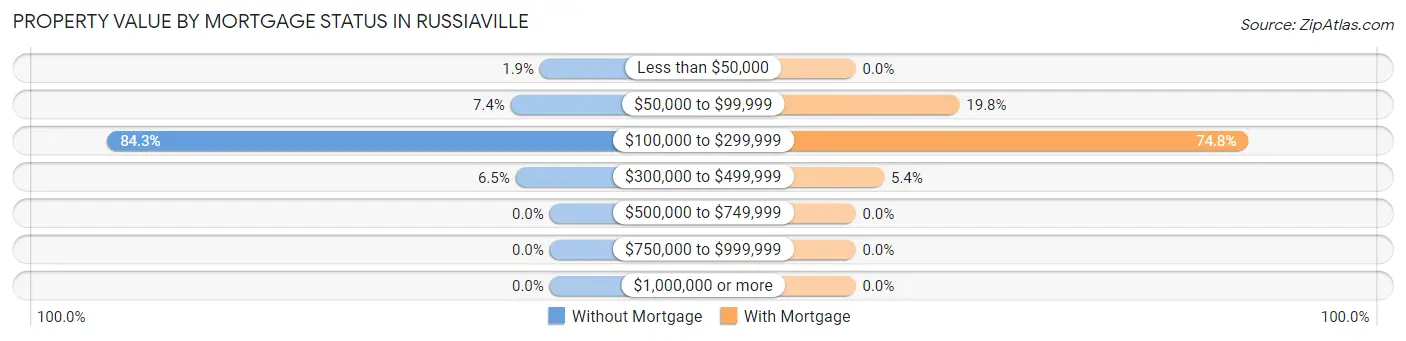
| Property Value | Without Mortgage | With Mortgage |
| Less than $50,000 | 2 (1.8%) | 0 (0.0%) |
| $50,000 to $99,999 | 8 (7.4%) | 51 (19.8%) |
| $100,000 to $299,999 | 91 (84.3%) | 193 (74.8%) |
| $300,000 to $499,999 | 7 (6.5%) | 14 (5.4%) |
| $500,000 to $749,999 | 0 (0.0%) | 0 (0.0%) |
| $750,000 to $999,999 | 0 (0.0%) | 0 (0.0%) |
| $1,000,000 or more | 0 (0.0%) | 0 (0.0%) |
| Total | 108 (100.0%) | 258 (100.0%) |
Household Income by Mortgage Status in Russiaville
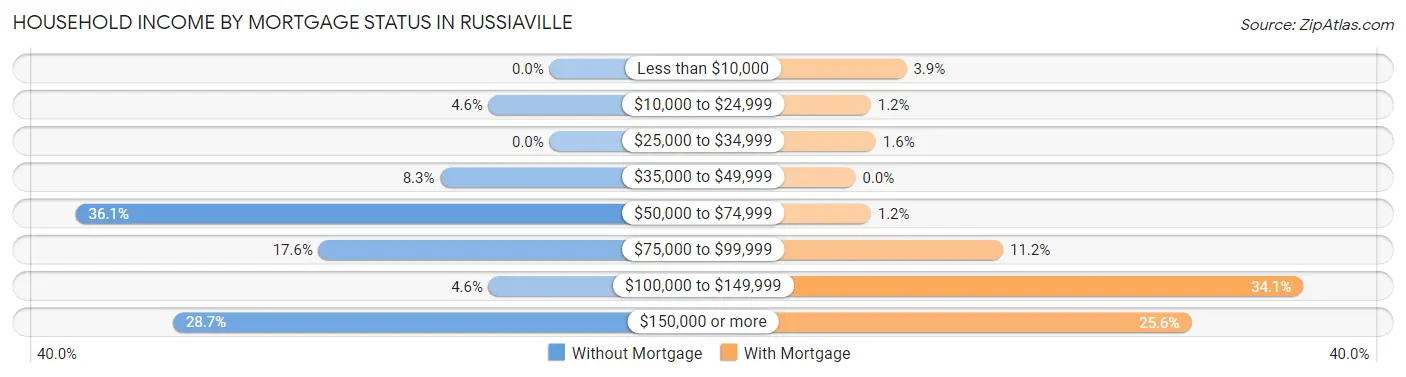
| Household Income | Without Mortgage | With Mortgage |
| Less than $10,000 | 0 (0.0%) | 10 (3.9%) |
| $10,000 to $24,999 | 5 (4.6%) | 3 (1.2%) |
| $25,000 to $34,999 | 0 (0.0%) | 4 (1.5%) |
| $35,000 to $49,999 | 9 (8.3%) | 0 (0.0%) |
| $50,000 to $74,999 | 39 (36.1%) | 3 (1.2%) |
| $75,000 to $99,999 | 19 (17.6%) | 29 (11.2%) |
| $100,000 to $149,999 | 5 (4.6%) | 88 (34.1%) |
| $150,000 or more | 31 (28.7%) | 66 (25.6%) |
| Total | 108 (100.0%) | 258 (100.0%) |
Property Value to Household Income Ratio in Russiaville
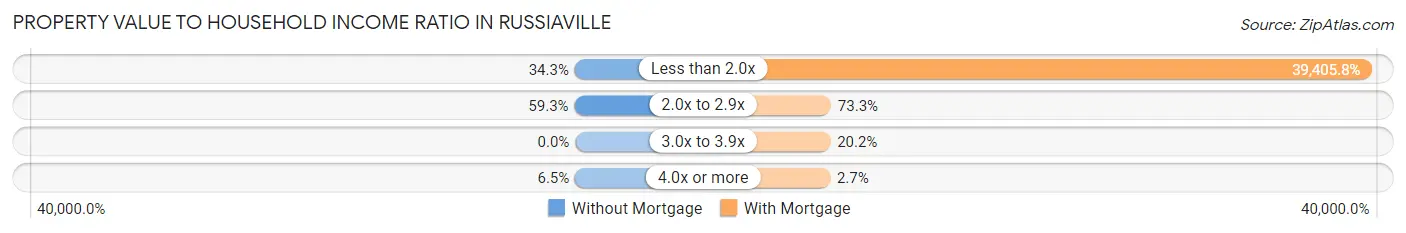
| Value-to-Income Ratio | Without Mortgage | With Mortgage |
| Less than 2.0x | 37 (34.3%) | 101,667 (39,405.8%) |
| 2.0x to 2.9x | 64 (59.3%) | 189 (73.3%) |
| 3.0x to 3.9x | 0 (0.0%) | 52 (20.2%) |
| 4.0x or more | 7 (6.5%) | 7 (2.7%) |
| Total | 108 (100.0%) | 258 (100.0%) |
Real Estate Taxes by Mortgage Status in Russiaville
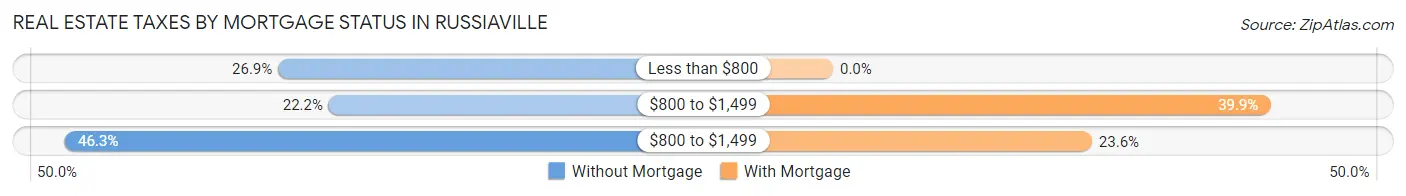
| Property Taxes | Without Mortgage | With Mortgage |
| Less than $800 | 29 (26.9%) | 0 (0.0%) |
| $800 to $1,499 | 24 (22.2%) | 103 (39.9%) |
| $800 to $1,499 | 50 (46.3%) | 61 (23.6%) |
| Total | 108 (100.0%) | 258 (100.0%) |
Health & Disability in Russiaville
Health Insurance Coverage by Age in Russiaville
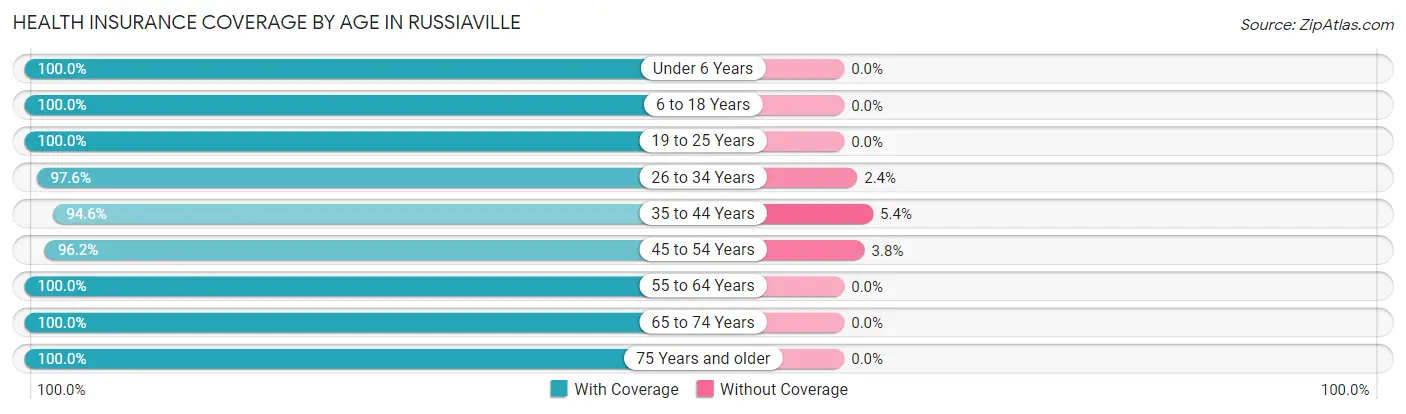
| Age Bracket | With Coverage | Without Coverage |
| Under 6 Years | 141 (100.0%) | 0 (0.0%) |
| 6 to 18 Years | 252 (100.0%) | 0 (0.0%) |
| 19 to 25 Years | 122 (100.0%) | 0 (0.0%) |
| 26 to 34 Years | 161 (97.6%) | 4 (2.4%) |
| 35 to 44 Years | 123 (94.6%) | 7 (5.4%) |
| 45 to 54 Years | 152 (96.2%) | 6 (3.8%) |
| 55 to 64 Years | 164 (100.0%) | 0 (0.0%) |
| 65 to 74 Years | 135 (100.0%) | 0 (0.0%) |
| 75 Years and older | 82 (100.0%) | 0 (0.0%) |
| Total | 1,332 (98.7%) | 17 (1.3%) |
Health Insurance Coverage by Citizenship Status in Russiaville
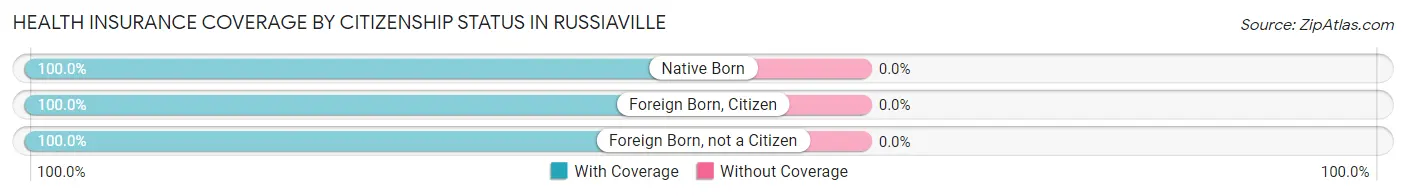
| Citizenship Status | With Coverage | Without Coverage |
| Native Born | 141 (100.0%) | 0 (0.0%) |
| Foreign Born, Citizen | 252 (100.0%) | 0 (0.0%) |
| Foreign Born, not a Citizen | 122 (100.0%) | 0 (0.0%) |
Health Insurance Coverage by Household Income in Russiaville
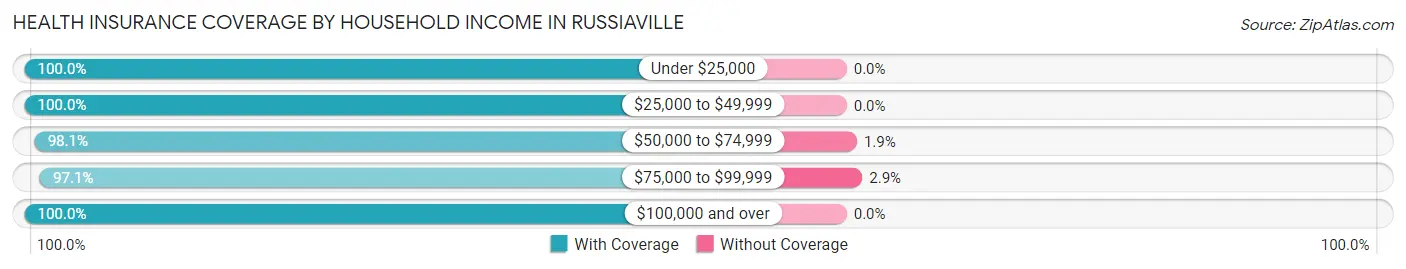
| Household Income | With Coverage | Without Coverage |
| Under $25,000 | 75 (100.0%) | 0 (0.0%) |
| $25,000 to $49,999 | 77 (100.0%) | 0 (0.0%) |
| $50,000 to $74,999 | 207 (98.1%) | 4 (1.9%) |
| $75,000 to $99,999 | 432 (97.1%) | 13 (2.9%) |
| $100,000 and over | 541 (100.0%) | 0 (0.0%) |
Public vs Private Health Insurance Coverage by Age in Russiaville
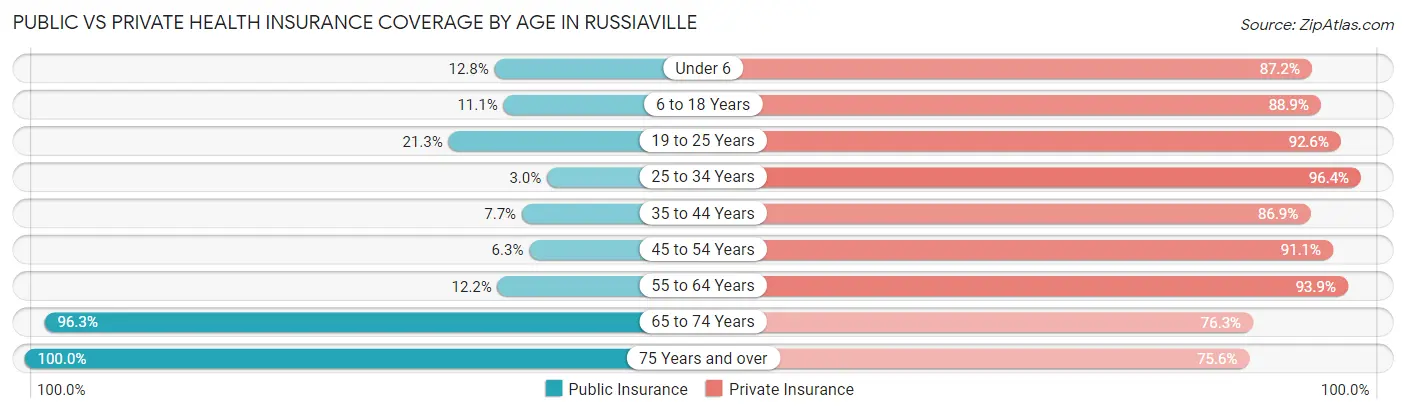
| Age Bracket | Public Insurance | Private Insurance |
| Under 6 | 18 (12.8%) | 123 (87.2%) |
| 6 to 18 Years | 28 (11.1%) | 224 (88.9%) |
| 19 to 25 Years | 26 (21.3%) | 113 (92.6%) |
| 25 to 34 Years | 5 (3.0%) | 159 (96.4%) |
| 35 to 44 Years | 10 (7.7%) | 113 (86.9%) |
| 45 to 54 Years | 10 (6.3%) | 144 (91.1%) |
| 55 to 64 Years | 20 (12.2%) | 154 (93.9%) |
| 65 to 74 Years | 130 (96.3%) | 103 (76.3%) |
| 75 Years and over | 82 (100.0%) | 62 (75.6%) |
| Total | 329 (24.4%) | 1,195 (88.6%) |
Disability Status by Sex by Age in Russiaville
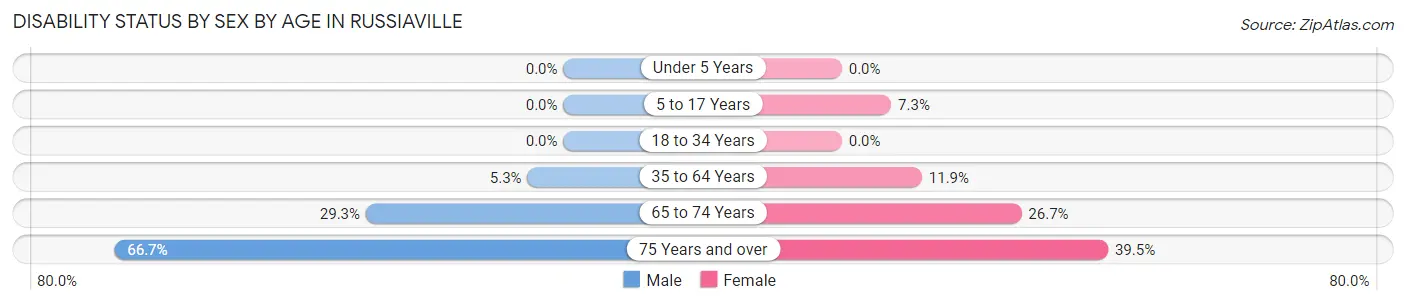
| Age Bracket | Male | Female |
| Under 5 Years | 0 (0.0%) | 0 (0.0%) |
| 5 to 17 Years | 0 (0.0%) | 11 (7.3%) |
| 18 to 34 Years | 0 (0.0%) | 0 (0.0%) |
| 35 to 64 Years | 12 (5.3%) | 27 (11.9%) |
| 65 to 74 Years | 22 (29.3%) | 16 (26.7%) |
| 75 Years and over | 26 (66.7%) | 17 (39.5%) |
Disability Class by Sex by Age in Russiaville
Disability Class: Hearing Difficulty
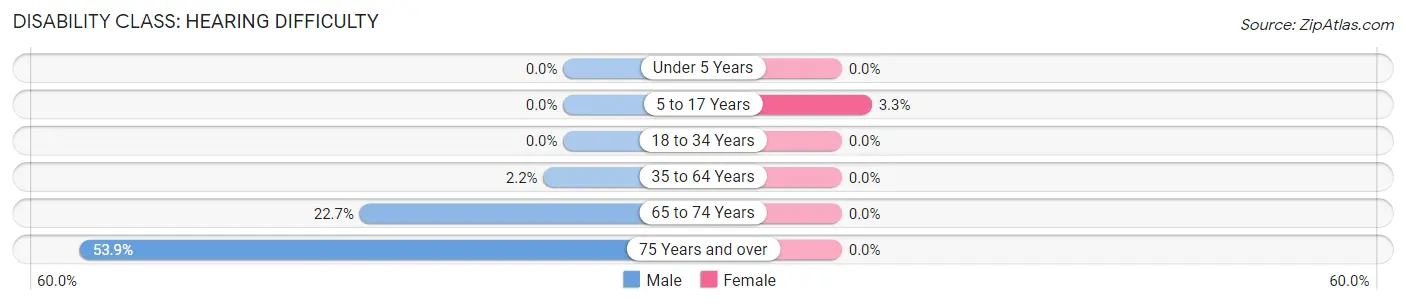
| Age Bracket | Male | Female |
| Under 5 Years | 0 (0.0%) | 0 (0.0%) |
| 5 to 17 Years | 0 (0.0%) | 5 (3.3%) |
| 18 to 34 Years | 0 (0.0%) | 0 (0.0%) |
| 35 to 64 Years | 5 (2.2%) | 0 (0.0%) |
| 65 to 74 Years | 17 (22.7%) | 0 (0.0%) |
| 75 Years and over | 21 (53.8%) | 0 (0.0%) |
Disability Class: Vision Difficulty
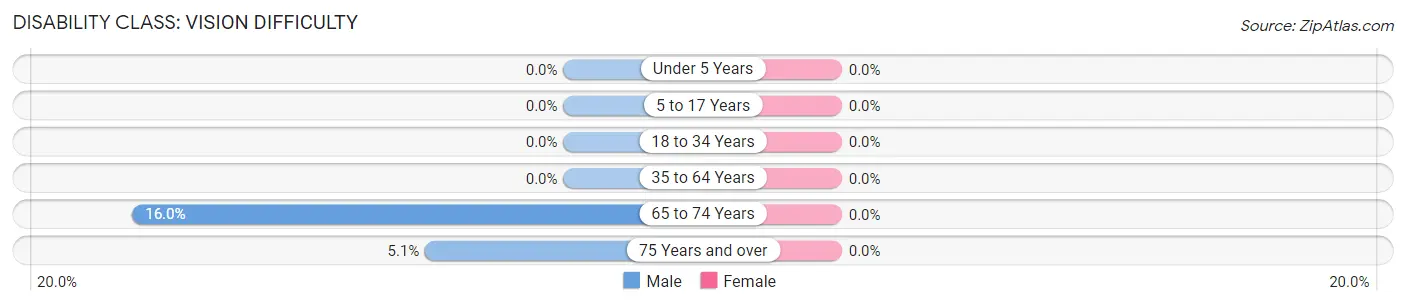
| Age Bracket | Male | Female |
| Under 5 Years | 0 (0.0%) | 0 (0.0%) |
| 5 to 17 Years | 0 (0.0%) | 0 (0.0%) |
| 18 to 34 Years | 0 (0.0%) | 0 (0.0%) |
| 35 to 64 Years | 0 (0.0%) | 0 (0.0%) |
| 65 to 74 Years | 12 (16.0%) | 0 (0.0%) |
| 75 Years and over | 2 (5.1%) | 0 (0.0%) |
Disability Class: Cognitive Difficulty
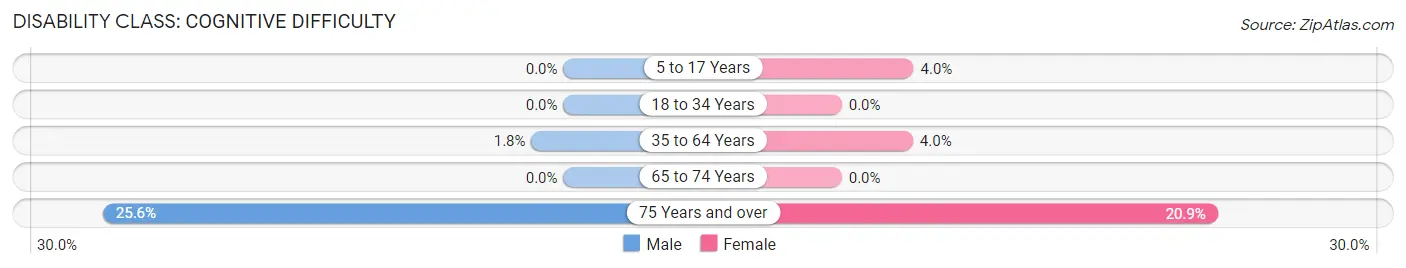
| Age Bracket | Male | Female |
| 5 to 17 Years | 0 (0.0%) | 6 (4.0%) |
| 18 to 34 Years | 0 (0.0%) | 0 (0.0%) |
| 35 to 64 Years | 4 (1.8%) | 9 (4.0%) |
| 65 to 74 Years | 0 (0.0%) | 0 (0.0%) |
| 75 Years and over | 10 (25.6%) | 9 (20.9%) |
Disability Class: Ambulatory Difficulty
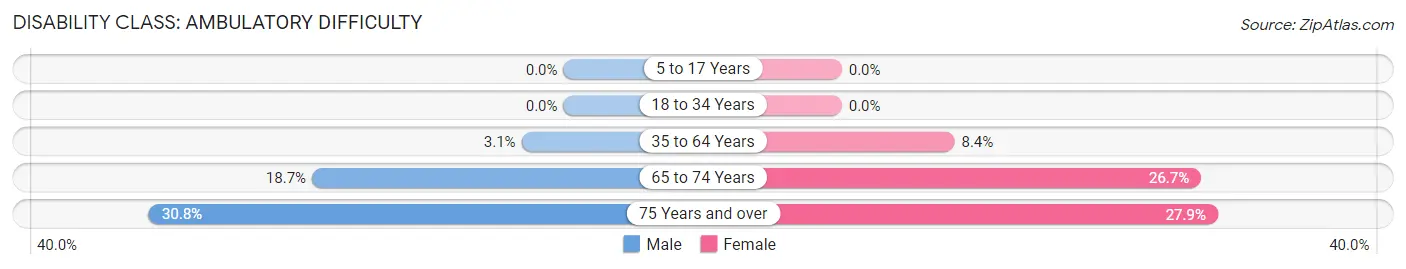
| Age Bracket | Male | Female |
| 5 to 17 Years | 0 (0.0%) | 0 (0.0%) |
| 18 to 34 Years | 0 (0.0%) | 0 (0.0%) |
| 35 to 64 Years | 7 (3.1%) | 19 (8.4%) |
| 65 to 74 Years | 14 (18.7%) | 16 (26.7%) |
| 75 Years and over | 12 (30.8%) | 12 (27.9%) |
Disability Class: Self-Care Difficulty
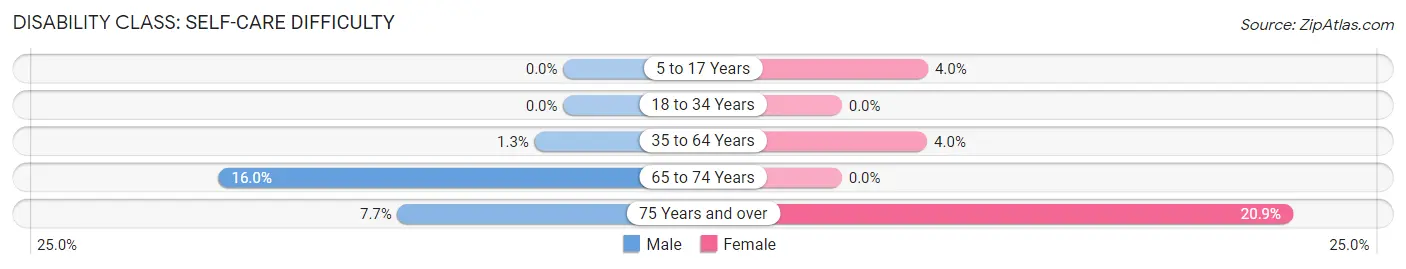
| Age Bracket | Male | Female |
| 5 to 17 Years | 0 (0.0%) | 6 (4.0%) |
| 18 to 34 Years | 0 (0.0%) | 0 (0.0%) |
| 35 to 64 Years | 3 (1.3%) | 9 (4.0%) |
| 65 to 74 Years | 12 (16.0%) | 0 (0.0%) |
| 75 Years and over | 3 (7.7%) | 9 (20.9%) |
Technology Access in Russiaville
Computing Device Access in Russiaville
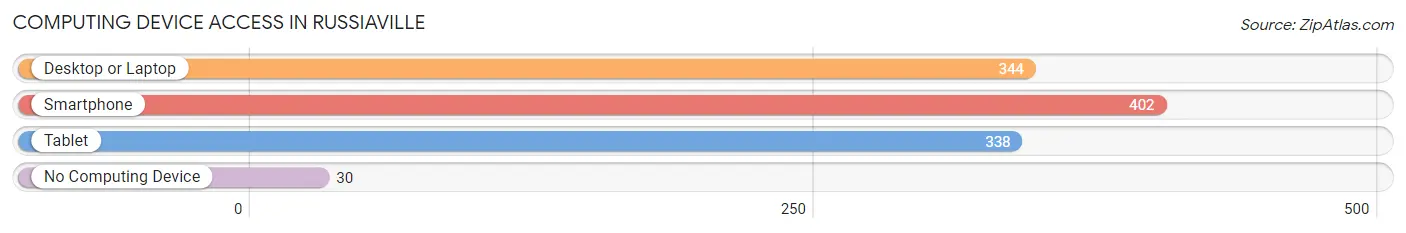
| Device Type | # Households | % Households |
| Desktop or Laptop | 344 | 74.8% |
| Smartphone | 402 | 87.4% |
| Tablet | 338 | 73.5% |
| No Computing Device | 30 | 6.5% |
| Total | 460 | 100.0% |
Internet Access in Russiaville
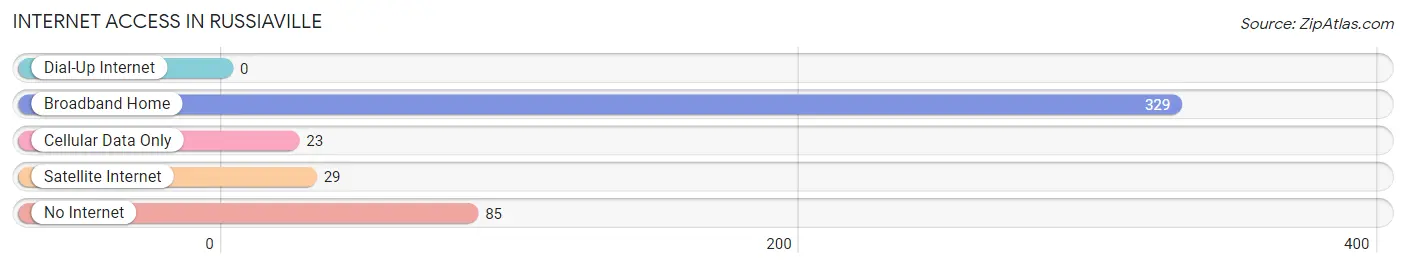
| Internet Type | # Households | % Households |
| Dial-Up Internet | 0 | 0.0% |
| Broadband Home | 329 | 71.5% |
| Cellular Data Only | 23 | 5.0% |
| Satellite Internet | 29 | 6.3% |
| No Internet | 85 | 18.5% |
| Total | 460 | 100.0% |
Russiaville Summary
History
The small town of Russiaville, Indiana is located in Howard County, about 20 miles northwest of Kokomo. It was founded in 1837 by a group of German immigrants who had come to the area from Russia. The town was originally called “New Russia”, but the name was changed to Russiaville in 1845.
The town was originally a farming community, but it soon developed into a small industrial center. The first industry in the town was a sawmill, which was built in 1845. This was followed by a grist mill, a woolen mill, a flour mill, and a brickyard. The town also had a blacksmith shop, a general store, and a post office.
In the late 19th century, Russiaville began to grow rapidly. The town was connected to the outside world by the railroad in 1887, and the population grew to over 1,000 by 1900. The town also had several churches, a bank, a newspaper, and a hotel.
In the early 20th century, Russiaville continued to grow and prosper. The town had a population of over 1,500 by 1910, and it had several factories, including a canning factory, a furniture factory, and a shoe factory. The town also had a movie theater, a library, and a hospital.
Geography
Russiaville is located in Howard County, Indiana, about 20 miles northwest of Kokomo. The town is situated on the banks of the Wildcat Creek, which flows through the town. The town is surrounded by rolling hills and farmland, and it is located in the Central Till Plains region of Indiana.
The climate in Russiaville is typical of the Midwest, with hot summers and cold winters. The average temperature in the summer is around 75 degrees Fahrenheit, and the average temperature in the winter is around 30 degrees Fahrenheit. The town receives an average of 40 inches of precipitation per year.
Economy
Russiaville’s economy is largely based on agriculture and manufacturing. The town is home to several large farms, which produce corn, soybeans, and wheat. The town also has several factories, which produce furniture, shoes, and canned goods.
The town also has several small businesses, including restaurants, shops, and service providers. The town also has a bank, a post office, and a library.
Demographics
As of the 2010 census, the population of Russiaville was 1,717. The town has a population density of 1,072 people per square mile. The median age in the town is 38.7 years, and the median household income is $45,938.
The racial makeup of the town is 97.3% White, 0.9% African American, 0.2% Native American, 0.2% Asian, 0.1% Pacific Islander, 0.3% from other races, and 0.9% from two or more races. The town also has a large Hispanic population, which makes up 4.2% of the population.
Conclusion
Russiaville is a small town in Howard County, Indiana, with a population of 1,717. The town was founded in 1837 by German immigrants, and it has a long history of agriculture and manufacturing. The town has a median household income of $45,938, and the racial makeup of the town is 97.3% White, 0.9% African American, 0.2% Native American, 0.2% Asian, 0.1% Pacific Islander, 0.3% from other races, and 0.9% from two or more races. The town also has a large Hispanic population, which makes up 4.2% of the population.
Common Questions
What is the Total Population of Russiaville?
Total Population of Russiaville is 1,349.
What is the Total Male Population of Russiaville?
Total Male Population of Russiaville is 654.
What is the Total Female Population of Russiaville?
Total Female Population of Russiaville is 695.
What is the Ratio of Males per 100 Females in Russiaville?
There are 94.10 Males per 100 Females in Russiaville.
What is the Ratio of Females per 100 Males in Russiaville?
There are 106.27 Females per 100 Males in Russiaville.
What is the Median Population Age in Russiaville?
Median Population Age in Russiaville is 34.5 Years.
What is the Average Family Size in Russiaville
Average Family Size in Russiaville is 3.2 People.
What is the Average Household Size in Russiaville
Average Household Size in Russiaville is 2.9 People.
What is Per Capita Income in Russiaville?
Per Capita income in Russiaville is $38,269.
What is the Median Family Income in Russiaville?
Median Family Income in Russiaville is $87,344.
What is the Median Household income in Russiaville?
Median Household Income in Russiaville is $84,032.
What is Income or Wage Gap in Russiaville?
Income or Wage Gap in Russiaville is 17.1%.
Women in Russiaville earn 82.9 cents for every dollar earned by a man.
What is Inequality or Gini Index in Russiaville?
Inequality or Gini Index in Russiaville is 0.38.
How Large is the Labor Force in Russiaville?
There are 626 People in the Labor Forcein in Russiaville.
What is the Percentage of People in the Labor Force in Russiaville?
61.3% of People are in the Labor Force in Russiaville.
What is the Unemployment Rate in Russiaville?
Unemployment Rate in Russiaville is 2.6%.