Sky Valley, GA
Sky Valley Map
Sky Valley Overview
599
TOTAL POPULATION
222
MALE POPULATION
377
FEMALE POPULATION
58.89
MALES / 100 FEMALES
169.82
FEMALES / 100 MALES
58.5
MEDIAN AGE
2.4
AVG FAMILY SIZE
1.6
AVG HOUSEHOLD SIZE
$49,353
PER CAPITA INCOME
$92,000
AVG FAMILY INCOME
0.60
INEQUALITY / GINI INDEX
308
LABOR FORCE [ PEOPLE ]
53.4%
PERCENT IN LABOR FORCE
4.9%
UNEMPLOYMENT RATE
Sky Valley Area Codes
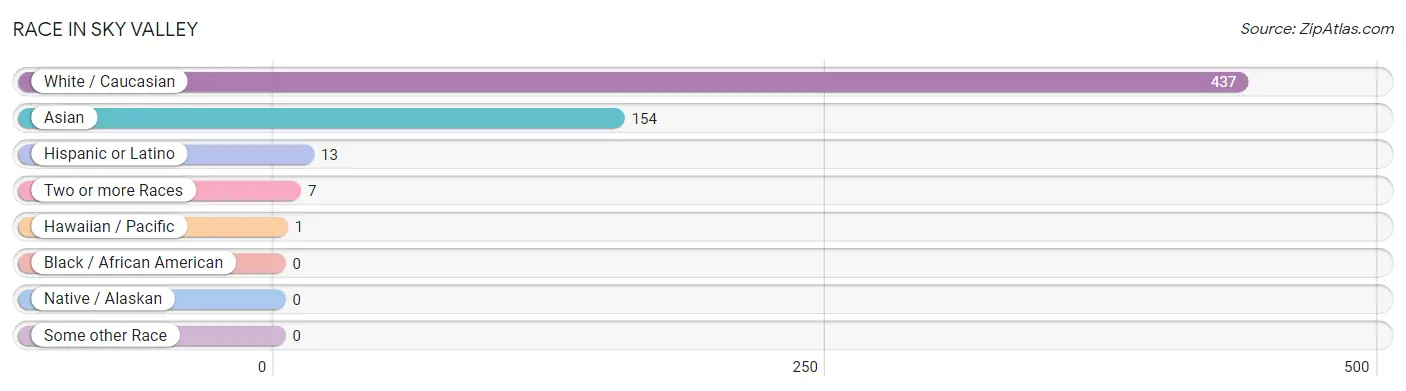
Race in Sky Valley
The most populous races in Sky Valley are White / Caucasian (437 | 73.0%), Asian (154 | 25.7%), and Hispanic or Latino (13 | 2.2%).
| Race | # Population | % Population |
| Asian | 154 | 25.7% |
| Black / African American | 0 | 0.0% |
| Hawaiian / Pacific | 1 | 0.2% |
| Hispanic or Latino | 13 | 2.2% |
| Native / Alaskan | 0 | 0.0% |
| White / Caucasian | 437 | 73.0% |
| Two or more Races | 7 | 1.2% |
| Some other Race | 0 | 0.0% |
| Total | 599 | 100.0% |
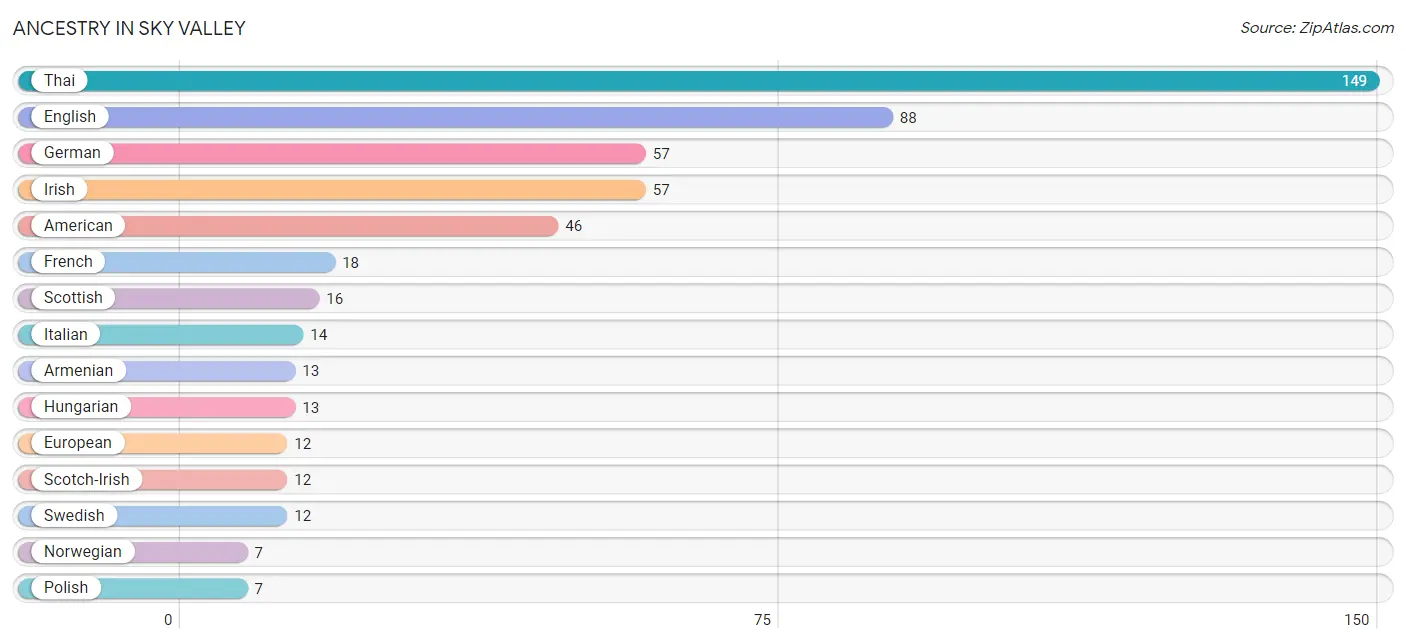
Ancestry in Sky Valley
The most populous ancestries reported in Sky Valley are Thai (149 | 24.9%), English (88 | 14.7%), German (57 | 9.5%), Irish (57 | 9.5%), and American (46 | 7.7%), together accounting for 66.3% of all Sky Valley residents.
| Ancestry | # Population | % Population |
| American | 46 | 7.7% |
| Arab | 1 | 0.2% |
| Armenian | 13 | 2.2% |
| British | 2 | 0.3% |
| Central American | 2 | 0.3% |
| Cherokee | 5 | 0.8% |
| Colombian | 2 | 0.3% |
| Dominican | 2 | 0.3% |
| Dutch | 4 | 0.7% |
| Eastern European | 2 | 0.3% |
| English | 88 | 14.7% |
| European | 12 | 2.0% |
| French | 18 | 3.0% |
| French Canadian | 1 | 0.2% |
| German | 57 | 9.5% |
| Greek | 4 | 0.7% |
| Guamanian / Chamorro | 1 | 0.2% |
| Honduran | 2 | 0.3% |
| Hungarian | 13 | 2.2% |
| Irish | 57 | 9.5% |
| Italian | 14 | 2.3% |
| Korean | 5 | 0.8% |
| Norwegian | 7 | 1.2% |
| Polish | 7 | 1.2% |
| Puerto Rican | 3 | 0.5% |
| Scandinavian | 1 | 0.2% |
| Scotch-Irish | 12 | 2.0% |
| Scottish | 16 | 2.7% |
| South American | 2 | 0.3% |
| Spaniard | 4 | 0.7% |
| Swedish | 12 | 2.0% |
| Swiss | 2 | 0.3% |
| Thai | 149 | 24.9% |
| Welsh | 1 | 0.2% | View All 34 Rows |
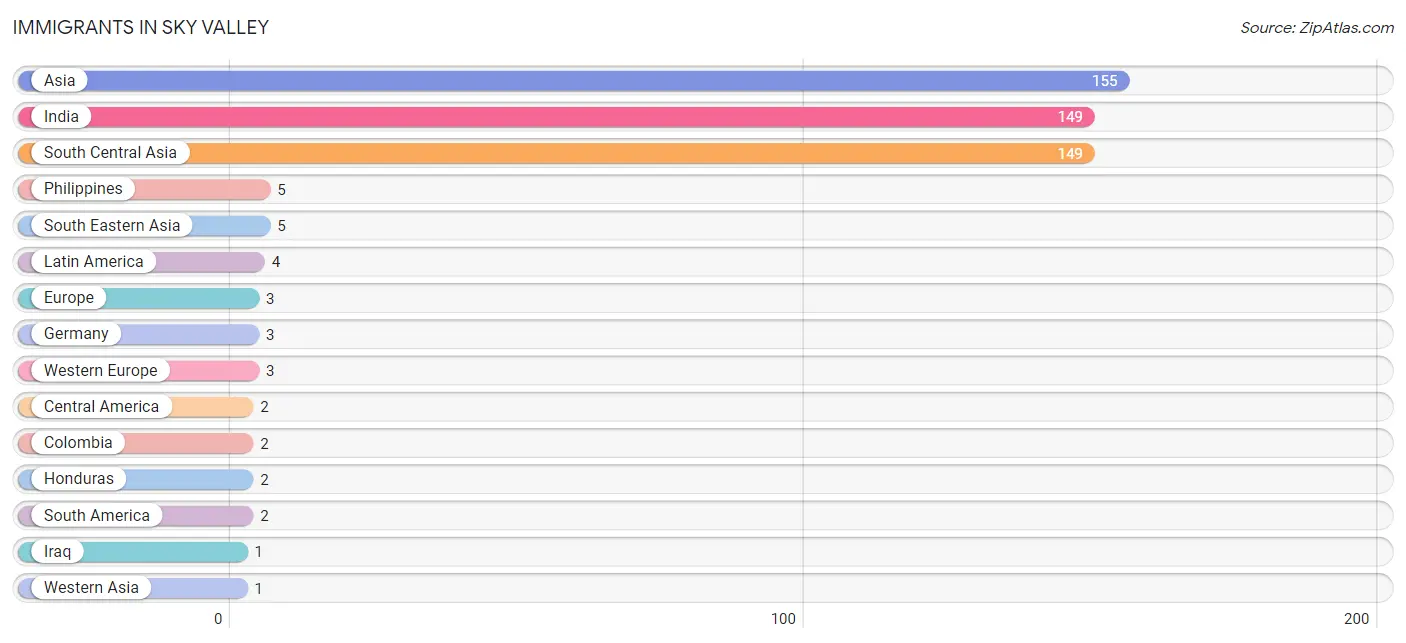
Immigrants in Sky Valley
The most numerous immigrant groups reported in Sky Valley came from Asia (155 | 25.9%), India (149 | 24.9%), South Central Asia (149 | 24.9%), Philippines (5 | 0.8%), and South Eastern Asia (5 | 0.8%), together accounting for 77.3% of all Sky Valley residents.
| Immigration Origin | # Population | % Population |
| Asia | 155 | 25.9% |
| Central America | 2 | 0.3% |
| Colombia | 2 | 0.3% |
| Europe | 3 | 0.5% |
| Germany | 3 | 0.5% |
| Honduras | 2 | 0.3% |
| India | 149 | 24.9% |
| Iraq | 1 | 0.2% |
| Latin America | 4 | 0.7% |
| Philippines | 5 | 0.8% |
| South America | 2 | 0.3% |
| South Central Asia | 149 | 24.9% |
| South Eastern Asia | 5 | 0.8% |
| Western Asia | 1 | 0.2% |
| Western Europe | 3 | 0.5% | View All 15 Rows |
Sex and Age in Sky Valley
Sex and Age in Sky Valley
The most populous age groups in Sky Valley are 65 to 69 Years (42 | 18.9%) for men and 30 to 34 Years (154 | 40.8%) for women.
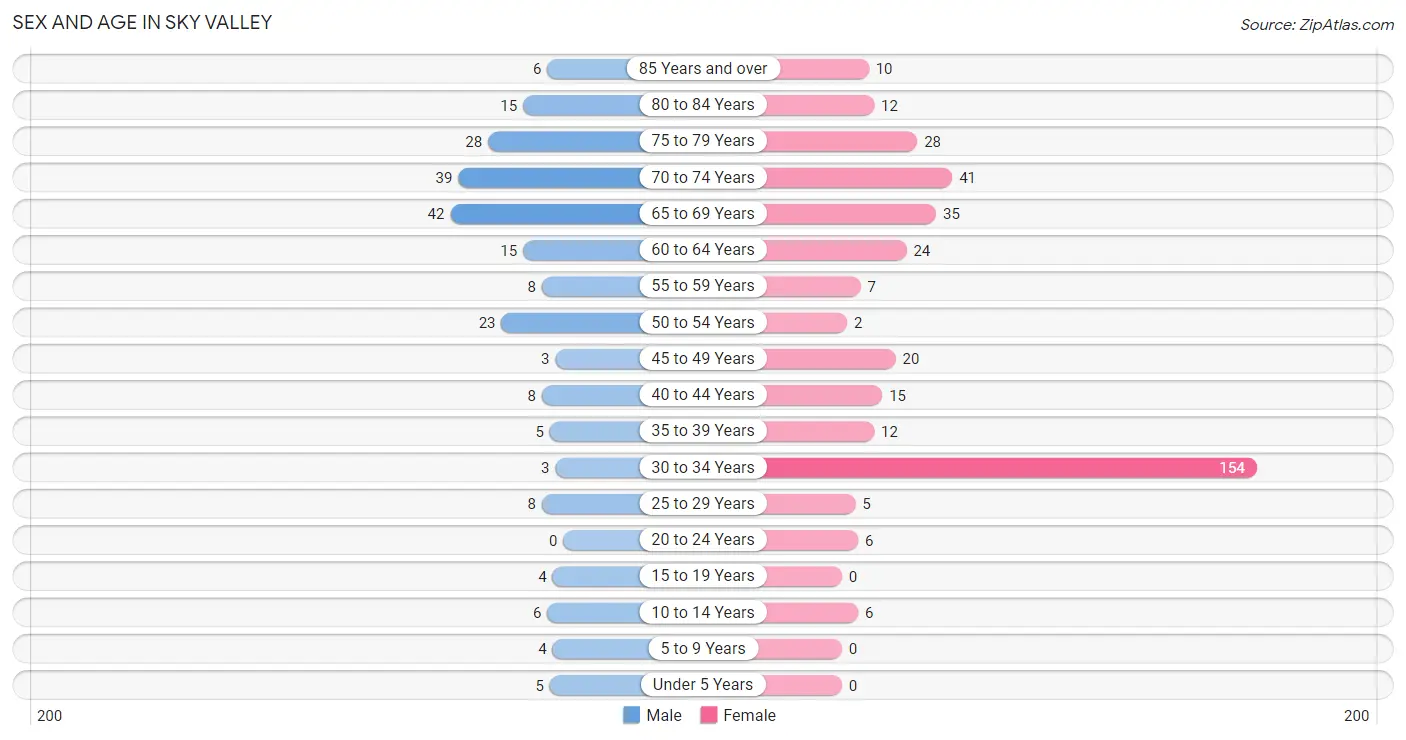
| Age Bracket | Male | Female |
| Under 5 Years | 5 (2.2%) | 0 (0.0%) |
| 5 to 9 Years | 4 (1.8%) | 0 (0.0%) |
| 10 to 14 Years | 6 (2.7%) | 6 (1.6%) |
| 15 to 19 Years | 4 (1.8%) | 0 (0.0%) |
| 20 to 24 Years | 0 (0.0%) | 6 (1.6%) |
| 25 to 29 Years | 8 (3.6%) | 5 (1.3%) |
| 30 to 34 Years | 3 (1.3%) | 154 (40.8%) |
| 35 to 39 Years | 5 (2.2%) | 12 (3.2%) |
| 40 to 44 Years | 8 (3.6%) | 15 (4.0%) |
| 45 to 49 Years | 3 (1.3%) | 20 (5.3%) |
| 50 to 54 Years | 23 (10.4%) | 2 (0.5%) |
| 55 to 59 Years | 8 (3.6%) | 7 (1.9%) |
| 60 to 64 Years | 15 (6.8%) | 24 (6.4%) |
| 65 to 69 Years | 42 (18.9%) | 35 (9.3%) |
| 70 to 74 Years | 39 (17.6%) | 41 (10.9%) |
| 75 to 79 Years | 28 (12.6%) | 28 (7.4%) |
| 80 to 84 Years | 15 (6.8%) | 12 (3.2%) |
| 85 Years and over | 6 (2.7%) | 10 (2.6%) |
| Total | 222 (100.0%) | 377 (100.0%) |
Families and Households in Sky Valley
Median Family Size in Sky Valley
The median family size in Sky Valley is 2.38 persons per family, with single female/mother families (13 | 8.1%) accounting for the largest median family size of 3.69 persons per family. On the other hand, married-couple families (138 | 86.3%) represent the smallest median family size with 2.26 persons per family.
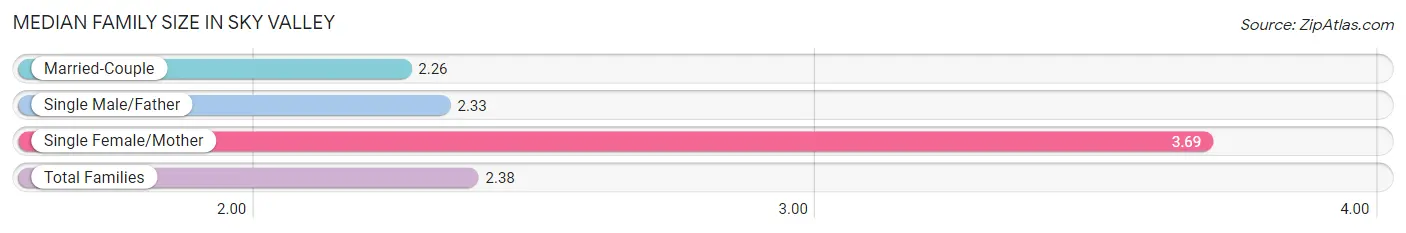
| Family Type | # Families | Family Size |
| Married-Couple | 138 (86.3%) | 2.26 |
| Single Male/Father | 9 (5.6%) | 2.33 |
| Single Female/Mother | 13 (8.1%) | 3.69 |
| Total Families | 160 (100.0%) | 2.38 |
Median Household Size in Sky Valley
The median household size in Sky Valley is 1.65 persons per household, with single female/mother households (13 | 3.6%) accounting for the largest median household size of 4 persons per household. non-family households (203 | 55.9%) represent the smallest median household size with 1.02 persons per household.
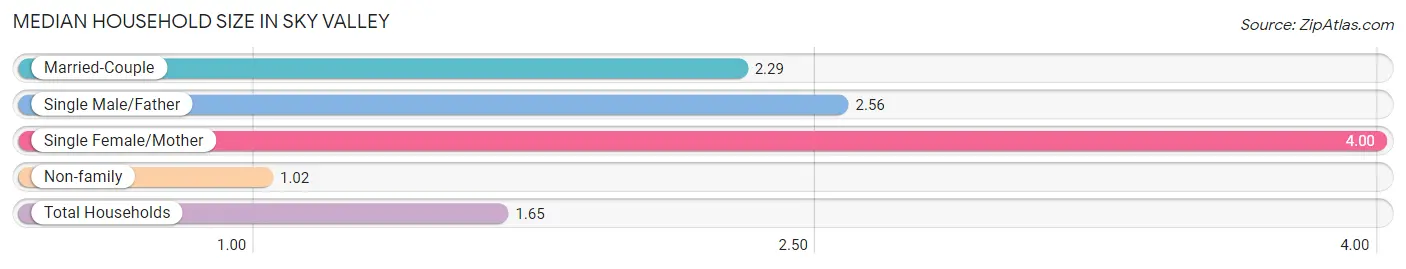
| Household Type | # Households | Household Size |
| Married-Couple | 138 (38.0%) | 2.29 |
| Single Male/Father | 9 (2.5%) | 2.56 |
| Single Female/Mother | 13 (3.6%) | 4.00 |
| Non-family | 203 (55.9%) | 1.02 |
| Total Households | 363 (100.0%) | 1.65 |
Household Size by Marriage Status in Sky Valley
Out of a total of 363 households in Sky Valley, 160 (44.1%) are family households, while 203 (55.9%) are nonfamily households. The most numerous type of family households are 2-person households, comprising 135, and the most common type of nonfamily households are 1-person households, comprising 198.
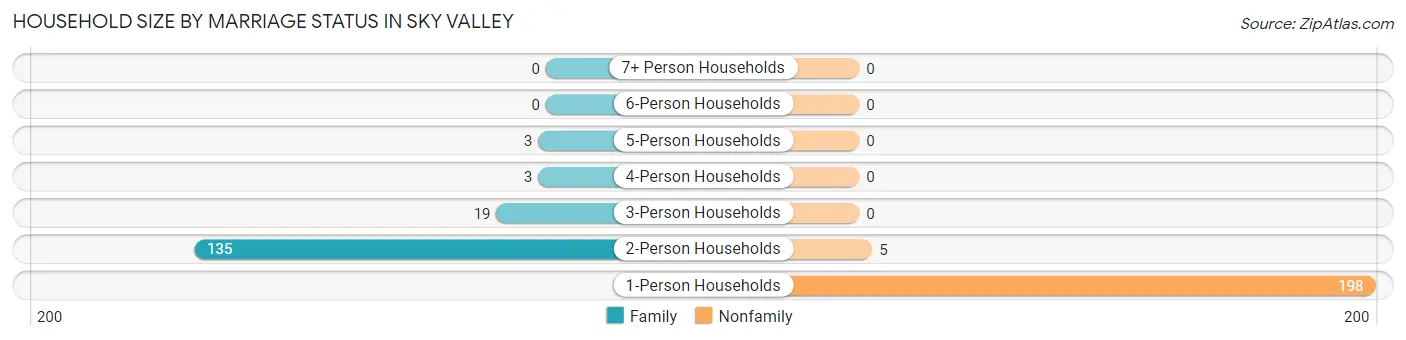
| Household Size | Family Households | Nonfamily Households |
| 1-Person Households | - | 198 (54.5%) |
| 2-Person Households | 135 (37.2%) | 5 (1.4%) |
| 3-Person Households | 19 (5.2%) | 0 (0.0%) |
| 4-Person Households | 3 (0.8%) | 0 (0.0%) |
| 5-Person Households | 3 (0.8%) | 0 (0.0%) |
| 6-Person Households | 0 (0.0%) | 0 (0.0%) |
| 7+ Person Households | 0 (0.0%) | 0 (0.0%) |
| Total | 160 (44.1%) | 203 (55.9%) |
Female Fertility in Sky Valley
Fertility by Age in Sky Valley
Average fertility rate in Sky Valley is 14.0 births per 1,000 women. Women in the age bracket of 20 to 34 years have the highest fertility rate with 18.0 births per 1,000 women. Women in the age bracket of 20 to 34 years acount for 100.0% of all women with births.
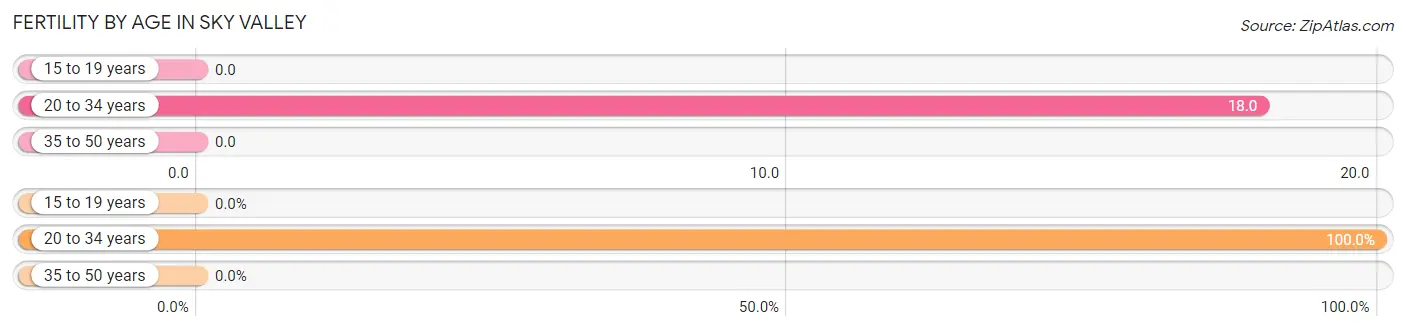
| Age Bracket | Women with Births | Births / 1,000 Women |
| 15 to 19 years | 0 (0.0%) | 0.0 |
| 20 to 34 years | 3 (100.0%) | 18.0 |
| 35 to 50 years | 0 (0.0%) | 0.0 |
| Total | 3 (100.0%) | 14.0 |
Fertility by Age by Marriage Status in Sky Valley
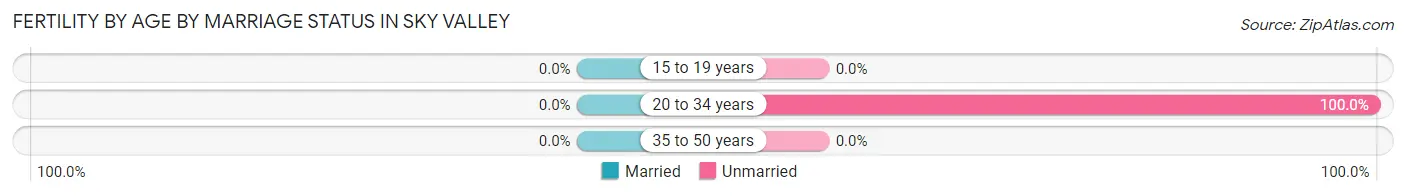
| Age Bracket | Married | Unmarried |
| 15 to 19 years | 0 (0.0%) | 0 (0.0%) |
| 20 to 34 years | 0 (0.0%) | 3 (100.0%) |
| 35 to 50 years | 0 (0.0%) | 0 (0.0%) |
| Total | 0 (0.0%) | 3 (100.0%) |
Fertility by Education in Sky Valley
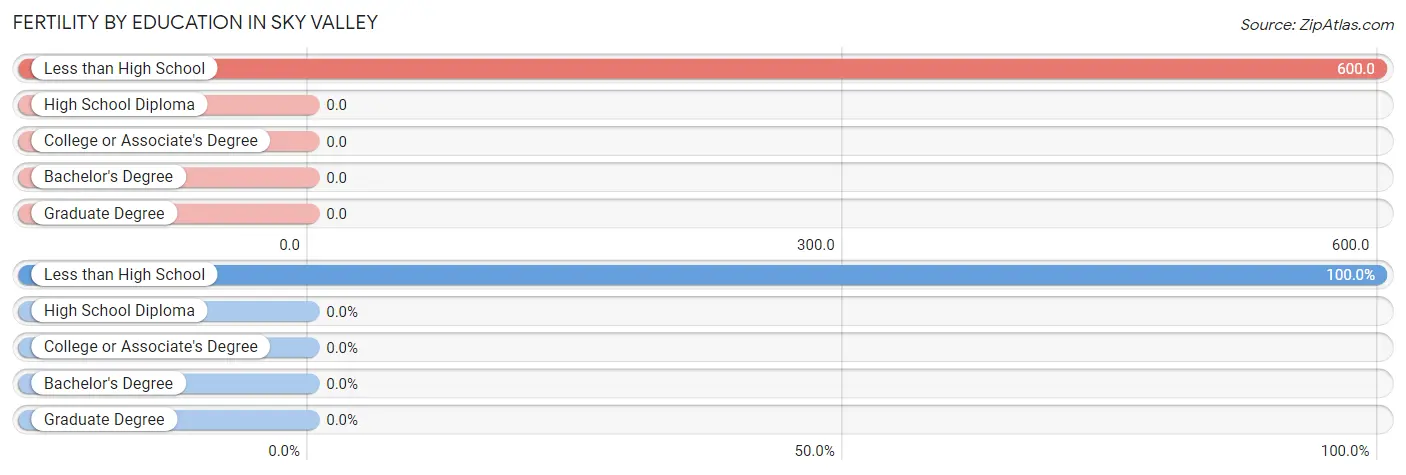
| Educational Attainment | Women with Births | Births / 1,000 Women |
| Less than High School | 3 (100.0%) | 600.0 |
| High School Diploma | 0 (0.0%) | 0.0 |
| College or Associate's Degree | 0 (0.0%) | 0.0 |
| Bachelor's Degree | 0 (0.0%) | 0.0 |
| Graduate Degree | 0 (0.0%) | 0.0 |
| Total | 3 (100.0%) | 14.0 |
Fertility by Education by Marriage Status in Sky Valley
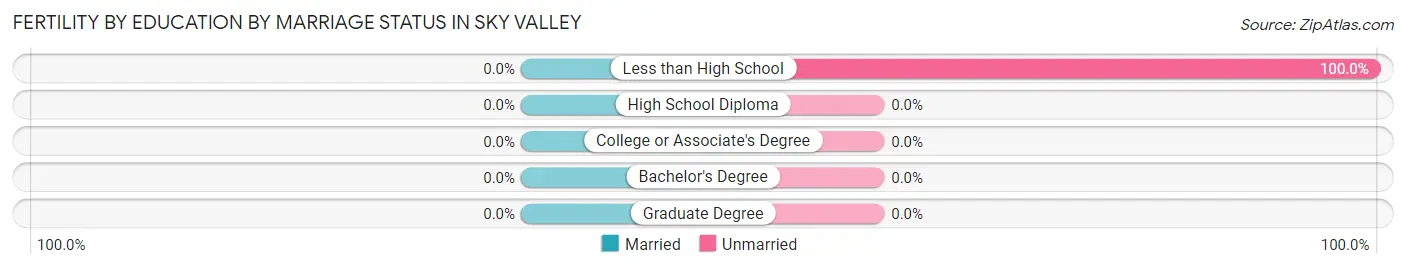
| Educational Attainment | Married | Unmarried |
| Less than High School | 0 (0.0%) | 3 (100.0%) |
| High School Diploma | 0 (0.0%) | 0 (0.0%) |
| College or Associate's Degree | 0 (0.0%) | 0 (0.0%) |
| Bachelor's Degree | 0 (0.0%) | 0 (0.0%) |
| Graduate Degree | 0 (0.0%) | 0 (0.0%) |
| Total | 0 (0.0%) | 3 (100.0%) |
Income in Sky Valley
Income Overview in Sky Valley
| Characteristic | Number | Measure |
| Per Capita Income | 599 | $49,353 |
| Median Family Income | 160 | $92,000 |
| Mean Family Income | 160 | $130,128 |
| Median Household Income | 363 | $0 |
| Mean Household Income | 363 | $73,768 |
| Income Deficit | 160 | $0 |
| Wage / Income Gap (%) | 599 | 0.00% |
| Wage / Income Gap ($) | 599 | 100.00¢ per $1 |
| Gini / Inequality Index | 599 | 0.60 |
Earnings by Sex in Sky Valley
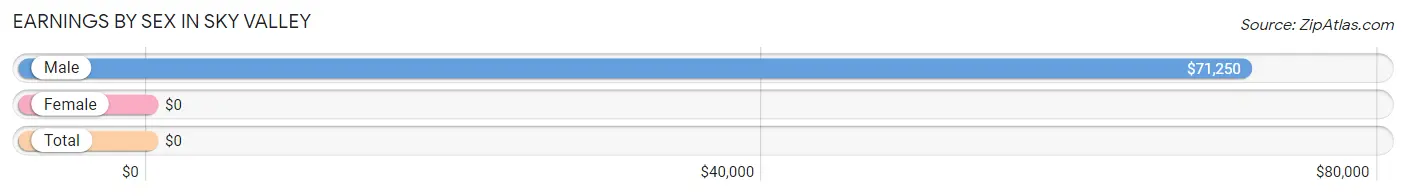
| Sex | Number | Average Earnings |
| Male | 65 (21.2%) | $71,250 |
| Female | 241 (78.8%) | $0 |
| Total | 306 (100.0%) | $0 |
Earnings by Sex by Income Bracket in Sky Valley
The most common earnings brackets in Sky Valley are $100,000+ for men (20 | 30.8%) and $7,500 to $9,999 for women (149 | 61.8%).
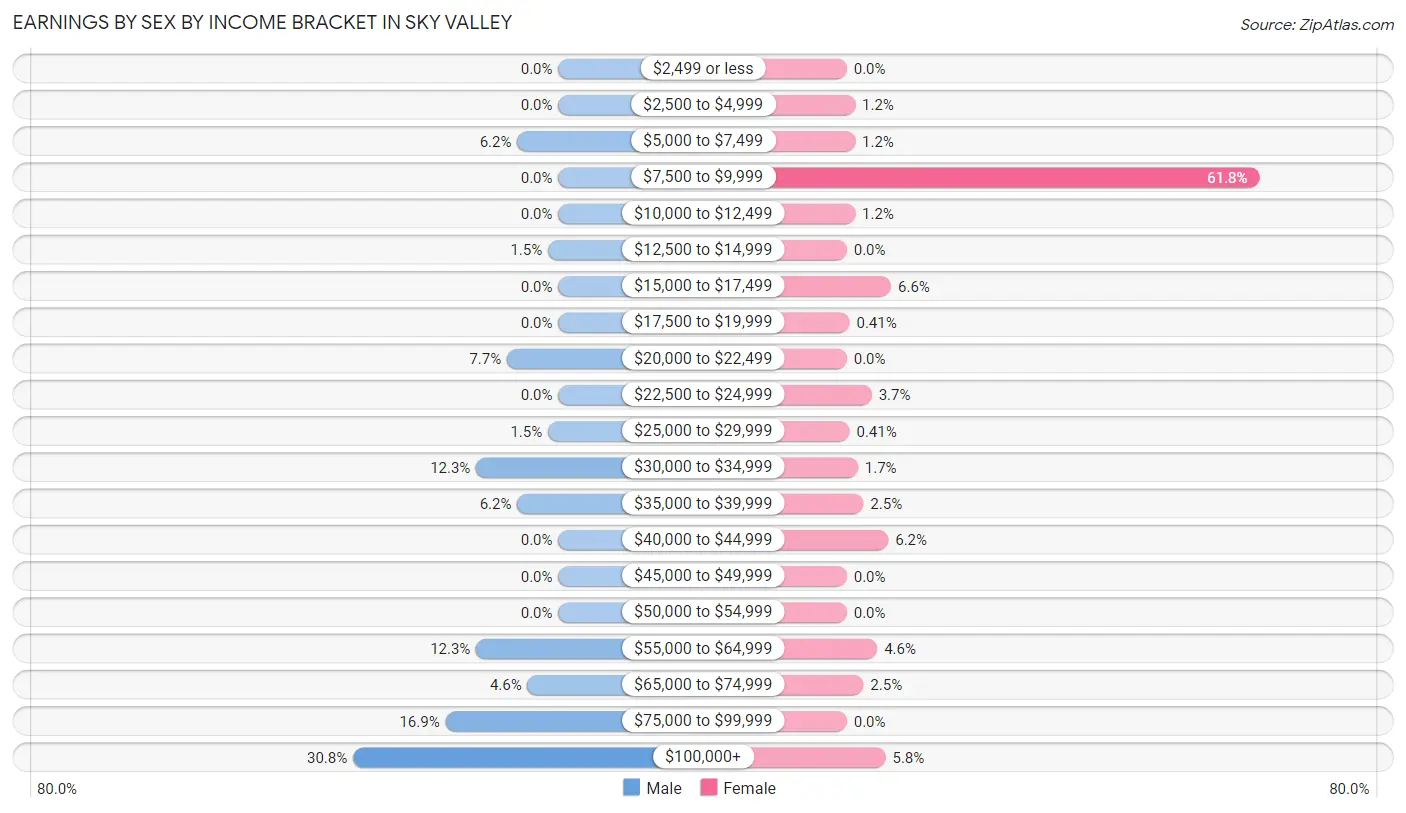
| Income | Male | Female |
| $2,499 or less | 0 (0.0%) | 0 (0.0%) |
| $2,500 to $4,999 | 0 (0.0%) | 3 (1.2%) |
| $5,000 to $7,499 | 4 (6.1%) | 3 (1.2%) |
| $7,500 to $9,999 | 0 (0.0%) | 149 (61.8%) |
| $10,000 to $12,499 | 0 (0.0%) | 3 (1.2%) |
| $12,500 to $14,999 | 1 (1.5%) | 0 (0.0%) |
| $15,000 to $17,499 | 0 (0.0%) | 16 (6.6%) |
| $17,500 to $19,999 | 0 (0.0%) | 1 (0.4%) |
| $20,000 to $22,499 | 5 (7.7%) | 0 (0.0%) |
| $22,500 to $24,999 | 0 (0.0%) | 9 (3.7%) |
| $25,000 to $29,999 | 1 (1.5%) | 1 (0.4%) |
| $30,000 to $34,999 | 8 (12.3%) | 4 (1.7%) |
| $35,000 to $39,999 | 4 (6.1%) | 6 (2.5%) |
| $40,000 to $44,999 | 0 (0.0%) | 15 (6.2%) |
| $45,000 to $49,999 | 0 (0.0%) | 0 (0.0%) |
| $50,000 to $54,999 | 0 (0.0%) | 0 (0.0%) |
| $55,000 to $64,999 | 8 (12.3%) | 11 (4.6%) |
| $65,000 to $74,999 | 3 (4.6%) | 6 (2.5%) |
| $75,000 to $99,999 | 11 (16.9%) | 0 (0.0%) |
| $100,000+ | 20 (30.8%) | 14 (5.8%) |
| Total | 65 (100.0%) | 241 (100.0%) |
Earnings by Sex by Educational Attainment in Sky Valley
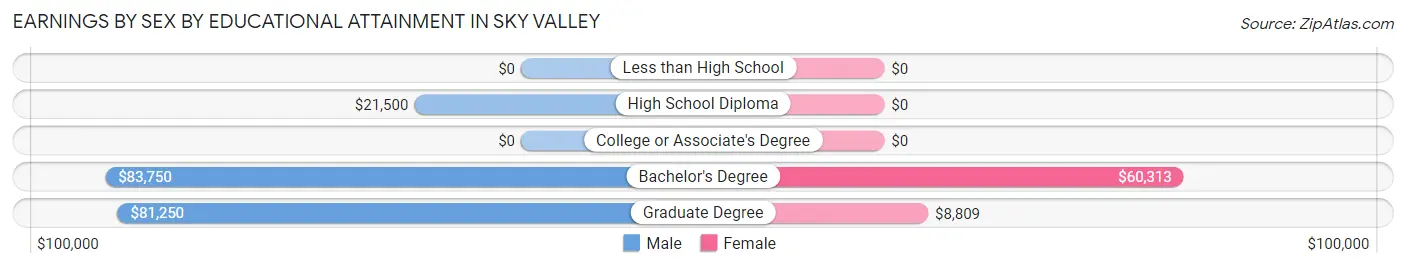
| Educational Attainment | Male Income | Female Income |
| Less than High School | - | - |
| High School Diploma | $21,500 | $0 |
| College or Associate's Degree | - | - |
| Bachelor's Degree | $83,750 | $60,313 |
| Graduate Degree | $81,250 | $8,809 |
| Total | $71,250 | $0 |
Family Income in Sky Valley
Family Income Brackets in Sky Valley
According to the Sky Valley family income data, there are 39 families falling into the $100,000 to $149,999 income range, which is the most common income bracket and makes up 24.4% of all families. Conversely, the less than $10,000 income bracket is the least frequent group with only 1 families (0.6%) belonging to this category.
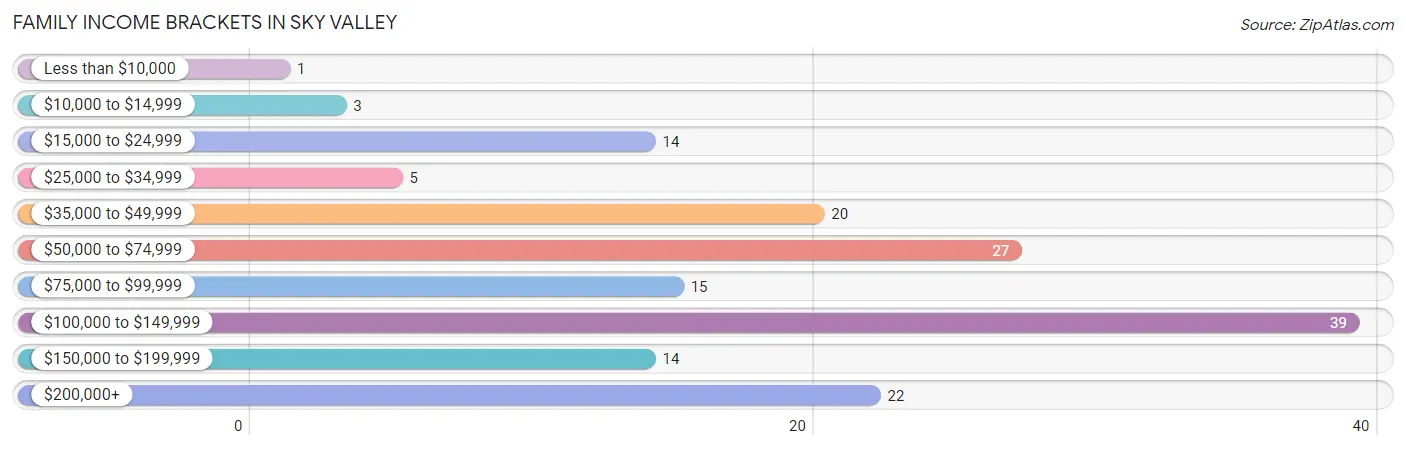
| Income Bracket | # Families | % Families |
| Less than $10,000 | 1 | 0.6% |
| $10,000 to $14,999 | 3 | 1.9% |
| $15,000 to $24,999 | 14 | 8.8% |
| $25,000 to $34,999 | 5 | 3.1% |
| $35,000 to $49,999 | 20 | 12.5% |
| $50,000 to $74,999 | 27 | 16.9% |
| $75,000 to $99,999 | 15 | 9.4% |
| $100,000 to $149,999 | 39 | 24.4% |
| $150,000 to $199,999 | 14 | 8.8% |
| $200,000+ | 22 | 13.8% |
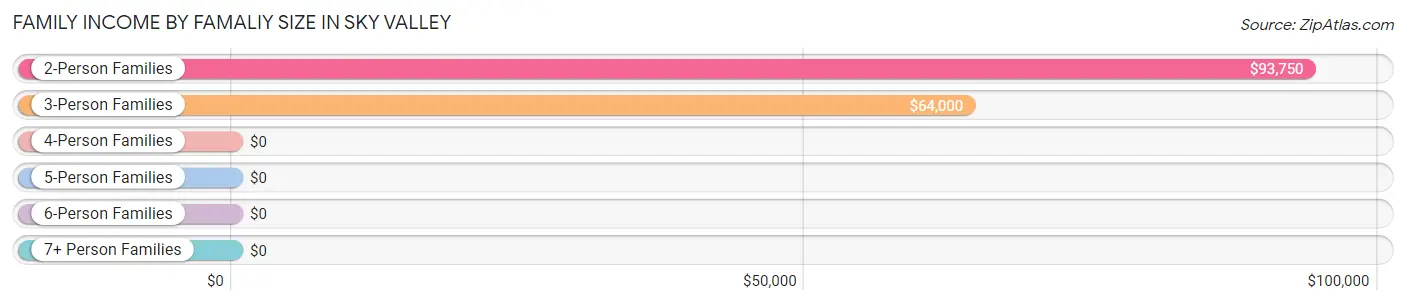
Family Income by Famaliy Size in Sky Valley
2-person families (142 | 88.7%) account for the highest median family income in Sky Valley with $93,750 per family, while 2-person families (142 | 88.7%) have the highest median income of $46,875 per family member.
| Income Bracket | # Families | Median Income |
| 2-Person Families | 142 (88.7%) | $93,750 |
| 3-Person Families | 12 (7.5%) | $64,000 |
| 4-Person Families | 3 (1.9%) | $0 |
| 5-Person Families | 3 (1.9%) | $0 |
| 6-Person Families | 0 (0.0%) | $0 |
| 7+ Person Families | 0 (0.0%) | $0 |
| Total | 160 (100.0%) | $92,000 |
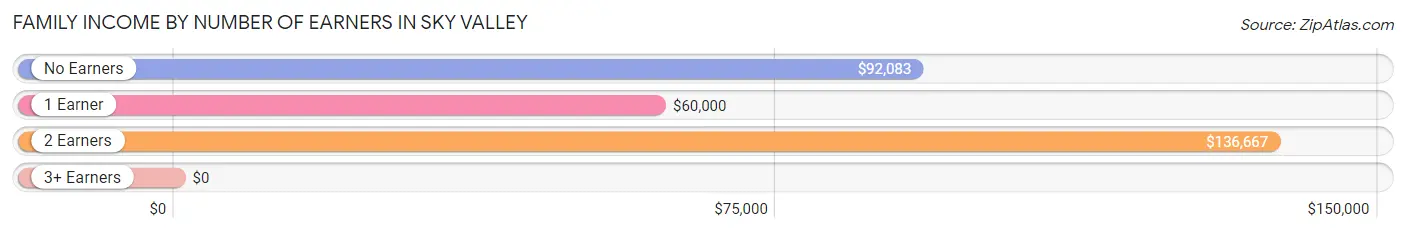
Family Income by Number of Earners in Sky Valley
| Number of Earners | # Families | Median Income |
| No Earners | 81 (50.6%) | $92,083 |
| 1 Earner | 56 (35.0%) | $60,000 |
| 2 Earners | 22 (13.8%) | $136,667 |
| 3+ Earners | 1 (0.6%) | $0 |
| Total | 160 (100.0%) | $92,000 |
Household Income in Sky Valley
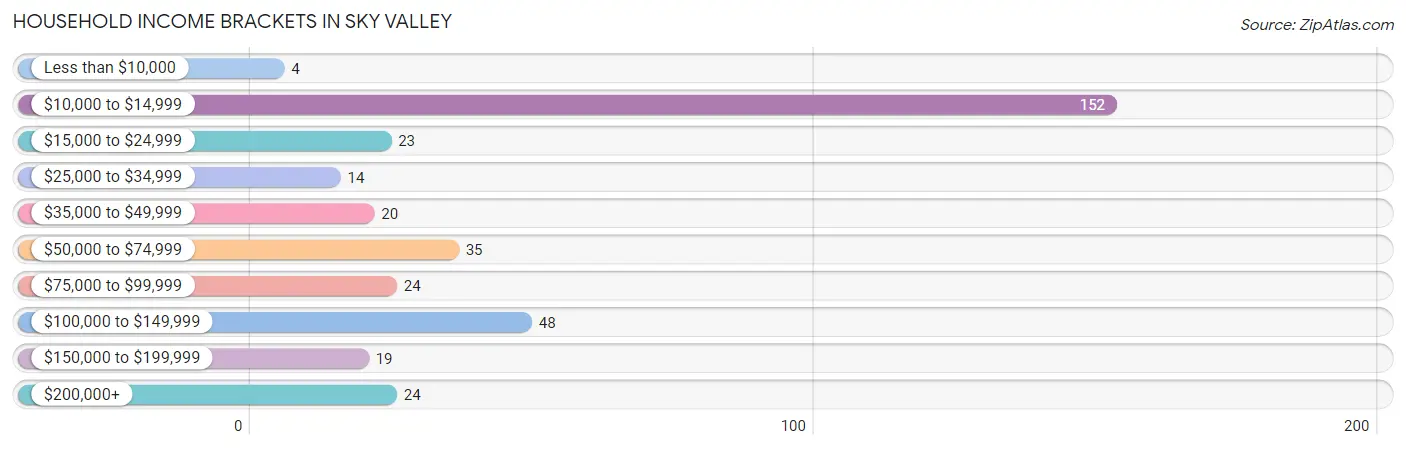
Household Income Brackets in Sky Valley
With 152 households falling in the category, the $10,000 to $14,999 income range is the most frequent in Sky Valley, accounting for 41.9% of all households. In contrast, only 4 households (1.1%) fall into the less than $10,000 income bracket, making it the least populous group.
| Income Bracket | # Households | % Households |
| Less than $10,000 | 4 | 1.1% |
| $10,000 to $14,999 | 152 | 41.9% |
| $15,000 to $24,999 | 23 | 6.3% |
| $25,000 to $34,999 | 14 | 3.9% |
| $35,000 to $49,999 | 20 | 5.5% |
| $50,000 to $74,999 | 35 | 9.6% |
| $75,000 to $99,999 | 24 | 6.6% |
| $100,000 to $149,999 | 48 | 13.2% |
| $150,000 to $199,999 | 19 | 5.2% |
| $200,000+ | 24 | 6.6% |
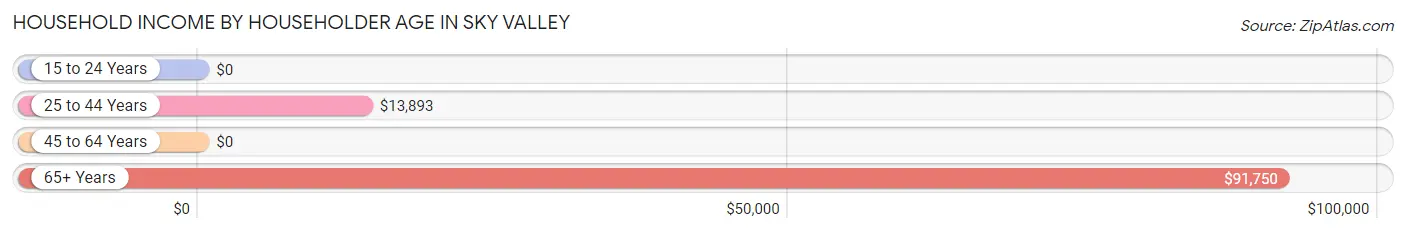
Household Income by Householder Age in Sky Valley
The median household income in Sky Valley is $0, with the highest median household income of $91,750 found in the 65+ years age bracket for the primary householder. A total of 153 households (42.1%) fall into this category.
| Income Bracket | # Households | Median Income |
| 15 to 24 Years | 0 (0.0%) | $0 |
| 25 to 44 Years | 166 (45.7%) | $13,893 |
| 45 to 64 Years | 44 (12.1%) | $0 |
| 65+ Years | 153 (42.1%) | $91,750 |
| Total | 363 (100.0%) | $0 |
Poverty in Sky Valley
Income Below Poverty by Sex and Age in Sky Valley
With 15.3% poverty level for males and 45.4% for females among the residents of Sky Valley, 45 to 54 year old males and 25 to 34 year old females are the most vulnerable to poverty, with 19 males (73.1%) and 151 females (95.0%) in their respective age groups living below the poverty level.
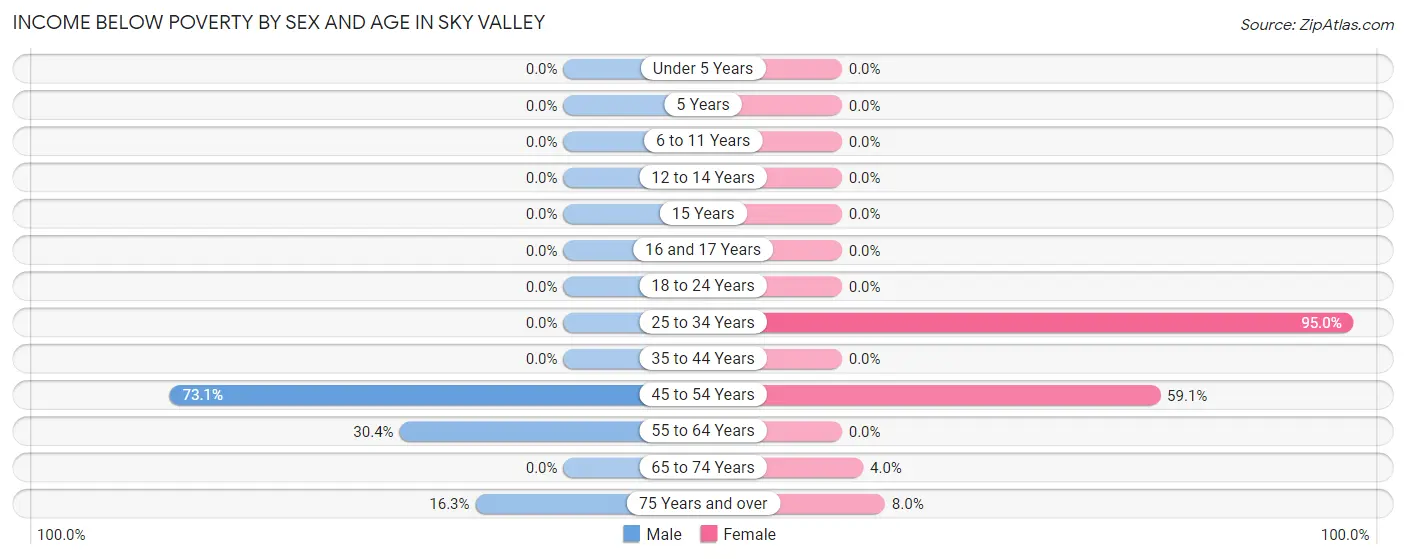
| Age Bracket | Male | Female |
| Under 5 Years | 0 (0.0%) | 0 (0.0%) |
| 5 Years | 0 (0.0%) | 0 (0.0%) |
| 6 to 11 Years | 0 (0.0%) | 0 (0.0%) |
| 12 to 14 Years | 0 (0.0%) | 0 (0.0%) |
| 15 Years | 0 (0.0%) | 0 (0.0%) |
| 16 and 17 Years | 0 (0.0%) | 0 (0.0%) |
| 18 to 24 Years | 0 (0.0%) | 0 (0.0%) |
| 25 to 34 Years | 0 (0.0%) | 151 (95.0%) |
| 35 to 44 Years | 0 (0.0%) | 0 (0.0%) |
| 45 to 54 Years | 19 (73.1%) | 13 (59.1%) |
| 55 to 64 Years | 7 (30.4%) | 0 (0.0%) |
| 65 to 74 Years | 0 (0.0%) | 3 (4.0%) |
| 75 Years and over | 8 (16.3%) | 4 (8.0%) |
| Total | 34 (15.3%) | 171 (45.4%) |
Income Above Poverty by Sex and Age in Sky Valley
According to the poverty statistics in Sky Valley, males aged under 5 years and females aged 12 to 14 years are the age groups that are most secure financially, with 100.0% of males and 100.0% of females in these age groups living above the poverty line.
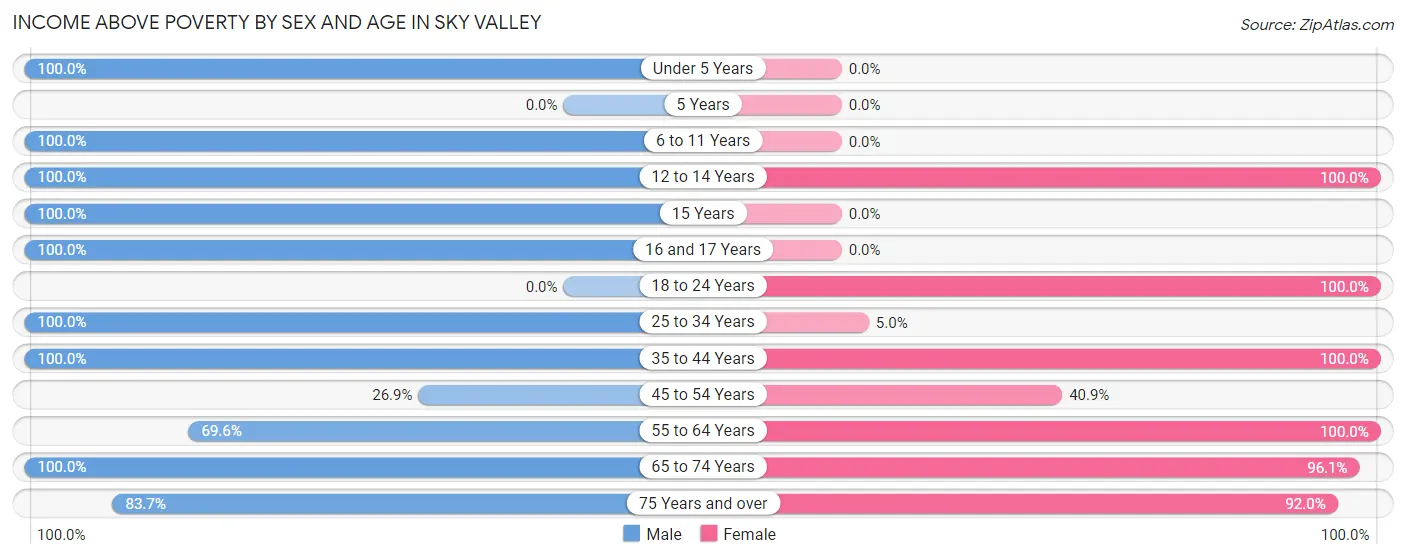
| Age Bracket | Male | Female |
| Under 5 Years | 5 (100.0%) | 0 (0.0%) |
| 5 Years | 0 (0.0%) | 0 (0.0%) |
| 6 to 11 Years | 7 (100.0%) | 0 (0.0%) |
| 12 to 14 Years | 3 (100.0%) | 6 (100.0%) |
| 15 Years | 1 (100.0%) | 0 (0.0%) |
| 16 and 17 Years | 3 (100.0%) | 0 (0.0%) |
| 18 to 24 Years | 0 (0.0%) | 6 (100.0%) |
| 25 to 34 Years | 11 (100.0%) | 8 (5.0%) |
| 35 to 44 Years | 13 (100.0%) | 27 (100.0%) |
| 45 to 54 Years | 7 (26.9%) | 9 (40.9%) |
| 55 to 64 Years | 16 (69.6%) | 31 (100.0%) |
| 65 to 74 Years | 81 (100.0%) | 73 (96.1%) |
| 75 Years and over | 41 (83.7%) | 46 (92.0%) |
| Total | 188 (84.7%) | 206 (54.6%) |
Income Below Poverty Among Married-Couple Families in Sky Valley
The poverty statistics for married-couple families in Sky Valley show that 10.9% or 15 of the total 138 families live below the poverty line. Families with no children have the highest poverty rate of 11.6%, comprising of 15 families. On the other hand, families with 1 or 2 children have the lowest poverty rate of 0.0%, which includes 0 families.
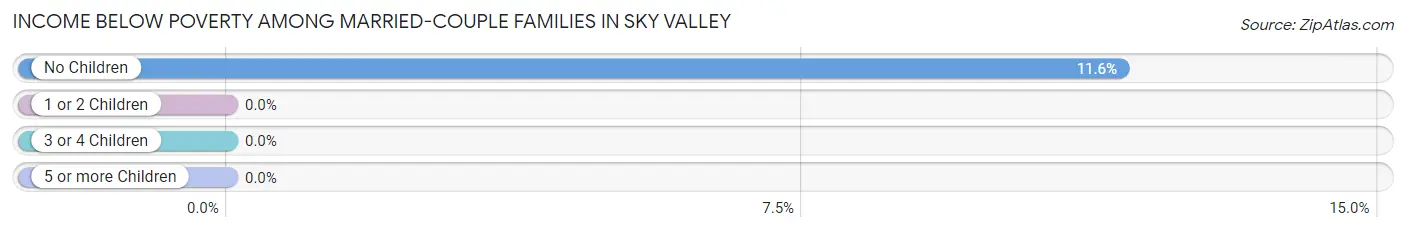
| Children | Above Poverty | Below Poverty |
| No Children | 114 (88.4%) | 15 (11.6%) |
| 1 or 2 Children | 6 (100.0%) | 0 (0.0%) |
| 3 or 4 Children | 3 (100.0%) | 0 (0.0%) |
| 5 or more Children | 0 (0.0%) | 0 (0.0%) |
| Total | 123 (89.1%) | 15 (10.9%) |
Income Below Poverty Among Single-Parent Households in Sky Valley
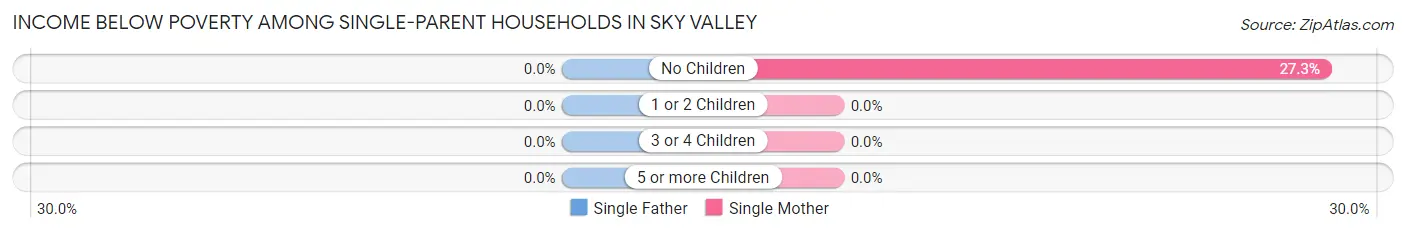
| Children | Single Father | Single Mother |
| No Children | 0 (0.0%) | 3 (27.3%) |
| 1 or 2 Children | 0 (0.0%) | 0 (0.0%) |
| 3 or 4 Children | 0 (0.0%) | 0 (0.0%) |
| 5 or more Children | 0 (0.0%) | 0 (0.0%) |
| Total | 0 (0.0%) | 3 (23.1%) |
Income Below Poverty Among Married-Couple vs Single-Parent Households in Sky Valley
The poverty data for Sky Valley shows that 15 of the married-couple family households (10.9%) and 3 of the single-parent households (13.6%) are living below the poverty level. Within the married-couple family households, those with no children have the highest poverty rate, with 15 households (11.6%) falling below the poverty line. Among the single-parent households, those with no children have the highest poverty rate, with 3 household (16.7%) living below poverty.
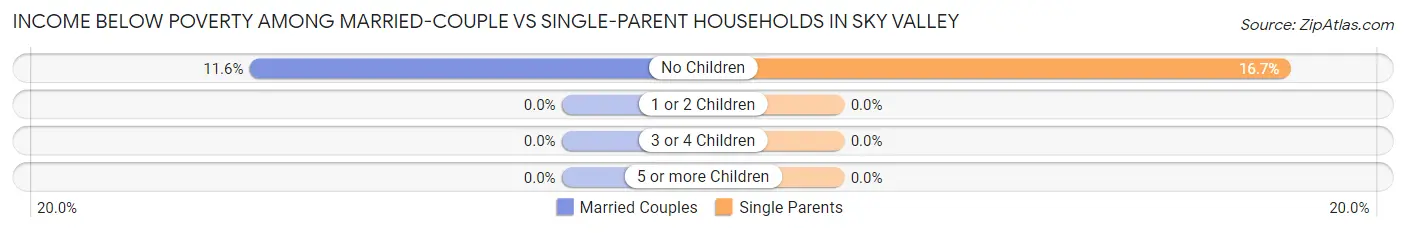
| Children | Married-Couple Families | Single-Parent Households |
| No Children | 15 (11.6%) | 3 (16.7%) |
| 1 or 2 Children | 0 (0.0%) | 0 (0.0%) |
| 3 or 4 Children | 0 (0.0%) | 0 (0.0%) |
| 5 or more Children | 0 (0.0%) | 0 (0.0%) |
| Total | 15 (10.9%) | 3 (13.6%) |
Employment Characteristics in Sky Valley
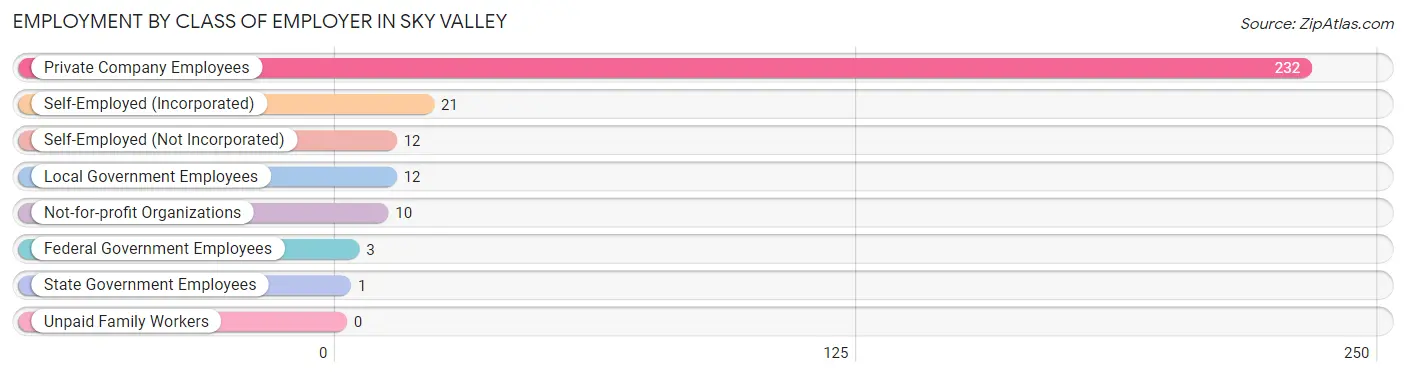
Employment by Class of Employer in Sky Valley
Among the 291 employed individuals in Sky Valley, private company employees (232 | 79.7%), self-employed (incorporated) (21 | 7.2%), and self-employed (not incorporated) (12 | 4.1%) make up the most common classes of employment.
| Employer Class | # Employees | % Employees |
| Private Company Employees | 232 | 79.7% |
| Self-Employed (Incorporated) | 21 | 7.2% |
| Self-Employed (Not Incorporated) | 12 | 4.1% |
| Not-for-profit Organizations | 10 | 3.4% |
| Local Government Employees | 12 | 4.1% |
| State Government Employees | 1 | 0.3% |
| Federal Government Employees | 3 | 1.0% |
| Unpaid Family Workers | 0 | 0.0% |
| Total | 291 | 100.0% |
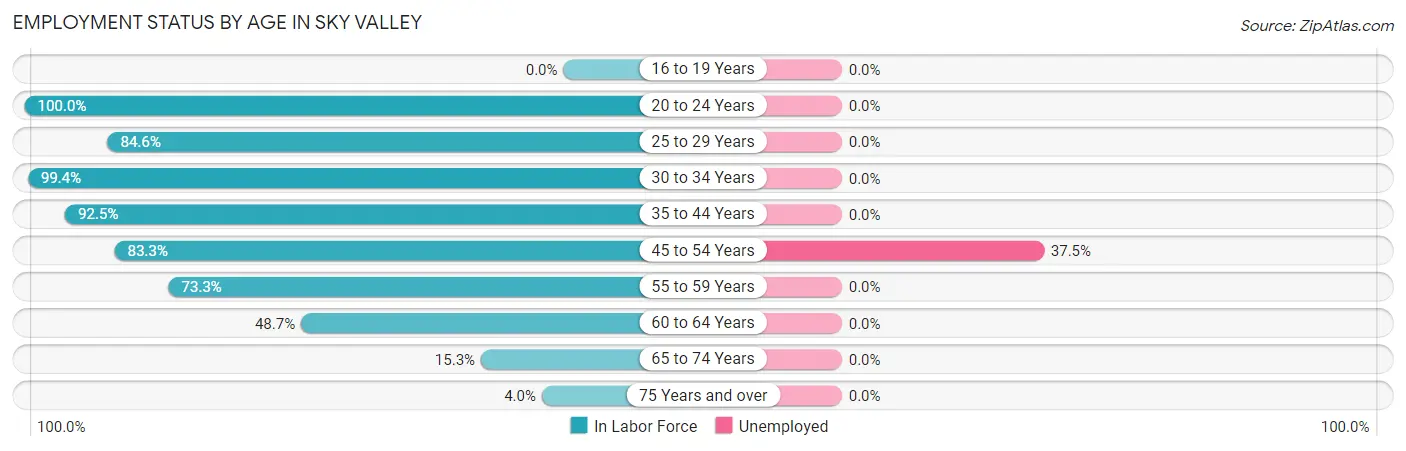
Employment Status by Age in Sky Valley
According to the labor force statistics for Sky Valley, out of the total population over 16 years of age (577), 53.4% or 308 individuals are in the labor force, with 4.9% or 15 of them unemployed. The age group with the highest labor force participation rate is 20 to 24 years, with 100.0% or 6 individuals in the labor force. Within the labor force, the 45 to 54 years age range has the highest percentage of unemployed individuals, with 37.5% or 15 of them being unemployed.
| Age Bracket | In Labor Force | Unemployed |
| 16 to 19 Years | 0 (0.0%) | 0 (0.0%) |
| 20 to 24 Years | 6 (100.0%) | 0 (0.0%) |
| 25 to 29 Years | 11 (84.6%) | 0 (0.0%) |
| 30 to 34 Years | 156 (99.4%) | 0 (0.0%) |
| 35 to 44 Years | 37 (92.5%) | 0 (0.0%) |
| 45 to 54 Years | 40 (83.3%) | 15 (37.5%) |
| 55 to 59 Years | 11 (73.3%) | 0 (0.0%) |
| 60 to 64 Years | 19 (48.7%) | 0 (0.0%) |
| 65 to 74 Years | 24 (15.3%) | 0 (0.0%) |
| 75 Years and over | 4 (4.0%) | 0 (0.0%) |
| Total | 308 (53.4%) | 15 (4.9%) |
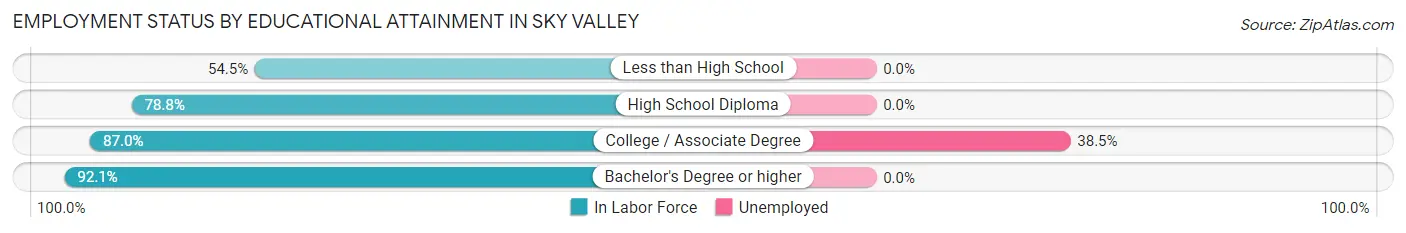
Employment Status by Educational Attainment in Sky Valley
According to labor force statistics for Sky Valley, 87.8% of individuals (274) out of the total population between 25 and 64 years of age (312) are in the labor force, with 5.5% or 15 of them being unemployed. The group with the highest labor force participation rate are those with the educational attainment of bachelor's degree or higher, with 92.1% or 187 individuals in the labor force. Within the labor force, individuals with college / associate degree education have the highest percentage of unemployment, with 38.5% or 15 of them being unemployed.
| Educational Attainment | In Labor Force | Unemployed |
| Less than High School | 6 (54.5%) | 0 (0.0%) |
| High School Diploma | 41 (78.8%) | 0 (0.0%) |
| College / Associate Degree | 40 (87.0%) | 18 (38.5%) |
| Bachelor's Degree or higher | 187 (92.1%) | 0 (0.0%) |
| Total | 274 (87.8%) | 17 (5.5%) |
Employment Occupations by Sex in Sky Valley
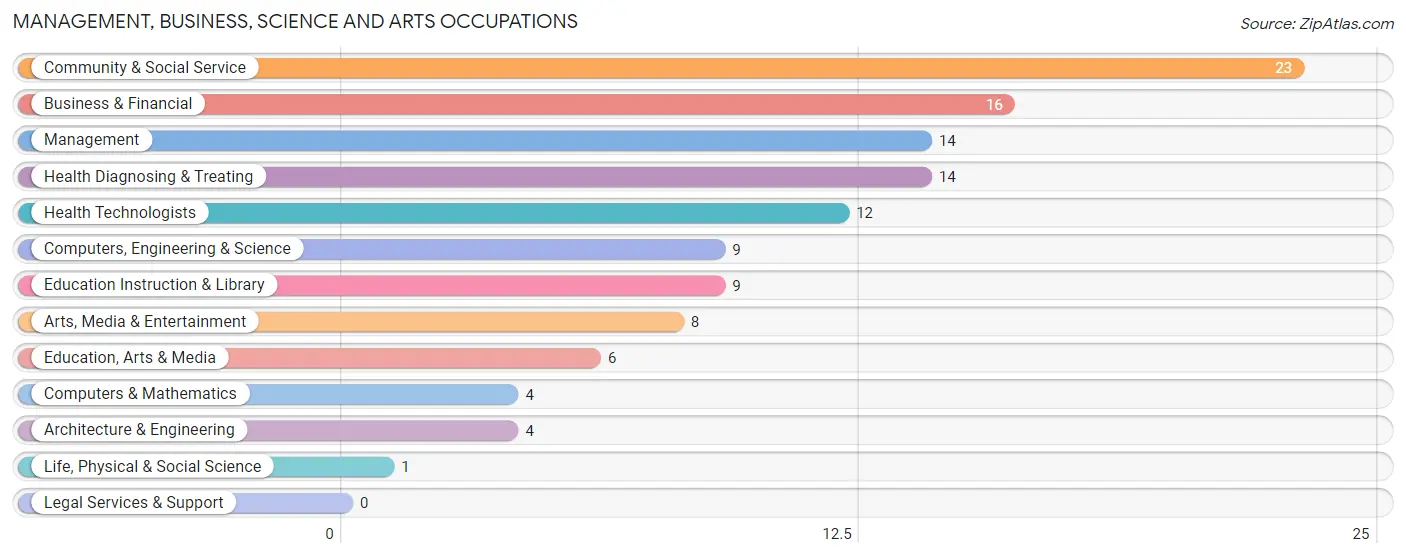
Management, Business, Science and Arts Occupations
The most common Management, Business, Science and Arts occupations in Sky Valley are Community & Social Service (23 | 7.9%), Business & Financial (16 | 5.5%), Management (14 | 4.8%), Health Diagnosing & Treating (14 | 4.8%), and Health Technologists (12 | 4.1%).
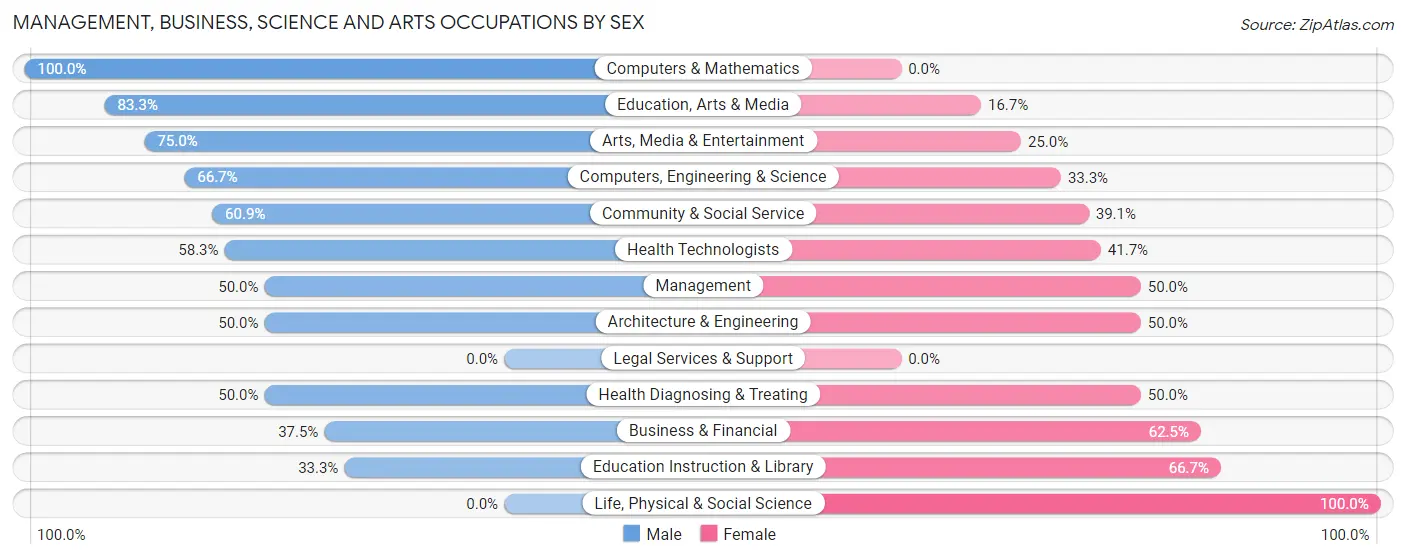
Management, Business, Science and Arts Occupations by Sex
Within the Management, Business, Science and Arts occupations in Sky Valley, the most male-oriented occupations are Computers & Mathematics (100.0%), Education, Arts & Media (83.3%), and Arts, Media & Entertainment (75.0%), while the most female-oriented occupations are Life, Physical & Social Science (100.0%), Education Instruction & Library (66.7%), and Business & Financial (62.5%).
| Occupation | Male | Female |
| Management | 7 (50.0%) | 7 (50.0%) |
| Business & Financial | 6 (37.5%) | 10 (62.5%) |
| Computers, Engineering & Science | 6 (66.7%) | 3 (33.3%) |
| Computers & Mathematics | 4 (100.0%) | 0 (0.0%) |
| Architecture & Engineering | 2 (50.0%) | 2 (50.0%) |
| Life, Physical & Social Science | 0 (0.0%) | 1 (100.0%) |
| Community & Social Service | 14 (60.9%) | 9 (39.1%) |
| Education, Arts & Media | 5 (83.3%) | 1 (16.7%) |
| Legal Services & Support | 0 (0.0%) | 0 (0.0%) |
| Education Instruction & Library | 3 (33.3%) | 6 (66.7%) |
| Arts, Media & Entertainment | 6 (75.0%) | 2 (25.0%) |
| Health Diagnosing & Treating | 7 (50.0%) | 7 (50.0%) |
| Health Technologists | 7 (58.3%) | 5 (41.7%) |
| Total (Category) | 40 (52.6%) | 36 (47.4%) |
| Total (Overall) | 57 (19.5%) | 235 (80.5%) |
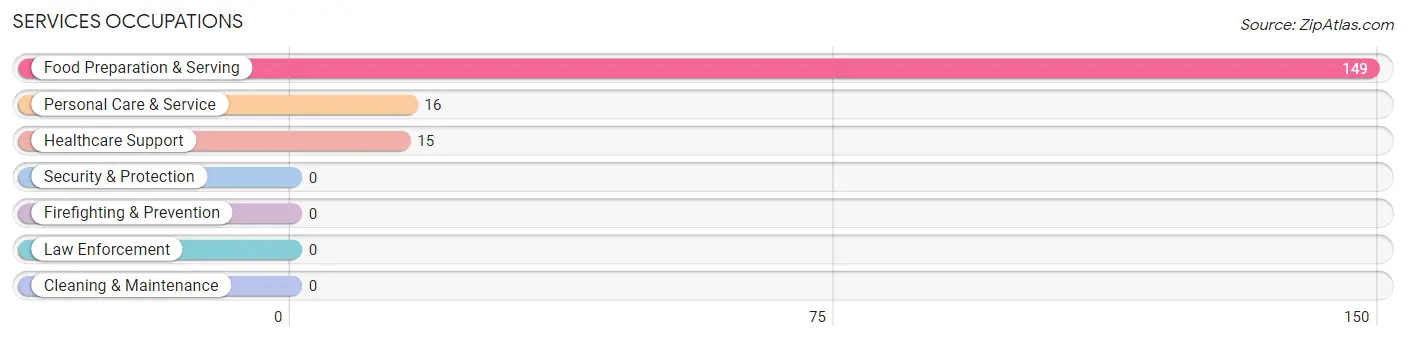
Services Occupations
The most common Services occupations in Sky Valley are Food Preparation & Serving (149 | 51.0%), Personal Care & Service (16 | 5.5%), and Healthcare Support (15 | 5.1%).
Services Occupations by Sex
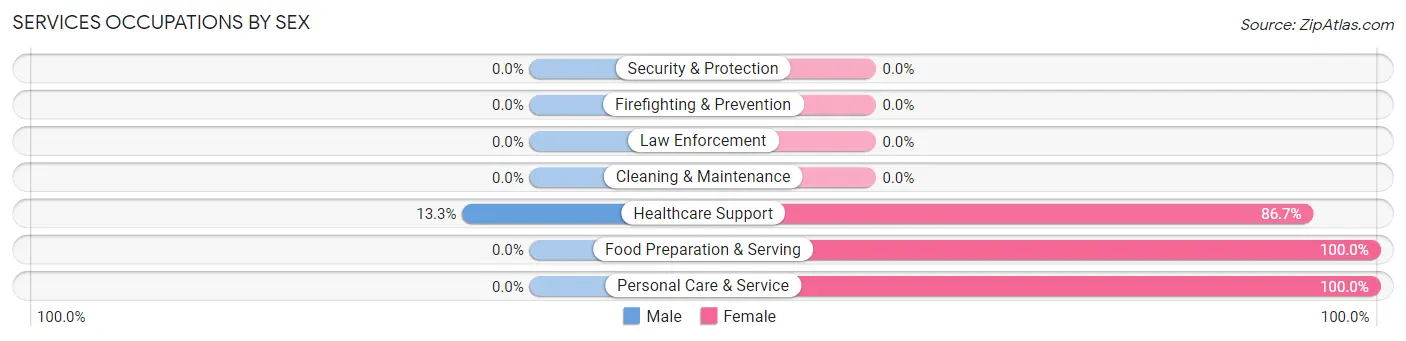
| Occupation | Male | Female |
| Healthcare Support | 2 (13.3%) | 13 (86.7%) |
| Security & Protection | 0 (0.0%) | 0 (0.0%) |
| Firefighting & Prevention | 0 (0.0%) | 0 (0.0%) |
| Law Enforcement | 0 (0.0%) | 0 (0.0%) |
| Food Preparation & Serving | 0 (0.0%) | 149 (100.0%) |
| Cleaning & Maintenance | 0 (0.0%) | 0 (0.0%) |
| Personal Care & Service | 0 (0.0%) | 16 (100.0%) |
| Total (Category) | 2 (1.1%) | 178 (98.9%) |
| Total (Overall) | 57 (19.5%) | 235 (80.5%) |
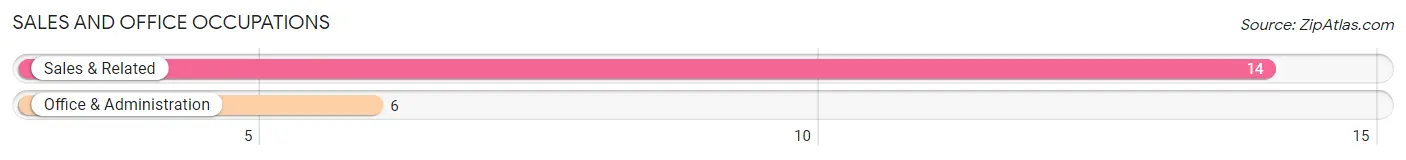
Sales and Office Occupations
The most common Sales and Office occupations in Sky Valley are Sales & Related (14 | 4.8%), and Office & Administration (6 | 2.1%).
Sales and Office Occupations by Sex
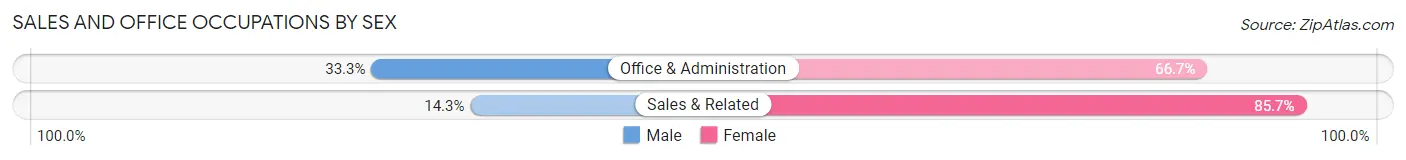
| Occupation | Male | Female |
| Sales & Related | 2 (14.3%) | 12 (85.7%) |
| Office & Administration | 2 (33.3%) | 4 (66.7%) |
| Total (Category) | 4 (20.0%) | 16 (80.0%) |
| Total (Overall) | 57 (19.5%) | 235 (80.5%) |
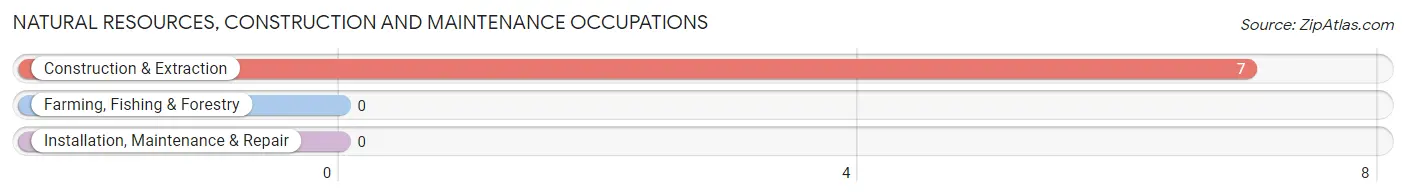
Natural Resources, Construction and Maintenance Occupations
The most common Natural Resources, Construction and Maintenance occupations in Sky Valley are , and Construction & Extraction (7 | 2.4%).
Natural Resources, Construction and Maintenance Occupations by Sex
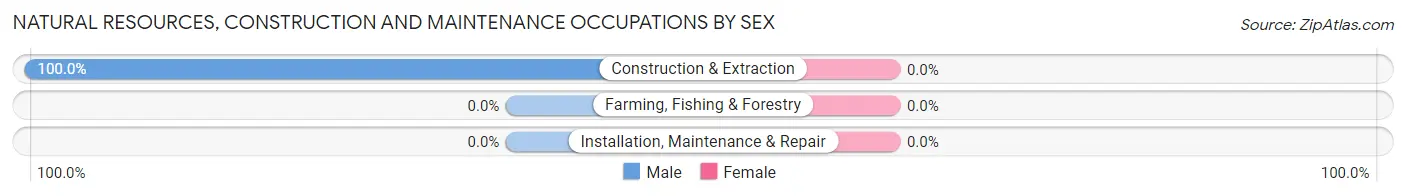
| Occupation | Male | Female |
| Farming, Fishing & Forestry | 0 (0.0%) | 0 (0.0%) |
| Construction & Extraction | 7 (100.0%) | 0 (0.0%) |
| Installation, Maintenance & Repair | 0 (0.0%) | 0 (0.0%) |
| Total (Category) | 7 (100.0%) | 0 (0.0%) |
| Total (Overall) | 57 (19.5%) | 235 (80.5%) |
Production, Transportation and Moving Occupations
The most common Production, Transportation and Moving occupations in Sky Valley are Production (8 | 2.7%), and Transportation (1 | 0.3%).
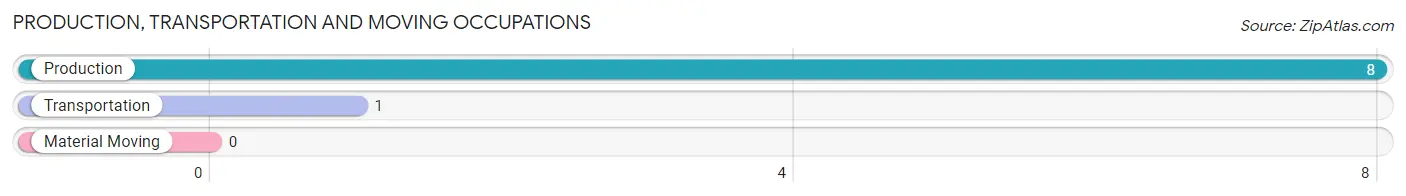
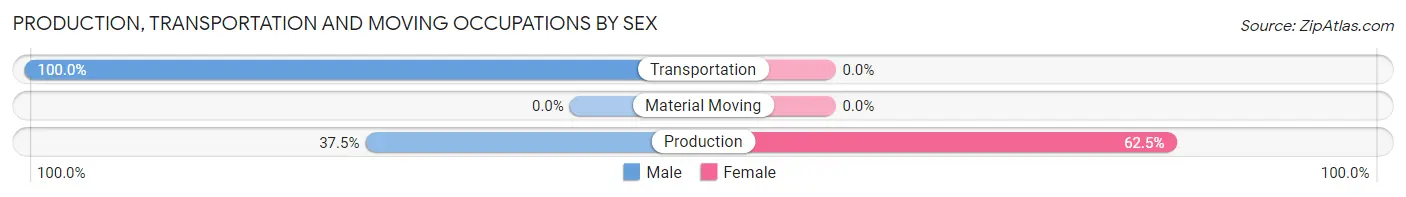
Production, Transportation and Moving Occupations by Sex
| Occupation | Male | Female |
| Production | 3 (37.5%) | 5 (62.5%) |
| Transportation | 1 (100.0%) | 0 (0.0%) |
| Material Moving | 0 (0.0%) | 0 (0.0%) |
| Total (Category) | 4 (44.4%) | 5 (55.6%) |
| Total (Overall) | 57 (19.5%) | 235 (80.5%) |
Employment Industries by Sex in Sky Valley
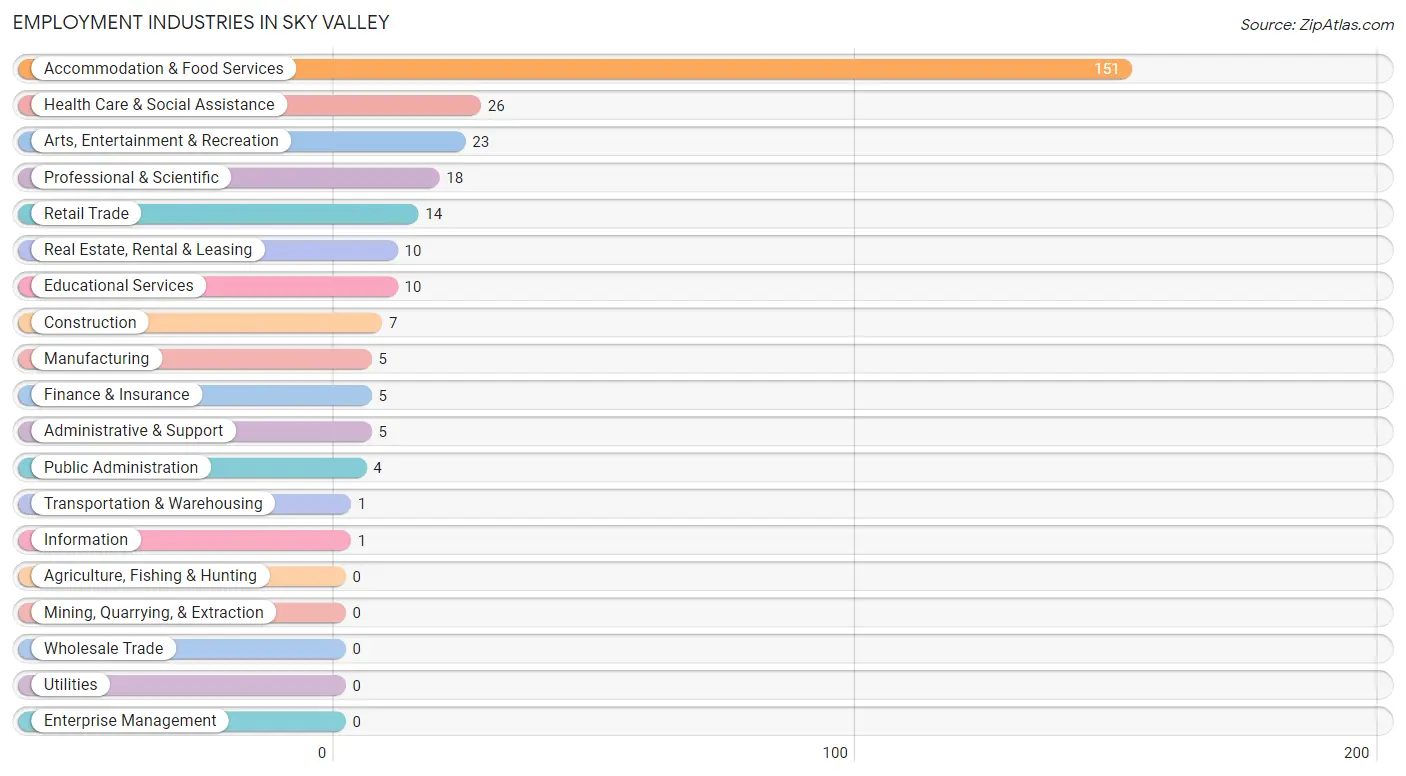
Employment Industries in Sky Valley
The major employment industries in Sky Valley include Accommodation & Food Services (151 | 51.7%), Health Care & Social Assistance (26 | 8.9%), Arts, Entertainment & Recreation (23 | 7.9%), Professional & Scientific (18 | 6.2%), and Retail Trade (14 | 4.8%).
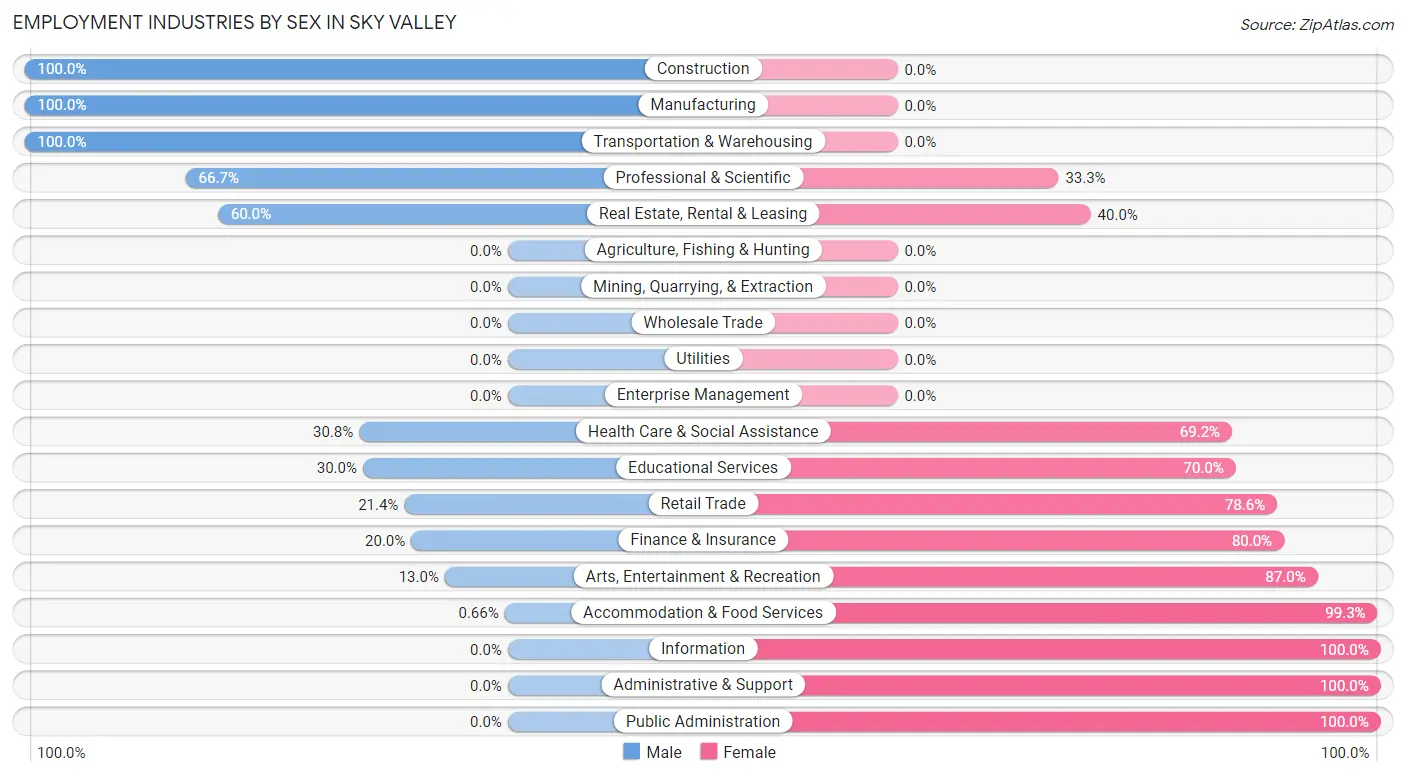
Employment Industries by Sex in Sky Valley
The Sky Valley industries that see more men than women are Construction (100.0%), Manufacturing (100.0%), and Transportation & Warehousing (100.0%), whereas the industries that tend to have a higher number of women are Information (100.0%), Administrative & Support (100.0%), and Public Administration (100.0%).
| Industry | Male | Female |
| Agriculture, Fishing & Hunting | 0 (0.0%) | 0 (0.0%) |
| Mining, Quarrying, & Extraction | 0 (0.0%) | 0 (0.0%) |
| Construction | 7 (100.0%) | 0 (0.0%) |
| Manufacturing | 5 (100.0%) | 0 (0.0%) |
| Wholesale Trade | 0 (0.0%) | 0 (0.0%) |
| Retail Trade | 3 (21.4%) | 11 (78.6%) |
| Transportation & Warehousing | 1 (100.0%) | 0 (0.0%) |
| Utilities | 0 (0.0%) | 0 (0.0%) |
| Information | 0 (0.0%) | 1 (100.0%) |
| Finance & Insurance | 1 (20.0%) | 4 (80.0%) |
| Real Estate, Rental & Leasing | 6 (60.0%) | 4 (40.0%) |
| Professional & Scientific | 12 (66.7%) | 6 (33.3%) |
| Enterprise Management | 0 (0.0%) | 0 (0.0%) |
| Administrative & Support | 0 (0.0%) | 5 (100.0%) |
| Educational Services | 3 (30.0%) | 7 (70.0%) |
| Health Care & Social Assistance | 8 (30.8%) | 18 (69.2%) |
| Arts, Entertainment & Recreation | 3 (13.0%) | 20 (87.0%) |
| Accommodation & Food Services | 1 (0.7%) | 150 (99.3%) |
| Public Administration | 0 (0.0%) | 4 (100.0%) |
| Total | 57 (19.5%) | 235 (80.5%) |
Education in Sky Valley
School Enrollment in Sky Valley
The most common levels of schooling among the 21 students in Sky Valley are middle school (9 | 42.9%), elementary school (7 | 33.3%), and high school (4 | 19.1%).
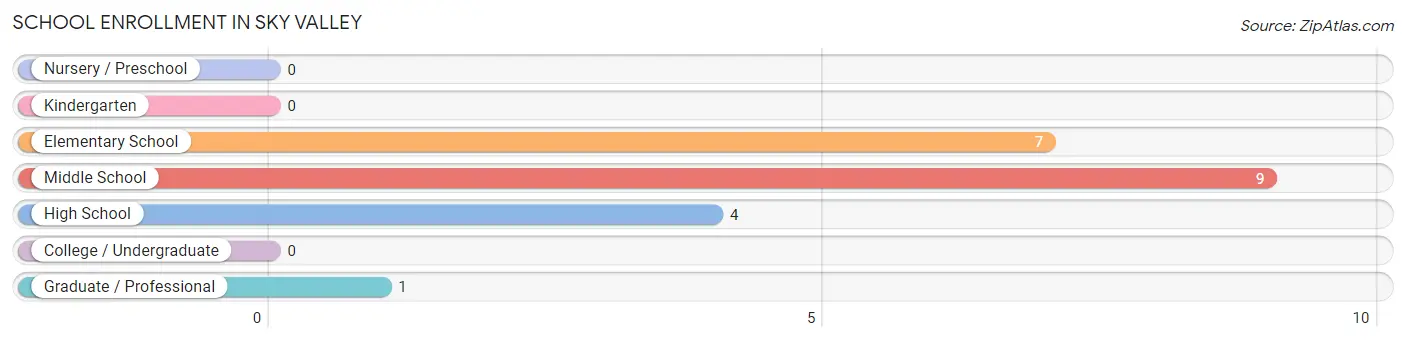
| School Level | # Students | % Students |
| Nursery / Preschool | 0 | 0.0% |
| Kindergarten | 0 | 0.0% |
| Elementary School | 7 | 33.3% |
| Middle School | 9 | 42.9% |
| High School | 4 | 19.1% |
| College / Undergraduate | 0 | 0.0% |
| Graduate / Professional | 1 | 4.8% |
| Total | 21 | 100.0% |
School Enrollment by Age by Funding Source in Sky Valley
Out of a total of 21 students who are enrolled in schools in Sky Valley, 8 (38.1%) attend a private institution, while the remaining 13 (61.9%) are enrolled in public schools. The age group of 15 to 17 year olds has the highest likelihood of being enrolled in private schools, with 3 (75.0% in the age bracket) enrolled. Conversely, the age group of 35 years and over has the lowest likelihood of being enrolled in a private school, with 1 (100.0% in the age bracket) attending a public institution.
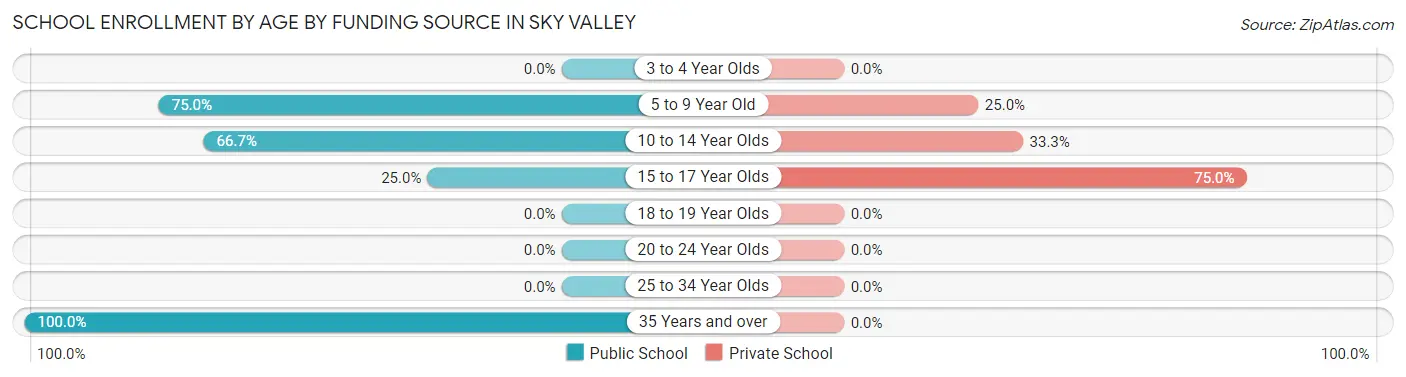
| Age Bracket | Public School | Private School |
| 3 to 4 Year Olds | 0 (0.0%) | 0 (0.0%) |
| 5 to 9 Year Old | 3 (75.0%) | 1 (25.0%) |
| 10 to 14 Year Olds | 8 (66.7%) | 4 (33.3%) |
| 15 to 17 Year Olds | 1 (25.0%) | 3 (75.0%) |
| 18 to 19 Year Olds | 0 (0.0%) | 0 (0.0%) |
| 20 to 24 Year Olds | 0 (0.0%) | 0 (0.0%) |
| 25 to 34 Year Olds | 0 (0.0%) | 0 (0.0%) |
| 35 Years and over | 1 (100.0%) | 0 (0.0%) |
| Total | 13 (61.9%) | 8 (38.1%) |
Educational Attainment by Field of Study in Sky Valley
Bio, nature & agricultural (156 | 41.6%), business (41 | 10.9%), education (38 | 10.1%), science & technology (25 | 6.7%), and social sciences (20 | 5.3%) are the most common fields of study among 375 individuals in Sky Valley who have obtained a bachelor's degree or higher.
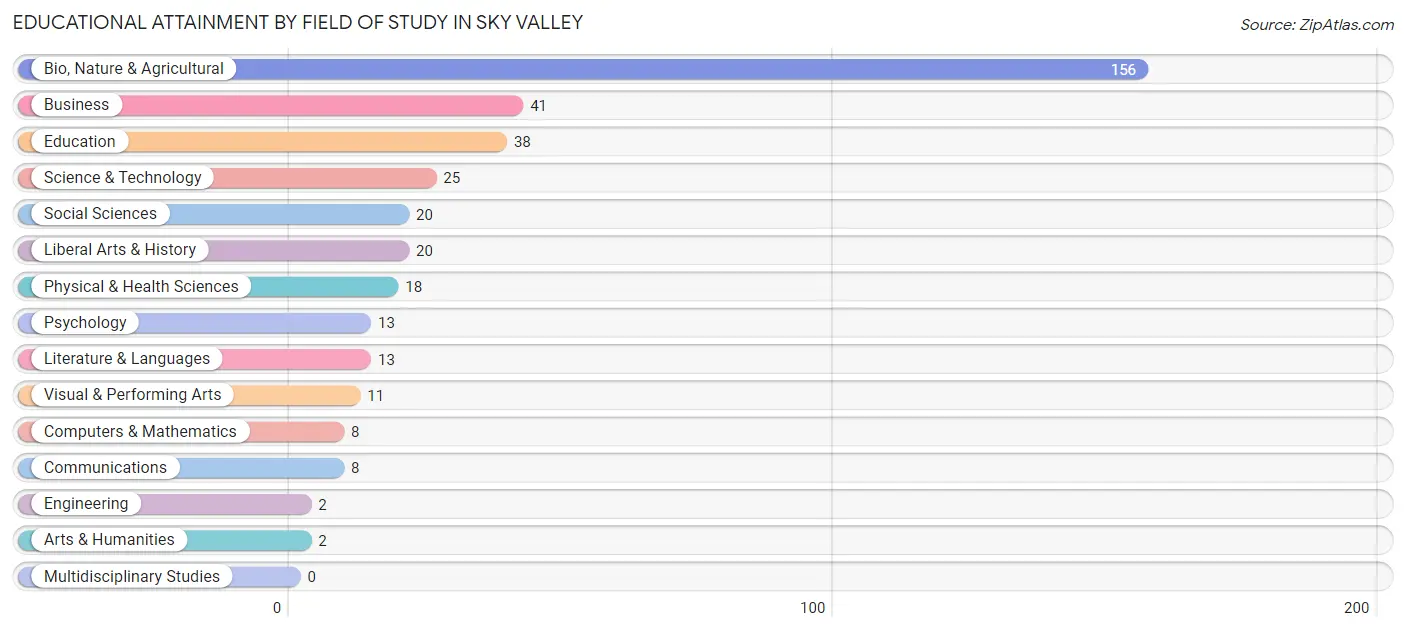
| Field of Study | # Graduates | % Graduates |
| Computers & Mathematics | 8 | 2.1% |
| Bio, Nature & Agricultural | 156 | 41.6% |
| Physical & Health Sciences | 18 | 4.8% |
| Psychology | 13 | 3.5% |
| Social Sciences | 20 | 5.3% |
| Engineering | 2 | 0.5% |
| Multidisciplinary Studies | 0 | 0.0% |
| Science & Technology | 25 | 6.7% |
| Business | 41 | 10.9% |
| Education | 38 | 10.1% |
| Literature & Languages | 13 | 3.5% |
| Liberal Arts & History | 20 | 5.3% |
| Visual & Performing Arts | 11 | 2.9% |
| Communications | 8 | 2.1% |
| Arts & Humanities | 2 | 0.5% |
| Total | 375 | 100.0% |
Transportation & Commute in Sky Valley
Vehicle Availability by Sex in Sky Valley
The most prevalent vehicle ownership categories in Sky Valley are males with 2 vehicles (30, accounting for 53.6%) and females with 2 vehicles (45, making up 12.8%).
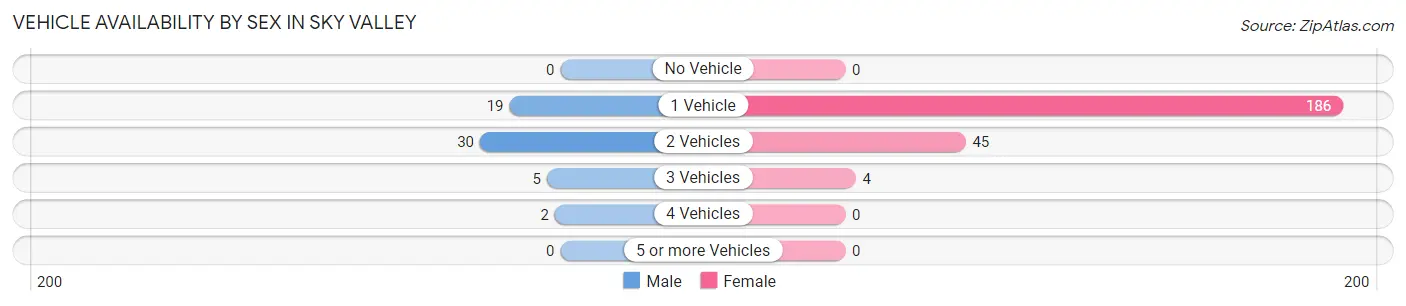
| Vehicles Available | Male | Female |
| No Vehicle | 0 (0.0%) | 0 (0.0%) |
| 1 Vehicle | 19 (33.9%) | 186 (79.1%) |
| 2 Vehicles | 30 (53.6%) | 45 (19.2%) |
| 3 Vehicles | 5 (8.9%) | 4 (1.7%) |
| 4 Vehicles | 2 (3.6%) | 0 (0.0%) |
| 5 or more Vehicles | 0 (0.0%) | 0 (0.0%) |
| Total | 56 (100.0%) | 235 (100.0%) |
Commute Time in Sky Valley
The most frequently occuring commute durations in Sky Valley are 20 to 24 minutes (155 commuters, 64.8%), 25 to 29 minutes (26 commuters, 10.9%), and 10 to 14 minutes (19 commuters, 8.0%).
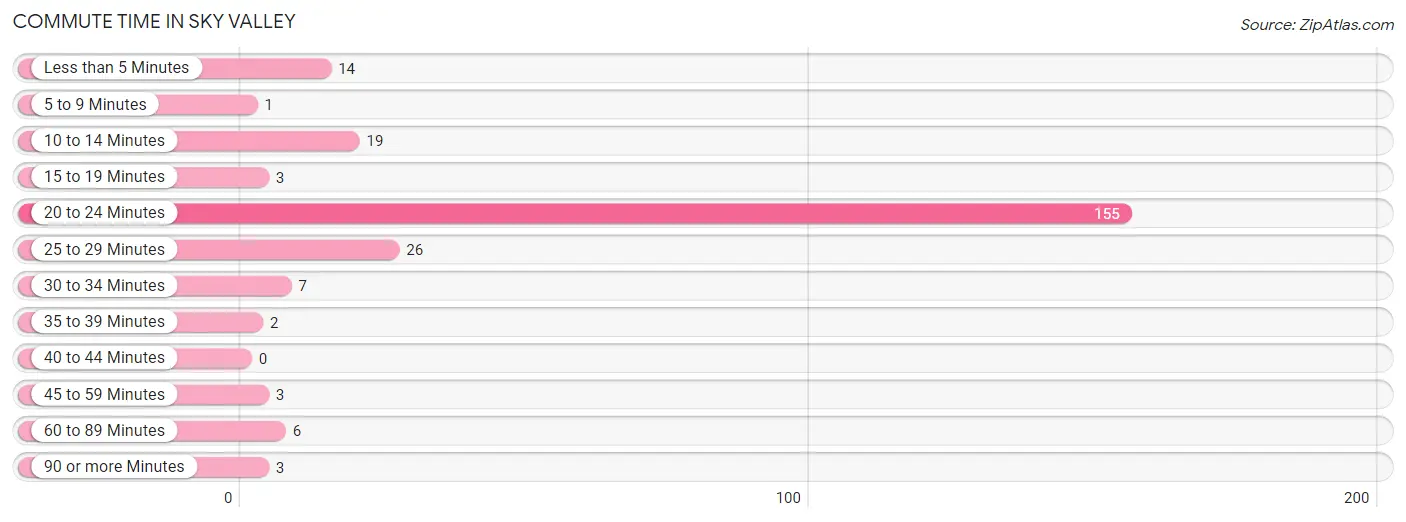
| Commute Time | # Commuters | % Commuters |
| Less than 5 Minutes | 14 | 5.9% |
| 5 to 9 Minutes | 1 | 0.4% |
| 10 to 14 Minutes | 19 | 8.0% |
| 15 to 19 Minutes | 3 | 1.3% |
| 20 to 24 Minutes | 155 | 64.8% |
| 25 to 29 Minutes | 26 | 10.9% |
| 30 to 34 Minutes | 7 | 2.9% |
| 35 to 39 Minutes | 2 | 0.8% |
| 40 to 44 Minutes | 0 | 0.0% |
| 45 to 59 Minutes | 3 | 1.3% |
| 60 to 89 Minutes | 6 | 2.5% |
| 90 or more Minutes | 3 | 1.3% |
Commute Time by Sex in Sky Valley
The most common commute times in Sky Valley are less than 5 minutes (8 commuters, 25.0%) for males and 20 to 24 minutes (154 commuters, 74.4%) for females.
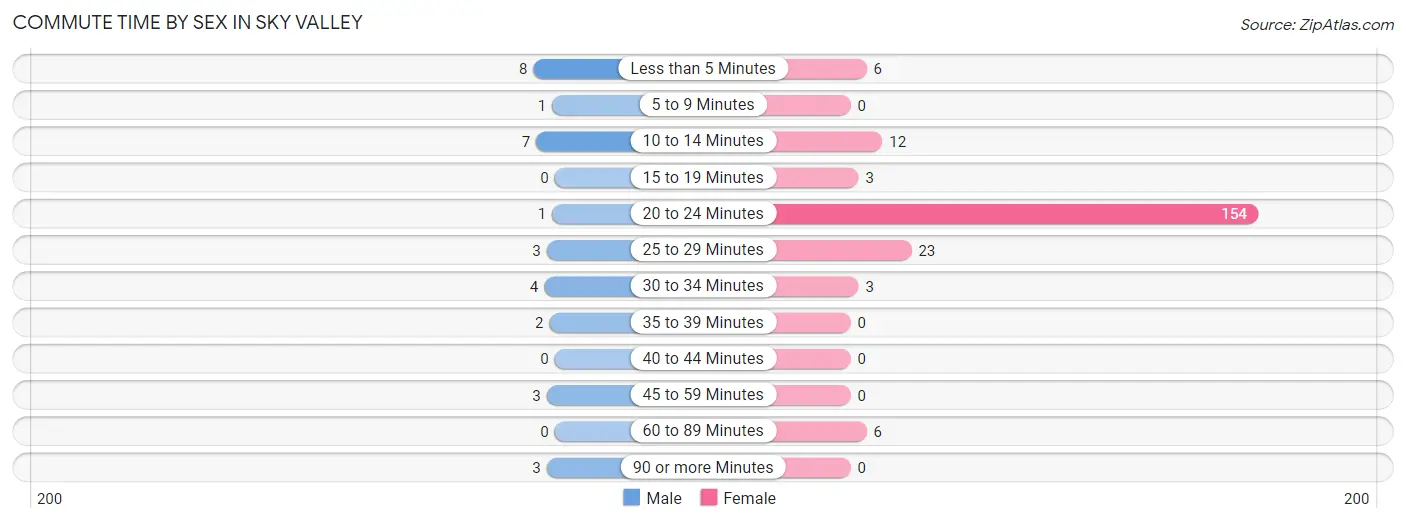
| Commute Time | Male | Female |
| Less than 5 Minutes | 8 (25.0%) | 6 (2.9%) |
| 5 to 9 Minutes | 1 (3.1%) | 0 (0.0%) |
| 10 to 14 Minutes | 7 (21.9%) | 12 (5.8%) |
| 15 to 19 Minutes | 0 (0.0%) | 3 (1.5%) |
| 20 to 24 Minutes | 1 (3.1%) | 154 (74.4%) |
| 25 to 29 Minutes | 3 (9.4%) | 23 (11.1%) |
| 30 to 34 Minutes | 4 (12.5%) | 3 (1.5%) |
| 35 to 39 Minutes | 2 (6.2%) | 0 (0.0%) |
| 40 to 44 Minutes | 0 (0.0%) | 0 (0.0%) |
| 45 to 59 Minutes | 3 (9.4%) | 0 (0.0%) |
| 60 to 89 Minutes | 0 (0.0%) | 6 (2.9%) |
| 90 or more Minutes | 3 (9.4%) | 0 (0.0%) |
Time of Departure to Work by Sex in Sky Valley
The most frequent times of departure to work in Sky Valley are 5:30 AM to 5:59 AM (7, 21.9%) for males and 12:00 PM to 3:59 PM (153, 73.9%) for females.
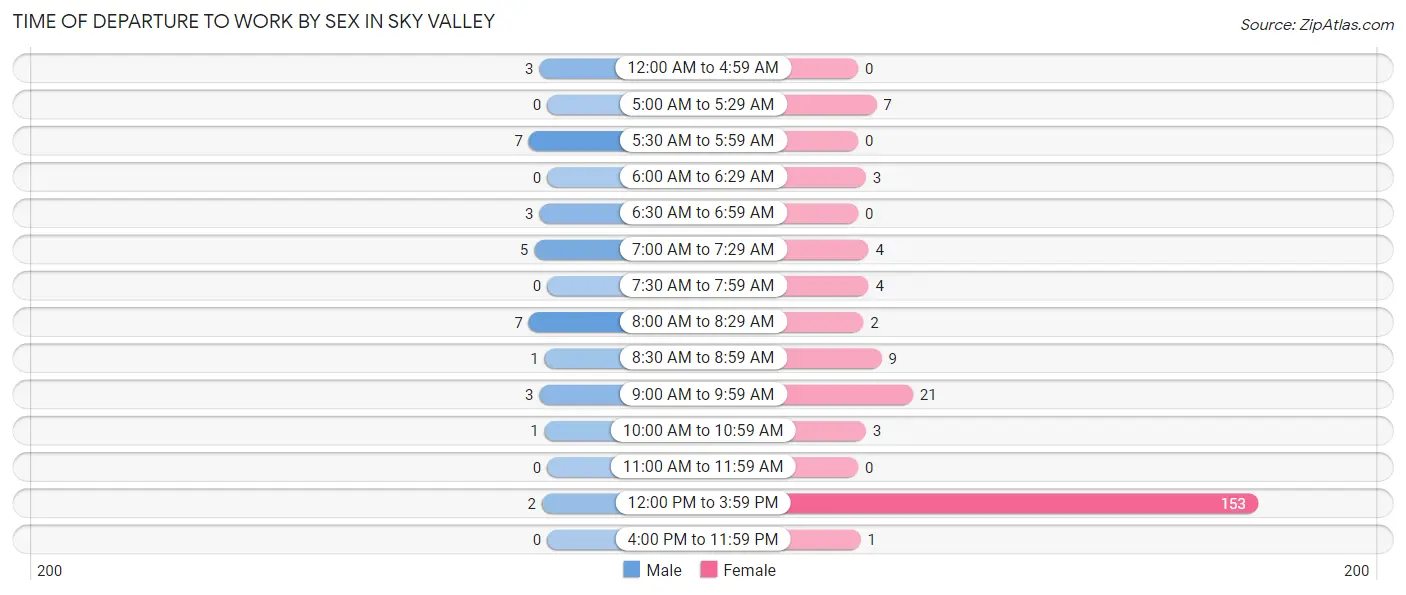
| Time of Departure | Male | Female |
| 12:00 AM to 4:59 AM | 3 (9.4%) | 0 (0.0%) |
| 5:00 AM to 5:29 AM | 0 (0.0%) | 7 (3.4%) |
| 5:30 AM to 5:59 AM | 7 (21.9%) | 0 (0.0%) |
| 6:00 AM to 6:29 AM | 0 (0.0%) | 3 (1.5%) |
| 6:30 AM to 6:59 AM | 3 (9.4%) | 0 (0.0%) |
| 7:00 AM to 7:29 AM | 5 (15.6%) | 4 (1.9%) |
| 7:30 AM to 7:59 AM | 0 (0.0%) | 4 (1.9%) |
| 8:00 AM to 8:29 AM | 7 (21.9%) | 2 (1.0%) |
| 8:30 AM to 8:59 AM | 1 (3.1%) | 9 (4.3%) |
| 9:00 AM to 9:59 AM | 3 (9.4%) | 21 (10.1%) |
| 10:00 AM to 10:59 AM | 1 (3.1%) | 3 (1.5%) |
| 11:00 AM to 11:59 AM | 0 (0.0%) | 0 (0.0%) |
| 12:00 PM to 3:59 PM | 2 (6.2%) | 153 (73.9%) |
| 4:00 PM to 11:59 PM | 0 (0.0%) | 1 (0.5%) |
| Total | 32 (100.0%) | 207 (100.0%) |
Housing Occupancy in Sky Valley
Occupancy by Ownership in Sky Valley
Of the total 363 dwellings in Sky Valley, owner-occupied units account for 203 (55.9%), while renter-occupied units make up 160 (44.1%).
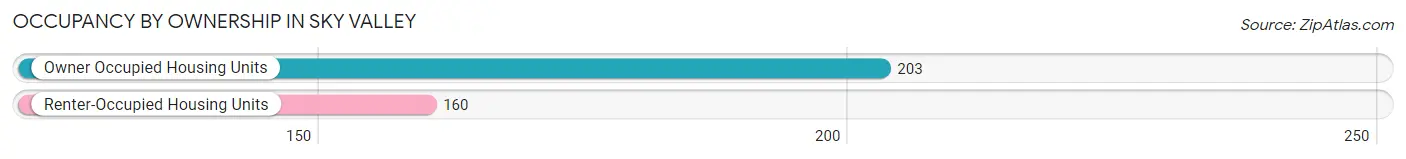
| Occupancy | # Housing Units | % Housing Units |
| Owner Occupied Housing Units | 203 | 55.9% |
| Renter-Occupied Housing Units | 160 | 44.1% |
| Total Occupied Housing Units | 363 | 100.0% |
Occupancy by Household Size in Sky Valley
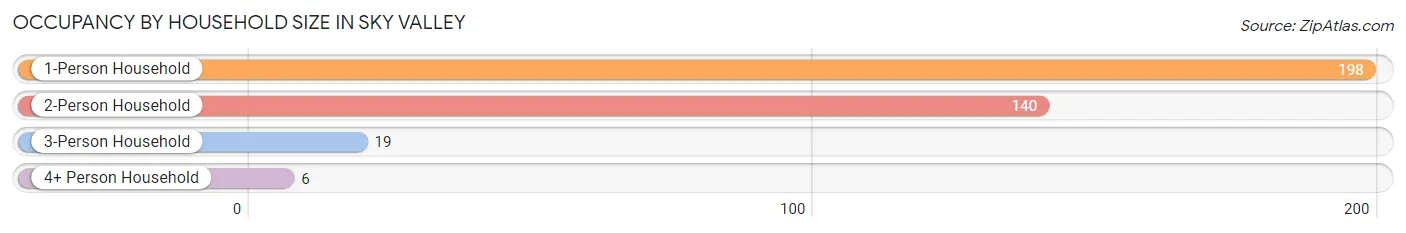
| Household Size | # Housing Units | % Housing Units |
| 1-Person Household | 198 | 54.5% |
| 2-Person Household | 140 | 38.6% |
| 3-Person Household | 19 | 5.2% |
| 4+ Person Household | 6 | 1.7% |
| Total Housing Units | 363 | 100.0% |
Occupancy by Ownership by Household Size in Sky Valley
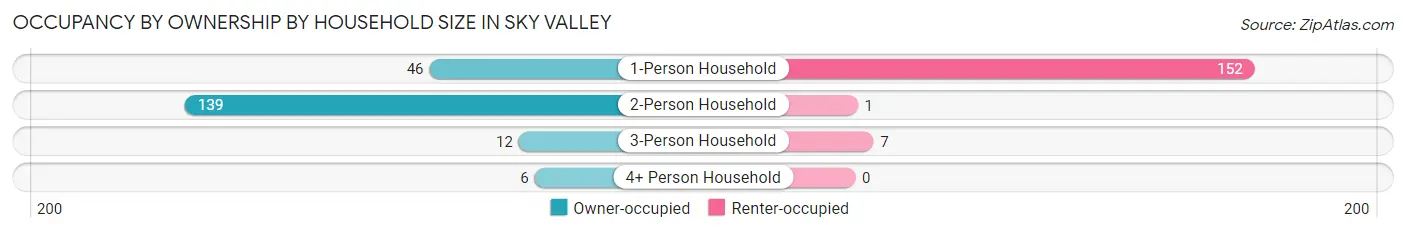
| Household Size | Owner-occupied | Renter-occupied |
| 1-Person Household | 46 (23.2%) | 152 (76.8%) |
| 2-Person Household | 139 (99.3%) | 1 (0.7%) |
| 3-Person Household | 12 (63.2%) | 7 (36.8%) |
| 4+ Person Household | 6 (100.0%) | 0 (0.0%) |
| Total Housing Units | 203 (55.9%) | 160 (44.1%) |
Occupancy by Educational Attainment in Sky Valley
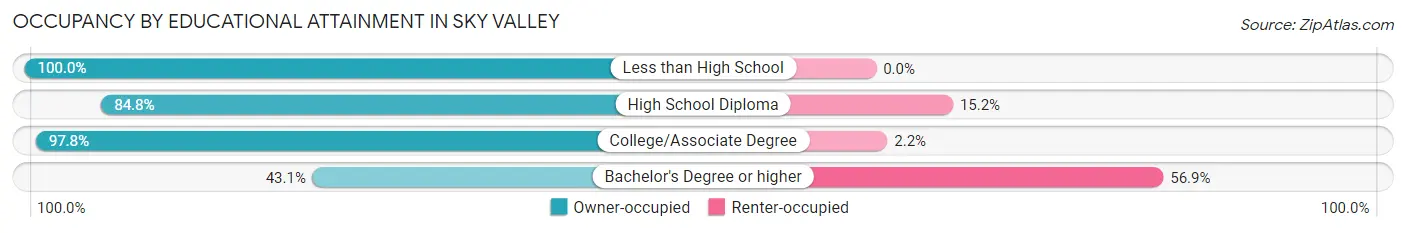
| Household Size | Owner-occupied | Renter-occupied |
| Less than High School | 5 (100.0%) | 0 (0.0%) |
| High School Diploma | 39 (84.8%) | 7 (15.2%) |
| College/Associate Degree | 44 (97.8%) | 1 (2.2%) |
| Bachelor's Degree or higher | 115 (43.1%) | 152 (56.9%) |
Occupancy by Age of Householder in Sky Valley
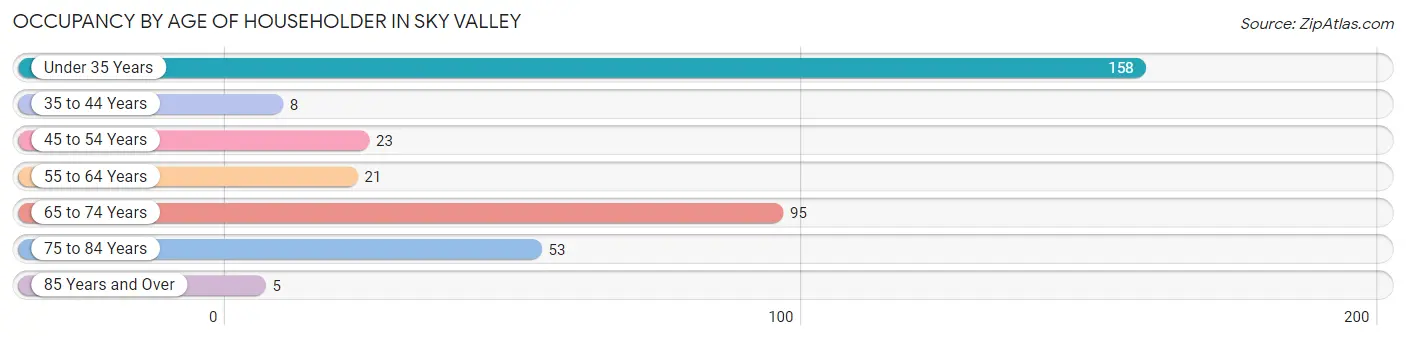
| Age Bracket | # Households | % Households |
| Under 35 Years | 158 | 43.5% |
| 35 to 44 Years | 8 | 2.2% |
| 45 to 54 Years | 23 | 6.3% |
| 55 to 64 Years | 21 | 5.8% |
| 65 to 74 Years | 95 | 26.2% |
| 75 to 84 Years | 53 | 14.6% |
| 85 Years and Over | 5 | 1.4% |
| Total | 363 | 100.0% |
Housing Finances in Sky Valley
Median Income by Occupancy in Sky Valley
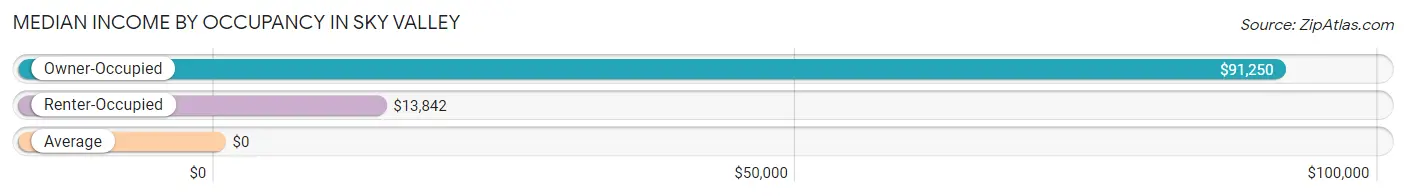
| Occupancy Type | # Households | Median Income |
| Owner-Occupied | 203 (55.9%) | $91,250 |
| Renter-Occupied | 160 (44.1%) | $13,842 |
| Average | 363 (100.0%) | $0 |
Occupancy by Householder Income Bracket in Sky Valley
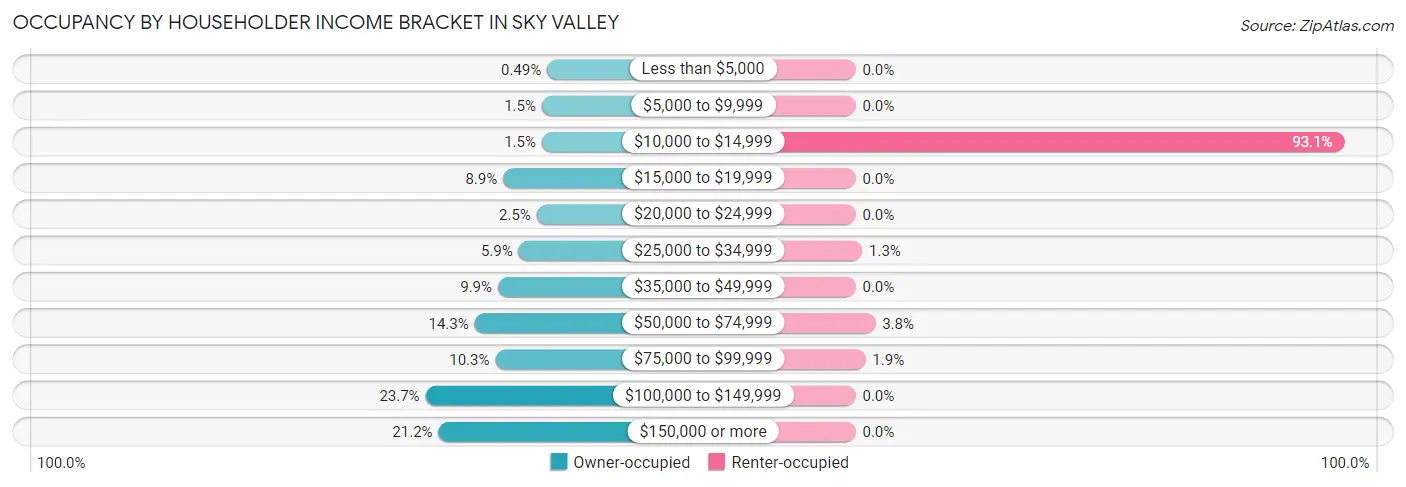
| Income Bracket | Owner-occupied | Renter-occupied |
| Less than $5,000 | 1 (0.5%) | 0 (0.0%) |
| $5,000 to $9,999 | 3 (1.5%) | 0 (0.0%) |
| $10,000 to $14,999 | 3 (1.5%) | 149 (93.1%) |
| $15,000 to $19,999 | 18 (8.9%) | 0 (0.0%) |
| $20,000 to $24,999 | 5 (2.5%) | 0 (0.0%) |
| $25,000 to $34,999 | 12 (5.9%) | 2 (1.3%) |
| $35,000 to $49,999 | 20 (9.9%) | 0 (0.0%) |
| $50,000 to $74,999 | 29 (14.3%) | 6 (3.7%) |
| $75,000 to $99,999 | 21 (10.3%) | 3 (1.9%) |
| $100,000 to $149,999 | 48 (23.6%) | 0 (0.0%) |
| $150,000 or more | 43 (21.2%) | 0 (0.0%) |
| Total | 203 (100.0%) | 160 (100.0%) |
Monthly Housing Cost Tiers in Sky Valley
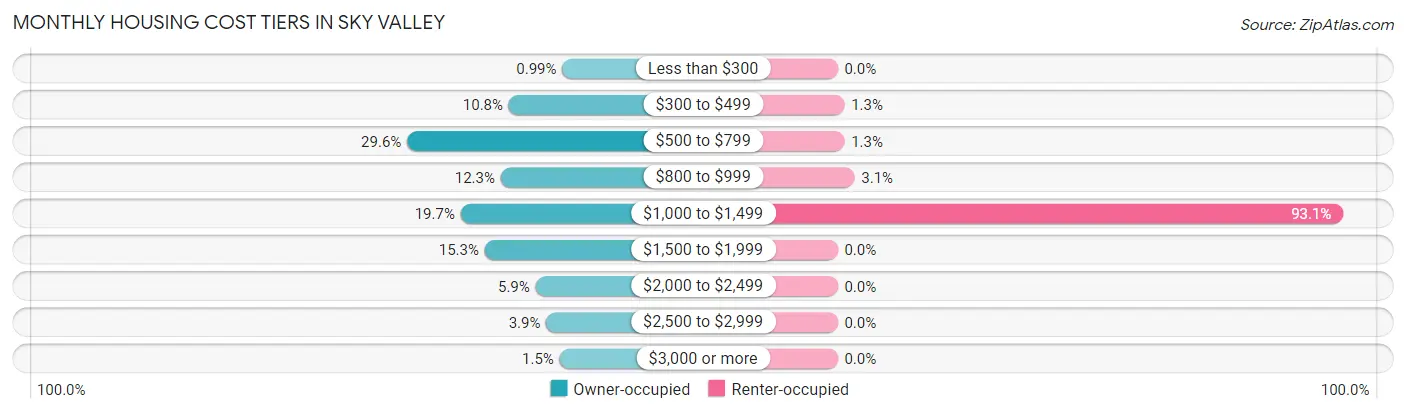
| Monthly Cost | Owner-occupied | Renter-occupied |
| Less than $300 | 2 (1.0%) | 0 (0.0%) |
| $300 to $499 | 22 (10.8%) | 2 (1.3%) |
| $500 to $799 | 60 (29.6%) | 2 (1.3%) |
| $800 to $999 | 25 (12.3%) | 5 (3.1%) |
| $1,000 to $1,499 | 40 (19.7%) | 149 (93.1%) |
| $1,500 to $1,999 | 31 (15.3%) | 0 (0.0%) |
| $2,000 to $2,499 | 12 (5.9%) | 0 (0.0%) |
| $2,500 to $2,999 | 8 (3.9%) | 0 (0.0%) |
| $3,000 or more | 3 (1.5%) | 0 (0.0%) |
| Total | 203 (100.0%) | 160 (100.0%) |
Physical Housing Characteristics in Sky Valley
Housing Structures in Sky Valley
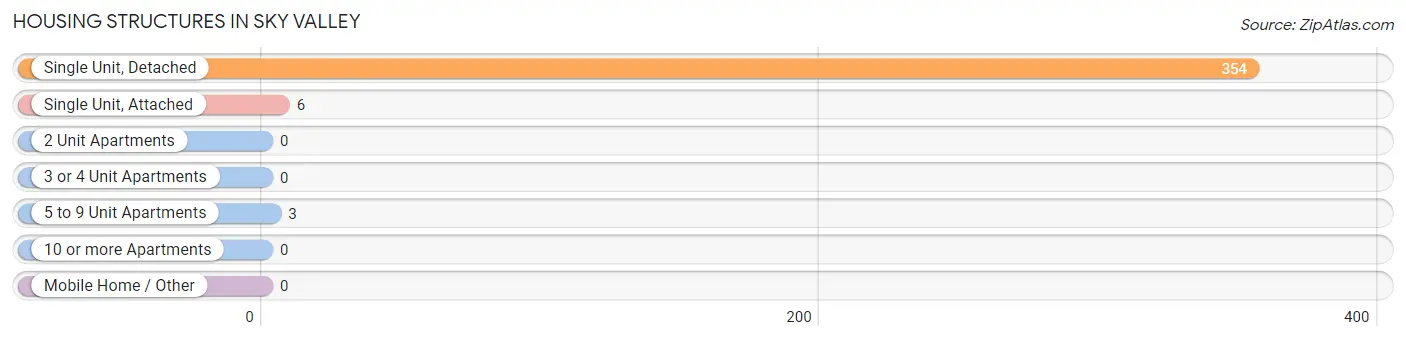
| Structure Type | # Housing Units | % Housing Units |
| Single Unit, Detached | 354 | 97.5% |
| Single Unit, Attached | 6 | 1.7% |
| 2 Unit Apartments | 0 | 0.0% |
| 3 or 4 Unit Apartments | 0 | 0.0% |
| 5 to 9 Unit Apartments | 3 | 0.8% |
| 10 or more Apartments | 0 | 0.0% |
| Mobile Home / Other | 0 | 0.0% |
| Total | 363 | 100.0% |
Housing Structures by Occupancy in Sky Valley
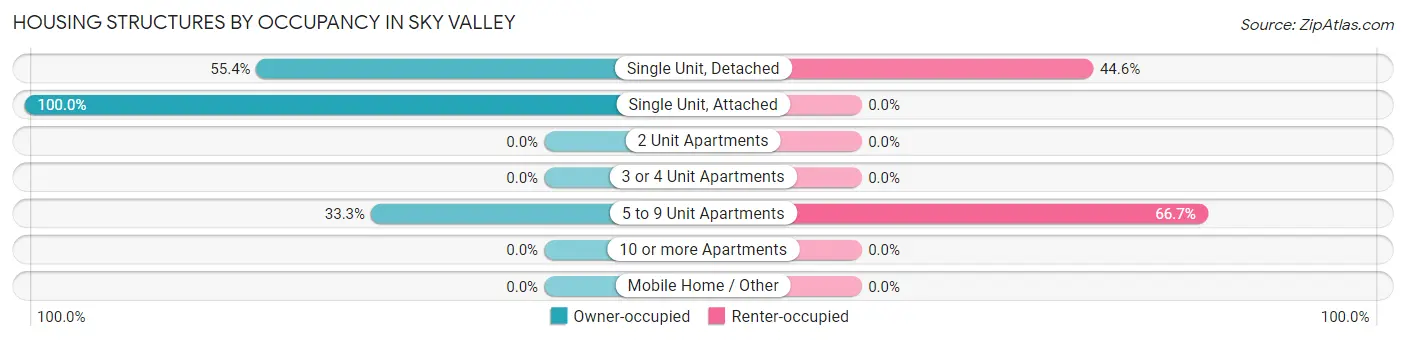
| Structure Type | Owner-occupied | Renter-occupied |
| Single Unit, Detached | 196 (55.4%) | 158 (44.6%) |
| Single Unit, Attached | 6 (100.0%) | 0 (0.0%) |
| 2 Unit Apartments | 0 (0.0%) | 0 (0.0%) |
| 3 or 4 Unit Apartments | 0 (0.0%) | 0 (0.0%) |
| 5 to 9 Unit Apartments | 1 (33.3%) | 2 (66.7%) |
| 10 or more Apartments | 0 (0.0%) | 0 (0.0%) |
| Mobile Home / Other | 0 (0.0%) | 0 (0.0%) |
| Total | 203 (55.9%) | 160 (44.1%) |
Housing Structures by Number of Rooms in Sky Valley
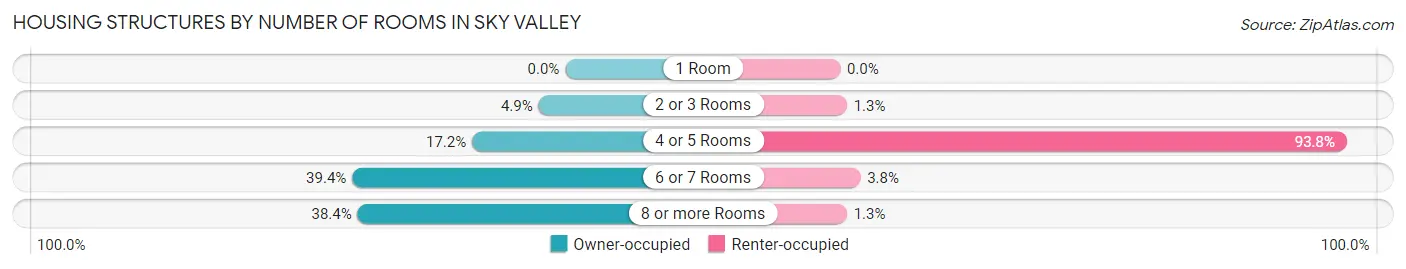
| Number of Rooms | Owner-occupied | Renter-occupied |
| 1 Room | 0 (0.0%) | 0 (0.0%) |
| 2 or 3 Rooms | 10 (4.9%) | 2 (1.3%) |
| 4 or 5 Rooms | 35 (17.2%) | 150 (93.8%) |
| 6 or 7 Rooms | 80 (39.4%) | 6 (3.7%) |
| 8 or more Rooms | 78 (38.4%) | 2 (1.3%) |
| Total | 203 (100.0%) | 160 (100.0%) |
Housing Structure by Heating Type in Sky Valley
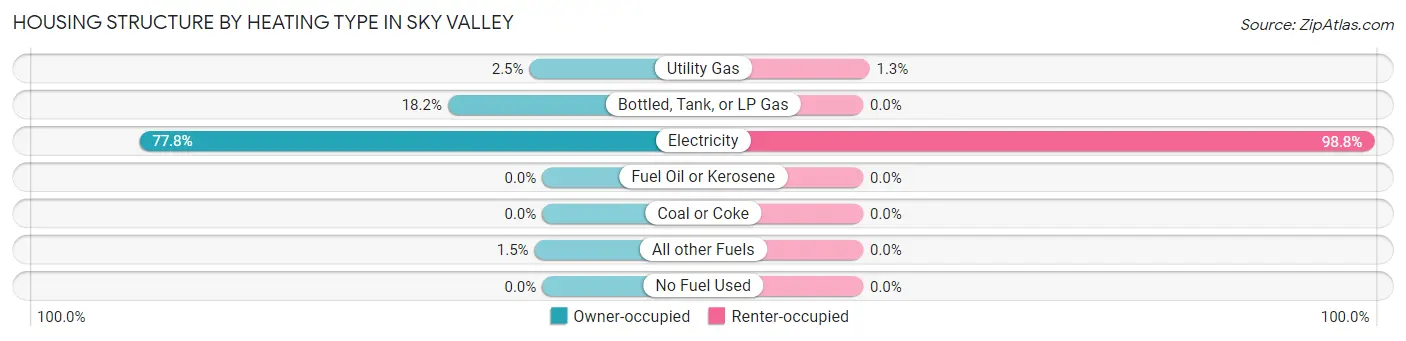
| Heating Type | Owner-occupied | Renter-occupied |
| Utility Gas | 5 (2.5%) | 2 (1.3%) |
| Bottled, Tank, or LP Gas | 37 (18.2%) | 0 (0.0%) |
| Electricity | 158 (77.8%) | 158 (98.8%) |
| Fuel Oil or Kerosene | 0 (0.0%) | 0 (0.0%) |
| Coal or Coke | 0 (0.0%) | 0 (0.0%) |
| All other Fuels | 3 (1.5%) | 0 (0.0%) |
| No Fuel Used | 0 (0.0%) | 0 (0.0%) |
| Total | 203 (100.0%) | 160 (100.0%) |
Household Vehicle Usage in Sky Valley
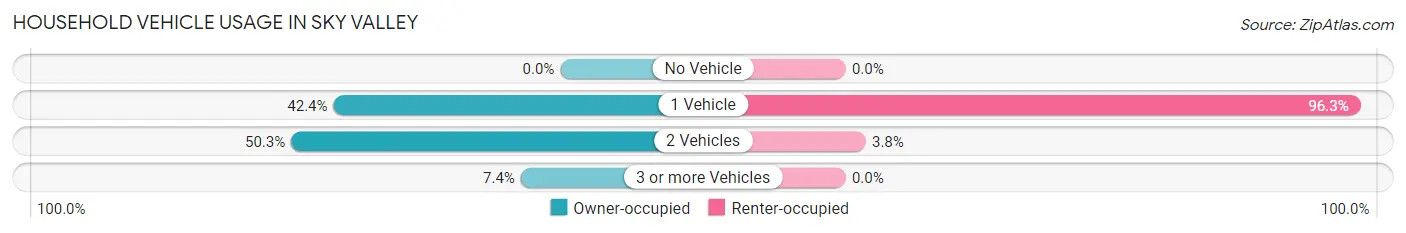
| Vehicles per Household | Owner-occupied | Renter-occupied |
| No Vehicle | 0 (0.0%) | 0 (0.0%) |
| 1 Vehicle | 86 (42.4%) | 154 (96.3%) |
| 2 Vehicles | 102 (50.2%) | 6 (3.7%) |
| 3 or more Vehicles | 15 (7.4%) | 0 (0.0%) |
| Total | 203 (100.0%) | 160 (100.0%) |
Real Estate & Mortgages in Sky Valley
Real Estate and Mortgage Overview in Sky Valley
| Characteristic | Without Mortgage | With Mortgage |
| Housing Units | 115 | 88 |
| Median Property Value | $320,800 | $282,500 |
| Median Household Income | $78,750 | $16 |
| Monthly Housing Costs | $652 | $3 |
| Real Estate Taxes | $3,088 | $0 |
Property Value by Mortgage Status in Sky Valley
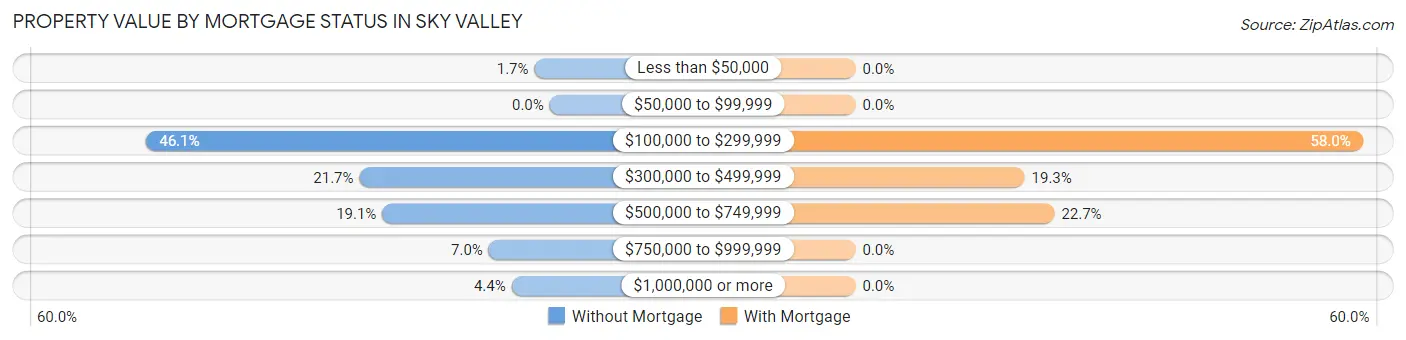
| Property Value | Without Mortgage | With Mortgage |
| Less than $50,000 | 2 (1.7%) | 0 (0.0%) |
| $50,000 to $99,999 | 0 (0.0%) | 0 (0.0%) |
| $100,000 to $299,999 | 53 (46.1%) | 51 (58.0%) |
| $300,000 to $499,999 | 25 (21.7%) | 17 (19.3%) |
| $500,000 to $749,999 | 22 (19.1%) | 20 (22.7%) |
| $750,000 to $999,999 | 8 (7.0%) | 0 (0.0%) |
| $1,000,000 or more | 5 (4.3%) | 0 (0.0%) |
| Total | 115 (100.0%) | 88 (100.0%) |
Household Income by Mortgage Status in Sky Valley
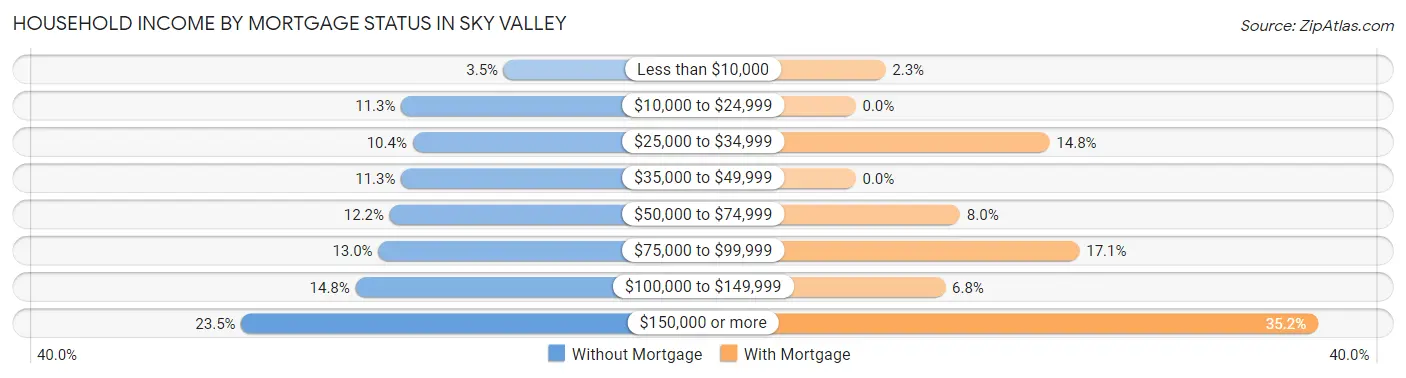
| Household Income | Without Mortgage | With Mortgage |
| Less than $10,000 | 4 (3.5%) | 2 (2.3%) |
| $10,000 to $24,999 | 13 (11.3%) | 0 (0.0%) |
| $25,000 to $34,999 | 12 (10.4%) | 13 (14.8%) |
| $35,000 to $49,999 | 13 (11.3%) | 0 (0.0%) |
| $50,000 to $74,999 | 14 (12.2%) | 7 (8.0%) |
| $75,000 to $99,999 | 15 (13.0%) | 15 (17.1%) |
| $100,000 to $149,999 | 17 (14.8%) | 6 (6.8%) |
| $150,000 or more | 27 (23.5%) | 31 (35.2%) |
| Total | 115 (100.0%) | 88 (100.0%) |
Property Value to Household Income Ratio in Sky Valley
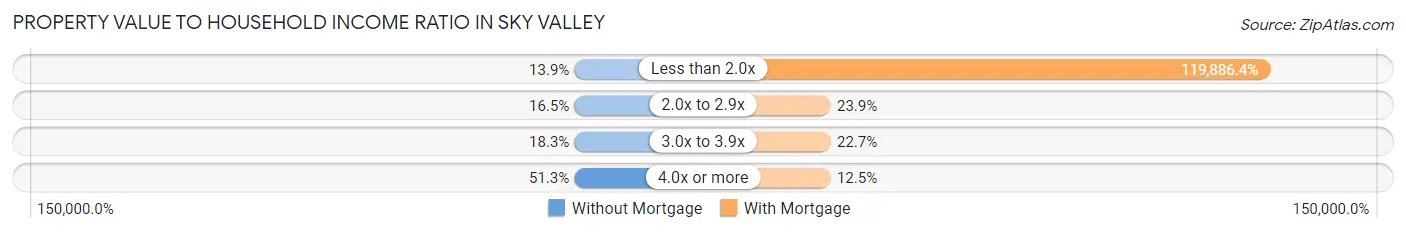
| Value-to-Income Ratio | Without Mortgage | With Mortgage |
| Less than 2.0x | 16 (13.9%) | 105,500 (119,886.4%) |
| 2.0x to 2.9x | 19 (16.5%) | 21 (23.9%) |
| 3.0x to 3.9x | 21 (18.3%) | 20 (22.7%) |
| 4.0x or more | 59 (51.3%) | 11 (12.5%) |
| Total | 115 (100.0%) | 88 (100.0%) |
Real Estate Taxes by Mortgage Status in Sky Valley
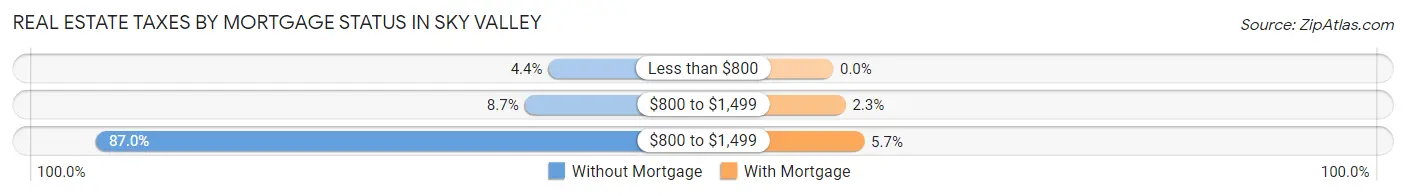
| Property Taxes | Without Mortgage | With Mortgage |
| Less than $800 | 5 (4.3%) | 0 (0.0%) |
| $800 to $1,499 | 10 (8.7%) | 2 (2.3%) |
| $800 to $1,499 | 100 (87.0%) | 5 (5.7%) |
| Total | 115 (100.0%) | 88 (100.0%) |
Health & Disability in Sky Valley
Health Insurance Coverage by Age in Sky Valley
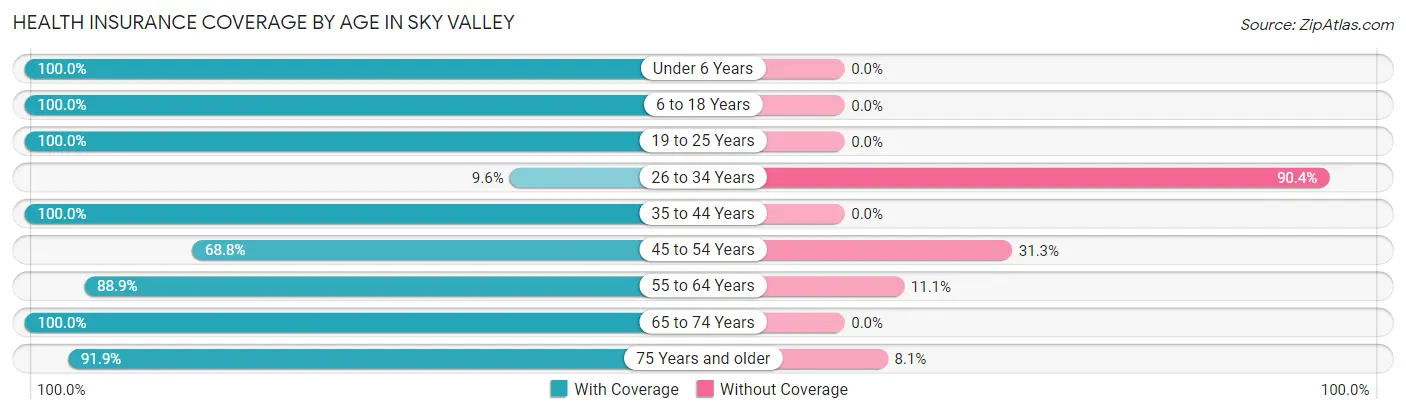
| Age Bracket | With Coverage | Without Coverage |
| Under 6 Years | 5 (100.0%) | 0 (0.0%) |
| 6 to 18 Years | 20 (100.0%) | 0 (0.0%) |
| 19 to 25 Years | 8 (100.0%) | 0 (0.0%) |
| 26 to 34 Years | 16 (9.6%) | 151 (90.4%) |
| 35 to 44 Years | 40 (100.0%) | 0 (0.0%) |
| 45 to 54 Years | 33 (68.8%) | 15 (31.2%) |
| 55 to 64 Years | 48 (88.9%) | 6 (11.1%) |
| 65 to 74 Years | 157 (100.0%) | 0 (0.0%) |
| 75 Years and older | 91 (91.9%) | 8 (8.1%) |
| Total | 418 (69.9%) | 180 (30.1%) |
Health Insurance Coverage by Citizenship Status in Sky Valley
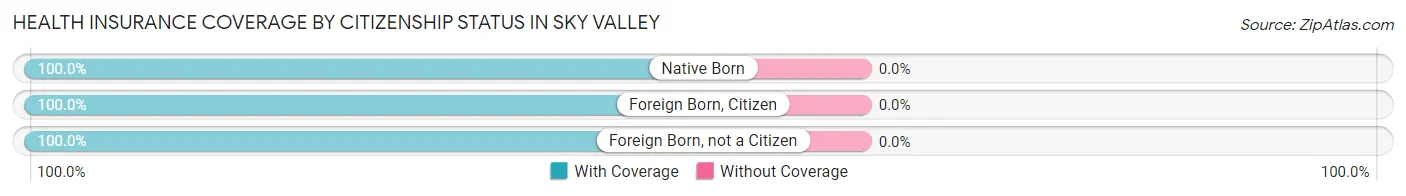
| Citizenship Status | With Coverage | Without Coverage |
| Native Born | 5 (100.0%) | 0 (0.0%) |
| Foreign Born, Citizen | 20 (100.0%) | 0 (0.0%) |
| Foreign Born, not a Citizen | 8 (100.0%) | 0 (0.0%) |
Health Insurance Coverage by Household Income in Sky Valley
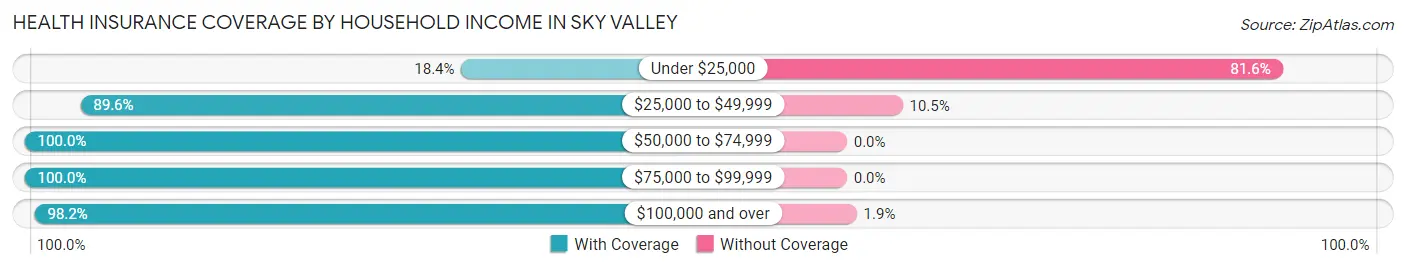
| Household Income | With Coverage | Without Coverage |
| Under $25,000 | 38 (18.4%) | 169 (81.6%) |
| $25,000 to $49,999 | 60 (89.5%) | 7 (10.4%) |
| $50,000 to $74,999 | 71 (100.0%) | 0 (0.0%) |
| $75,000 to $99,999 | 37 (100.0%) | 0 (0.0%) |
| $100,000 and over | 212 (98.2%) | 4 (1.8%) |
Public vs Private Health Insurance Coverage by Age in Sky Valley
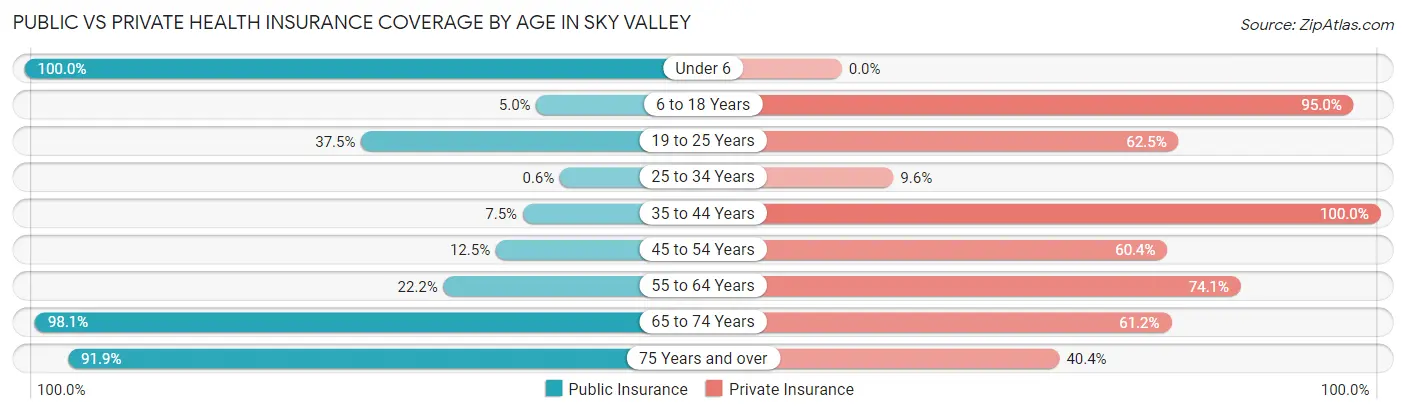
| Age Bracket | Public Insurance | Private Insurance |
| Under 6 | 5 (100.0%) | 0 (0.0%) |
| 6 to 18 Years | 1 (5.0%) | 19 (95.0%) |
| 19 to 25 Years | 3 (37.5%) | 5 (62.5%) |
| 25 to 34 Years | 1 (0.6%) | 16 (9.6%) |
| 35 to 44 Years | 3 (7.5%) | 40 (100.0%) |
| 45 to 54 Years | 6 (12.5%) | 29 (60.4%) |
| 55 to 64 Years | 12 (22.2%) | 40 (74.1%) |
| 65 to 74 Years | 154 (98.1%) | 96 (61.2%) |
| 75 Years and over | 91 (91.9%) | 40 (40.4%) |
| Total | 276 (46.2%) | 285 (47.7%) |
Disability Status by Sex by Age in Sky Valley
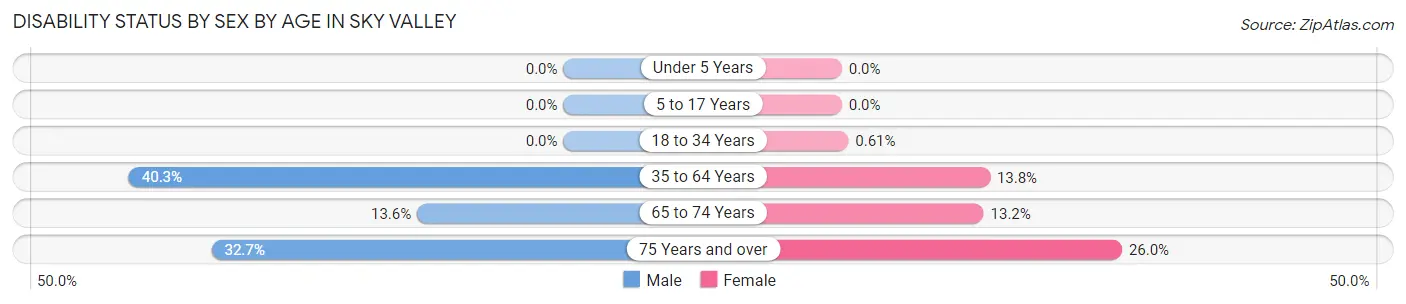
| Age Bracket | Male | Female |
| Under 5 Years | 0 (0.0%) | 0 (0.0%) |
| 5 to 17 Years | 0 (0.0%) | 0 (0.0%) |
| 18 to 34 Years | 0 (0.0%) | 1 (0.6%) |
| 35 to 64 Years | 25 (40.3%) | 11 (13.8%) |
| 65 to 74 Years | 11 (13.6%) | 10 (13.2%) |
| 75 Years and over | 16 (32.7%) | 13 (26.0%) |
Disability Class by Sex by Age in Sky Valley
Disability Class: Hearing Difficulty
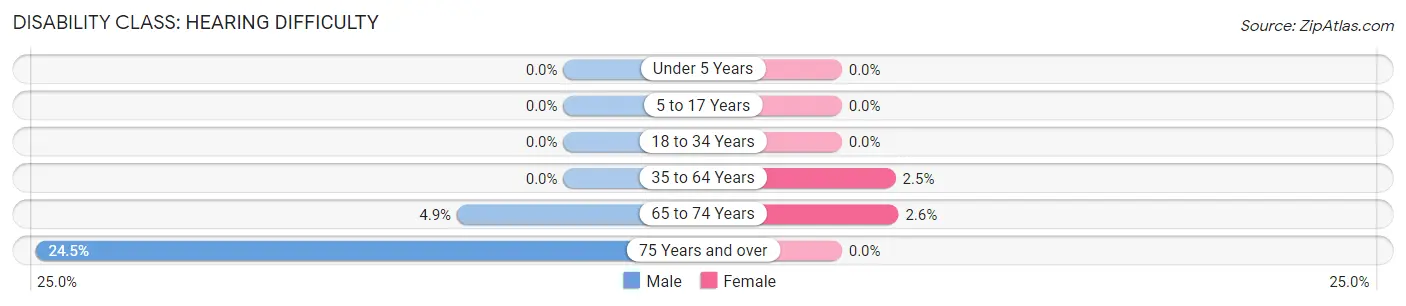
| Age Bracket | Male | Female |
| Under 5 Years | 0 (0.0%) | 0 (0.0%) |
| 5 to 17 Years | 0 (0.0%) | 0 (0.0%) |
| 18 to 34 Years | 0 (0.0%) | 0 (0.0%) |
| 35 to 64 Years | 0 (0.0%) | 2 (2.5%) |
| 65 to 74 Years | 4 (4.9%) | 2 (2.6%) |
| 75 Years and over | 12 (24.5%) | 0 (0.0%) |
Disability Class: Vision Difficulty
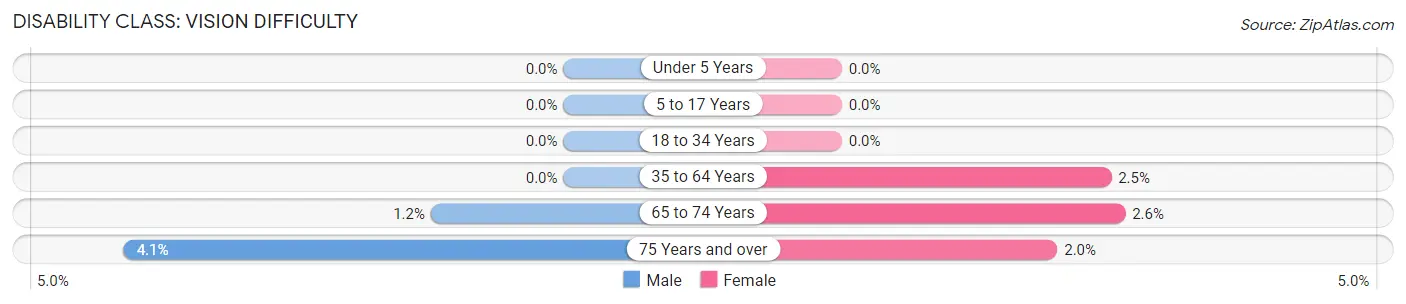
| Age Bracket | Male | Female |
| Under 5 Years | 0 (0.0%) | 0 (0.0%) |
| 5 to 17 Years | 0 (0.0%) | 0 (0.0%) |
| 18 to 34 Years | 0 (0.0%) | 0 (0.0%) |
| 35 to 64 Years | 0 (0.0%) | 2 (2.5%) |
| 65 to 74 Years | 1 (1.2%) | 2 (2.6%) |
| 75 Years and over | 2 (4.1%) | 1 (2.0%) |
Disability Class: Cognitive Difficulty
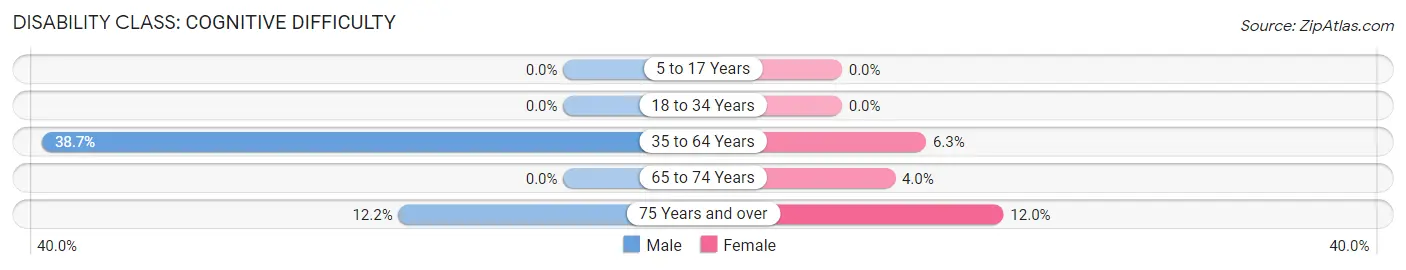
| Age Bracket | Male | Female |
| 5 to 17 Years | 0 (0.0%) | 0 (0.0%) |
| 18 to 34 Years | 0 (0.0%) | 0 (0.0%) |
| 35 to 64 Years | 24 (38.7%) | 5 (6.2%) |
| 65 to 74 Years | 0 (0.0%) | 3 (4.0%) |
| 75 Years and over | 6 (12.2%) | 6 (12.0%) |
Disability Class: Ambulatory Difficulty
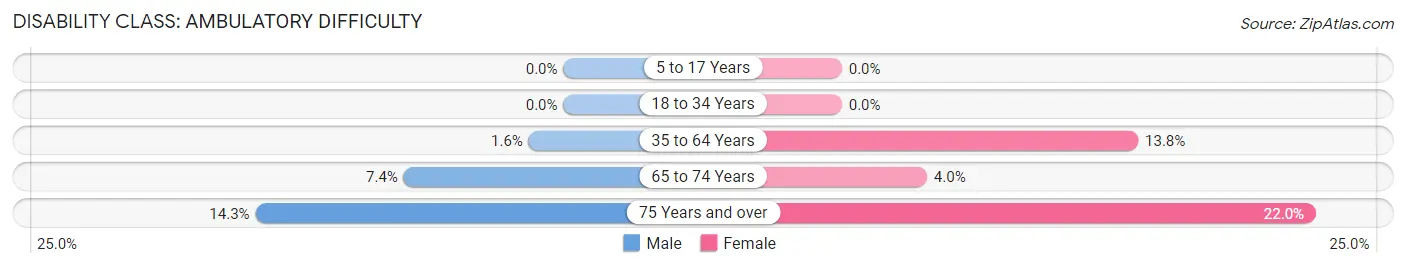
| Age Bracket | Male | Female |
| 5 to 17 Years | 0 (0.0%) | 0 (0.0%) |
| 18 to 34 Years | 0 (0.0%) | 0 (0.0%) |
| 35 to 64 Years | 1 (1.6%) | 11 (13.8%) |
| 65 to 74 Years | 6 (7.4%) | 3 (4.0%) |
| 75 Years and over | 7 (14.3%) | 11 (22.0%) |
Disability Class: Self-Care Difficulty
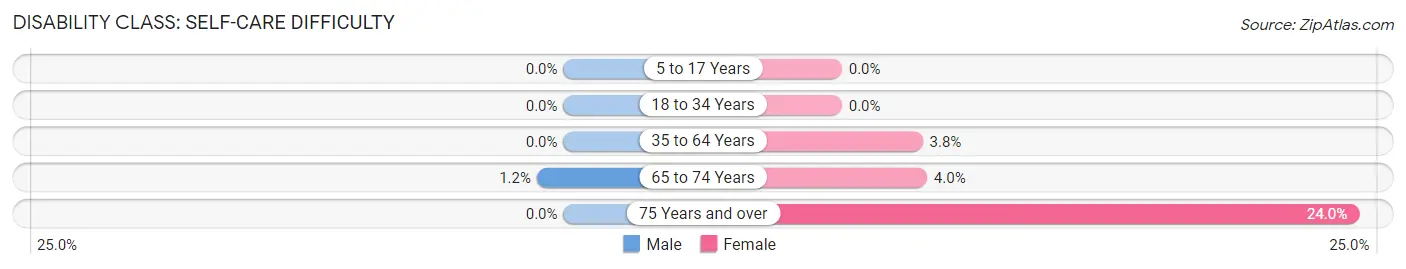
| Age Bracket | Male | Female |
| 5 to 17 Years | 0 (0.0%) | 0 (0.0%) |
| 18 to 34 Years | 0 (0.0%) | 0 (0.0%) |
| 35 to 64 Years | 0 (0.0%) | 3 (3.7%) |
| 65 to 74 Years | 1 (1.2%) | 3 (4.0%) |
| 75 Years and over | 0 (0.0%) | 12 (24.0%) |
Technology Access in Sky Valley
Computing Device Access in Sky Valley
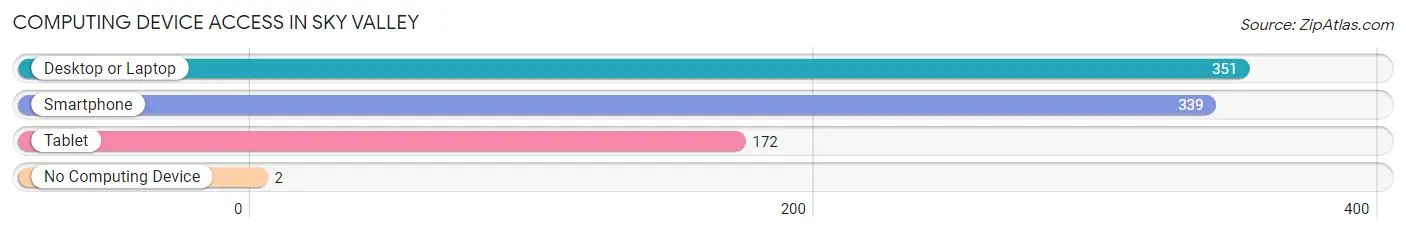
| Device Type | # Households | % Households |
| Desktop or Laptop | 351 | 96.7% |
| Smartphone | 339 | 93.4% |
| Tablet | 172 | 47.4% |
| No Computing Device | 2 | 0.5% |
| Total | 363 | 100.0% |
Internet Access in Sky Valley
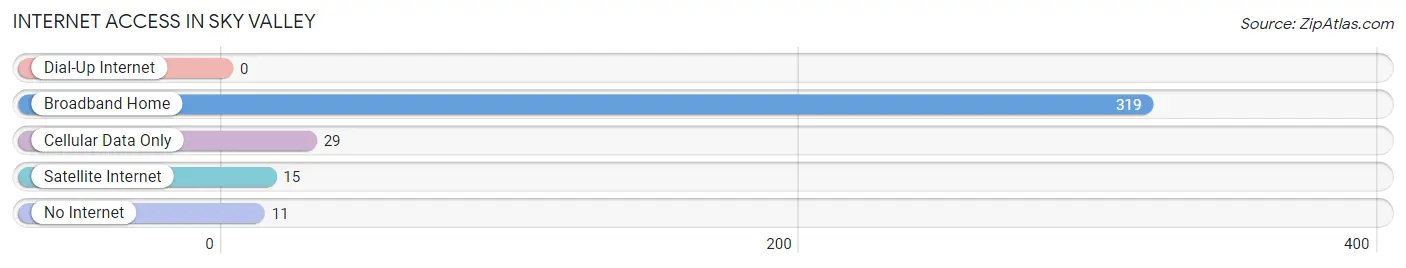
| Internet Type | # Households | % Households |
| Dial-Up Internet | 0 | 0.0% |
| Broadband Home | 319 | 87.9% |
| Cellular Data Only | 29 | 8.0% |
| Satellite Internet | 15 | 4.1% |
| No Internet | 11 | 3.0% |
| Total | 363 | 100.0% |
Sky Valley Summary
History
Sky Valley, Georgia is a small town located in Rabun County, Georgia. It is situated in the foothills of the Blue Ridge Mountains, and is known for its beautiful scenery and outdoor activities. The town was founded in 1883 by a group of settlers from North Carolina, and was originally called Skyland. The name was changed to Sky Valley in the early 1900s.
The town was originally a farming community, and the main crops grown were corn, wheat, and tobacco. The town also had a few small businesses, such as a general store, a blacksmith, and a sawmill. In the early 1900s, the town began to grow as more people moved to the area. The town was incorporated in 1921, and the population grew to over 500 by the 1940s.
The town experienced a period of growth in the 1950s and 1960s, as the population increased to over 1,000. During this time, the town saw the construction of a new school, a library, and a post office. The town also saw the opening of several new businesses, including a grocery store, a hardware store, and a gas station.
In the 1970s, the town began to decline as the population decreased and businesses closed. However, in the 1980s, the town began to experience a resurgence as new businesses opened and the population increased. Today, Sky Valley is a small but vibrant community with a population of around 1,500.
Geography
Sky Valley is located in the foothills of the Blue Ridge Mountains in Rabun County, Georgia. The town is situated at an elevation of 1,400 feet, and is surrounded by the Chattahoochee National Forest. The town is located near the headwaters of the Chattooga River, and is close to several popular outdoor recreation areas, such as the Tallulah Gorge State Park and the Chattooga River.
The town is located approximately 75 miles northeast of Atlanta, and is accessible via US Highway 441. The nearest major airport is the Athens-Ben Epps Airport, located approximately 50 miles away.
Economy
Sky Valley’s economy is largely based on tourism and outdoor recreation. The town is home to several popular outdoor recreation areas, such as the Tallulah Gorge State Park and the Chattooga River. The town also has several small businesses, including restaurants, shops, and lodging.
The town is also home to several manufacturing companies, such as a furniture manufacturer and a plastics manufacturer. The town is also home to a small airport, which serves as a base for several private aircraft.
Demographics
As of the 2010 census, the population of Sky Valley was 1,521. The racial makeup of the town was 95.3% White, 0.7% African American, 0.3% Native American, 0.7% Asian, 0.1% Pacific Islander, 1.3% from other races, and 1.6% from two or more races. Hispanic or Latino of any race were 3.2% of the population.
The median household income in Sky Valley was $37,917, and the median family income was $45,625. The per capita income for the town was $20,945. About 11.2% of families and 14.3% of the population were below the poverty line, including 18.2% of those under age 18 and 8.3% of those age 65 or over.
Common Questions
What is the Total Population of Sky Valley?
Total Population of Sky Valley is 599.
What is the Total Male Population of Sky Valley?
Total Male Population of Sky Valley is 222.
What is the Total Female Population of Sky Valley?
Total Female Population of Sky Valley is 377.
What is the Ratio of Males per 100 Females in Sky Valley?
There are 58.89 Males per 100 Females in Sky Valley.
What is the Ratio of Females per 100 Males in Sky Valley?
There are 169.82 Females per 100 Males in Sky Valley.
What is the Median Population Age in Sky Valley?
Median Population Age in Sky Valley is 58.5 Years.
What is the Average Family Size in Sky Valley
Average Family Size in Sky Valley is 2.4 People.
What is the Average Household Size in Sky Valley
Average Household Size in Sky Valley is 1.6 People.
What is Per Capita Income in Sky Valley?
Per Capita income in Sky Valley is $49,353.
What is the Median Family Income in Sky Valley?
Median Family Income in Sky Valley is $92,000.
What is Inequality or Gini Index in Sky Valley?
Inequality or Gini Index in Sky Valley is 0.60.
How Large is the Labor Force in Sky Valley?
There are 308 People in the Labor Forcein in Sky Valley.
What is the Percentage of People in the Labor Force in Sky Valley?
53.4% of People are in the Labor Force in Sky Valley.
What is the Unemployment Rate in Sky Valley?
Unemployment Rate in Sky Valley is 4.9%.