Cities with the Most Immigrants from Ukraine in Georgia
RELATED REPORTS & OPTIONS
Ukraine
Georgia
Compare Cities
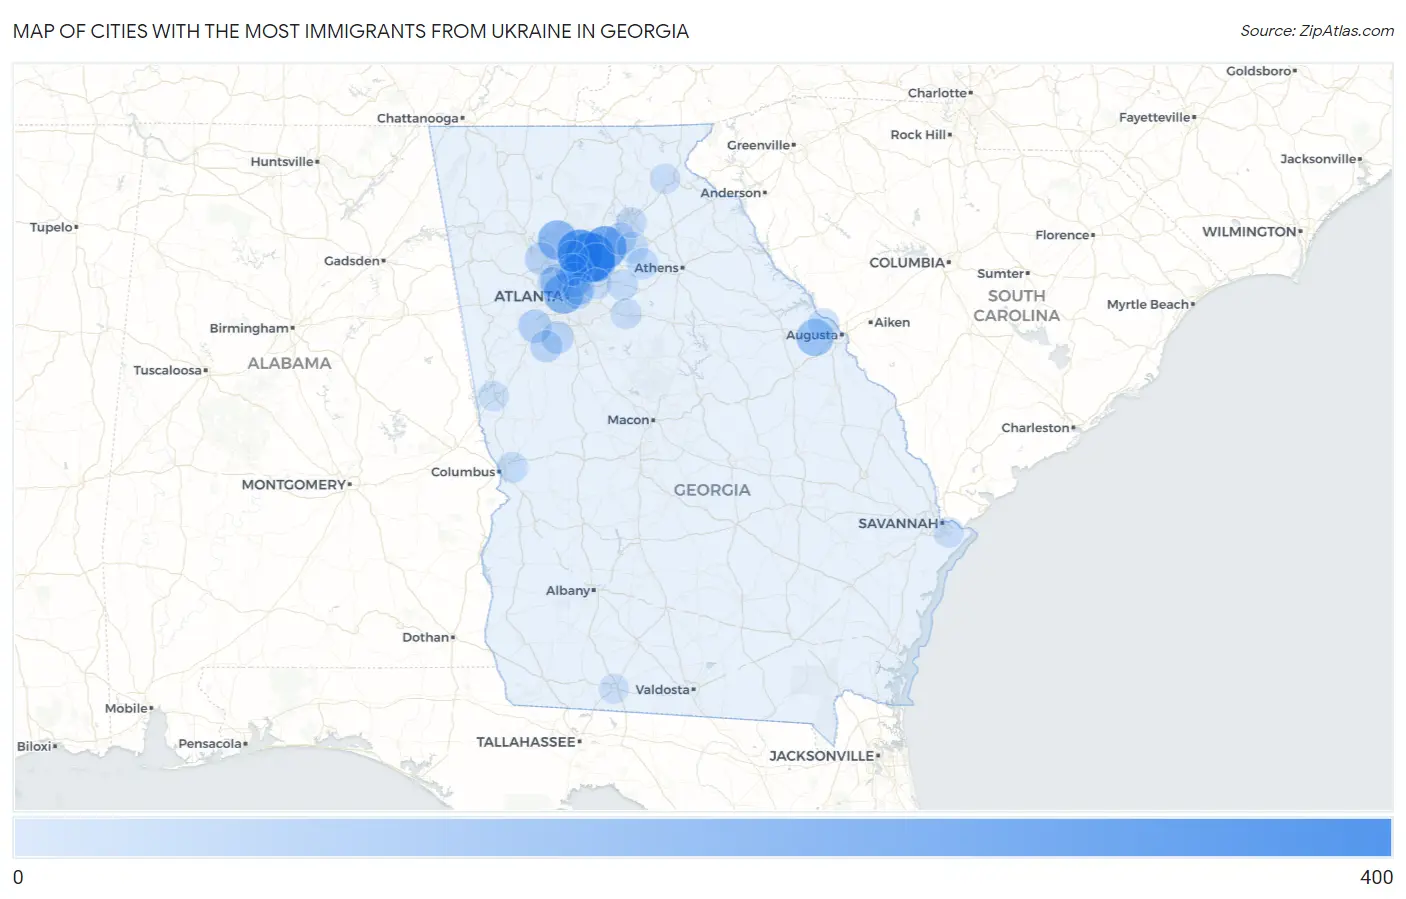
Map of Cities with the Most Immigrants from Ukraine in Georgia
0
400
Cities with the Most Immigrants from Ukraine in Georgia
| City | Ukraine | vs State | vs National | |
| 1. | Johns Creek | 308 | 4,193(7.35%)#1 | 383,359(0.08%)#159 |
| 2. | Alpharetta | 248 | 4,193(5.91%)#2 | 383,359(0.06%)#210 |
| 3. | Sugar Hill | 202 | 4,193(4.82%)#3 | 383,359(0.05%)#255 |
| 4. | Atlanta | 153 | 4,193(3.65%)#4 | 383,359(0.04%)#344 |
| 5. | Holly Springs | 143 | 4,193(3.41%)#5 | 383,359(0.04%)#364 |
| 6. | Duluth | 135 | 4,193(3.22%)#6 | 383,359(0.04%)#389 |
| 7. | Grovetown | 111 | 4,193(2.65%)#7 | 383,359(0.03%)#465 |
| 8. | Brookhaven | 69 | 4,193(1.65%)#8 | 383,359(0.02%)#734 |
| 9. | Vinings | 66 | 4,193(1.57%)#9 | 383,359(0.02%)#770 |
| 10. | Palmetto | 49 | 4,193(1.17%)#10 | 383,359(0.01%)#969 |
| 11. | Dunwoody | 43 | 4,193(1.03%)#11 | 383,359(0.01%)#1,052 |
| 12. | Kennesaw | 39 | 4,193(0.93%)#12 | 383,359(0.01%)#1,122 |
| 13. | Fayetteville | 36 | 4,193(0.86%)#13 | 383,359(0.01%)#1,180 |
| 14. | Flowery Branch | 32 | 4,193(0.76%)#14 | 383,359(0.01%)#1,276 |
| 15. | North Decatur | 31 | 4,193(0.74%)#15 | 383,359(0.01%)#1,294 |
| 16. | Sandy Springs | 30 | 4,193(0.72%)#16 | 383,359(0.01%)#1,309 |
| 17. | Peachtree City | 30 | 4,193(0.72%)#17 | 383,359(0.01%)#1,319 |
| 18. | Berry College | 30 | 4,193(0.72%)#18 | 383,359(0.01%)#1,334 |
| 19. | Braselton | 23 | 4,193(0.55%)#19 | 383,359(0.01%)#1,513 |
| 20. | Winder | 22 | 4,193(0.52%)#20 | 383,359(0.01%)#1,556 |
| 21. | Athens-Clarke County Unified Government (Balance) | 21 | 4,193(0.50%)#21 | 383,359(0.01%)#1,572 |
| 22. | Evans | 19 | 4,193(0.45%)#22 | 383,359(0.00%)#1,672 |
| 23. | Roswell | 16 | 4,193(0.38%)#23 | 383,359(0.00%)#1,815 |
| 24. | Loganville | 15 | 4,193(0.36%)#24 | 383,359(0.00%)#1,895 |
| 25. | Columbus | 14 | 4,193(0.33%)#25 | 383,359(0.00%)#1,913 |
| 26. | Augusta-Richmond County Consolidated Government (Balance) | 14 | 4,193(0.33%)#26 | 383,359(0.00%)#1,914 |
| 27. | Decatur | 14 | 4,193(0.33%)#27 | 383,359(0.00%)#1,933 |
| 28. | Mountain Park | 12 | 4,193(0.29%)#28 | 383,359(0.00%)#2,061 |
| 29. | Oxford | 12 | 4,193(0.29%)#29 | 383,359(0.00%)#2,094 |
| 30. | Smyrna | 10 | 4,193(0.24%)#30 | 383,359(0.00%)#2,174 |
| 31. | Gainesville | 10 | 4,193(0.24%)#31 | 383,359(0.00%)#2,176 |
| 32. | Dutch Island | 6 | 4,193(0.14%)#32 | 383,359(0.00%)#2,553 |
| 33. | Clarkesville | 3 | 4,193(0.07%)#33 | 383,359(0.00%)#2,742 |
| 34. | Lagrange | 2 | 4,193(0.05%)#34 | 383,359(0.00%)#2,778 |
| 35. | Thomasville | 2 | 4,193(0.05%)#35 | 383,359(0.00%)#2,782 |
Common Questions
What are the Top 10 Cities with the Most Immigrants from Ukraine in Georgia?
Top 10 Cities with the Most Immigrants from Ukraine in Georgia are:
#1
308
#2
248
#3
202
#4
153
#5
143
#6
135
#7
111
#8
69
#9
66
#10
49
What city has the Most Immigrants from Ukraine in Georgia?
Johns Creek has the Most Immigrants from Ukraine in Georgia with 308.
What is the Total Immigrants from Ukraine in the State of Georgia?
Total Immigrants from Ukraine in Georgia is 4,193.
What is the Total Immigrants from Ukraine in the United States?
Total Immigrants from Ukraine in the United States is 383,359.