Mountain Park, GA
Mountain Park Map
Mountain Park Overview
13,334
TOTAL POPULATION
7,238
MALE POPULATION
6,096
FEMALE POPULATION
118.73
MALES / 100 FEMALES
84.22
FEMALES / 100 MALES
46.2
MEDIAN AGE
3.3
AVG FAMILY SIZE
2.9
AVG HOUSEHOLD SIZE
$35,821
PER CAPITA INCOME
$96,090
AVG FAMILY INCOME
$92,718
AVG HOUSEHOLD INCOME
18.8%
WAGE / INCOME GAP [ % ]
81.2¢/ $1
WAGE / INCOME GAP [ $ ]
0.39
INEQUALITY / GINI INDEX
6,763
LABOR FORCE [ PEOPLE ]
60.9%
PERCENT IN LABOR FORCE
3.2%
UNEMPLOYMENT RATE
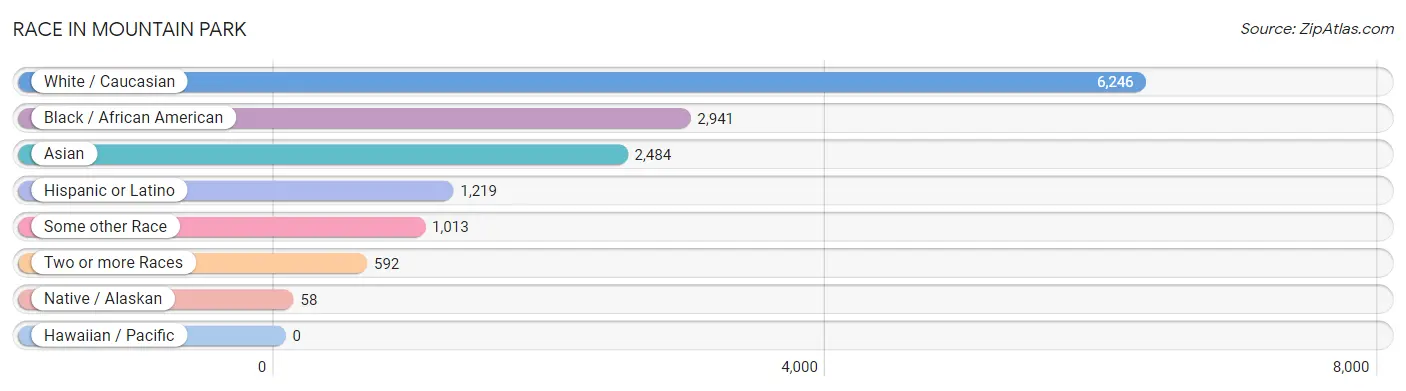
Race in Mountain Park
The most populous races in Mountain Park are White / Caucasian (6,246 | 46.8%), Black / African American (2,941 | 22.1%), and Asian (2,484 | 18.6%).
| Race | # Population | % Population |
| Asian | 2,484 | 18.6% |
| Black / African American | 2,941 | 22.1% |
| Hawaiian / Pacific | 0 | 0.0% |
| Hispanic or Latino | 1,219 | 9.1% |
| Native / Alaskan | 58 | 0.4% |
| White / Caucasian | 6,246 | 46.8% |
| Two or more Races | 592 | 4.4% |
| Some other Race | 1,013 | 7.6% |
| Total | 13,334 | 100.0% |
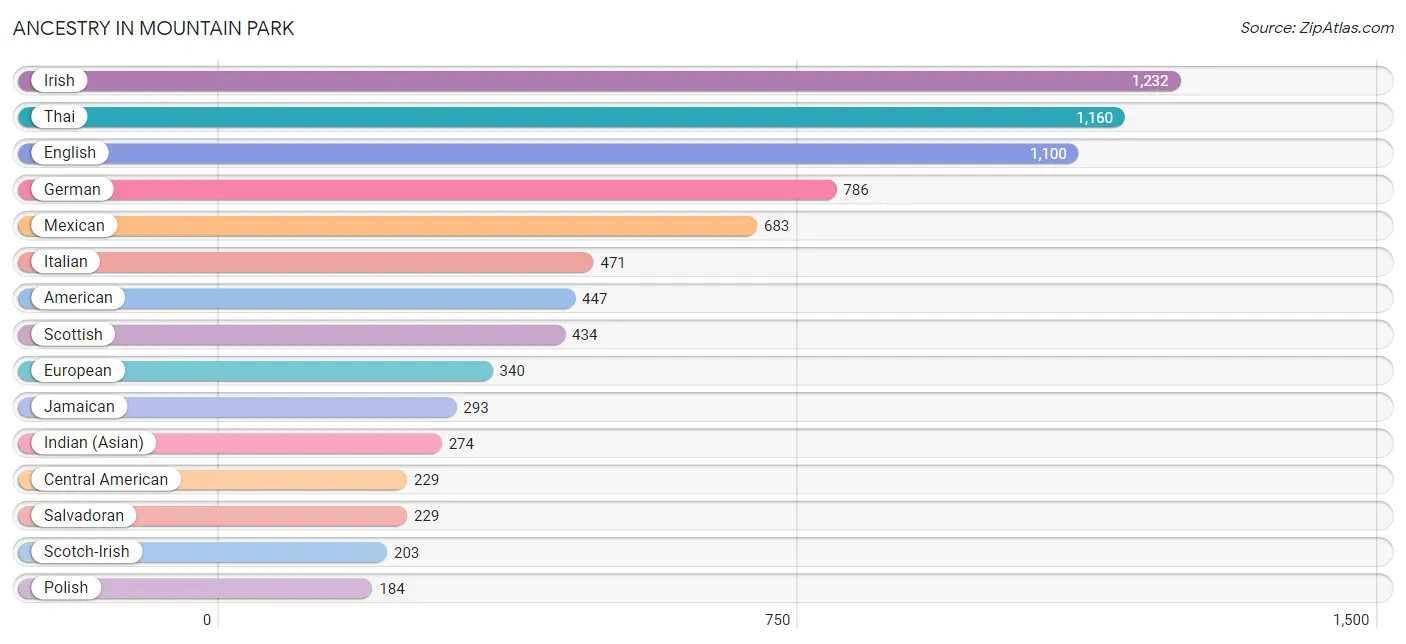
Ancestry in Mountain Park
The most populous ancestries reported in Mountain Park are Irish (1,232 | 9.2%), Thai (1,160 | 8.7%), English (1,100 | 8.3%), German (786 | 5.9%), and Mexican (683 | 5.1%), together accounting for 37.2% of all Mountain Park residents.
| Ancestry | # Population | % Population |
| American | 447 | 3.4% |
| Arab | 80 | 0.6% |
| Austrian | 7 | 0.1% |
| Belgian | 10 | 0.1% |
| Bhutanese | 8 | 0.1% |
| British | 90 | 0.7% |
| Burmese | 95 | 0.7% |
| Canadian | 36 | 0.3% |
| Central American | 229 | 1.7% |
| Cherokee | 42 | 0.3% |
| Colombian | 52 | 0.4% |
| Cuban | 2 | 0.0% |
| Dominican | 132 | 1.0% |
| Dutch | 42 | 0.3% |
| English | 1,100 | 8.3% |
| European | 340 | 2.5% |
| Filipino | 65 | 0.5% |
| French | 136 | 1.0% |
| French American Indian | 3 | 0.0% |
| German | 786 | 5.9% |
| Ghanaian | 17 | 0.1% |
| Haitian | 84 | 0.6% |
| Hungarian | 43 | 0.3% |
| Indian (Asian) | 274 | 2.1% |
| Indonesian | 99 | 0.7% |
| Iraqi | 12 | 0.1% |
| Irish | 1,232 | 9.2% |
| Italian | 471 | 3.5% |
| Jamaican | 293 | 2.2% |
| Japanese | 76 | 0.6% |
| Macedonian | 15 | 0.1% |
| Mexican | 683 | 5.1% |
| Norwegian | 144 | 1.1% |
| Peruvian | 67 | 0.5% |
| Polish | 184 | 1.4% |
| Portuguese | 12 | 0.1% |
| Puerto Rican | 43 | 0.3% |
| Romanian | 14 | 0.1% |
| Russian | 31 | 0.2% |
| Salvadoran | 229 | 1.7% |
| Scotch-Irish | 203 | 1.5% |
| Scottish | 434 | 3.3% |
| Serbian | 13 | 0.1% |
| Sioux | 26 | 0.2% |
| Slavic | 12 | 0.1% |
| South American | 119 | 0.9% |
| South American Indian | 40 | 0.3% |
| Spaniard | 11 | 0.1% |
| Sri Lankan | 124 | 0.9% |
| Subsaharan African | 17 | 0.1% |
| Swedish | 87 | 0.6% |
| Swiss | 10 | 0.1% |
| Thai | 1,160 | 8.7% |
| Trinidadian and Tobagonian | 17 | 0.1% |
| Turkish | 15 | 0.1% |
| Welsh | 20 | 0.2% |
| West Indian | 175 | 1.3% |
| Yugoslavian | 44 | 0.3% | View All 58 Rows |
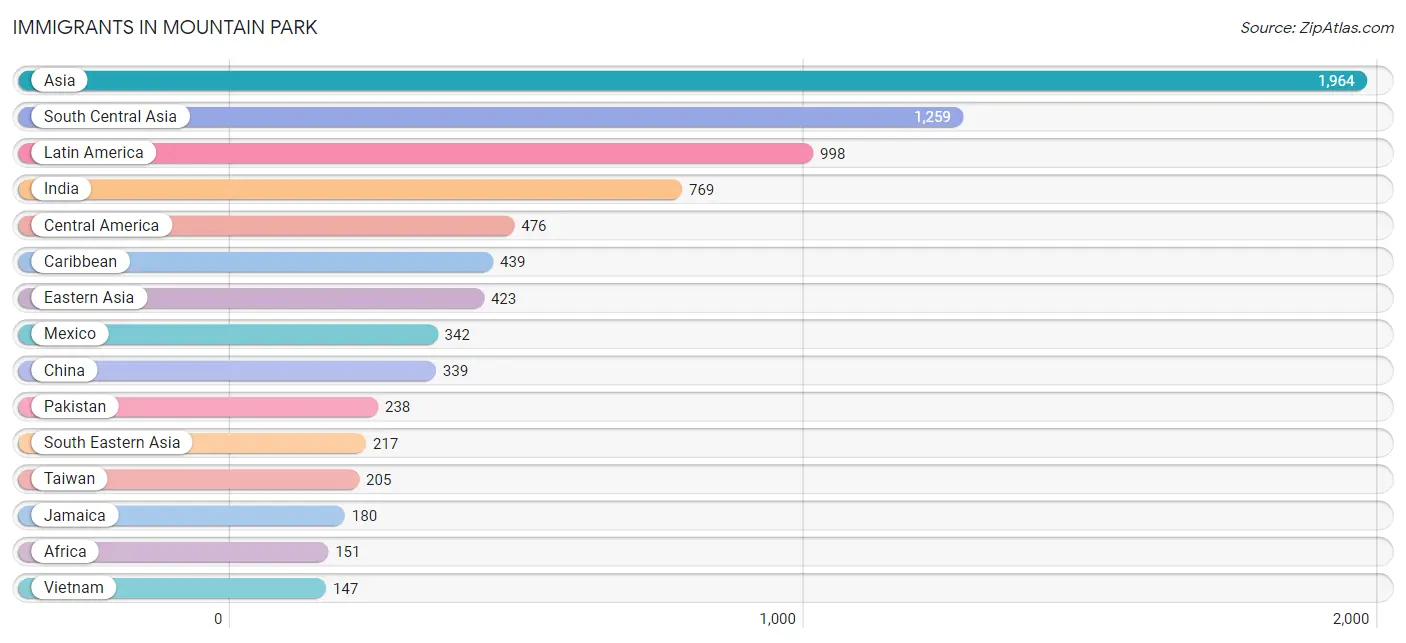
Immigrants in Mountain Park
The most numerous immigrant groups reported in Mountain Park came from Asia (1,964 | 14.7%), South Central Asia (1,259 | 9.4%), Latin America (998 | 7.5%), India (769 | 5.8%), and Central America (476 | 3.6%), together accounting for 41.0% of all Mountain Park residents.
| Immigration Origin | # Population | % Population |
| Africa | 151 | 1.1% |
| Asia | 1,964 | 14.7% |
| Bangladesh | 101 | 0.8% |
| Bosnia and Herzegovina | 14 | 0.1% |
| Cambodia | 31 | 0.2% |
| Canada | 19 | 0.1% |
| Caribbean | 439 | 3.3% |
| Central America | 476 | 3.6% |
| China | 339 | 2.5% |
| Colombia | 29 | 0.2% |
| Cuba | 9 | 0.1% |
| Dominica | 40 | 0.3% |
| Dominican Republic | 97 | 0.7% |
| Eastern Africa | 134 | 1.0% |
| Eastern Asia | 423 | 3.2% |
| Eastern Europe | 63 | 0.5% |
| El Salvador | 83 | 0.6% |
| Ethiopia | 134 | 1.0% |
| Europe | 91 | 0.7% |
| France | 11 | 0.1% |
| Germany | 17 | 0.1% |
| Haiti | 84 | 0.6% |
| Honduras | 51 | 0.4% |
| India | 769 | 5.8% |
| Iraq | 65 | 0.5% |
| Jamaica | 180 | 1.3% |
| Japan | 21 | 0.2% |
| Korea | 63 | 0.5% |
| Latin America | 998 | 7.5% |
| Mexico | 342 | 2.6% |
| Morocco | 17 | 0.1% |
| Northern Africa | 17 | 0.1% |
| Oceania | 24 | 0.2% |
| Pakistan | 238 | 1.8% |
| Peru | 39 | 0.3% |
| Russia | 9 | 0.1% |
| Serbia | 13 | 0.1% |
| South America | 83 | 0.6% |
| South Central Asia | 1,259 | 9.4% |
| South Eastern Asia | 217 | 1.6% |
| Taiwan | 205 | 1.5% |
| Trinidad and Tobago | 29 | 0.2% |
| Ukraine | 12 | 0.1% |
| Vietnam | 147 | 1.1% |
| Western Asia | 65 | 0.5% |
| Western Europe | 28 | 0.2% | View All 46 Rows |
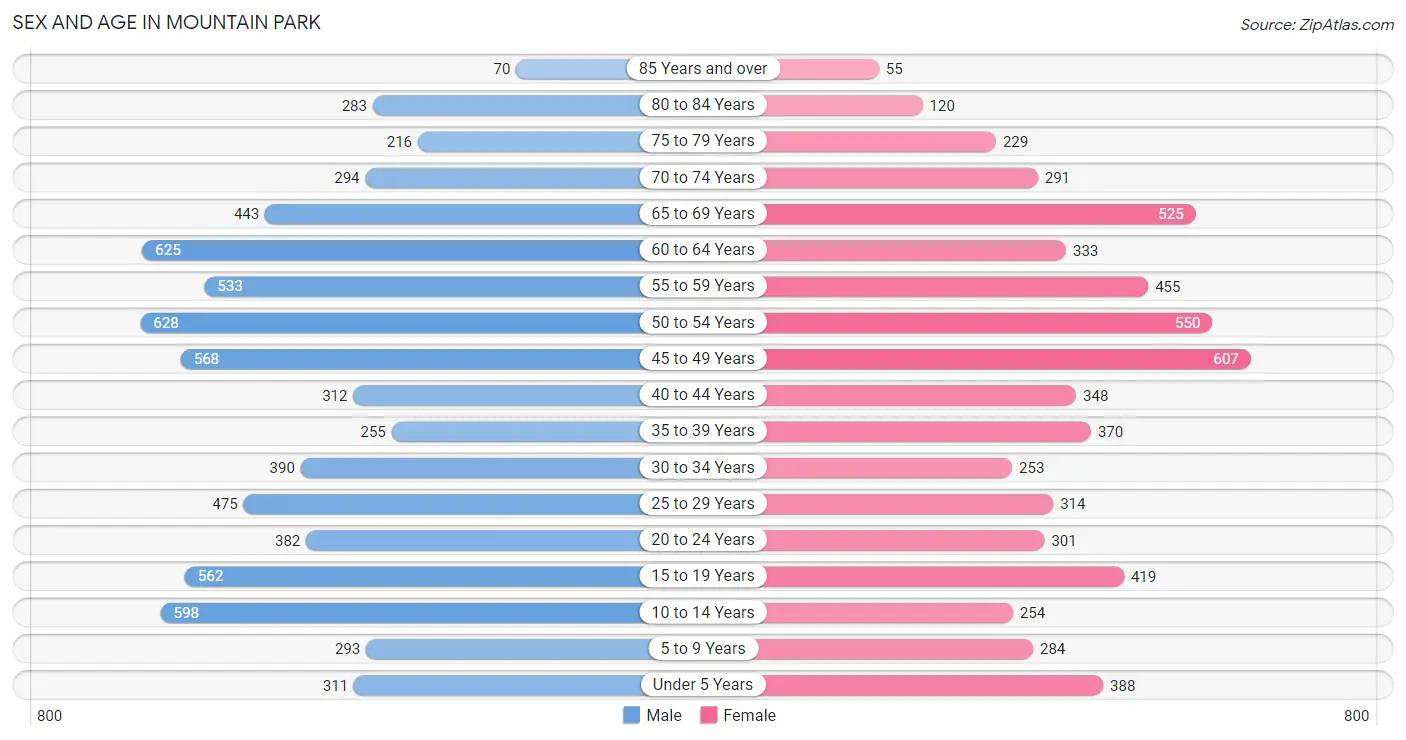
Sex and Age in Mountain Park
Sex and Age in Mountain Park
The most populous age groups in Mountain Park are 50 to 54 Years (628 | 8.7%) for men and 45 to 49 Years (607 | 10.0%) for women.
| Age Bracket | Male | Female |
| Under 5 Years | 311 (4.3%) | 388 (6.4%) |
| 5 to 9 Years | 293 (4.1%) | 284 (4.7%) |
| 10 to 14 Years | 598 (8.3%) | 254 (4.2%) |
| 15 to 19 Years | 562 (7.8%) | 419 (6.9%) |
| 20 to 24 Years | 382 (5.3%) | 301 (4.9%) |
| 25 to 29 Years | 475 (6.6%) | 314 (5.1%) |
| 30 to 34 Years | 390 (5.4%) | 253 (4.2%) |
| 35 to 39 Years | 255 (3.5%) | 370 (6.1%) |
| 40 to 44 Years | 312 (4.3%) | 348 (5.7%) |
| 45 to 49 Years | 568 (7.9%) | 607 (10.0%) |
| 50 to 54 Years | 628 (8.7%) | 550 (9.0%) |
| 55 to 59 Years | 533 (7.4%) | 455 (7.5%) |
| 60 to 64 Years | 625 (8.6%) | 333 (5.5%) |
| 65 to 69 Years | 443 (6.1%) | 525 (8.6%) |
| 70 to 74 Years | 294 (4.1%) | 291 (4.8%) |
| 75 to 79 Years | 216 (3.0%) | 229 (3.8%) |
| 80 to 84 Years | 283 (3.9%) | 120 (2.0%) |
| 85 Years and over | 70 (1.0%) | 55 (0.9%) |
| Total | 7,238 (100.0%) | 6,096 (100.0%) |
Families and Households in Mountain Park
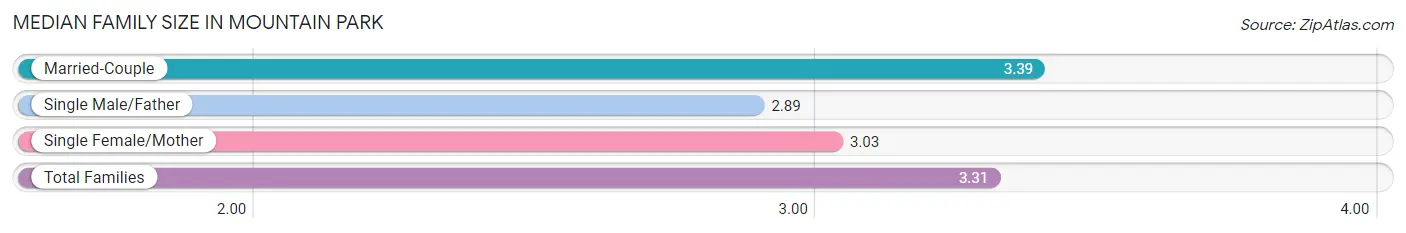
Median Family Size in Mountain Park
The median family size in Mountain Park is 3.31 persons per family, with married-couple families (2,840 | 81.5%) accounting for the largest median family size of 3.39 persons per family. On the other hand, single male/father families (283 | 8.1%) represent the smallest median family size with 2.89 persons per family.
| Family Type | # Families | Family Size |
| Married-Couple | 2,840 (81.5%) | 3.39 |
| Single Male/Father | 283 (8.1%) | 2.89 |
| Single Female/Mother | 363 (10.4%) | 3.03 |
| Total Families | 3,486 (100.0%) | 3.31 |
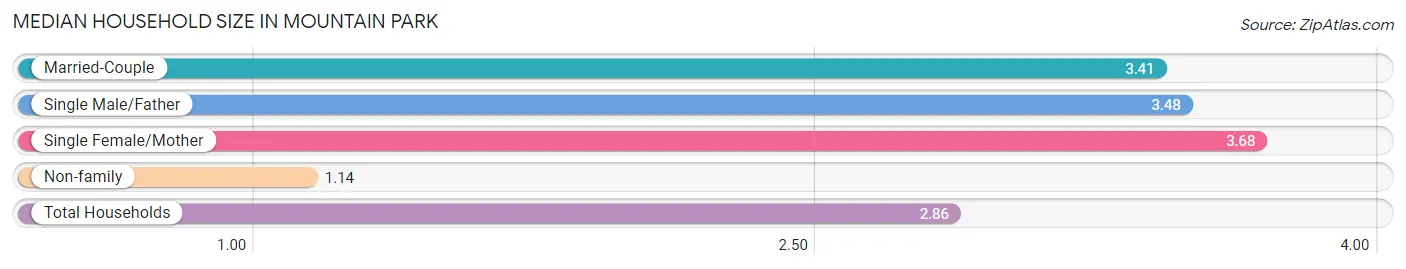
Median Household Size in Mountain Park
The median household size in Mountain Park is 2.86 persons per household, with single female/mother households (363 | 7.8%) accounting for the largest median household size of 3.68 persons per household. non-family households (1,164 | 25.0%) represent the smallest median household size with 1.14 persons per household.
| Household Type | # Households | Household Size |
| Married-Couple | 2,840 (61.1%) | 3.41 |
| Single Male/Father | 283 (6.1%) | 3.48 |
| Single Female/Mother | 363 (7.8%) | 3.68 |
| Non-family | 1,164 (25.0%) | 1.14 |
| Total Households | 4,650 (100.0%) | 2.86 |
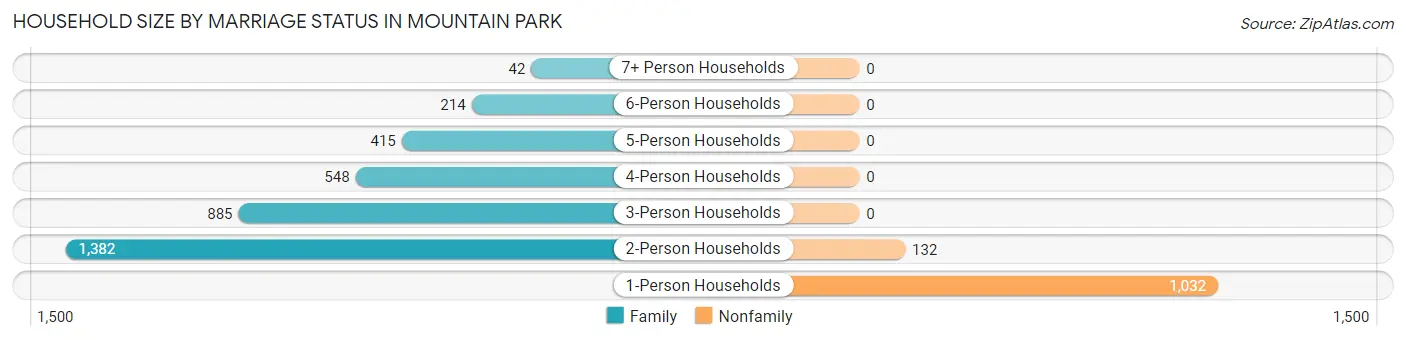
Household Size by Marriage Status in Mountain Park
Out of a total of 4,650 households in Mountain Park, 3,486 (75.0%) are family households, while 1,164 (25.0%) are nonfamily households. The most numerous type of family households are 2-person households, comprising 1,382, and the most common type of nonfamily households are 1-person households, comprising 1,032.
| Household Size | Family Households | Nonfamily Households |
| 1-Person Households | - | 1,032 (22.2%) |
| 2-Person Households | 1,382 (29.7%) | 132 (2.8%) |
| 3-Person Households | 885 (19.0%) | 0 (0.0%) |
| 4-Person Households | 548 (11.8%) | 0 (0.0%) |
| 5-Person Households | 415 (8.9%) | 0 (0.0%) |
| 6-Person Households | 214 (4.6%) | 0 (0.0%) |
| 7+ Person Households | 42 (0.9%) | 0 (0.0%) |
| Total | 3,486 (75.0%) | 1,164 (25.0%) |
Female Fertility in Mountain Park
Fertility by Age in Mountain Park
Average fertility rate in Mountain Park is 36.0 births per 1,000 women. Women in the age bracket of 35 to 50 years have the highest fertility rate with 46.0 births per 1,000 women. Women in the age bracket of 35 to 50 years acount for 67.7% of all women with births.
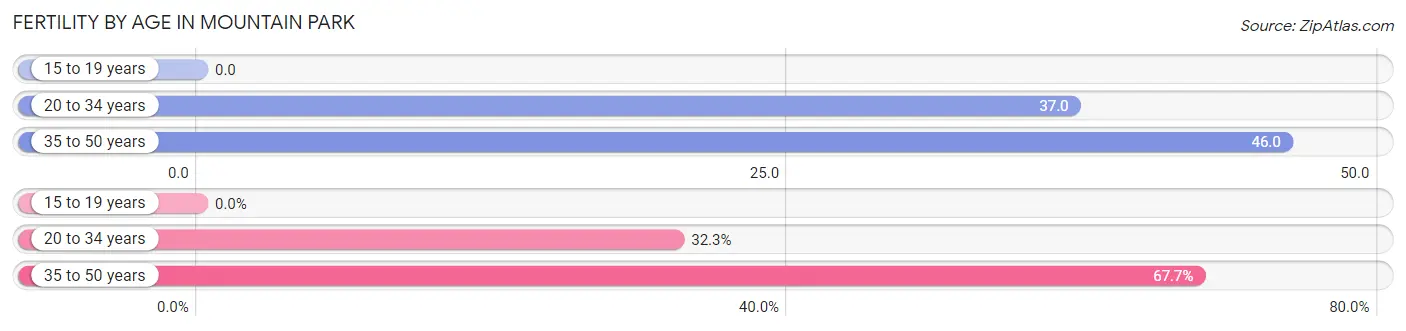
| Age Bracket | Women with Births | Births / 1,000 Women |
| 15 to 19 years | 0 (0.0%) | 0.0 |
| 20 to 34 years | 32 (32.3%) | 37.0 |
| 35 to 50 years | 67 (67.7%) | 46.0 |
| Total | 99 (100.0%) | 36.0 |
Fertility by Age by Marriage Status in Mountain Park
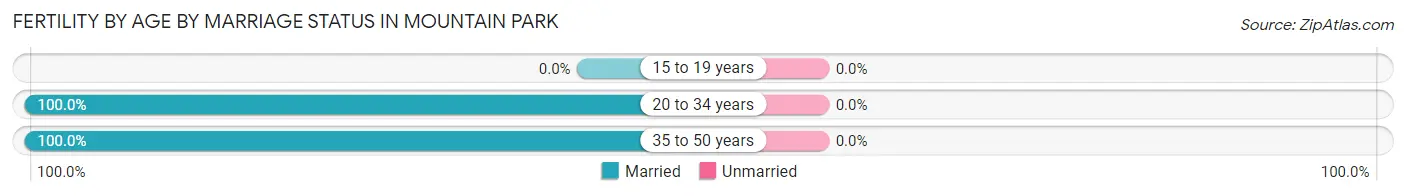
| Age Bracket | Married | Unmarried |
| 15 to 19 years | 0 (0.0%) | 0 (0.0%) |
| 20 to 34 years | 32 (100.0%) | 0 (0.0%) |
| 35 to 50 years | 67 (100.0%) | 0 (0.0%) |
| Total | 99 (100.0%) | 0 (0.0%) |
Fertility by Education in Mountain Park
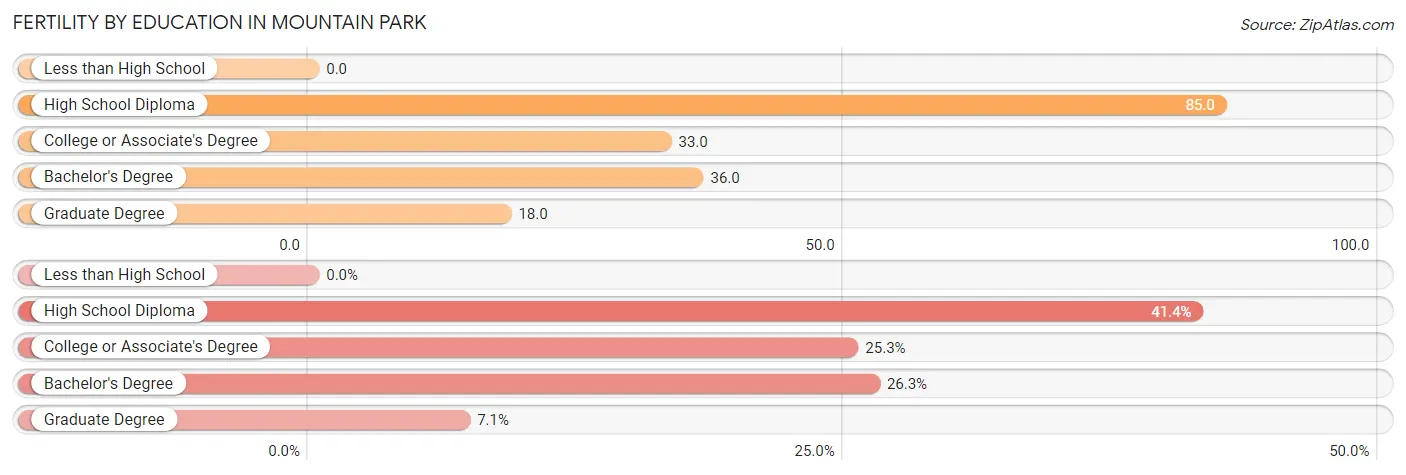
| Educational Attainment | Women with Births | Births / 1,000 Women |
| Less than High School | 0 (0.0%) | 0.0 |
| High School Diploma | 41 (41.4%) | 85.0 |
| College or Associate's Degree | 25 (25.3%) | 33.0 |
| Bachelor's Degree | 26 (26.3%) | 36.0 |
| Graduate Degree | 7 (7.1%) | 18.0 |
| Total | 99 (100.0%) | 36.0 |
Fertility by Education by Marriage Status in Mountain Park
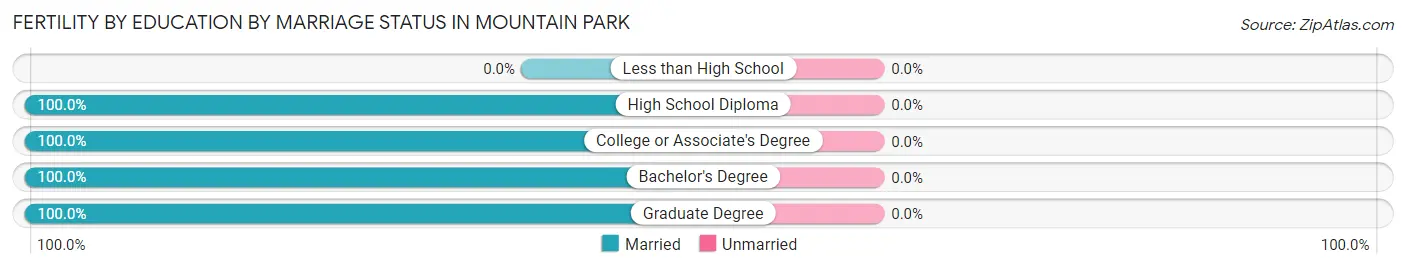
| Educational Attainment | Married | Unmarried |
| Less than High School | 0 (0.0%) | 0 (0.0%) |
| High School Diploma | 41 (100.0%) | 0 (0.0%) |
| College or Associate's Degree | 25 (100.0%) | 0 (0.0%) |
| Bachelor's Degree | 26 (100.0%) | 0 (0.0%) |
| Graduate Degree | 7 (100.0%) | 0 (0.0%) |
| Total | 99 (100.0%) | 0 (0.0%) |
Income in Mountain Park
Income Overview in Mountain Park
Per Capita Income in Mountain Park is $35,821, while median incomes of families and households are $96,090 and $92,718 respectively.
| Characteristic | Number | Measure |
| Per Capita Income | 13,334 | $35,821 |
| Median Family Income | 3,486 | $96,090 |
| Mean Family Income | 3,486 | $111,099 |
| Median Household Income | 4,650 | $92,718 |
| Mean Household Income | 4,650 | $99,184 |
| Income Deficit | 3,486 | $0 |
| Wage / Income Gap (%) | 13,334 | 18.78% |
| Wage / Income Gap ($) | 13,334 | 81.22¢ per $1 |
| Gini / Inequality Index | 13,334 | 0.39 |
Earnings by Sex in Mountain Park
Average Earnings in Mountain Park are $46,237, $51,286 for men and $41,654 for women, a difference of 18.8%.
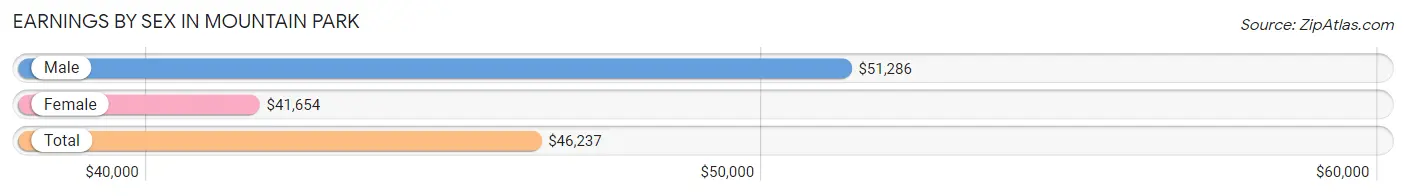
| Sex | Number | Average Earnings |
| Male | 3,964 (55.5%) | $51,286 |
| Female | 3,177 (44.5%) | $41,654 |
| Total | 7,141 (100.0%) | $46,237 |
Earnings by Sex by Income Bracket in Mountain Park
The most common earnings brackets in Mountain Park are $100,000+ for men (611 | 15.4%) and $50,000 to $54,999 for women (321 | 10.1%).
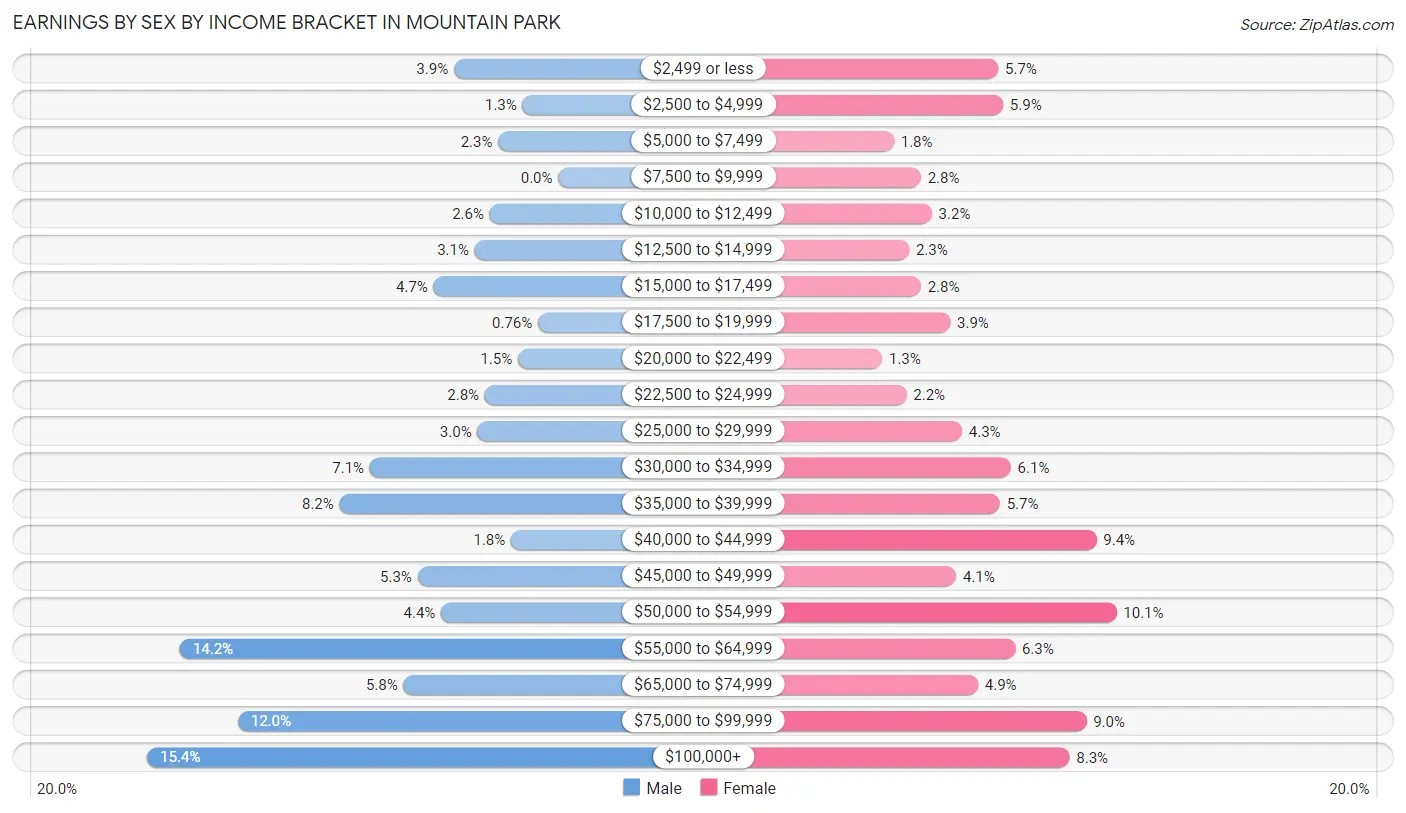
| Income | Male | Female |
| $2,499 or less | 155 (3.9%) | 180 (5.7%) |
| $2,500 to $4,999 | 53 (1.3%) | 186 (5.9%) |
| $5,000 to $7,499 | 89 (2.2%) | 56 (1.8%) |
| $7,500 to $9,999 | 0 (0.0%) | 88 (2.8%) |
| $10,000 to $12,499 | 102 (2.6%) | 101 (3.2%) |
| $12,500 to $14,999 | 124 (3.1%) | 74 (2.3%) |
| $15,000 to $17,499 | 185 (4.7%) | 88 (2.8%) |
| $17,500 to $19,999 | 30 (0.8%) | 123 (3.9%) |
| $20,000 to $22,499 | 60 (1.5%) | 42 (1.3%) |
| $22,500 to $24,999 | 109 (2.8%) | 71 (2.2%) |
| $25,000 to $29,999 | 120 (3.0%) | 137 (4.3%) |
| $30,000 to $34,999 | 280 (7.1%) | 195 (6.1%) |
| $35,000 to $39,999 | 325 (8.2%) | 182 (5.7%) |
| $40,000 to $44,999 | 70 (1.8%) | 297 (9.3%) |
| $45,000 to $49,999 | 209 (5.3%) | 130 (4.1%) |
| $50,000 to $54,999 | 174 (4.4%) | 321 (10.1%) |
| $55,000 to $64,999 | 562 (14.2%) | 200 (6.3%) |
| $65,000 to $74,999 | 230 (5.8%) | 156 (4.9%) |
| $75,000 to $99,999 | 476 (12.0%) | 285 (9.0%) |
| $100,000+ | 611 (15.4%) | 265 (8.3%) |
| Total | 3,964 (100.0%) | 3,177 (100.0%) |
Earnings by Sex by Educational Attainment in Mountain Park
Average earnings in Mountain Park are $55,833 for men and $45,944 for women, a difference of 17.7%. Men with an educational attainment of bachelor's degree enjoy the highest average annual earnings of $68,672, while those with less than high school education earn the least with $33,427. Women with an educational attainment of graduate degree earn the most with the average annual earnings of $66,302, while those with less than high school education have the smallest earnings of $17,917.
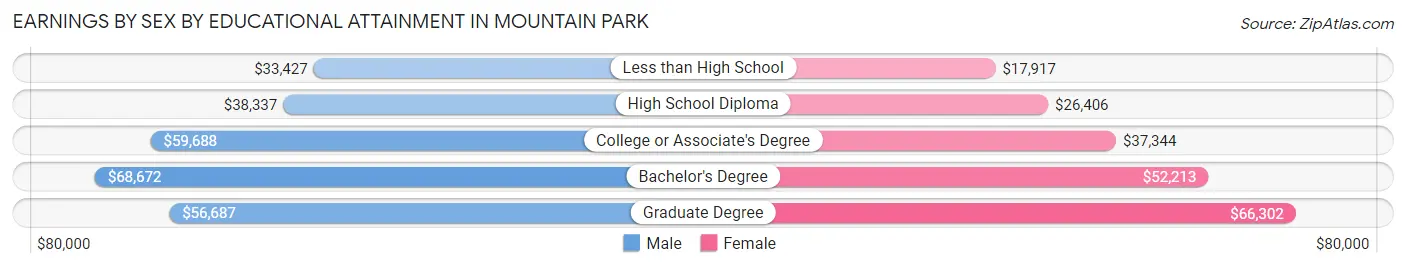
| Educational Attainment | Male Income | Female Income |
| Less than High School | $33,427 | $17,917 |
| High School Diploma | $38,337 | $26,406 |
| College or Associate's Degree | $59,688 | $37,344 |
| Bachelor's Degree | $68,672 | $52,213 |
| Graduate Degree | $56,687 | $66,302 |
| Total | $55,833 | $45,944 |
Family Income in Mountain Park
Family Income Brackets in Mountain Park
According to the Mountain Park family income data, there are 816 families falling into the $100,000 to $149,999 income range, which is the most common income bracket and makes up 23.4% of all families.
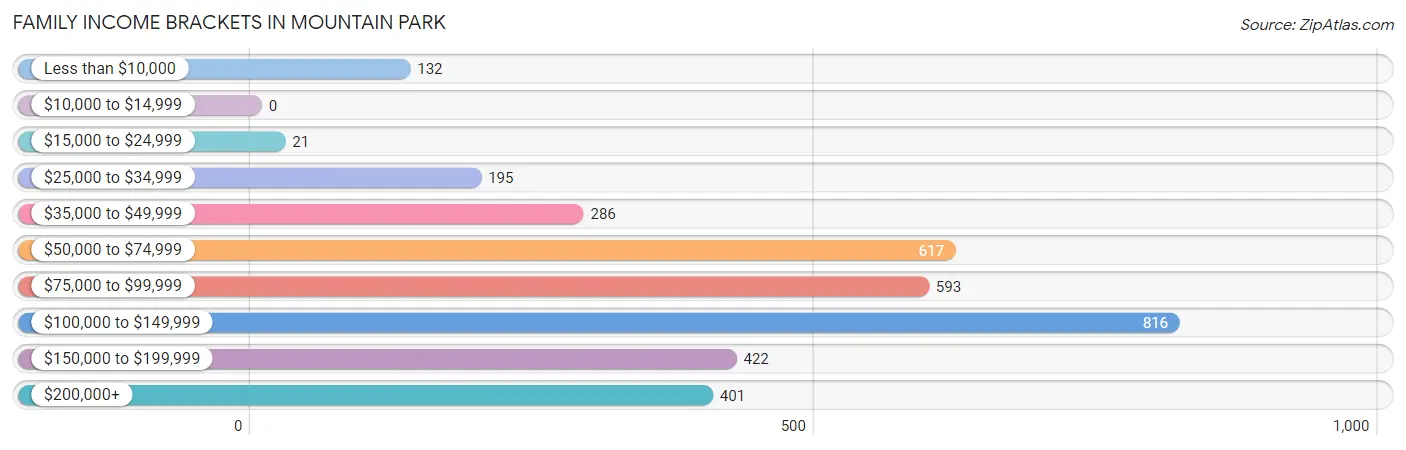
| Income Bracket | # Families | % Families |
| Less than $10,000 | 132 | 3.8% |
| $10,000 to $14,999 | 0 | 0.0% |
| $15,000 to $24,999 | 21 | 0.6% |
| $25,000 to $34,999 | 195 | 5.6% |
| $35,000 to $49,999 | 286 | 8.2% |
| $50,000 to $74,999 | 617 | 17.7% |
| $75,000 to $99,999 | 593 | 17.0% |
| $100,000 to $149,999 | 816 | 23.4% |
| $150,000 to $199,999 | 422 | 12.1% |
| $200,000+ | 401 | 11.5% |
Family Income by Famaliy Size in Mountain Park
4-person families (489 | 14.0%) account for the highest median family income in Mountain Park with $124,018 per family, while 2-person families (1,514 | 43.4%) have the highest median income of $41,979 per family member.
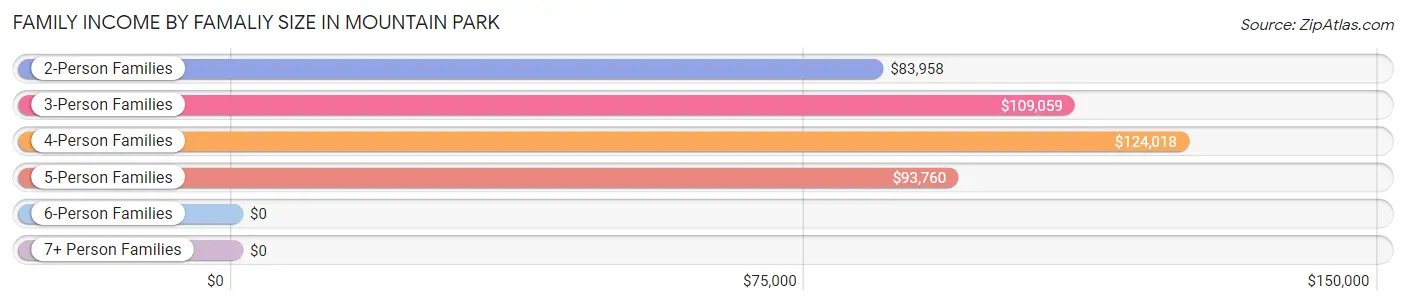
| Income Bracket | # Families | Median Income |
| 2-Person Families | 1,514 (43.4%) | $83,958 |
| 3-Person Families | 883 (25.3%) | $109,059 |
| 4-Person Families | 489 (14.0%) | $124,018 |
| 5-Person Families | 384 (11.0%) | $93,760 |
| 6-Person Families | 174 (5.0%) | $0 |
| 7+ Person Families | 42 (1.2%) | $0 |
| Total | 3,486 (100.0%) | $96,090 |
Family Income by Number of Earners in Mountain Park
The median family income in Mountain Park is $96,090, with families comprising 3+ earners (572) having the highest median family income of $118,500, while families with no earners (493) have the lowest median family income of $58,750, accounting for 16.4% and 14.1% of families, respectively.
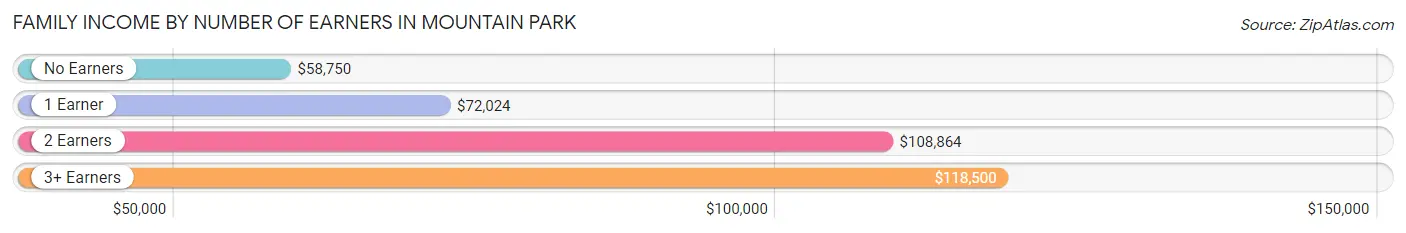
| Number of Earners | # Families | Median Income |
| No Earners | 493 (14.1%) | $58,750 |
| 1 Earner | 932 (26.7%) | $72,024 |
| 2 Earners | 1,489 (42.7%) | $108,864 |
| 3+ Earners | 572 (16.4%) | $118,500 |
| Total | 3,486 (100.0%) | $96,090 |
Household Income in Mountain Park
Household Income Brackets in Mountain Park
With 1,000 households falling in the category, the $100,000 to $149,999 income range is the most frequent in Mountain Park, accounting for 21.5% of all households. In contrast, only 158 households (3.4%) fall into the less than $10,000 income bracket, making it the least populous group.
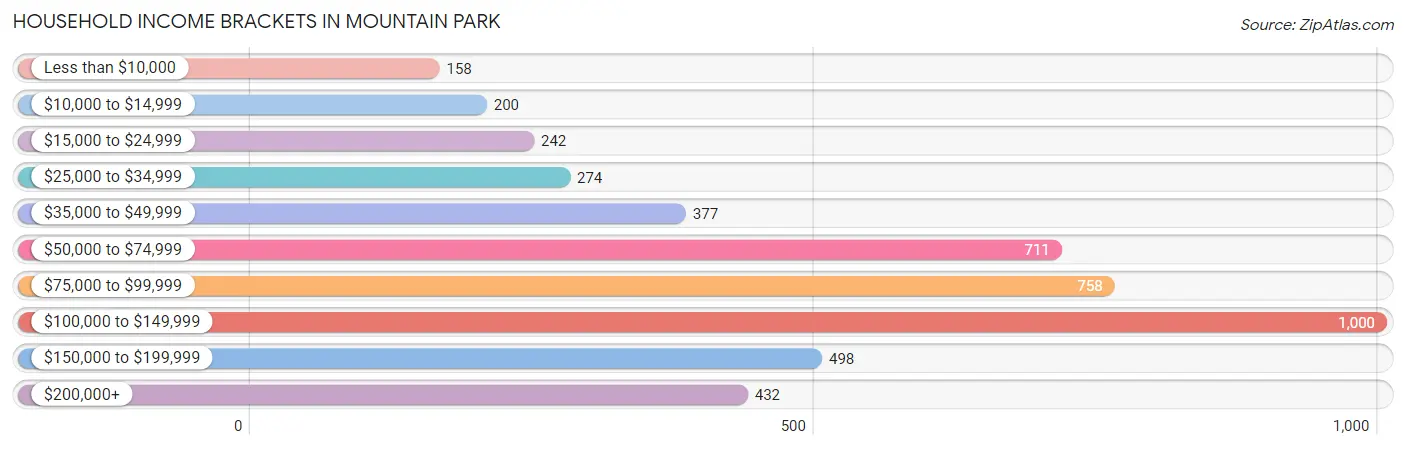
| Income Bracket | # Households | % Households |
| Less than $10,000 | 158 | 3.4% |
| $10,000 to $14,999 | 200 | 4.3% |
| $15,000 to $24,999 | 242 | 5.2% |
| $25,000 to $34,999 | 274 | 5.9% |
| $35,000 to $49,999 | 377 | 8.1% |
| $50,000 to $74,999 | 711 | 15.3% |
| $75,000 to $99,999 | 758 | 16.3% |
| $100,000 to $149,999 | 1,000 | 21.5% |
| $150,000 to $199,999 | 498 | 10.7% |
| $200,000+ | 432 | 9.3% |
Household Income by Householder Age in Mountain Park
The median household income in Mountain Park is $92,718, with the highest median household income of $102,575 found in the 45 to 64 years age bracket for the primary householder. A total of 2,292 households (49.3%) fall into this category.
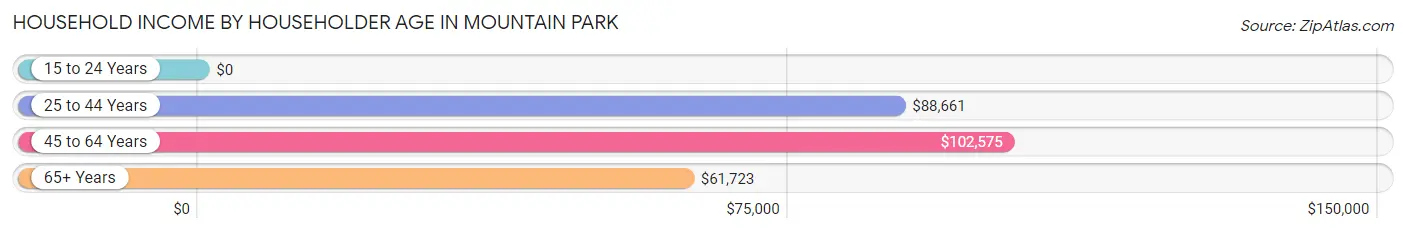
| Income Bracket | # Households | Median Income |
| 15 to 24 Years | 0 (0.0%) | $0 |
| 25 to 44 Years | 987 (21.2%) | $88,661 |
| 45 to 64 Years | 2,292 (49.3%) | $102,575 |
| 65+ Years | 1,371 (29.5%) | $61,723 |
| Total | 4,650 (100.0%) | $92,718 |
Poverty in Mountain Park
Income Below Poverty by Sex and Age in Mountain Park
With 8.2% poverty level for males and 7.7% for females among the residents of Mountain Park, 75 year old and over males and 12 to 14 year old females are the most vulnerable to poverty, with 185 males (32.5%) and 43 females (23.2%) in their respective age groups living below the poverty level.
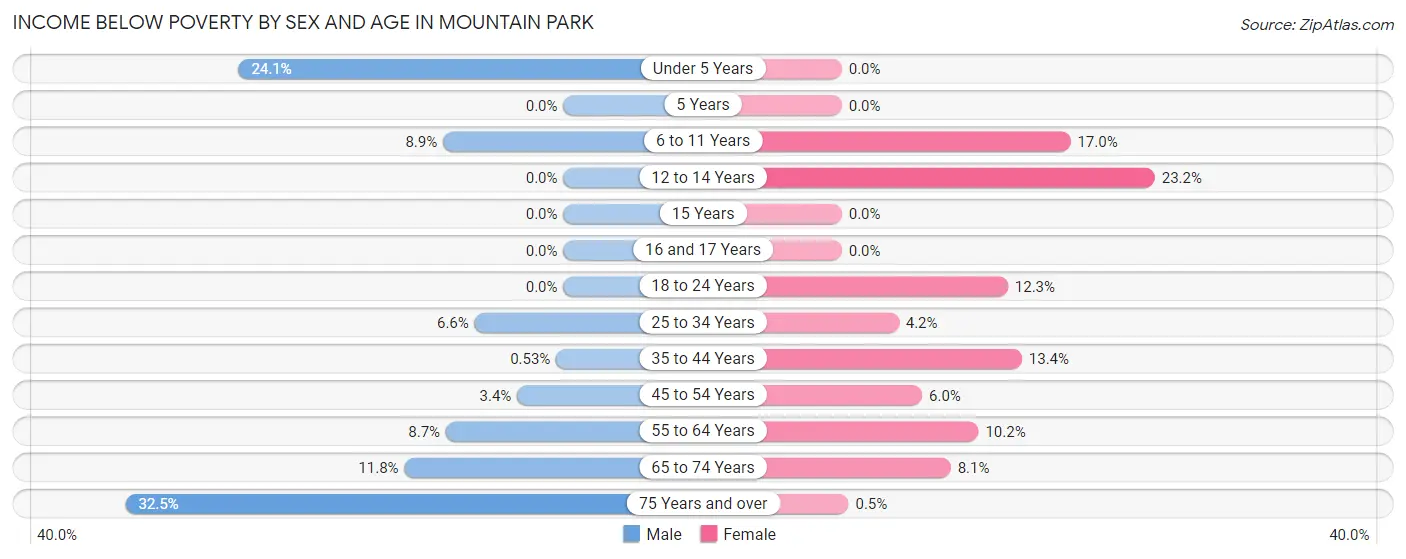
| Age Bracket | Male | Female |
| Under 5 Years | 75 (24.1%) | 0 (0.0%) |
| 5 Years | 0 (0.0%) | 0 (0.0%) |
| 6 to 11 Years | 40 (8.9%) | 36 (17.0%) |
| 12 to 14 Years | 0 (0.0%) | 43 (23.2%) |
| 15 Years | 0 (0.0%) | 0 (0.0%) |
| 16 and 17 Years | 0 (0.0%) | 0 (0.0%) |
| 18 to 24 Years | 0 (0.0%) | 54 (12.3%) |
| 25 to 34 Years | 57 (6.6%) | 24 (4.2%) |
| 35 to 44 Years | 3 (0.5%) | 96 (13.4%) |
| 45 to 54 Years | 41 (3.4%) | 69 (6.0%) |
| 55 to 64 Years | 101 (8.7%) | 80 (10.2%) |
| 65 to 74 Years | 87 (11.8%) | 66 (8.1%) |
| 75 Years and over | 185 (32.5%) | 2 (0.5%) |
| Total | 589 (8.2%) | 470 (7.7%) |
Income Above Poverty by Sex and Age in Mountain Park
According to the poverty statistics in Mountain Park, males aged 5 years and females aged under 5 years are the age groups that are most secure financially, with 100.0% of males and 100.0% of females in these age groups living above the poverty line.
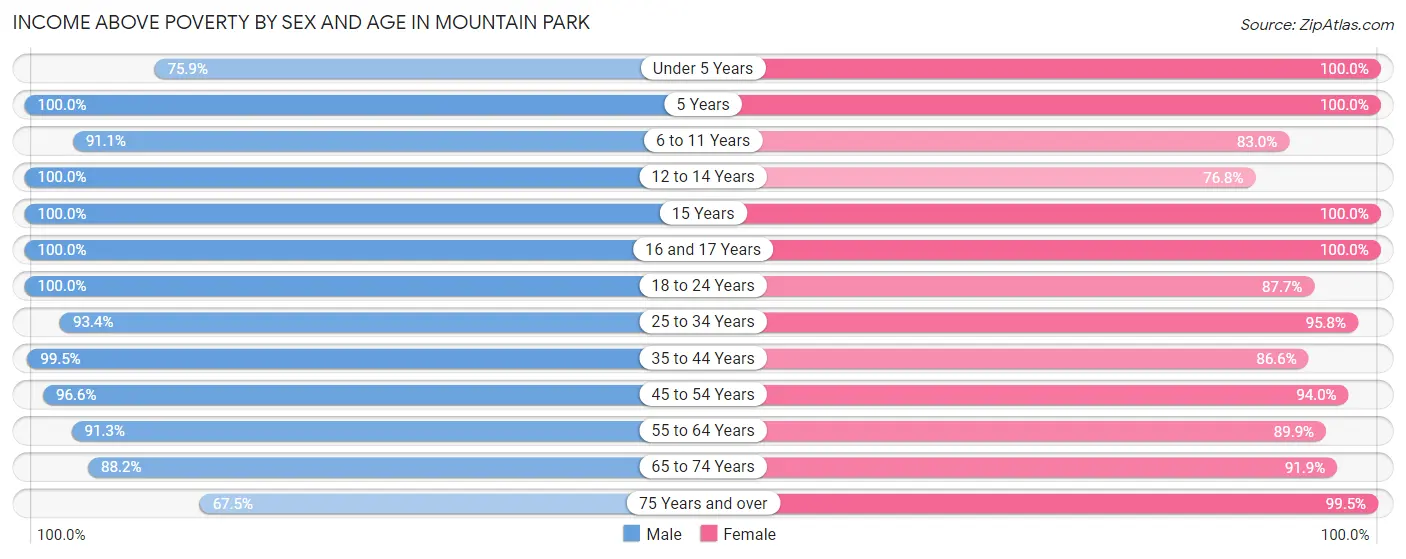
| Age Bracket | Male | Female |
| Under 5 Years | 236 (75.9%) | 386 (100.0%) |
| 5 Years | 62 (100.0%) | 141 (100.0%) |
| 6 to 11 Years | 408 (91.1%) | 176 (83.0%) |
| 12 to 14 Years | 369 (100.0%) | 142 (76.8%) |
| 15 Years | 7 (100.0%) | 94 (100.0%) |
| 16 and 17 Years | 450 (100.0%) | 188 (100.0%) |
| 18 to 24 Years | 487 (100.0%) | 384 (87.7%) |
| 25 to 34 Years | 808 (93.4%) | 543 (95.8%) |
| 35 to 44 Years | 564 (99.5%) | 622 (86.6%) |
| 45 to 54 Years | 1,155 (96.6%) | 1,088 (94.0%) |
| 55 to 64 Years | 1,057 (91.3%) | 708 (89.8%) |
| 65 to 74 Years | 650 (88.2%) | 750 (91.9%) |
| 75 Years and over | 384 (67.5%) | 402 (99.5%) |
| Total | 6,637 (91.8%) | 5,624 (92.3%) |
Income Below Poverty Among Married-Couple Families in Mountain Park
The poverty statistics for married-couple families in Mountain Park show that 4.2% or 118 of the total 2,840 families live below the poverty line. Families with 3 or 4 children have the highest poverty rate of 21.0%, comprising of 40 families. On the other hand, families with 1 or 2 children have the lowest poverty rate of 0.0%, which includes 0 families.
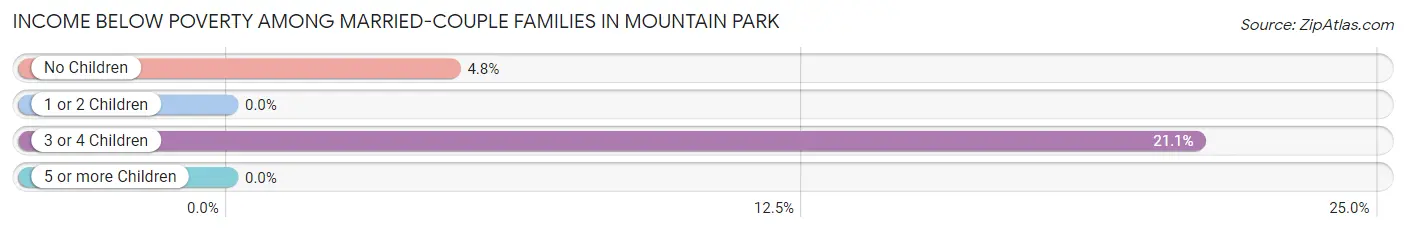
| Children | Above Poverty | Below Poverty |
| No Children | 1,535 (95.2%) | 78 (4.8%) |
| 1 or 2 Children | 1,014 (100.0%) | 0 (0.0%) |
| 3 or 4 Children | 150 (78.9%) | 40 (21.0%) |
| 5 or more Children | 23 (100.0%) | 0 (0.0%) |
| Total | 2,722 (95.9%) | 118 (4.2%) |
Income Below Poverty Among Single-Parent Households in Mountain Park
According to the poverty data in Mountain Park, 1.8% or 5 single-father households and 15.1% or 55 single-mother households are living below the poverty line. Among single-father households, those with no children have the highest poverty rate, with 5 households (4.0%) experiencing poverty. Likewise, among single-mother households, those with 1 or 2 children have the highest poverty rate, with 55 households (32.4%) falling below the poverty line.
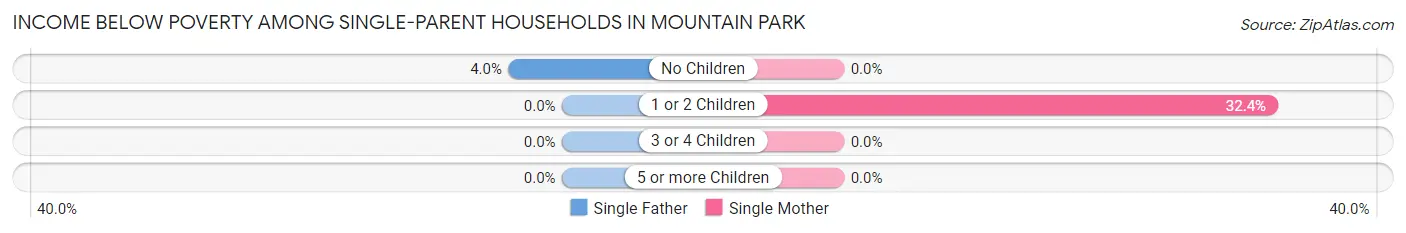
| Children | Single Father | Single Mother |
| No Children | 5 (4.0%) | 0 (0.0%) |
| 1 or 2 Children | 0 (0.0%) | 55 (32.4%) |
| 3 or 4 Children | 0 (0.0%) | 0 (0.0%) |
| 5 or more Children | 0 (0.0%) | 0 (0.0%) |
| Total | 5 (1.8%) | 55 (15.1%) |
Income Below Poverty Among Married-Couple vs Single-Parent Households in Mountain Park
The poverty data for Mountain Park shows that 118 of the married-couple family households (4.2%) and 60 of the single-parent households (9.3%) are living below the poverty level. Within the married-couple family households, those with 3 or 4 children have the highest poverty rate, with 40 households (21.0%) falling below the poverty line. Among the single-parent households, those with 1 or 2 children have the highest poverty rate, with 55 household (17.6%) living below poverty.
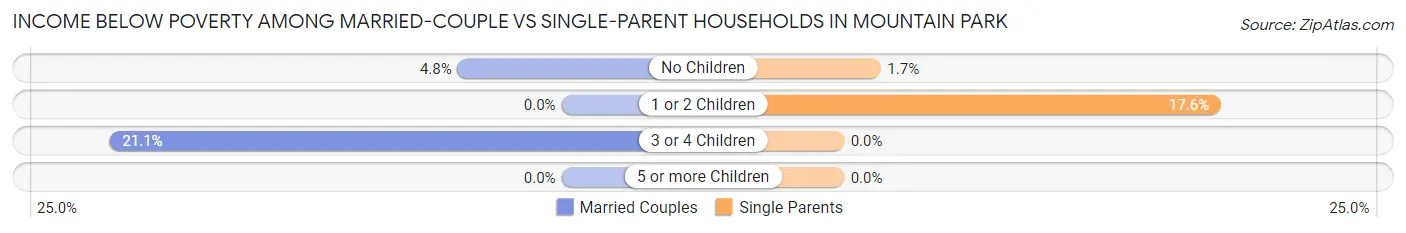
| Children | Married-Couple Families | Single-Parent Households |
| No Children | 78 (4.8%) | 5 (1.7%) |
| 1 or 2 Children | 0 (0.0%) | 55 (17.6%) |
| 3 or 4 Children | 40 (21.0%) | 0 (0.0%) |
| 5 or more Children | 0 (0.0%) | 0 (0.0%) |
| Total | 118 (4.2%) | 60 (9.3%) |
Employment Characteristics in Mountain Park
Employment by Class of Employer in Mountain Park
Among the 6,018 employed individuals in Mountain Park, private company employees (3,861 | 64.2%), not-for-profit organizations (627 | 10.4%), and self-employed (not incorporated) (407 | 6.8%) make up the most common classes of employment.
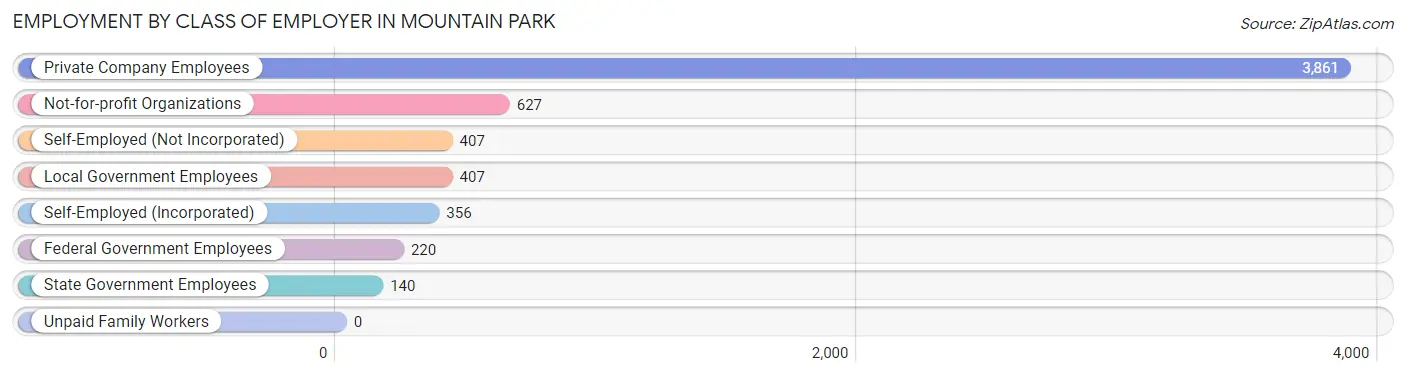
| Employer Class | # Employees | % Employees |
| Private Company Employees | 3,861 | 64.2% |
| Self-Employed (Incorporated) | 356 | 5.9% |
| Self-Employed (Not Incorporated) | 407 | 6.8% |
| Not-for-profit Organizations | 627 | 10.4% |
| Local Government Employees | 407 | 6.8% |
| State Government Employees | 140 | 2.3% |
| Federal Government Employees | 220 | 3.7% |
| Unpaid Family Workers | 0 | 0.0% |
| Total | 6,018 | 100.0% |
Employment Status by Age in Mountain Park
According to the labor force statistics for Mountain Park, out of the total population over 16 years of age (11,105), 60.9% or 6,763 individuals are in the labor force, with 3.2% or 216 of them unemployed. The age group with the highest labor force participation rate is 45 to 54 years, with 87.8% or 2,066 individuals in the labor force. Within the labor force, the 20 to 24 years age range has the highest percentage of unemployed individuals, with 6.1% or 30 of them being unemployed.
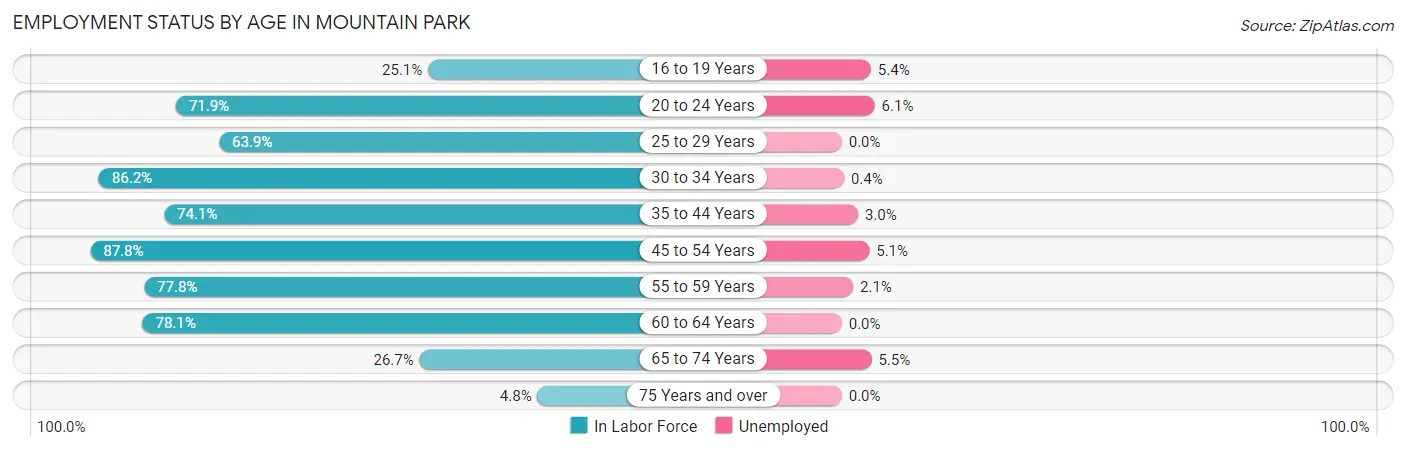
| Age Bracket | In Labor Force | Unemployed |
| 16 to 19 Years | 221 (25.1%) | 12 (5.4%) |
| 20 to 24 Years | 491 (71.9%) | 30 (6.1%) |
| 25 to 29 Years | 504 (63.9%) | 0 (0.0%) |
| 30 to 34 Years | 554 (86.2%) | 2 (0.4%) |
| 35 to 44 Years | 952 (74.1%) | 29 (3.0%) |
| 45 to 54 Years | 2,066 (87.8%) | 105 (5.1%) |
| 55 to 59 Years | 769 (77.8%) | 16 (2.1%) |
| 60 to 64 Years | 748 (78.1%) | 0 (0.0%) |
| 65 to 74 Years | 415 (26.7%) | 23 (5.5%) |
| 75 Years and over | 47 (4.8%) | 0 (0.0%) |
| Total | 6,763 (60.9%) | 216 (3.2%) |
Employment Status by Educational Attainment in Mountain Park
According to labor force statistics for Mountain Park, 79.7% of individuals (5,592) out of the total population between 25 and 64 years of age (7,016) are in the labor force, with 2.7% or 151 of them being unemployed. The group with the highest labor force participation rate are those with the educational attainment of bachelor's degree or higher, with 88.6% or 3,128 individuals in the labor force. Within the labor force, individuals with less than high school education have the highest percentage of unemployment, with 12.1% or 56 of them being unemployed.
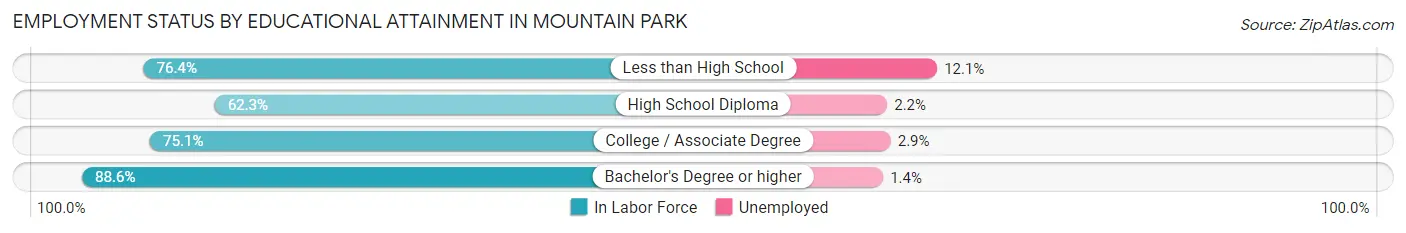
| Educational Attainment | In Labor Force | Unemployed |
| Less than High School | 463 (76.4%) | 73 (12.1%) |
| High School Diploma | 782 (62.3%) | 28 (2.2%) |
| College / Associate Degree | 1,220 (75.1%) | 47 (2.9%) |
| Bachelor's Degree or higher | 3,128 (88.6%) | 49 (1.4%) |
| Total | 5,592 (79.7%) | 189 (2.7%) |
Employment Occupations by Sex in Mountain Park
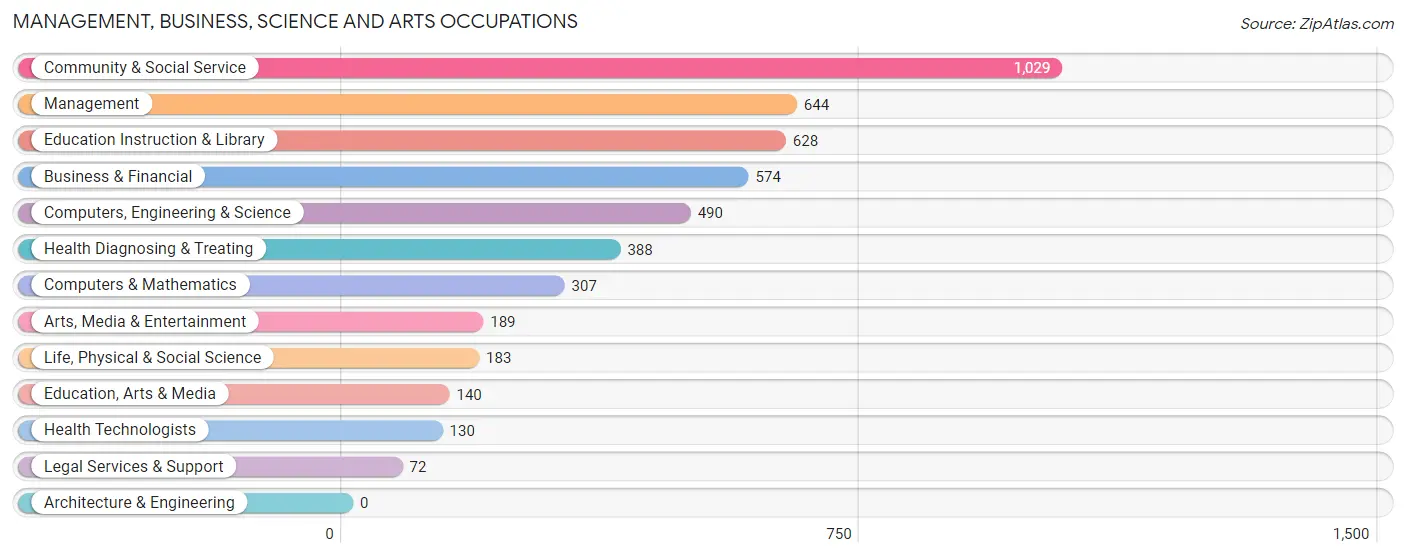
Management, Business, Science and Arts Occupations
The most common Management, Business, Science and Arts occupations in Mountain Park are Community & Social Service (1,029 | 15.7%), Management (644 | 9.8%), Education Instruction & Library (628 | 9.6%), Business & Financial (574 | 8.8%), and Computers, Engineering & Science (490 | 7.5%).
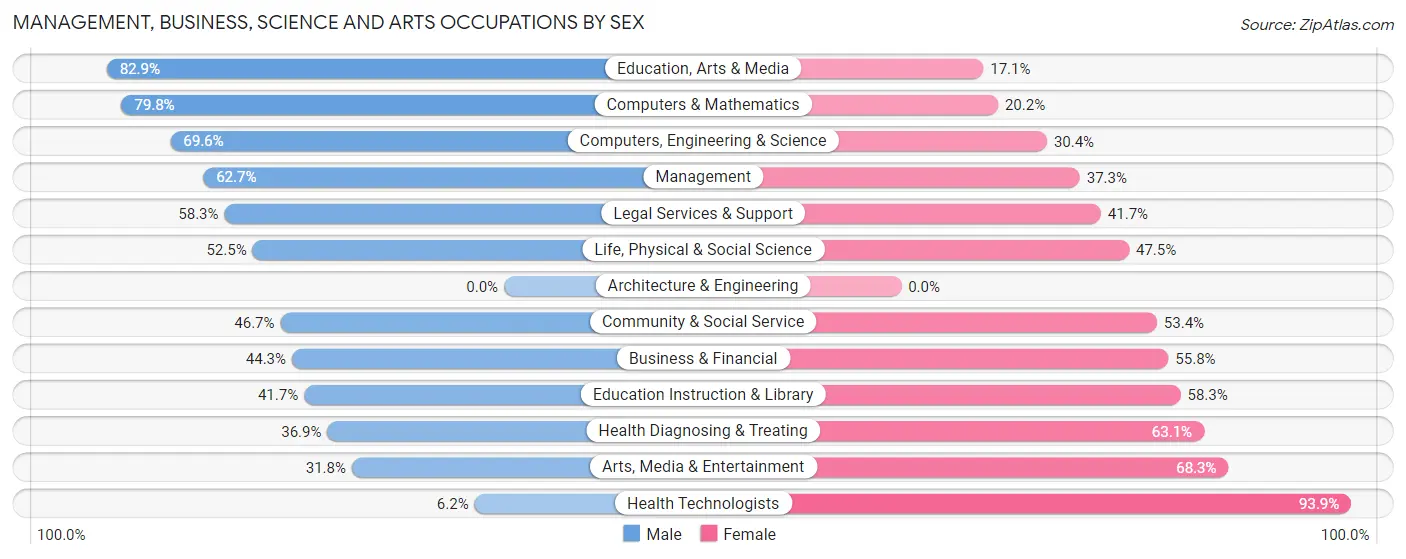
Management, Business, Science and Arts Occupations by Sex
Within the Management, Business, Science and Arts occupations in Mountain Park, the most male-oriented occupations are Education, Arts & Media (82.9%), Computers & Mathematics (79.8%), and Computers, Engineering & Science (69.6%), while the most female-oriented occupations are Health Technologists (93.9%), Arts, Media & Entertainment (68.2%), and Health Diagnosing & Treating (63.1%).
| Occupation | Male | Female |
| Management | 404 (62.7%) | 240 (37.3%) |
| Business & Financial | 254 (44.3%) | 320 (55.7%) |
| Computers, Engineering & Science | 341 (69.6%) | 149 (30.4%) |
| Computers & Mathematics | 245 (79.8%) | 62 (20.2%) |
| Architecture & Engineering | 0 (0.0%) | 0 (0.0%) |
| Life, Physical & Social Science | 96 (52.5%) | 87 (47.5%) |
| Community & Social Service | 480 (46.7%) | 549 (53.3%) |
| Education, Arts & Media | 116 (82.9%) | 24 (17.1%) |
| Legal Services & Support | 42 (58.3%) | 30 (41.7%) |
| Education Instruction & Library | 262 (41.7%) | 366 (58.3%) |
| Arts, Media & Entertainment | 60 (31.8%) | 129 (68.2%) |
| Health Diagnosing & Treating | 143 (36.9%) | 245 (63.1%) |
| Health Technologists | 8 (6.1%) | 122 (93.9%) |
| Total (Category) | 1,622 (51.9%) | 1,503 (48.1%) |
| Total (Overall) | 3,651 (55.8%) | 2,897 (44.2%) |
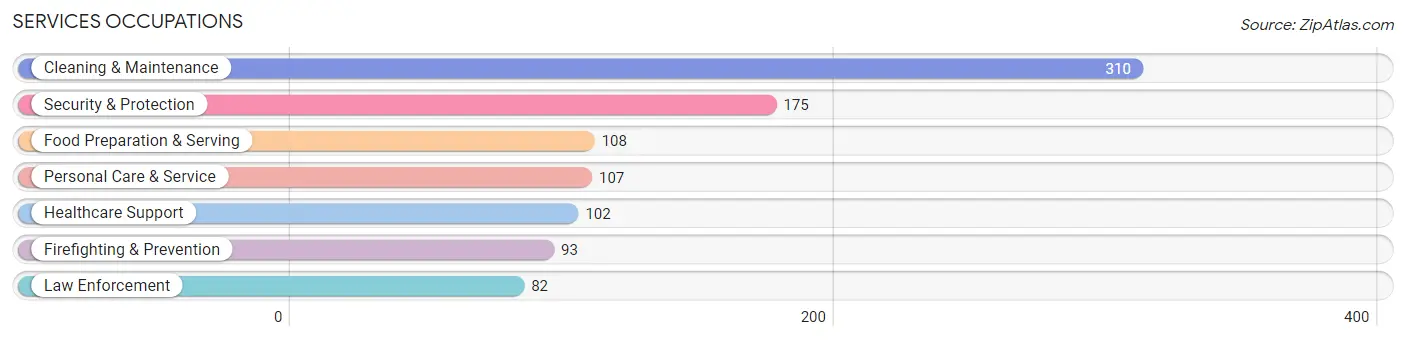
Services Occupations
The most common Services occupations in Mountain Park are Cleaning & Maintenance (310 | 4.7%), Security & Protection (175 | 2.7%), Food Preparation & Serving (108 | 1.7%), Personal Care & Service (107 | 1.6%), and Healthcare Support (102 | 1.6%).
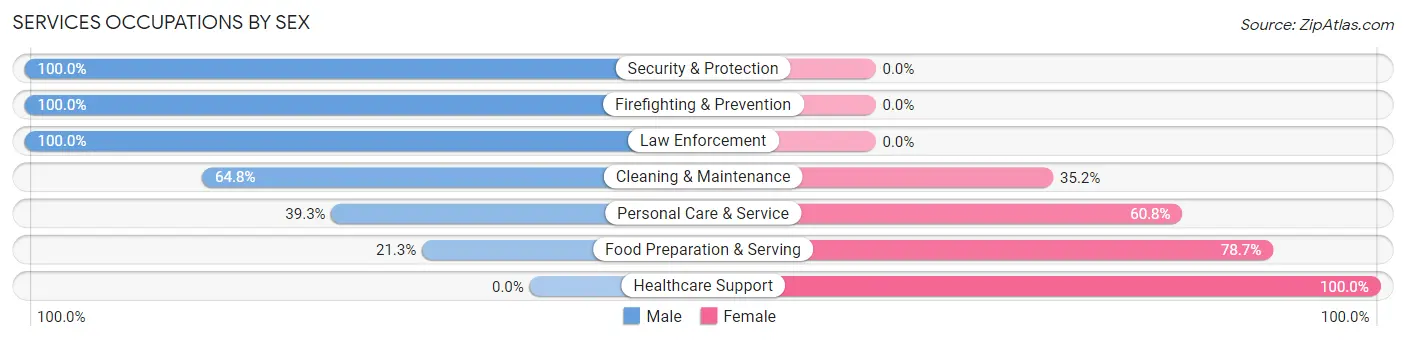
Services Occupations by Sex
Within the Services occupations in Mountain Park, the most male-oriented occupations are Security & Protection (100.0%), Firefighting & Prevention (100.0%), and Law Enforcement (100.0%), while the most female-oriented occupations are Healthcare Support (100.0%), Food Preparation & Serving (78.7%), and Personal Care & Service (60.8%).
| Occupation | Male | Female |
| Healthcare Support | 0 (0.0%) | 102 (100.0%) |
| Security & Protection | 175 (100.0%) | 0 (0.0%) |
| Firefighting & Prevention | 93 (100.0%) | 0 (0.0%) |
| Law Enforcement | 82 (100.0%) | 0 (0.0%) |
| Food Preparation & Serving | 23 (21.3%) | 85 (78.7%) |
| Cleaning & Maintenance | 201 (64.8%) | 109 (35.2%) |
| Personal Care & Service | 42 (39.3%) | 65 (60.8%) |
| Total (Category) | 441 (55.0%) | 361 (45.0%) |
| Total (Overall) | 3,651 (55.8%) | 2,897 (44.2%) |
Sales and Office Occupations
The most common Sales and Office occupations in Mountain Park are Office & Administration (670 | 10.2%), and Sales & Related (664 | 10.1%).
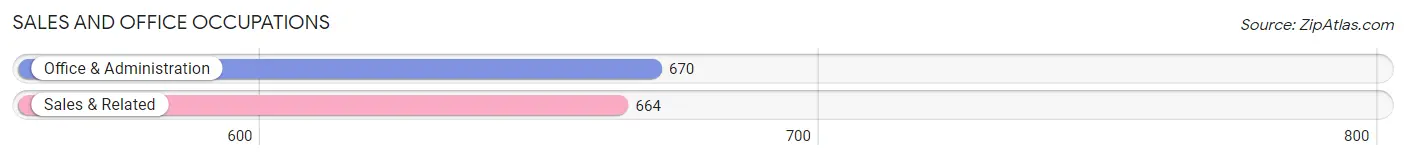
Sales and Office Occupations by Sex
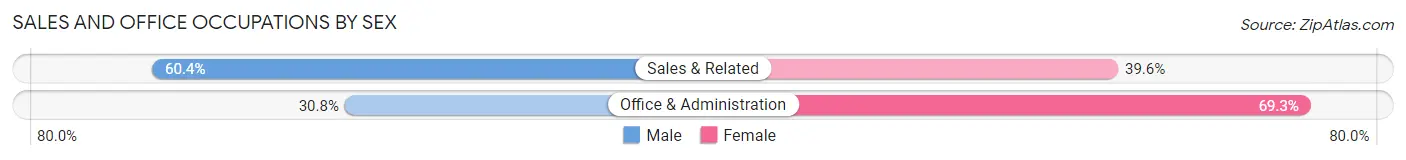
| Occupation | Male | Female |
| Sales & Related | 401 (60.4%) | 263 (39.6%) |
| Office & Administration | 206 (30.7%) | 464 (69.3%) |
| Total (Category) | 607 (45.5%) | 727 (54.5%) |
| Total (Overall) | 3,651 (55.8%) | 2,897 (44.2%) |
Natural Resources, Construction and Maintenance Occupations
The most common Natural Resources, Construction and Maintenance occupations in Mountain Park are Construction & Extraction (226 | 3.5%), and Installation, Maintenance & Repair (205 | 3.1%).
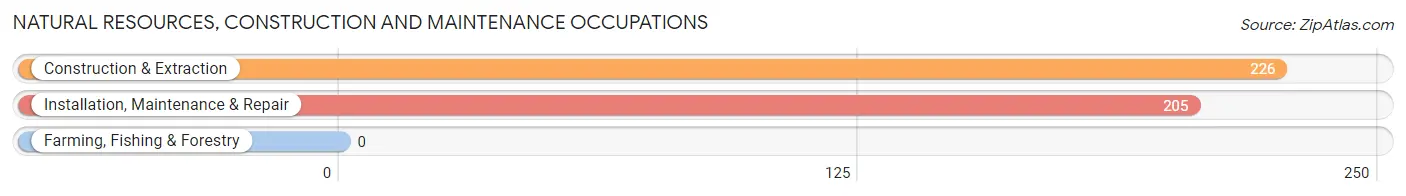
Natural Resources, Construction and Maintenance Occupations by Sex
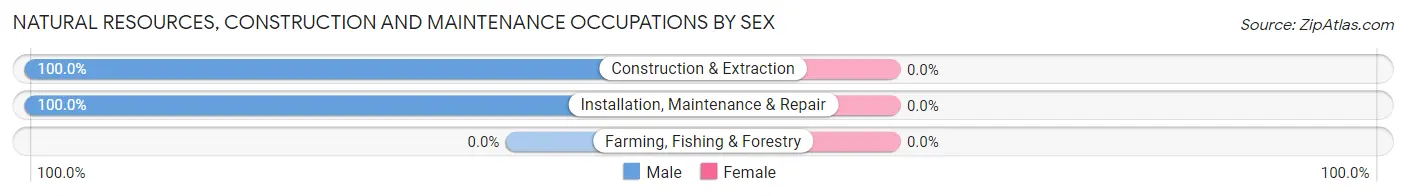
| Occupation | Male | Female |
| Farming, Fishing & Forestry | 0 (0.0%) | 0 (0.0%) |
| Construction & Extraction | 226 (100.0%) | 0 (0.0%) |
| Installation, Maintenance & Repair | 205 (100.0%) | 0 (0.0%) |
| Total (Category) | 431 (100.0%) | 0 (0.0%) |
| Total (Overall) | 3,651 (55.8%) | 2,897 (44.2%) |
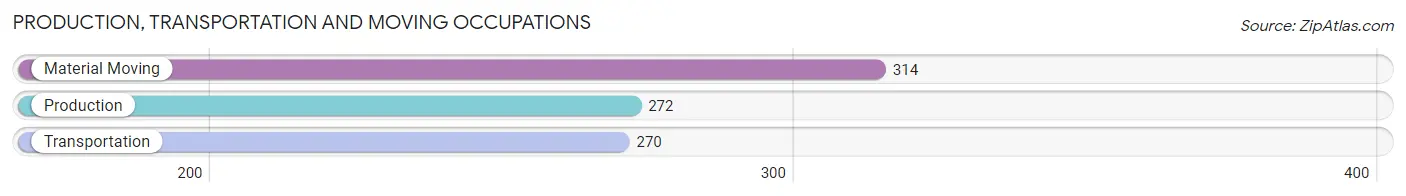
Production, Transportation and Moving Occupations
The most common Production, Transportation and Moving occupations in Mountain Park are Material Moving (314 | 4.8%), Production (272 | 4.2%), and Transportation (270 | 4.1%).
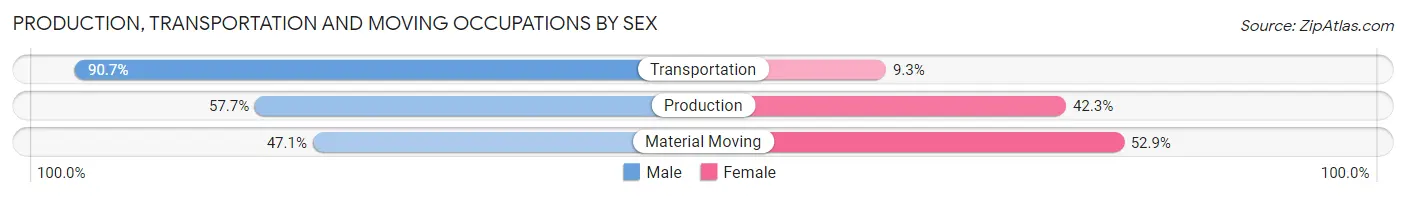
Production, Transportation and Moving Occupations by Sex
| Occupation | Male | Female |
| Production | 157 (57.7%) | 115 (42.3%) |
| Transportation | 245 (90.7%) | 25 (9.3%) |
| Material Moving | 148 (47.1%) | 166 (52.9%) |
| Total (Category) | 550 (64.2%) | 306 (35.7%) |
| Total (Overall) | 3,651 (55.8%) | 2,897 (44.2%) |
Employment Industries by Sex in Mountain Park
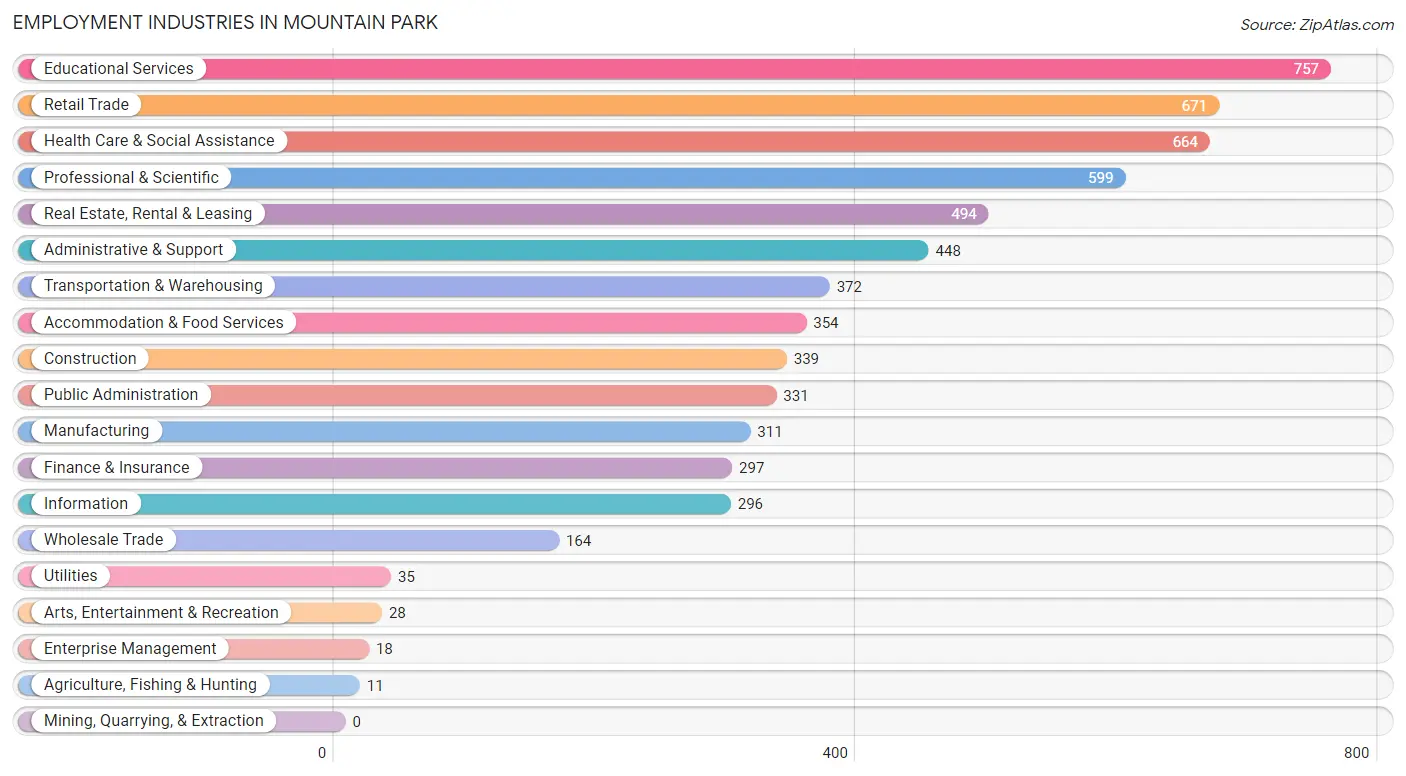
Employment Industries in Mountain Park
The major employment industries in Mountain Park include Educational Services (757 | 11.6%), Retail Trade (671 | 10.2%), Health Care & Social Assistance (664 | 10.1%), Professional & Scientific (599 | 9.1%), and Real Estate, Rental & Leasing (494 | 7.5%).
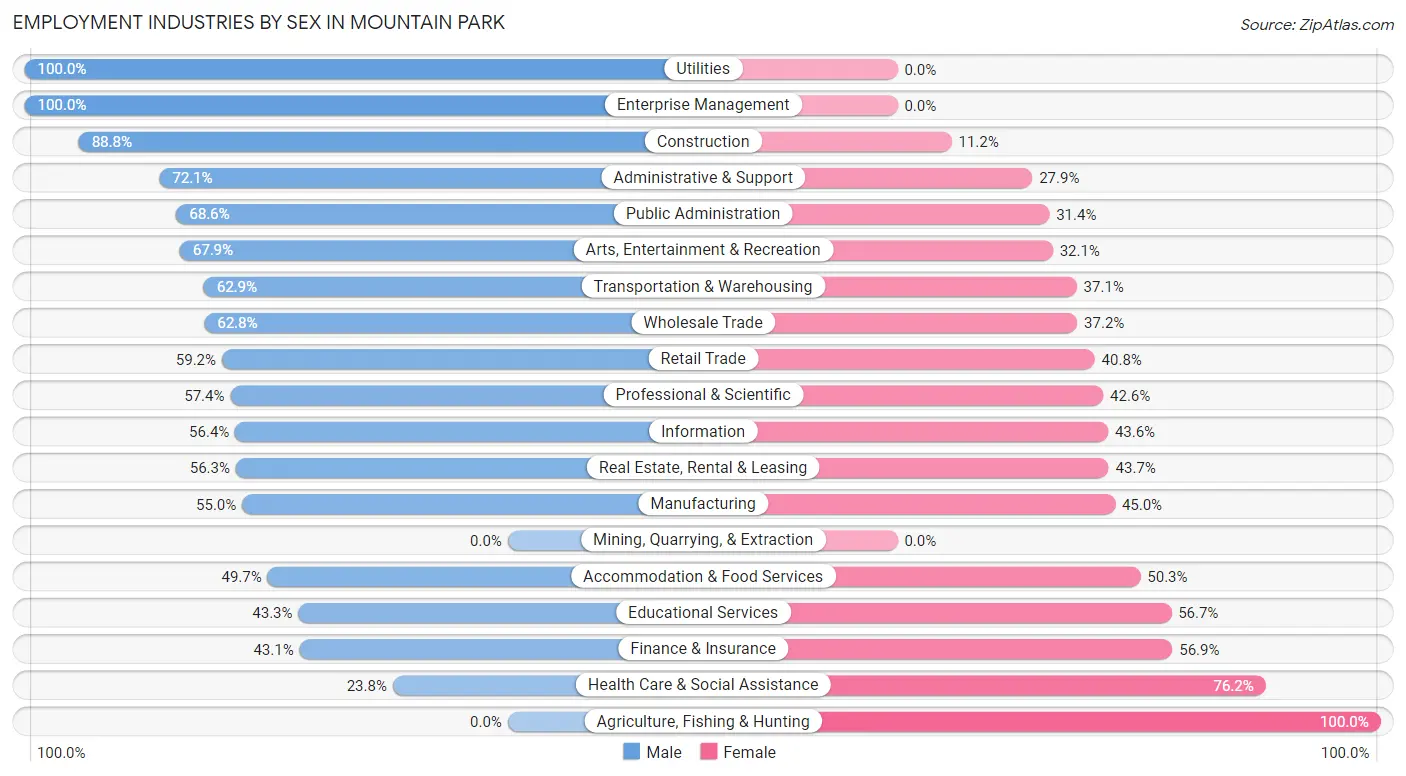
Employment Industries by Sex in Mountain Park
The Mountain Park industries that see more men than women are Utilities (100.0%), Enterprise Management (100.0%), and Construction (88.8%), whereas the industries that tend to have a higher number of women are Agriculture, Fishing & Hunting (100.0%), Health Care & Social Assistance (76.2%), and Finance & Insurance (56.9%).
| Industry | Male | Female |
| Agriculture, Fishing & Hunting | 0 (0.0%) | 11 (100.0%) |
| Mining, Quarrying, & Extraction | 0 (0.0%) | 0 (0.0%) |
| Construction | 301 (88.8%) | 38 (11.2%) |
| Manufacturing | 171 (55.0%) | 140 (45.0%) |
| Wholesale Trade | 103 (62.8%) | 61 (37.2%) |
| Retail Trade | 397 (59.2%) | 274 (40.8%) |
| Transportation & Warehousing | 234 (62.9%) | 138 (37.1%) |
| Utilities | 35 (100.0%) | 0 (0.0%) |
| Information | 167 (56.4%) | 129 (43.6%) |
| Finance & Insurance | 128 (43.1%) | 169 (56.9%) |
| Real Estate, Rental & Leasing | 278 (56.3%) | 216 (43.7%) |
| Professional & Scientific | 344 (57.4%) | 255 (42.6%) |
| Enterprise Management | 18 (100.0%) | 0 (0.0%) |
| Administrative & Support | 323 (72.1%) | 125 (27.9%) |
| Educational Services | 328 (43.3%) | 429 (56.7%) |
| Health Care & Social Assistance | 158 (23.8%) | 506 (76.2%) |
| Arts, Entertainment & Recreation | 19 (67.9%) | 9 (32.1%) |
| Accommodation & Food Services | 176 (49.7%) | 178 (50.3%) |
| Public Administration | 227 (68.6%) | 104 (31.4%) |
| Total | 3,651 (55.8%) | 2,897 (44.2%) |
Education in Mountain Park
School Enrollment in Mountain Park
The most common levels of schooling among the 3,058 students in Mountain Park are high school (1,107 | 36.2%), middle school (574 | 18.8%), and college / undergraduate (494 | 16.2%).
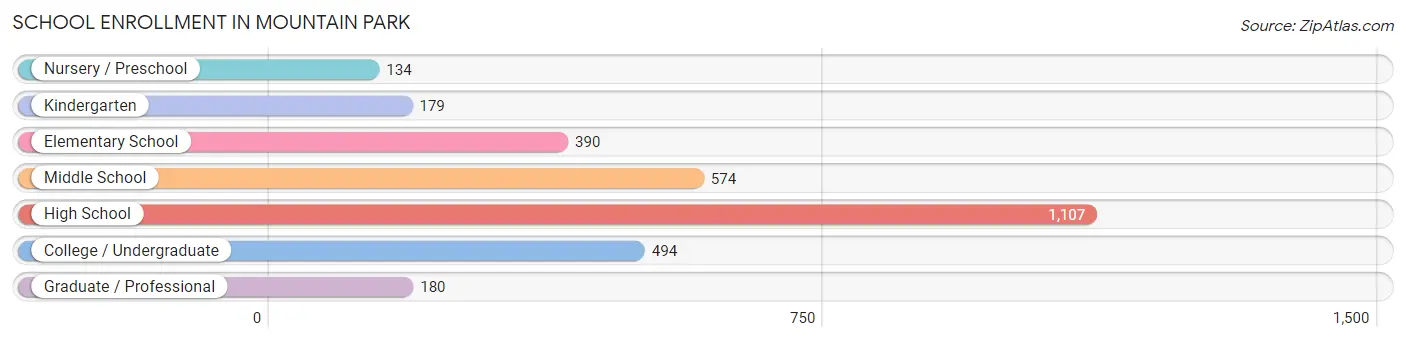
| School Level | # Students | % Students |
| Nursery / Preschool | 134 | 4.4% |
| Kindergarten | 179 | 5.9% |
| Elementary School | 390 | 12.8% |
| Middle School | 574 | 18.8% |
| High School | 1,107 | 36.2% |
| College / Undergraduate | 494 | 16.2% |
| Graduate / Professional | 180 | 5.9% |
| Total | 3,058 | 100.0% |
School Enrollment by Age by Funding Source in Mountain Park
Out of a total of 3,058 students who are enrolled in schools in Mountain Park, 465 (15.2%) attend a private institution, while the remaining 2,593 (84.8%) are enrolled in public schools. The age group of 3 to 4 year olds has the highest likelihood of being enrolled in private schools, with 87 (64.0% in the age bracket) enrolled. Conversely, the age group of 18 to 19 year olds has the lowest likelihood of being enrolled in a private school, with 223 (100.0% in the age bracket) attending a public institution.
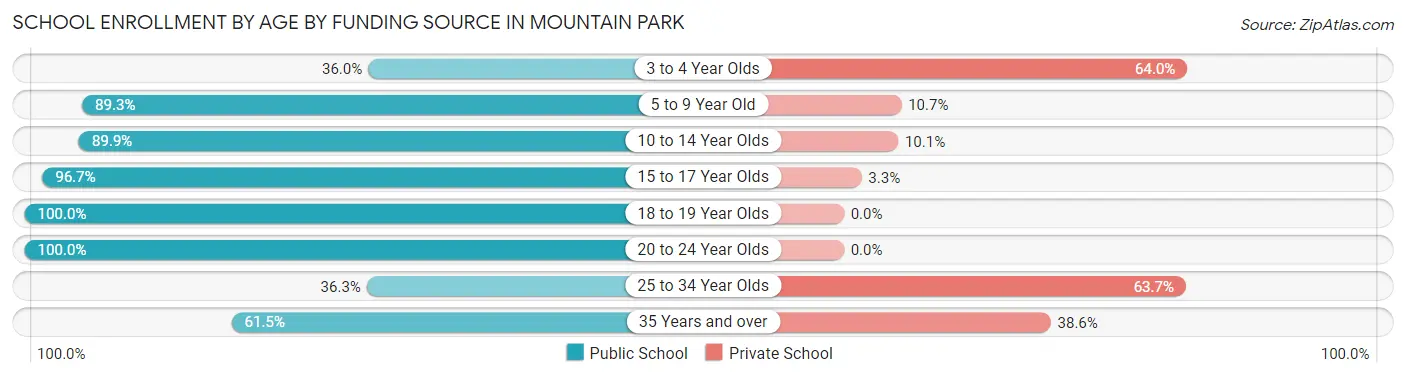
| Age Bracket | Public School | Private School |
| 3 to 4 Year Olds | 49 (36.0%) | 87 (64.0%) |
| 5 to 9 Year Old | 458 (89.3%) | 55 (10.7%) |
| 10 to 14 Year Olds | 755 (89.9%) | 85 (10.1%) |
| 15 to 17 Year Olds | 703 (96.7%) | 24 (3.3%) |
| 18 to 19 Year Olds | 223 (100.0%) | 0 (0.0%) |
| 20 to 24 Year Olds | 216 (100.0%) | 0 (0.0%) |
| 25 to 34 Year Olds | 86 (36.3%) | 151 (63.7%) |
| 35 Years and over | 102 (61.5%) | 64 (38.6%) |
| Total | 2,593 (84.8%) | 465 (15.2%) |
Educational Attainment by Field of Study in Mountain Park
Business (1,142 | 25.0%), engineering (593 | 13.0%), education (536 | 11.7%), computers & mathematics (338 | 7.4%), and psychology (337 | 7.4%) are the most common fields of study among 4,567 individuals in Mountain Park who have obtained a bachelor's degree or higher.
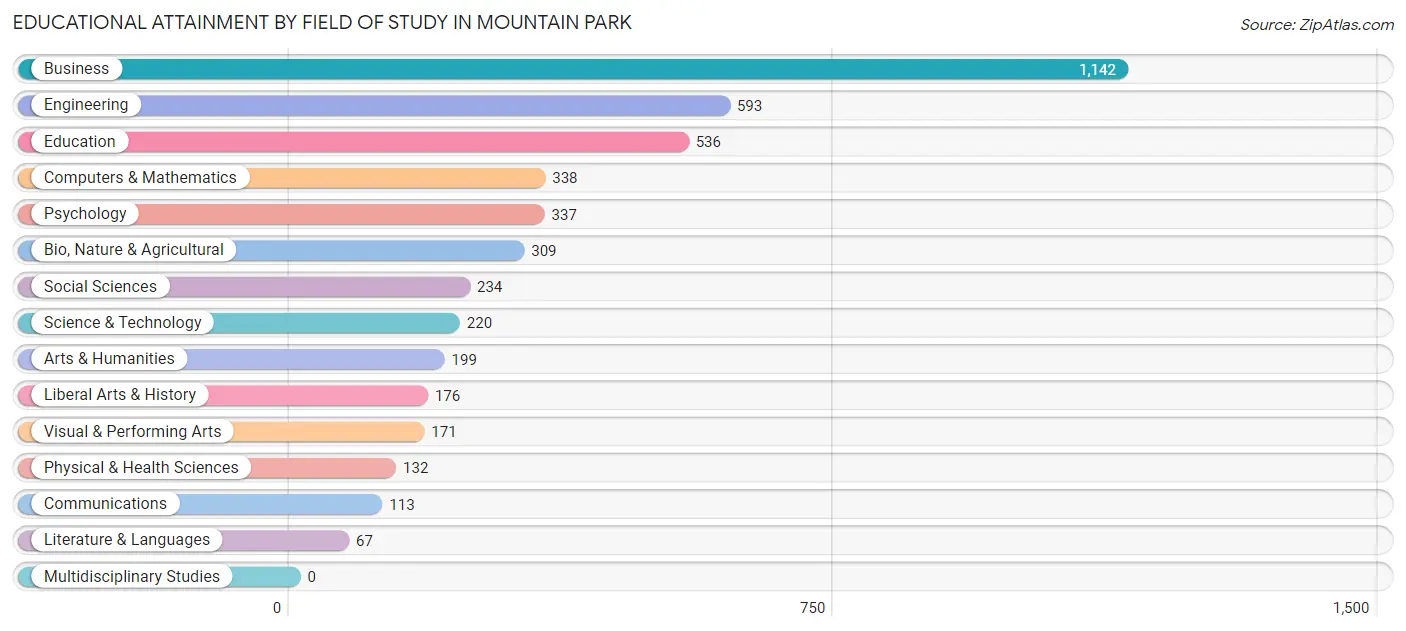
| Field of Study | # Graduates | % Graduates |
| Computers & Mathematics | 338 | 7.4% |
| Bio, Nature & Agricultural | 309 | 6.8% |
| Physical & Health Sciences | 132 | 2.9% |
| Psychology | 337 | 7.4% |
| Social Sciences | 234 | 5.1% |
| Engineering | 593 | 13.0% |
| Multidisciplinary Studies | 0 | 0.0% |
| Science & Technology | 220 | 4.8% |
| Business | 1,142 | 25.0% |
| Education | 536 | 11.7% |
| Literature & Languages | 67 | 1.5% |
| Liberal Arts & History | 176 | 3.8% |
| Visual & Performing Arts | 171 | 3.7% |
| Communications | 113 | 2.5% |
| Arts & Humanities | 199 | 4.4% |
| Total | 4,567 | 100.0% |
Transportation & Commute in Mountain Park
Vehicle Availability by Sex in Mountain Park
The most prevalent vehicle ownership categories in Mountain Park are males with 2 vehicles (1,083, accounting for 32.8%) and females with 2 vehicles (852, making up 39.9%).
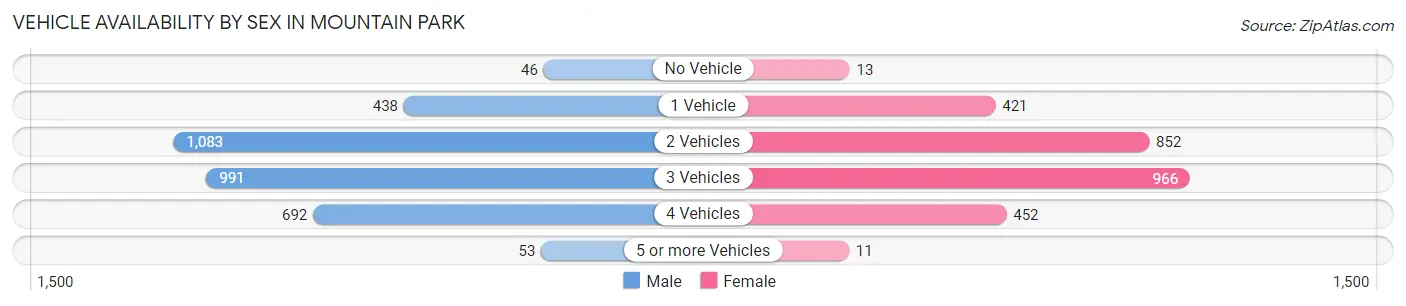
| Vehicles Available | Male | Female |
| No Vehicle | 46 (1.4%) | 13 (0.5%) |
| 1 Vehicle | 438 (13.3%) | 421 (15.5%) |
| 2 Vehicles | 1,083 (32.8%) | 852 (31.4%) |
| 3 Vehicles | 991 (30.0%) | 966 (35.6%) |
| 4 Vehicles | 692 (20.9%) | 452 (16.7%) |
| 5 or more Vehicles | 53 (1.6%) | 11 (0.4%) |
| Total | 3,303 (100.0%) | 2,715 (100.0%) |
Commute Time in Mountain Park
The most frequently occuring commute durations in Mountain Park are 30 to 34 minutes (841 commuters, 16.4%), 45 to 59 minutes (822 commuters, 16.0%), and 60 to 89 minutes (618 commuters, 12.1%).
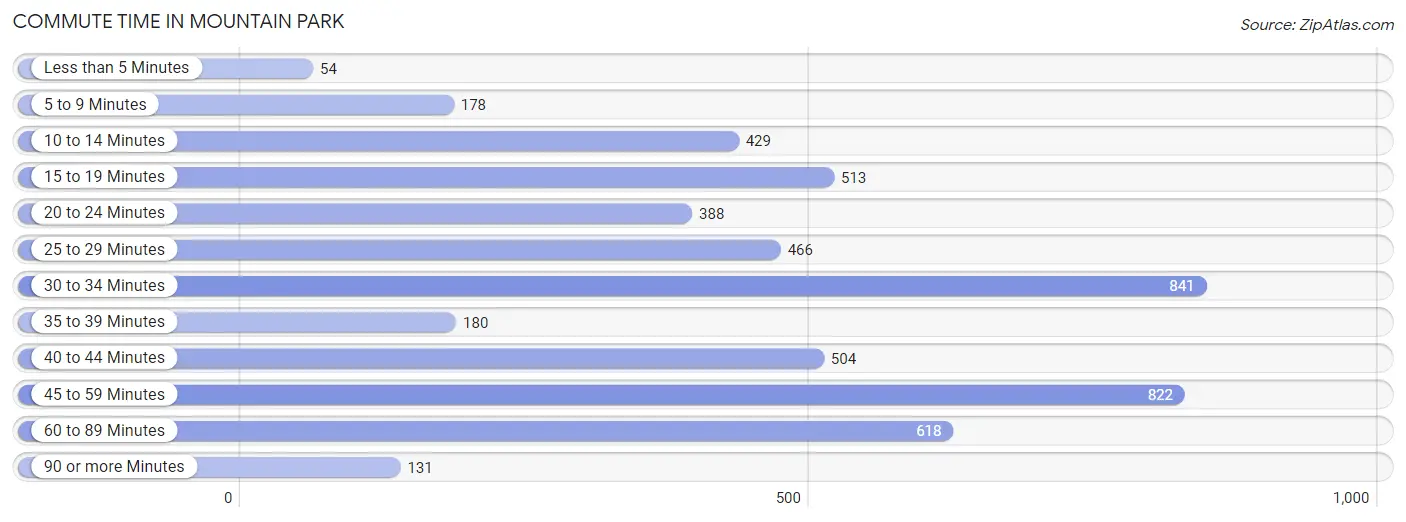
| Commute Time | # Commuters | % Commuters |
| Less than 5 Minutes | 54 | 1.1% |
| 5 to 9 Minutes | 178 | 3.5% |
| 10 to 14 Minutes | 429 | 8.4% |
| 15 to 19 Minutes | 513 | 10.0% |
| 20 to 24 Minutes | 388 | 7.6% |
| 25 to 29 Minutes | 466 | 9.1% |
| 30 to 34 Minutes | 841 | 16.4% |
| 35 to 39 Minutes | 180 | 3.5% |
| 40 to 44 Minutes | 504 | 9.8% |
| 45 to 59 Minutes | 822 | 16.0% |
| 60 to 89 Minutes | 618 | 12.1% |
| 90 or more Minutes | 131 | 2.6% |
Commute Time by Sex in Mountain Park
The most common commute times in Mountain Park are 30 to 34 minutes (545 commuters, 19.1%) for males and 45 to 59 minutes (299 commuters, 13.1%) for females.
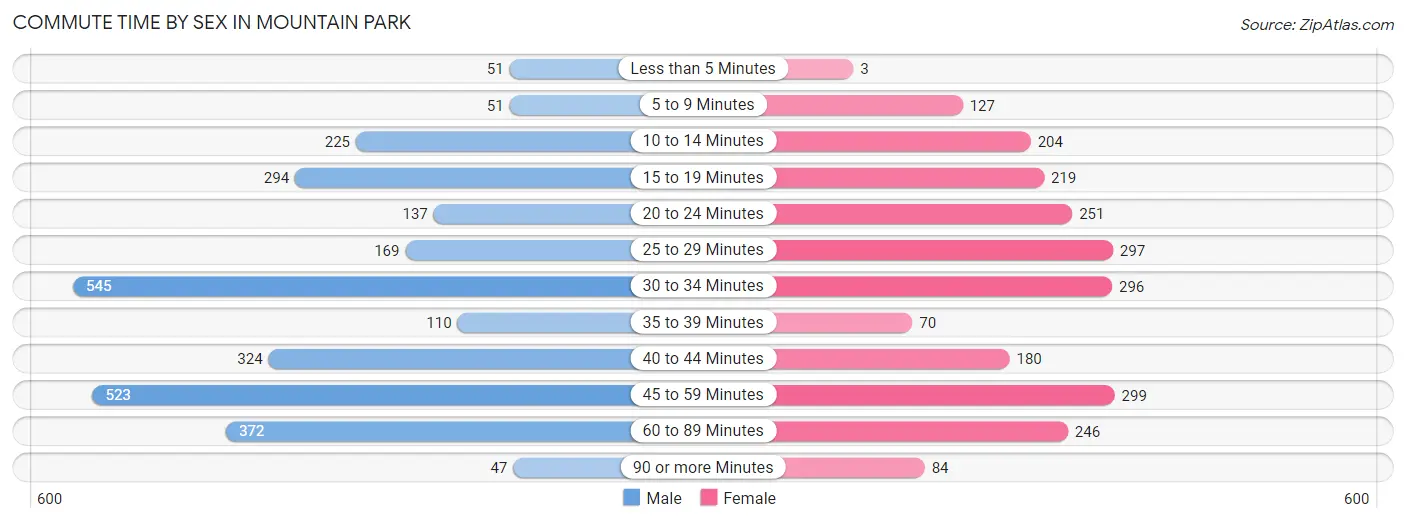
| Commute Time | Male | Female |
| Less than 5 Minutes | 51 (1.8%) | 3 (0.1%) |
| 5 to 9 Minutes | 51 (1.8%) | 127 (5.6%) |
| 10 to 14 Minutes | 225 (7.9%) | 204 (9.0%) |
| 15 to 19 Minutes | 294 (10.3%) | 219 (9.6%) |
| 20 to 24 Minutes | 137 (4.8%) | 251 (11.0%) |
| 25 to 29 Minutes | 169 (5.9%) | 297 (13.1%) |
| 30 to 34 Minutes | 545 (19.1%) | 296 (13.0%) |
| 35 to 39 Minutes | 110 (3.9%) | 70 (3.1%) |
| 40 to 44 Minutes | 324 (11.4%) | 180 (7.9%) |
| 45 to 59 Minutes | 523 (18.4%) | 299 (13.1%) |
| 60 to 89 Minutes | 372 (13.1%) | 246 (10.8%) |
| 90 or more Minutes | 47 (1.7%) | 84 (3.7%) |
Time of Departure to Work by Sex in Mountain Park
The most frequent times of departure to work in Mountain Park are 7:00 AM to 7:29 AM (472, 16.6%) for males and 8:00 AM to 8:29 AM (383, 16.8%) for females.
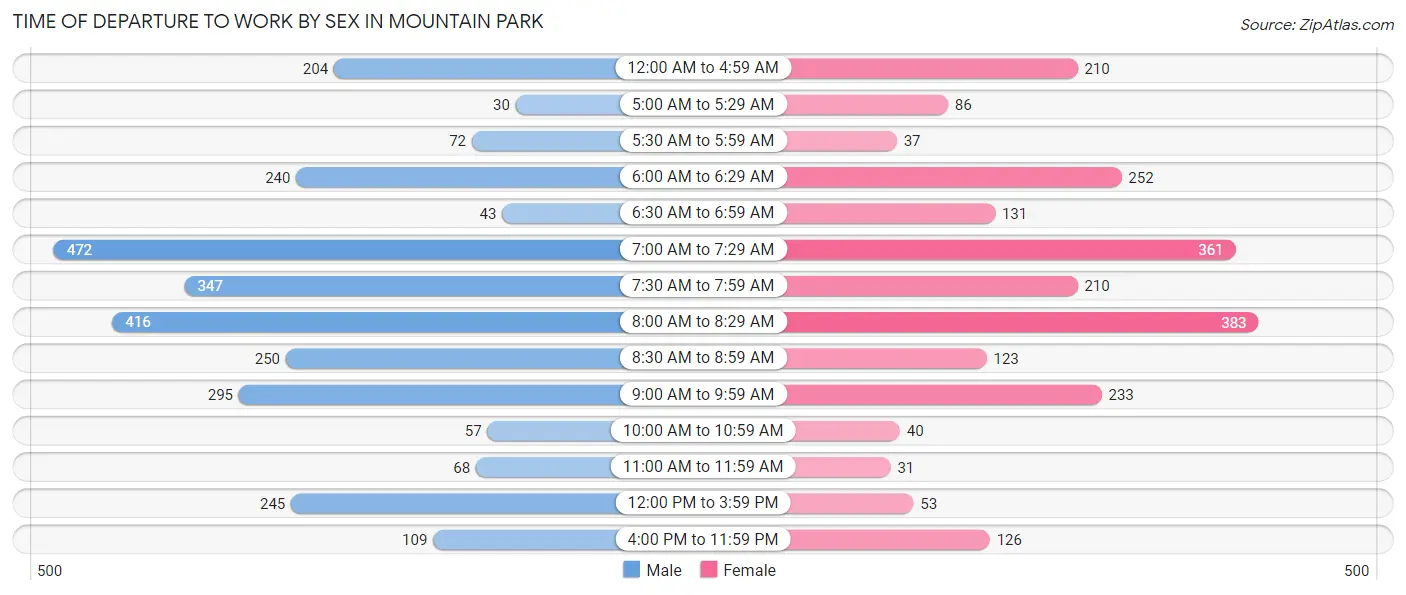
| Time of Departure | Male | Female |
| 12:00 AM to 4:59 AM | 204 (7.2%) | 210 (9.2%) |
| 5:00 AM to 5:29 AM | 30 (1.1%) | 86 (3.8%) |
| 5:30 AM to 5:59 AM | 72 (2.5%) | 37 (1.6%) |
| 6:00 AM to 6:29 AM | 240 (8.4%) | 252 (11.1%) |
| 6:30 AM to 6:59 AM | 43 (1.5%) | 131 (5.8%) |
| 7:00 AM to 7:29 AM | 472 (16.6%) | 361 (15.9%) |
| 7:30 AM to 7:59 AM | 347 (12.2%) | 210 (9.2%) |
| 8:00 AM to 8:29 AM | 416 (14.6%) | 383 (16.8%) |
| 8:30 AM to 8:59 AM | 250 (8.8%) | 123 (5.4%) |
| 9:00 AM to 9:59 AM | 295 (10.4%) | 233 (10.2%) |
| 10:00 AM to 10:59 AM | 57 (2.0%) | 40 (1.8%) |
| 11:00 AM to 11:59 AM | 68 (2.4%) | 31 (1.4%) |
| 12:00 PM to 3:59 PM | 245 (8.6%) | 53 (2.3%) |
| 4:00 PM to 11:59 PM | 109 (3.8%) | 126 (5.5%) |
| Total | 2,848 (100.0%) | 2,276 (100.0%) |
Housing Occupancy in Mountain Park
Occupancy by Ownership in Mountain Park
Of the total 4,650 dwellings in Mountain Park, owner-occupied units account for 3,908 (84.0%), while renter-occupied units make up 742 (16.0%).
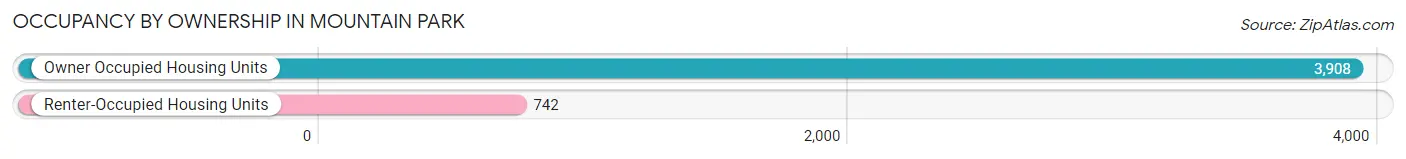
| Occupancy | # Housing Units | % Housing Units |
| Owner Occupied Housing Units | 3,908 | 84.0% |
| Renter-Occupied Housing Units | 742 | 16.0% |
| Total Occupied Housing Units | 4,650 | 100.0% |
Occupancy by Household Size in Mountain Park
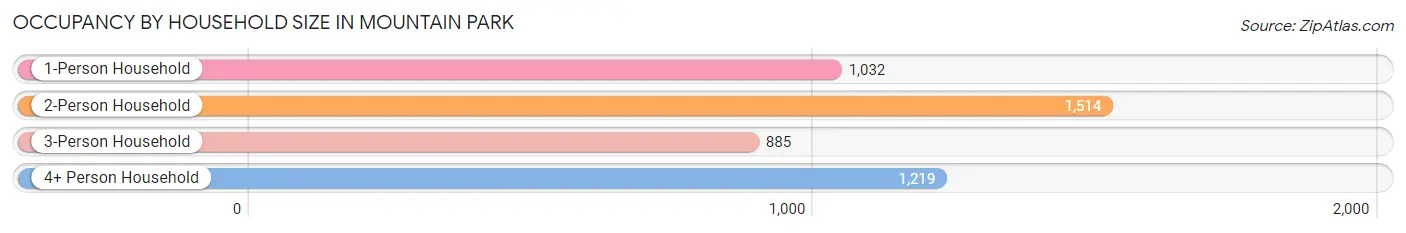
| Household Size | # Housing Units | % Housing Units |
| 1-Person Household | 1,032 | 22.2% |
| 2-Person Household | 1,514 | 32.6% |
| 3-Person Household | 885 | 19.0% |
| 4+ Person Household | 1,219 | 26.2% |
| Total Housing Units | 4,650 | 100.0% |
Occupancy by Ownership by Household Size in Mountain Park
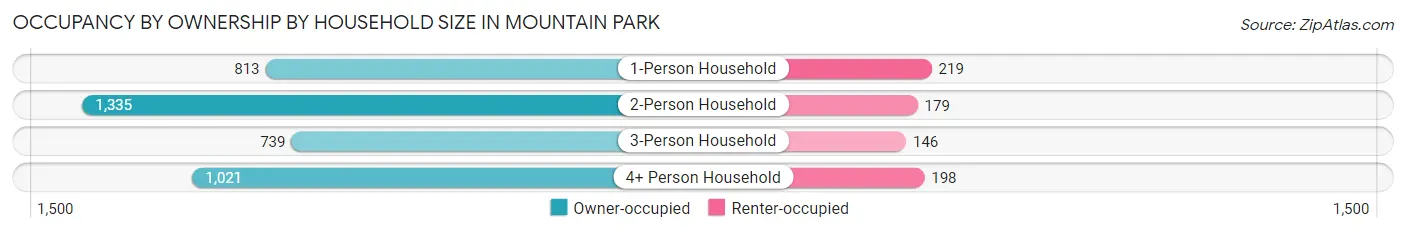
| Household Size | Owner-occupied | Renter-occupied |
| 1-Person Household | 813 (78.8%) | 219 (21.2%) |
| 2-Person Household | 1,335 (88.2%) | 179 (11.8%) |
| 3-Person Household | 739 (83.5%) | 146 (16.5%) |
| 4+ Person Household | 1,021 (83.8%) | 198 (16.2%) |
| Total Housing Units | 3,908 (84.0%) | 742 (16.0%) |
Occupancy by Educational Attainment in Mountain Park
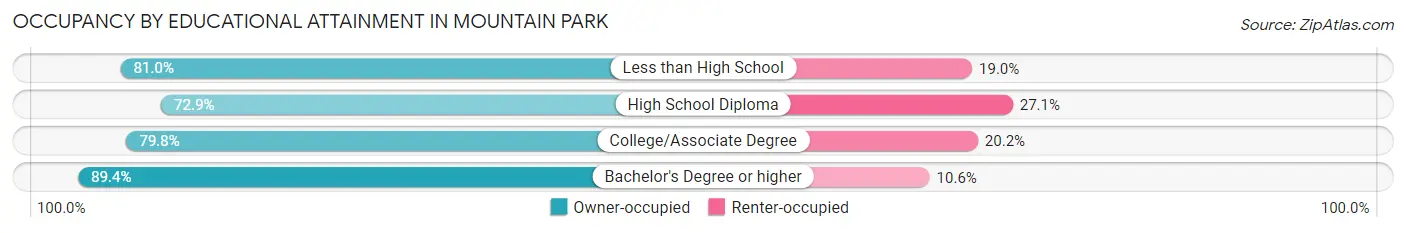
| Household Size | Owner-occupied | Renter-occupied |
| Less than High School | 149 (81.0%) | 35 (19.0%) |
| High School Diploma | 482 (72.9%) | 179 (27.1%) |
| College/Associate Degree | 1,041 (79.8%) | 263 (20.2%) |
| Bachelor's Degree or higher | 2,236 (89.4%) | 265 (10.6%) |
Occupancy by Age of Householder in Mountain Park
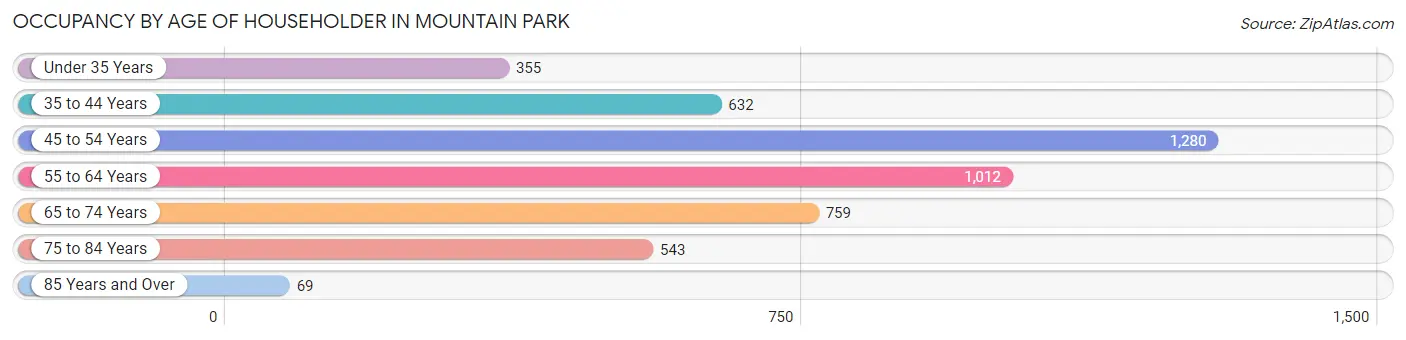
| Age Bracket | # Households | % Households |
| Under 35 Years | 355 | 7.6% |
| 35 to 44 Years | 632 | 13.6% |
| 45 to 54 Years | 1,280 | 27.5% |
| 55 to 64 Years | 1,012 | 21.8% |
| 65 to 74 Years | 759 | 16.3% |
| 75 to 84 Years | 543 | 11.7% |
| 85 Years and Over | 69 | 1.5% |
| Total | 4,650 | 100.0% |
Housing Finances in Mountain Park
Median Income by Occupancy in Mountain Park
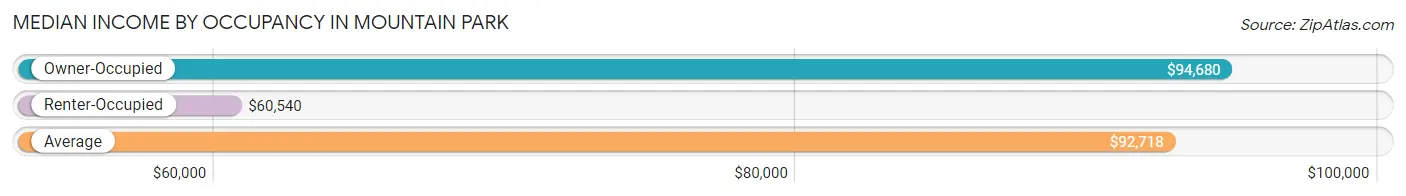
| Occupancy Type | # Households | Median Income |
| Owner-Occupied | 3,908 (84.0%) | $94,680 |
| Renter-Occupied | 742 (16.0%) | $60,540 |
| Average | 4,650 (100.0%) | $92,718 |
Occupancy by Householder Income Bracket in Mountain Park
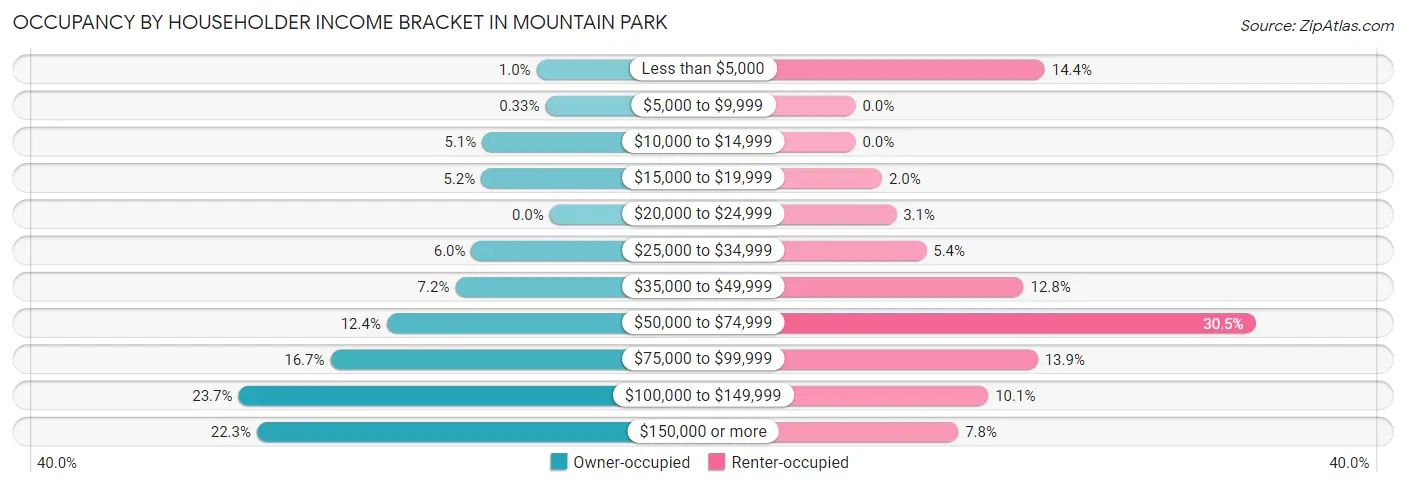
| Income Bracket | Owner-occupied | Renter-occupied |
| Less than $5,000 | 39 (1.0%) | 107 (14.4%) |
| $5,000 to $9,999 | 13 (0.3%) | 0 (0.0%) |
| $10,000 to $14,999 | 201 (5.1%) | 0 (0.0%) |
| $15,000 to $19,999 | 204 (5.2%) | 15 (2.0%) |
| $20,000 to $24,999 | 0 (0.0%) | 23 (3.1%) |
| $25,000 to $34,999 | 233 (6.0%) | 40 (5.4%) |
| $35,000 to $49,999 | 281 (7.2%) | 95 (12.8%) |
| $50,000 to $74,999 | 485 (12.4%) | 226 (30.5%) |
| $75,000 to $99,999 | 653 (16.7%) | 103 (13.9%) |
| $100,000 to $149,999 | 927 (23.7%) | 75 (10.1%) |
| $150,000 or more | 872 (22.3%) | 58 (7.8%) |
| Total | 3,908 (100.0%) | 742 (100.0%) |
Monthly Housing Cost Tiers in Mountain Park
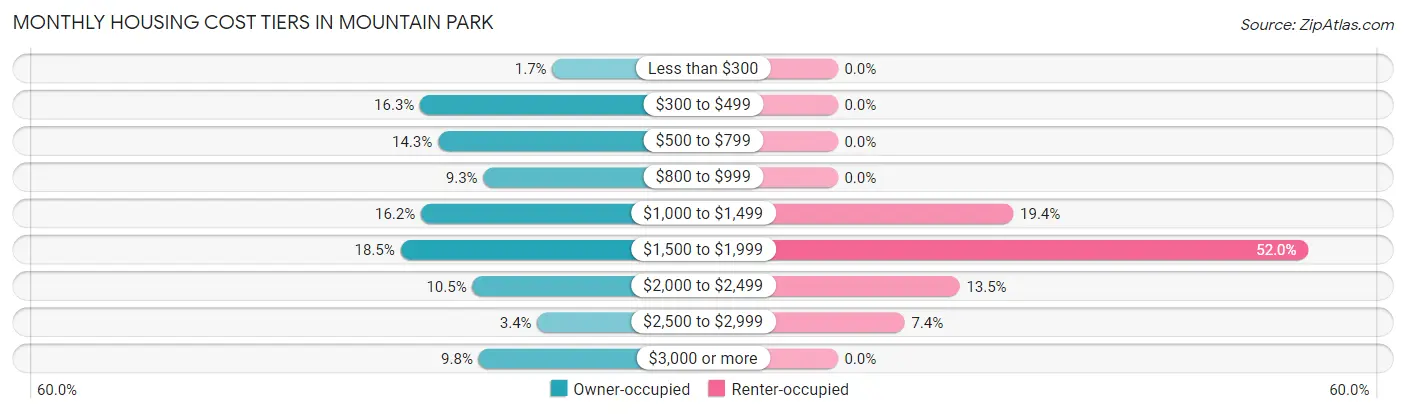
| Monthly Cost | Owner-occupied | Renter-occupied |
| Less than $300 | 66 (1.7%) | 0 (0.0%) |
| $300 to $499 | 637 (16.3%) | 0 (0.0%) |
| $500 to $799 | 560 (14.3%) | 0 (0.0%) |
| $800 to $999 | 364 (9.3%) | 0 (0.0%) |
| $1,000 to $1,499 | 633 (16.2%) | 144 (19.4%) |
| $1,500 to $1,999 | 722 (18.5%) | 386 (52.0%) |
| $2,000 to $2,499 | 411 (10.5%) | 100 (13.5%) |
| $2,500 to $2,999 | 131 (3.4%) | 55 (7.4%) |
| $3,000 or more | 384 (9.8%) | 0 (0.0%) |
| Total | 3,908 (100.0%) | 742 (100.0%) |
Physical Housing Characteristics in Mountain Park
Housing Structures in Mountain Park
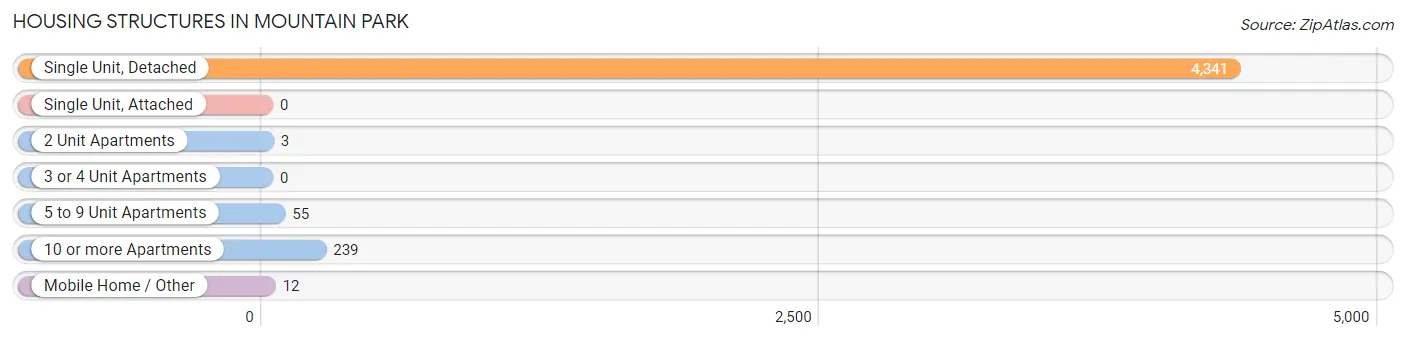
| Structure Type | # Housing Units | % Housing Units |
| Single Unit, Detached | 4,341 | 93.3% |
| Single Unit, Attached | 0 | 0.0% |
| 2 Unit Apartments | 3 | 0.1% |
| 3 or 4 Unit Apartments | 0 | 0.0% |
| 5 to 9 Unit Apartments | 55 | 1.2% |
| 10 or more Apartments | 239 | 5.1% |
| Mobile Home / Other | 12 | 0.3% |
| Total | 4,650 | 100.0% |
Housing Structures by Occupancy in Mountain Park
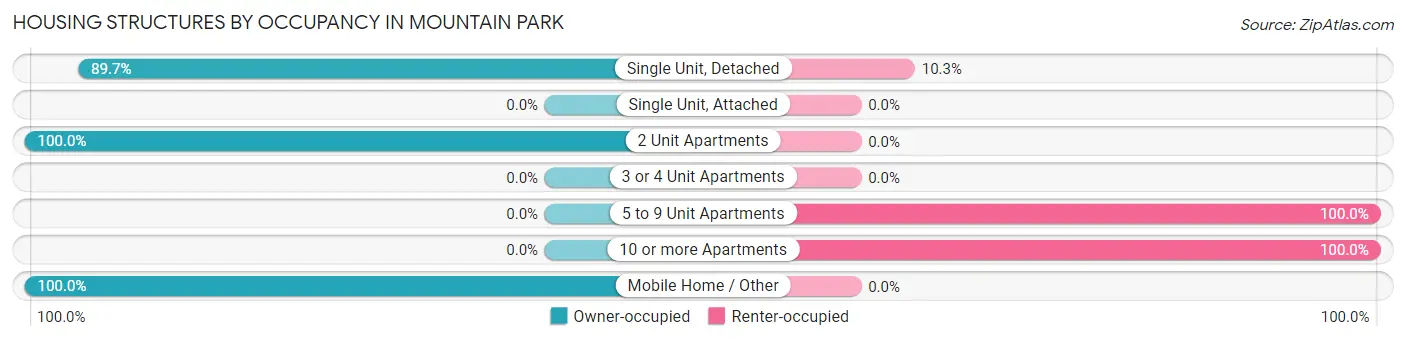
| Structure Type | Owner-occupied | Renter-occupied |
| Single Unit, Detached | 3,893 (89.7%) | 448 (10.3%) |
| Single Unit, Attached | 0 (0.0%) | 0 (0.0%) |
| 2 Unit Apartments | 3 (100.0%) | 0 (0.0%) |
| 3 or 4 Unit Apartments | 0 (0.0%) | 0 (0.0%) |
| 5 to 9 Unit Apartments | 0 (0.0%) | 55 (100.0%) |
| 10 or more Apartments | 0 (0.0%) | 239 (100.0%) |
| Mobile Home / Other | 12 (100.0%) | 0 (0.0%) |
| Total | 3,908 (84.0%) | 742 (16.0%) |
Housing Structures by Number of Rooms in Mountain Park
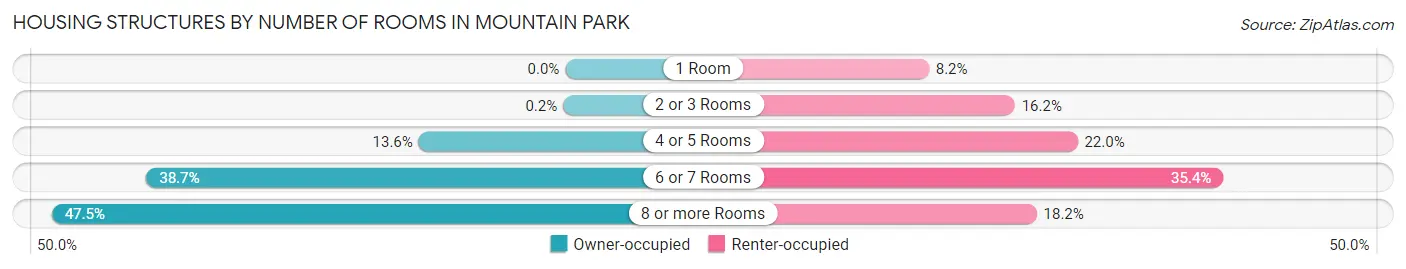
| Number of Rooms | Owner-occupied | Renter-occupied |
| 1 Room | 0 (0.0%) | 61 (8.2%) |
| 2 or 3 Rooms | 8 (0.2%) | 120 (16.2%) |
| 4 or 5 Rooms | 530 (13.6%) | 163 (22.0%) |
| 6 or 7 Rooms | 1,514 (38.7%) | 263 (35.4%) |
| 8 or more Rooms | 1,856 (47.5%) | 135 (18.2%) |
| Total | 3,908 (100.0%) | 742 (100.0%) |
Housing Structure by Heating Type in Mountain Park
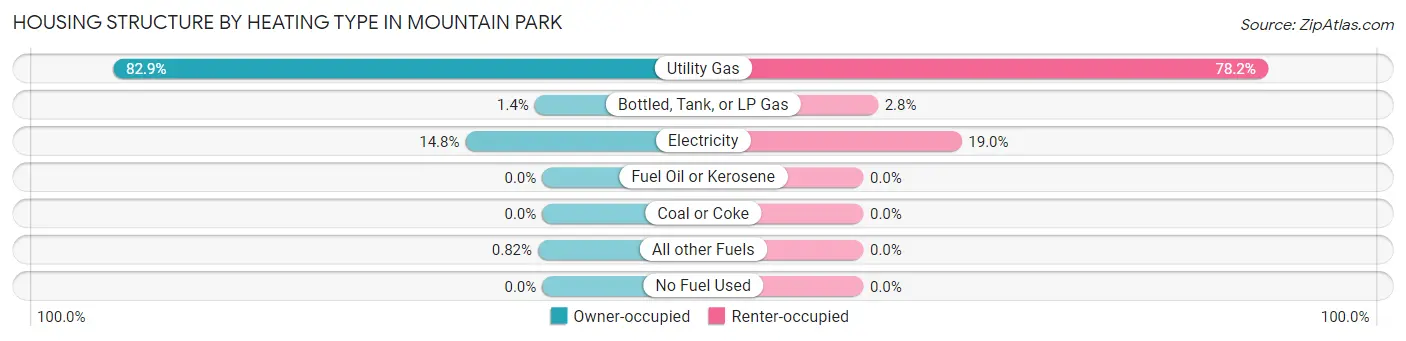
| Heating Type | Owner-occupied | Renter-occupied |
| Utility Gas | 3,240 (82.9%) | 580 (78.2%) |
| Bottled, Tank, or LP Gas | 56 (1.4%) | 21 (2.8%) |
| Electricity | 580 (14.8%) | 141 (19.0%) |
| Fuel Oil or Kerosene | 0 (0.0%) | 0 (0.0%) |
| Coal or Coke | 0 (0.0%) | 0 (0.0%) |
| All other Fuels | 32 (0.8%) | 0 (0.0%) |
| No Fuel Used | 0 (0.0%) | 0 (0.0%) |
| Total | 3,908 (100.0%) | 742 (100.0%) |
Household Vehicle Usage in Mountain Park
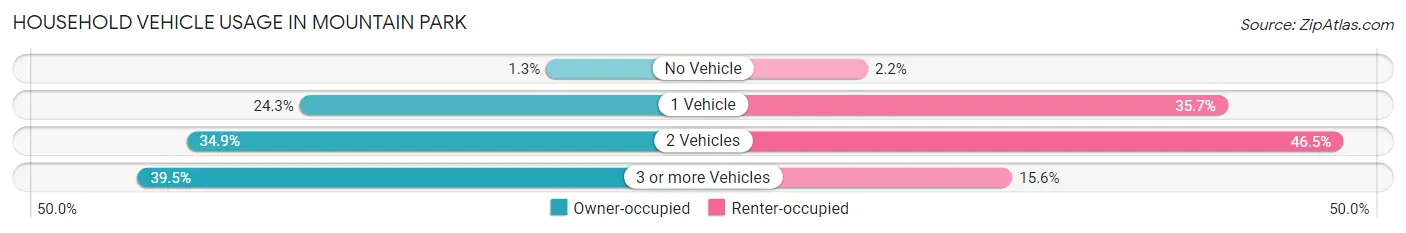
| Vehicles per Household | Owner-occupied | Renter-occupied |
| No Vehicle | 52 (1.3%) | 16 (2.2%) |
| 1 Vehicle | 951 (24.3%) | 265 (35.7%) |
| 2 Vehicles | 1,363 (34.9%) | 345 (46.5%) |
| 3 or more Vehicles | 1,542 (39.5%) | 116 (15.6%) |
| Total | 3,908 (100.0%) | 742 (100.0%) |
Real Estate & Mortgages in Mountain Park
Real Estate and Mortgage Overview in Mountain Park
| Characteristic | Without Mortgage | With Mortgage |
| Housing Units | 1,369 | 2,539 |
| Median Property Value | $261,800 | $287,400 |
| Median Household Income | $80,875 | $584 |
| Monthly Housing Costs | $505 | $384 |
| Real Estate Taxes | $1,743 | $35 |
Property Value by Mortgage Status in Mountain Park
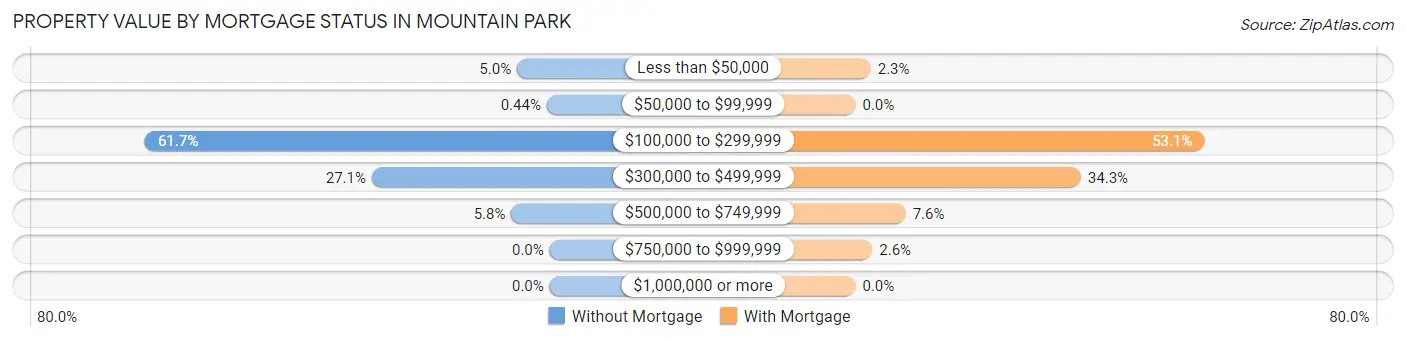
| Property Value | Without Mortgage | With Mortgage |
| Less than $50,000 | 68 (5.0%) | 59 (2.3%) |
| $50,000 to $99,999 | 6 (0.4%) | 0 (0.0%) |
| $100,000 to $299,999 | 844 (61.7%) | 1,349 (53.1%) |
| $300,000 to $499,999 | 371 (27.1%) | 872 (34.3%) |
| $500,000 to $749,999 | 80 (5.8%) | 194 (7.6%) |
| $750,000 to $999,999 | 0 (0.0%) | 65 (2.6%) |
| $1,000,000 or more | 0 (0.0%) | 0 (0.0%) |
| Total | 1,369 (100.0%) | 2,539 (100.0%) |
Household Income by Mortgage Status in Mountain Park
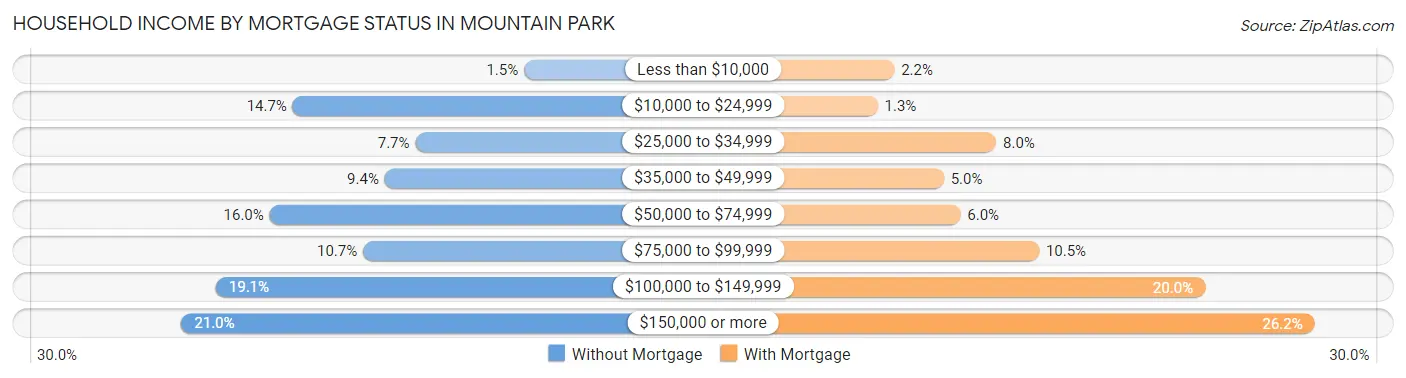
| Household Income | Without Mortgage | With Mortgage |
| Less than $10,000 | 20 (1.5%) | 56 (2.2%) |
| $10,000 to $24,999 | 201 (14.7%) | 32 (1.3%) |
| $25,000 to $34,999 | 105 (7.7%) | 204 (8.0%) |
| $35,000 to $49,999 | 129 (9.4%) | 128 (5.0%) |
| $50,000 to $74,999 | 219 (16.0%) | 152 (6.0%) |
| $75,000 to $99,999 | 146 (10.7%) | 266 (10.5%) |
| $100,000 to $149,999 | 261 (19.1%) | 507 (20.0%) |
| $150,000 or more | 288 (21.0%) | 666 (26.2%) |
| Total | 1,369 (100.0%) | 2,539 (100.0%) |
Property Value to Household Income Ratio in Mountain Park
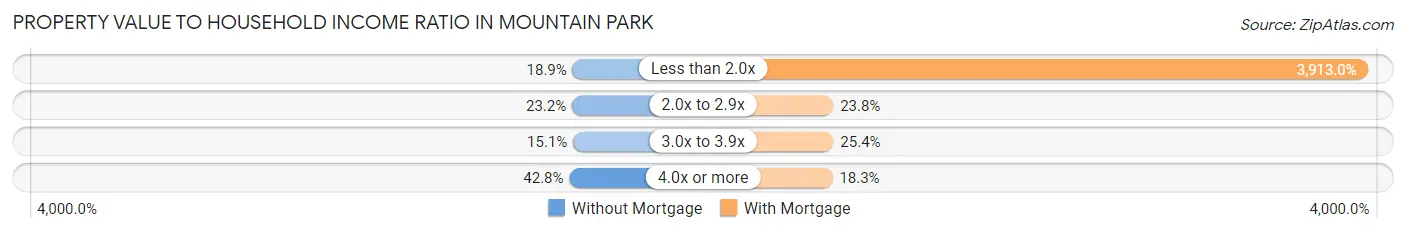
| Value-to-Income Ratio | Without Mortgage | With Mortgage |
| Less than 2.0x | 259 (18.9%) | 99,350 (3,913.0%) |
| 2.0x to 2.9x | 318 (23.2%) | 603 (23.7%) |
| 3.0x to 3.9x | 206 (15.0%) | 645 (25.4%) |
| 4.0x or more | 586 (42.8%) | 465 (18.3%) |
| Total | 1,369 (100.0%) | 2,539 (100.0%) |
Real Estate Taxes by Mortgage Status in Mountain Park
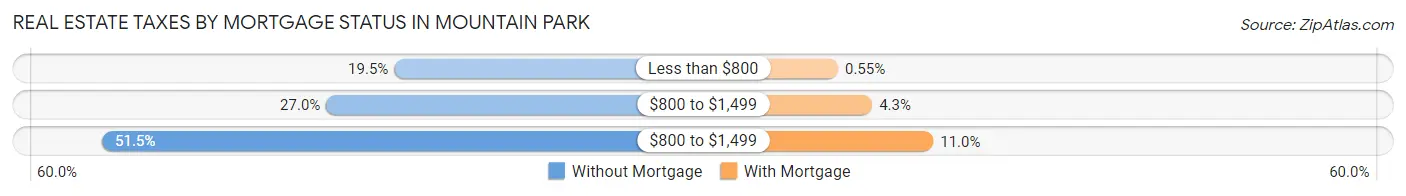
| Property Taxes | Without Mortgage | With Mortgage |
| Less than $800 | 267 (19.5%) | 14 (0.5%) |
| $800 to $1,499 | 369 (27.0%) | 109 (4.3%) |
| $800 to $1,499 | 705 (51.5%) | 279 (11.0%) |
| Total | 1,369 (100.0%) | 2,539 (100.0%) |
Health & Disability in Mountain Park
Health Insurance Coverage by Age in Mountain Park
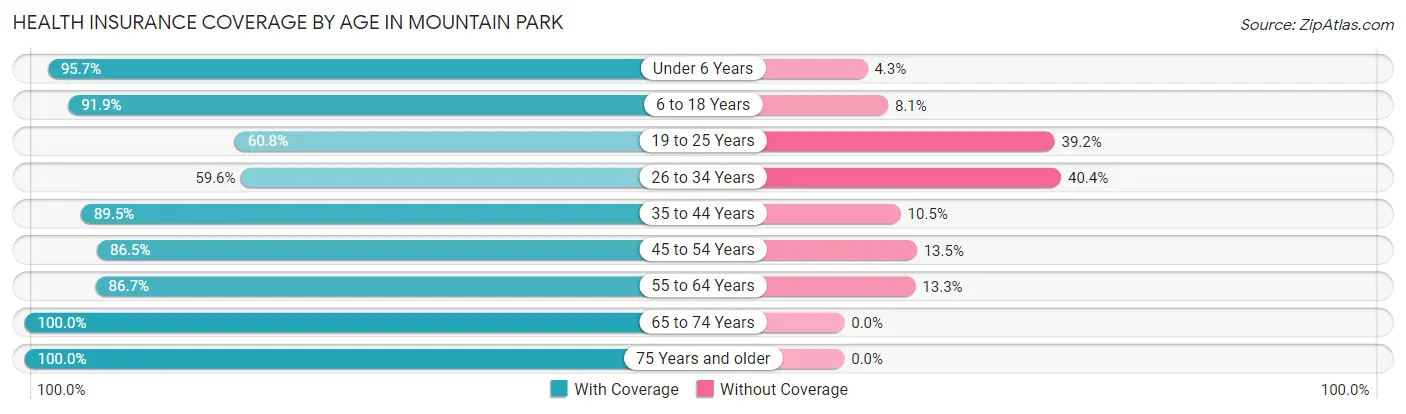
| Age Bracket | With Coverage | Without Coverage |
| Under 6 Years | 863 (95.7%) | 39 (4.3%) |
| 6 to 18 Years | 1,906 (91.9%) | 169 (8.1%) |
| 19 to 25 Years | 665 (60.8%) | 429 (39.2%) |
| 26 to 34 Years | 687 (59.6%) | 466 (40.4%) |
| 35 to 44 Years | 1,150 (89.5%) | 135 (10.5%) |
| 45 to 54 Years | 2,035 (86.5%) | 318 (13.5%) |
| 55 to 64 Years | 1,688 (86.7%) | 258 (13.3%) |
| 65 to 74 Years | 1,553 (100.0%) | 0 (0.0%) |
| 75 Years and older | 973 (100.0%) | 0 (0.0%) |
| Total | 11,520 (86.4%) | 1,814 (13.6%) |
Health Insurance Coverage by Citizenship Status in Mountain Park
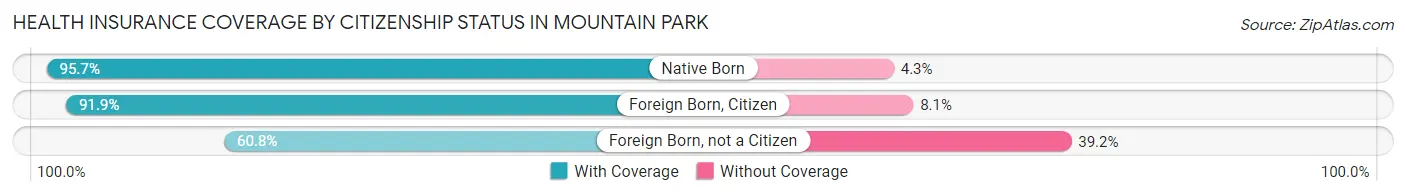
| Citizenship Status | With Coverage | Without Coverage |
| Native Born | 863 (95.7%) | 39 (4.3%) |
| Foreign Born, Citizen | 1,906 (91.9%) | 169 (8.1%) |
| Foreign Born, not a Citizen | 665 (60.8%) | 429 (39.2%) |
Health Insurance Coverage by Household Income in Mountain Park
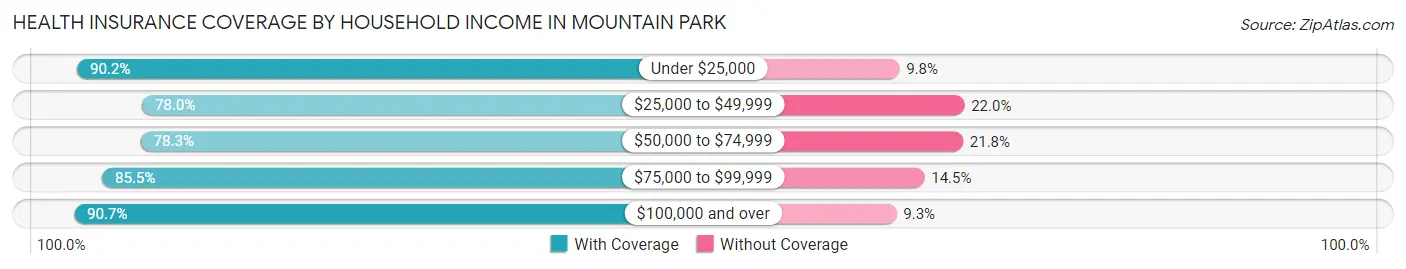
| Household Income | With Coverage | Without Coverage |
| Under $25,000 | 761 (90.2%) | 83 (9.8%) |
| $25,000 to $49,999 | 1,269 (78.0%) | 358 (22.0%) |
| $50,000 to $74,999 | 1,482 (78.2%) | 412 (21.7%) |
| $75,000 to $99,999 | 2,025 (85.5%) | 344 (14.5%) |
| $100,000 and over | 5,974 (90.7%) | 611 (9.3%) |
Public vs Private Health Insurance Coverage by Age in Mountain Park
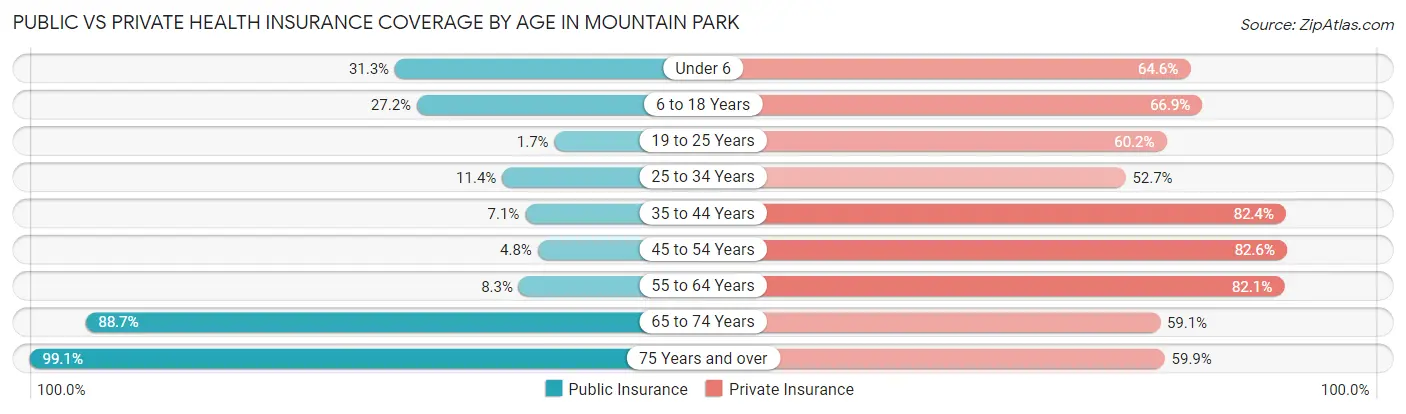
| Age Bracket | Public Insurance | Private Insurance |
| Under 6 | 282 (31.3%) | 583 (64.6%) |
| 6 to 18 Years | 564 (27.2%) | 1,388 (66.9%) |
| 19 to 25 Years | 18 (1.7%) | 659 (60.2%) |
| 25 to 34 Years | 131 (11.4%) | 607 (52.6%) |
| 35 to 44 Years | 91 (7.1%) | 1,059 (82.4%) |
| 45 to 54 Years | 112 (4.8%) | 1,943 (82.6%) |
| 55 to 64 Years | 161 (8.3%) | 1,597 (82.1%) |
| 65 to 74 Years | 1,378 (88.7%) | 917 (59.1%) |
| 75 Years and over | 964 (99.1%) | 583 (59.9%) |
| Total | 3,701 (27.8%) | 9,336 (70.0%) |
Disability Status by Sex by Age in Mountain Park
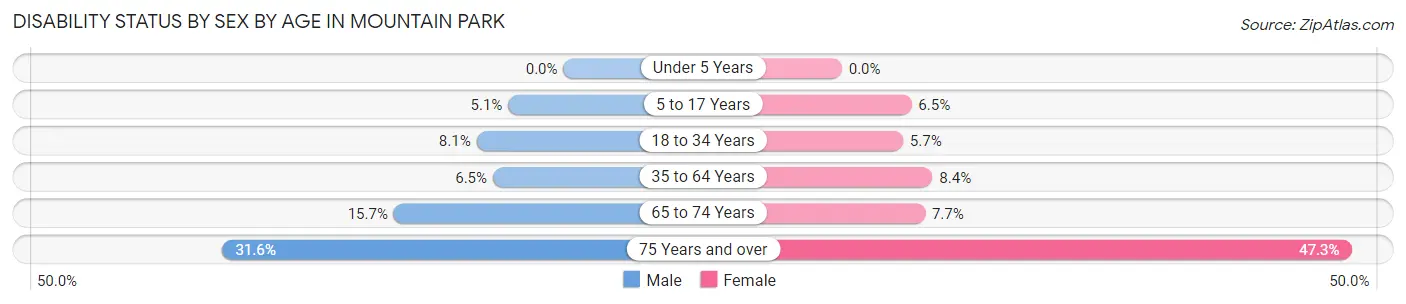
| Age Bracket | Male | Female |
| Under 5 Years | 0 (0.0%) | 0 (0.0%) |
| 5 to 17 Years | 69 (5.1%) | 53 (6.5%) |
| 18 to 34 Years | 109 (8.1%) | 57 (5.7%) |
| 35 to 64 Years | 191 (6.5%) | 224 (8.4%) |
| 65 to 74 Years | 116 (15.7%) | 63 (7.7%) |
| 75 Years and over | 180 (31.6%) | 191 (47.3%) |
Disability Class by Sex by Age in Mountain Park
Disability Class: Hearing Difficulty
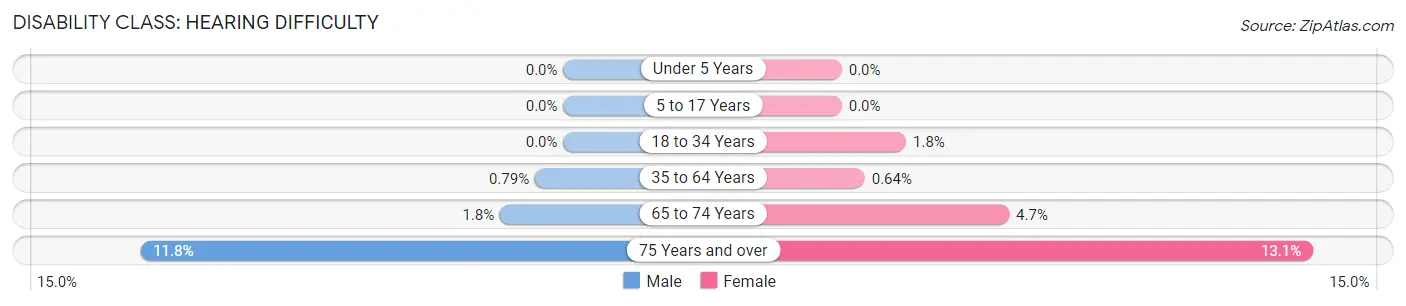
| Age Bracket | Male | Female |
| Under 5 Years | 0 (0.0%) | 0 (0.0%) |
| 5 to 17 Years | 0 (0.0%) | 0 (0.0%) |
| 18 to 34 Years | 0 (0.0%) | 18 (1.8%) |
| 35 to 64 Years | 23 (0.8%) | 17 (0.6%) |
| 65 to 74 Years | 13 (1.8%) | 38 (4.7%) |
| 75 Years and over | 67 (11.8%) | 53 (13.1%) |
Disability Class: Vision Difficulty
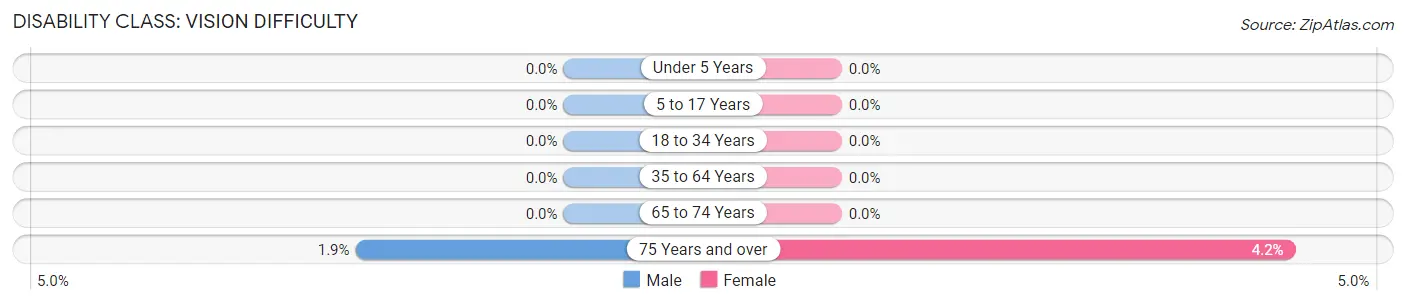
| Age Bracket | Male | Female |
| Under 5 Years | 0 (0.0%) | 0 (0.0%) |
| 5 to 17 Years | 0 (0.0%) | 0 (0.0%) |
| 18 to 34 Years | 0 (0.0%) | 0 (0.0%) |
| 35 to 64 Years | 0 (0.0%) | 0 (0.0%) |
| 65 to 74 Years | 0 (0.0%) | 0 (0.0%) |
| 75 Years and over | 11 (1.9%) | 17 (4.2%) |
Disability Class: Cognitive Difficulty
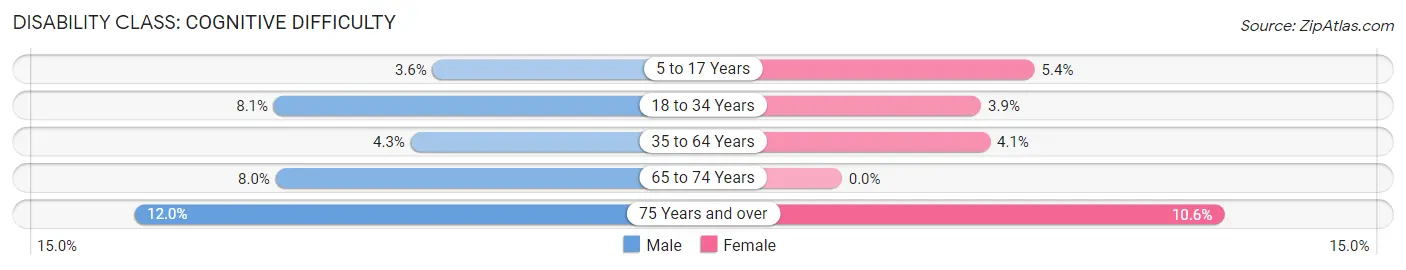
| Age Bracket | Male | Female |
| 5 to 17 Years | 49 (3.6%) | 44 (5.4%) |
| 18 to 34 Years | 109 (8.1%) | 39 (3.9%) |
| 35 to 64 Years | 124 (4.3%) | 110 (4.1%) |
| 65 to 74 Years | 59 (8.0%) | 0 (0.0%) |
| 75 Years and over | 68 (11.9%) | 43 (10.6%) |
Disability Class: Ambulatory Difficulty
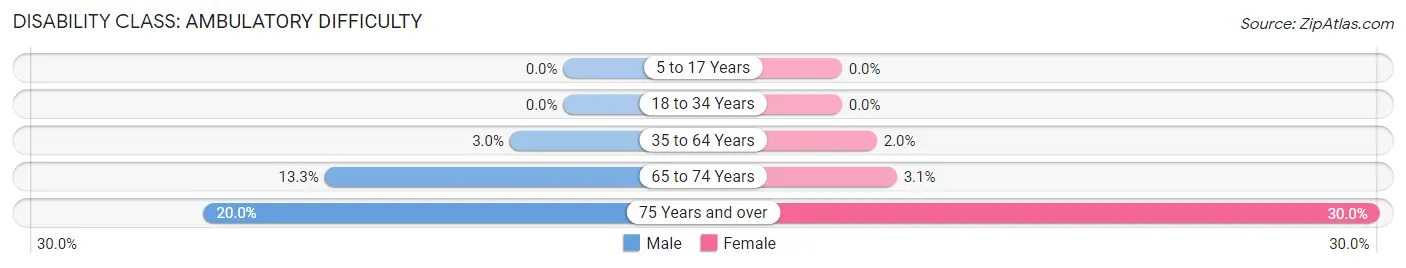
| Age Bracket | Male | Female |
| 5 to 17 Years | 0 (0.0%) | 0 (0.0%) |
| 18 to 34 Years | 0 (0.0%) | 0 (0.0%) |
| 35 to 64 Years | 87 (3.0%) | 52 (1.9%) |
| 65 to 74 Years | 98 (13.3%) | 25 (3.1%) |
| 75 Years and over | 114 (20.0%) | 121 (29.9%) |
Disability Class: Self-Care Difficulty
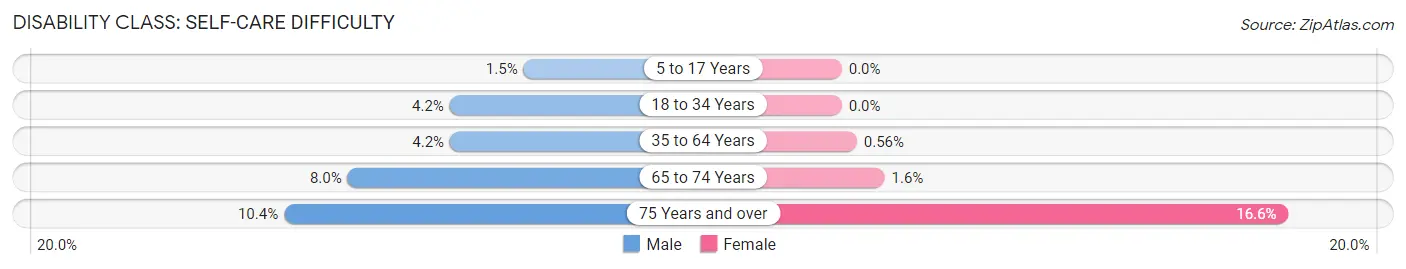
| Age Bracket | Male | Female |
| 5 to 17 Years | 20 (1.5%) | 0 (0.0%) |
| 18 to 34 Years | 57 (4.2%) | 0 (0.0%) |
| 35 to 64 Years | 123 (4.2%) | 15 (0.6%) |
| 65 to 74 Years | 59 (8.0%) | 13 (1.6%) |
| 75 Years and over | 59 (10.4%) | 67 (16.6%) |
Technology Access in Mountain Park
Computing Device Access in Mountain Park
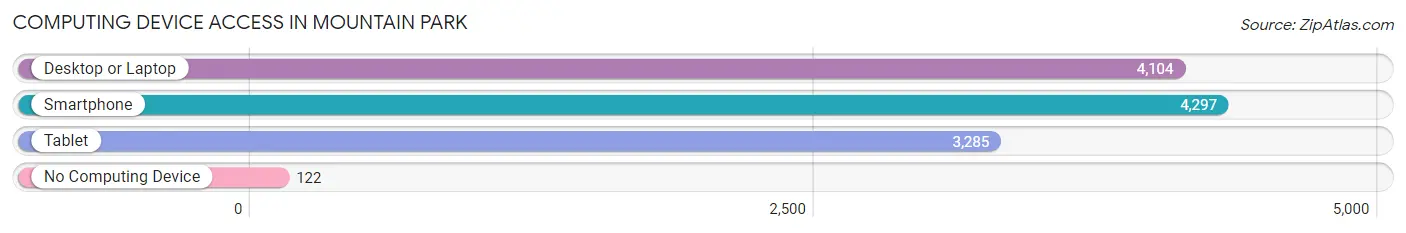
| Device Type | # Households | % Households |
| Desktop or Laptop | 4,104 | 88.3% |
| Smartphone | 4,297 | 92.4% |
| Tablet | 3,285 | 70.7% |
| No Computing Device | 122 | 2.6% |
| Total | 4,650 | 100.0% |
Internet Access in Mountain Park
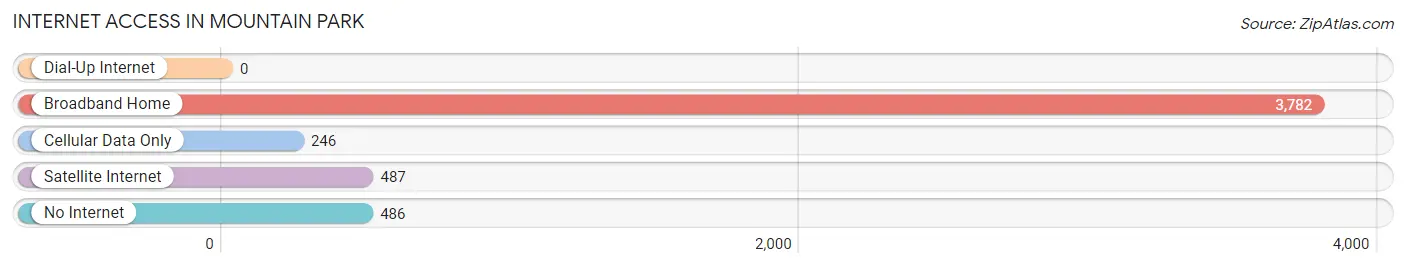
| Internet Type | # Households | % Households |
| Dial-Up Internet | 0 | 0.0% |
| Broadband Home | 3,782 | 81.3% |
| Cellular Data Only | 246 | 5.3% |
| Satellite Internet | 487 | 10.5% |
| No Internet | 486 | 10.4% |
| Total | 4,650 | 100.0% |
Mountain Park Summary
Mountain Park is a small city located in the northern part of Fulton County, Georgia, United States. It is situated in the foothills of the Appalachian Mountains, approximately 20 miles north of Atlanta. The city has a population of approximately 1,500 people and covers an area of 1.2 square miles.
History
Mountain Park was founded in the late 1800s by a group of settlers who were looking for a place to settle in the foothills of the Appalachian Mountains. The area was originally known as “Mountain Park” due to its location in the mountains. The first settlers were mostly farmers and the area was used for logging and farming. In the early 1900s, the area began to develop as a resort town, with the construction of several hotels and resorts. The area was also used for recreational activities such as fishing, hunting, and camping.
In the 1950s, the city began to experience rapid growth due to the development of the nearby city of Roswell. The city was incorporated in 1959 and has since grown to its current population of 1,500 people.
Geography
Mountain Park is located in the northern part of Fulton County, Georgia, approximately 20 miles north of Atlanta. The city is situated in the foothills of the Appalachian Mountains and is surrounded by the Chattahoochee National Forest. The city covers an area of 1.2 square miles and has an elevation of 1,000 feet. The city is located in a temperate climate zone and experiences mild winters and hot summers.
Economy
Mountain Park’s economy is largely based on tourism and recreation. The city is home to several resorts and hotels, as well as a variety of outdoor activities such as fishing, hunting, and camping. The city also has several restaurants and shops. The city is also home to a number of small businesses, including a local newspaper, a hardware store, and a grocery store.
Demographics
As of the 2010 census, the population of Mountain Park was 1,500 people. The racial makeup of the city was 94.7% White, 1.3% African American, 0.7% Asian, 0.3% Native American, and 2.7% from other races. The median household income was $50,000 and the median family income was $60,000. The per capita income was $25,000. The city has a poverty rate of 8.3%.
Conclusion
Mountain Park is a small city located in the northern part of Fulton County, Georgia, United States. It is situated in the foothills of the Appalachian Mountains and has a population of approximately 1,500 people. The city’s economy is largely based on tourism and recreation, and it is home to several resorts and hotels, as well as a variety of outdoor activities. The city has a diverse population, with a median household income of $50,000 and a poverty rate of 8.3%.
Common Questions
What is the Total Population of Mountain Park?
Total Population of Mountain Park is 13,334.
What is the Total Male Population of Mountain Park?
Total Male Population of Mountain Park is 7,238.
What is the Total Female Population of Mountain Park?
Total Female Population of Mountain Park is 6,096.
What is the Ratio of Males per 100 Females in Mountain Park?
There are 118.73 Males per 100 Females in Mountain Park.
What is the Ratio of Females per 100 Males in Mountain Park?
There are 84.22 Females per 100 Males in Mountain Park.
What is the Median Population Age in Mountain Park?
Median Population Age in Mountain Park is 46.2 Years.
What is the Average Family Size in Mountain Park
Average Family Size in Mountain Park is 3.3 People.
What is the Average Household Size in Mountain Park
Average Household Size in Mountain Park is 2.9 People.
What is Per Capita Income in Mountain Park?
Per Capita income in Mountain Park is $35,821.
What is the Median Family Income in Mountain Park?
Median Family Income in Mountain Park is $96,090.
What is the Median Household income in Mountain Park?
Median Household Income in Mountain Park is $92,718.
What is Income or Wage Gap in Mountain Park?
Income or Wage Gap in Mountain Park is 18.8%.
Women in Mountain Park earn 81.2 cents for every dollar earned by a man.
What is Inequality or Gini Index in Mountain Park?
Inequality or Gini Index in Mountain Park is 0.39.
How Large is the Labor Force in Mountain Park?
There are 6,763 People in the Labor Forcein in Mountain Park.
What is the Percentage of People in the Labor Force in Mountain Park?
60.9% of People are in the Labor Force in Mountain Park.
What is the Unemployment Rate in Mountain Park?
Unemployment Rate in Mountain Park is 3.2%.