Lithonia, GA
Lithonia Map
Lithonia Overview
2,614
TOTAL POPULATION
1,142
MALE POPULATION
1,472
FEMALE POPULATION
77.58
MALES / 100 FEMALES
128.90
FEMALES / 100 MALES
33.1
MEDIAN AGE
4.0
AVG FAMILY SIZE
2.6
AVG HOUSEHOLD SIZE
$37,638
PER CAPITA INCOME
$51,600
AVG FAMILY INCOME
$45,431
AVG HOUSEHOLD INCOME
40.4%
WAGE / INCOME GAP [ % ]
59.6¢/ $1
WAGE / INCOME GAP [ $ ]
0.60
INEQUALITY / GINI INDEX
1,408
LABOR FORCE [ PEOPLE ]
78.6%
PERCENT IN LABOR FORCE
7.3%
UNEMPLOYMENT RATE
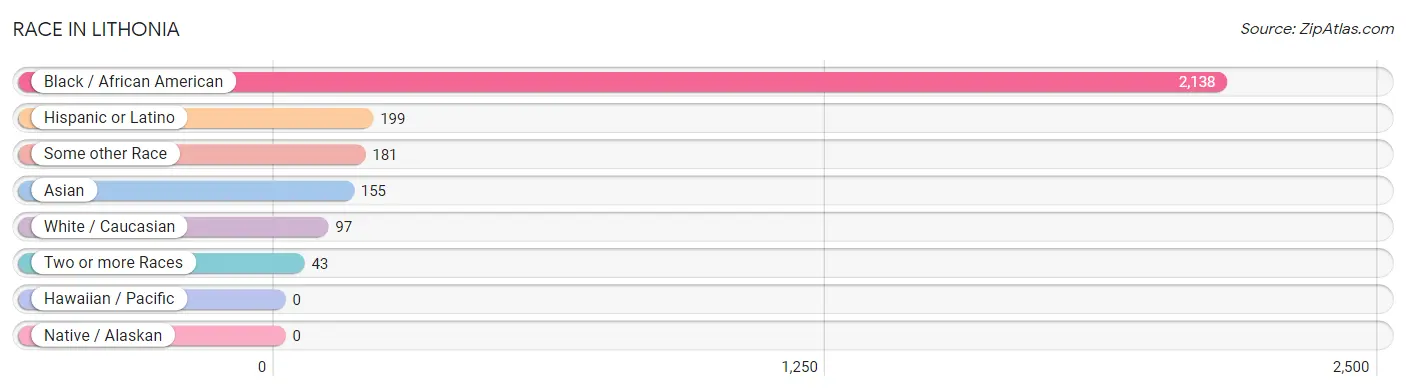
Race in Lithonia
The most populous races in Lithonia are Black / African American (2,138 | 81.8%), Hispanic or Latino (199 | 7.6%), and Some other Race (181 | 6.9%).
| Race | # Population | % Population |
| Asian | 155 | 5.9% |
| Black / African American | 2,138 | 81.8% |
| Hawaiian / Pacific | 0 | 0.0% |
| Hispanic or Latino | 199 | 7.6% |
| Native / Alaskan | 0 | 0.0% |
| White / Caucasian | 97 | 3.7% |
| Two or more Races | 43 | 1.6% |
| Some other Race | 181 | 6.9% |
| Total | 2,614 | 100.0% |
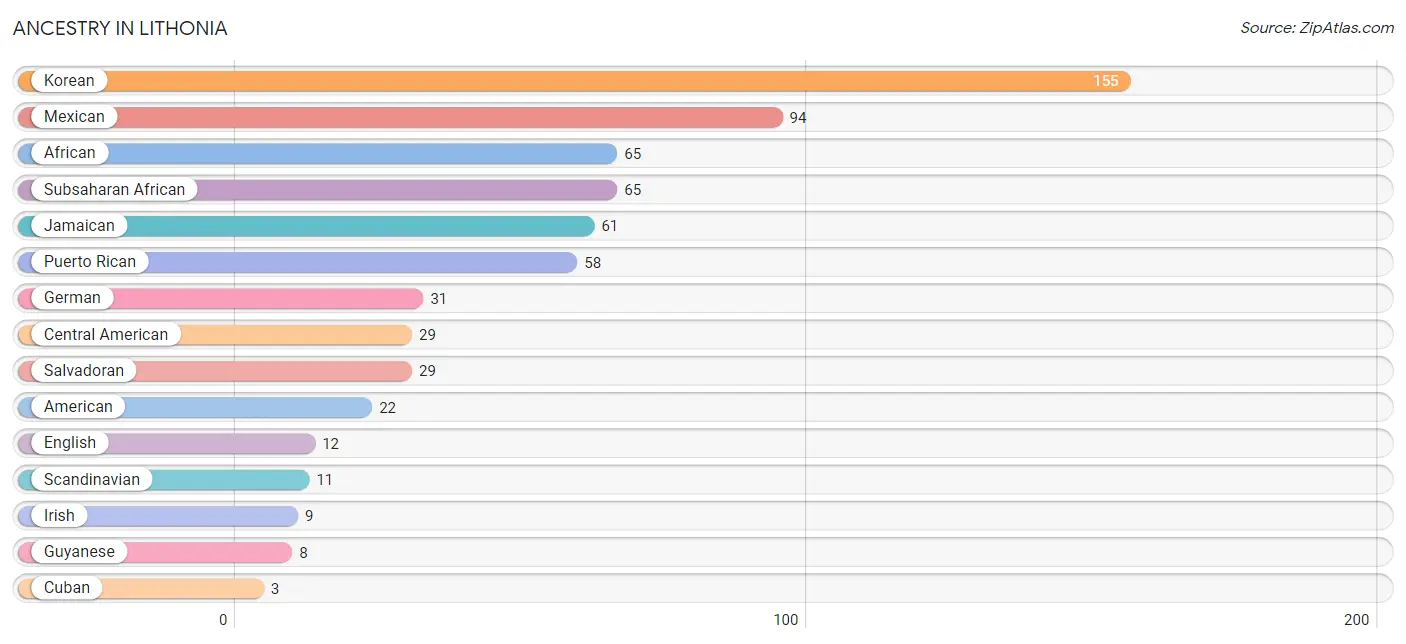
Ancestry in Lithonia
The most populous ancestries reported in Lithonia are Korean (155 | 5.9%), Mexican (94 | 3.6%), African (65 | 2.5%), Subsaharan African (65 | 2.5%), and Jamaican (61 | 2.3%), together accounting for 16.8% of all Lithonia residents.
| Ancestry | # Population | % Population |
| African | 65 | 2.5% |
| American | 22 | 0.8% |
| Central American | 29 | 1.1% |
| Cuban | 3 | 0.1% |
| English | 12 | 0.5% |
| German | 31 | 1.2% |
| Guyanese | 8 | 0.3% |
| Irish | 9 | 0.3% |
| Jamaican | 61 | 2.3% |
| Korean | 155 | 5.9% |
| Mexican | 94 | 3.6% |
| Peruvian | 2 | 0.1% |
| Puerto Rican | 58 | 2.2% |
| Salvadoran | 29 | 1.1% |
| Scandinavian | 11 | 0.4% |
| Scottish | 1 | 0.0% |
| South American | 2 | 0.1% |
| Subsaharan African | 65 | 2.5% | View All 18 Rows |
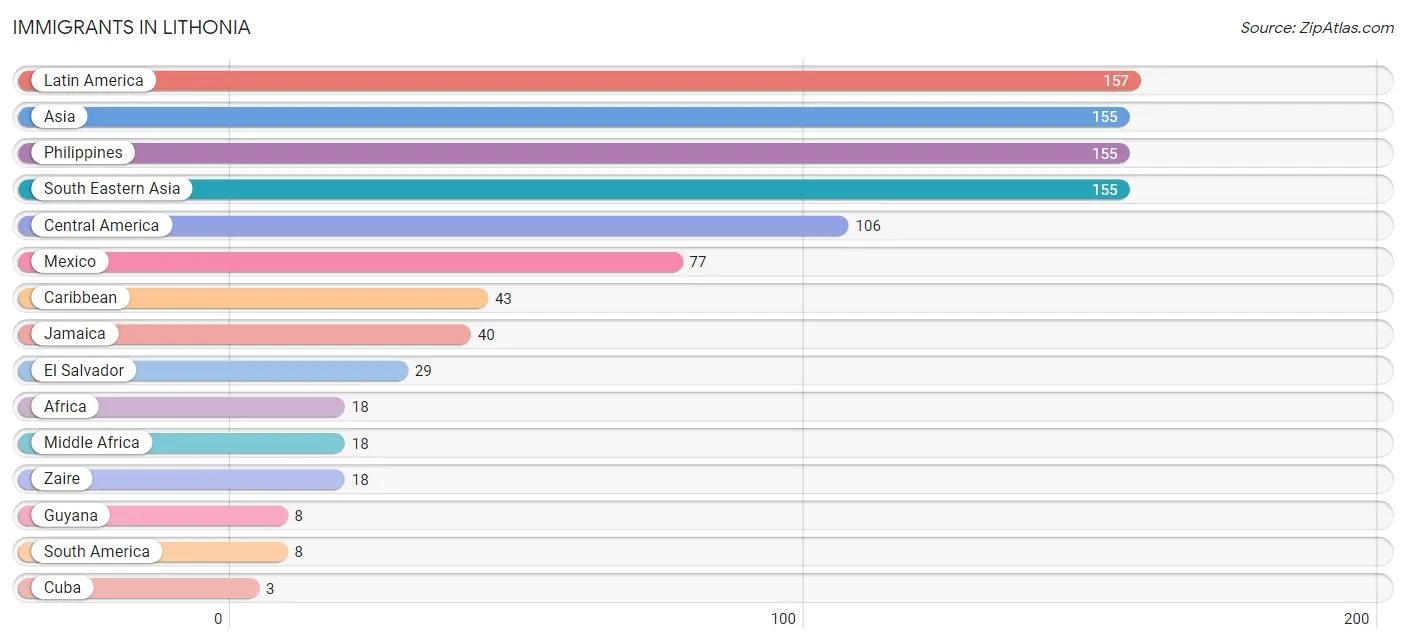
Immigrants in Lithonia
The most numerous immigrant groups reported in Lithonia came from Latin America (157 | 6.0%), Asia (155 | 5.9%), Philippines (155 | 5.9%), South Eastern Asia (155 | 5.9%), and Central America (106 | 4.1%), together accounting for 27.9% of all Lithonia residents.
| Immigration Origin | # Population | % Population |
| Africa | 18 | 0.7% |
| Asia | 155 | 5.9% |
| Caribbean | 43 | 1.6% |
| Central America | 106 | 4.1% |
| Cuba | 3 | 0.1% |
| El Salvador | 29 | 1.1% |
| Guyana | 8 | 0.3% |
| Jamaica | 40 | 1.5% |
| Latin America | 157 | 6.0% |
| Mexico | 77 | 2.9% |
| Middle Africa | 18 | 0.7% |
| Philippines | 155 | 5.9% |
| South America | 8 | 0.3% |
| South Eastern Asia | 155 | 5.9% |
| Zaire | 18 | 0.7% | View All 15 Rows |
Sex and Age in Lithonia
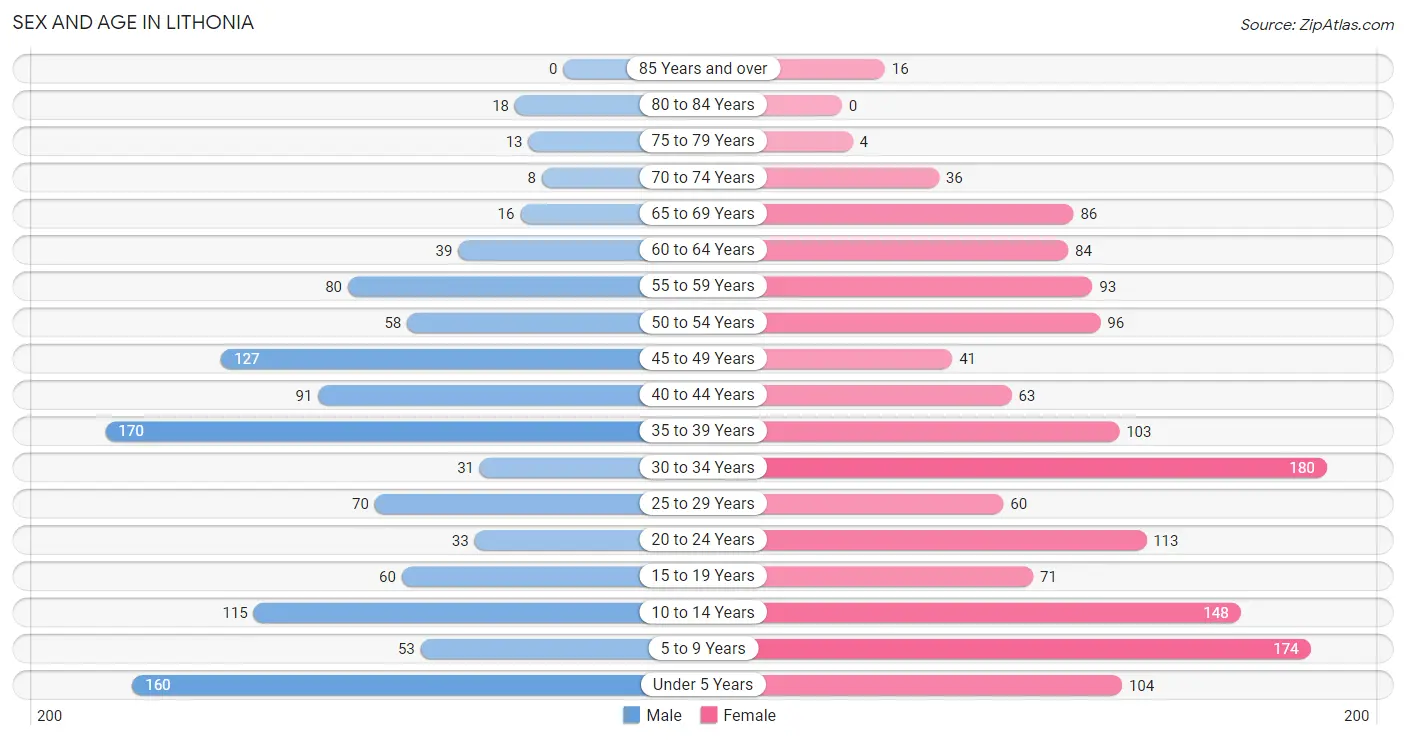
Sex and Age in Lithonia
The most populous age groups in Lithonia are 35 to 39 Years (170 | 14.9%) for men and 30 to 34 Years (180 | 12.2%) for women.
| Age Bracket | Male | Female |
| Under 5 Years | 160 (14.0%) | 104 (7.1%) |
| 5 to 9 Years | 53 (4.6%) | 174 (11.8%) |
| 10 to 14 Years | 115 (10.1%) | 148 (10.1%) |
| 15 to 19 Years | 60 (5.2%) | 71 (4.8%) |
| 20 to 24 Years | 33 (2.9%) | 113 (7.7%) |
| 25 to 29 Years | 70 (6.1%) | 60 (4.1%) |
| 30 to 34 Years | 31 (2.7%) | 180 (12.2%) |
| 35 to 39 Years | 170 (14.9%) | 103 (7.0%) |
| 40 to 44 Years | 91 (8.0%) | 63 (4.3%) |
| 45 to 49 Years | 127 (11.1%) | 41 (2.8%) |
| 50 to 54 Years | 58 (5.1%) | 96 (6.5%) |
| 55 to 59 Years | 80 (7.0%) | 93 (6.3%) |
| 60 to 64 Years | 39 (3.4%) | 84 (5.7%) |
| 65 to 69 Years | 16 (1.4%) | 86 (5.8%) |
| 70 to 74 Years | 8 (0.7%) | 36 (2.5%) |
| 75 to 79 Years | 13 (1.1%) | 4 (0.3%) |
| 80 to 84 Years | 18 (1.6%) | 0 (0.0%) |
| 85 Years and over | 0 (0.0%) | 16 (1.1%) |
| Total | 1,142 (100.0%) | 1,472 (100.0%) |
Families and Households in Lithonia
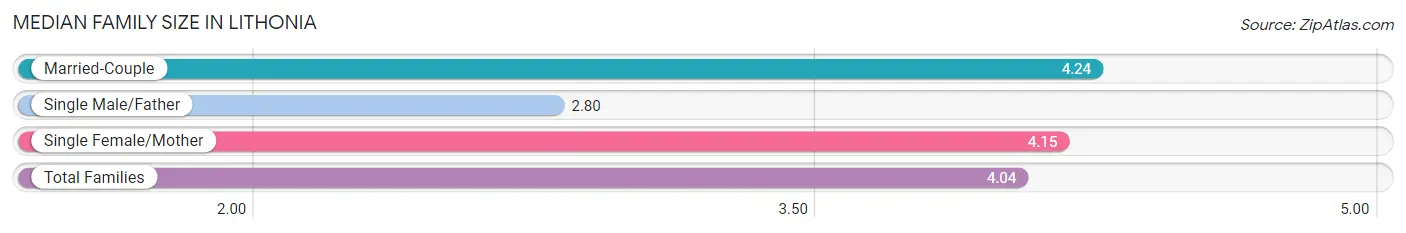
Median Family Size in Lithonia
The median family size in Lithonia is 4.04 persons per family, with married-couple families (115 | 25.0%) accounting for the largest median family size of 4.24 persons per family. On the other hand, single male/father families (45 | 9.8%) represent the smallest median family size with 2.80 persons per family.
| Family Type | # Families | Family Size |
| Married-Couple | 115 (25.0%) | 4.24 |
| Single Male/Father | 45 (9.8%) | 2.80 |
| Single Female/Mother | 300 (65.2%) | 4.15 |
| Total Families | 460 (100.0%) | 4.04 |
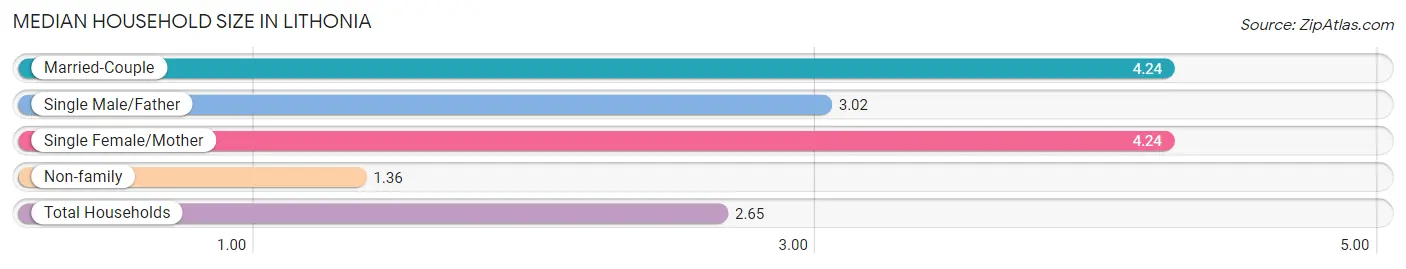
Median Household Size in Lithonia
The median household size in Lithonia is 2.65 persons per household, with married-couple households (115 | 11.7%) accounting for the largest median household size of 4.24 persons per household. non-family households (524 | 53.2%) represent the smallest median household size with 1.36 persons per household.
| Household Type | # Households | Household Size |
| Married-Couple | 115 (11.7%) | 4.24 |
| Single Male/Father | 45 (4.6%) | 3.02 |
| Single Female/Mother | 300 (30.5%) | 4.24 |
| Non-family | 524 (53.2%) | 1.36 |
| Total Households | 984 (100.0%) | 2.65 |
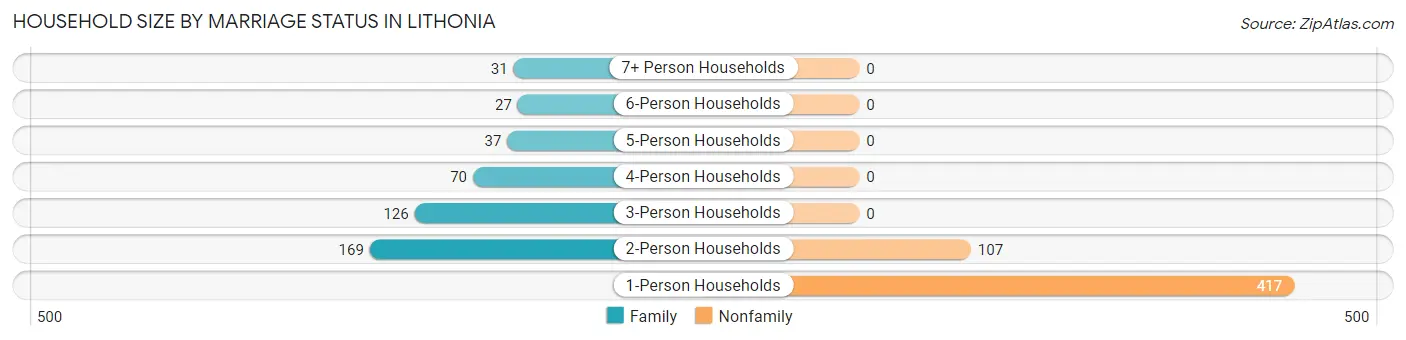
Household Size by Marriage Status in Lithonia
Out of a total of 984 households in Lithonia, 460 (46.8%) are family households, while 524 (53.2%) are nonfamily households. The most numerous type of family households are 2-person households, comprising 169, and the most common type of nonfamily households are 1-person households, comprising 417.
| Household Size | Family Households | Nonfamily Households |
| 1-Person Households | - | 417 (42.4%) |
| 2-Person Households | 169 (17.2%) | 107 (10.9%) |
| 3-Person Households | 126 (12.8%) | 0 (0.0%) |
| 4-Person Households | 70 (7.1%) | 0 (0.0%) |
| 5-Person Households | 37 (3.8%) | 0 (0.0%) |
| 6-Person Households | 27 (2.7%) | 0 (0.0%) |
| 7+ Person Households | 31 (3.2%) | 0 (0.0%) |
| Total | 460 (46.8%) | 524 (53.2%) |
Female Fertility in Lithonia
Fertility by Age in Lithonia
Average fertility rate in Lithonia is 74.0 births per 1,000 women. Women in the age bracket of 35 to 50 years have the highest fertility rate with 106.0 births per 1,000 women. Women in the age bracket of 20 to 34 years acount for 50.0% of all women with births.
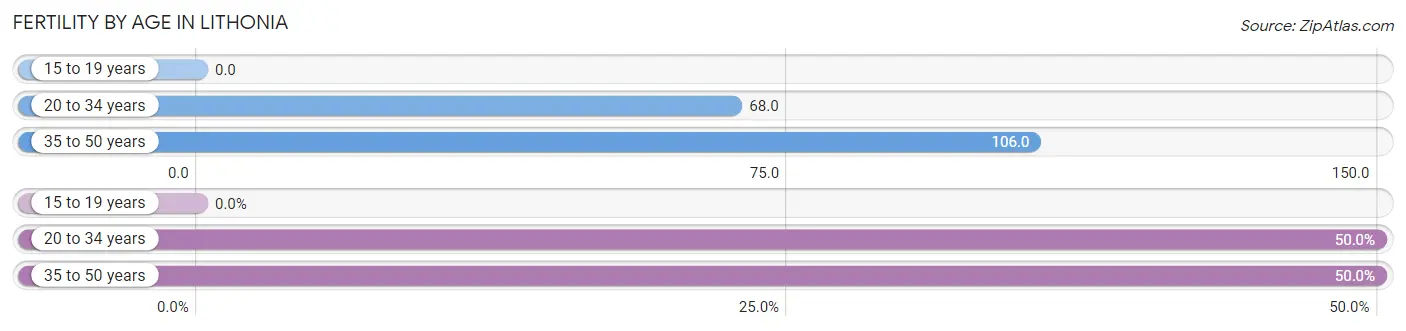
| Age Bracket | Women with Births | Births / 1,000 Women |
| 15 to 19 years | 0 (0.0%) | 0.0 |
| 20 to 34 years | 24 (50.0%) | 68.0 |
| 35 to 50 years | 24 (50.0%) | 106.0 |
| Total | 48 (100.0%) | 74.0 |
Fertility by Age by Marriage Status in Lithonia
50.0% of women with births (48) in Lithonia are married. The highest percentage of unmarried women with births falls into 20 to 34 years age bracket with 100.0% of them unmarried at the time of birth, while the lowest percentage of unmarried women with births belong to 35 to 50 years age bracket with 0.0% of them unmarried.
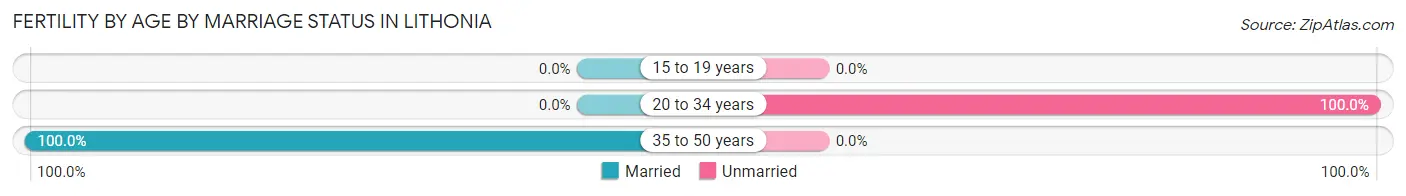
| Age Bracket | Married | Unmarried |
| 15 to 19 years | 0 (0.0%) | 0 (0.0%) |
| 20 to 34 years | 0 (0.0%) | 24 (100.0%) |
| 35 to 50 years | 24 (100.0%) | 0 (0.0%) |
| Total | 24 (50.0%) | 24 (50.0%) |
Fertility by Education in Lithonia
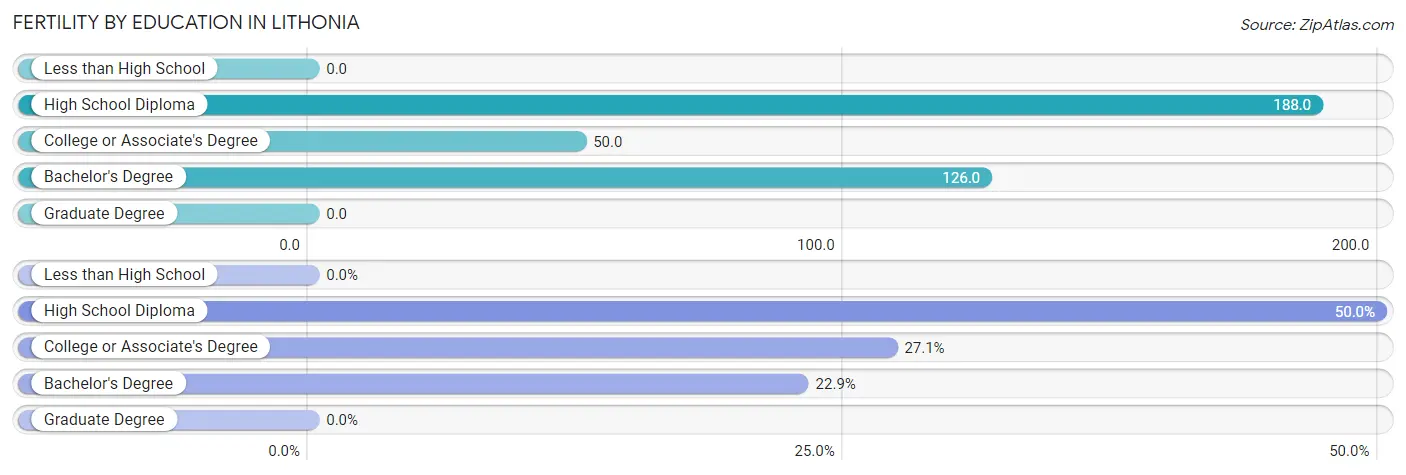
| Educational Attainment | Women with Births | Births / 1,000 Women |
| Less than High School | 0 (0.0%) | 0.0 |
| High School Diploma | 24 (50.0%) | 188.0 |
| College or Associate's Degree | 13 (27.1%) | 50.0 |
| Bachelor's Degree | 11 (22.9%) | 126.0 |
| Graduate Degree | 0 (0.0%) | 0.0 |
| Total | 48 (100.0%) | 74.0 |
Fertility by Education by Marriage Status in Lithonia
50.0% of women with births in Lithonia are unmarried. Women with the educational attainment of college or associate's degree are most likely to be married with 100.0% of them married at childbirth, while women with the educational attainment of high school diploma are least likely to be married with 100.0% of them unmarried at childbirth.
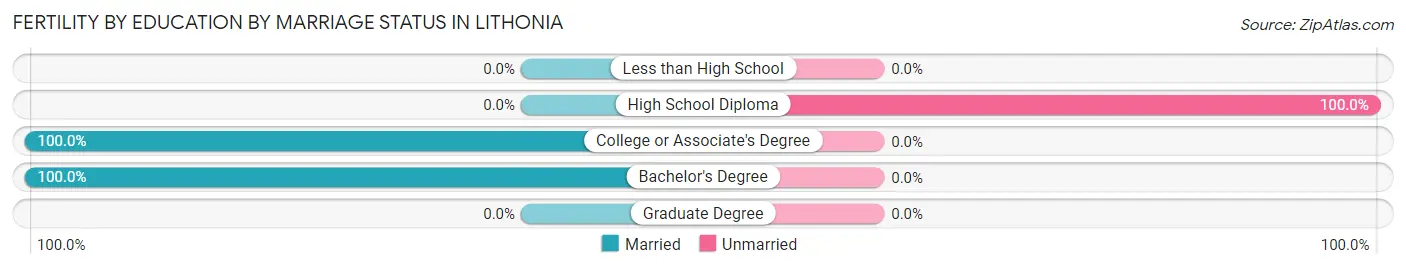
| Educational Attainment | Married | Unmarried |
| Less than High School | 0 (0.0%) | 0 (0.0%) |
| High School Diploma | 0 (0.0%) | 24 (100.0%) |
| College or Associate's Degree | 13 (100.0%) | 0 (0.0%) |
| Bachelor's Degree | 11 (100.0%) | 0 (0.0%) |
| Graduate Degree | 0 (0.0%) | 0 (0.0%) |
| Total | 24 (50.0%) | 24 (50.0%) |
Income in Lithonia
Income Overview in Lithonia
Per Capita Income in Lithonia is $37,638, while median incomes of families and households are $51,600 and $45,431 respectively.
| Characteristic | Number | Measure |
| Per Capita Income | 2,614 | $37,638 |
| Median Family Income | 460 | $51,600 |
| Mean Family Income | 460 | $101,615 |
| Median Household Income | 984 | $45,431 |
| Mean Household Income | 984 | $80,943 |
| Income Deficit | 460 | $0 |
| Wage / Income Gap (%) | 2,614 | 40.41% |
| Wage / Income Gap ($) | 2,614 | 59.59¢ per $1 |
| Gini / Inequality Index | 2,614 | 0.60 |
Earnings by Sex in Lithonia
Average Earnings in Lithonia are $33,872, $46,090 for men and $27,464 for women, a difference of 40.4%.
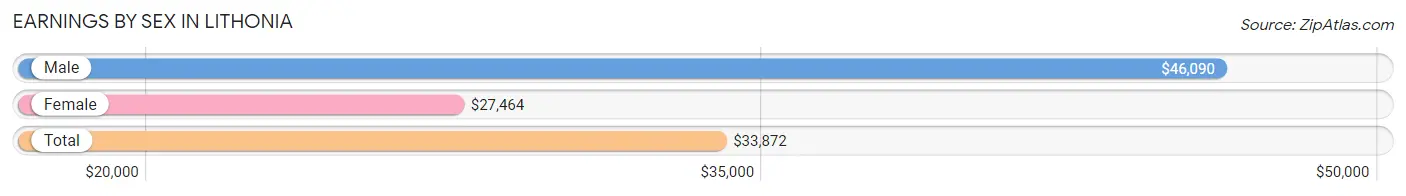
| Sex | Number | Average Earnings |
| Male | 672 (47.0%) | $46,090 |
| Female | 759 (53.0%) | $27,464 |
| Total | 1,431 (100.0%) | $33,872 |
Earnings by Sex by Income Bracket in Lithonia
The most common earnings brackets in Lithonia are $100,000+ for men (170 | 25.3%) and $100,000+ for women (98 | 12.9%).
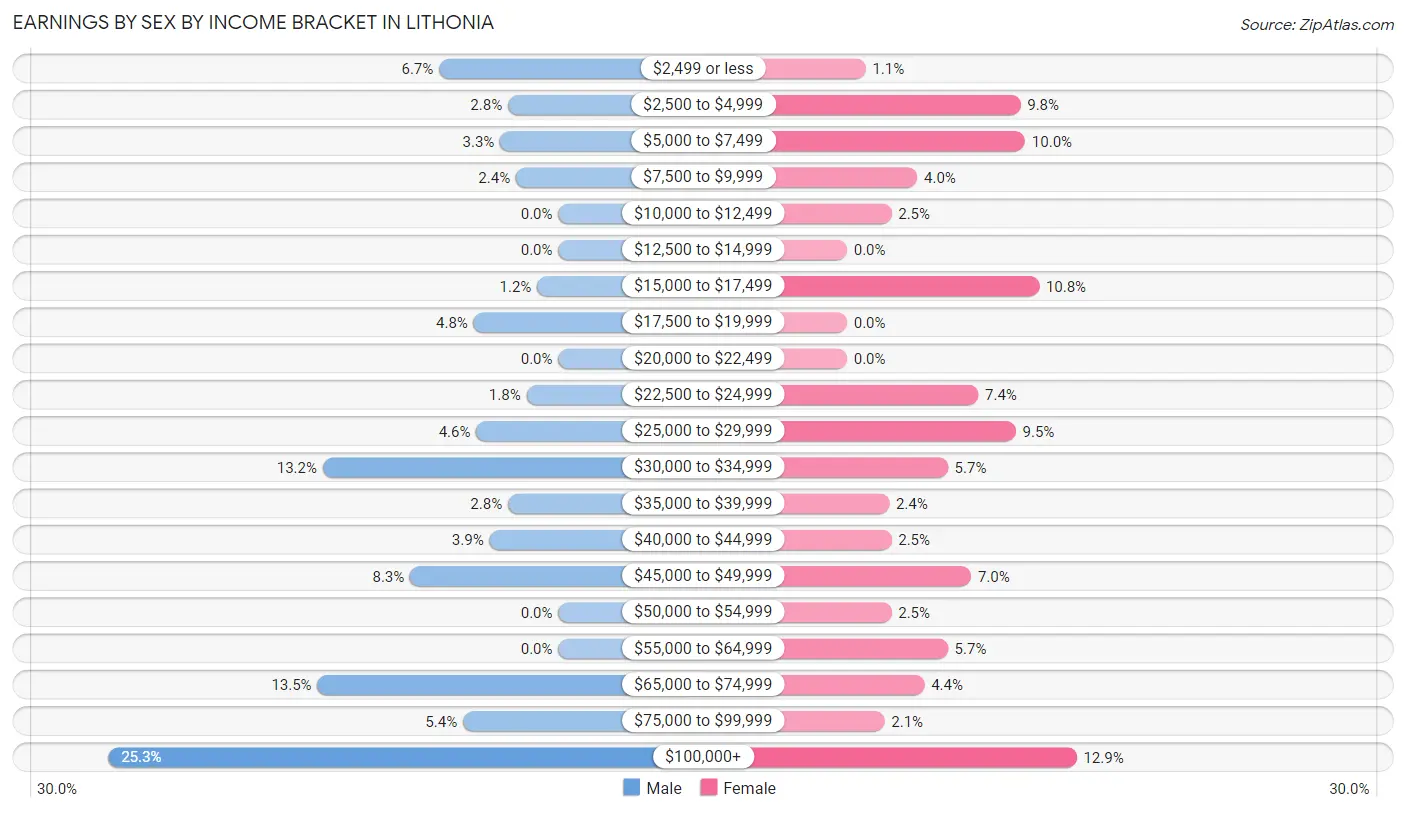
| Income | Male | Female |
| $2,499 or less | 45 (6.7%) | 8 (1.1%) |
| $2,500 to $4,999 | 19 (2.8%) | 74 (9.8%) |
| $5,000 to $7,499 | 22 (3.3%) | 76 (10.0%) |
| $7,500 to $9,999 | 16 (2.4%) | 30 (4.0%) |
| $10,000 to $12,499 | 0 (0.0%) | 19 (2.5%) |
| $12,500 to $14,999 | 0 (0.0%) | 0 (0.0%) |
| $15,000 to $17,499 | 8 (1.2%) | 82 (10.8%) |
| $17,500 to $19,999 | 32 (4.8%) | 0 (0.0%) |
| $20,000 to $22,499 | 0 (0.0%) | 0 (0.0%) |
| $22,500 to $24,999 | 12 (1.8%) | 56 (7.4%) |
| $25,000 to $29,999 | 31 (4.6%) | 72 (9.5%) |
| $30,000 to $34,999 | 89 (13.2%) | 43 (5.7%) |
| $35,000 to $39,999 | 19 (2.8%) | 18 (2.4%) |
| $40,000 to $44,999 | 26 (3.9%) | 19 (2.5%) |
| $45,000 to $49,999 | 56 (8.3%) | 53 (7.0%) |
| $50,000 to $54,999 | 0 (0.0%) | 19 (2.5%) |
| $55,000 to $64,999 | 0 (0.0%) | 43 (5.7%) |
| $65,000 to $74,999 | 91 (13.5%) | 33 (4.3%) |
| $75,000 to $99,999 | 36 (5.4%) | 16 (2.1%) |
| $100,000+ | 170 (25.3%) | 98 (12.9%) |
| Total | 672 (100.0%) | 759 (100.0%) |
Earnings by Sex by Educational Attainment in Lithonia
Average earnings in Lithonia are $48,088 for men and $32,031 for women, a difference of 33.4%. Men with an educational attainment of graduate degree enjoy the highest average annual earnings of $121,384, while those with college or associate's degree education earn the least with $24,688. Women with an educational attainment of graduate degree earn the most with the average annual earnings of $61,172, while those with less than high school education have the smallest earnings of $16,333.
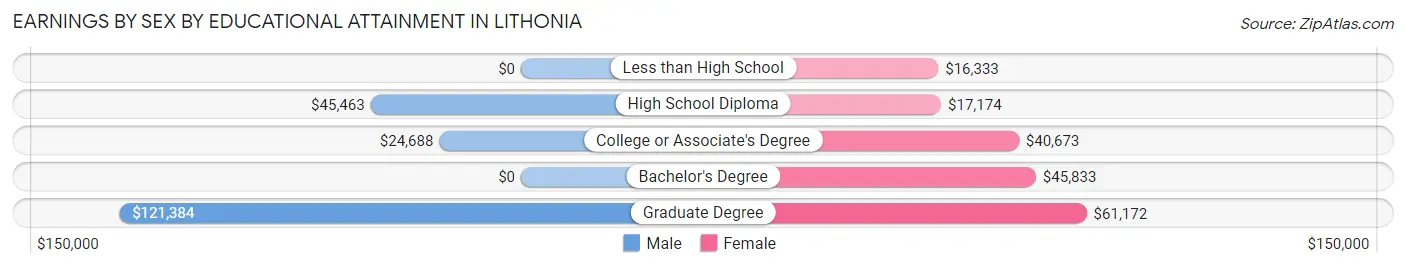
| Educational Attainment | Male Income | Female Income |
| Less than High School | - | - |
| High School Diploma | $45,463 | $17,174 |
| College or Associate's Degree | $24,688 | $40,673 |
| Bachelor's Degree | - | - |
| Graduate Degree | $121,384 | $61,172 |
| Total | $48,088 | $32,031 |
Family Income in Lithonia
Family Income Brackets in Lithonia
According to the Lithonia family income data, there are 133 families falling into the $50,000 to $74,999 income range, which is the most common income bracket and makes up 28.9% of all families. Conversely, the $10,000 to $14,999 income bracket is the least frequent group with only 8 families (1.7%) belonging to this category.
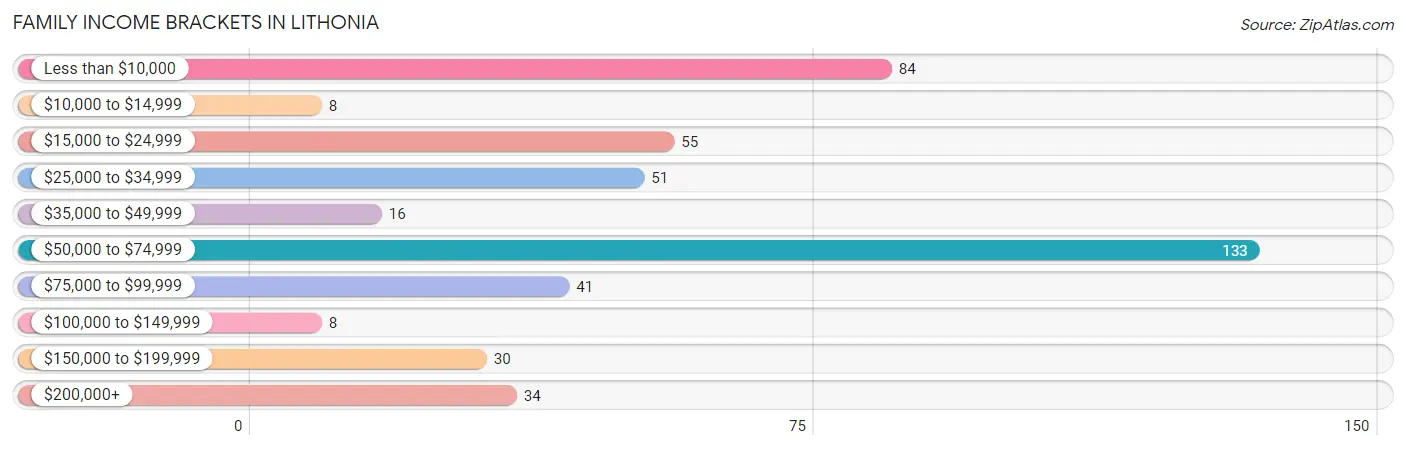
| Income Bracket | # Families | % Families |
| Less than $10,000 | 84 | 18.3% |
| $10,000 to $14,999 | 8 | 1.7% |
| $15,000 to $24,999 | 55 | 12.0% |
| $25,000 to $34,999 | 51 | 11.1% |
| $35,000 to $49,999 | 16 | 3.5% |
| $50,000 to $74,999 | 133 | 28.9% |
| $75,000 to $99,999 | 41 | 8.9% |
| $100,000 to $149,999 | 8 | 1.7% |
| $150,000 to $199,999 | 30 | 6.5% |
| $200,000+ | 34 | 7.4% |
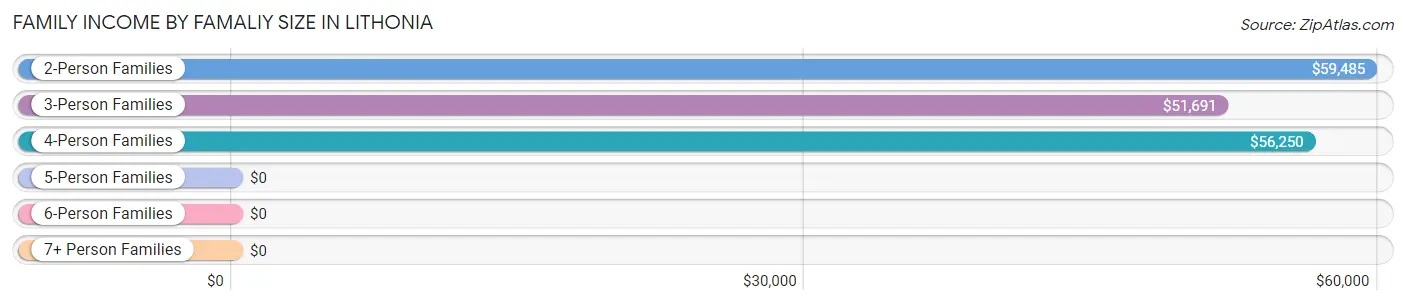
Family Income by Famaliy Size in Lithonia
2-person families (179 | 38.9%) account for the highest median family income in Lithonia with $59,485 per family, while 2-person families (179 | 38.9%) have the highest median income of $29,742 per family member.
| Income Bracket | # Families | Median Income |
| 2-Person Families | 179 (38.9%) | $59,485 |
| 3-Person Families | 143 (31.1%) | $51,691 |
| 4-Person Families | 43 (9.3%) | $56,250 |
| 5-Person Families | 37 (8.0%) | $0 |
| 6-Person Families | 27 (5.9%) | $0 |
| 7+ Person Families | 31 (6.7%) | $0 |
| Total | 460 (100.0%) | $51,600 |
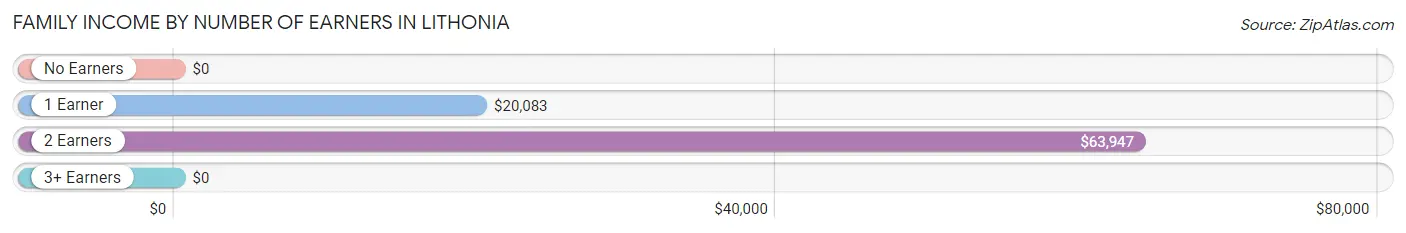
Family Income by Number of Earners in Lithonia
| Number of Earners | # Families | Median Income |
| No Earners | 29 (6.3%) | $0 |
| 1 Earner | 189 (41.1%) | $20,083 |
| 2 Earners | 230 (50.0%) | $63,947 |
| 3+ Earners | 12 (2.6%) | $0 |
| Total | 460 (100.0%) | $51,600 |
Household Income in Lithonia
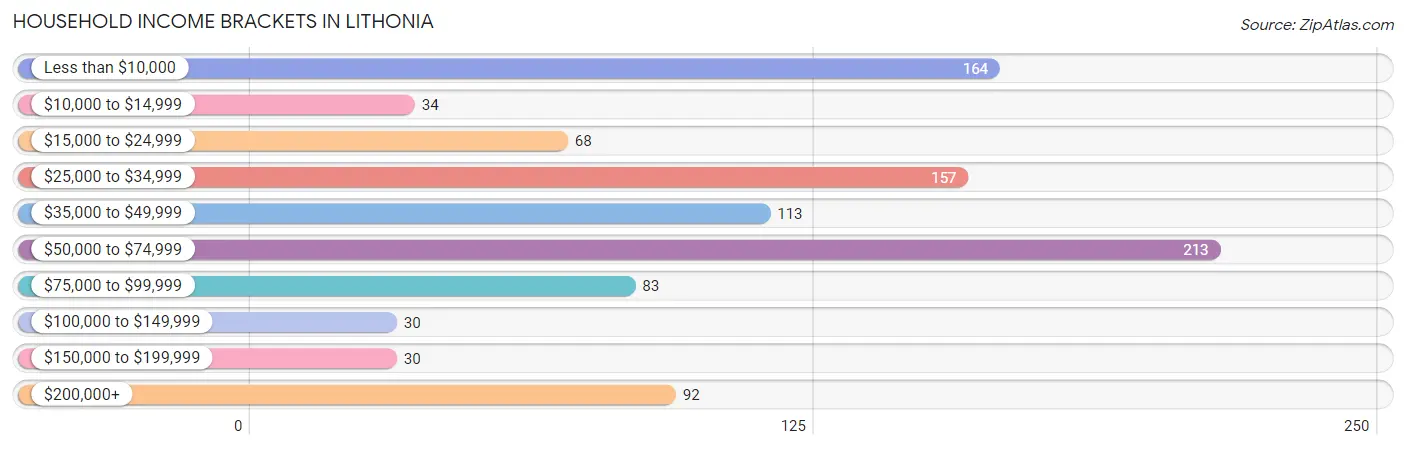
Household Income Brackets in Lithonia
With 213 households falling in the category, the $50,000 to $74,999 income range is the most frequent in Lithonia, accounting for 21.6% of all households. In contrast, only 30 households (3.0%) fall into the $100,000 to $149,999 income bracket, making it the least populous group.
| Income Bracket | # Households | % Households |
| Less than $10,000 | 164 | 16.7% |
| $10,000 to $14,999 | 34 | 3.5% |
| $15,000 to $24,999 | 68 | 6.9% |
| $25,000 to $34,999 | 157 | 16.0% |
| $35,000 to $49,999 | 113 | 11.5% |
| $50,000 to $74,999 | 213 | 21.6% |
| $75,000 to $99,999 | 83 | 8.4% |
| $100,000 to $149,999 | 30 | 3.0% |
| $150,000 to $199,999 | 30 | 3.0% |
| $200,000+ | 92 | 9.3% |
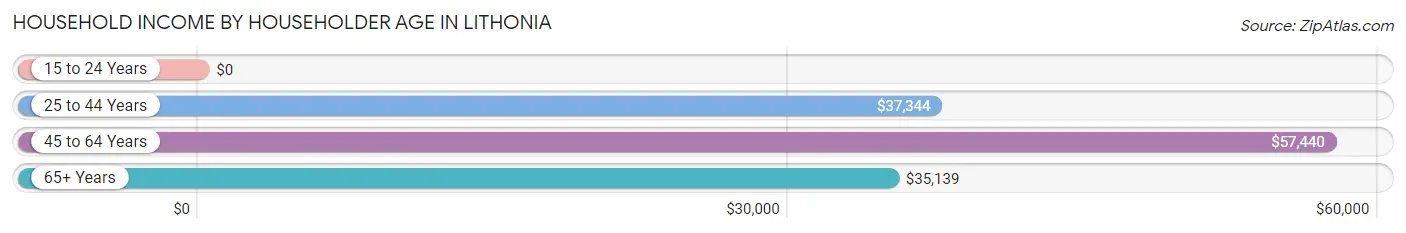
Household Income by Householder Age in Lithonia
The median household income in Lithonia is $45,431, with the highest median household income of $57,440 found in the 45 to 64 years age bracket for the primary householder. A total of 367 households (37.3%) fall into this category. Meanwhile, the 15 to 24 years age bracket for the primary householder has the lowest median household income of $0, with 59 households (6.0%) in this group.
| Income Bracket | # Households | Median Income |
| 15 to 24 Years | 59 (6.0%) | $0 |
| 25 to 44 Years | 411 (41.8%) | $37,344 |
| 45 to 64 Years | 367 (37.3%) | $57,440 |
| 65+ Years | 147 (14.9%) | $35,139 |
| Total | 984 (100.0%) | $45,431 |
Poverty in Lithonia
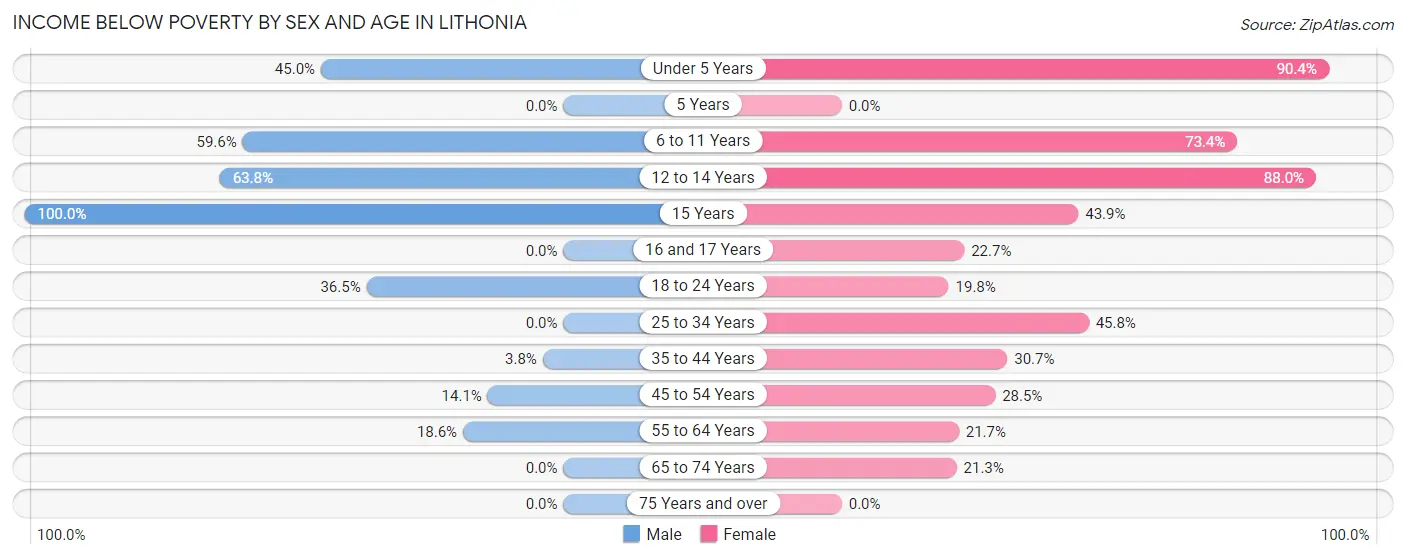
Income Below Poverty by Sex and Age in Lithonia
With 24.0% poverty level for males and 42.9% for females among the residents of Lithonia, 15 year old males and under 5 year old females are the most vulnerable to poverty, with 28 males (100.0%) and 94 females (90.4%) in their respective age groups living below the poverty level.
| Age Bracket | Male | Female |
| Under 5 Years | 72 (45.0%) | 94 (90.4%) |
| 5 Years | 0 (0.0%) | 0 (0.0%) |
| 6 to 11 Years | 53 (59.6%) | 138 (73.4%) |
| 12 to 14 Years | 44 (63.8%) | 88 (88.0%) |
| 15 Years | 28 (100.0%) | 18 (43.9%) |
| 16 and 17 Years | 0 (0.0%) | 5 (22.7%) |
| 18 to 24 Years | 19 (36.5%) | 24 (19.8%) |
| 25 to 34 Years | 0 (0.0%) | 110 (45.8%) |
| 35 to 44 Years | 10 (3.8%) | 51 (30.7%) |
| 45 to 54 Years | 26 (14.1%) | 39 (28.5%) |
| 55 to 64 Years | 22 (18.6%) | 38 (21.7%) |
| 65 to 74 Years | 0 (0.0%) | 26 (21.3%) |
| 75 Years and over | 0 (0.0%) | 0 (0.0%) |
| Total | 274 (24.0%) | 631 (42.9%) |
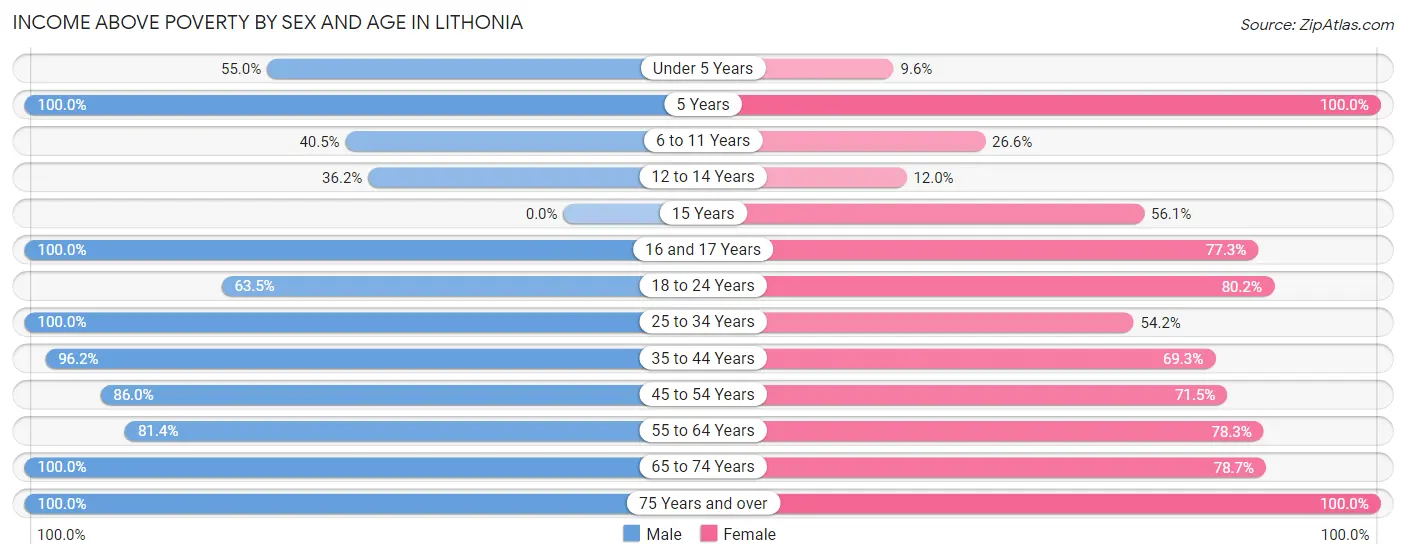
Income Above Poverty by Sex and Age in Lithonia
According to the poverty statistics in Lithonia, males aged 5 years and females aged 5 years are the age groups that are most secure financially, with 100.0% of males and 100.0% of females in these age groups living above the poverty line.
| Age Bracket | Male | Female |
| Under 5 Years | 88 (55.0%) | 10 (9.6%) |
| 5 Years | 10 (100.0%) | 34 (100.0%) |
| 6 to 11 Years | 36 (40.5%) | 50 (26.6%) |
| 12 to 14 Years | 25 (36.2%) | 12 (12.0%) |
| 15 Years | 0 (0.0%) | 23 (56.1%) |
| 16 and 17 Years | 13 (100.0%) | 17 (77.3%) |
| 18 to 24 Years | 33 (63.5%) | 97 (80.2%) |
| 25 to 34 Years | 101 (100.0%) | 130 (54.2%) |
| 35 to 44 Years | 251 (96.2%) | 115 (69.3%) |
| 45 to 54 Years | 159 (86.0%) | 98 (71.5%) |
| 55 to 64 Years | 96 (81.4%) | 137 (78.3%) |
| 65 to 74 Years | 24 (100.0%) | 96 (78.7%) |
| 75 Years and over | 30 (100.0%) | 20 (100.0%) |
| Total | 866 (76.0%) | 839 (57.1%) |
Income Below Poverty Among Married-Couple Families in Lithonia
| Children | Above Poverty | Below Poverty |
| No Children | 52 (100.0%) | 0 (0.0%) |
| 1 or 2 Children | 41 (100.0%) | 0 (0.0%) |
| 3 or 4 Children | 10 (100.0%) | 0 (0.0%) |
| 5 or more Children | 12 (100.0%) | 0 (0.0%) |
| Total | 115 (100.0%) | 0 (0.0%) |
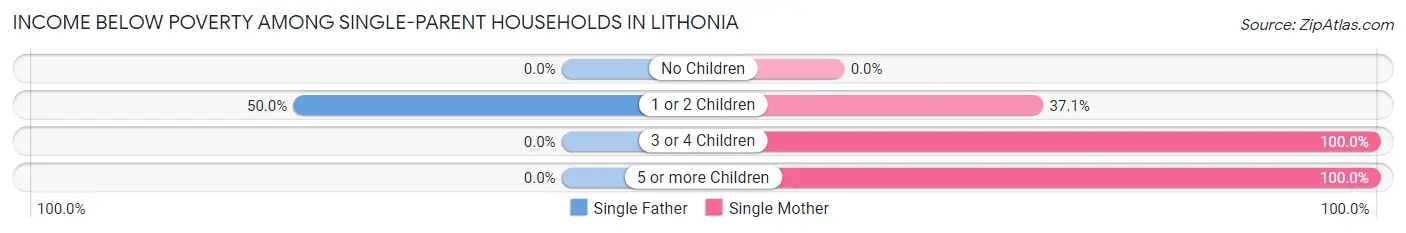
Income Below Poverty Among Single-Parent Households in Lithonia
According to the poverty data in Lithonia, 22.2% or 10 single-father households and 46.3% or 139 single-mother households are living below the poverty line. Among single-father households, those with 1 or 2 children have the highest poverty rate, with 10 households (50.0%) experiencing poverty. Likewise, among single-mother households, those with 3 or 4 children have the highest poverty rate, with 67 households (100.0%) falling below the poverty line.
| Children | Single Father | Single Mother |
| No Children | 0 (0.0%) | 0 (0.0%) |
| 1 or 2 Children | 10 (50.0%) | 53 (37.1%) |
| 3 or 4 Children | 0 (0.0%) | 67 (100.0%) |
| 5 or more Children | 0 (0.0%) | 19 (100.0%) |
| Total | 10 (22.2%) | 139 (46.3%) |
Income Below Poverty Among Married-Couple vs Single-Parent Households in Lithonia
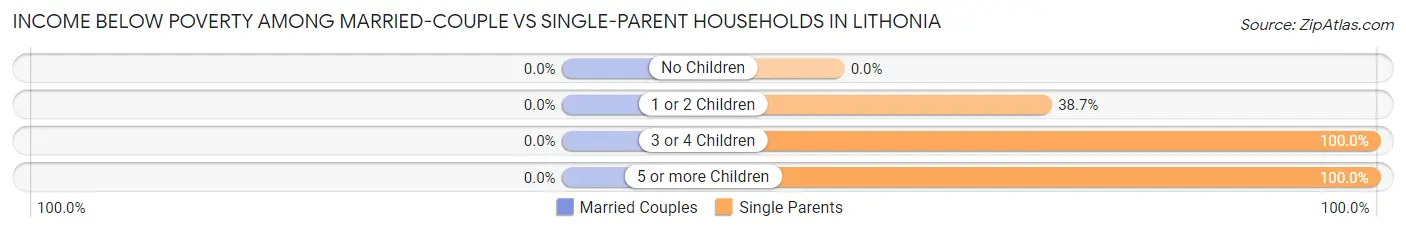
| Children | Married-Couple Families | Single-Parent Households |
| No Children | 0 (0.0%) | 0 (0.0%) |
| 1 or 2 Children | 0 (0.0%) | 63 (38.7%) |
| 3 or 4 Children | 0 (0.0%) | 67 (100.0%) |
| 5 or more Children | 0 (0.0%) | 19 (100.0%) |
| Total | 0 (0.0%) | 149 (43.2%) |
Employment Characteristics in Lithonia
Employment by Class of Employer in Lithonia
Among the 1,305 employed individuals in Lithonia, private company employees (937 | 71.8%), self-employed (not incorporated) (107 | 8.2%), and not-for-profit organizations (88 | 6.7%) make up the most common classes of employment.
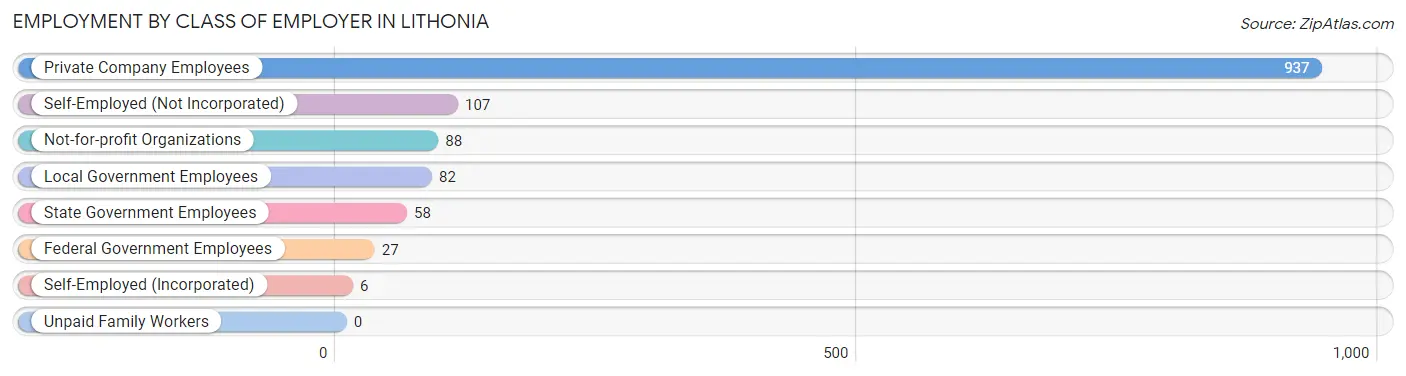
| Employer Class | # Employees | % Employees |
| Private Company Employees | 937 | 71.8% |
| Self-Employed (Incorporated) | 6 | 0.5% |
| Self-Employed (Not Incorporated) | 107 | 8.2% |
| Not-for-profit Organizations | 88 | 6.7% |
| Local Government Employees | 82 | 6.3% |
| State Government Employees | 58 | 4.4% |
| Federal Government Employees | 27 | 2.1% |
| Unpaid Family Workers | 0 | 0.0% |
| Total | 1,305 | 100.0% |
Employment Status by Age in Lithonia
According to the labor force statistics for Lithonia, out of the total population over 16 years of age (1,791), 78.6% or 1,408 individuals are in the labor force, with 7.3% or 103 of them unemployed. The age group with the highest labor force participation rate is 20 to 24 years, with 100.0% or 146 individuals in the labor force. Within the labor force, the 25 to 29 years age range has the highest percentage of unemployed individuals, with 19.8% or 20 of them being unemployed.
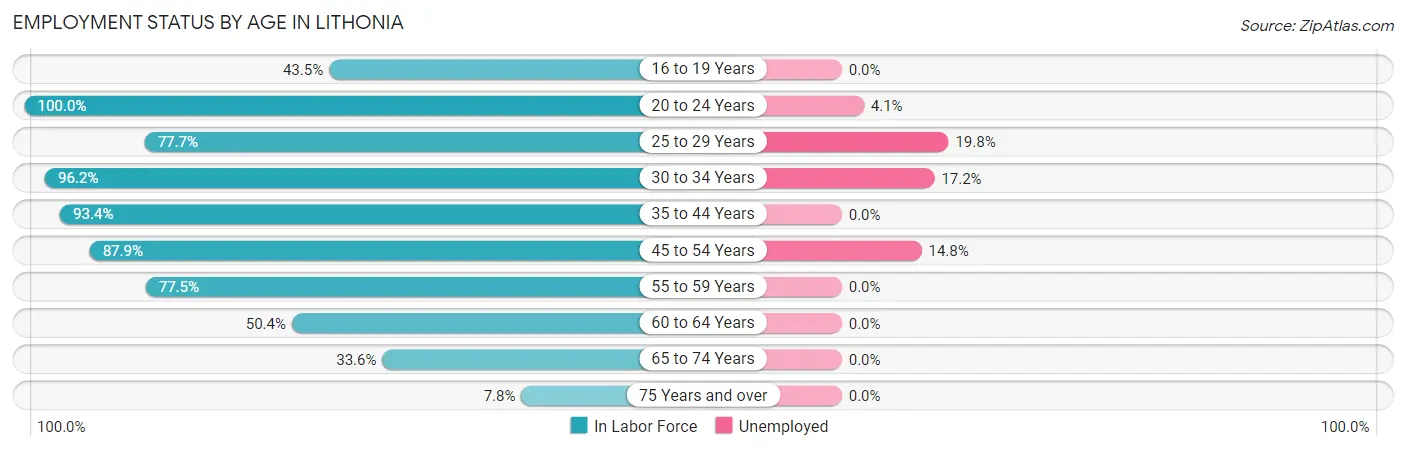
| Age Bracket | In Labor Force | Unemployed |
| 16 to 19 Years | 27 (43.5%) | 0 (0.0%) |
| 20 to 24 Years | 146 (100.0%) | 6 (4.1%) |
| 25 to 29 Years | 101 (77.7%) | 20 (19.8%) |
| 30 to 34 Years | 203 (96.2%) | 35 (17.2%) |
| 35 to 44 Years | 399 (93.4%) | 0 (0.0%) |
| 45 to 54 Years | 283 (87.9%) | 42 (14.8%) |
| 55 to 59 Years | 134 (77.5%) | 0 (0.0%) |
| 60 to 64 Years | 62 (50.4%) | 0 (0.0%) |
| 65 to 74 Years | 49 (33.6%) | 0 (0.0%) |
| 75 Years and over | 4 (7.8%) | 0 (0.0%) |
| Total | 1,408 (78.6%) | 103 (7.3%) |
Employment Status by Educational Attainment in Lithonia
According to labor force statistics for Lithonia, 85.3% of individuals (1,182) out of the total population between 25 and 64 years of age (1,386) are in the labor force, with 8.2% or 97 of them being unemployed. The group with the highest labor force participation rate are those with the educational attainment of bachelor's degree or higher, with 100.0% or 373 individuals in the labor force. Within the labor force, individuals with less than high school education have the highest percentage of unemployment, with 21.0% or 37 of them being unemployed.
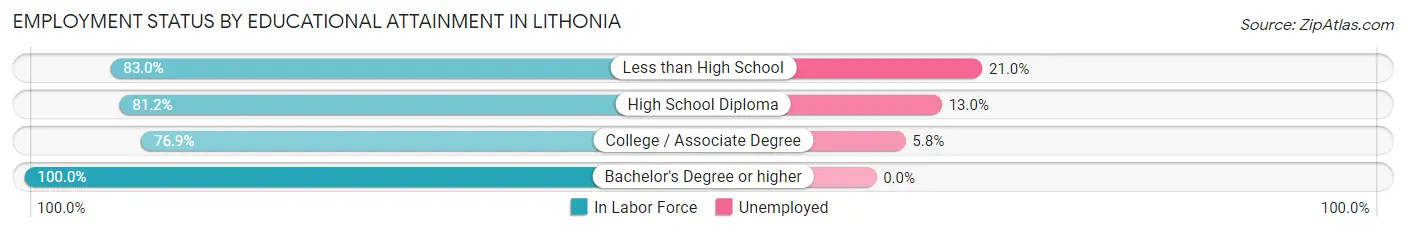
| Educational Attainment | In Labor Force | Unemployed |
| Less than High School | 176 (83.0%) | 45 (21.0%) |
| High School Diploma | 323 (81.2%) | 52 (13.0%) |
| College / Associate Degree | 310 (76.9%) | 23 (5.8%) |
| Bachelor's Degree or higher | 373 (100.0%) | 0 (0.0%) |
| Total | 1,182 (85.3%) | 114 (8.2%) |
Employment Occupations by Sex in Lithonia
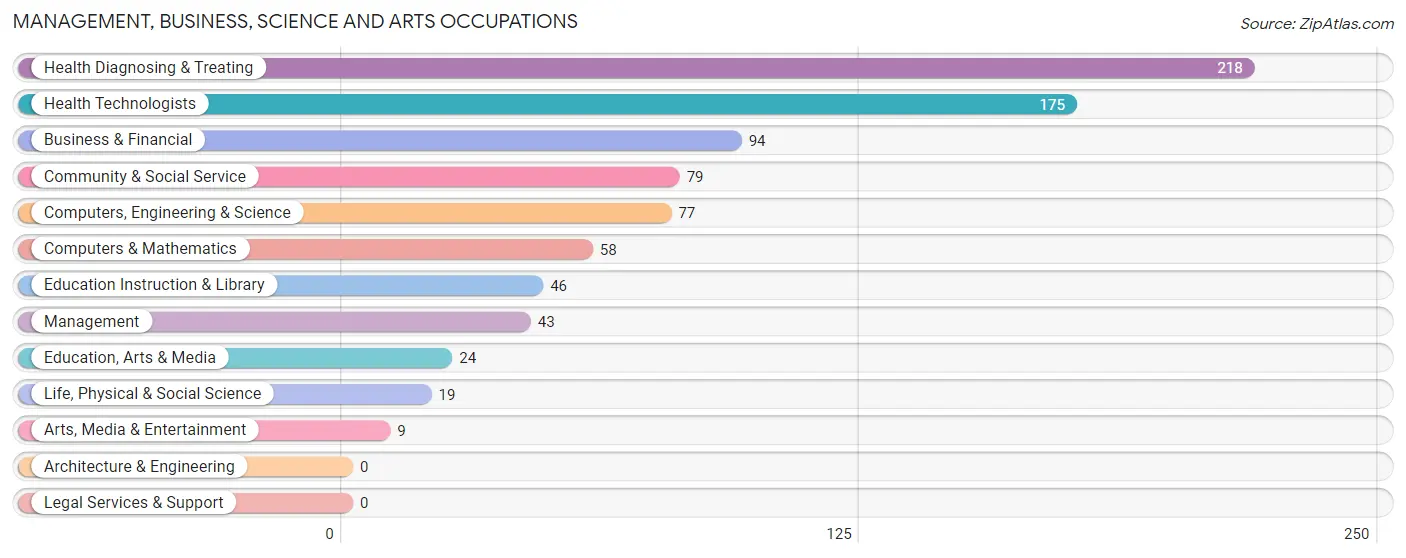
Management, Business, Science and Arts Occupations
The most common Management, Business, Science and Arts occupations in Lithonia are Health Diagnosing & Treating (218 | 16.7%), Health Technologists (175 | 13.4%), Business & Financial (94 | 7.2%), Community & Social Service (79 | 6.0%), and Computers, Engineering & Science (77 | 5.9%).
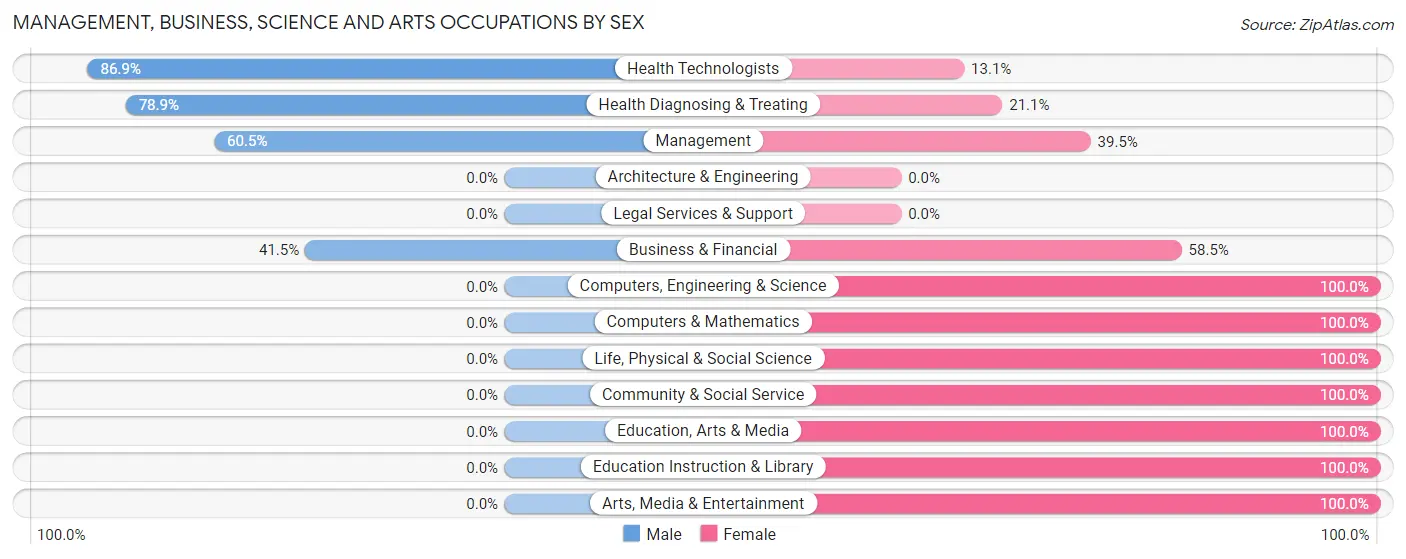
Management, Business, Science and Arts Occupations by Sex
Within the Management, Business, Science and Arts occupations in Lithonia, the most male-oriented occupations are Health Technologists (86.9%), Health Diagnosing & Treating (78.9%), and Management (60.5%), while the most female-oriented occupations are Computers, Engineering & Science (100.0%), Computers & Mathematics (100.0%), and Life, Physical & Social Science (100.0%).
| Occupation | Male | Female |
| Management | 26 (60.5%) | 17 (39.5%) |
| Business & Financial | 39 (41.5%) | 55 (58.5%) |
| Computers, Engineering & Science | 0 (0.0%) | 77 (100.0%) |
| Computers & Mathematics | 0 (0.0%) | 58 (100.0%) |
| Architecture & Engineering | 0 (0.0%) | 0 (0.0%) |
| Life, Physical & Social Science | 0 (0.0%) | 19 (100.0%) |
| Community & Social Service | 0 (0.0%) | 79 (100.0%) |
| Education, Arts & Media | 0 (0.0%) | 24 (100.0%) |
| Legal Services & Support | 0 (0.0%) | 0 (0.0%) |
| Education Instruction & Library | 0 (0.0%) | 46 (100.0%) |
| Arts, Media & Entertainment | 0 (0.0%) | 9 (100.0%) |
| Health Diagnosing & Treating | 172 (78.9%) | 46 (21.1%) |
| Health Technologists | 152 (86.9%) | 23 (13.1%) |
| Total (Category) | 237 (46.4%) | 274 (53.6%) |
| Total (Overall) | 644 (49.3%) | 661 (50.6%) |
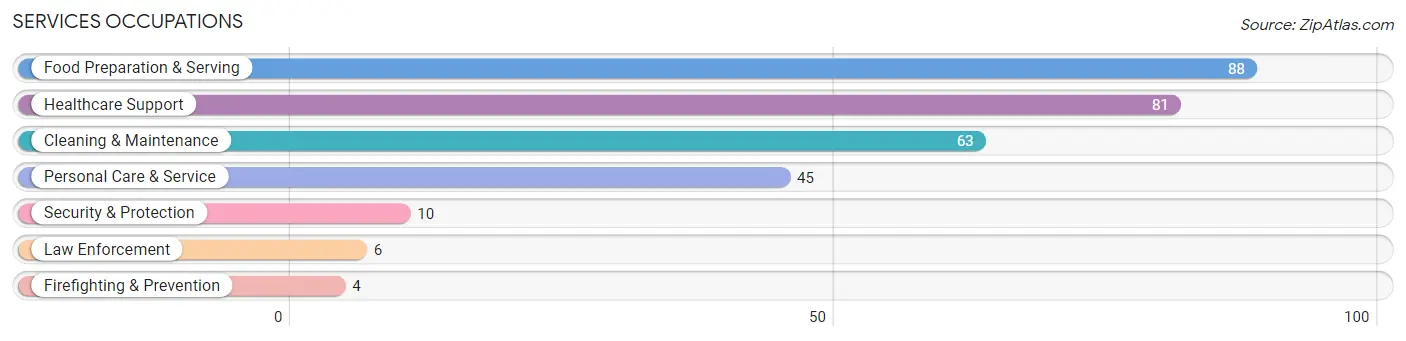
Services Occupations
The most common Services occupations in Lithonia are Food Preparation & Serving (88 | 6.7%), Healthcare Support (81 | 6.2%), Cleaning & Maintenance (63 | 4.8%), Personal Care & Service (45 | 3.5%), and Security & Protection (10 | 0.8%).
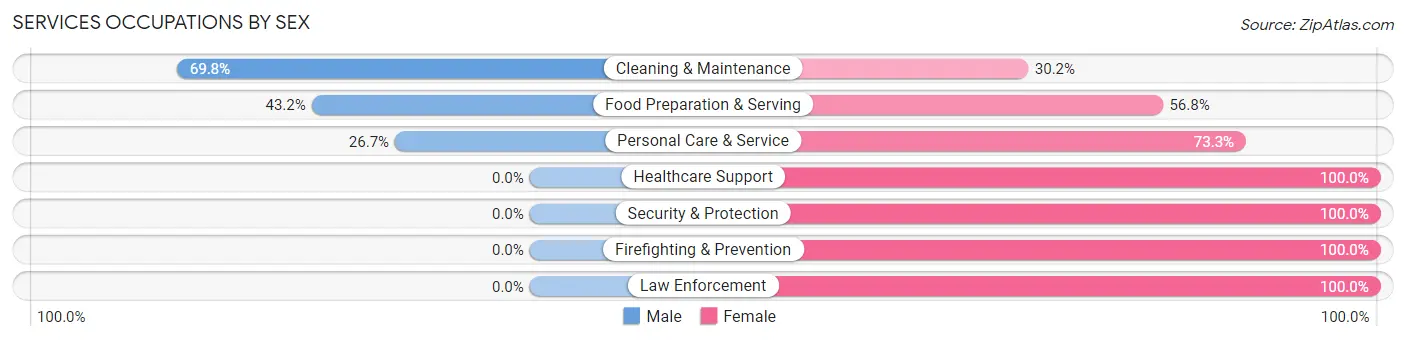
Services Occupations by Sex
Within the Services occupations in Lithonia, the most male-oriented occupations are Cleaning & Maintenance (69.8%), Food Preparation & Serving (43.2%), and Personal Care & Service (26.7%), while the most female-oriented occupations are Healthcare Support (100.0%), Security & Protection (100.0%), and Firefighting & Prevention (100.0%).
| Occupation | Male | Female |
| Healthcare Support | 0 (0.0%) | 81 (100.0%) |
| Security & Protection | 0 (0.0%) | 10 (100.0%) |
| Firefighting & Prevention | 0 (0.0%) | 4 (100.0%) |
| Law Enforcement | 0 (0.0%) | 6 (100.0%) |
| Food Preparation & Serving | 38 (43.2%) | 50 (56.8%) |
| Cleaning & Maintenance | 44 (69.8%) | 19 (30.2%) |
| Personal Care & Service | 12 (26.7%) | 33 (73.3%) |
| Total (Category) | 94 (32.8%) | 193 (67.2%) |
| Total (Overall) | 644 (49.3%) | 661 (50.6%) |
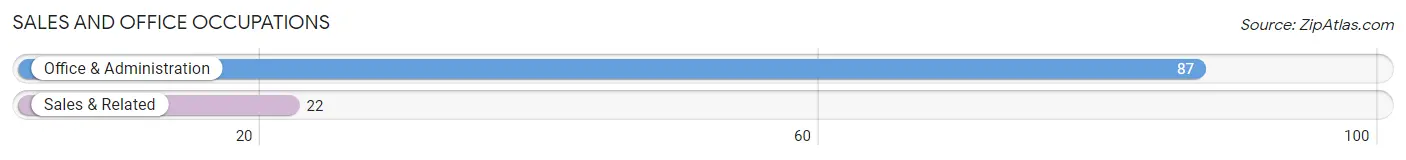
Sales and Office Occupations
The most common Sales and Office occupations in Lithonia are Office & Administration (87 | 6.7%), and Sales & Related (22 | 1.7%).
Sales and Office Occupations by Sex
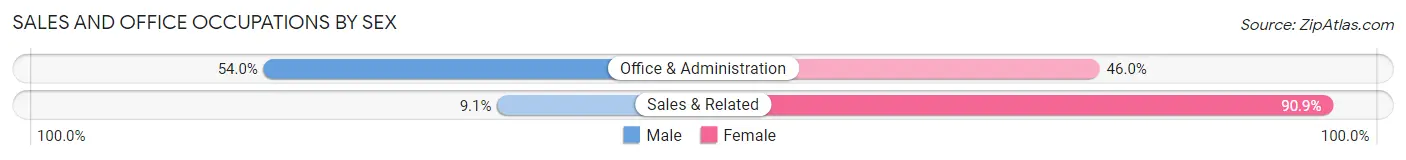
| Occupation | Male | Female |
| Sales & Related | 2 (9.1%) | 20 (90.9%) |
| Office & Administration | 47 (54.0%) | 40 (46.0%) |
| Total (Category) | 49 (45.0%) | 60 (55.0%) |
| Total (Overall) | 644 (49.3%) | 661 (50.6%) |
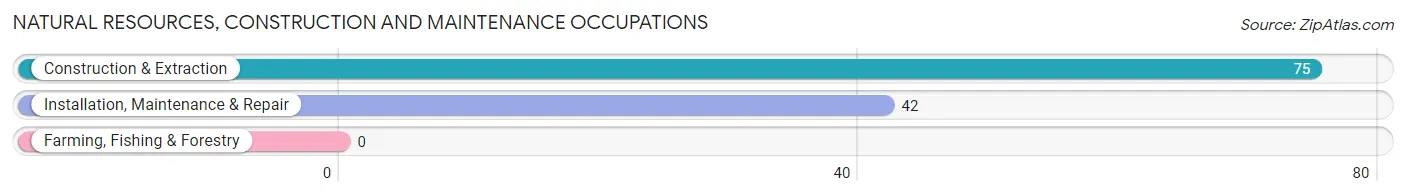
Natural Resources, Construction and Maintenance Occupations
The most common Natural Resources, Construction and Maintenance occupations in Lithonia are Construction & Extraction (75 | 5.8%), and Installation, Maintenance & Repair (42 | 3.2%).
Natural Resources, Construction and Maintenance Occupations by Sex
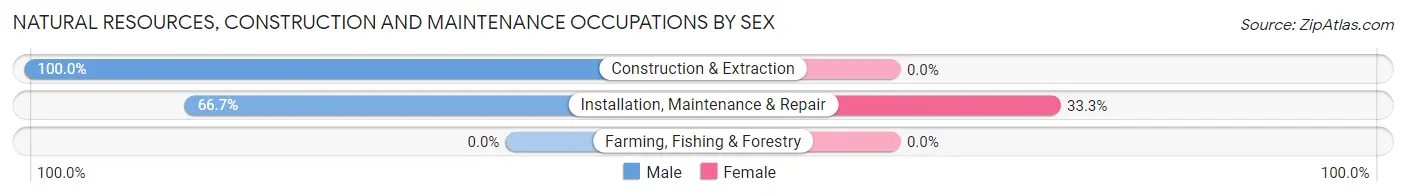
| Occupation | Male | Female |
| Farming, Fishing & Forestry | 0 (0.0%) | 0 (0.0%) |
| Construction & Extraction | 75 (100.0%) | 0 (0.0%) |
| Installation, Maintenance & Repair | 28 (66.7%) | 14 (33.3%) |
| Total (Category) | 103 (88.0%) | 14 (12.0%) |
| Total (Overall) | 644 (49.3%) | 661 (50.6%) |
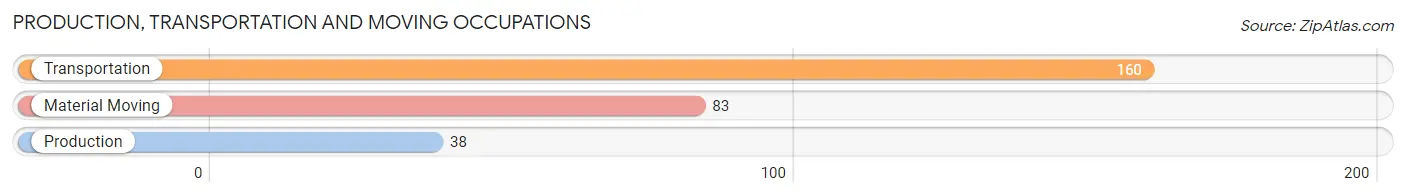
Production, Transportation and Moving Occupations
The most common Production, Transportation and Moving occupations in Lithonia are Transportation (160 | 12.3%), Material Moving (83 | 6.4%), and Production (38 | 2.9%).
Production, Transportation and Moving Occupations by Sex
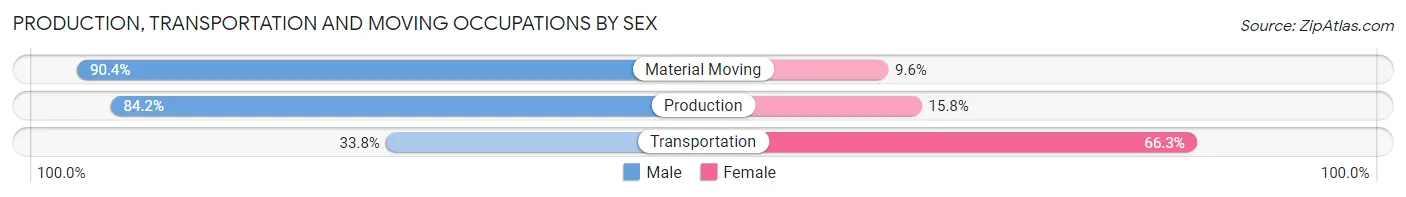
| Occupation | Male | Female |
| Production | 32 (84.2%) | 6 (15.8%) |
| Transportation | 54 (33.8%) | 106 (66.2%) |
| Material Moving | 75 (90.4%) | 8 (9.6%) |
| Total (Category) | 161 (57.3%) | 120 (42.7%) |
| Total (Overall) | 644 (49.3%) | 661 (50.6%) |
Employment Industries by Sex in Lithonia
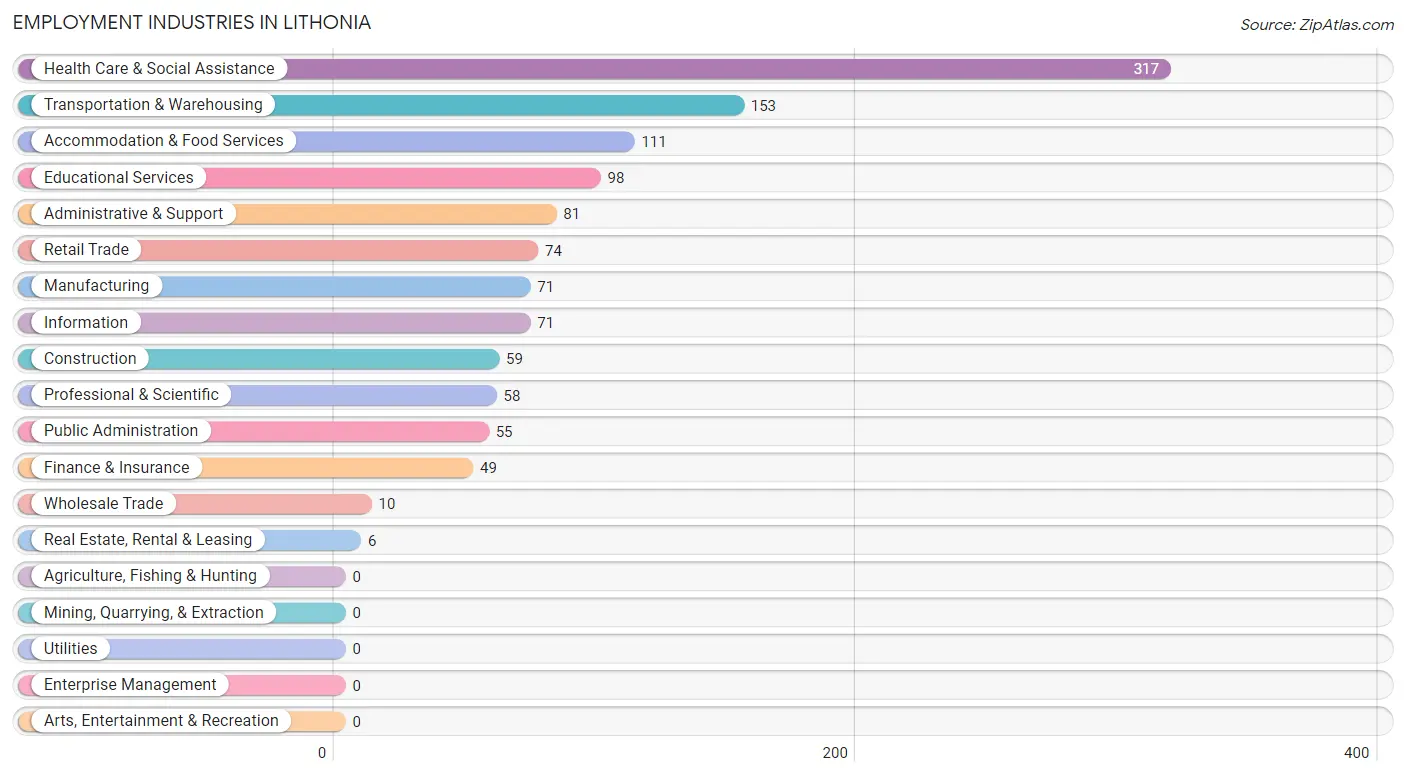
Employment Industries in Lithonia
The major employment industries in Lithonia include Health Care & Social Assistance (317 | 24.3%), Transportation & Warehousing (153 | 11.7%), Accommodation & Food Services (111 | 8.5%), Educational Services (98 | 7.5%), and Administrative & Support (81 | 6.2%).
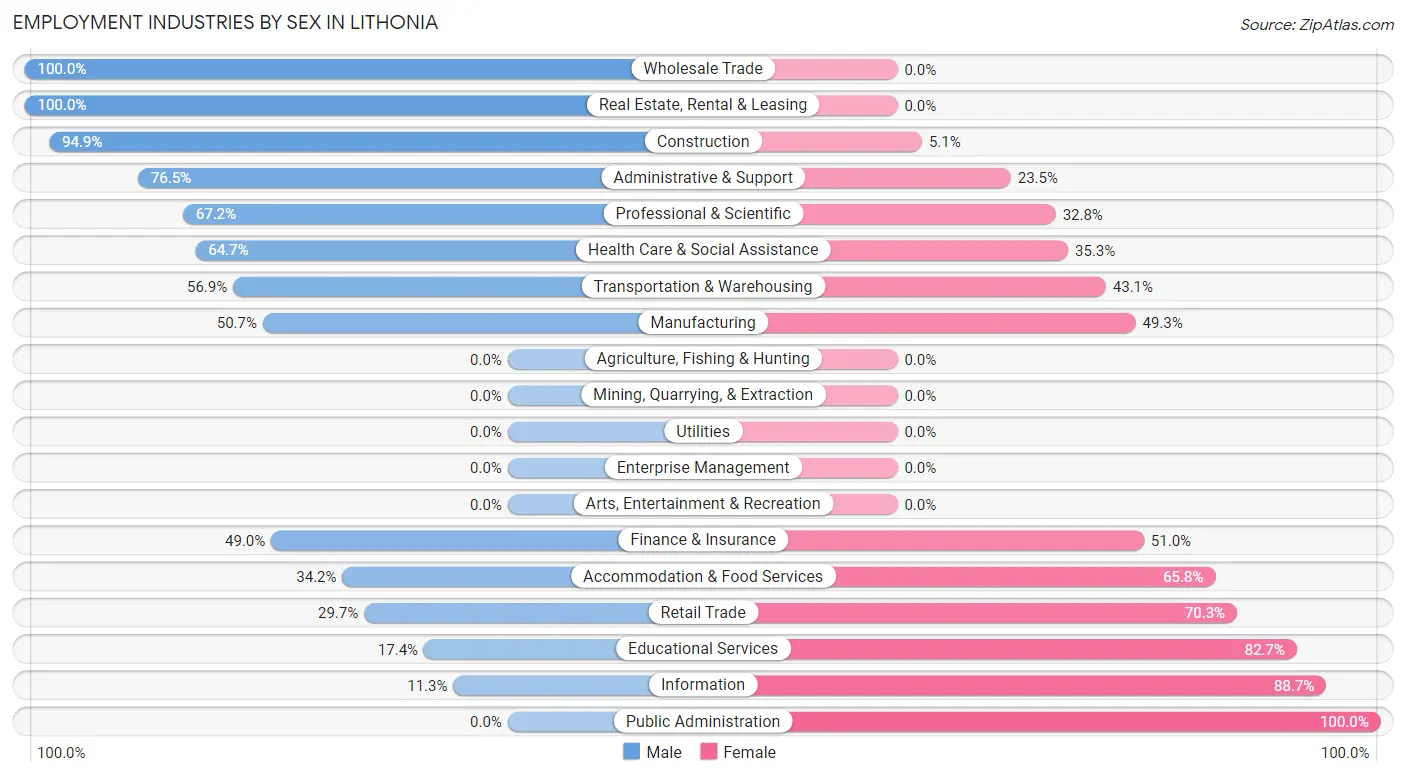
Employment Industries by Sex in Lithonia
The Lithonia industries that see more men than women are Wholesale Trade (100.0%), Real Estate, Rental & Leasing (100.0%), and Construction (94.9%), whereas the industries that tend to have a higher number of women are Public Administration (100.0%), Information (88.7%), and Educational Services (82.7%).
| Industry | Male | Female |
| Agriculture, Fishing & Hunting | 0 (0.0%) | 0 (0.0%) |
| Mining, Quarrying, & Extraction | 0 (0.0%) | 0 (0.0%) |
| Construction | 56 (94.9%) | 3 (5.1%) |
| Manufacturing | 36 (50.7%) | 35 (49.3%) |
| Wholesale Trade | 10 (100.0%) | 0 (0.0%) |
| Retail Trade | 22 (29.7%) | 52 (70.3%) |
| Transportation & Warehousing | 87 (56.9%) | 66 (43.1%) |
| Utilities | 0 (0.0%) | 0 (0.0%) |
| Information | 8 (11.3%) | 63 (88.7%) |
| Finance & Insurance | 24 (49.0%) | 25 (51.0%) |
| Real Estate, Rental & Leasing | 6 (100.0%) | 0 (0.0%) |
| Professional & Scientific | 39 (67.2%) | 19 (32.8%) |
| Enterprise Management | 0 (0.0%) | 0 (0.0%) |
| Administrative & Support | 62 (76.5%) | 19 (23.5%) |
| Educational Services | 17 (17.3%) | 81 (82.7%) |
| Health Care & Social Assistance | 205 (64.7%) | 112 (35.3%) |
| Arts, Entertainment & Recreation | 0 (0.0%) | 0 (0.0%) |
| Accommodation & Food Services | 38 (34.2%) | 73 (65.8%) |
| Public Administration | 0 (0.0%) | 55 (100.0%) |
| Total | 644 (49.3%) | 661 (50.6%) |
Education in Lithonia
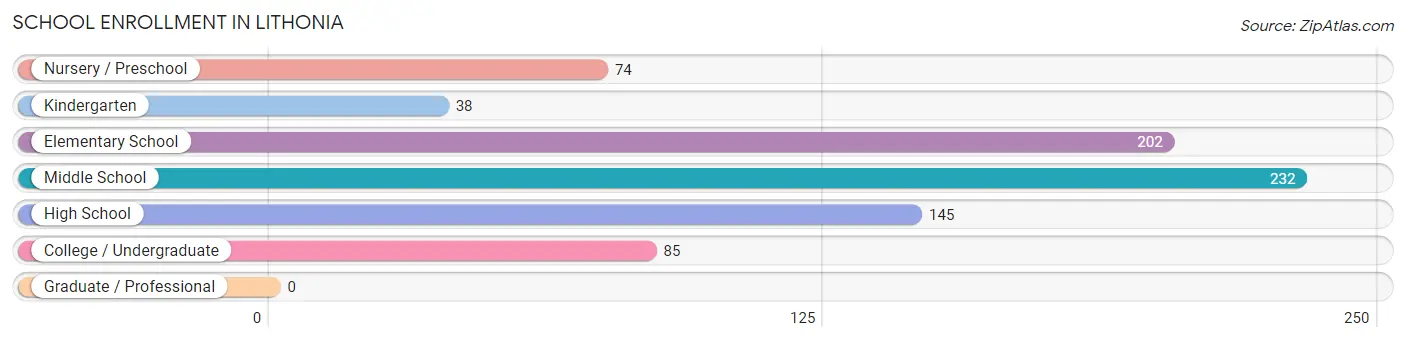
School Enrollment in Lithonia
The most common levels of schooling among the 776 students in Lithonia are middle school (232 | 29.9%), elementary school (202 | 26.0%), and high school (145 | 18.7%).
| School Level | # Students | % Students |
| Nursery / Preschool | 74 | 9.5% |
| Kindergarten | 38 | 4.9% |
| Elementary School | 202 | 26.0% |
| Middle School | 232 | 29.9% |
| High School | 145 | 18.7% |
| College / Undergraduate | 85 | 11.0% |
| Graduate / Professional | 0 | 0.0% |
| Total | 776 | 100.0% |
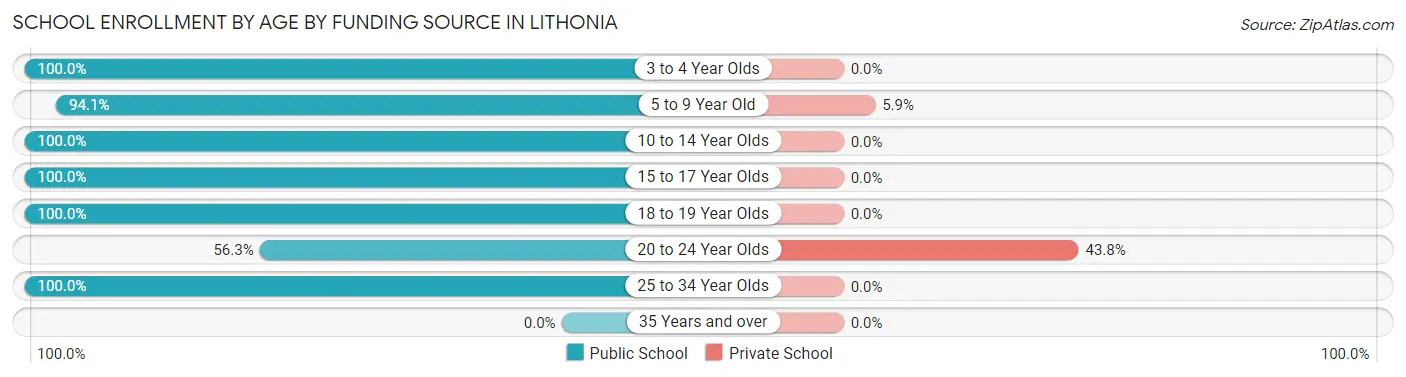
School Enrollment by Age by Funding Source in Lithonia
Out of a total of 776 students who are enrolled in schools in Lithonia, 41 (5.3%) attend a private institution, while the remaining 735 (94.7%) are enrolled in public schools. The age group of 20 to 24 year olds has the highest likelihood of being enrolled in private schools, with 28 (43.8% in the age bracket) enrolled. Conversely, the age group of 3 to 4 year olds has the lowest likelihood of being enrolled in a private school, with 74 (100.0% in the age bracket) attending a public institution.
| Age Bracket | Public School | Private School |
| 3 to 4 Year Olds | 74 (100.0%) | 0 (0.0%) |
| 5 to 9 Year Old | 208 (94.1%) | 13 (5.9%) |
| 10 to 14 Year Olds | 263 (100.0%) | 0 (0.0%) |
| 15 to 17 Year Olds | 93 (100.0%) | 0 (0.0%) |
| 18 to 19 Year Olds | 27 (100.0%) | 0 (0.0%) |
| 20 to 24 Year Olds | 36 (56.2%) | 28 (43.8%) |
| 25 to 34 Year Olds | 34 (100.0%) | 0 (0.0%) |
| 35 Years and over | 0 (0.0%) | 0 (0.0%) |
| Total | 735 (94.7%) | 41 (5.3%) |
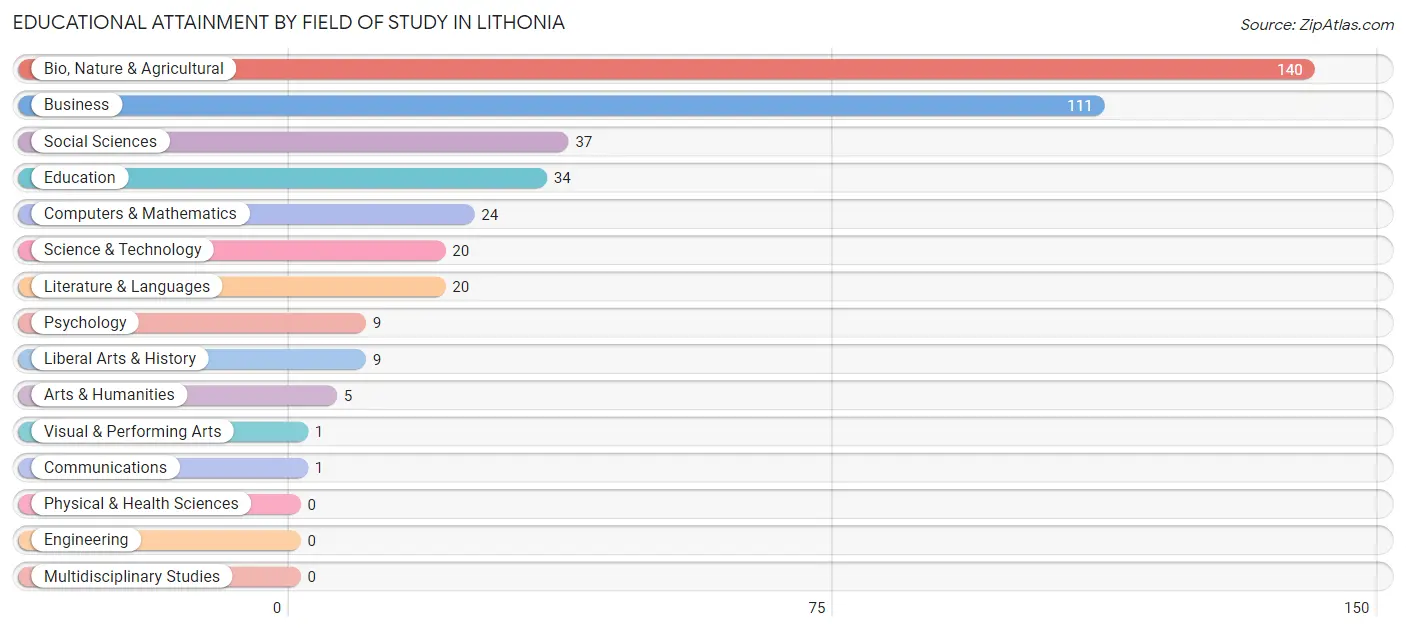
Educational Attainment by Field of Study in Lithonia
Bio, nature & agricultural (140 | 34.1%), business (111 | 27.0%), social sciences (37 | 9.0%), education (34 | 8.3%), and computers & mathematics (24 | 5.8%) are the most common fields of study among 411 individuals in Lithonia who have obtained a bachelor's degree or higher.
| Field of Study | # Graduates | % Graduates |
| Computers & Mathematics | 24 | 5.8% |
| Bio, Nature & Agricultural | 140 | 34.1% |
| Physical & Health Sciences | 0 | 0.0% |
| Psychology | 9 | 2.2% |
| Social Sciences | 37 | 9.0% |
| Engineering | 0 | 0.0% |
| Multidisciplinary Studies | 0 | 0.0% |
| Science & Technology | 20 | 4.9% |
| Business | 111 | 27.0% |
| Education | 34 | 8.3% |
| Literature & Languages | 20 | 4.9% |
| Liberal Arts & History | 9 | 2.2% |
| Visual & Performing Arts | 1 | 0.2% |
| Communications | 1 | 0.2% |
| Arts & Humanities | 5 | 1.2% |
| Total | 411 | 100.0% |
Transportation & Commute in Lithonia
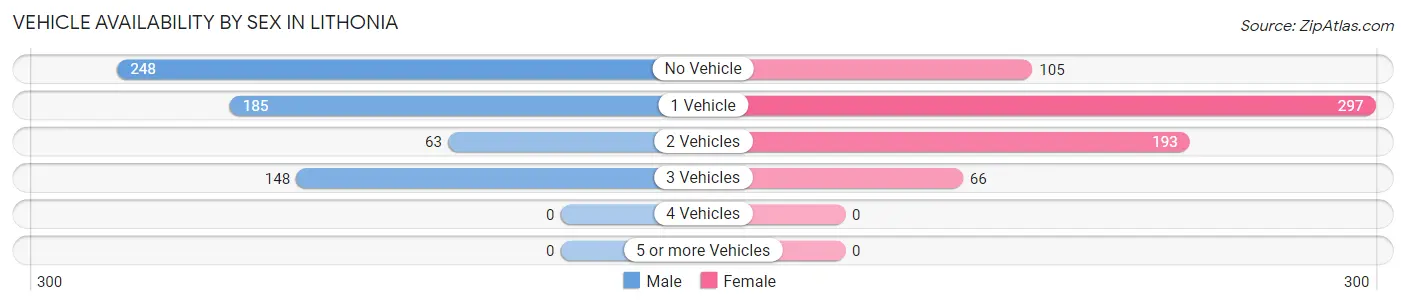
Vehicle Availability by Sex in Lithonia
The most prevalent vehicle ownership categories in Lithonia are males with no vehicle (248, accounting for 38.5%) and females with no vehicle (105, making up 37.5%).
| Vehicles Available | Male | Female |
| No Vehicle | 248 (38.5%) | 105 (15.9%) |
| 1 Vehicle | 185 (28.7%) | 297 (44.9%) |
| 2 Vehicles | 63 (9.8%) | 193 (29.2%) |
| 3 Vehicles | 148 (23.0%) | 66 (10.0%) |
| 4 Vehicles | 0 (0.0%) | 0 (0.0%) |
| 5 or more Vehicles | 0 (0.0%) | 0 (0.0%) |
| Total | 644 (100.0%) | 661 (100.0%) |
Commute Time in Lithonia
The most frequently occuring commute durations in Lithonia are 30 to 34 minutes (237 commuters, 19.3%), 60 to 89 minutes (184 commuters, 15.0%), and 90 or more minutes (154 commuters, 12.5%).
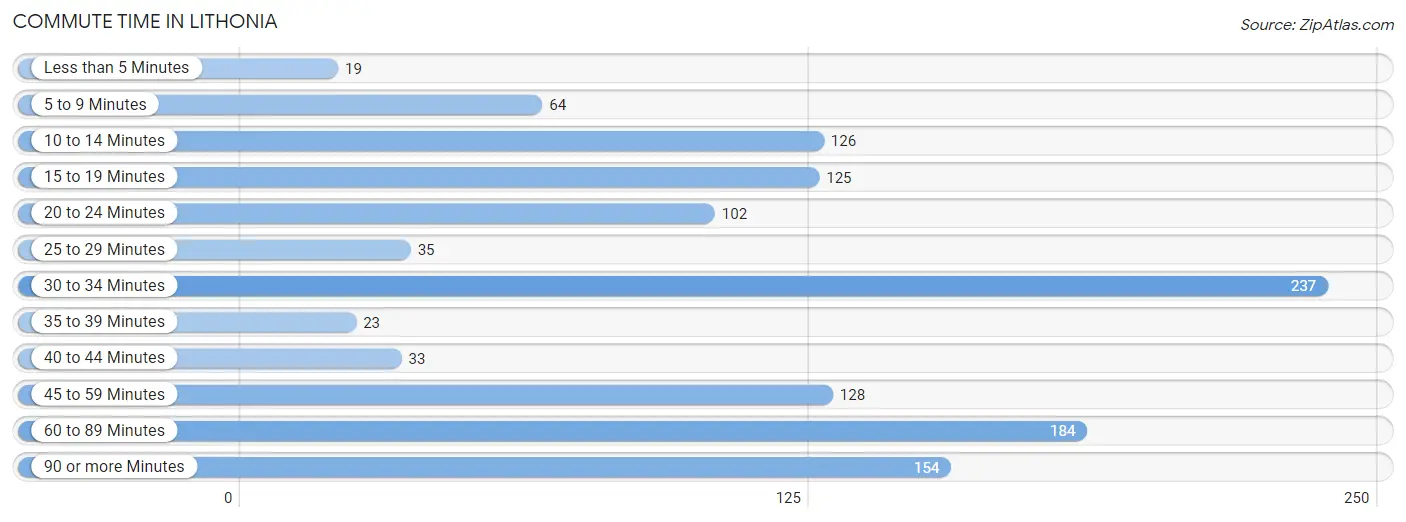
| Commute Time | # Commuters | % Commuters |
| Less than 5 Minutes | 19 | 1.5% |
| 5 to 9 Minutes | 64 | 5.2% |
| 10 to 14 Minutes | 126 | 10.2% |
| 15 to 19 Minutes | 125 | 10.2% |
| 20 to 24 Minutes | 102 | 8.3% |
| 25 to 29 Minutes | 35 | 2.9% |
| 30 to 34 Minutes | 237 | 19.3% |
| 35 to 39 Minutes | 23 | 1.9% |
| 40 to 44 Minutes | 33 | 2.7% |
| 45 to 59 Minutes | 128 | 10.4% |
| 60 to 89 Minutes | 184 | 15.0% |
| 90 or more Minutes | 154 | 12.5% |
Commute Time by Sex in Lithonia
The most common commute times in Lithonia are 30 to 34 minutes (174 commuters, 27.5%) for males and 45 to 59 minutes (85 commuters, 14.2%) for females.
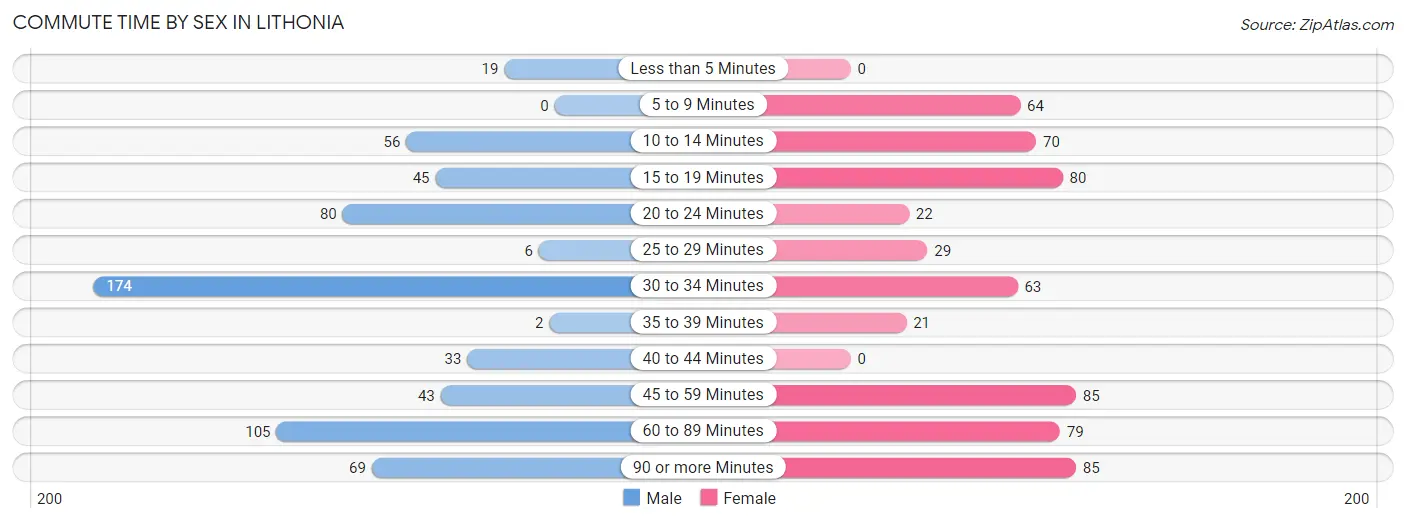
| Commute Time | Male | Female |
| Less than 5 Minutes | 19 (3.0%) | 0 (0.0%) |
| 5 to 9 Minutes | 0 (0.0%) | 64 (10.7%) |
| 10 to 14 Minutes | 56 (8.9%) | 70 (11.7%) |
| 15 to 19 Minutes | 45 (7.1%) | 80 (13.4%) |
| 20 to 24 Minutes | 80 (12.7%) | 22 (3.7%) |
| 25 to 29 Minutes | 6 (0.9%) | 29 (4.9%) |
| 30 to 34 Minutes | 174 (27.5%) | 63 (10.5%) |
| 35 to 39 Minutes | 2 (0.3%) | 21 (3.5%) |
| 40 to 44 Minutes | 33 (5.2%) | 0 (0.0%) |
| 45 to 59 Minutes | 43 (6.8%) | 85 (14.2%) |
| 60 to 89 Minutes | 105 (16.6%) | 79 (13.2%) |
| 90 or more Minutes | 69 (10.9%) | 85 (14.2%) |
Time of Departure to Work by Sex in Lithonia
The most frequent times of departure to work in Lithonia are 7:00 AM to 7:29 AM (204, 32.3%) for males and 12:00 PM to 3:59 PM (96, 16.1%) for females.
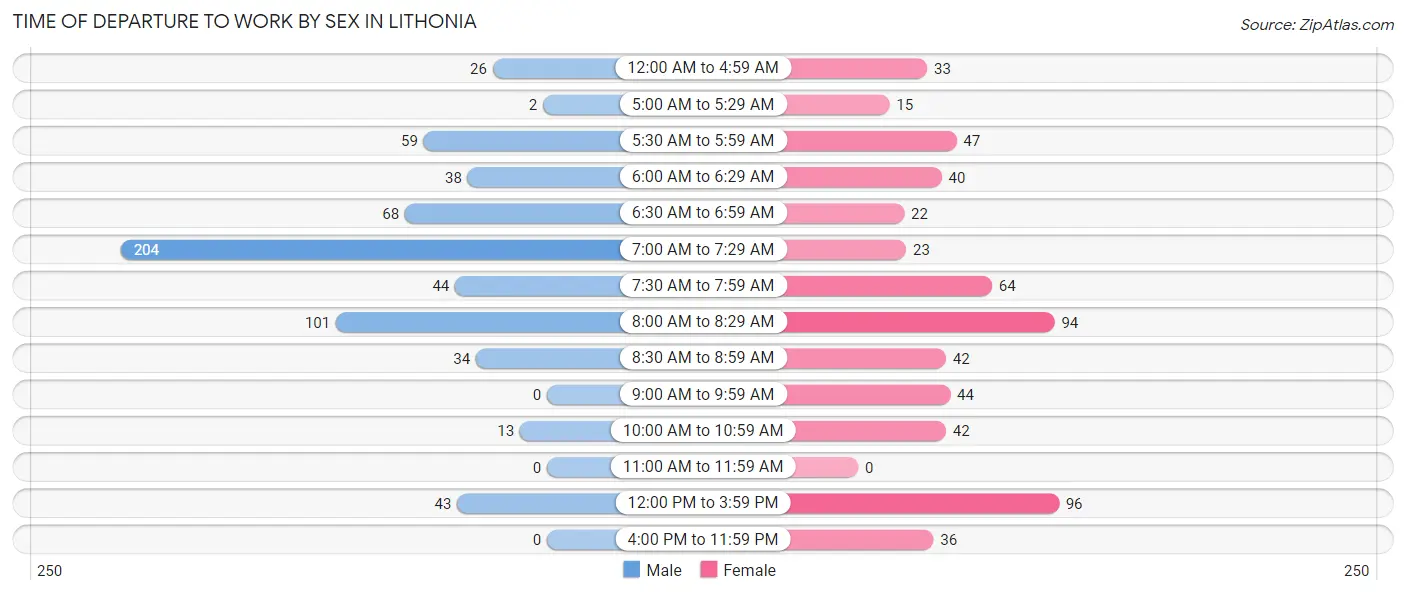
| Time of Departure | Male | Female |
| 12:00 AM to 4:59 AM | 26 (4.1%) | 33 (5.5%) |
| 5:00 AM to 5:29 AM | 2 (0.3%) | 15 (2.5%) |
| 5:30 AM to 5:59 AM | 59 (9.3%) | 47 (7.9%) |
| 6:00 AM to 6:29 AM | 38 (6.0%) | 40 (6.7%) |
| 6:30 AM to 6:59 AM | 68 (10.8%) | 22 (3.7%) |
| 7:00 AM to 7:29 AM | 204 (32.3%) | 23 (3.8%) |
| 7:30 AM to 7:59 AM | 44 (7.0%) | 64 (10.7%) |
| 8:00 AM to 8:29 AM | 101 (16.0%) | 94 (15.7%) |
| 8:30 AM to 8:59 AM | 34 (5.4%) | 42 (7.0%) |
| 9:00 AM to 9:59 AM | 0 (0.0%) | 44 (7.4%) |
| 10:00 AM to 10:59 AM | 13 (2.1%) | 42 (7.0%) |
| 11:00 AM to 11:59 AM | 0 (0.0%) | 0 (0.0%) |
| 12:00 PM to 3:59 PM | 43 (6.8%) | 96 (16.1%) |
| 4:00 PM to 11:59 PM | 0 (0.0%) | 36 (6.0%) |
| Total | 632 (100.0%) | 598 (100.0%) |
Housing Occupancy in Lithonia
Occupancy by Ownership in Lithonia
Of the total 984 dwellings in Lithonia, owner-occupied units account for 281 (28.6%), while renter-occupied units make up 703 (71.4%).
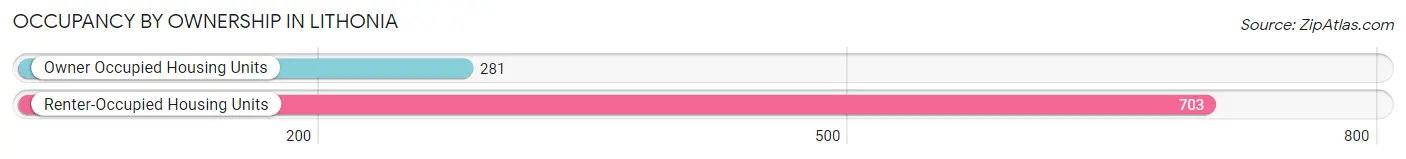
| Occupancy | # Housing Units | % Housing Units |
| Owner Occupied Housing Units | 281 | 28.6% |
| Renter-Occupied Housing Units | 703 | 71.4% |
| Total Occupied Housing Units | 984 | 100.0% |
Occupancy by Household Size in Lithonia
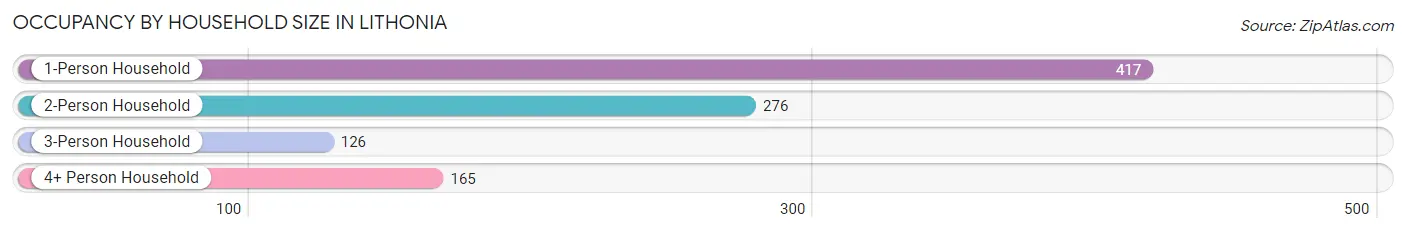
| Household Size | # Housing Units | % Housing Units |
| 1-Person Household | 417 | 42.4% |
| 2-Person Household | 276 | 28.1% |
| 3-Person Household | 126 | 12.8% |
| 4+ Person Household | 165 | 16.8% |
| Total Housing Units | 984 | 100.0% |
Occupancy by Ownership by Household Size in Lithonia
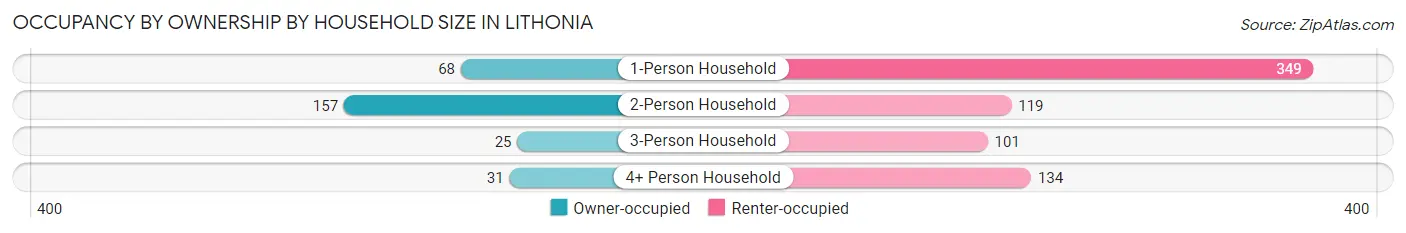
| Household Size | Owner-occupied | Renter-occupied |
| 1-Person Household | 68 (16.3%) | 349 (83.7%) |
| 2-Person Household | 157 (56.9%) | 119 (43.1%) |
| 3-Person Household | 25 (19.8%) | 101 (80.2%) |
| 4+ Person Household | 31 (18.8%) | 134 (81.2%) |
| Total Housing Units | 281 (28.6%) | 703 (71.4%) |
Occupancy by Educational Attainment in Lithonia
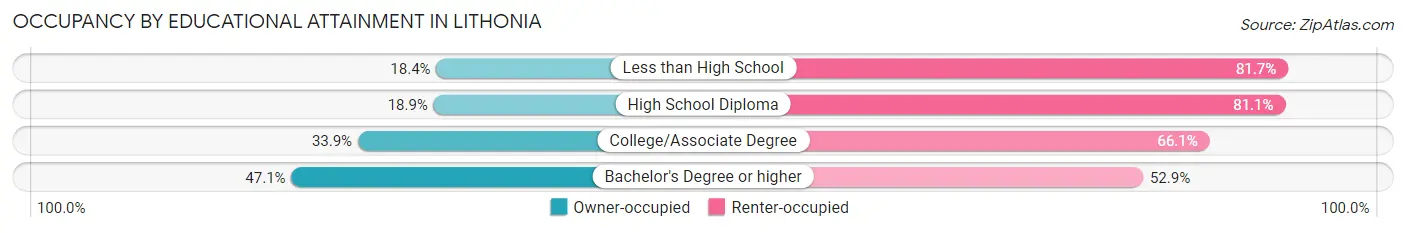
| Household Size | Owner-occupied | Renter-occupied |
| Less than High School | 29 (18.3%) | 129 (81.7%) |
| High School Diploma | 61 (18.9%) | 262 (81.1%) |
| College/Associate Degree | 118 (33.9%) | 230 (66.1%) |
| Bachelor's Degree or higher | 73 (47.1%) | 82 (52.9%) |
Occupancy by Age of Householder in Lithonia
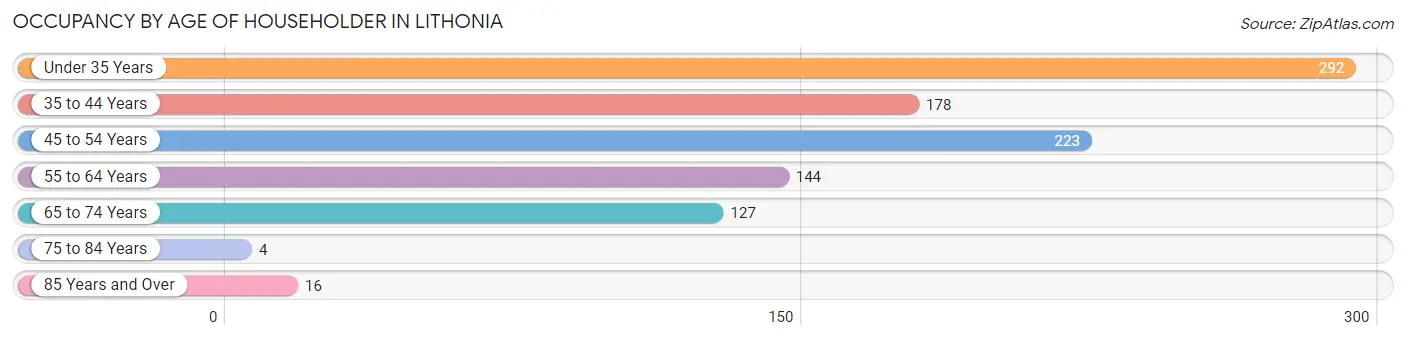
| Age Bracket | # Households | % Households |
| Under 35 Years | 292 | 29.7% |
| 35 to 44 Years | 178 | 18.1% |
| 45 to 54 Years | 223 | 22.7% |
| 55 to 64 Years | 144 | 14.6% |
| 65 to 74 Years | 127 | 12.9% |
| 75 to 84 Years | 4 | 0.4% |
| 85 Years and Over | 16 | 1.6% |
| Total | 984 | 100.0% |
Housing Finances in Lithonia
Median Income by Occupancy in Lithonia
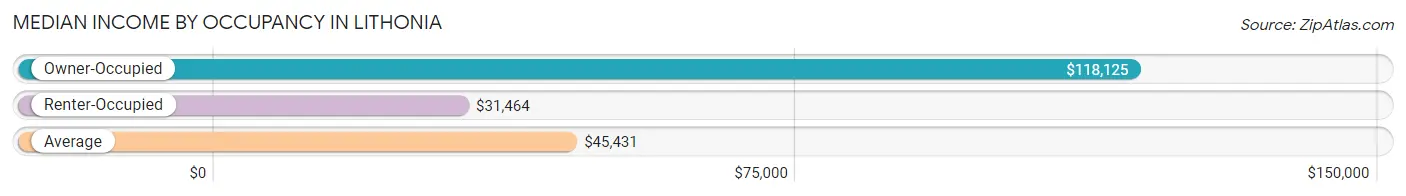
| Occupancy Type | # Households | Median Income |
| Owner-Occupied | 281 (28.6%) | $118,125 |
| Renter-Occupied | 703 (71.4%) | $31,464 |
| Average | 984 (100.0%) | $45,431 |
Occupancy by Householder Income Bracket in Lithonia
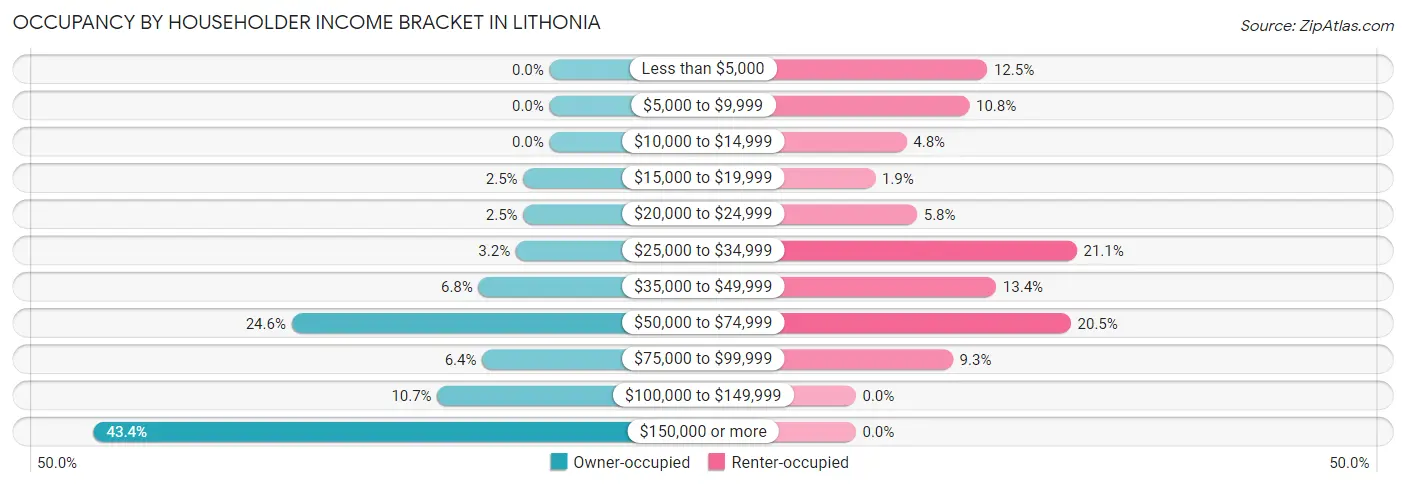
| Income Bracket | Owner-occupied | Renter-occupied |
| Less than $5,000 | 0 (0.0%) | 88 (12.5%) |
| $5,000 to $9,999 | 0 (0.0%) | 76 (10.8%) |
| $10,000 to $14,999 | 0 (0.0%) | 34 (4.8%) |
| $15,000 to $19,999 | 7 (2.5%) | 13 (1.8%) |
| $20,000 to $24,999 | 7 (2.5%) | 41 (5.8%) |
| $25,000 to $34,999 | 9 (3.2%) | 148 (21.0%) |
| $35,000 to $49,999 | 19 (6.8%) | 94 (13.4%) |
| $50,000 to $74,999 | 69 (24.6%) | 144 (20.5%) |
| $75,000 to $99,999 | 18 (6.4%) | 65 (9.2%) |
| $100,000 to $149,999 | 30 (10.7%) | 0 (0.0%) |
| $150,000 or more | 122 (43.4%) | 0 (0.0%) |
| Total | 281 (100.0%) | 703 (100.0%) |
Monthly Housing Cost Tiers in Lithonia
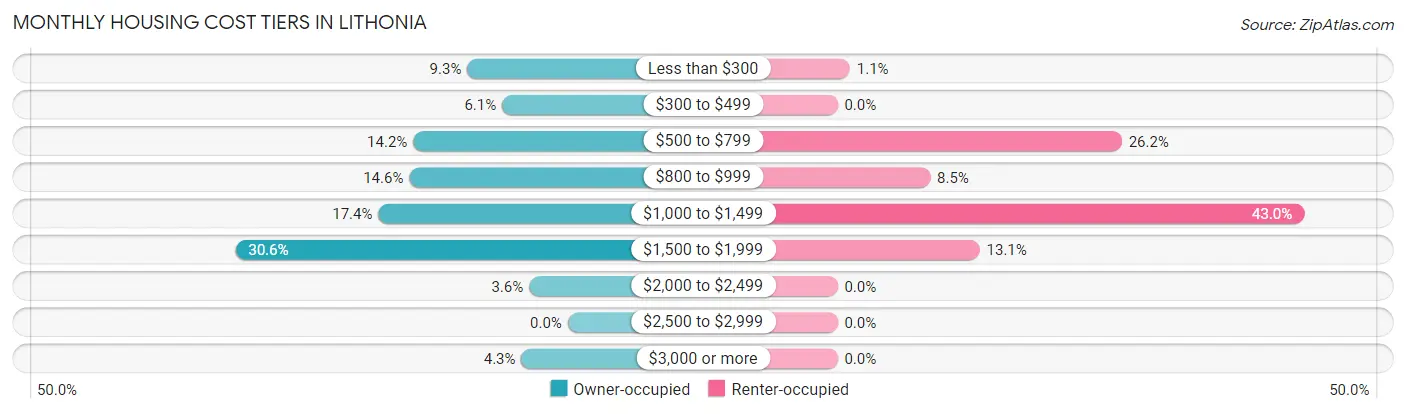
| Monthly Cost | Owner-occupied | Renter-occupied |
| Less than $300 | 26 (9.2%) | 8 (1.1%) |
| $300 to $499 | 17 (6.0%) | 0 (0.0%) |
| $500 to $799 | 40 (14.2%) | 184 (26.2%) |
| $800 to $999 | 41 (14.6%) | 60 (8.5%) |
| $1,000 to $1,499 | 49 (17.4%) | 302 (43.0%) |
| $1,500 to $1,999 | 86 (30.6%) | 92 (13.1%) |
| $2,000 to $2,499 | 10 (3.6%) | 0 (0.0%) |
| $2,500 to $2,999 | 0 (0.0%) | 0 (0.0%) |
| $3,000 or more | 12 (4.3%) | 0 (0.0%) |
| Total | 281 (100.0%) | 703 (100.0%) |
Physical Housing Characteristics in Lithonia
Housing Structures in Lithonia
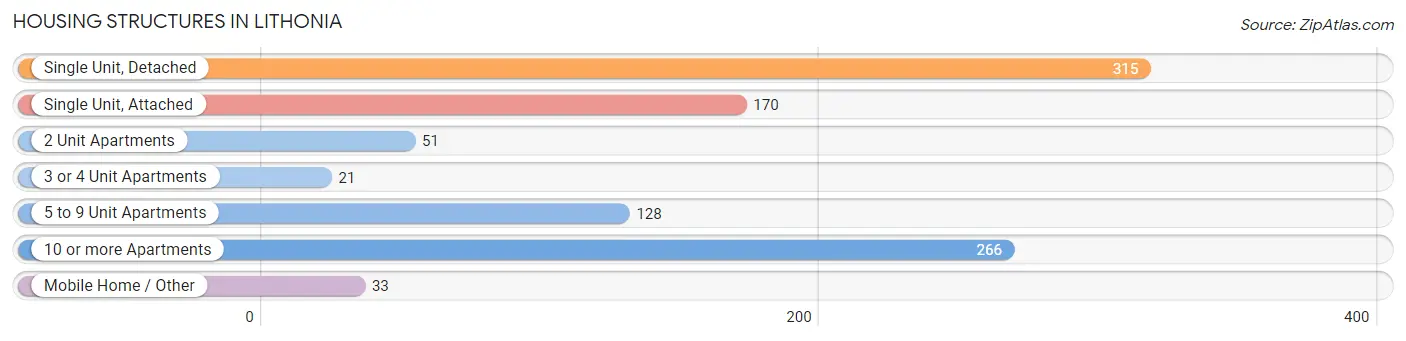
| Structure Type | # Housing Units | % Housing Units |
| Single Unit, Detached | 315 | 32.0% |
| Single Unit, Attached | 170 | 17.3% |
| 2 Unit Apartments | 51 | 5.2% |
| 3 or 4 Unit Apartments | 21 | 2.1% |
| 5 to 9 Unit Apartments | 128 | 13.0% |
| 10 or more Apartments | 266 | 27.0% |
| Mobile Home / Other | 33 | 3.4% |
| Total | 984 | 100.0% |
Housing Structures by Occupancy in Lithonia
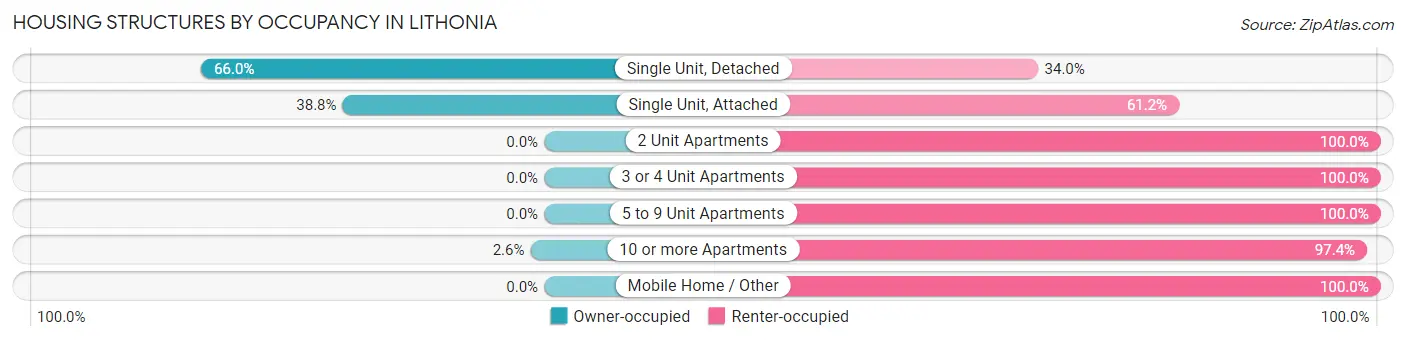
| Structure Type | Owner-occupied | Renter-occupied |
| Single Unit, Detached | 208 (66.0%) | 107 (34.0%) |
| Single Unit, Attached | 66 (38.8%) | 104 (61.2%) |
| 2 Unit Apartments | 0 (0.0%) | 51 (100.0%) |
| 3 or 4 Unit Apartments | 0 (0.0%) | 21 (100.0%) |
| 5 to 9 Unit Apartments | 0 (0.0%) | 128 (100.0%) |
| 10 or more Apartments | 7 (2.6%) | 259 (97.4%) |
| Mobile Home / Other | 0 (0.0%) | 33 (100.0%) |
| Total | 281 (28.6%) | 703 (71.4%) |
Housing Structures by Number of Rooms in Lithonia
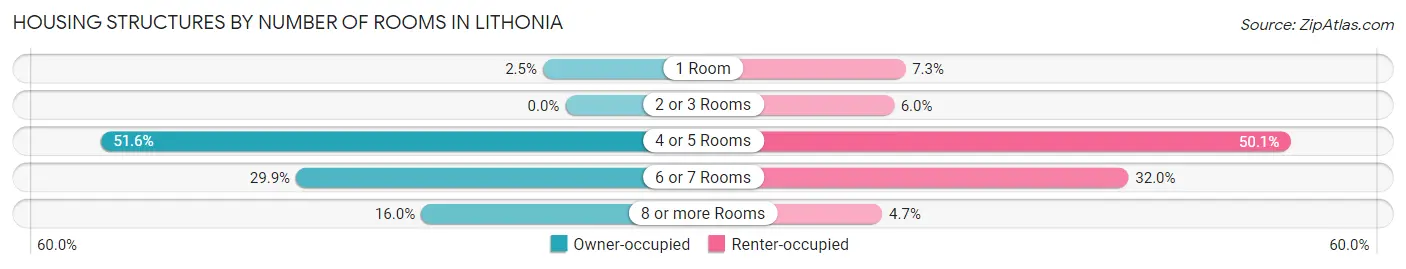
| Number of Rooms | Owner-occupied | Renter-occupied |
| 1 Room | 7 (2.5%) | 51 (7.2%) |
| 2 or 3 Rooms | 0 (0.0%) | 42 (6.0%) |
| 4 or 5 Rooms | 145 (51.6%) | 352 (50.1%) |
| 6 or 7 Rooms | 84 (29.9%) | 225 (32.0%) |
| 8 or more Rooms | 45 (16.0%) | 33 (4.7%) |
| Total | 281 (100.0%) | 703 (100.0%) |
Housing Structure by Heating Type in Lithonia
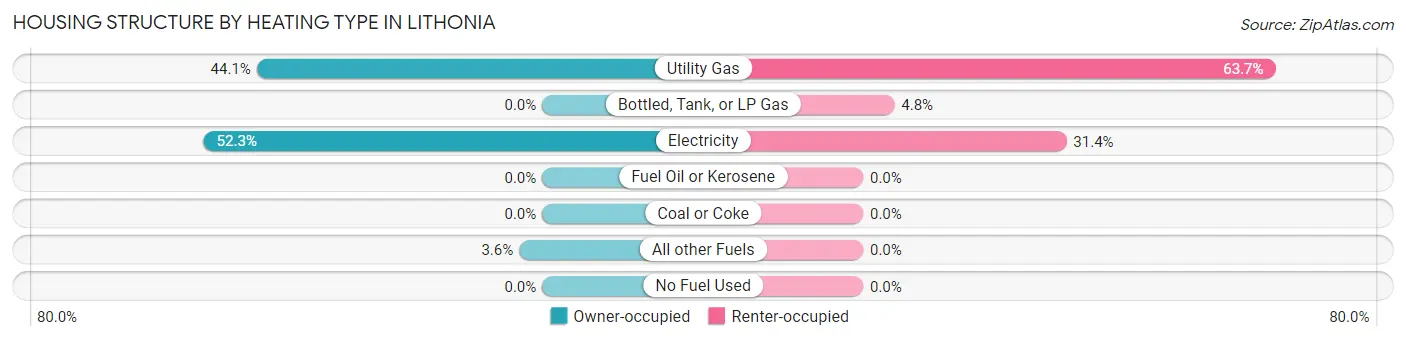
| Heating Type | Owner-occupied | Renter-occupied |
| Utility Gas | 124 (44.1%) | 448 (63.7%) |
| Bottled, Tank, or LP Gas | 0 (0.0%) | 34 (4.8%) |
| Electricity | 147 (52.3%) | 221 (31.4%) |
| Fuel Oil or Kerosene | 0 (0.0%) | 0 (0.0%) |
| Coal or Coke | 0 (0.0%) | 0 (0.0%) |
| All other Fuels | 10 (3.6%) | 0 (0.0%) |
| No Fuel Used | 0 (0.0%) | 0 (0.0%) |
| Total | 281 (100.0%) | 703 (100.0%) |
Household Vehicle Usage in Lithonia
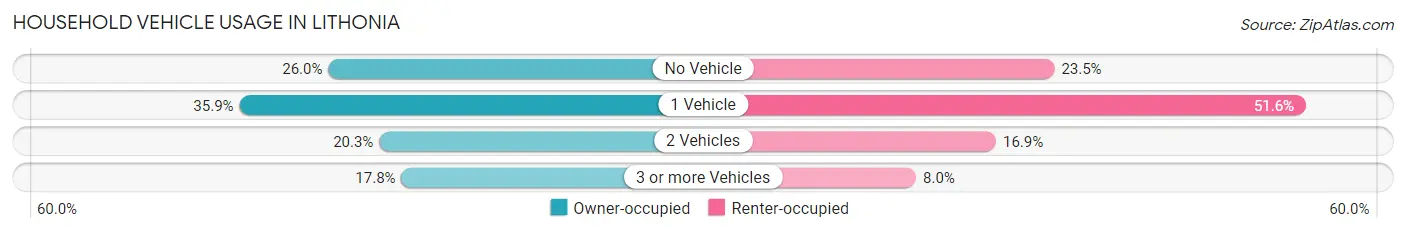
| Vehicles per Household | Owner-occupied | Renter-occupied |
| No Vehicle | 73 (26.0%) | 165 (23.5%) |
| 1 Vehicle | 101 (35.9%) | 363 (51.6%) |
| 2 Vehicles | 57 (20.3%) | 119 (16.9%) |
| 3 or more Vehicles | 50 (17.8%) | 56 (8.0%) |
| Total | 281 (100.0%) | 703 (100.0%) |
Real Estate & Mortgages in Lithonia
Real Estate and Mortgage Overview in Lithonia
| Characteristic | Without Mortgage | With Mortgage |
| Housing Units | 70 | 211 |
| Median Property Value | $44,100 | $200,600 |
| Median Household Income | $59,706 | $112 |
| Monthly Housing Costs | $337 | $12 |
| Real Estate Taxes | $504 | $0 |
Property Value by Mortgage Status in Lithonia
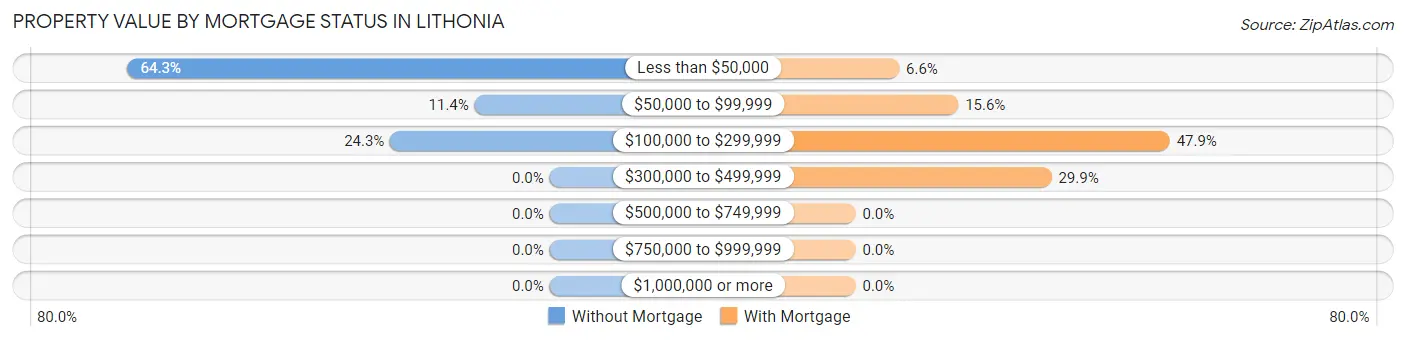
| Property Value | Without Mortgage | With Mortgage |
| Less than $50,000 | 45 (64.3%) | 14 (6.6%) |
| $50,000 to $99,999 | 8 (11.4%) | 33 (15.6%) |
| $100,000 to $299,999 | 17 (24.3%) | 101 (47.9%) |
| $300,000 to $499,999 | 0 (0.0%) | 63 (29.9%) |
| $500,000 to $749,999 | 0 (0.0%) | 0 (0.0%) |
| $750,000 to $999,999 | 0 (0.0%) | 0 (0.0%) |
| $1,000,000 or more | 0 (0.0%) | 0 (0.0%) |
| Total | 70 (100.0%) | 211 (100.0%) |
Household Income by Mortgage Status in Lithonia
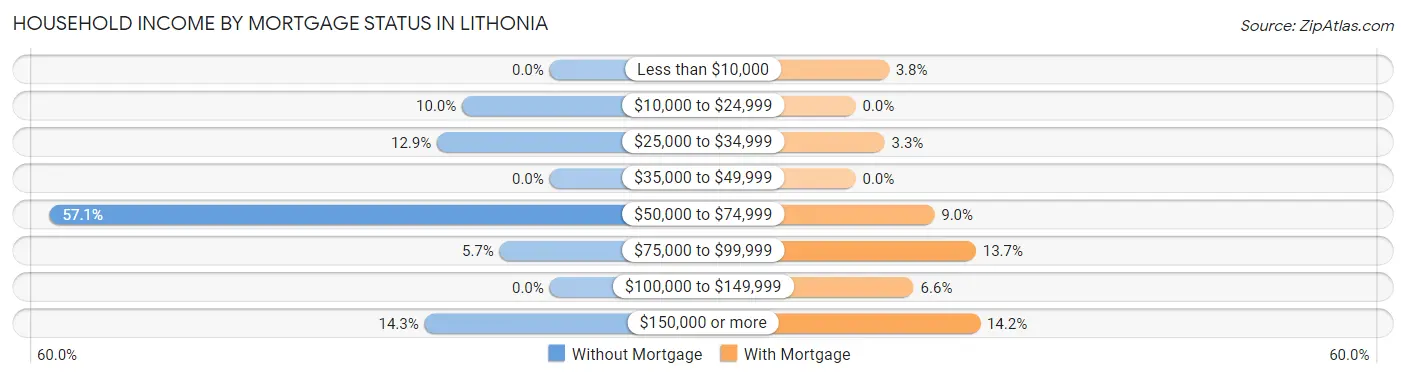
| Household Income | Without Mortgage | With Mortgage |
| Less than $10,000 | 0 (0.0%) | 8 (3.8%) |
| $10,000 to $24,999 | 7 (10.0%) | 0 (0.0%) |
| $25,000 to $34,999 | 9 (12.9%) | 7 (3.3%) |
| $35,000 to $49,999 | 0 (0.0%) | 0 (0.0%) |
| $50,000 to $74,999 | 40 (57.1%) | 19 (9.0%) |
| $75,000 to $99,999 | 4 (5.7%) | 29 (13.7%) |
| $100,000 to $149,999 | 0 (0.0%) | 14 (6.6%) |
| $150,000 or more | 10 (14.3%) | 30 (14.2%) |
| Total | 70 (100.0%) | 211 (100.0%) |
Property Value to Household Income Ratio in Lithonia
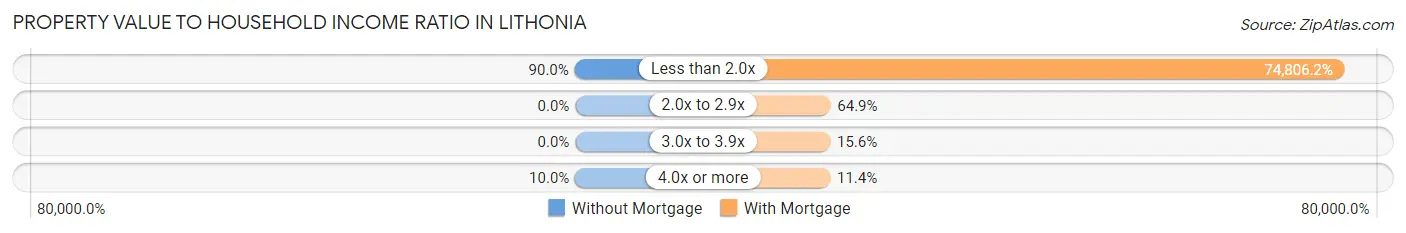
| Value-to-Income Ratio | Without Mortgage | With Mortgage |
| Less than 2.0x | 63 (90.0%) | 157,841 (74,806.2%) |
| 2.0x to 2.9x | 0 (0.0%) | 137 (64.9%) |
| 3.0x to 3.9x | 0 (0.0%) | 33 (15.6%) |
| 4.0x or more | 7 (10.0%) | 24 (11.4%) |
| Total | 70 (100.0%) | 211 (100.0%) |
Real Estate Taxes by Mortgage Status in Lithonia
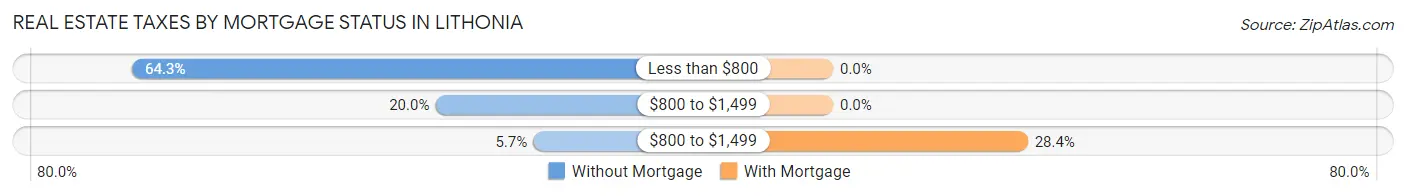
| Property Taxes | Without Mortgage | With Mortgage |
| Less than $800 | 45 (64.3%) | 0 (0.0%) |
| $800 to $1,499 | 14 (20.0%) | 0 (0.0%) |
| $800 to $1,499 | 4 (5.7%) | 60 (28.4%) |
| Total | 70 (100.0%) | 211 (100.0%) |
Health & Disability in Lithonia
Health Insurance Coverage by Age in Lithonia
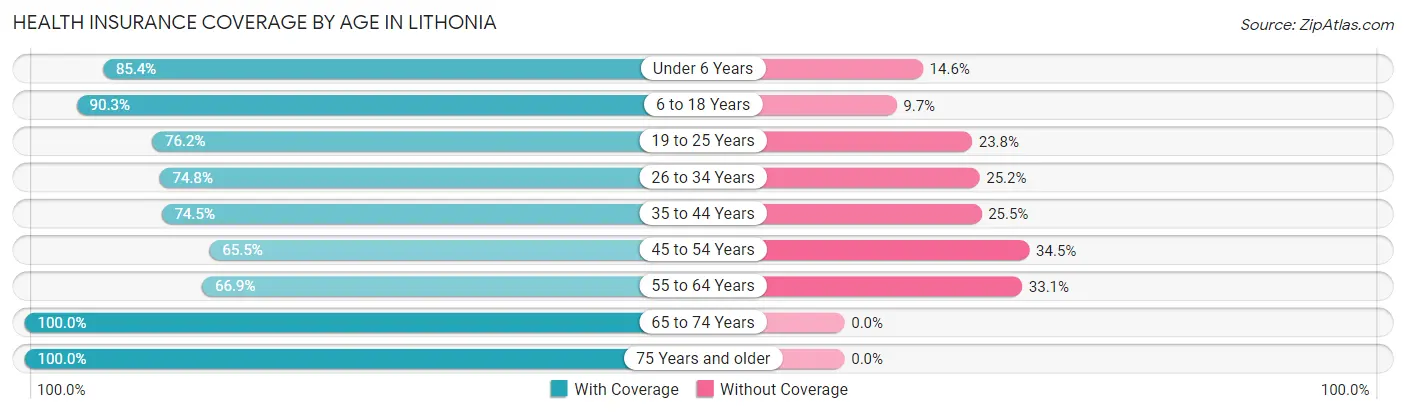
| Age Bracket | With Coverage | Without Coverage |
| Under 6 Years | 263 (85.4%) | 45 (14.6%) |
| 6 to 18 Years | 521 (90.3%) | 56 (9.7%) |
| 19 to 25 Years | 141 (76.2%) | 44 (23.8%) |
| 26 to 34 Years | 226 (74.8%) | 76 (25.2%) |
| 35 to 44 Years | 318 (74.5%) | 109 (25.5%) |
| 45 to 54 Years | 211 (65.5%) | 111 (34.5%) |
| 55 to 64 Years | 196 (66.9%) | 97 (33.1%) |
| 65 to 74 Years | 146 (100.0%) | 0 (0.0%) |
| 75 Years and older | 50 (100.0%) | 0 (0.0%) |
| Total | 2,072 (79.4%) | 538 (20.6%) |
Health Insurance Coverage by Citizenship Status in Lithonia
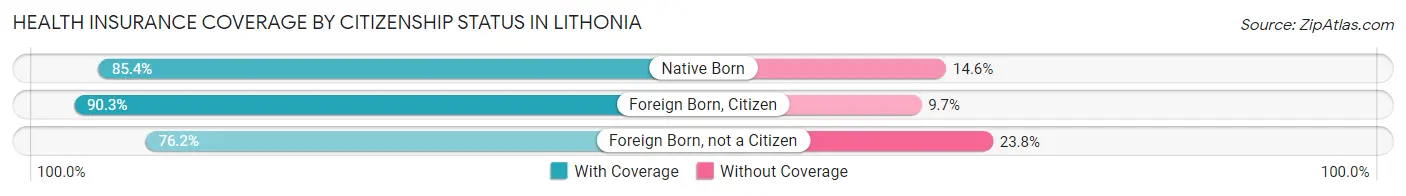
| Citizenship Status | With Coverage | Without Coverage |
| Native Born | 263 (85.4%) | 45 (14.6%) |
| Foreign Born, Citizen | 521 (90.3%) | 56 (9.7%) |
| Foreign Born, not a Citizen | 141 (76.2%) | 44 (23.8%) |
Health Insurance Coverage by Household Income in Lithonia
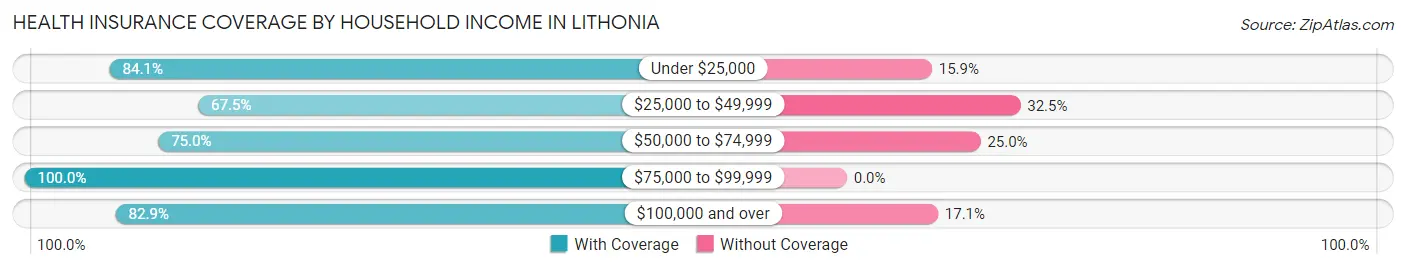
| Household Income | With Coverage | Without Coverage |
| Under $25,000 | 607 (84.1%) | 115 (15.9%) |
| $25,000 to $49,999 | 376 (67.5%) | 181 (32.5%) |
| $50,000 to $74,999 | 446 (75.0%) | 149 (25.0%) |
| $75,000 to $99,999 | 191 (100.0%) | 0 (0.0%) |
| $100,000 and over | 452 (82.9%) | 93 (17.1%) |
Public vs Private Health Insurance Coverage by Age in Lithonia
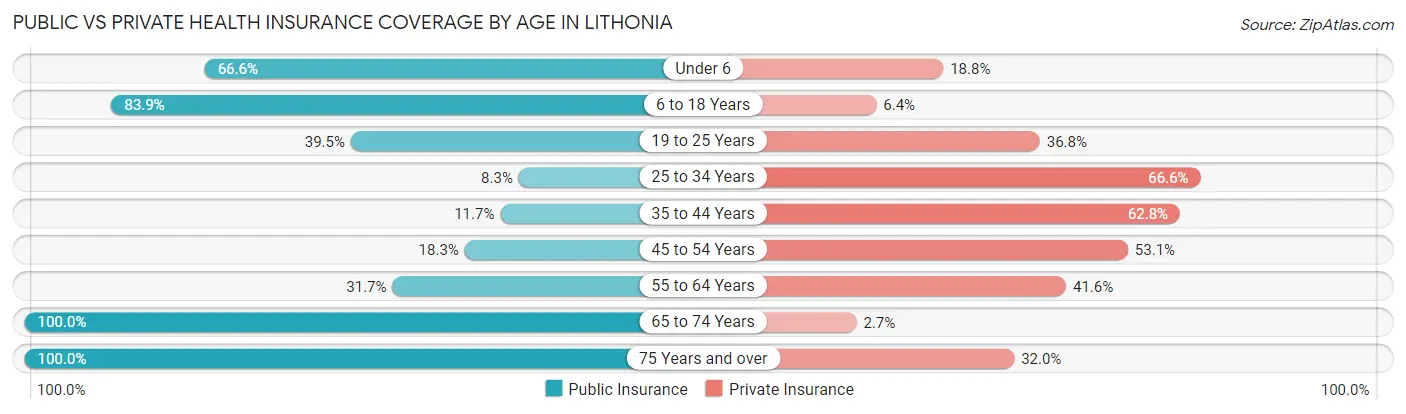
| Age Bracket | Public Insurance | Private Insurance |
| Under 6 | 205 (66.6%) | 58 (18.8%) |
| 6 to 18 Years | 484 (83.9%) | 37 (6.4%) |
| 19 to 25 Years | 73 (39.5%) | 68 (36.8%) |
| 25 to 34 Years | 25 (8.3%) | 201 (66.6%) |
| 35 to 44 Years | 50 (11.7%) | 268 (62.8%) |
| 45 to 54 Years | 59 (18.3%) | 171 (53.1%) |
| 55 to 64 Years | 93 (31.7%) | 122 (41.6%) |
| 65 to 74 Years | 146 (100.0%) | 4 (2.7%) |
| 75 Years and over | 50 (100.0%) | 16 (32.0%) |
| Total | 1,185 (45.4%) | 945 (36.2%) |
Disability Status by Sex by Age in Lithonia
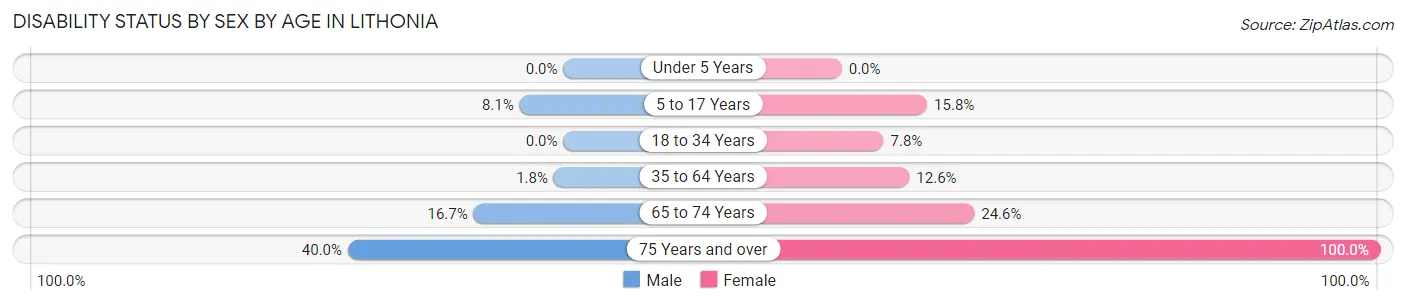
| Age Bracket | Male | Female |
| Under 5 Years | 0 (0.0%) | 0 (0.0%) |
| 5 to 17 Years | 17 (8.1%) | 61 (15.8%) |
| 18 to 34 Years | 0 (0.0%) | 28 (7.8%) |
| 35 to 64 Years | 10 (1.8%) | 60 (12.6%) |
| 65 to 74 Years | 4 (16.7%) | 30 (24.6%) |
| 75 Years and over | 12 (40.0%) | 20 (100.0%) |
Disability Class by Sex by Age in Lithonia
Disability Class: Hearing Difficulty
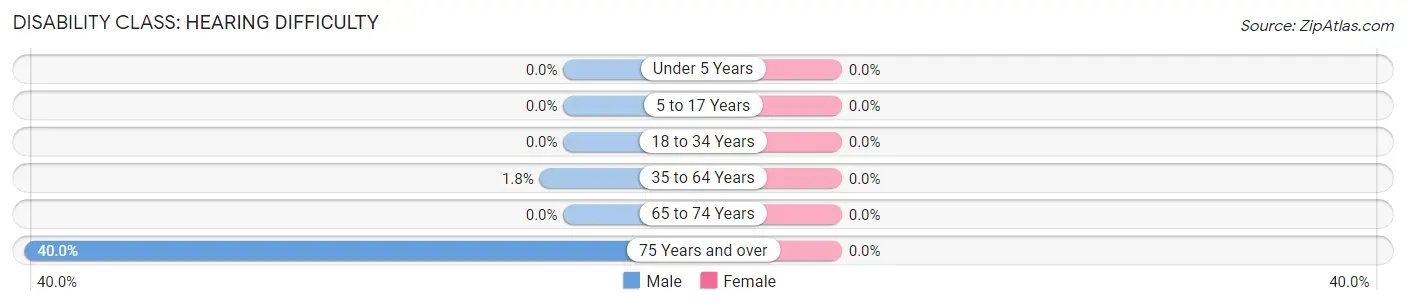
| Age Bracket | Male | Female |
| Under 5 Years | 0 (0.0%) | 0 (0.0%) |
| 5 to 17 Years | 0 (0.0%) | 0 (0.0%) |
| 18 to 34 Years | 0 (0.0%) | 0 (0.0%) |
| 35 to 64 Years | 10 (1.8%) | 0 (0.0%) |
| 65 to 74 Years | 0 (0.0%) | 0 (0.0%) |
| 75 Years and over | 12 (40.0%) | 0 (0.0%) |
Disability Class: Vision Difficulty
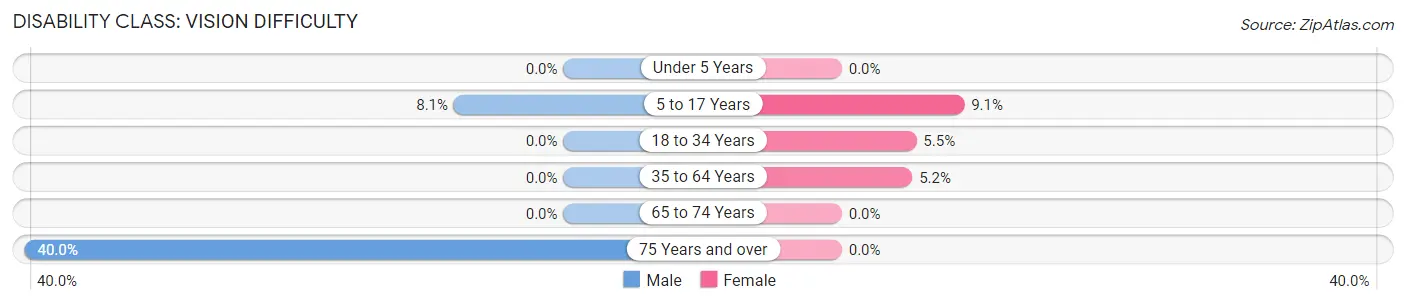
| Age Bracket | Male | Female |
| Under 5 Years | 0 (0.0%) | 0 (0.0%) |
| 5 to 17 Years | 17 (8.1%) | 35 (9.1%) |
| 18 to 34 Years | 0 (0.0%) | 20 (5.5%) |
| 35 to 64 Years | 0 (0.0%) | 25 (5.2%) |
| 65 to 74 Years | 0 (0.0%) | 0 (0.0%) |
| 75 Years and over | 12 (40.0%) | 0 (0.0%) |
Disability Class: Cognitive Difficulty
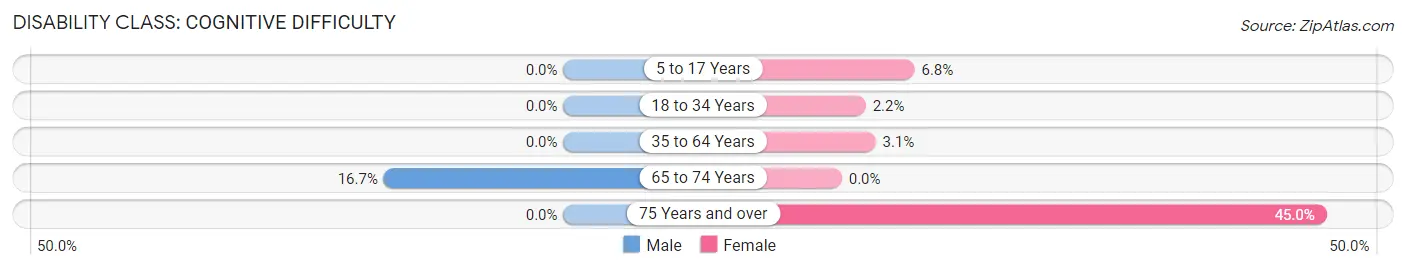
| Age Bracket | Male | Female |
| 5 to 17 Years | 0 (0.0%) | 26 (6.8%) |
| 18 to 34 Years | 0 (0.0%) | 8 (2.2%) |
| 35 to 64 Years | 0 (0.0%) | 15 (3.1%) |
| 65 to 74 Years | 4 (16.7%) | 0 (0.0%) |
| 75 Years and over | 0 (0.0%) | 9 (45.0%) |
Disability Class: Ambulatory Difficulty
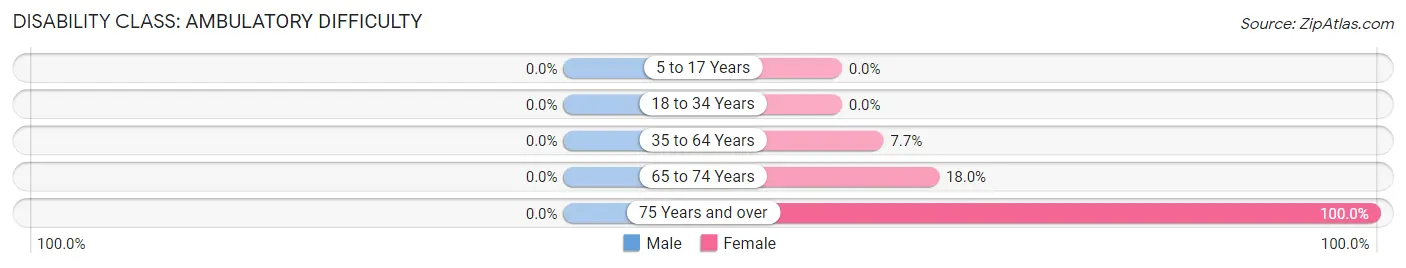
| Age Bracket | Male | Female |
| 5 to 17 Years | 0 (0.0%) | 0 (0.0%) |
| 18 to 34 Years | 0 (0.0%) | 0 (0.0%) |
| 35 to 64 Years | 0 (0.0%) | 37 (7.7%) |
| 65 to 74 Years | 0 (0.0%) | 22 (18.0%) |
| 75 Years and over | 0 (0.0%) | 20 (100.0%) |
Disability Class: Self-Care Difficulty
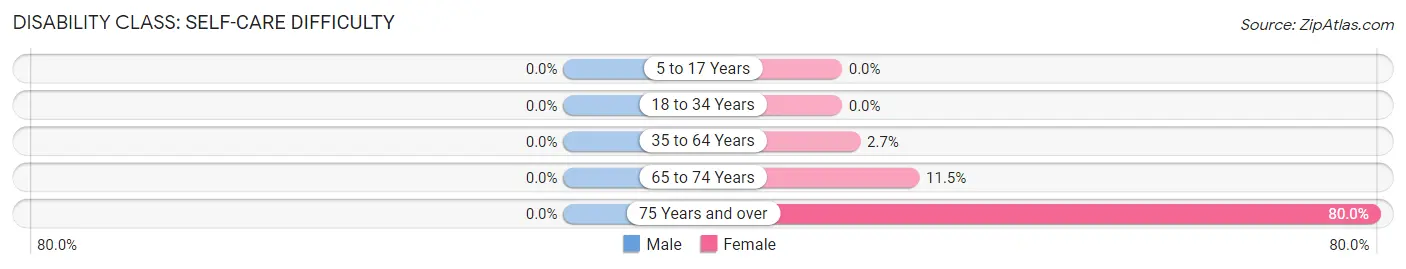
| Age Bracket | Male | Female |
| 5 to 17 Years | 0 (0.0%) | 0 (0.0%) |
| 18 to 34 Years | 0 (0.0%) | 0 (0.0%) |
| 35 to 64 Years | 0 (0.0%) | 13 (2.7%) |
| 65 to 74 Years | 0 (0.0%) | 14 (11.5%) |
| 75 Years and over | 0 (0.0%) | 16 (80.0%) |
Technology Access in Lithonia
Computing Device Access in Lithonia
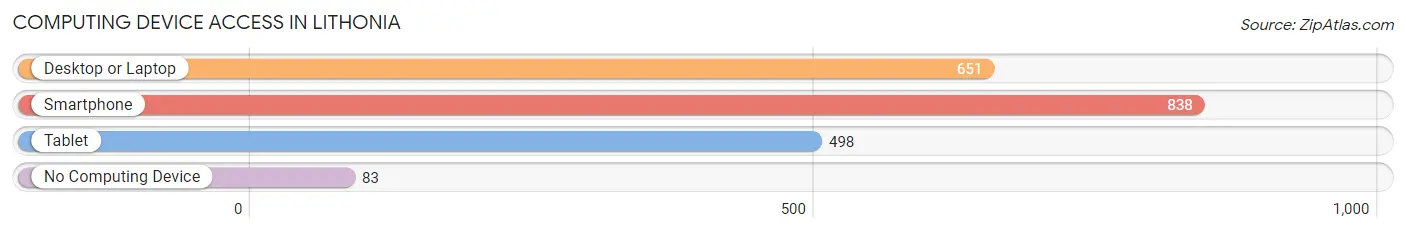
| Device Type | # Households | % Households |
| Desktop or Laptop | 651 | 66.2% |
| Smartphone | 838 | 85.2% |
| Tablet | 498 | 50.6% |
| No Computing Device | 83 | 8.4% |
| Total | 984 | 100.0% |
Internet Access in Lithonia
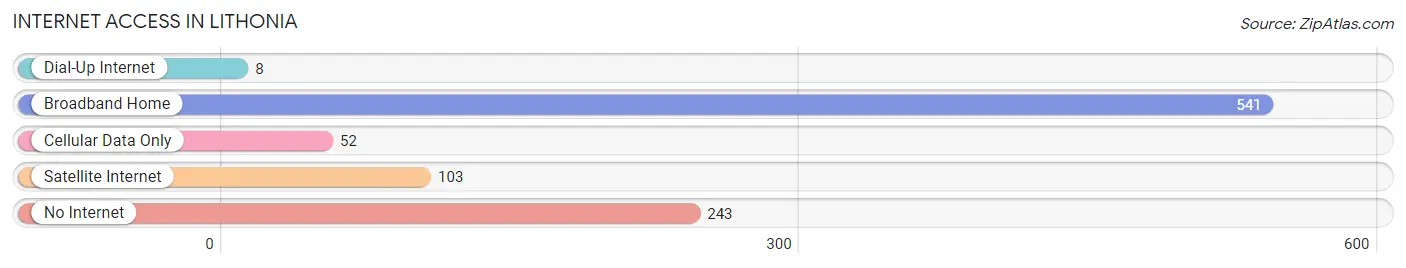
| Internet Type | # Households | % Households |
| Dial-Up Internet | 8 | 0.8% |
| Broadband Home | 541 | 55.0% |
| Cellular Data Only | 52 | 5.3% |
| Satellite Internet | 103 | 10.5% |
| No Internet | 243 | 24.7% |
| Total | 984 | 100.0% |
Lithonia Summary
Lithonia is a city located in DeKalb County, Georgia, United States. It is a suburb of Atlanta and is part of the Atlanta metropolitan area. The population was 1,924 at the 2010 census.
History
Lithonia was founded in 1842 as a small farming community. The name Lithonia is derived from the Greek words for "stone" and "place". The town was originally known as "Stone Place" and was later changed to Lithonia. The town was incorporated in 1887.
In the early 1900s, Lithonia was a thriving agricultural community. The town was home to several cotton gins, a grist mill, and a sawmill. The town also had a post office, a general store, and a hotel.
In the 1950s, Lithonia began to experience rapid growth as the city of Atlanta expanded. The city was annexed by the city of Atlanta in 1959.
Geography
Lithonia is located in DeKalb County, Georgia, at 33°44'N 84°7'W (33.7333, -84.1167). The city is located in the eastern part of the county, approximately 20 miles east of downtown Atlanta.
The city has a total area of 4.2 square miles, all of which is land. The city is located in the Piedmont region of Georgia and is surrounded by rolling hills and forests.
Economy
Lithonia is a bedroom community for the city of Atlanta. The city has a diverse economy with a mix of manufacturing, retail, and service businesses.
The city is home to several large employers, including Georgia-Pacific, a paper and pulp company, and the Lithonia Lighting Company, a manufacturer of lighting fixtures.
Demographics
As of the 2010 census, there were 1,924 people, 745 households, and 486 families residing in the city. The population density was 459.3 people per square mile. The racial makeup of the city was 57.2% African American, 37.2% White, 0.3% Native American, 0.7% Asian, 0.1% Pacific Islander, 2.2% from other races, and 2.3% from two or more races. Hispanic or Latino of any race were 4.3% of the population.
The median income for a household in the city was $37,917, and the median income for a family was $45,625. Males had a median income of $31,250 versus $27,500 for females. The per capita income for the city was $17,845. About 11.2% of families and 14.2% of the population were below the poverty line, including 19.2% of those under age 18 and 11.2% of those age 65 or over.
Common Questions
What is the Total Population of Lithonia?
Total Population of Lithonia is 2,614.
What is the Total Male Population of Lithonia?
Total Male Population of Lithonia is 1,142.
What is the Total Female Population of Lithonia?
Total Female Population of Lithonia is 1,472.
What is the Ratio of Males per 100 Females in Lithonia?
There are 77.58 Males per 100 Females in Lithonia.
What is the Ratio of Females per 100 Males in Lithonia?
There are 128.90 Females per 100 Males in Lithonia.
What is the Median Population Age in Lithonia?
Median Population Age in Lithonia is 33.1 Years.
What is the Average Family Size in Lithonia
Average Family Size in Lithonia is 4.0 People.
What is the Average Household Size in Lithonia
Average Household Size in Lithonia is 2.6 People.
What is Per Capita Income in Lithonia?
Per Capita income in Lithonia is $37,638.
What is the Median Family Income in Lithonia?
Median Family Income in Lithonia is $51,600.
What is the Median Household income in Lithonia?
Median Household Income in Lithonia is $45,431.
What is Income or Wage Gap in Lithonia?
Income or Wage Gap in Lithonia is 40.4%.
Women in Lithonia earn 59.6 cents for every dollar earned by a man.
What is Inequality or Gini Index in Lithonia?
Inequality or Gini Index in Lithonia is 0.60.
How Large is the Labor Force in Lithonia?
There are 1,408 People in the Labor Forcein in Lithonia.
What is the Percentage of People in the Labor Force in Lithonia?
78.6% of People are in the Labor Force in Lithonia.
What is the Unemployment Rate in Lithonia?
Unemployment Rate in Lithonia is 7.3%.