Gainesville, GA
Gainesville Map
Gainesville Overview
42,780
TOTAL POPULATION
20,516
MALE POPULATION
22,264
FEMALE POPULATION
92.15
MALES / 100 FEMALES
108.52
FEMALES / 100 MALES
32.1
MEDIAN AGE
3.5
AVG FAMILY SIZE
2.8
AVG HOUSEHOLD SIZE
$31,619
PER CAPITA INCOME
$71,466
AVG FAMILY INCOME
$64,163
AVG HOUSEHOLD INCOME
18.7%
WAGE / INCOME GAP [ % ]
81.3¢/ $1
WAGE / INCOME GAP [ $ ]
$11,386
FAMILY INCOME DEFICIT
0.49
INEQUALITY / GINI INDEX
20,896
LABOR FORCE [ PEOPLE ]
62.8%
PERCENT IN LABOR FORCE
4.3%
UNEMPLOYMENT RATE
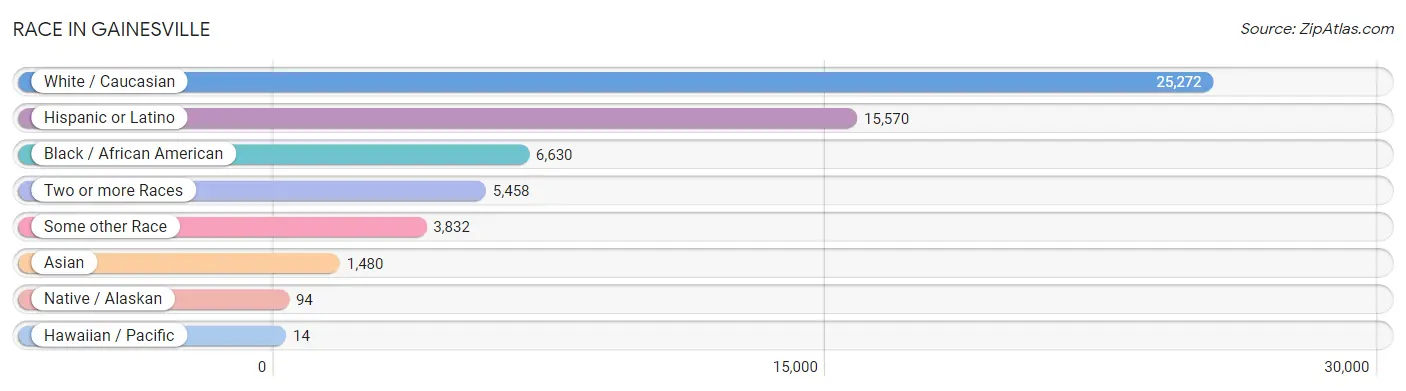
Race in Gainesville
The most populous races in Gainesville are White / Caucasian (25,272 | 59.1%), Hispanic or Latino (15,570 | 36.4%), and Black / African American (6,630 | 15.5%).
| Race | # Population | % Population |
| Asian | 1,480 | 3.5% |
| Black / African American | 6,630 | 15.5% |
| Hawaiian / Pacific | 14 | 0.0% |
| Hispanic or Latino | 15,570 | 36.4% |
| Native / Alaskan | 94 | 0.2% |
| White / Caucasian | 25,272 | 59.1% |
| Two or more Races | 5,458 | 12.8% |
| Some other Race | 3,832 | 9.0% |
| Total | 42,780 | 100.0% |
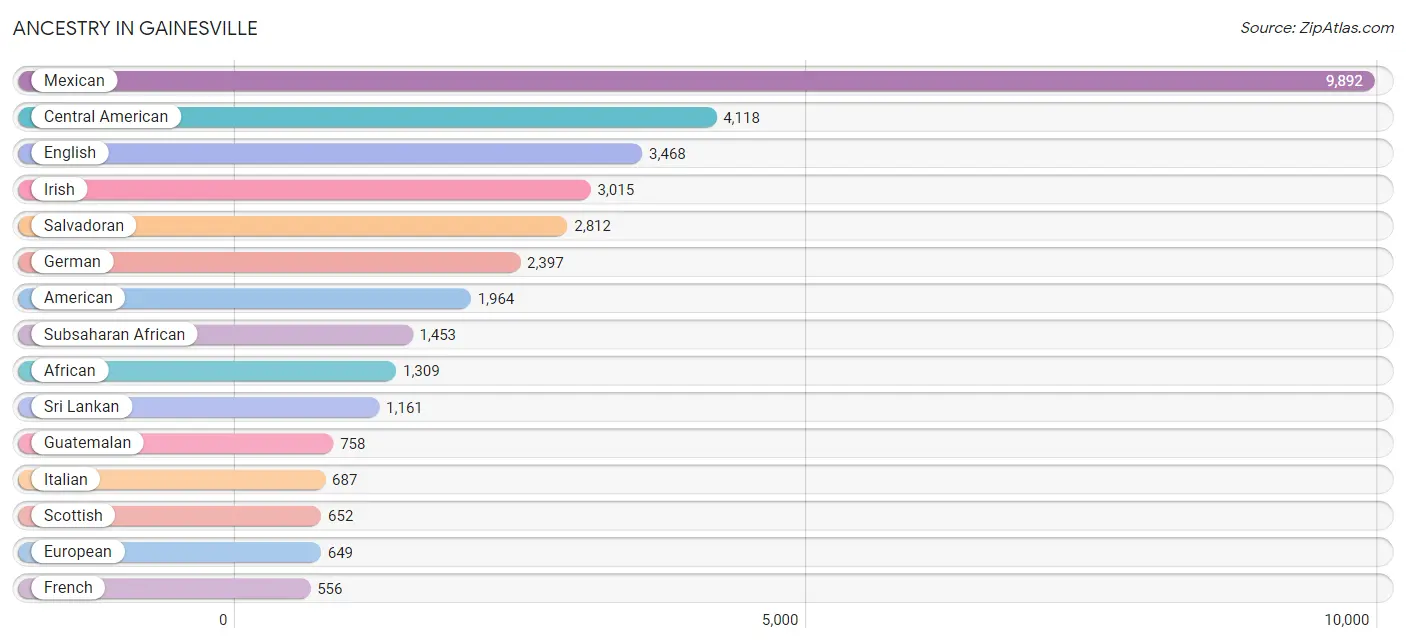
Ancestry in Gainesville
The most populous ancestries reported in Gainesville are Mexican (9,892 | 23.1%), Central American (4,118 | 9.6%), English (3,468 | 8.1%), Irish (3,015 | 7.0%), and Salvadoran (2,812 | 6.6%), together accounting for 54.5% of all Gainesville residents.
| Ancestry | # Population | % Population |
| African | 1,309 | 3.1% |
| American | 1,964 | 4.6% |
| Arab | 53 | 0.1% |
| Argentinean | 20 | 0.1% |
| Austrian | 59 | 0.1% |
| Belizean | 10 | 0.0% |
| Bhutanese | 51 | 0.1% |
| British | 480 | 1.1% |
| British West Indian | 140 | 0.3% |
| Burmese | 63 | 0.2% |
| Canadian | 45 | 0.1% |
| Celtic | 25 | 0.1% |
| Central American | 4,118 | 9.6% |
| Central American Indian | 44 | 0.1% |
| Cherokee | 61 | 0.1% |
| Choctaw | 17 | 0.0% |
| Colombian | 240 | 0.6% |
| Costa Rican | 10 | 0.0% |
| Cuban | 323 | 0.8% |
| Czech | 60 | 0.1% |
| Danish | 10 | 0.0% |
| Dominican | 363 | 0.9% |
| Dutch | 189 | 0.4% |
| Eastern European | 98 | 0.2% |
| English | 3,468 | 8.1% |
| European | 649 | 1.5% |
| Filipino | 9 | 0.0% |
| French | 556 | 1.3% |
| French Canadian | 121 | 0.3% |
| German | 2,397 | 5.6% |
| Ghanaian | 105 | 0.3% |
| Greek | 119 | 0.3% |
| Guatemalan | 758 | 1.8% |
| Haitian | 73 | 0.2% |
| Honduran | 482 | 1.1% |
| Hungarian | 65 | 0.2% |
| Indian (Asian) | 46 | 0.1% |
| Irish | 3,015 | 7.0% |
| Italian | 687 | 1.6% |
| Jamaican | 92 | 0.2% |
| Korean | 207 | 0.5% |
| Laotian | 76 | 0.2% |
| Latvian | 7 | 0.0% |
| Lebanese | 53 | 0.1% |
| Lumbee | 22 | 0.1% |
| Mexican | 9,892 | 23.1% |
| Mexican American Indian | 74 | 0.2% |
| Native Hawaiian | 14 | 0.0% |
| Nicaraguan | 56 | 0.1% |
| Nigerian | 18 | 0.0% |
| Northern European | 52 | 0.1% |
| Norwegian | 175 | 0.4% |
| Pennsylvania German | 309 | 0.7% |
| Peruvian | 73 | 0.2% |
| Polish | 463 | 1.1% |
| Portuguese | 55 | 0.1% |
| Puerto Rican | 316 | 0.7% |
| Romanian | 45 | 0.1% |
| Russian | 58 | 0.1% |
| Salvadoran | 2,812 | 6.6% |
| Scotch-Irish | 282 | 0.7% |
| Scottish | 652 | 1.5% |
| Slavic | 20 | 0.1% |
| Slovene | 17 | 0.0% |
| South American | 356 | 0.8% |
| Spaniard | 66 | 0.2% |
| Sri Lankan | 1,161 | 2.7% |
| Subsaharan African | 1,453 | 3.4% |
| Swedish | 63 | 0.2% |
| Swiss | 60 | 0.1% |
| Thai | 15 | 0.0% |
| Tongan | 26 | 0.1% |
| Turkish | 29 | 0.1% |
| Ukrainian | 30 | 0.1% |
| Venezuelan | 23 | 0.1% |
| Welsh | 155 | 0.4% | View All 76 Rows |
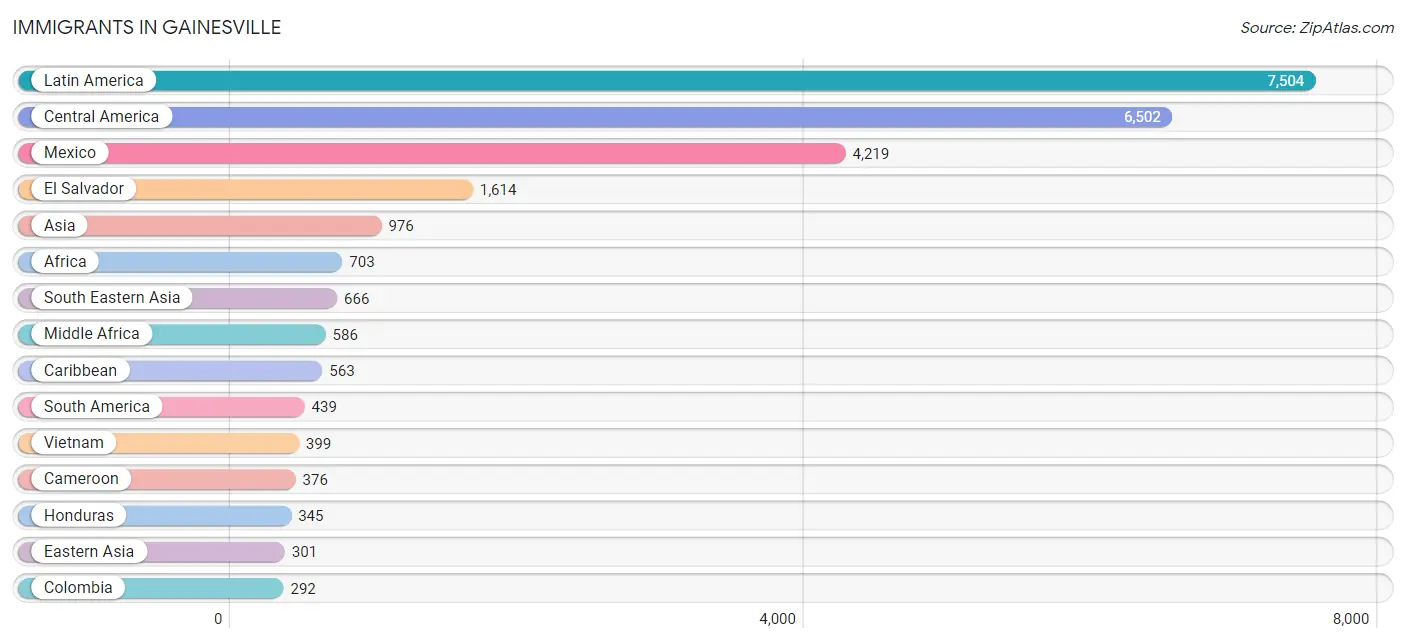
Immigrants in Gainesville
The most numerous immigrant groups reported in Gainesville came from Latin America (7,504 | 17.5%), Central America (6,502 | 15.2%), Mexico (4,219 | 9.9%), El Salvador (1,614 | 3.8%), and Asia (976 | 2.3%), together accounting for 48.7% of all Gainesville residents.
| Immigration Origin | # Population | % Population |
| Africa | 703 | 1.6% |
| Argentina | 20 | 0.1% |
| Asia | 976 | 2.3% |
| Cameroon | 376 | 0.9% |
| Canada | 78 | 0.2% |
| Caribbean | 563 | 1.3% |
| Central America | 6,502 | 15.2% |
| China | 124 | 0.3% |
| Colombia | 292 | 0.7% |
| Cuba | 93 | 0.2% |
| Dominica | 63 | 0.2% |
| Dominican Republic | 108 | 0.3% |
| Eastern Asia | 301 | 0.7% |
| Eastern Europe | 84 | 0.2% |
| El Salvador | 1,614 | 3.8% |
| England | 12 | 0.0% |
| Europe | 231 | 0.5% |
| France | 13 | 0.0% |
| Germany | 45 | 0.1% |
| Ghana | 82 | 0.2% |
| Guatemala | 268 | 0.6% |
| Haiti | 73 | 0.2% |
| Honduras | 345 | 0.8% |
| Hong Kong | 1 | 0.0% |
| Jamaica | 155 | 0.4% |
| Japan | 129 | 0.3% |
| Korea | 48 | 0.1% |
| Latin America | 7,504 | 17.5% |
| Malaysia | 40 | 0.1% |
| Mexico | 4,219 | 9.9% |
| Middle Africa | 586 | 1.4% |
| Netherlands | 34 | 0.1% |
| Nicaragua | 56 | 0.1% |
| Nigeria | 14 | 0.0% |
| Northern Europe | 25 | 0.1% |
| Peru | 32 | 0.1% |
| Philippines | 227 | 0.5% |
| Poland | 49 | 0.1% |
| Portugal | 30 | 0.1% |
| Romania | 2 | 0.0% |
| Russia | 23 | 0.1% |
| South America | 439 | 1.0% |
| South Eastern Asia | 666 | 1.6% |
| Southern Europe | 30 | 0.1% |
| Taiwan | 78 | 0.2% |
| Turkey | 9 | 0.0% |
| Ukraine | 10 | 0.0% |
| Venezuela | 95 | 0.2% |
| Vietnam | 399 | 0.9% |
| Western Africa | 117 | 0.3% |
| Western Asia | 9 | 0.0% |
| Western Europe | 92 | 0.2% |
| Zaire | 210 | 0.5% | View All 53 Rows |
Sex and Age in Gainesville
Sex and Age in Gainesville
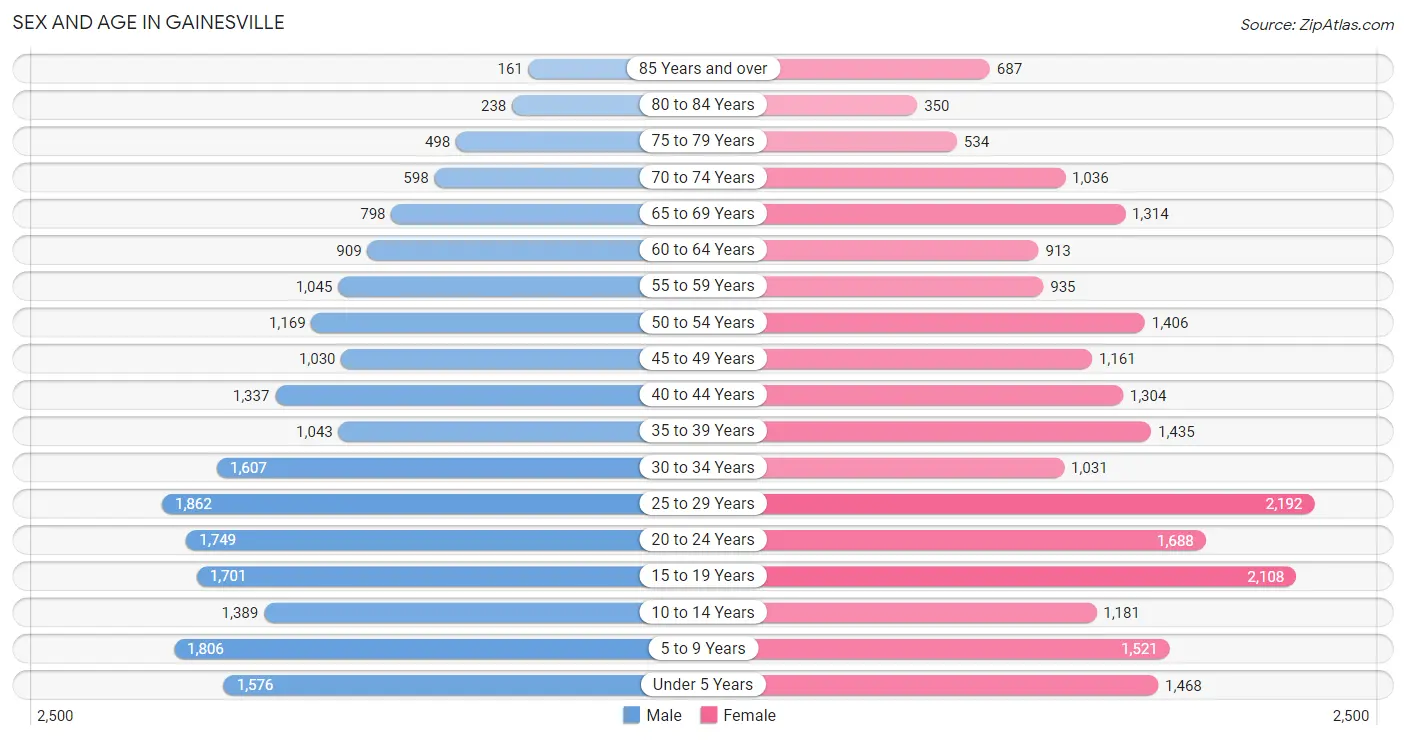
The most populous age groups in Gainesville are 25 to 29 Years (1,862 | 9.1%) for men and 25 to 29 Years (2,192 | 9.9%) for women.
| Age Bracket | Male | Female |
| Under 5 Years | 1,576 (7.7%) | 1,468 (6.6%) |
| 5 to 9 Years | 1,806 (8.8%) | 1,521 (6.8%) |
| 10 to 14 Years | 1,389 (6.8%) | 1,181 (5.3%) |
| 15 to 19 Years | 1,701 (8.3%) | 2,108 (9.5%) |
| 20 to 24 Years | 1,749 (8.5%) | 1,688 (7.6%) |
| 25 to 29 Years | 1,862 (9.1%) | 2,192 (9.9%) |
| 30 to 34 Years | 1,607 (7.8%) | 1,031 (4.6%) |
| 35 to 39 Years | 1,043 (5.1%) | 1,435 (6.5%) |
| 40 to 44 Years | 1,337 (6.5%) | 1,304 (5.9%) |
| 45 to 49 Years | 1,030 (5.0%) | 1,161 (5.2%) |
| 50 to 54 Years | 1,169 (5.7%) | 1,406 (6.3%) |
| 55 to 59 Years | 1,045 (5.1%) | 935 (4.2%) |
| 60 to 64 Years | 909 (4.4%) | 913 (4.1%) |
| 65 to 69 Years | 798 (3.9%) | 1,314 (5.9%) |
| 70 to 74 Years | 598 (2.9%) | 1,036 (4.6%) |
| 75 to 79 Years | 498 (2.4%) | 534 (2.4%) |
| 80 to 84 Years | 238 (1.2%) | 350 (1.6%) |
| 85 Years and over | 161 (0.8%) | 687 (3.1%) |
| Total | 20,516 (100.0%) | 22,264 (100.0%) |
Families and Households in Gainesville
Median Family Size in Gainesville
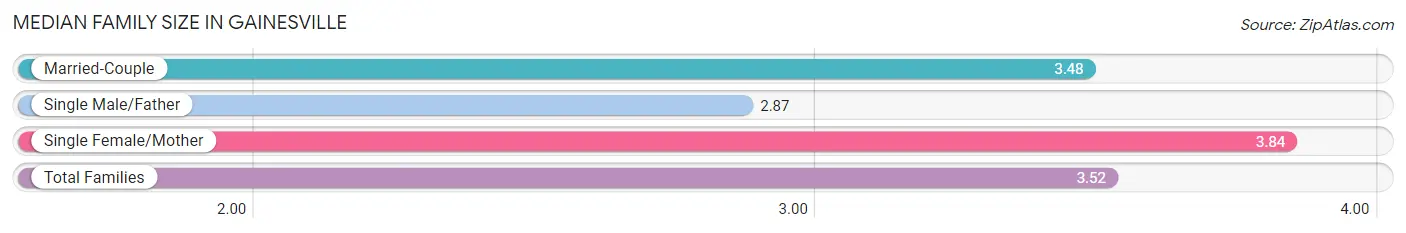
The median family size in Gainesville is 3.52 persons per family, with single female/mother families (2,385 | 25.4%) accounting for the largest median family size of 3.84 persons per family. On the other hand, single male/father families (908 | 9.7%) represent the smallest median family size with 2.87 persons per family.
| Family Type | # Families | Family Size |
| Married-Couple | 6,113 (65.0%) | 3.48 |
| Single Male/Father | 908 (9.7%) | 2.87 |
| Single Female/Mother | 2,385 (25.4%) | 3.84 |
| Total Families | 9,406 (100.0%) | 3.52 |
Median Household Size in Gainesville
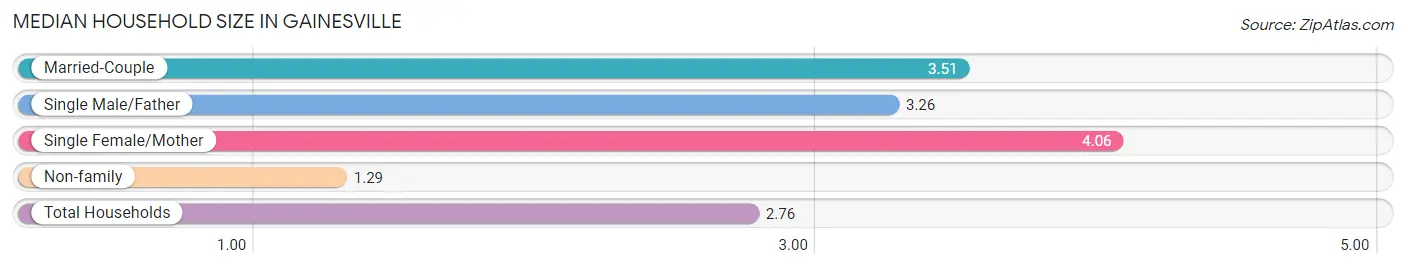
The median household size in Gainesville is 2.76 persons per household, with single female/mother households (2,385 | 15.9%) accounting for the largest median household size of 4.06 persons per household. non-family households (5,559 | 37.1%) represent the smallest median household size with 1.29 persons per household.
| Household Type | # Households | Household Size |
| Married-Couple | 6,113 (40.8%) | 3.51 |
| Single Male/Father | 908 (6.1%) | 3.26 |
| Single Female/Mother | 2,385 (15.9%) | 4.06 |
| Non-family | 5,559 (37.1%) | 1.29 |
| Total Households | 14,965 (100.0%) | 2.76 |
Household Size by Marriage Status in Gainesville
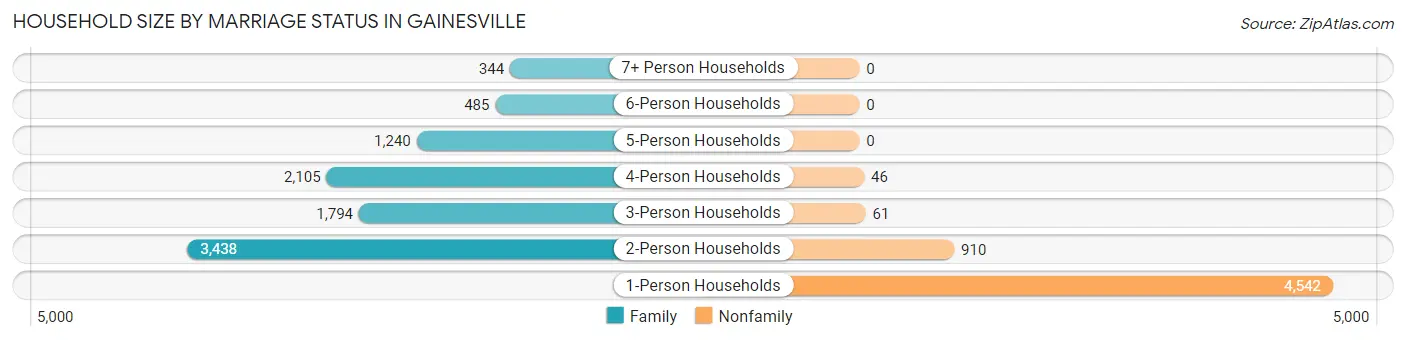
Out of a total of 14,965 households in Gainesville, 9,406 (62.8%) are family households, while 5,559 (37.1%) are nonfamily households. The most numerous type of family households are 2-person households, comprising 3,438, and the most common type of nonfamily households are 1-person households, comprising 4,542.
| Household Size | Family Households | Nonfamily Households |
| 1-Person Households | - | 4,542 (30.3%) |
| 2-Person Households | 3,438 (23.0%) | 910 (6.1%) |
| 3-Person Households | 1,794 (12.0%) | 61 (0.4%) |
| 4-Person Households | 2,105 (14.1%) | 46 (0.3%) |
| 5-Person Households | 1,240 (8.3%) | 0 (0.0%) |
| 6-Person Households | 485 (3.2%) | 0 (0.0%) |
| 7+ Person Households | 344 (2.3%) | 0 (0.0%) |
| Total | 9,406 (62.8%) | 5,559 (37.1%) |
Female Fertility in Gainesville
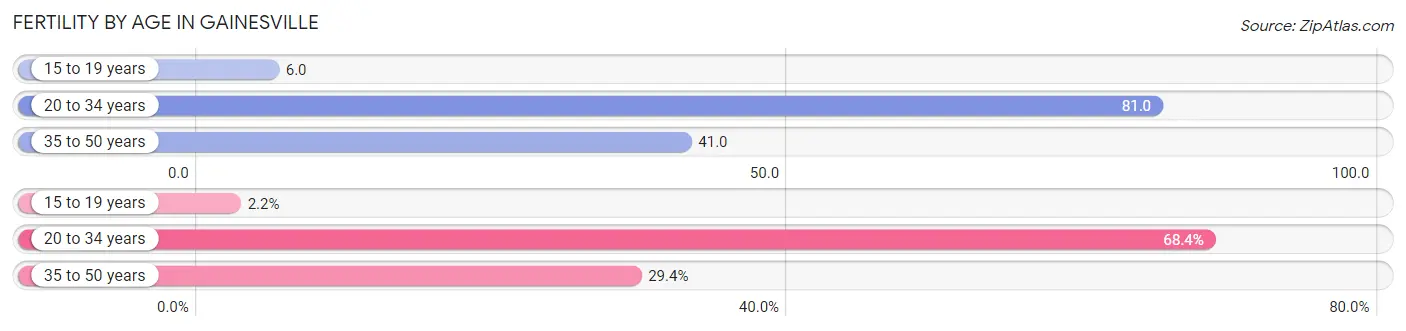
Fertility by Age in Gainesville
Average fertility rate in Gainesville is 52.0 births per 1,000 women. Women in the age bracket of 20 to 34 years have the highest fertility rate with 81.0 births per 1,000 women. Women in the age bracket of 20 to 34 years acount for 68.4% of all women with births.
| Age Bracket | Women with Births | Births / 1,000 Women |
| 15 to 19 years | 13 (2.2%) | 6.0 |
| 20 to 34 years | 400 (68.4%) | 81.0 |
| 35 to 50 years | 172 (29.4%) | 41.0 |
| Total | 585 (100.0%) | 52.0 |
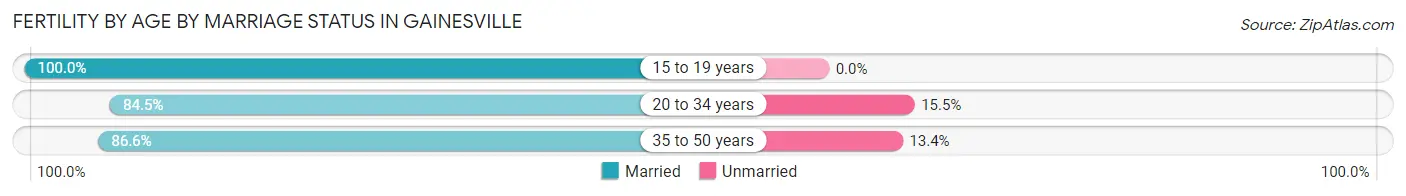
Fertility by Age by Marriage Status in Gainesville
85.5% of women with births (585) in Gainesville are married. The highest percentage of unmarried women with births falls into 20 to 34 years age bracket with 15.5% of them unmarried at the time of birth, while the lowest percentage of unmarried women with births belong to 15 to 19 years age bracket with 0.0% of them unmarried.
| Age Bracket | Married | Unmarried |
| 15 to 19 years | 13 (100.0%) | 0 (0.0%) |
| 20 to 34 years | 338 (84.5%) | 62 (15.5%) |
| 35 to 50 years | 149 (86.6%) | 23 (13.4%) |
| Total | 500 (85.5%) | 85 (14.5%) |
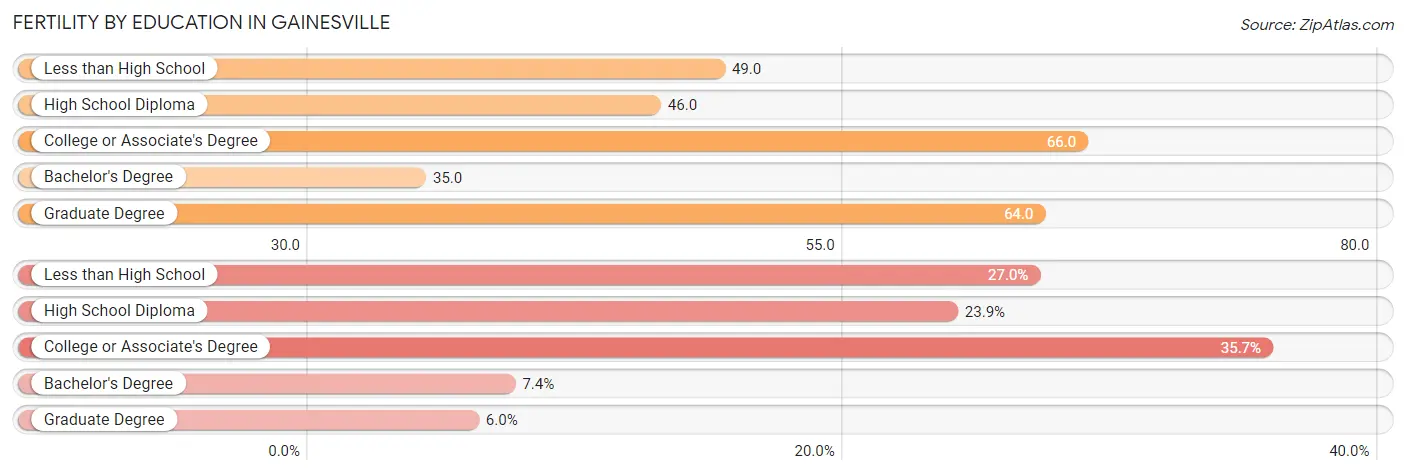
Fertility by Education in Gainesville
Average fertility rate in Gainesville is 52.0 births per 1,000 women. Women with the education attainment of college or associate's degree have the highest fertility rate of 66.0 births per 1,000 women, while women with the education attainment of bachelor's degree have the lowest fertility at 35.0 births per 1,000 women. Women with the education attainment of college or associate's degree represent 35.7% of all women with births.
| Educational Attainment | Women with Births | Births / 1,000 Women |
| Less than High School | 158 (27.0%) | 49.0 |
| High School Diploma | 140 (23.9%) | 46.0 |
| College or Associate's Degree | 209 (35.7%) | 66.0 |
| Bachelor's Degree | 43 (7.3%) | 35.0 |
| Graduate Degree | 35 (6.0%) | 64.0 |
| Total | 585 (100.0%) | 52.0 |
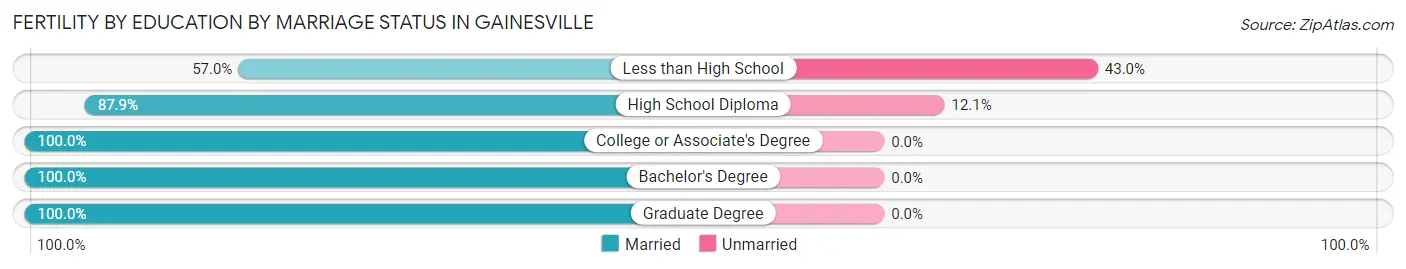
Fertility by Education by Marriage Status in Gainesville
14.5% of women with births in Gainesville are unmarried. Women with the educational attainment of college or associate's degree are most likely to be married with 100.0% of them married at childbirth, while women with the educational attainment of less than high school are least likely to be married with 43.0% of them unmarried at childbirth.
| Educational Attainment | Married | Unmarried |
| Less than High School | 90 (57.0%) | 68 (43.0%) |
| High School Diploma | 123 (87.9%) | 17 (12.1%) |
| College or Associate's Degree | 209 (100.0%) | 0 (0.0%) |
| Bachelor's Degree | 43 (100.0%) | 0 (0.0%) |
| Graduate Degree | 35 (100.0%) | 0 (0.0%) |
| Total | 500 (85.5%) | 85 (14.5%) |
Income in Gainesville
Income Overview in Gainesville
Per Capita Income in Gainesville is $31,619, while median incomes of families and households are $71,466 and $64,163 respectively.
| Characteristic | Number | Measure |
| Per Capita Income | 42,780 | $31,619 |
| Median Family Income | 9,406 | $71,466 |
| Mean Family Income | 9,406 | $98,043 |
| Median Household Income | 14,965 | $64,163 |
| Mean Household Income | 14,965 | $86,648 |
| Income Deficit | 9,406 | $11,386 |
| Wage / Income Gap (%) | 42,780 | 18.70% |
| Wage / Income Gap ($) | 42,780 | 81.30¢ per $1 |
| Gini / Inequality Index | 42,780 | 0.49 |
Earnings by Sex in Gainesville
Average Earnings in Gainesville are $33,665, $37,488 for men and $30,479 for women, a difference of 18.7%.
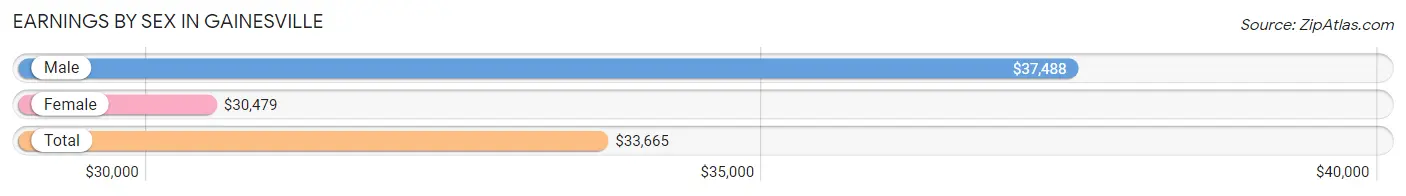
| Sex | Number | Average Earnings |
| Male | 11,371 (51.6%) | $37,488 |
| Female | 10,672 (48.4%) | $30,479 |
| Total | 22,043 (100.0%) | $33,665 |
Earnings by Sex by Income Bracket in Gainesville
The most common earnings brackets in Gainesville are $100,000+ for men (1,137 | 10.0%) and $25,000 to $29,999 for women (1,503 | 14.1%).
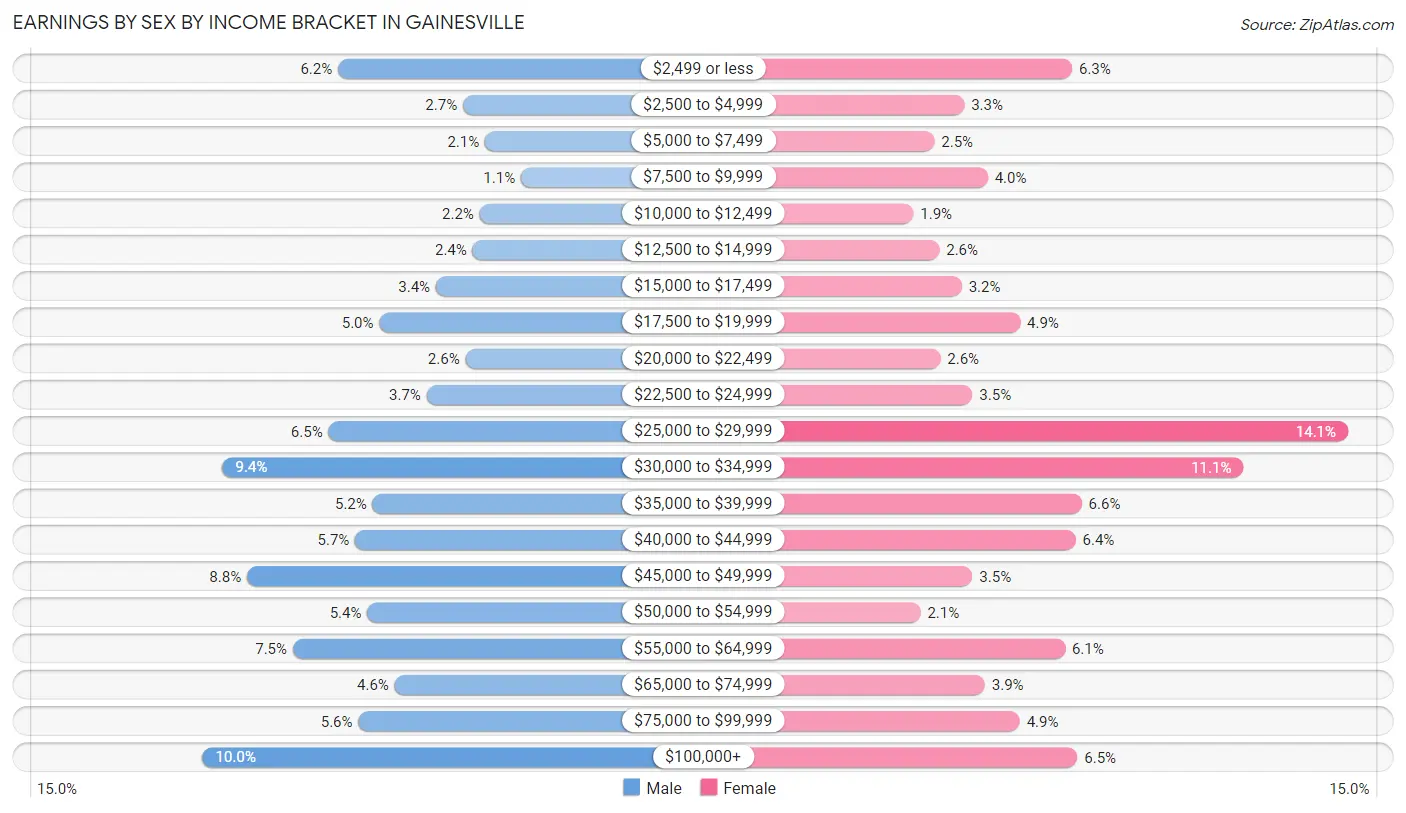
| Income | Male | Female |
| $2,499 or less | 704 (6.2%) | 676 (6.3%) |
| $2,500 to $4,999 | 305 (2.7%) | 352 (3.3%) |
| $5,000 to $7,499 | 234 (2.1%) | 262 (2.5%) |
| $7,500 to $9,999 | 119 (1.1%) | 423 (4.0%) |
| $10,000 to $12,499 | 251 (2.2%) | 200 (1.9%) |
| $12,500 to $14,999 | 274 (2.4%) | 277 (2.6%) |
| $15,000 to $17,499 | 391 (3.4%) | 345 (3.2%) |
| $17,500 to $19,999 | 572 (5.0%) | 520 (4.9%) |
| $20,000 to $22,499 | 297 (2.6%) | 281 (2.6%) |
| $22,500 to $24,999 | 421 (3.7%) | 377 (3.5%) |
| $25,000 to $29,999 | 734 (6.5%) | 1,503 (14.1%) |
| $30,000 to $34,999 | 1,073 (9.4%) | 1,189 (11.1%) |
| $35,000 to $39,999 | 594 (5.2%) | 704 (6.6%) |
| $40,000 to $44,999 | 649 (5.7%) | 686 (6.4%) |
| $45,000 to $49,999 | 995 (8.7%) | 377 (3.5%) |
| $50,000 to $54,999 | 611 (5.4%) | 221 (2.1%) |
| $55,000 to $64,999 | 848 (7.5%) | 654 (6.1%) |
| $65,000 to $74,999 | 523 (4.6%) | 414 (3.9%) |
| $75,000 to $99,999 | 639 (5.6%) | 519 (4.9%) |
| $100,000+ | 1,137 (10.0%) | 692 (6.5%) |
| Total | 11,371 (100.0%) | 10,672 (100.0%) |
Earnings by Sex by Educational Attainment in Gainesville
Average earnings in Gainesville are $45,442 for men and $33,324 for women, a difference of 26.7%. Men with an educational attainment of graduate degree enjoy the highest average annual earnings of $93,420, while those with less than high school education earn the least with $33,906. Women with an educational attainment of graduate degree earn the most with the average annual earnings of $61,696, while those with less than high school education have the smallest earnings of $28,874.
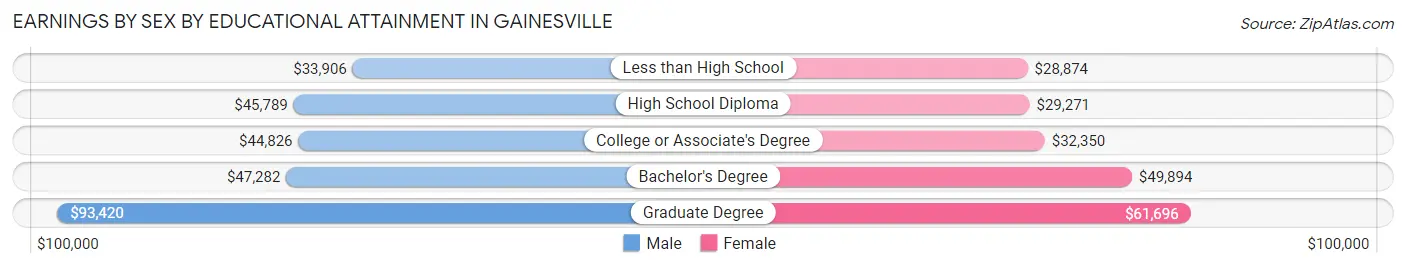
| Educational Attainment | Male Income | Female Income |
| Less than High School | $33,906 | $28,874 |
| High School Diploma | $45,789 | $29,271 |
| College or Associate's Degree | $44,826 | $32,350 |
| Bachelor's Degree | $47,282 | $49,894 |
| Graduate Degree | $93,420 | $61,696 |
| Total | $45,442 | $33,324 |
Family Income in Gainesville
Family Income Brackets in Gainesville
According to the Gainesville family income data, there are 2,173 families falling into the $50,000 to $74,999 income range, which is the most common income bracket and makes up 23.1% of all families. Conversely, the less than $10,000 income bracket is the least frequent group with only 414 families (4.4%) belonging to this category.
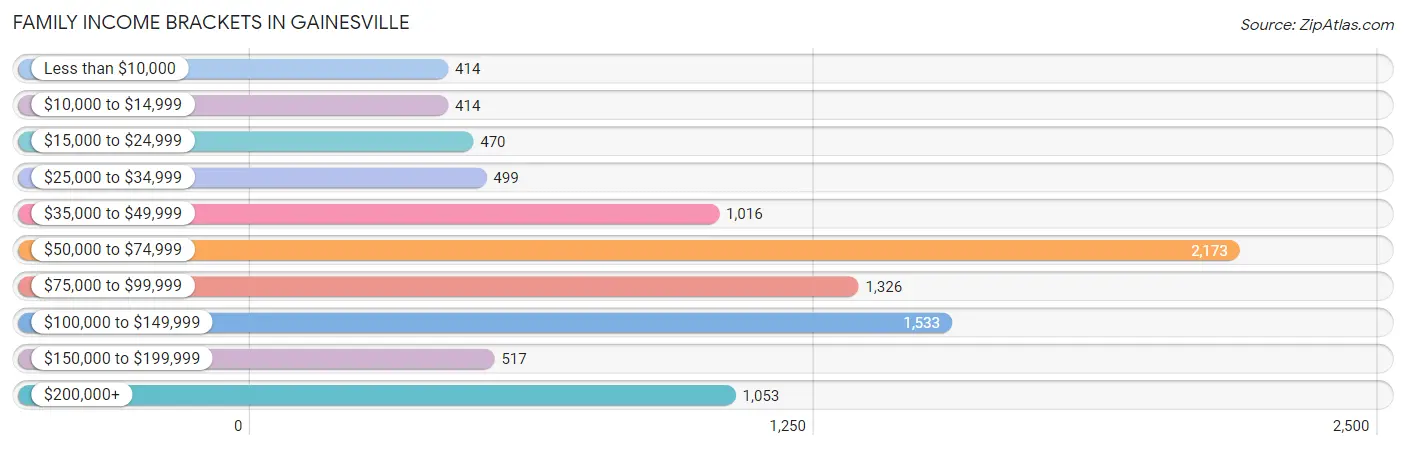
| Income Bracket | # Families | % Families |
| Less than $10,000 | 414 | 4.4% |
| $10,000 to $14,999 | 414 | 4.4% |
| $15,000 to $24,999 | 470 | 5.0% |
| $25,000 to $34,999 | 499 | 5.3% |
| $35,000 to $49,999 | 1,016 | 10.8% |
| $50,000 to $74,999 | 2,173 | 23.1% |
| $75,000 to $99,999 | 1,326 | 14.1% |
| $100,000 to $149,999 | 1,533 | 16.3% |
| $150,000 to $199,999 | 517 | 5.5% |
| $200,000+ | 1,053 | 11.2% |
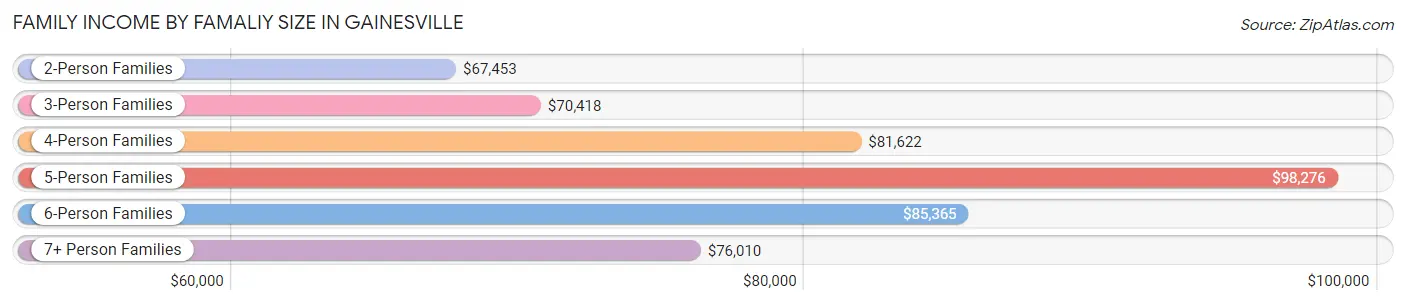
Family Income by Famaliy Size in Gainesville
5-person families (1,118 | 11.9%) account for the highest median family income in Gainesville with $98,276 per family, while 2-person families (3,773 | 40.1%) have the highest median income of $33,726 per family member.
| Income Bracket | # Families | Median Income |
| 2-Person Families | 3,773 (40.1%) | $67,453 |
| 3-Person Families | 1,752 (18.6%) | $70,418 |
| 4-Person Families | 2,011 (21.4%) | $81,622 |
| 5-Person Families | 1,118 (11.9%) | $98,276 |
| 6-Person Families | 451 (4.8%) | $85,365 |
| 7+ Person Families | 301 (3.2%) | $76,010 |
| Total | 9,406 (100.0%) | $71,466 |
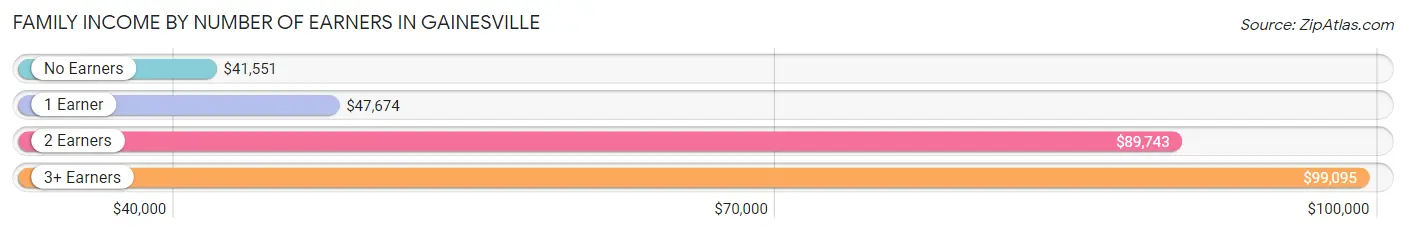
Family Income by Number of Earners in Gainesville
The median family income in Gainesville is $71,466, with families comprising 3+ earners (1,426) having the highest median family income of $99,095, while families with no earners (1,419) have the lowest median family income of $41,551, accounting for 15.2% and 15.1% of families, respectively.
| Number of Earners | # Families | Median Income |
| No Earners | 1,419 (15.1%) | $41,551 |
| 1 Earner | 2,767 (29.4%) | $47,674 |
| 2 Earners | 3,794 (40.3%) | $89,743 |
| 3+ Earners | 1,426 (15.2%) | $99,095 |
| Total | 9,406 (100.0%) | $71,466 |
Household Income in Gainesville
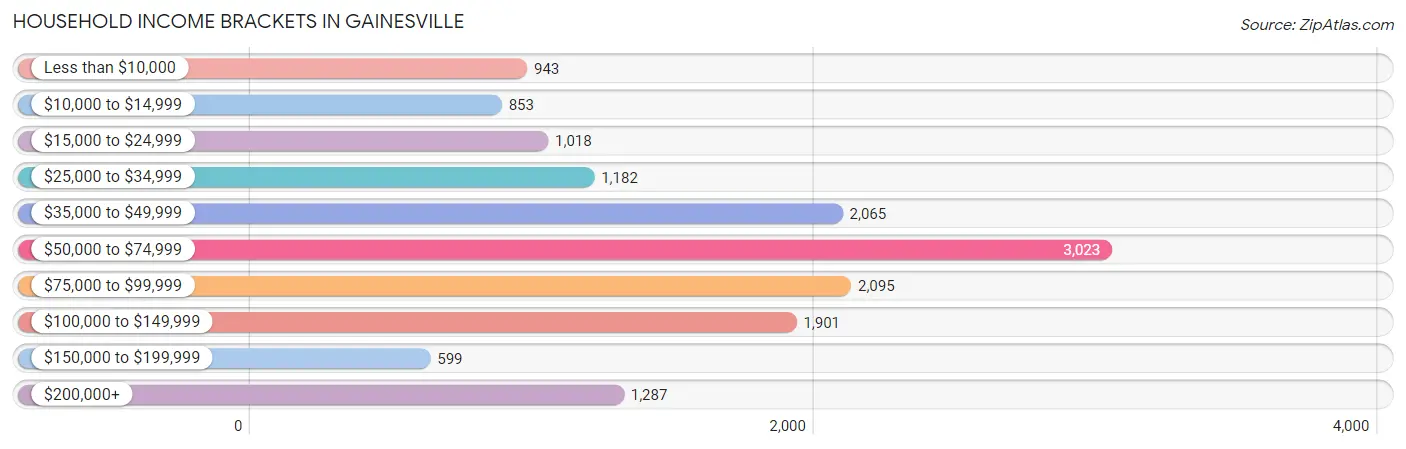
Household Income Brackets in Gainesville
With 3,023 households falling in the category, the $50,000 to $74,999 income range is the most frequent in Gainesville, accounting for 20.2% of all households. In contrast, only 599 households (4.0%) fall into the $150,000 to $199,999 income bracket, making it the least populous group.
| Income Bracket | # Households | % Households |
| Less than $10,000 | 943 | 6.3% |
| $10,000 to $14,999 | 853 | 5.7% |
| $15,000 to $24,999 | 1,018 | 6.8% |
| $25,000 to $34,999 | 1,182 | 7.9% |
| $35,000 to $49,999 | 2,065 | 13.8% |
| $50,000 to $74,999 | 3,023 | 20.2% |
| $75,000 to $99,999 | 2,095 | 14.0% |
| $100,000 to $149,999 | 1,901 | 12.7% |
| $150,000 to $199,999 | 599 | 4.0% |
| $200,000+ | 1,287 | 8.6% |
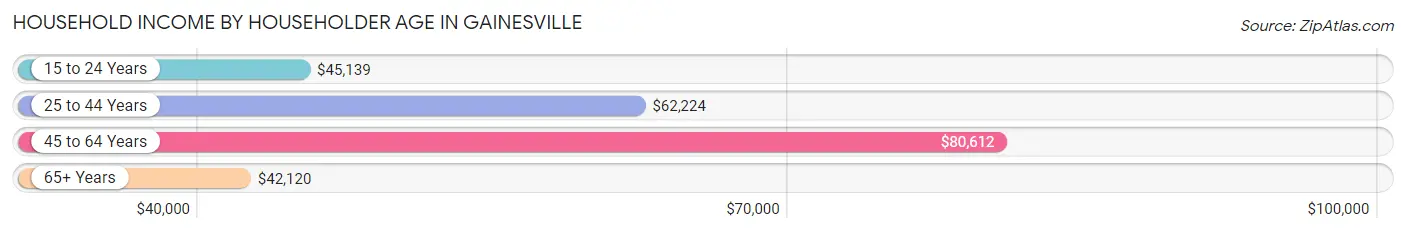
Household Income by Householder Age in Gainesville
The median household income in Gainesville is $64,163, with the highest median household income of $80,612 found in the 45 to 64 years age bracket for the primary householder. A total of 4,553 households (30.4%) fall into this category. Meanwhile, the 65+ years age bracket for the primary householder has the lowest median household income of $42,120, with 3,905 households (26.1%) in this group.
| Income Bracket | # Households | Median Income |
| 15 to 24 Years | 934 (6.2%) | $45,139 |
| 25 to 44 Years | 5,573 (37.2%) | $62,224 |
| 45 to 64 Years | 4,553 (30.4%) | $80,612 |
| 65+ Years | 3,905 (26.1%) | $42,120 |
| Total | 14,965 (100.0%) | $64,163 |
Poverty in Gainesville
Income Below Poverty by Sex and Age in Gainesville
With 15.5% poverty level for males and 18.3% for females among the residents of Gainesville, under 5 year old males and 5 year old females are the most vulnerable to poverty, with 470 males (30.0%) and 98 females (49.0%) in their respective age groups living below the poverty level.
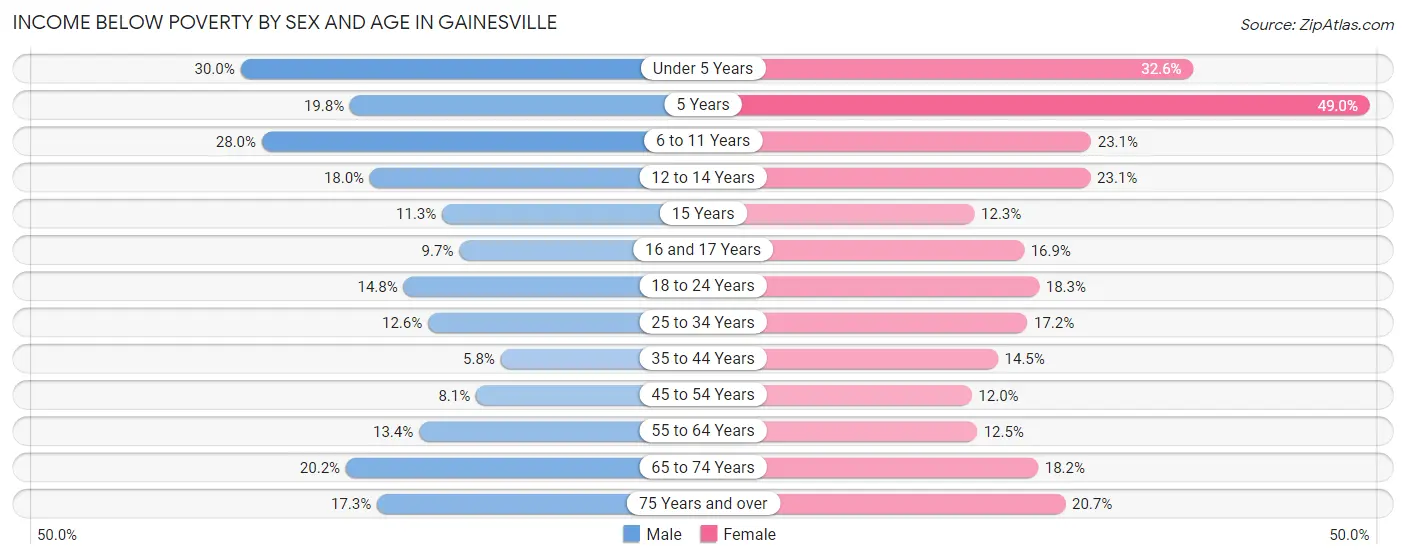
| Age Bracket | Male | Female |
| Under 5 Years | 470 (30.0%) | 479 (32.6%) |
| 5 Years | 39 (19.8%) | 98 (49.0%) |
| 6 to 11 Years | 592 (28.0%) | 400 (23.1%) |
| 12 to 14 Years | 147 (17.9%) | 177 (23.1%) |
| 15 Years | 37 (11.3%) | 28 (12.3%) |
| 16 and 17 Years | 68 (9.7%) | 157 (16.9%) |
| 18 to 24 Years | 336 (14.8%) | 385 (18.3%) |
| 25 to 34 Years | 425 (12.6%) | 554 (17.2%) |
| 35 to 44 Years | 135 (5.8%) | 396 (14.5%) |
| 45 to 54 Years | 174 (8.1%) | 303 (12.0%) |
| 55 to 64 Years | 257 (13.4%) | 229 (12.5%) |
| 65 to 74 Years | 276 (20.2%) | 415 (18.2%) |
| 75 Years and over | 147 (17.3%) | 286 (20.7%) |
| Total | 3,103 (15.5%) | 3,907 (18.3%) |
Income Above Poverty by Sex and Age in Gainesville
According to the poverty statistics in Gainesville, males aged 35 to 44 years and females aged 45 to 54 years are the age groups that are most secure financially, with 94.2% of males and 88.0% of females in these age groups living above the poverty line.
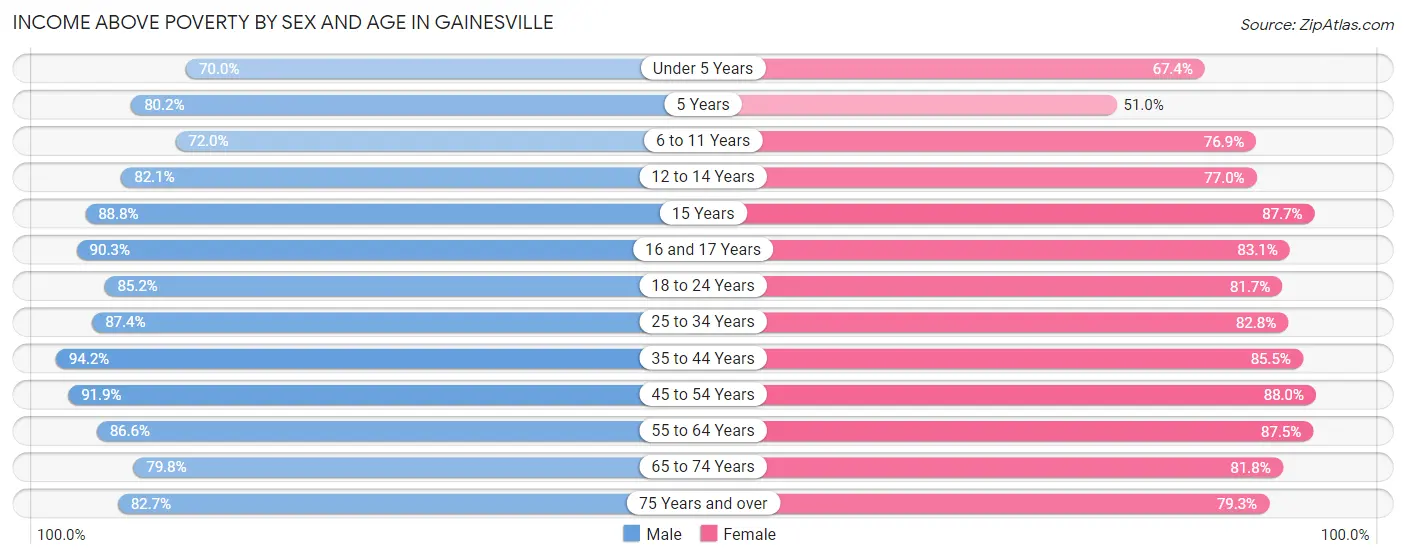
| Age Bracket | Male | Female |
| Under 5 Years | 1,099 (70.0%) | 989 (67.4%) |
| 5 Years | 158 (80.2%) | 102 (51.0%) |
| 6 to 11 Years | 1,524 (72.0%) | 1,331 (76.9%) |
| 12 to 14 Years | 672 (82.1%) | 591 (76.9%) |
| 15 Years | 292 (88.7%) | 200 (87.7%) |
| 16 and 17 Years | 636 (90.3%) | 773 (83.1%) |
| 18 to 24 Years | 1,930 (85.2%) | 1,721 (81.7%) |
| 25 to 34 Years | 2,960 (87.4%) | 2,669 (82.8%) |
| 35 to 44 Years | 2,186 (94.2%) | 2,343 (85.5%) |
| 45 to 54 Years | 1,974 (91.9%) | 2,216 (88.0%) |
| 55 to 64 Years | 1,663 (86.6%) | 1,600 (87.5%) |
| 65 to 74 Years | 1,092 (79.8%) | 1,866 (81.8%) |
| 75 Years and over | 703 (82.7%) | 1,094 (79.3%) |
| Total | 16,889 (84.5%) | 17,495 (81.7%) |
Income Below Poverty Among Married-Couple Families in Gainesville
The poverty statistics for married-couple families in Gainesville show that 8.0% or 489 of the total 6,113 families live below the poverty line. Families with 3 or 4 children have the highest poverty rate of 13.5%, comprising of 102 families. On the other hand, families with 5 or more children have the lowest poverty rate of 0.0%, which includes 0 families.
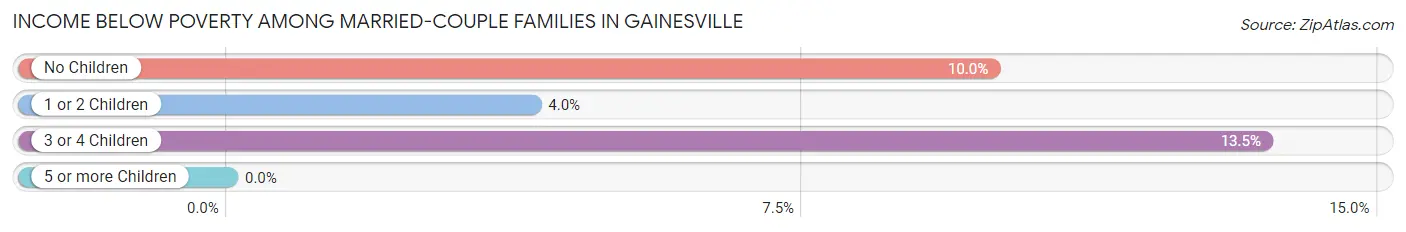
| Children | Above Poverty | Below Poverty |
| No Children | 2,644 (90.0%) | 292 (10.0%) |
| 1 or 2 Children | 2,307 (96.0%) | 95 (4.0%) |
| 3 or 4 Children | 653 (86.5%) | 102 (13.5%) |
| 5 or more Children | 20 (100.0%) | 0 (0.0%) |
| Total | 5,624 (92.0%) | 489 (8.0%) |
Income Below Poverty Among Single-Parent Households in Gainesville
According to the poverty data in Gainesville, 16.5% or 150 single-father households and 32.2% or 767 single-mother households are living below the poverty line. Among single-father households, those with 1 or 2 children have the highest poverty rate, with 93 households (20.3%) experiencing poverty. Likewise, among single-mother households, those with 3 or 4 children have the highest poverty rate, with 337 households (83.0%) falling below the poverty line.
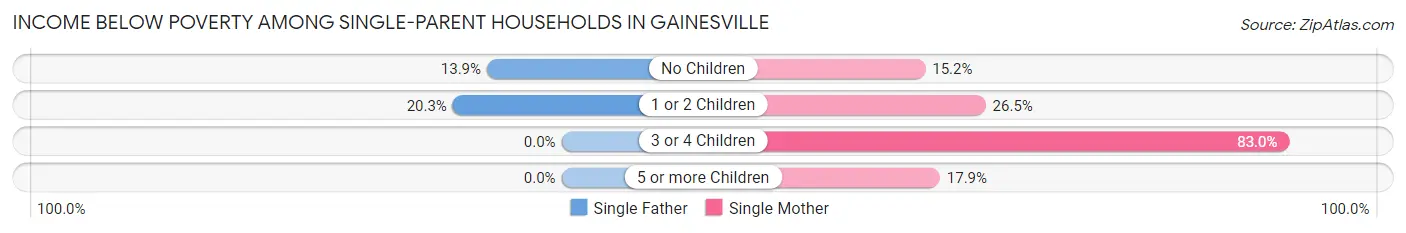
| Children | Single Father | Single Mother |
| No Children | 57 (13.9%) | 114 (15.2%) |
| 1 or 2 Children | 93 (20.3%) | 297 (26.5%) |
| 3 or 4 Children | 0 (0.0%) | 337 (83.0%) |
| 5 or more Children | 0 (0.0%) | 19 (17.9%) |
| Total | 150 (16.5%) | 767 (32.2%) |
Income Below Poverty Among Married-Couple vs Single-Parent Households in Gainesville
The poverty data for Gainesville shows that 489 of the married-couple family households (8.0%) and 917 of the single-parent households (27.9%) are living below the poverty level. Within the married-couple family households, those with 3 or 4 children have the highest poverty rate, with 102 households (13.5%) falling below the poverty line. Among the single-parent households, those with 3 or 4 children have the highest poverty rate, with 337 household (75.7%) living below poverty.
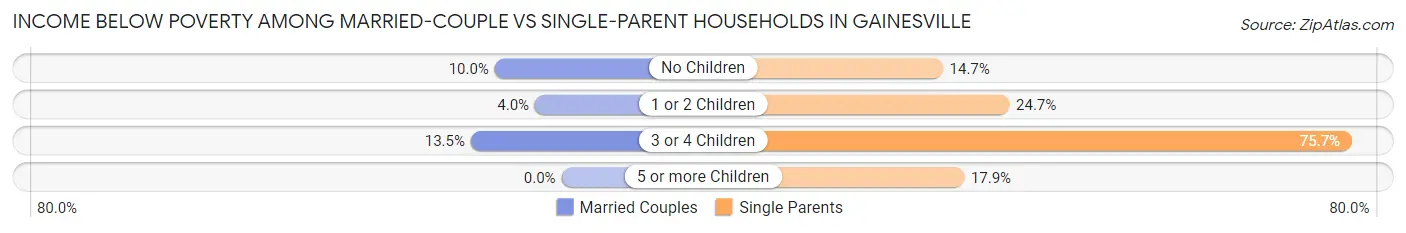
| Children | Married-Couple Families | Single-Parent Households |
| No Children | 292 (10.0%) | 171 (14.7%) |
| 1 or 2 Children | 95 (4.0%) | 390 (24.6%) |
| 3 or 4 Children | 102 (13.5%) | 337 (75.7%) |
| 5 or more Children | 0 (0.0%) | 19 (17.9%) |
| Total | 489 (8.0%) | 917 (27.9%) |
Employment Characteristics in Gainesville
Employment by Class of Employer in Gainesville
Among the 19,655 employed individuals in Gainesville, private company employees (14,710 | 74.8%), not-for-profit organizations (1,353 | 6.9%), and local government employees (1,127 | 5.7%) make up the most common classes of employment.
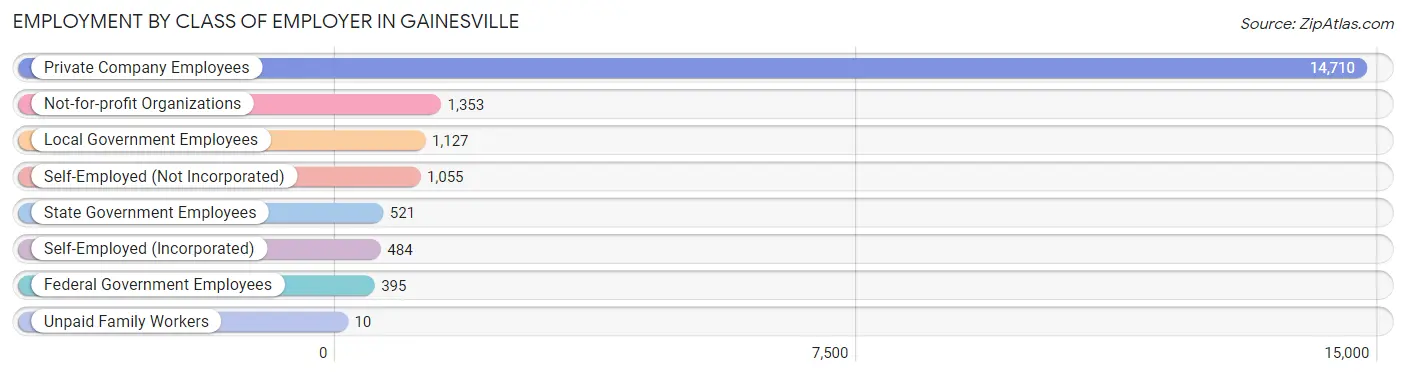
| Employer Class | # Employees | % Employees |
| Private Company Employees | 14,710 | 74.8% |
| Self-Employed (Incorporated) | 484 | 2.5% |
| Self-Employed (Not Incorporated) | 1,055 | 5.4% |
| Not-for-profit Organizations | 1,353 | 6.9% |
| Local Government Employees | 1,127 | 5.7% |
| State Government Employees | 521 | 2.6% |
| Federal Government Employees | 395 | 2.0% |
| Unpaid Family Workers | 10 | 0.1% |
| Total | 19,655 | 100.0% |
Employment Status by Age in Gainesville
According to the labor force statistics for Gainesville, out of the total population over 16 years of age (33,274), 62.8% or 20,896 individuals are in the labor force, with 4.3% or 899 of them unemployed. The age group with the highest labor force participation rate is 25 to 29 years, with 86.9% or 3,523 individuals in the labor force. Within the labor force, the 16 to 19 years age range has the highest percentage of unemployed individuals, with 14.1% or 159 of them being unemployed.
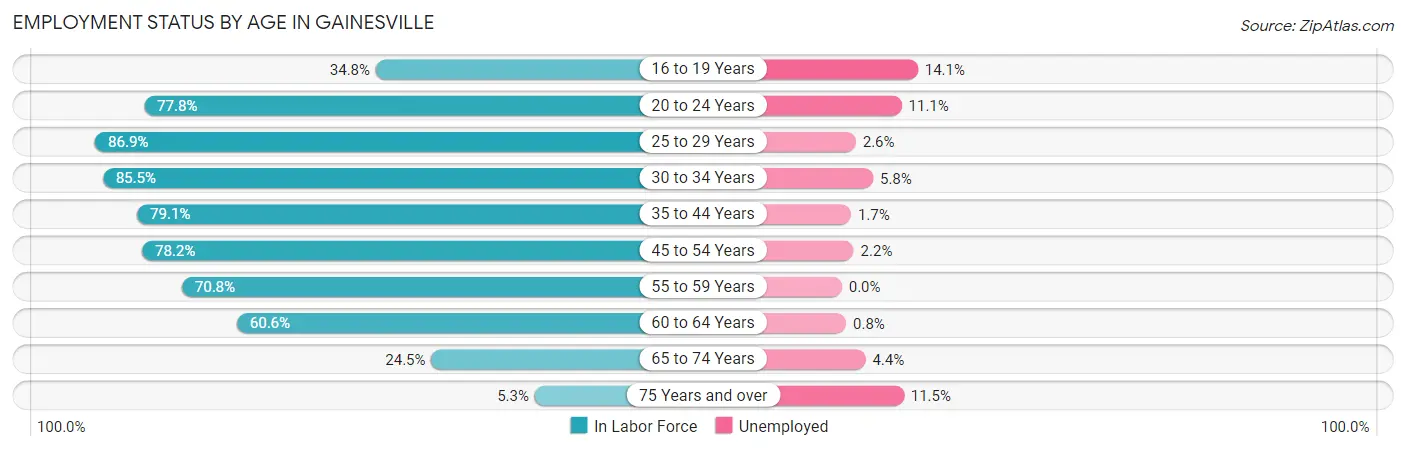
| Age Bracket | In Labor Force | Unemployed |
| 16 to 19 Years | 1,129 (34.8%) | 159 (14.1%) |
| 20 to 24 Years | 2,674 (77.8%) | 297 (11.1%) |
| 25 to 29 Years | 3,523 (86.9%) | 92 (2.6%) |
| 30 to 34 Years | 2,255 (85.5%) | 131 (5.8%) |
| 35 to 44 Years | 4,049 (79.1%) | 69 (1.7%) |
| 45 to 54 Years | 3,727 (78.2%) | 82 (2.2%) |
| 55 to 59 Years | 1,402 (70.8%) | 0 (0.0%) |
| 60 to 64 Years | 1,104 (60.6%) | 9 (0.8%) |
| 65 to 74 Years | 918 (24.5%) | 40 (4.4%) |
| 75 Years and over | 131 (5.3%) | 15 (11.5%) |
| Total | 20,896 (62.8%) | 899 (4.3%) |
Employment Status by Educational Attainment in Gainesville
According to labor force statistics for Gainesville, 78.8% of individuals (16,059) out of the total population between 25 and 64 years of age (20,379) are in the labor force, with 2.4% or 385 of them being unemployed. The group with the highest labor force participation rate are those with the educational attainment of bachelor's degree or higher, with 84.0% or 3,768 individuals in the labor force. Within the labor force, individuals with bachelor's degree or higher education have the highest percentage of unemployment, with 3.7% or 139 of them being unemployed.
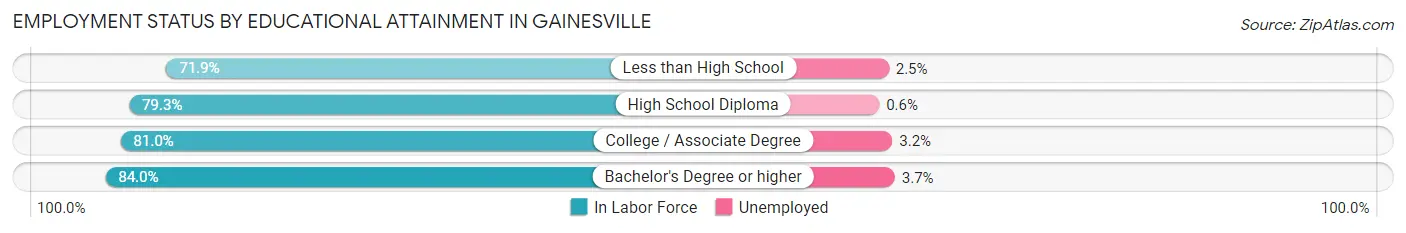
| Educational Attainment | In Labor Force | Unemployed |
| Less than High School | 3,855 (71.9%) | 134 (2.5%) |
| High School Diploma | 4,668 (79.3%) | 35 (0.6%) |
| College / Associate Degree | 3,762 (81.0%) | 149 (3.2%) |
| Bachelor's Degree or higher | 3,768 (84.0%) | 166 (3.7%) |
| Total | 16,059 (78.8%) | 489 (2.4%) |
Employment Occupations by Sex in Gainesville
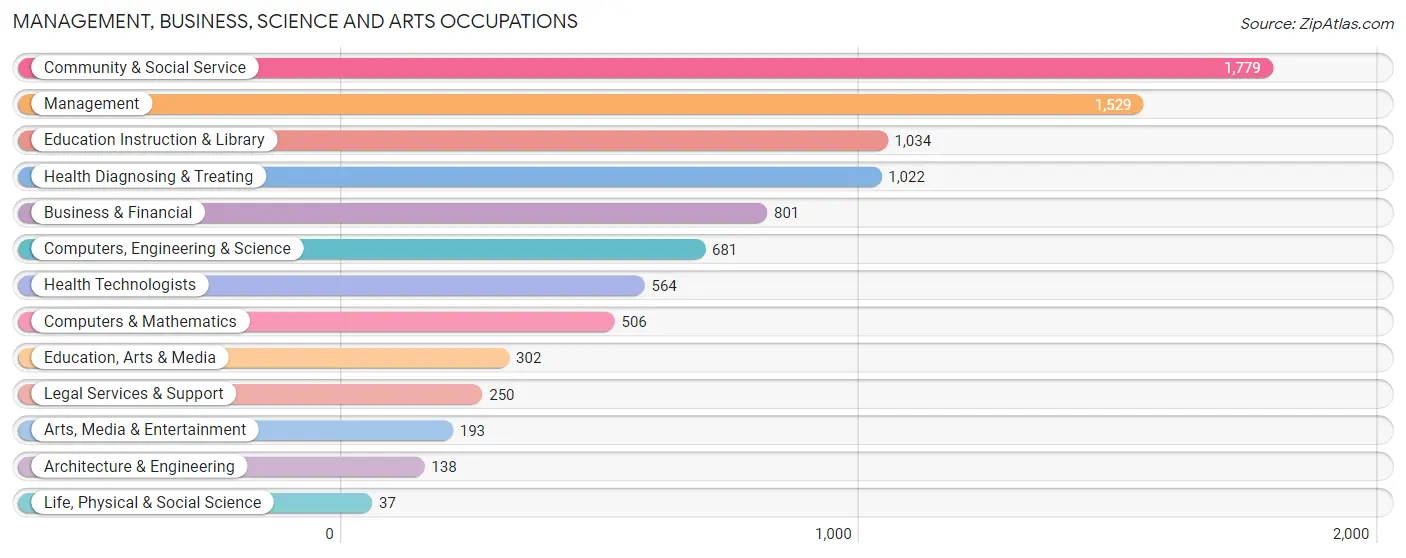
Management, Business, Science and Arts Occupations
The most common Management, Business, Science and Arts occupations in Gainesville are Community & Social Service (1,779 | 8.9%), Management (1,529 | 7.6%), Education Instruction & Library (1,034 | 5.2%), Health Diagnosing & Treating (1,022 | 5.1%), and Business & Financial (801 | 4.0%).
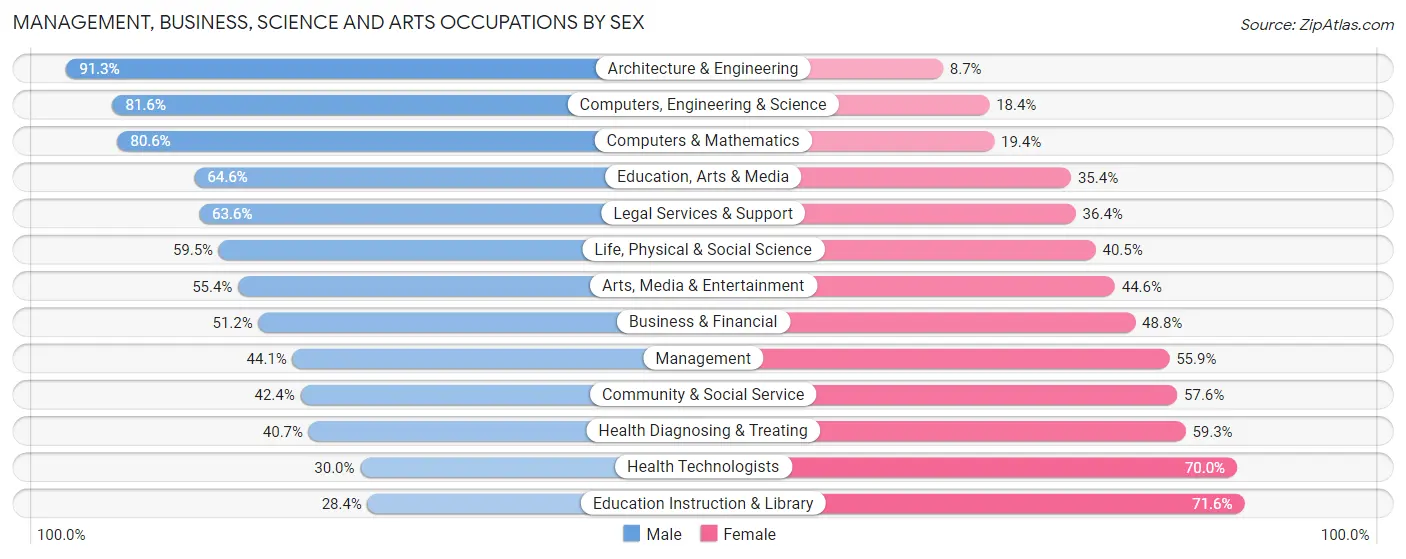
Management, Business, Science and Arts Occupations by Sex
Within the Management, Business, Science and Arts occupations in Gainesville, the most male-oriented occupations are Architecture & Engineering (91.3%), Computers, Engineering & Science (81.6%), and Computers & Mathematics (80.6%), while the most female-oriented occupations are Education Instruction & Library (71.6%), Health Technologists (70.0%), and Health Diagnosing & Treating (59.3%).
| Occupation | Male | Female |
| Management | 674 (44.1%) | 855 (55.9%) |
| Business & Financial | 410 (51.2%) | 391 (48.8%) |
| Computers, Engineering & Science | 556 (81.6%) | 125 (18.4%) |
| Computers & Mathematics | 408 (80.6%) | 98 (19.4%) |
| Architecture & Engineering | 126 (91.3%) | 12 (8.7%) |
| Life, Physical & Social Science | 22 (59.5%) | 15 (40.5%) |
| Community & Social Service | 755 (42.4%) | 1,024 (57.6%) |
| Education, Arts & Media | 195 (64.6%) | 107 (35.4%) |
| Legal Services & Support | 159 (63.6%) | 91 (36.4%) |
| Education Instruction & Library | 294 (28.4%) | 740 (71.6%) |
| Arts, Media & Entertainment | 107 (55.4%) | 86 (44.6%) |
| Health Diagnosing & Treating | 416 (40.7%) | 606 (59.3%) |
| Health Technologists | 169 (30.0%) | 395 (70.0%) |
| Total (Category) | 2,811 (48.4%) | 3,001 (51.6%) |
| Total (Overall) | 10,232 (51.2%) | 9,743 (48.8%) |
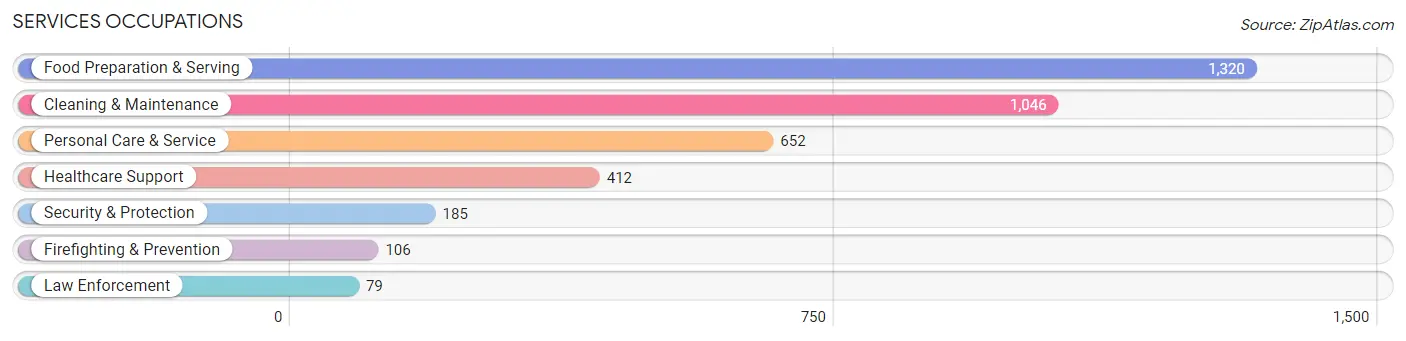
Services Occupations
The most common Services occupations in Gainesville are Food Preparation & Serving (1,320 | 6.6%), Cleaning & Maintenance (1,046 | 5.2%), Personal Care & Service (652 | 3.3%), Healthcare Support (412 | 2.1%), and Security & Protection (185 | 0.9%).
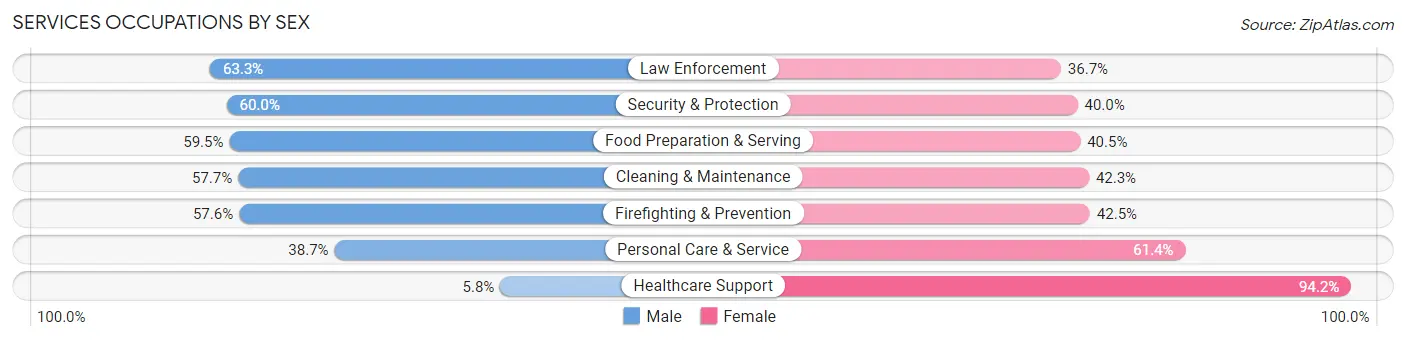
Services Occupations by Sex
Within the Services occupations in Gainesville, the most male-oriented occupations are Law Enforcement (63.3%), Security & Protection (60.0%), and Food Preparation & Serving (59.5%), while the most female-oriented occupations are Healthcare Support (94.2%), Personal Care & Service (61.4%), and Firefighting & Prevention (42.4%).
| Occupation | Male | Female |
| Healthcare Support | 24 (5.8%) | 388 (94.2%) |
| Security & Protection | 111 (60.0%) | 74 (40.0%) |
| Firefighting & Prevention | 61 (57.6%) | 45 (42.4%) |
| Law Enforcement | 50 (63.3%) | 29 (36.7%) |
| Food Preparation & Serving | 785 (59.5%) | 535 (40.5%) |
| Cleaning & Maintenance | 604 (57.7%) | 442 (42.3%) |
| Personal Care & Service | 252 (38.7%) | 400 (61.4%) |
| Total (Category) | 1,776 (49.1%) | 1,839 (50.9%) |
| Total (Overall) | 10,232 (51.2%) | 9,743 (48.8%) |
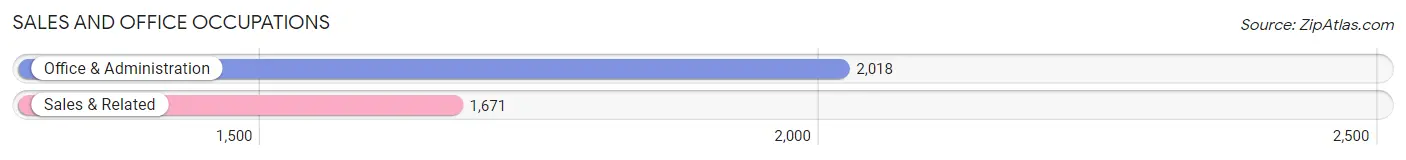
Sales and Office Occupations
The most common Sales and Office occupations in Gainesville are Office & Administration (2,018 | 10.1%), and Sales & Related (1,671 | 8.4%).
Sales and Office Occupations by Sex
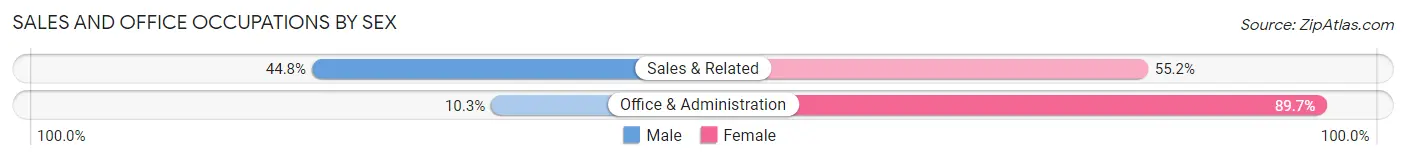
| Occupation | Male | Female |
| Sales & Related | 748 (44.8%) | 923 (55.2%) |
| Office & Administration | 208 (10.3%) | 1,810 (89.7%) |
| Total (Category) | 956 (25.9%) | 2,733 (74.1%) |
| Total (Overall) | 10,232 (51.2%) | 9,743 (48.8%) |
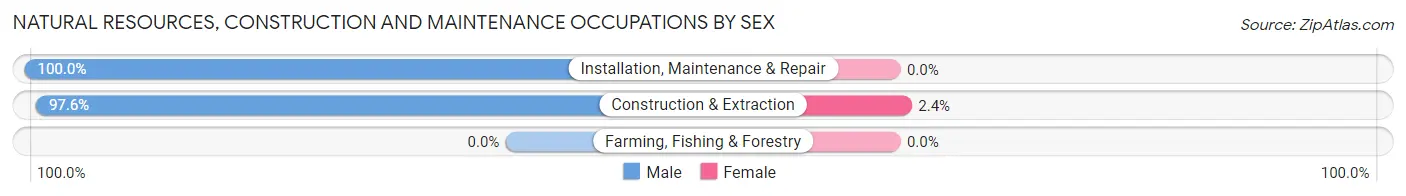
Natural Resources, Construction and Maintenance Occupations
The most common Natural Resources, Construction and Maintenance occupations in Gainesville are Construction & Extraction (1,649 | 8.3%), and Installation, Maintenance & Repair (600 | 3.0%).

Natural Resources, Construction and Maintenance Occupations by Sex
| Occupation | Male | Female |
| Farming, Fishing & Forestry | 0 (0.0%) | 0 (0.0%) |
| Construction & Extraction | 1,610 (97.6%) | 39 (2.4%) |
| Installation, Maintenance & Repair | 600 (100.0%) | 0 (0.0%) |
| Total (Category) | 2,210 (98.3%) | 39 (1.7%) |
| Total (Overall) | 10,232 (51.2%) | 9,743 (48.8%) |
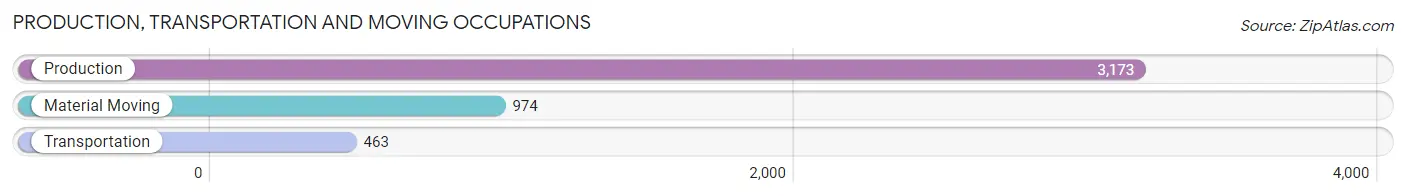
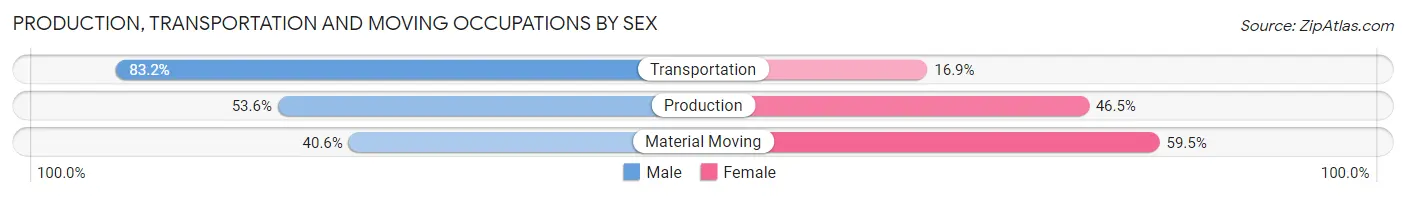
Production, Transportation and Moving Occupations
The most common Production, Transportation and Moving occupations in Gainesville are Production (3,173 | 15.9%), Material Moving (974 | 4.9%), and Transportation (463 | 2.3%).
Production, Transportation and Moving Occupations by Sex
| Occupation | Male | Female |
| Production | 1,699 (53.5%) | 1,474 (46.5%) |
| Transportation | 385 (83.2%) | 78 (16.9%) |
| Material Moving | 395 (40.6%) | 579 (59.5%) |
| Total (Category) | 2,479 (53.8%) | 2,131 (46.2%) |
| Total (Overall) | 10,232 (51.2%) | 9,743 (48.8%) |
Employment Industries by Sex in Gainesville
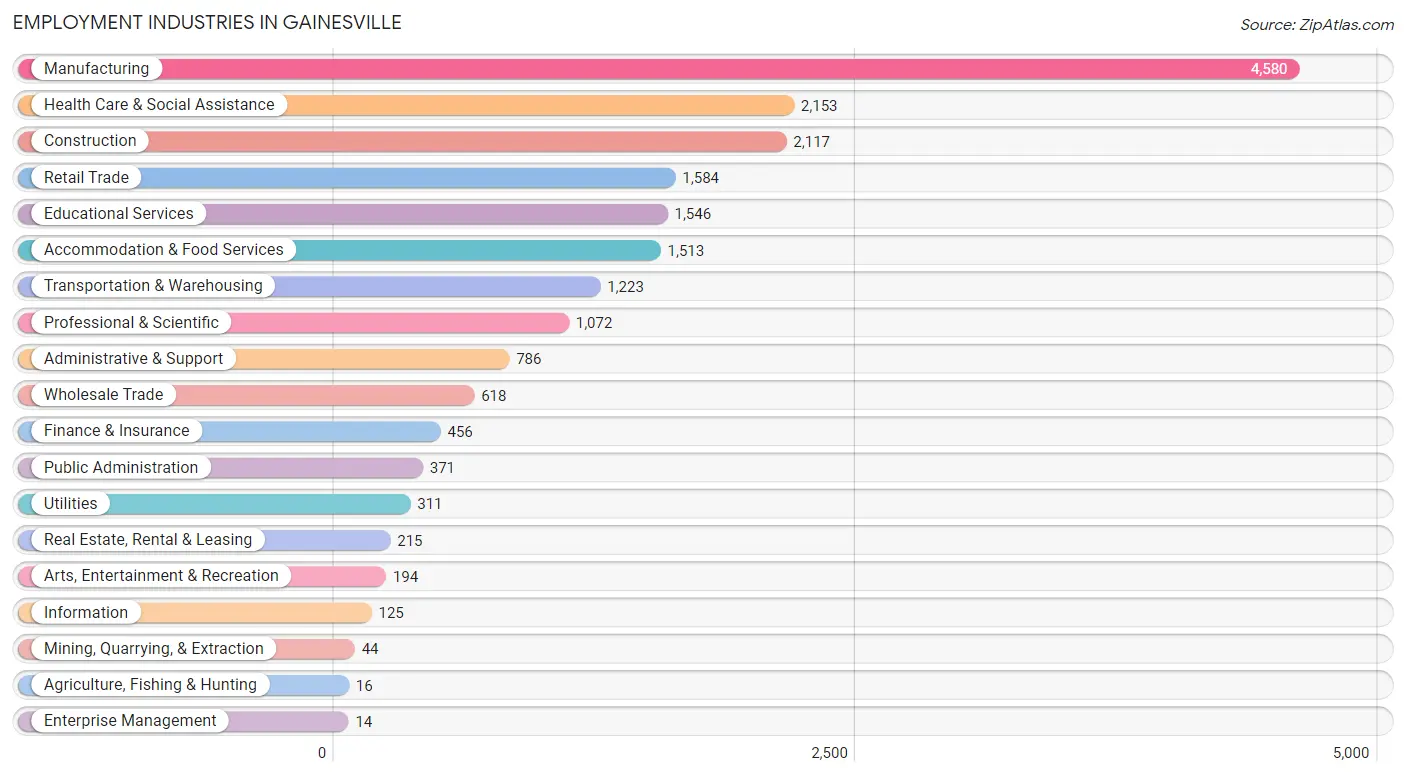
Employment Industries in Gainesville
The major employment industries in Gainesville include Manufacturing (4,580 | 22.9%), Health Care & Social Assistance (2,153 | 10.8%), Construction (2,117 | 10.6%), Retail Trade (1,584 | 7.9%), and Educational Services (1,546 | 7.7%).
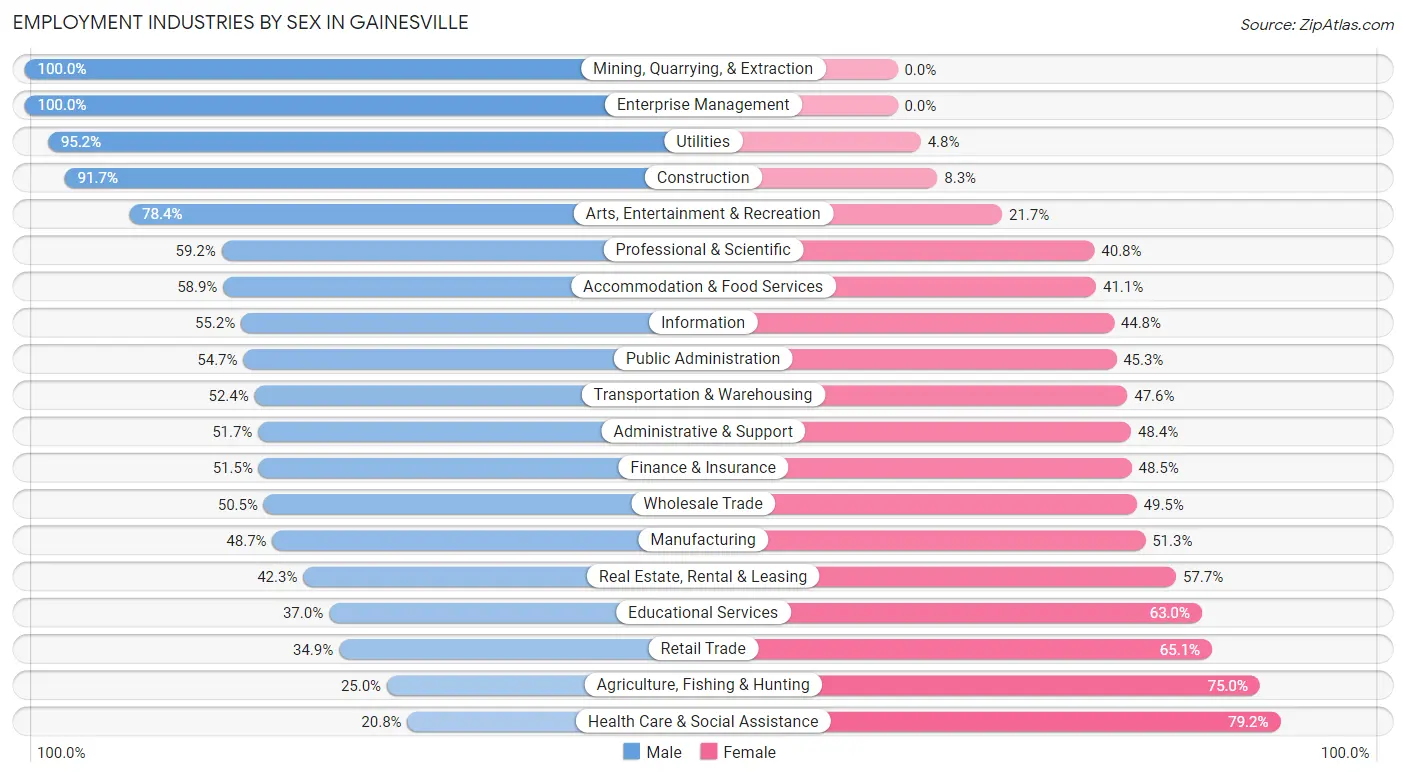
Employment Industries by Sex in Gainesville
The Gainesville industries that see more men than women are Mining, Quarrying, & Extraction (100.0%), Enterprise Management (100.0%), and Utilities (95.2%), whereas the industries that tend to have a higher number of women are Health Care & Social Assistance (79.2%), Agriculture, Fishing & Hunting (75.0%), and Retail Trade (65.1%).
| Industry | Male | Female |
| Agriculture, Fishing & Hunting | 4 (25.0%) | 12 (75.0%) |
| Mining, Quarrying, & Extraction | 44 (100.0%) | 0 (0.0%) |
| Construction | 1,942 (91.7%) | 175 (8.3%) |
| Manufacturing | 2,231 (48.7%) | 2,349 (51.3%) |
| Wholesale Trade | 312 (50.5%) | 306 (49.5%) |
| Retail Trade | 553 (34.9%) | 1,031 (65.1%) |
| Transportation & Warehousing | 641 (52.4%) | 582 (47.6%) |
| Utilities | 296 (95.2%) | 15 (4.8%) |
| Information | 69 (55.2%) | 56 (44.8%) |
| Finance & Insurance | 235 (51.5%) | 221 (48.5%) |
| Real Estate, Rental & Leasing | 91 (42.3%) | 124 (57.7%) |
| Professional & Scientific | 635 (59.2%) | 437 (40.8%) |
| Enterprise Management | 14 (100.0%) | 0 (0.0%) |
| Administrative & Support | 406 (51.6%) | 380 (48.3%) |
| Educational Services | 572 (37.0%) | 974 (63.0%) |
| Health Care & Social Assistance | 447 (20.8%) | 1,706 (79.2%) |
| Arts, Entertainment & Recreation | 152 (78.3%) | 42 (21.6%) |
| Accommodation & Food Services | 891 (58.9%) | 622 (41.1%) |
| Public Administration | 203 (54.7%) | 168 (45.3%) |
| Total | 10,232 (51.2%) | 9,743 (48.8%) |
Education in Gainesville
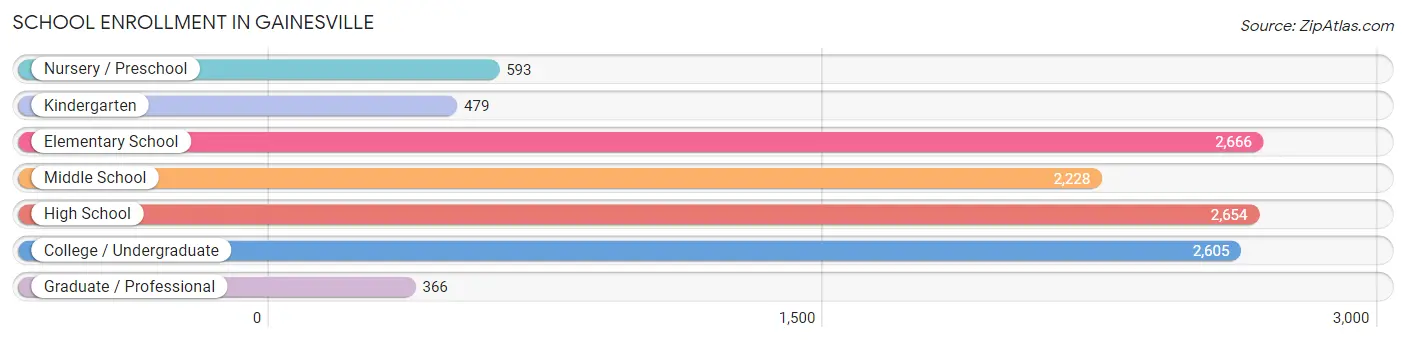
School Enrollment in Gainesville
The most common levels of schooling among the 11,591 students in Gainesville are elementary school (2,666 | 23.0%), high school (2,654 | 22.9%), and college / undergraduate (2,605 | 22.5%).
| School Level | # Students | % Students |
| Nursery / Preschool | 593 | 5.1% |
| Kindergarten | 479 | 4.1% |
| Elementary School | 2,666 | 23.0% |
| Middle School | 2,228 | 19.2% |
| High School | 2,654 | 22.9% |
| College / Undergraduate | 2,605 | 22.5% |
| Graduate / Professional | 366 | 3.2% |
| Total | 11,591 | 100.0% |
School Enrollment by Age by Funding Source in Gainesville
Out of a total of 11,591 students who are enrolled in schools in Gainesville, 1,391 (12.0%) attend a private institution, while the remaining 10,200 (88.0%) are enrolled in public schools. The age group of 25 to 34 year olds has the highest likelihood of being enrolled in private schools, with 320 (55.0% in the age bracket) enrolled. Conversely, the age group of 10 to 14 year olds has the lowest likelihood of being enrolled in a private school, with 2,337 (95.5% in the age bracket) attending a public institution.
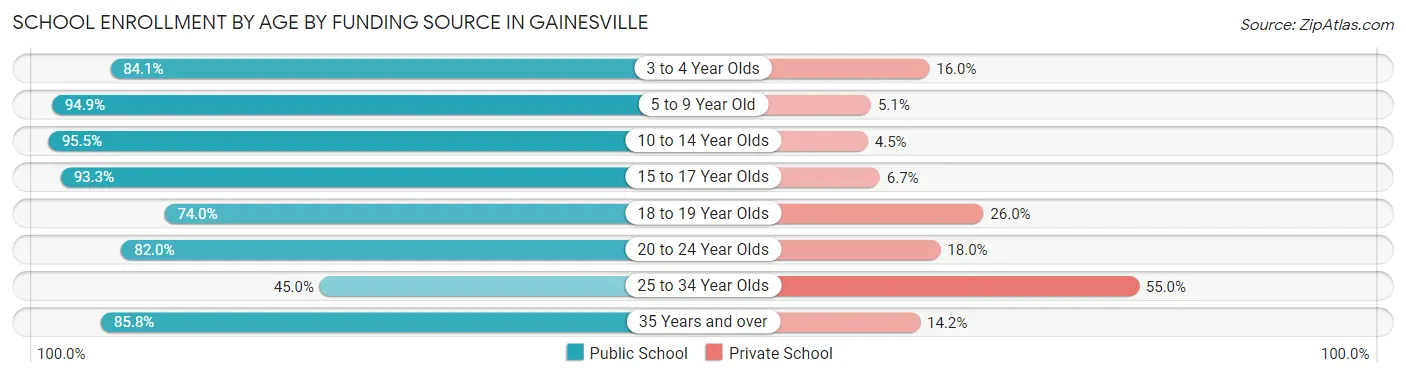
| Age Bracket | Public School | Private School |
| 3 to 4 Year Olds | 411 (84.1%) | 78 (16.0%) |
| 5 to 9 Year Old | 2,989 (94.9%) | 160 (5.1%) |
| 10 to 14 Year Olds | 2,337 (95.5%) | 110 (4.5%) |
| 15 to 17 Year Olds | 1,966 (93.3%) | 142 (6.7%) |
| 18 to 19 Year Olds | 844 (74.0%) | 297 (26.0%) |
| 20 to 24 Year Olds | 1,033 (82.0%) | 227 (18.0%) |
| 25 to 34 Year Olds | 262 (45.0%) | 320 (55.0%) |
| 35 Years and over | 356 (85.8%) | 59 (14.2%) |
| Total | 10,200 (88.0%) | 1,391 (12.0%) |
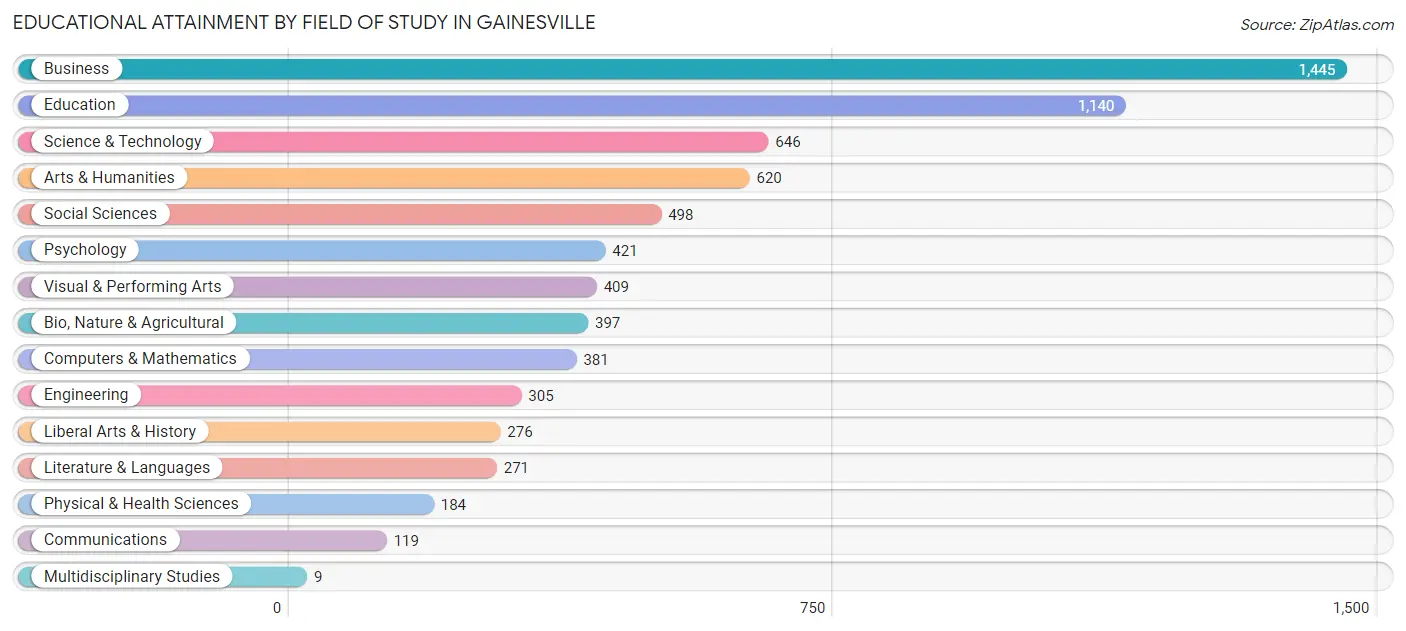
Educational Attainment by Field of Study in Gainesville
Business (1,445 | 20.3%), education (1,140 | 16.0%), science & technology (646 | 9.1%), arts & humanities (620 | 8.7%), and social sciences (498 | 7.0%) are the most common fields of study among 7,121 individuals in Gainesville who have obtained a bachelor's degree or higher.
| Field of Study | # Graduates | % Graduates |
| Computers & Mathematics | 381 | 5.3% |
| Bio, Nature & Agricultural | 397 | 5.6% |
| Physical & Health Sciences | 184 | 2.6% |
| Psychology | 421 | 5.9% |
| Social Sciences | 498 | 7.0% |
| Engineering | 305 | 4.3% |
| Multidisciplinary Studies | 9 | 0.1% |
| Science & Technology | 646 | 9.1% |
| Business | 1,445 | 20.3% |
| Education | 1,140 | 16.0% |
| Literature & Languages | 271 | 3.8% |
| Liberal Arts & History | 276 | 3.9% |
| Visual & Performing Arts | 409 | 5.7% |
| Communications | 119 | 1.7% |
| Arts & Humanities | 620 | 8.7% |
| Total | 7,121 | 100.0% |
Transportation & Commute in Gainesville
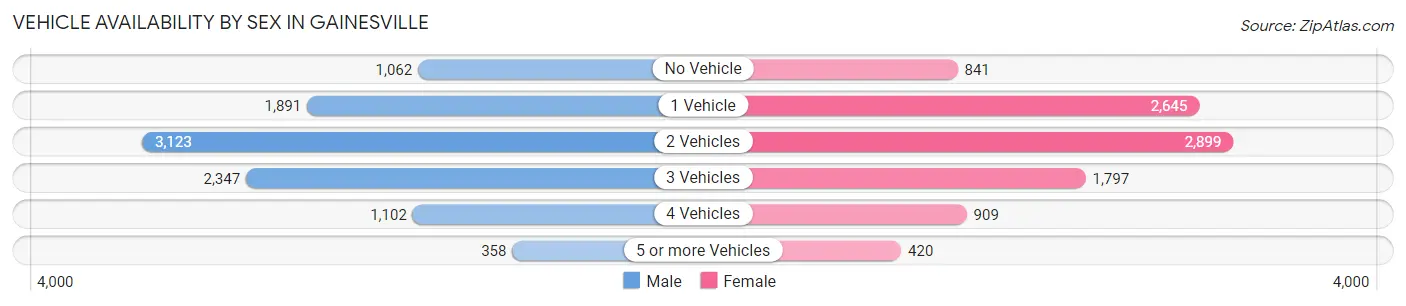
Vehicle Availability by Sex in Gainesville
The most prevalent vehicle ownership categories in Gainesville are males with 2 vehicles (3,123, accounting for 31.6%) and females with 2 vehicles (2,899, making up 32.8%).
| Vehicles Available | Male | Female |
| No Vehicle | 1,062 (10.7%) | 841 (8.8%) |
| 1 Vehicle | 1,891 (19.1%) | 2,645 (27.8%) |
| 2 Vehicles | 3,123 (31.6%) | 2,899 (30.5%) |
| 3 Vehicles | 2,347 (23.7%) | 1,797 (18.9%) |
| 4 Vehicles | 1,102 (11.2%) | 909 (9.6%) |
| 5 or more Vehicles | 358 (3.6%) | 420 (4.4%) |
| Total | 9,883 (100.0%) | 9,511 (100.0%) |
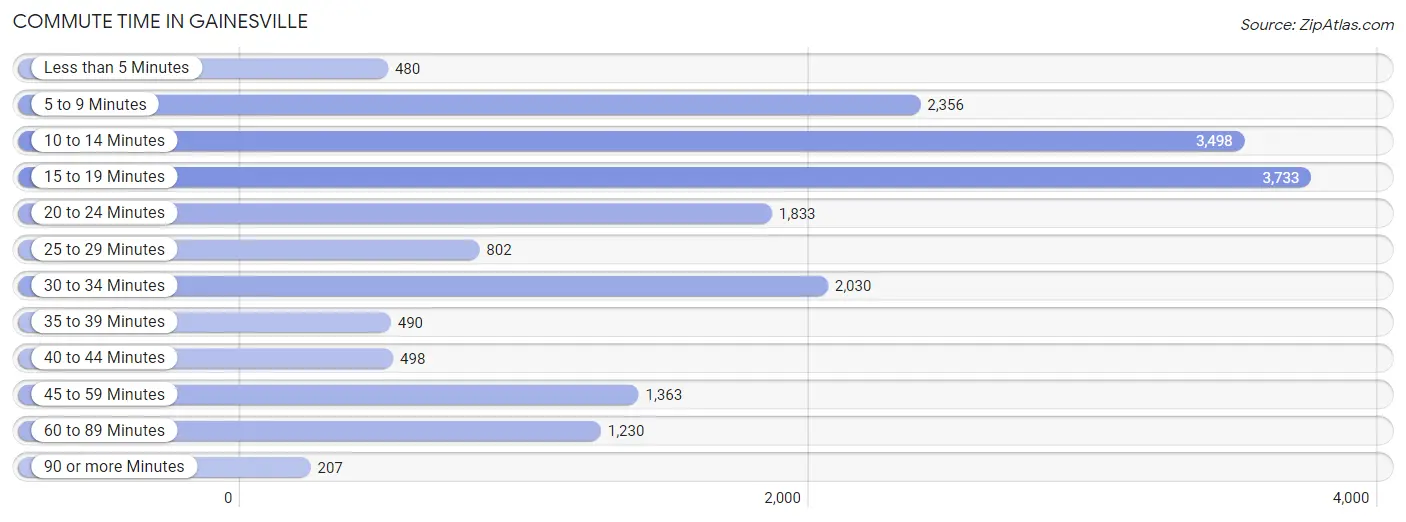
Commute Time in Gainesville
The most frequently occuring commute durations in Gainesville are 15 to 19 minutes (3,733 commuters, 20.2%), 10 to 14 minutes (3,498 commuters, 18.9%), and 5 to 9 minutes (2,356 commuters, 12.7%).
| Commute Time | # Commuters | % Commuters |
| Less than 5 Minutes | 480 | 2.6% |
| 5 to 9 Minutes | 2,356 | 12.7% |
| 10 to 14 Minutes | 3,498 | 18.9% |
| 15 to 19 Minutes | 3,733 | 20.2% |
| 20 to 24 Minutes | 1,833 | 9.9% |
| 25 to 29 Minutes | 802 | 4.3% |
| 30 to 34 Minutes | 2,030 | 11.0% |
| 35 to 39 Minutes | 490 | 2.6% |
| 40 to 44 Minutes | 498 | 2.7% |
| 45 to 59 Minutes | 1,363 | 7.4% |
| 60 to 89 Minutes | 1,230 | 6.6% |
| 90 or more Minutes | 207 | 1.1% |
Commute Time by Sex in Gainesville
The most common commute times in Gainesville are 15 to 19 minutes (1,980 commuters, 21.2%) for males and 15 to 19 minutes (1,753 commuters, 19.1%) for females.
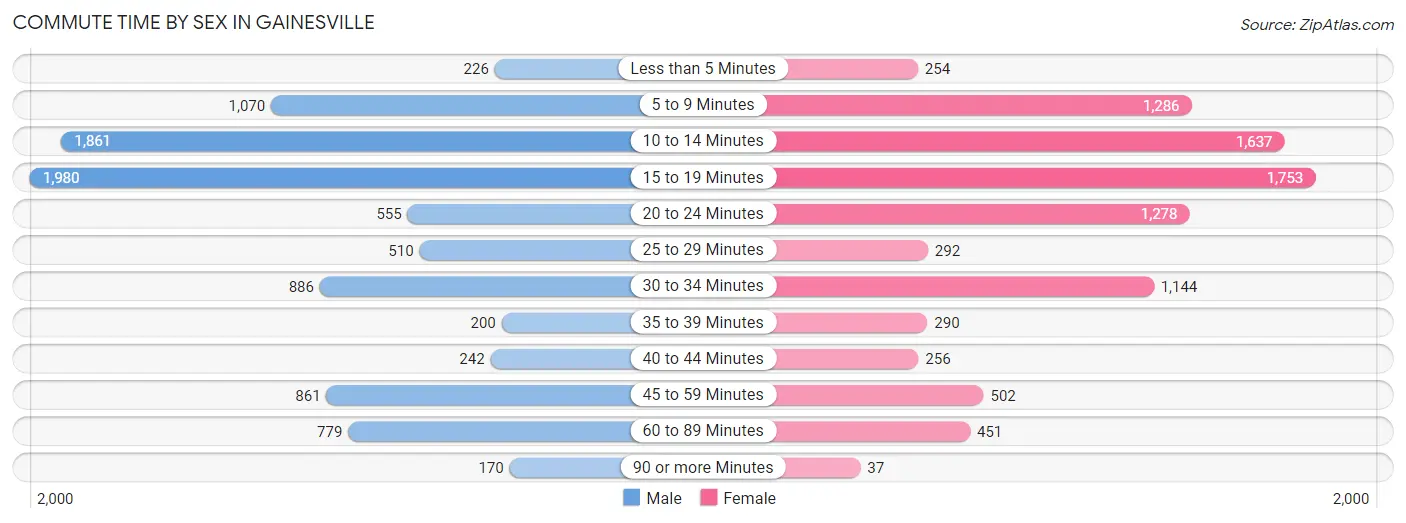
| Commute Time | Male | Female |
| Less than 5 Minutes | 226 (2.4%) | 254 (2.8%) |
| 5 to 9 Minutes | 1,070 (11.5%) | 1,286 (14.0%) |
| 10 to 14 Minutes | 1,861 (19.9%) | 1,637 (17.8%) |
| 15 to 19 Minutes | 1,980 (21.2%) | 1,753 (19.1%) |
| 20 to 24 Minutes | 555 (5.9%) | 1,278 (13.9%) |
| 25 to 29 Minutes | 510 (5.5%) | 292 (3.2%) |
| 30 to 34 Minutes | 886 (9.5%) | 1,144 (12.5%) |
| 35 to 39 Minutes | 200 (2.1%) | 290 (3.2%) |
| 40 to 44 Minutes | 242 (2.6%) | 256 (2.8%) |
| 45 to 59 Minutes | 861 (9.2%) | 502 (5.5%) |
| 60 to 89 Minutes | 779 (8.3%) | 451 (4.9%) |
| 90 or more Minutes | 170 (1.8%) | 37 (0.4%) |
Time of Departure to Work by Sex in Gainesville
The most frequent times of departure to work in Gainesville are 4:00 PM to 11:59 PM (1,469, 15.7%) for males and 7:00 AM to 7:29 AM (1,723, 18.8%) for females.
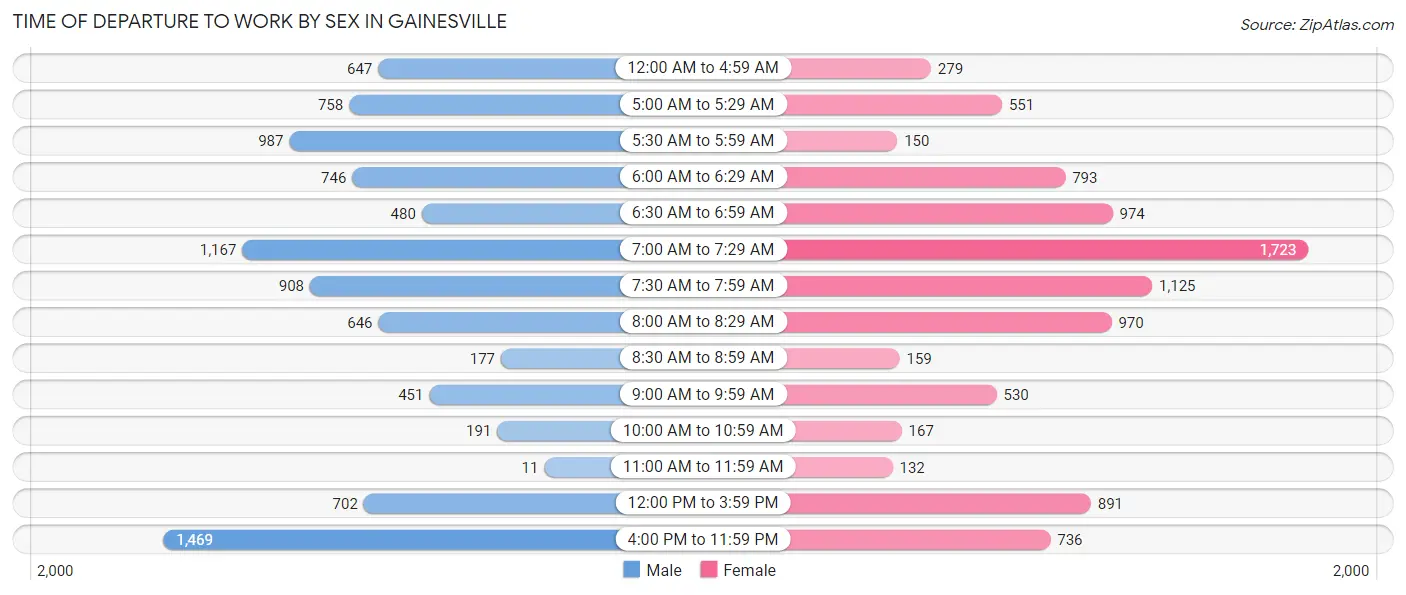
| Time of Departure | Male | Female |
| 12:00 AM to 4:59 AM | 647 (6.9%) | 279 (3.0%) |
| 5:00 AM to 5:29 AM | 758 (8.1%) | 551 (6.0%) |
| 5:30 AM to 5:59 AM | 987 (10.6%) | 150 (1.6%) |
| 6:00 AM to 6:29 AM | 746 (8.0%) | 793 (8.6%) |
| 6:30 AM to 6:59 AM | 480 (5.1%) | 974 (10.6%) |
| 7:00 AM to 7:29 AM | 1,167 (12.5%) | 1,723 (18.8%) |
| 7:30 AM to 7:59 AM | 908 (9.7%) | 1,125 (12.2%) |
| 8:00 AM to 8:29 AM | 646 (6.9%) | 970 (10.6%) |
| 8:30 AM to 8:59 AM | 177 (1.9%) | 159 (1.7%) |
| 9:00 AM to 9:59 AM | 451 (4.8%) | 530 (5.8%) |
| 10:00 AM to 10:59 AM | 191 (2.0%) | 167 (1.8%) |
| 11:00 AM to 11:59 AM | 11 (0.1%) | 132 (1.4%) |
| 12:00 PM to 3:59 PM | 702 (7.5%) | 891 (9.7%) |
| 4:00 PM to 11:59 PM | 1,469 (15.7%) | 736 (8.0%) |
| Total | 9,340 (100.0%) | 9,180 (100.0%) |
Housing Occupancy in Gainesville
Occupancy by Ownership in Gainesville
Of the total 14,965 dwellings in Gainesville, owner-occupied units account for 6,490 (43.4%), while renter-occupied units make up 8,475 (56.6%).
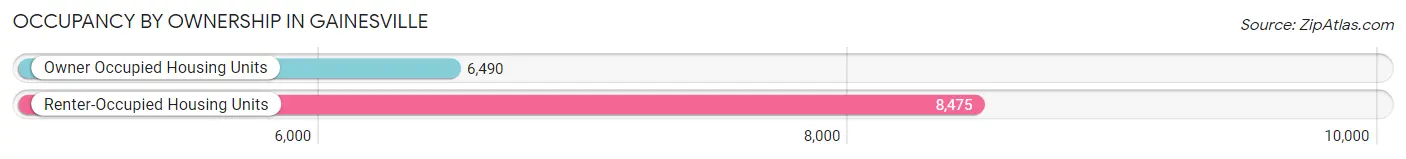
| Occupancy | # Housing Units | % Housing Units |
| Owner Occupied Housing Units | 6,490 | 43.4% |
| Renter-Occupied Housing Units | 8,475 | 56.6% |
| Total Occupied Housing Units | 14,965 | 100.0% |
Occupancy by Household Size in Gainesville
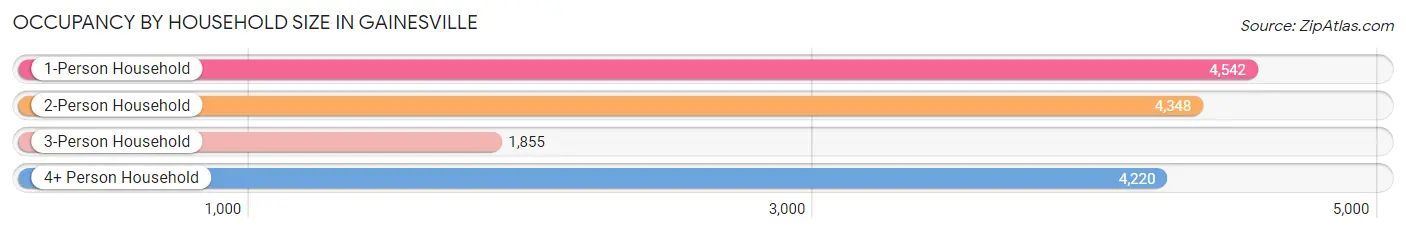
| Household Size | # Housing Units | % Housing Units |
| 1-Person Household | 4,542 | 30.3% |
| 2-Person Household | 4,348 | 29.0% |
| 3-Person Household | 1,855 | 12.4% |
| 4+ Person Household | 4,220 | 28.2% |
| Total Housing Units | 14,965 | 100.0% |
Occupancy by Ownership by Household Size in Gainesville
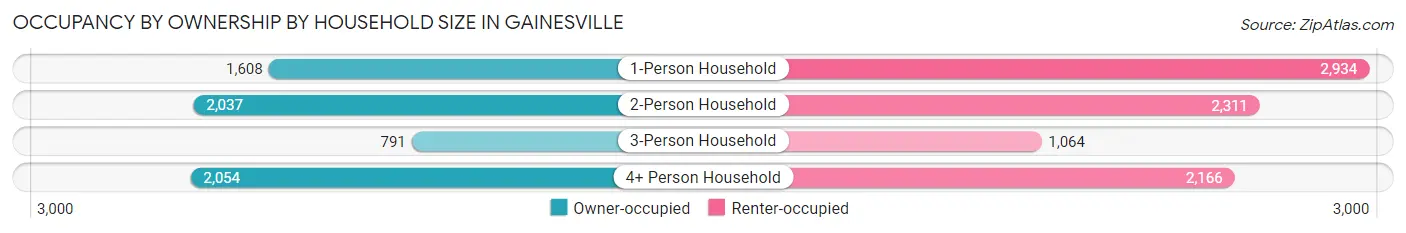
| Household Size | Owner-occupied | Renter-occupied |
| 1-Person Household | 1,608 (35.4%) | 2,934 (64.6%) |
| 2-Person Household | 2,037 (46.9%) | 2,311 (53.1%) |
| 3-Person Household | 791 (42.6%) | 1,064 (57.4%) |
| 4+ Person Household | 2,054 (48.7%) | 2,166 (51.3%) |
| Total Housing Units | 6,490 (43.4%) | 8,475 (56.6%) |
Occupancy by Educational Attainment in Gainesville
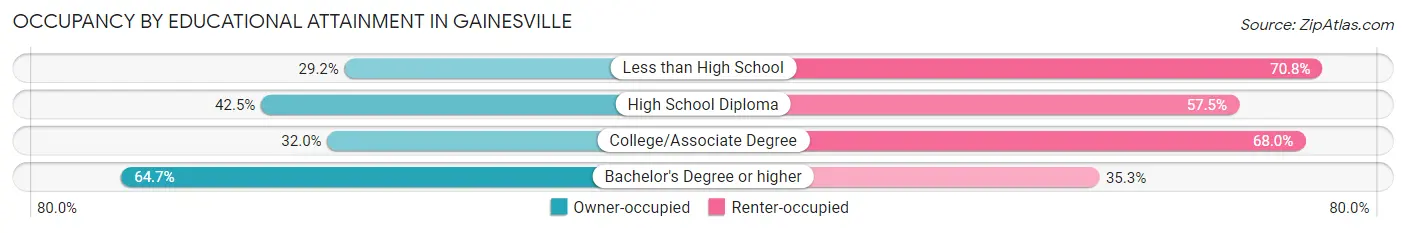
| Household Size | Owner-occupied | Renter-occupied |
| Less than High School | 824 (29.2%) | 1,994 (70.8%) |
| High School Diploma | 1,627 (42.5%) | 2,203 (57.5%) |
| College/Associate Degree | 1,309 (32.0%) | 2,786 (68.0%) |
| Bachelor's Degree or higher | 2,730 (64.7%) | 1,492 (35.3%) |
Occupancy by Age of Householder in Gainesville
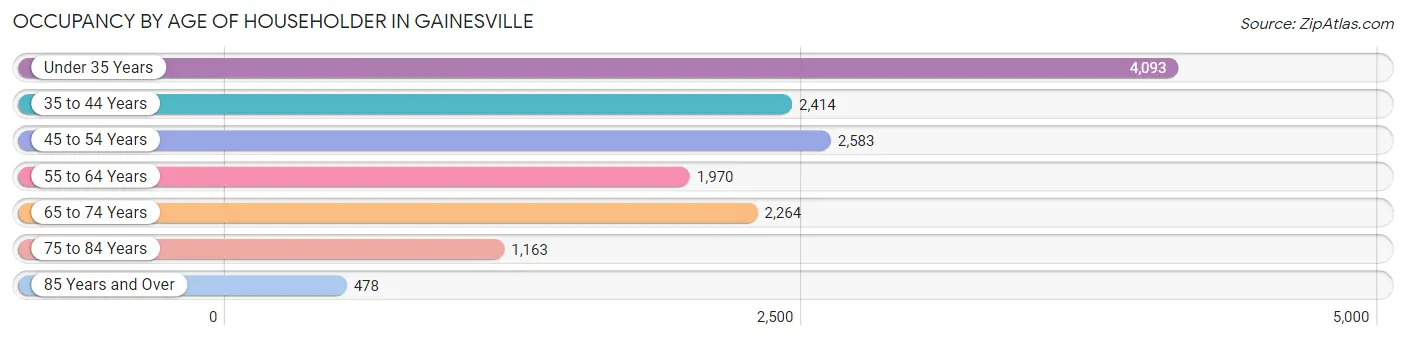
| Age Bracket | # Households | % Households |
| Under 35 Years | 4,093 | 27.4% |
| 35 to 44 Years | 2,414 | 16.1% |
| 45 to 54 Years | 2,583 | 17.3% |
| 55 to 64 Years | 1,970 | 13.2% |
| 65 to 74 Years | 2,264 | 15.1% |
| 75 to 84 Years | 1,163 | 7.8% |
| 85 Years and Over | 478 | 3.2% |
| Total | 14,965 | 100.0% |
Housing Finances in Gainesville
Median Income by Occupancy in Gainesville
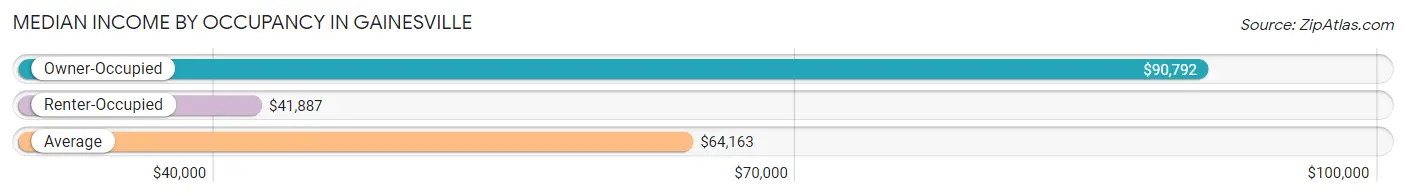
| Occupancy Type | # Households | Median Income |
| Owner-Occupied | 6,490 (43.4%) | $90,792 |
| Renter-Occupied | 8,475 (56.6%) | $41,887 |
| Average | 14,965 (100.0%) | $64,163 |
Occupancy by Householder Income Bracket in Gainesville
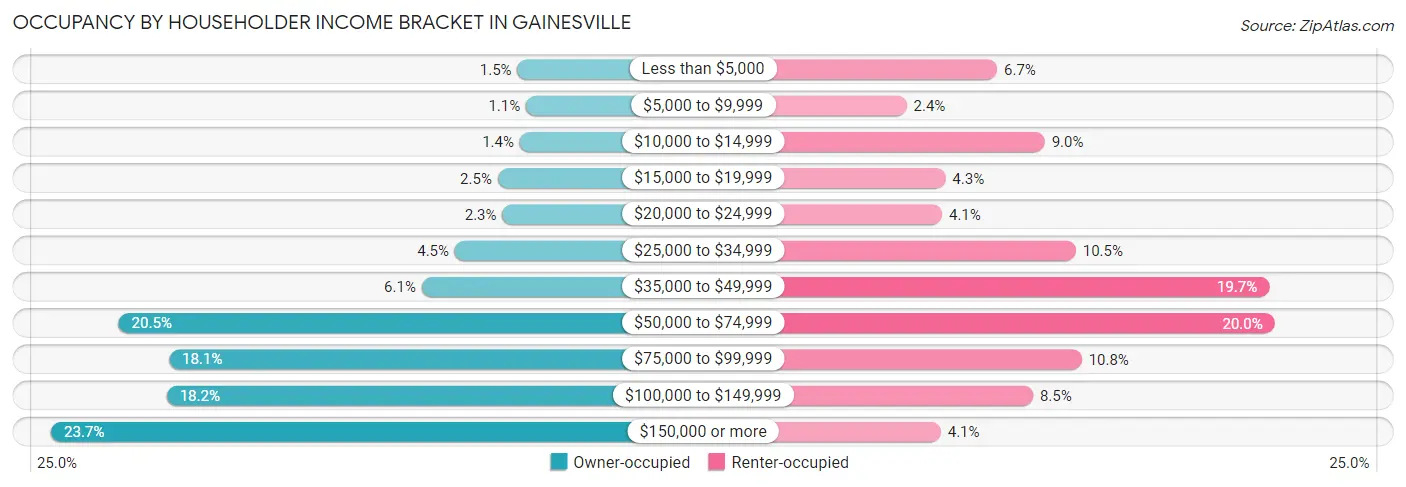
| Income Bracket | Owner-occupied | Renter-occupied |
| Less than $5,000 | 99 (1.5%) | 571 (6.7%) |
| $5,000 to $9,999 | 73 (1.1%) | 206 (2.4%) |
| $10,000 to $14,999 | 92 (1.4%) | 764 (9.0%) |
| $15,000 to $19,999 | 160 (2.5%) | 363 (4.3%) |
| $20,000 to $24,999 | 146 (2.2%) | 349 (4.1%) |
| $25,000 to $34,999 | 293 (4.5%) | 889 (10.5%) |
| $35,000 to $49,999 | 395 (6.1%) | 1,669 (19.7%) |
| $50,000 to $74,999 | 1,332 (20.5%) | 1,691 (20.0%) |
| $75,000 to $99,999 | 1,176 (18.1%) | 913 (10.8%) |
| $100,000 to $149,999 | 1,183 (18.2%) | 716 (8.5%) |
| $150,000 or more | 1,541 (23.7%) | 344 (4.1%) |
| Total | 6,490 (100.0%) | 8,475 (100.0%) |
Monthly Housing Cost Tiers in Gainesville
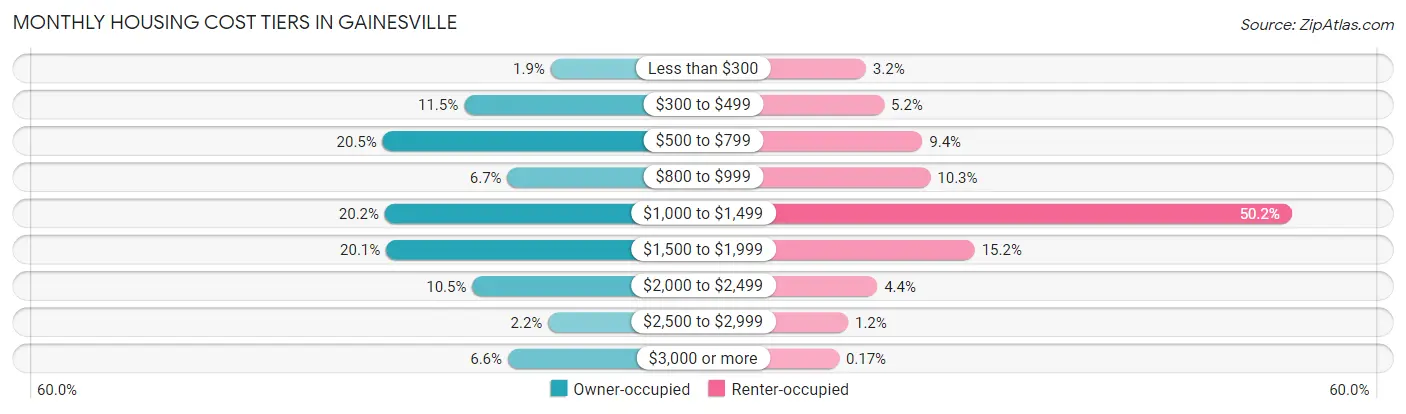
| Monthly Cost | Owner-occupied | Renter-occupied |
| Less than $300 | 122 (1.9%) | 267 (3.2%) |
| $300 to $499 | 743 (11.5%) | 437 (5.2%) |
| $500 to $799 | 1,327 (20.4%) | 795 (9.4%) |
| $800 to $999 | 432 (6.7%) | 870 (10.3%) |
| $1,000 to $1,499 | 1,311 (20.2%) | 4,253 (50.2%) |
| $1,500 to $1,999 | 1,302 (20.1%) | 1,286 (15.2%) |
| $2,000 to $2,499 | 684 (10.5%) | 373 (4.4%) |
| $2,500 to $2,999 | 140 (2.2%) | 99 (1.2%) |
| $3,000 or more | 429 (6.6%) | 14 (0.2%) |
| Total | 6,490 (100.0%) | 8,475 (100.0%) |
Physical Housing Characteristics in Gainesville
Housing Structures in Gainesville
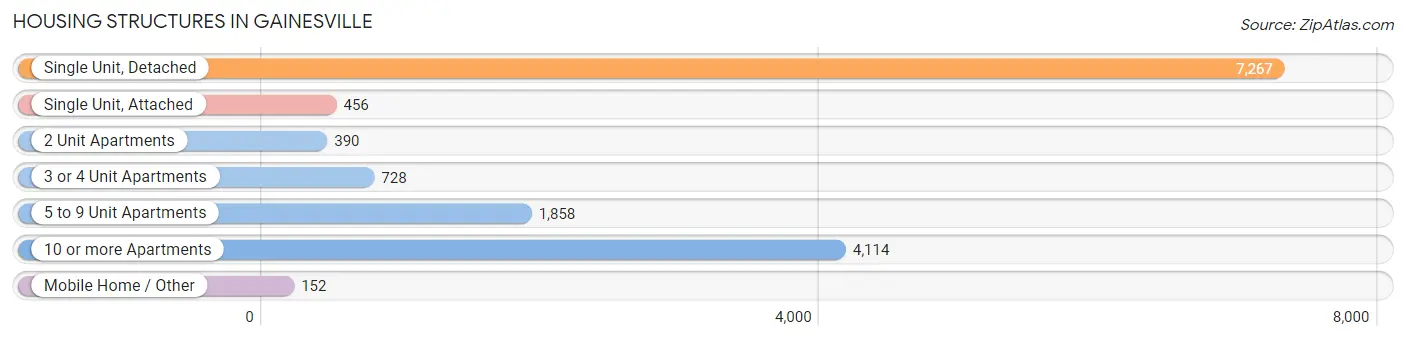
| Structure Type | # Housing Units | % Housing Units |
| Single Unit, Detached | 7,267 | 48.6% |
| Single Unit, Attached | 456 | 3.0% |
| 2 Unit Apartments | 390 | 2.6% |
| 3 or 4 Unit Apartments | 728 | 4.9% |
| 5 to 9 Unit Apartments | 1,858 | 12.4% |
| 10 or more Apartments | 4,114 | 27.5% |
| Mobile Home / Other | 152 | 1.0% |
| Total | 14,965 | 100.0% |
Housing Structures by Occupancy in Gainesville
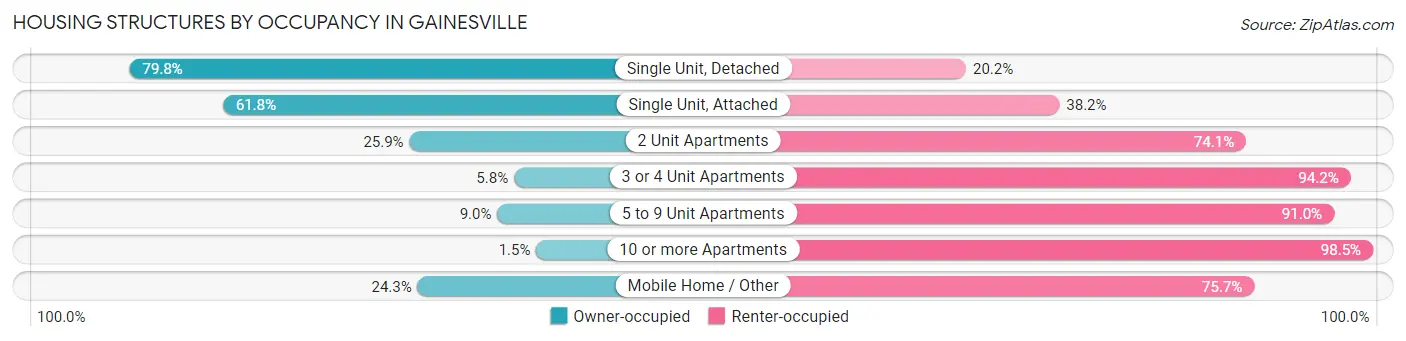
| Structure Type | Owner-occupied | Renter-occupied |
| Single Unit, Detached | 5,800 (79.8%) | 1,467 (20.2%) |
| Single Unit, Attached | 282 (61.8%) | 174 (38.2%) |
| 2 Unit Apartments | 101 (25.9%) | 289 (74.1%) |
| 3 or 4 Unit Apartments | 42 (5.8%) | 686 (94.2%) |
| 5 to 9 Unit Apartments | 167 (9.0%) | 1,691 (91.0%) |
| 10 or more Apartments | 61 (1.5%) | 4,053 (98.5%) |
| Mobile Home / Other | 37 (24.3%) | 115 (75.7%) |
| Total | 6,490 (43.4%) | 8,475 (56.6%) |
Housing Structures by Number of Rooms in Gainesville
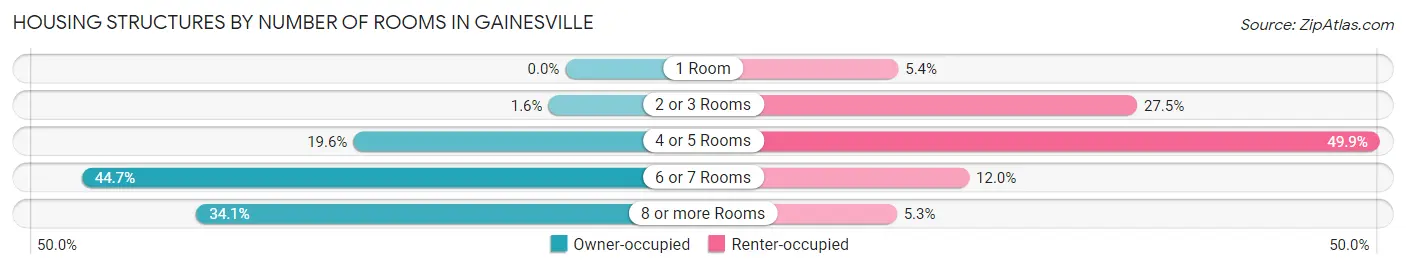
| Number of Rooms | Owner-occupied | Renter-occupied |
| 1 Room | 0 (0.0%) | 458 (5.4%) |
| 2 or 3 Rooms | 101 (1.6%) | 2,329 (27.5%) |
| 4 or 5 Rooms | 1,273 (19.6%) | 4,230 (49.9%) |
| 6 or 7 Rooms | 2,902 (44.7%) | 1,013 (11.9%) |
| 8 or more Rooms | 2,214 (34.1%) | 445 (5.2%) |
| Total | 6,490 (100.0%) | 8,475 (100.0%) |
Housing Structure by Heating Type in Gainesville
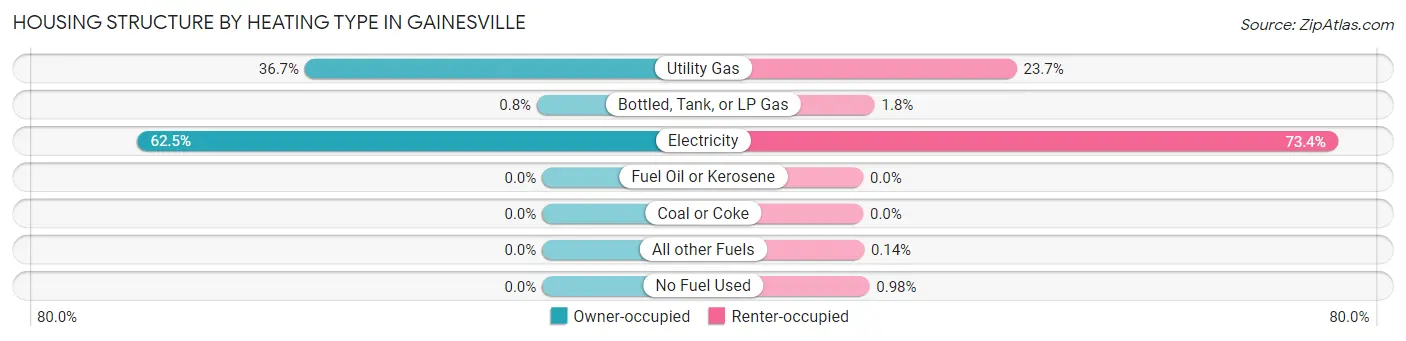
| Heating Type | Owner-occupied | Renter-occupied |
| Utility Gas | 2,380 (36.7%) | 2,011 (23.7%) |
| Bottled, Tank, or LP Gas | 52 (0.8%) | 152 (1.8%) |
| Electricity | 4,058 (62.5%) | 6,217 (73.4%) |
| Fuel Oil or Kerosene | 0 (0.0%) | 0 (0.0%) |
| Coal or Coke | 0 (0.0%) | 0 (0.0%) |
| All other Fuels | 0 (0.0%) | 12 (0.1%) |
| No Fuel Used | 0 (0.0%) | 83 (1.0%) |
| Total | 6,490 (100.0%) | 8,475 (100.0%) |
Household Vehicle Usage in Gainesville
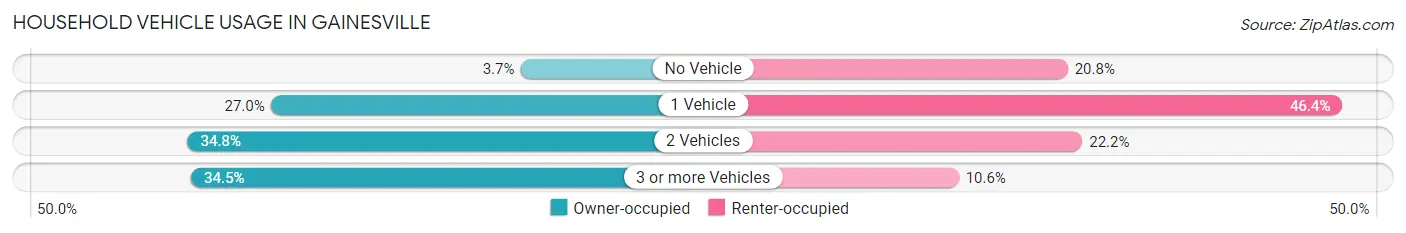
| Vehicles per Household | Owner-occupied | Renter-occupied |
| No Vehicle | 242 (3.7%) | 1,763 (20.8%) |
| 1 Vehicle | 1,755 (27.0%) | 3,934 (46.4%) |
| 2 Vehicles | 2,257 (34.8%) | 1,878 (22.2%) |
| 3 or more Vehicles | 2,236 (34.4%) | 900 (10.6%) |
| Total | 6,490 (100.0%) | 8,475 (100.0%) |
Real Estate & Mortgages in Gainesville
Real Estate and Mortgage Overview in Gainesville
| Characteristic | Without Mortgage | With Mortgage |
| Housing Units | 2,506 | 3,984 |
| Median Property Value | $274,900 | $308,400 |
| Median Household Income | $73,672 | $1,157 |
| Monthly Housing Costs | $564 | $422 |
| Real Estate Taxes | $2,061 | $9 |
Property Value by Mortgage Status in Gainesville
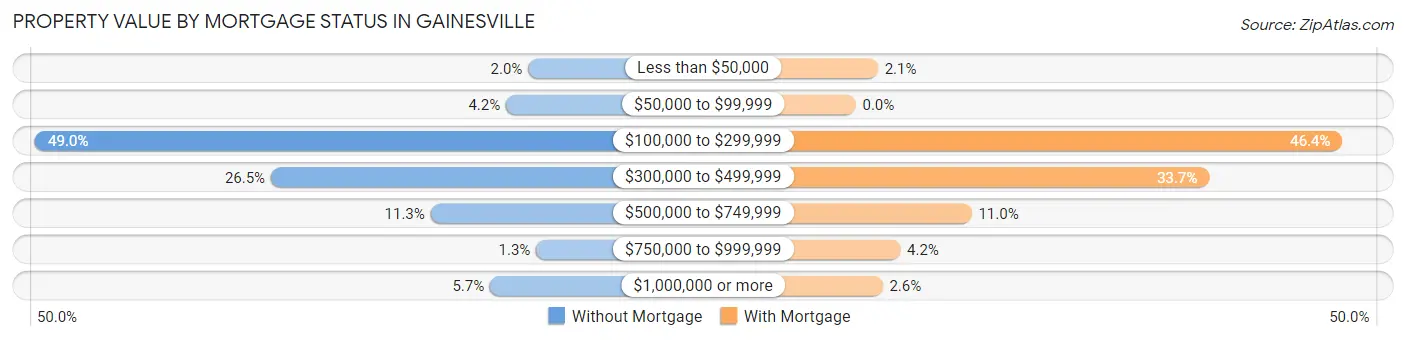
| Property Value | Without Mortgage | With Mortgage |
| Less than $50,000 | 51 (2.0%) | 84 (2.1%) |
| $50,000 to $99,999 | 104 (4.2%) | 0 (0.0%) |
| $100,000 to $299,999 | 1,228 (49.0%) | 1,847 (46.4%) |
| $300,000 to $499,999 | 665 (26.5%) | 1,342 (33.7%) |
| $500,000 to $749,999 | 284 (11.3%) | 440 (11.0%) |
| $750,000 to $999,999 | 32 (1.3%) | 169 (4.2%) |
| $1,000,000 or more | 142 (5.7%) | 102 (2.6%) |
| Total | 2,506 (100.0%) | 3,984 (100.0%) |
Household Income by Mortgage Status in Gainesville
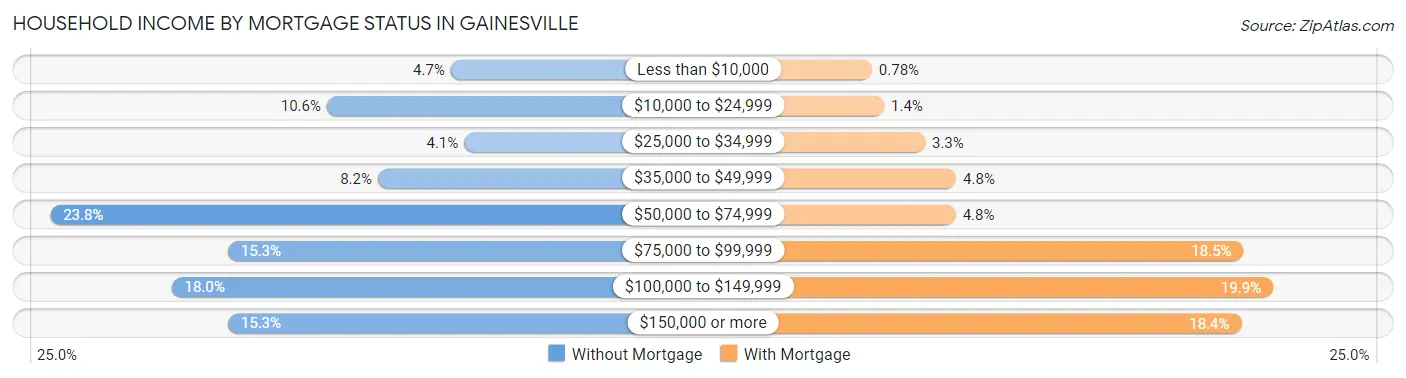
| Household Income | Without Mortgage | With Mortgage |
| Less than $10,000 | 118 (4.7%) | 31 (0.8%) |
| $10,000 to $24,999 | 266 (10.6%) | 54 (1.4%) |
| $25,000 to $34,999 | 102 (4.1%) | 132 (3.3%) |
| $35,000 to $49,999 | 205 (8.2%) | 191 (4.8%) |
| $50,000 to $74,999 | 596 (23.8%) | 190 (4.8%) |
| $75,000 to $99,999 | 384 (15.3%) | 736 (18.5%) |
| $100,000 to $149,999 | 451 (18.0%) | 792 (19.9%) |
| $150,000 or more | 384 (15.3%) | 732 (18.4%) |
| Total | 2,506 (100.0%) | 3,984 (100.0%) |
Property Value to Household Income Ratio in Gainesville
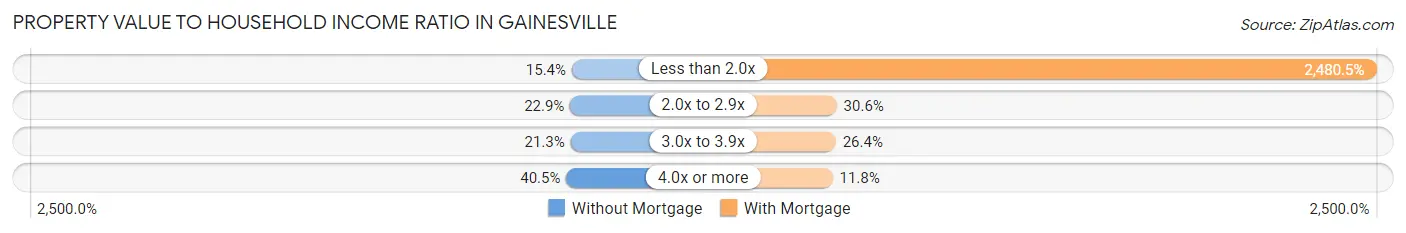
| Value-to-Income Ratio | Without Mortgage | With Mortgage |
| Less than 2.0x | 385 (15.4%) | 98,824 (2,480.5%) |
| 2.0x to 2.9x | 573 (22.9%) | 1,217 (30.5%) |
| 3.0x to 3.9x | 533 (21.3%) | 1,053 (26.4%) |
| 4.0x or more | 1,015 (40.5%) | 471 (11.8%) |
| Total | 2,506 (100.0%) | 3,984 (100.0%) |
Real Estate Taxes by Mortgage Status in Gainesville
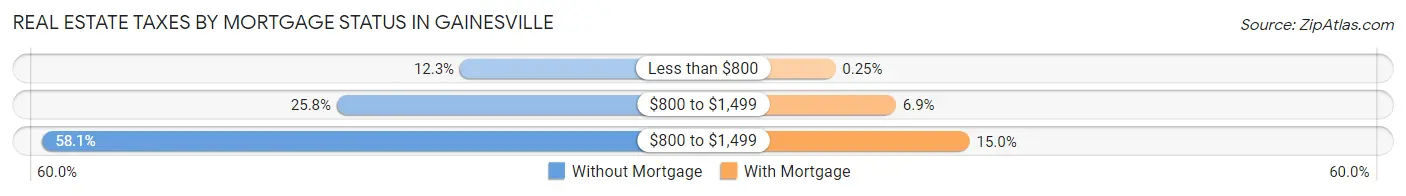
| Property Taxes | Without Mortgage | With Mortgage |
| Less than $800 | 308 (12.3%) | 10 (0.3%) |
| $800 to $1,499 | 646 (25.8%) | 274 (6.9%) |
| $800 to $1,499 | 1,455 (58.1%) | 596 (15.0%) |
| Total | 2,506 (100.0%) | 3,984 (100.0%) |
Health & Disability in Gainesville
Health Insurance Coverage by Age in Gainesville
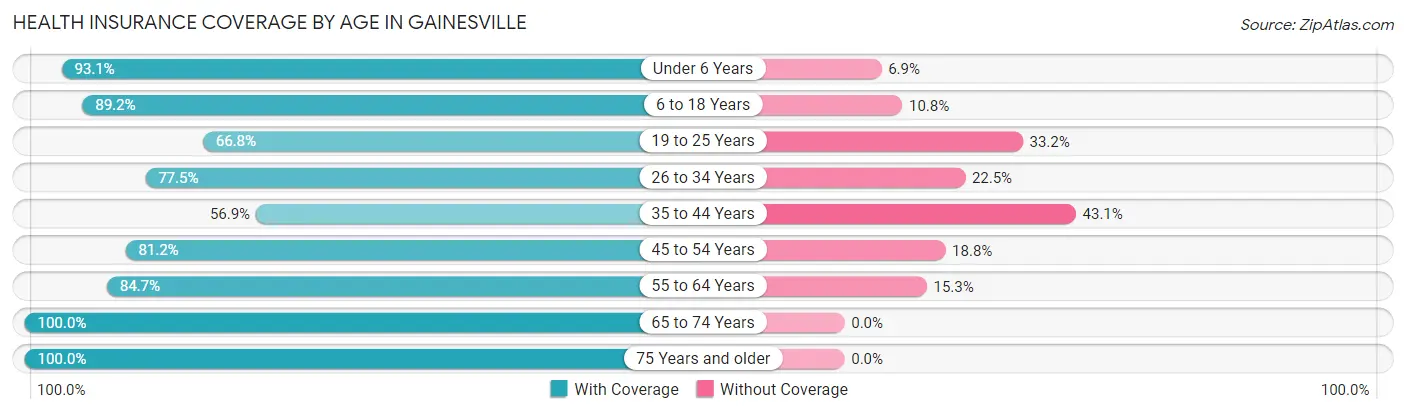
| Age Bracket | With Coverage | Without Coverage |
| Under 6 Years | 3,249 (93.1%) | 240 (6.9%) |
| 6 to 18 Years | 7,632 (89.2%) | 921 (10.8%) |
| 19 to 25 Years | 3,191 (66.8%) | 1,589 (33.2%) |
| 26 to 34 Years | 4,505 (77.5%) | 1,308 (22.5%) |
| 35 to 44 Years | 2,877 (56.9%) | 2,183 (43.1%) |
| 45 to 54 Years | 3,789 (81.2%) | 878 (18.8%) |
| 55 to 64 Years | 3,174 (84.7%) | 575 (15.3%) |
| 65 to 74 Years | 3,649 (100.0%) | 0 (0.0%) |
| 75 Years and older | 2,230 (100.0%) | 0 (0.0%) |
| Total | 34,296 (81.7%) | 7,694 (18.3%) |
Health Insurance Coverage by Citizenship Status in Gainesville
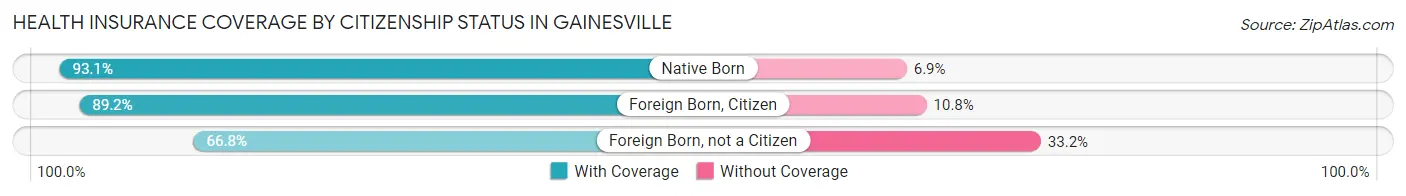
| Citizenship Status | With Coverage | Without Coverage |
| Native Born | 3,249 (93.1%) | 240 (6.9%) |
| Foreign Born, Citizen | 7,632 (89.2%) | 921 (10.8%) |
| Foreign Born, not a Citizen | 3,191 (66.8%) | 1,589 (33.2%) |
Health Insurance Coverage by Household Income in Gainesville
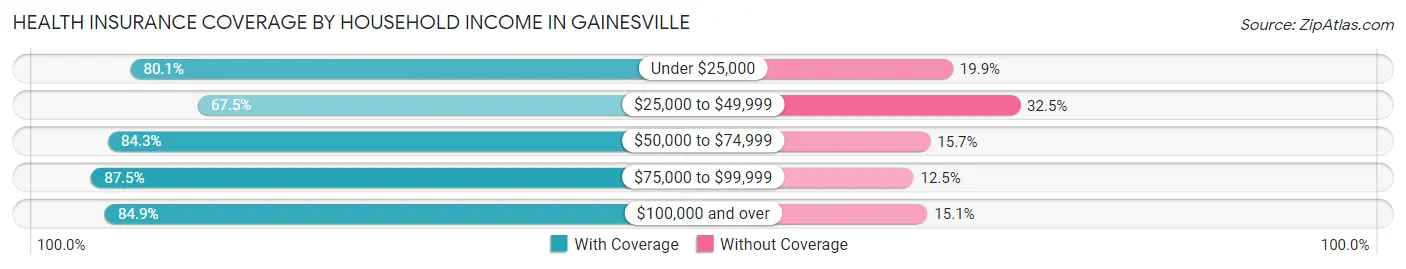
| Household Income | With Coverage | Without Coverage |
| Under $25,000 | 4,550 (80.1%) | 1,129 (19.9%) |
| $25,000 to $49,999 | 4,635 (67.5%) | 2,230 (32.5%) |
| $50,000 to $74,999 | 7,163 (84.3%) | 1,330 (15.7%) |
| $75,000 to $99,999 | 6,382 (87.5%) | 912 (12.5%) |
| $100,000 and over | 10,920 (84.9%) | 1,942 (15.1%) |
Public vs Private Health Insurance Coverage by Age in Gainesville
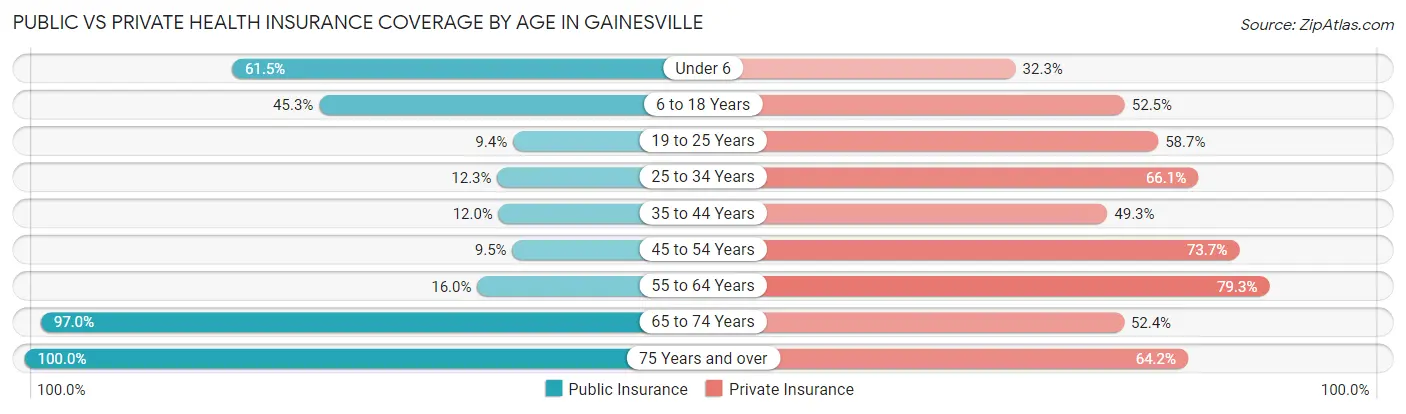
| Age Bracket | Public Insurance | Private Insurance |
| Under 6 | 2,146 (61.5%) | 1,126 (32.3%) |
| 6 to 18 Years | 3,877 (45.3%) | 4,494 (52.5%) |
| 19 to 25 Years | 447 (9.3%) | 2,808 (58.7%) |
| 25 to 34 Years | 712 (12.2%) | 3,843 (66.1%) |
| 35 to 44 Years | 607 (12.0%) | 2,494 (49.3%) |
| 45 to 54 Years | 441 (9.5%) | 3,441 (73.7%) |
| 55 to 64 Years | 599 (16.0%) | 2,974 (79.3%) |
| 65 to 74 Years | 3,539 (97.0%) | 1,911 (52.4%) |
| 75 Years and over | 2,230 (100.0%) | 1,432 (64.2%) |
| Total | 14,598 (34.8%) | 24,523 (58.4%) |
Disability Status by Sex by Age in Gainesville
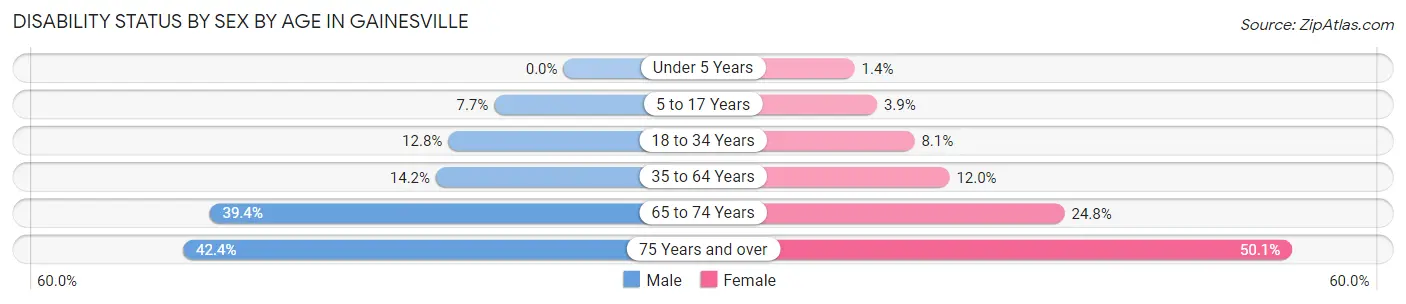
| Age Bracket | Male | Female |
| Under 5 Years | 0 (0.0%) | 21 (1.4%) |
| 5 to 17 Years | 326 (7.7%) | 152 (3.9%) |
| 18 to 34 Years | 727 (12.8%) | 471 (8.1%) |
| 35 to 64 Years | 907 (14.2%) | 850 (12.0%) |
| 65 to 74 Years | 539 (39.4%) | 566 (24.8%) |
| 75 Years and over | 360 (42.3%) | 692 (50.1%) |
Disability Class by Sex by Age in Gainesville
Disability Class: Hearing Difficulty
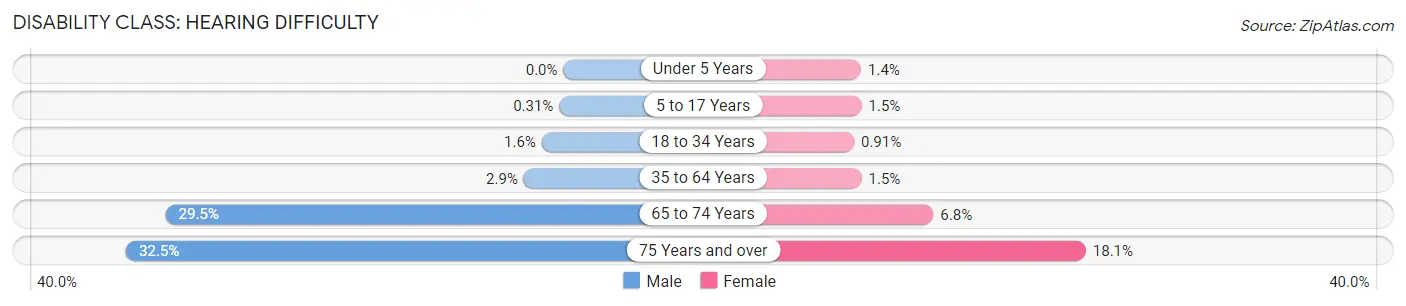
| Age Bracket | Male | Female |
| Under 5 Years | 0 (0.0%) | 21 (1.4%) |
| 5 to 17 Years | 13 (0.3%) | 57 (1.5%) |
| 18 to 34 Years | 91 (1.6%) | 53 (0.9%) |
| 35 to 64 Years | 188 (2.9%) | 104 (1.5%) |
| 65 to 74 Years | 404 (29.5%) | 155 (6.8%) |
| 75 Years and over | 276 (32.5%) | 250 (18.1%) |
Disability Class: Vision Difficulty
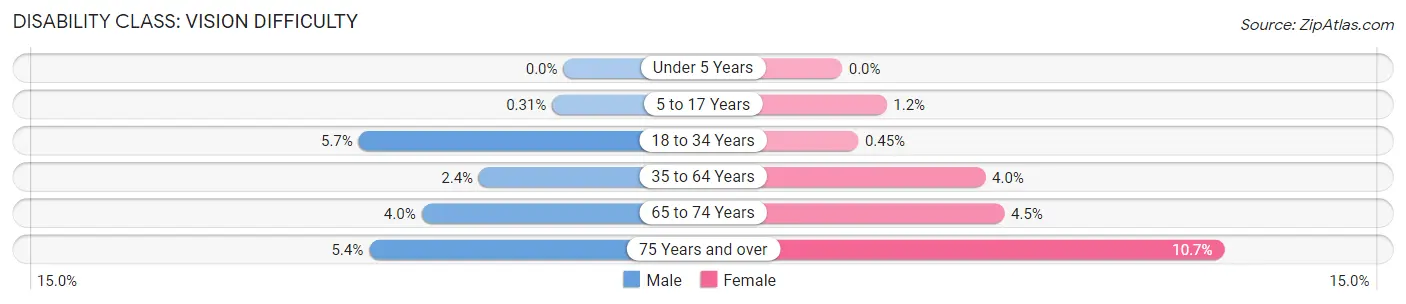
| Age Bracket | Male | Female |
| Under 5 Years | 0 (0.0%) | 0 (0.0%) |
| 5 to 17 Years | 13 (0.3%) | 48 (1.2%) |
| 18 to 34 Years | 323 (5.7%) | 26 (0.4%) |
| 35 to 64 Years | 150 (2.4%) | 283 (4.0%) |
| 65 to 74 Years | 54 (4.0%) | 103 (4.5%) |
| 75 Years and over | 46 (5.4%) | 147 (10.6%) |
Disability Class: Cognitive Difficulty
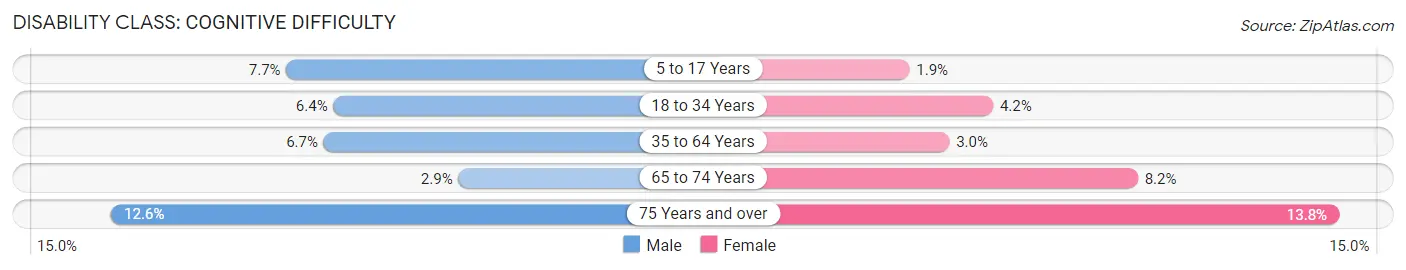
| Age Bracket | Male | Female |
| 5 to 17 Years | 326 (7.7%) | 73 (1.9%) |
| 18 to 34 Years | 363 (6.4%) | 245 (4.2%) |
| 35 to 64 Years | 426 (6.7%) | 212 (3.0%) |
| 65 to 74 Years | 40 (2.9%) | 188 (8.2%) |
| 75 Years and over | 107 (12.6%) | 191 (13.8%) |
Disability Class: Ambulatory Difficulty
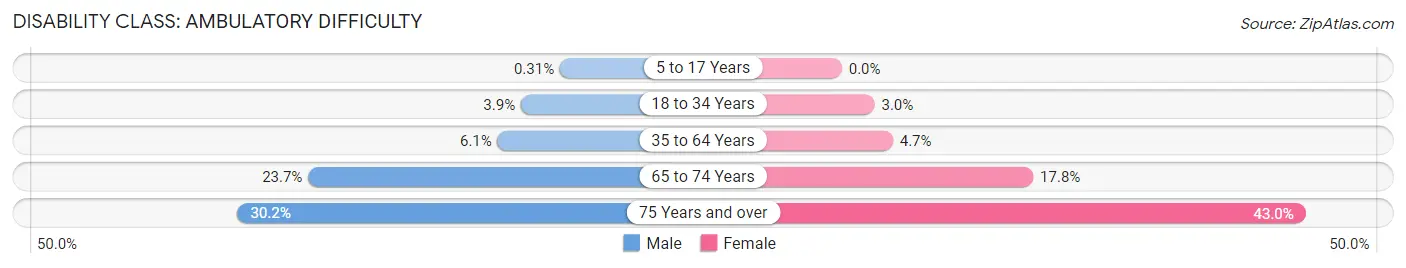
| Age Bracket | Male | Female |
| 5 to 17 Years | 13 (0.3%) | 0 (0.0%) |
| 18 to 34 Years | 223 (3.9%) | 177 (3.0%) |
| 35 to 64 Years | 390 (6.1%) | 335 (4.7%) |
| 65 to 74 Years | 324 (23.7%) | 405 (17.8%) |
| 75 Years and over | 257 (30.2%) | 594 (43.0%) |
Disability Class: Self-Care Difficulty
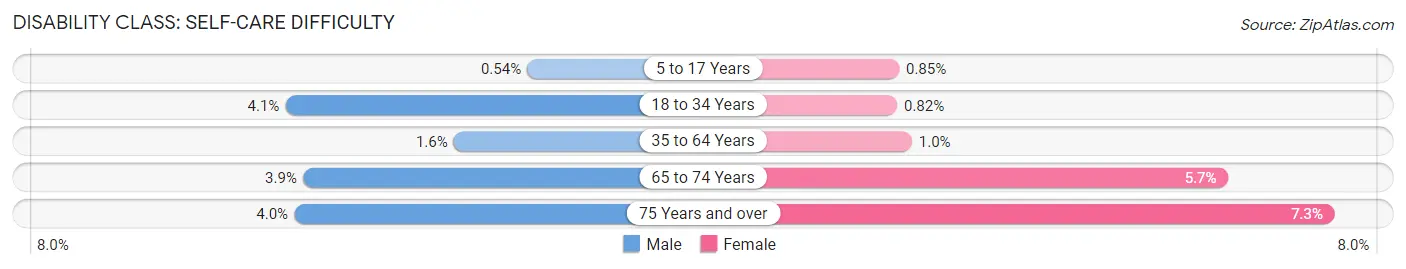
| Age Bracket | Male | Female |
| 5 to 17 Years | 23 (0.5%) | 33 (0.9%) |
| 18 to 34 Years | 234 (4.1%) | 48 (0.8%) |
| 35 to 64 Years | 104 (1.6%) | 74 (1.0%) |
| 65 to 74 Years | 53 (3.9%) | 131 (5.7%) |
| 75 Years and over | 34 (4.0%) | 101 (7.3%) |
Technology Access in Gainesville
Computing Device Access in Gainesville
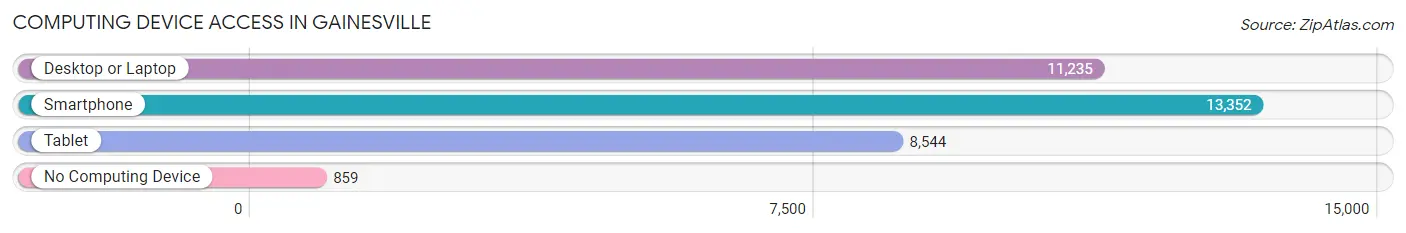
| Device Type | # Households | % Households |
| Desktop or Laptop | 11,235 | 75.1% |
| Smartphone | 13,352 | 89.2% |
| Tablet | 8,544 | 57.1% |
| No Computing Device | 859 | 5.7% |
| Total | 14,965 | 100.0% |
Internet Access in Gainesville
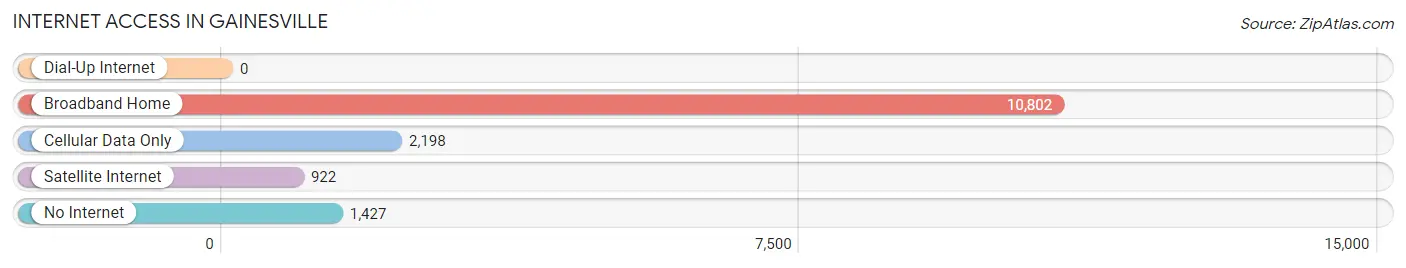
| Internet Type | # Households | % Households |
| Dial-Up Internet | 0 | 0.0% |
| Broadband Home | 10,802 | 72.2% |
| Cellular Data Only | 2,198 | 14.7% |
| Satellite Internet | 922 | 6.2% |
| No Internet | 1,427 | 9.5% |
| Total | 14,965 | 100.0% |
Gainesville Summary
Gainesville is a city located in the state of Georgia, in the United States of America. It is the county seat of Hall County and is part of the Atlanta metropolitan area. The city is situated in the foothills of the Blue Ridge Mountains, and is located about an hour northeast of Atlanta. As of the 2010 census, the city had a population of 33,804.
History
Gainesville was founded in 1821 as Mule Camp Springs, named for the nearby springs that provided water for the mules that were used to transport goods to and from the area. The city was renamed Gainesville in 1821, after General Edmund P. Gaines, a hero of the War of 1812. The city was incorporated in 1821, and the first mayor was elected in 1854.
Gainesville was a major center of the cotton industry in the 19th century, and the city was home to several cotton mills. The city was also a major railroad hub, with several lines running through the city. The city was also home to a major military base during World War II, and the base was used to train troops for the war effort.
Geography
Gainesville is located in the foothills of the Blue Ridge Mountains, in the Piedmont region of Georgia. The city is situated at the confluence of the Chattahoochee River and Lake Lanier. The city covers an area of 24.3 square miles, and has an elevation of 830 feet.
The climate in Gainesville is humid subtropical, with hot, humid summers and mild winters. The average annual temperature is 61.3 degrees Fahrenheit, and the average annual precipitation is 48.3 inches.
Economy
Gainesville is a major economic center in the region, and the city is home to several major employers. The largest employers in the city are Northeast Georgia Medical Center, the University of North Georgia, and the Hall County School System. Other major employers in the city include the Gainesville Times, the Gainesville-Hall County Chamber of Commerce, and the Gainesville-Hall County Development Authority.
The city is also home to several major industries, including manufacturing, healthcare, and education. The city is also home to several major retail centers, including the Gainesville Mall and the Lakeshore Mall.
Demographics
As of the 2010 census, the population of Gainesville was 33,804. The racial makeup of the city was 73.3% White, 17.2% African American, 0.4% Native American, 2.3% Asian, 0.1% Pacific Islander, 4.2% from other races, and 2.5% from two or more races. Hispanic or Latino of any race were 8.7% of the population.
The median household income in Gainesville was $41,945, and the median family income was $50,945. The per capita income in the city was $22,845. About 15.3% of the population was below the poverty line.
Common Questions
What is the Total Population of Gainesville?
Total Population of Gainesville is 42,780.
What is the Total Male Population of Gainesville?
Total Male Population of Gainesville is 20,516.
What is the Total Female Population of Gainesville?
Total Female Population of Gainesville is 22,264.
What is the Ratio of Males per 100 Females in Gainesville?
There are 92.15 Males per 100 Females in Gainesville.
What is the Ratio of Females per 100 Males in Gainesville?
There are 108.52 Females per 100 Males in Gainesville.
What is the Median Population Age in Gainesville?
Median Population Age in Gainesville is 32.1 Years.
What is the Average Family Size in Gainesville
Average Family Size in Gainesville is 3.5 People.
What is the Average Household Size in Gainesville
Average Household Size in Gainesville is 2.8 People.
What is Per Capita Income in Gainesville?
Per Capita income in Gainesville is $31,619.
What is the Median Family Income in Gainesville?
Median Family Income in Gainesville is $71,466.
What is the Median Household income in Gainesville?
Median Household Income in Gainesville is $64,163.
What is Income or Wage Gap in Gainesville?
Income or Wage Gap in Gainesville is 18.7%.
Women in Gainesville earn 81.3 cents for every dollar earned by a man.
What is Family Income Deficit in Gainesville?
Family Income Deficit in Gainesville is $11,386.
Families that are below poverty line in Gainesville earn $11,386 less on average than the poverty threshold level.
What is Inequality or Gini Index in Gainesville?
Inequality or Gini Index in Gainesville is 0.49.
How Large is the Labor Force in Gainesville?
There are 20,896 People in the Labor Forcein in Gainesville.
What is the Percentage of People in the Labor Force in Gainesville?
62.8% of People are in the Labor Force in Gainesville.
What is the Unemployment Rate in Gainesville?
Unemployment Rate in Gainesville is 4.3%.