Colquitt, GA
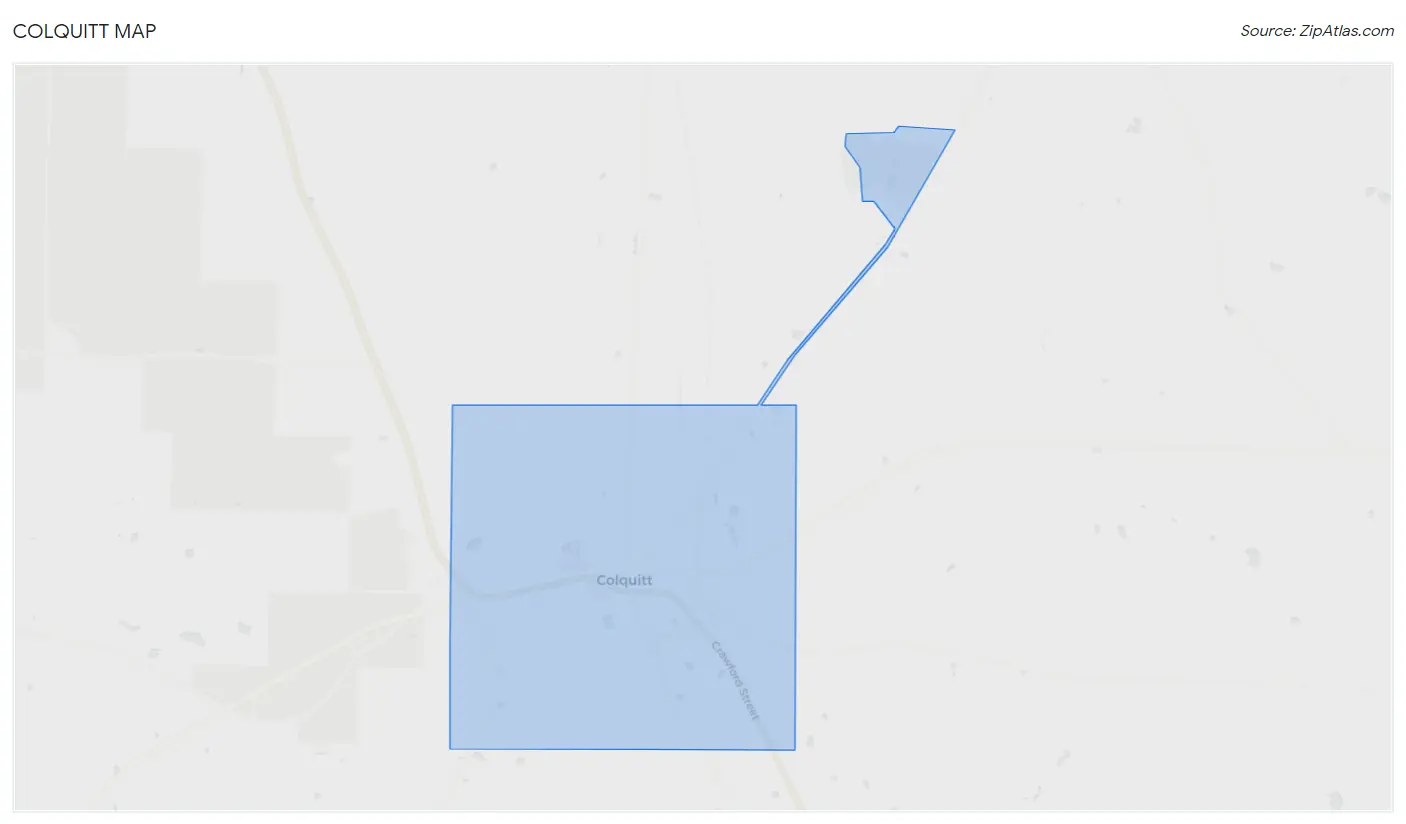
Colquitt Map
Colquitt Overview
2,131
TOTAL POPULATION
889
MALE POPULATION
1,242
FEMALE POPULATION
71.58
MALES / 100 FEMALES
139.71
FEMALES / 100 MALES
42.5
MEDIAN AGE
2.9
AVG FAMILY SIZE
2.2
AVG HOUSEHOLD SIZE
$25,544
PER CAPITA INCOME
$35,625
AVG FAMILY INCOME
$26,125
AVG HOUSEHOLD INCOME
36.2%
WAGE / INCOME GAP [ % ]
63.8¢/ $1
WAGE / INCOME GAP [ $ ]
0.54
INEQUALITY / GINI INDEX
851
LABOR FORCE [ PEOPLE ]
50.8%
PERCENT IN LABOR FORCE
9.0%
UNEMPLOYMENT RATE
Colquitt Zip Codes
Colquitt Area Codes
Race in Colquitt
The most populous races in Colquitt are Black / African American (1,086 | 51.0%), White / Caucasian (879 | 41.2%), and Native / Alaskan (68 | 3.2%).
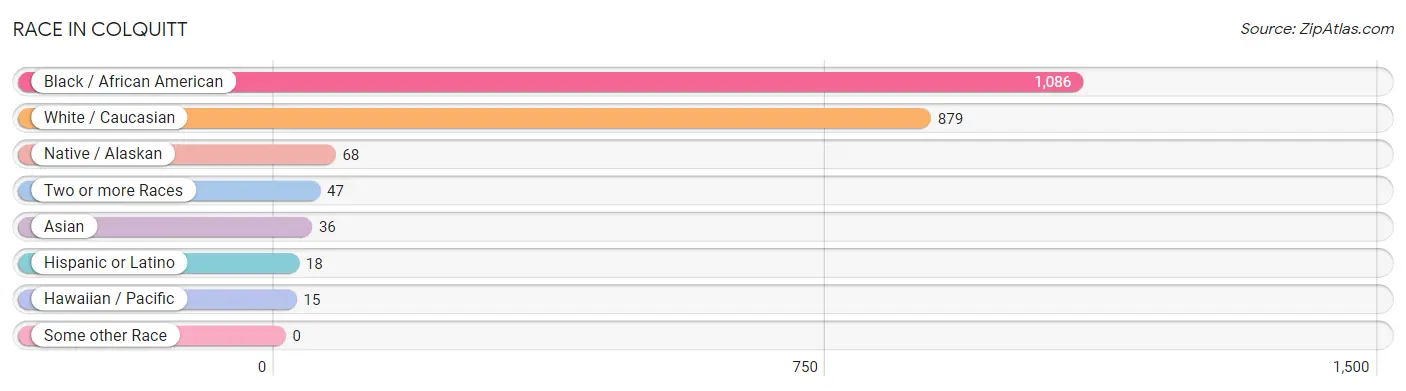
| Race | # Population | % Population |
| Asian | 36 | 1.7% |
| Black / African American | 1,086 | 51.0% |
| Hawaiian / Pacific | 15 | 0.7% |
| Hispanic or Latino | 18 | 0.8% |
| Native / Alaskan | 68 | 3.2% |
| White / Caucasian | 879 | 41.2% |
| Two or more Races | 47 | 2.2% |
| Some other Race | 0 | 0.0% |
| Total | 2,131 | 100.0% |
Ancestry in Colquitt
The most populous ancestries reported in Colquitt are American (215 | 10.1%), English (150 | 7.0%), Irish (87 | 4.1%), Bahamian (32 | 1.5%), and African (28 | 1.3%), together accounting for 24.0% of all Colquitt residents.
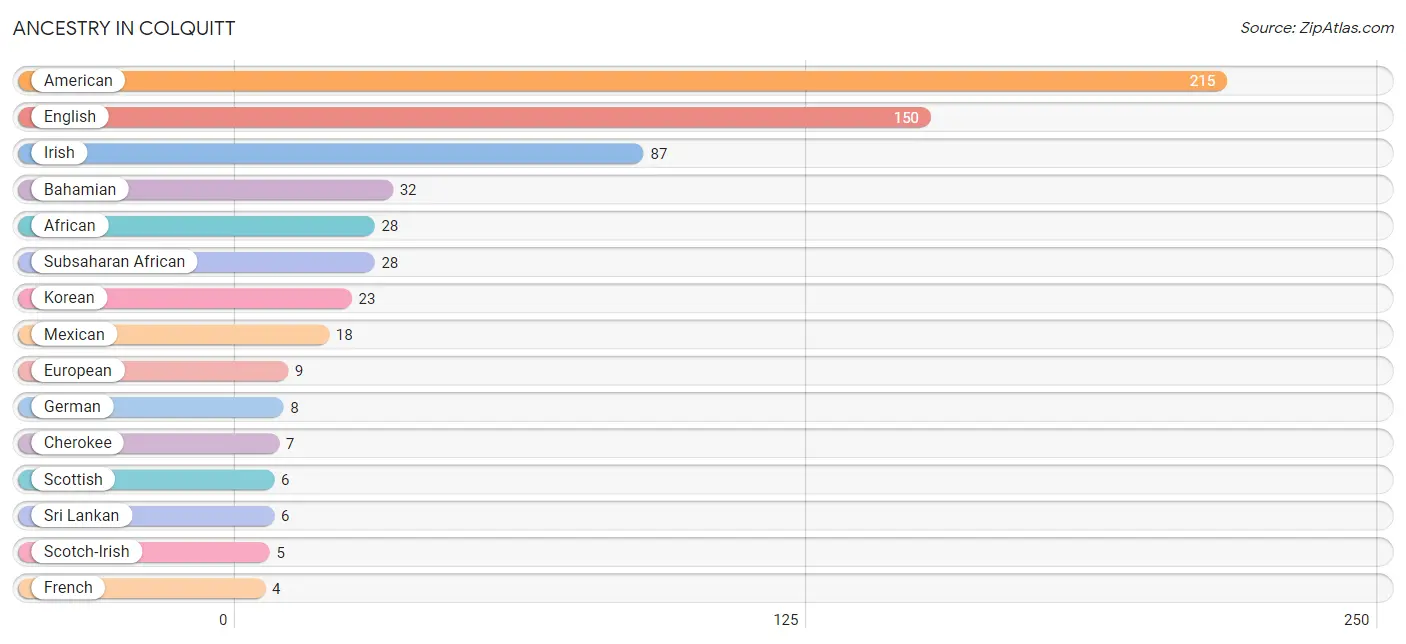
| Ancestry | # Population | % Population |
| African | 28 | 1.3% |
| American | 215 | 10.1% |
| Bahamian | 32 | 1.5% |
| Cherokee | 7 | 0.3% |
| English | 150 | 7.0% |
| European | 9 | 0.4% |
| French | 4 | 0.2% |
| German | 8 | 0.4% |
| Indian (Asian) | 1 | 0.1% |
| Irish | 87 | 4.1% |
| Japanese | 4 | 0.2% |
| Korean | 23 | 1.1% |
| Mexican | 18 | 0.8% |
| Polish | 2 | 0.1% |
| Scotch-Irish | 5 | 0.2% |
| Scottish | 6 | 0.3% |
| Sri Lankan | 6 | 0.3% |
| Subsaharan African | 28 | 1.3% |
| Thai | 2 | 0.1% | View All 19 Rows |
Immigrants in Colquitt
The most numerous immigrant groups reported in Colquitt came from Asia (29 | 1.4%), South Eastern Asia (27 | 1.3%), Philippines (23 | 1.1%), Micronesia (6 | 0.3%), and Oceania (6 | 0.3%), together accounting for 4.3% of all Colquitt residents.
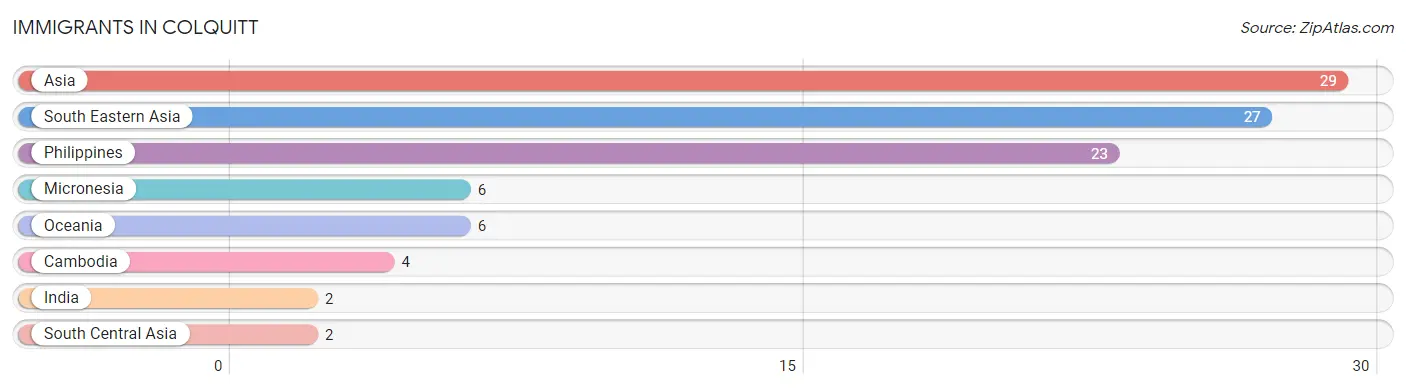
| Immigration Origin | # Population | % Population |
| Asia | 29 | 1.4% |
| Cambodia | 4 | 0.2% |
| India | 2 | 0.1% |
| Micronesia | 6 | 0.3% |
| Oceania | 6 | 0.3% |
| Philippines | 23 | 1.1% |
| South Central Asia | 2 | 0.1% |
| South Eastern Asia | 27 | 1.3% | View All 8 Rows |
Sex and Age in Colquitt
Sex and Age in Colquitt
The most populous age groups in Colquitt are 10 to 14 Years (131 | 14.7%) for men and 40 to 44 Years (187 | 15.1%) for women.
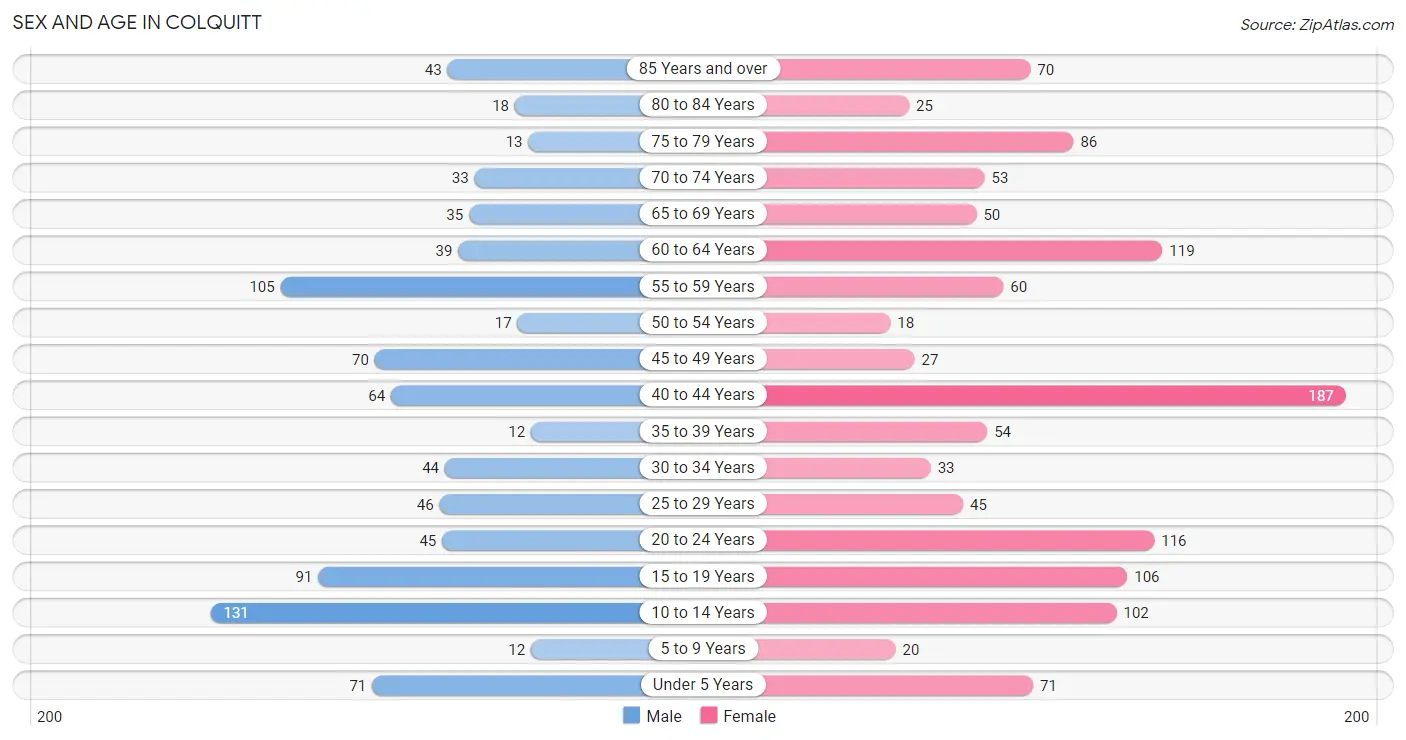
| Age Bracket | Male | Female |
| Under 5 Years | 71 (8.0%) | 71 (5.7%) |
| 5 to 9 Years | 12 (1.3%) | 20 (1.6%) |
| 10 to 14 Years | 131 (14.7%) | 102 (8.2%) |
| 15 to 19 Years | 91 (10.2%) | 106 (8.5%) |
| 20 to 24 Years | 45 (5.1%) | 116 (9.3%) |
| 25 to 29 Years | 46 (5.2%) | 45 (3.6%) |
| 30 to 34 Years | 44 (5.0%) | 33 (2.7%) |
| 35 to 39 Years | 12 (1.3%) | 54 (4.3%) |
| 40 to 44 Years | 64 (7.2%) | 187 (15.1%) |
| 45 to 49 Years | 70 (7.9%) | 27 (2.2%) |
| 50 to 54 Years | 17 (1.9%) | 18 (1.5%) |
| 55 to 59 Years | 105 (11.8%) | 60 (4.8%) |
| 60 to 64 Years | 39 (4.4%) | 119 (9.6%) |
| 65 to 69 Years | 35 (3.9%) | 50 (4.0%) |
| 70 to 74 Years | 33 (3.7%) | 53 (4.3%) |
| 75 to 79 Years | 13 (1.5%) | 86 (6.9%) |
| 80 to 84 Years | 18 (2.0%) | 25 (2.0%) |
| 85 Years and over | 43 (4.8%) | 70 (5.6%) |
| Total | 889 (100.0%) | 1,242 (100.0%) |
Families and Households in Colquitt
Median Family Size in Colquitt
The median family size in Colquitt is 2.91 persons per family, with single male/father families (34 | 6.7%) accounting for the largest median family size of 3.41 persons per family. On the other hand, married-couple families (223 | 44.0%) represent the smallest median family size with 2.69 persons per family.
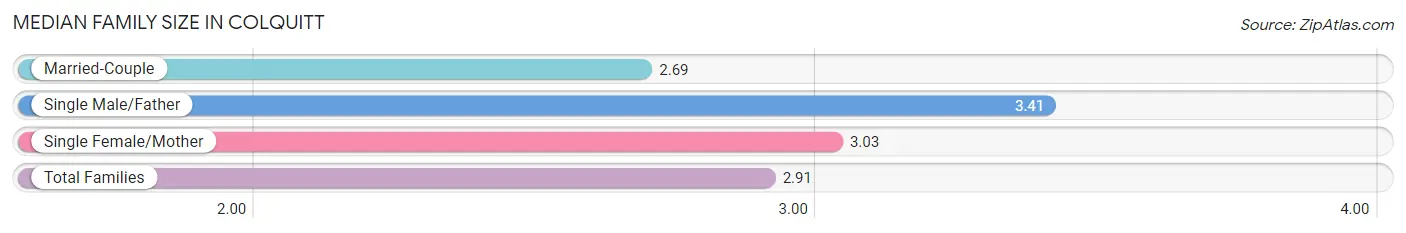
| Family Type | # Families | Family Size |
| Married-Couple | 223 (44.0%) | 2.69 |
| Single Male/Father | 34 (6.7%) | 3.41 |
| Single Female/Mother | 250 (49.3%) | 3.03 |
| Total Families | 507 (100.0%) | 2.91 |
Median Household Size in Colquitt
The median household size in Colquitt is 2.19 persons per household, with single male/father households (34 | 3.8%) accounting for the largest median household size of 3.74 persons per household. non-family households (388 | 43.3%) represent the smallest median household size with 1.08 persons per household.
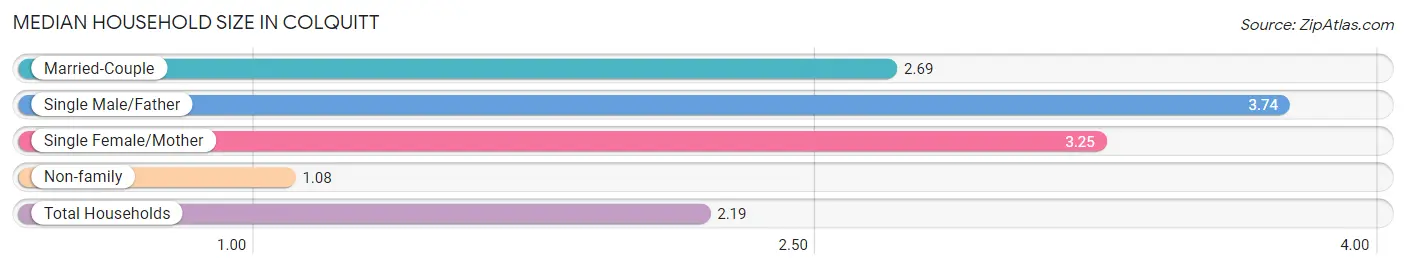
| Household Type | # Households | Household Size |
| Married-Couple | 223 (24.9%) | 2.69 |
| Single Male/Father | 34 (3.8%) | 3.74 |
| Single Female/Mother | 250 (27.9%) | 3.25 |
| Non-family | 388 (43.3%) | 1.08 |
| Total Households | 895 (100.0%) | 2.19 |
Household Size by Marriage Status in Colquitt
Out of a total of 895 households in Colquitt, 507 (56.7%) are family households, while 388 (43.3%) are nonfamily households. The most numerous type of family households are 2-person households, comprising 233, and the most common type of nonfamily households are 1-person households, comprising 354.
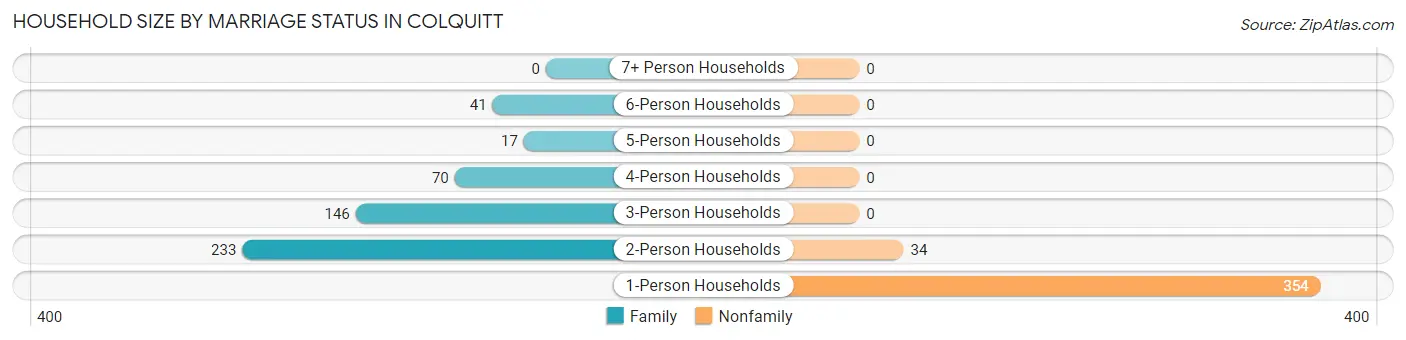
| Household Size | Family Households | Nonfamily Households |
| 1-Person Households | - | 354 (39.6%) |
| 2-Person Households | 233 (26.0%) | 34 (3.8%) |
| 3-Person Households | 146 (16.3%) | 0 (0.0%) |
| 4-Person Households | 70 (7.8%) | 0 (0.0%) |
| 5-Person Households | 17 (1.9%) | 0 (0.0%) |
| 6-Person Households | 41 (4.6%) | 0 (0.0%) |
| 7+ Person Households | 0 (0.0%) | 0 (0.0%) |
| Total | 507 (56.7%) | 388 (43.3%) |
Female Fertility in Colquitt
Fertility by Age in Colquitt
Average fertility rate in Colquitt is 7.0 births per 1,000 women. Women in the age bracket of 20 to 34 years have the highest fertility rate with 21.0 births per 1,000 women. Women in the age bracket of 20 to 34 years acount for 100.0% of all women with births.
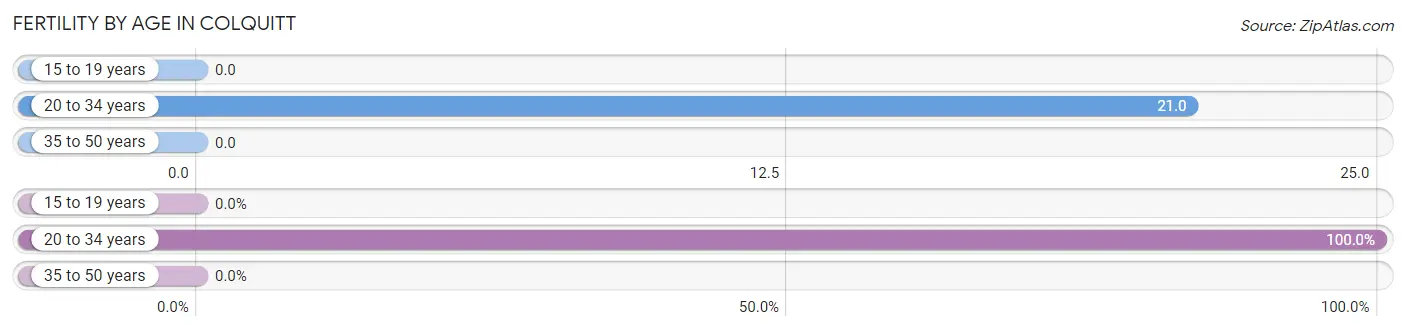
| Age Bracket | Women with Births | Births / 1,000 Women |
| 15 to 19 years | 0 (0.0%) | 0.0 |
| 20 to 34 years | 4 (100.0%) | 21.0 |
| 35 to 50 years | 0 (0.0%) | 0.0 |
| Total | 4 (100.0%) | 7.0 |
Fertility by Age by Marriage Status in Colquitt
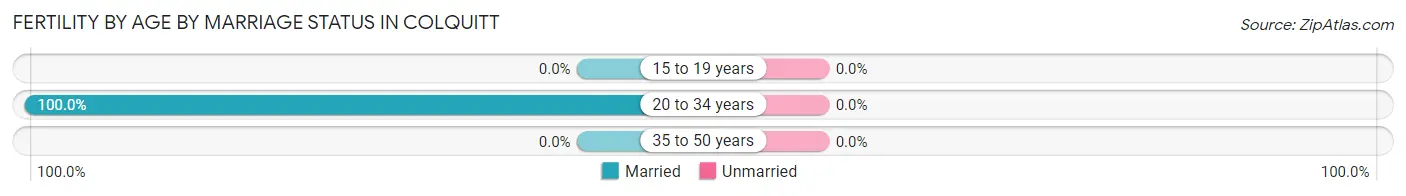
| Age Bracket | Married | Unmarried |
| 15 to 19 years | 0 (0.0%) | 0 (0.0%) |
| 20 to 34 years | 4 (100.0%) | 0 (0.0%) |
| 35 to 50 years | 0 (0.0%) | 0 (0.0%) |
| Total | 4 (100.0%) | 0 (0.0%) |
Fertility by Education in Colquitt
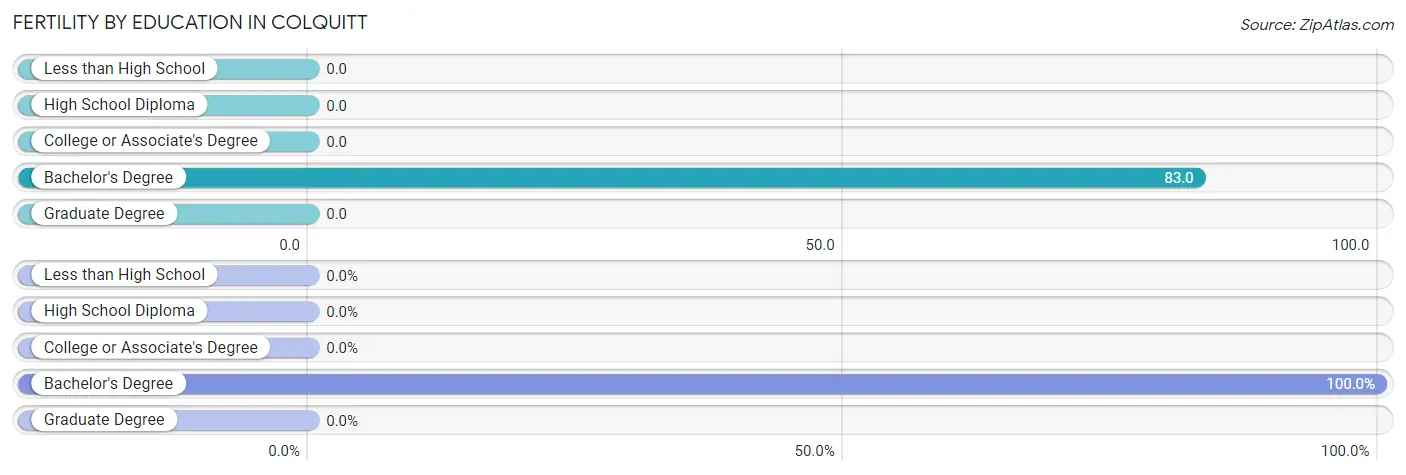
| Educational Attainment | Women with Births | Births / 1,000 Women |
| Less than High School | 0 (0.0%) | 0.0 |
| High School Diploma | 0 (0.0%) | 0.0 |
| College or Associate's Degree | 0 (0.0%) | 0.0 |
| Bachelor's Degree | 4 (100.0%) | 83.0 |
| Graduate Degree | 0 (0.0%) | 0.0 |
| Total | 4 (100.0%) | 7.0 |
Fertility by Education by Marriage Status in Colquitt
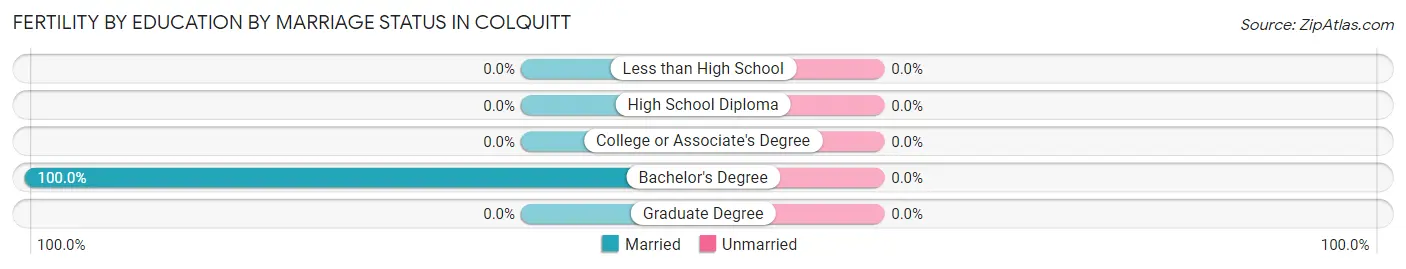
| Educational Attainment | Married | Unmarried |
| Less than High School | 0 (0.0%) | 0 (0.0%) |
| High School Diploma | 0 (0.0%) | 0 (0.0%) |
| College or Associate's Degree | 0 (0.0%) | 0 (0.0%) |
| Bachelor's Degree | 4 (100.0%) | 0 (0.0%) |
| Graduate Degree | 0 (0.0%) | 0 (0.0%) |
| Total | 4 (100.0%) | 0 (0.0%) |
Income in Colquitt
Income Overview in Colquitt
Per Capita Income in Colquitt is $25,544, while median incomes of families and households are $35,625 and $26,125 respectively.
| Characteristic | Number | Measure |
| Per Capita Income | 2,131 | $25,544 |
| Median Family Income | 507 | $35,625 |
| Mean Family Income | 507 | $57,667 |
| Median Household Income | 895 | $26,125 |
| Mean Household Income | 895 | $59,185 |
| Income Deficit | 507 | $0 |
| Wage / Income Gap (%) | 2,131 | 36.16% |
| Wage / Income Gap ($) | 2,131 | 63.84¢ per $1 |
| Gini / Inequality Index | 2,131 | 0.54 |
Earnings by Sex in Colquitt
Average Earnings in Colquitt are $36,327, $51,012 for men and $32,568 for women, a difference of 36.2%.
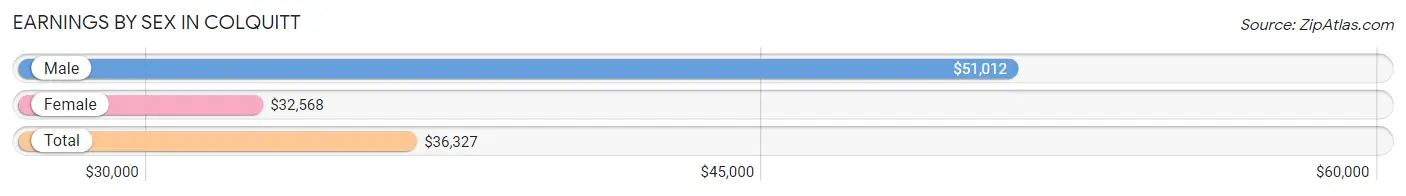
| Sex | Number | Average Earnings |
| Male | 311 (38.9%) | $51,012 |
| Female | 489 (61.1%) | $32,568 |
| Total | 800 (100.0%) | $36,327 |
Earnings by Sex by Income Bracket in Colquitt
The most common earnings brackets in Colquitt are $100,000+ for men (58 | 18.6%) and $30,000 to $34,999 for women (88 | 18.0%).
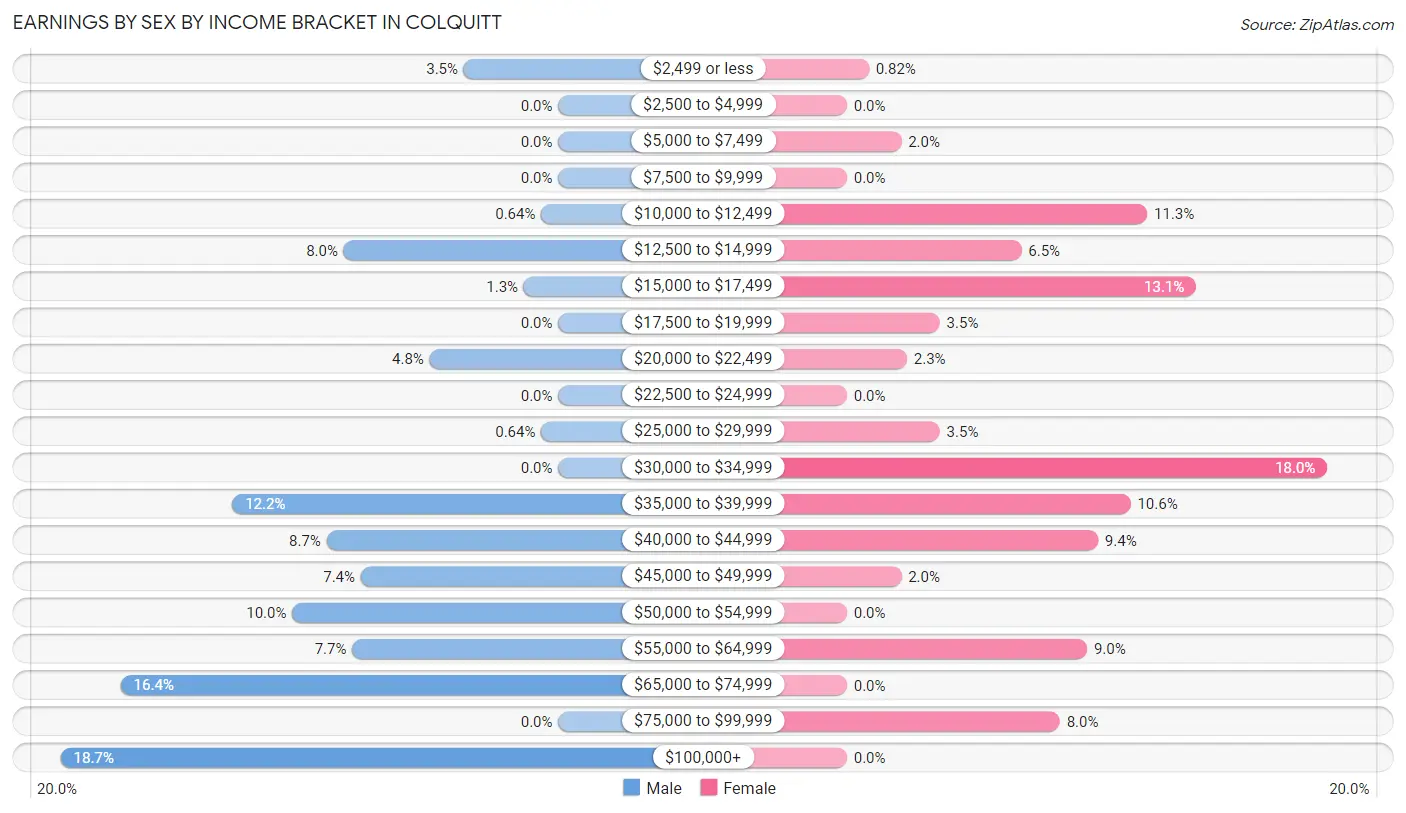
| Income | Male | Female |
| $2,499 or less | 11 (3.5%) | 4 (0.8%) |
| $2,500 to $4,999 | 0 (0.0%) | 0 (0.0%) |
| $5,000 to $7,499 | 0 (0.0%) | 10 (2.0%) |
| $7,500 to $9,999 | 0 (0.0%) | 0 (0.0%) |
| $10,000 to $12,499 | 2 (0.6%) | 55 (11.3%) |
| $12,500 to $14,999 | 25 (8.0%) | 32 (6.5%) |
| $15,000 to $17,499 | 4 (1.3%) | 64 (13.1%) |
| $17,500 to $19,999 | 0 (0.0%) | 17 (3.5%) |
| $20,000 to $22,499 | 15 (4.8%) | 11 (2.2%) |
| $22,500 to $24,999 | 0 (0.0%) | 0 (0.0%) |
| $25,000 to $29,999 | 2 (0.6%) | 17 (3.5%) |
| $30,000 to $34,999 | 0 (0.0%) | 88 (18.0%) |
| $35,000 to $39,999 | 38 (12.2%) | 52 (10.6%) |
| $40,000 to $44,999 | 27 (8.7%) | 46 (9.4%) |
| $45,000 to $49,999 | 23 (7.4%) | 10 (2.0%) |
| $50,000 to $54,999 | 31 (10.0%) | 0 (0.0%) |
| $55,000 to $64,999 | 24 (7.7%) | 44 (9.0%) |
| $65,000 to $74,999 | 51 (16.4%) | 0 (0.0%) |
| $75,000 to $99,999 | 0 (0.0%) | 39 (8.0%) |
| $100,000+ | 58 (18.6%) | 0 (0.0%) |
| Total | 311 (100.0%) | 489 (100.0%) |
Earnings by Sex by Educational Attainment in Colquitt
Average earnings in Colquitt are $52,321 for men and $34,841 for women, a difference of 33.4%. Men with an educational attainment of college or associate's degree enjoy the highest average annual earnings of $67,978, while those with high school diploma education earn the least with $41,691. Women with an educational attainment of bachelor's degree earn the most with the average annual earnings of $64,688, while those with less than high school education have the smallest earnings of $15,844.
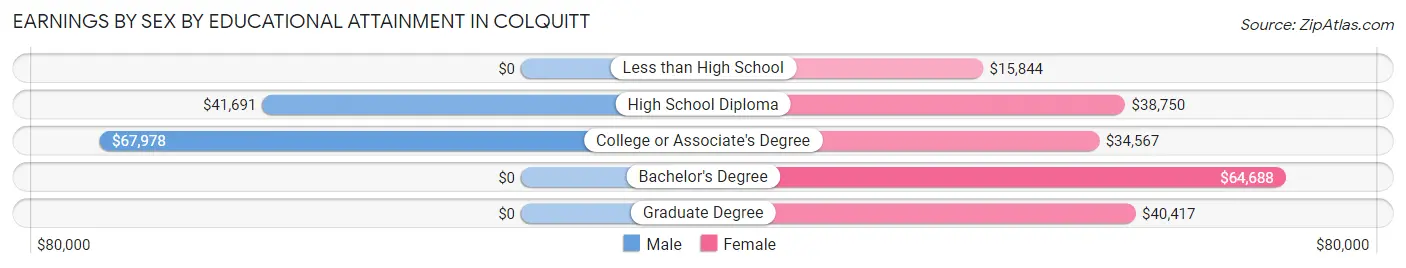
| Educational Attainment | Male Income | Female Income |
| Less than High School | - | - |
| High School Diploma | $41,691 | $38,750 |
| College or Associate's Degree | $67,978 | $34,567 |
| Bachelor's Degree | - | - |
| Graduate Degree | - | - |
| Total | $52,321 | $34,841 |
Family Income in Colquitt
Family Income Brackets in Colquitt
According to the Colquitt family income data, there are 145 families falling into the $15,000 to $24,999 income range, which is the most common income bracket and makes up 28.6% of all families.
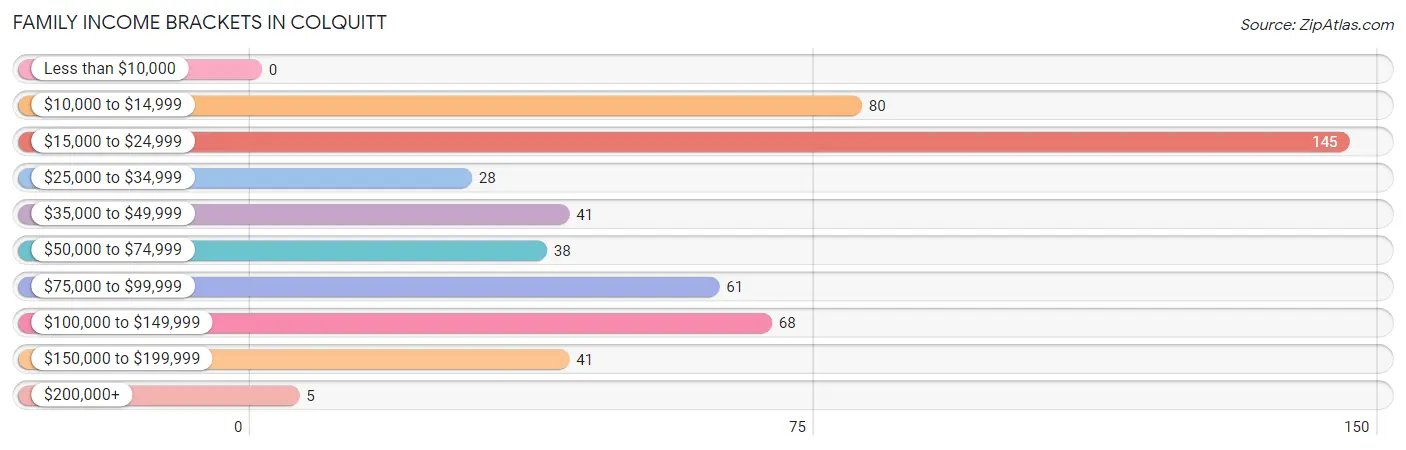
| Income Bracket | # Families | % Families |
| Less than $10,000 | 0 | 0.0% |
| $10,000 to $14,999 | 80 | 15.8% |
| $15,000 to $24,999 | 145 | 28.6% |
| $25,000 to $34,999 | 28 | 5.5% |
| $35,000 to $49,999 | 41 | 8.1% |
| $50,000 to $74,999 | 38 | 7.5% |
| $75,000 to $99,999 | 61 | 12.0% |
| $100,000 to $149,999 | 68 | 13.4% |
| $150,000 to $199,999 | 41 | 8.1% |
| $200,000+ | 5 | 1.0% |
Family Income by Famaliy Size in Colquitt
4-person families (57 | 11.2%) account for the highest median family income in Colquitt with $104,375 per family, while 4-person families (57 | 11.2%) have the highest median income of $26,094 per family member.
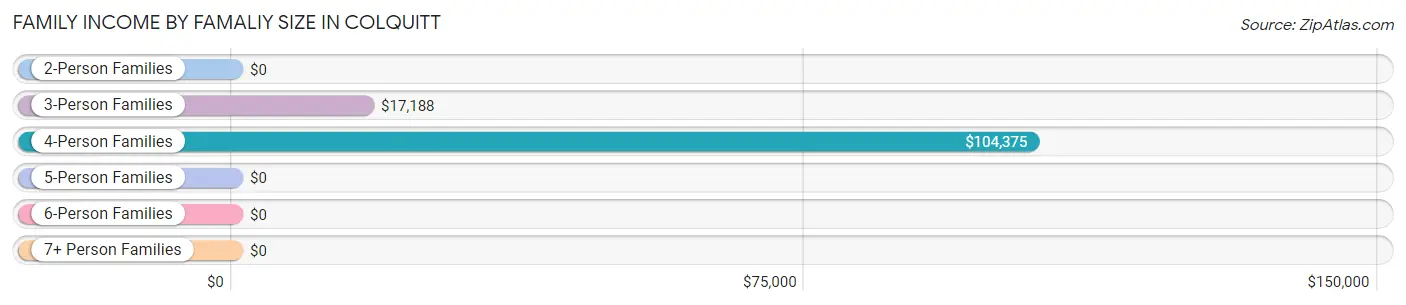
| Income Bracket | # Families | Median Income |
| 2-Person Families | 252 (49.7%) | $0 |
| 3-Person Families | 145 (28.6%) | $17,188 |
| 4-Person Families | 57 (11.2%) | $104,375 |
| 5-Person Families | 28 (5.5%) | $0 |
| 6-Person Families | 25 (4.9%) | $0 |
| 7+ Person Families | 0 (0.0%) | $0 |
| Total | 507 (100.0%) | $35,625 |
Family Income by Number of Earners in Colquitt
The median family income in Colquitt is $35,625, with families comprising 2 earners (161) having the highest median family income of $115,184, while families with no earners (73) have the lowest median family income of $15,347, accounting for 31.8% and 14.4% of families, respectively.
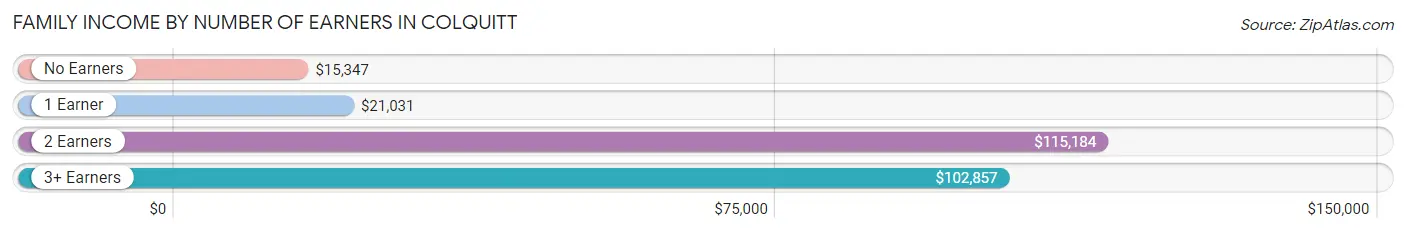
| Number of Earners | # Families | Median Income |
| No Earners | 73 (14.4%) | $15,347 |
| 1 Earner | 249 (49.1%) | $21,031 |
| 2 Earners | 161 (31.8%) | $115,184 |
| 3+ Earners | 24 (4.7%) | $102,857 |
| Total | 507 (100.0%) | $35,625 |
Household Income in Colquitt
Household Income Brackets in Colquitt
With 259 households falling in the category, the $15,000 to $24,999 income range is the most frequent in Colquitt, accounting for 28.9% of all households. In contrast, only 13 households (1.5%) fall into the less than $10,000 income bracket, making it the least populous group.
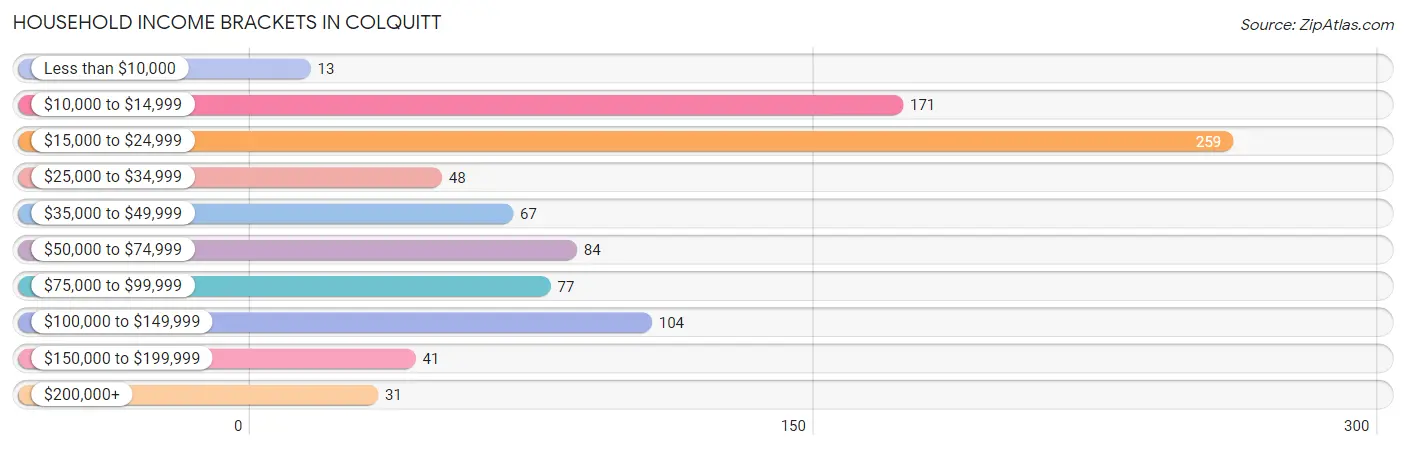
| Income Bracket | # Households | % Households |
| Less than $10,000 | 13 | 1.5% |
| $10,000 to $14,999 | 171 | 19.1% |
| $15,000 to $24,999 | 259 | 28.9% |
| $25,000 to $34,999 | 48 | 5.4% |
| $35,000 to $49,999 | 67 | 7.5% |
| $50,000 to $74,999 | 84 | 9.4% |
| $75,000 to $99,999 | 77 | 8.6% |
| $100,000 to $149,999 | 104 | 11.6% |
| $150,000 to $199,999 | 41 | 4.6% |
| $200,000+ | 31 | 3.5% |
Household Income by Householder Age in Colquitt
The median household income in Colquitt is $26,125, with the highest median household income of $86,202 found in the 45 to 64 years age bracket for the primary householder. A total of 291 households (32.5%) fall into this category. Meanwhile, the 65+ years age bracket for the primary householder has the lowest median household income of $18,346, with 239 households (26.7%) in this group.
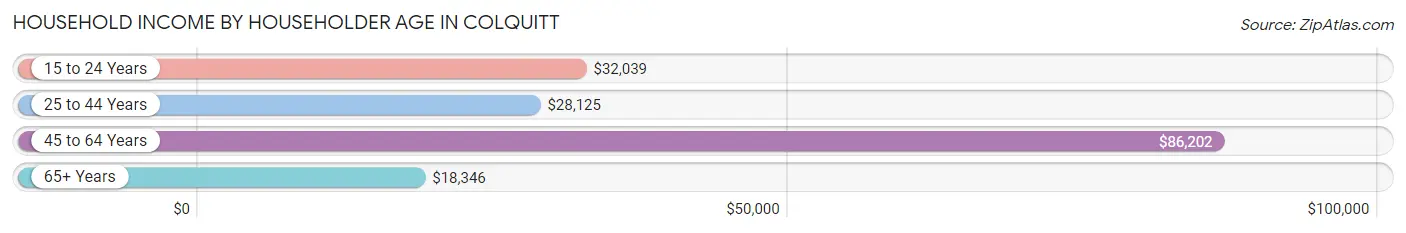
| Income Bracket | # Households | Median Income |
| 15 to 24 Years | 51 (5.7%) | $32,039 |
| 25 to 44 Years | 314 (35.1%) | $28,125 |
| 45 to 64 Years | 291 (32.5%) | $86,202 |
| 65+ Years | 239 (26.7%) | $18,346 |
| Total | 895 (100.0%) | $26,125 |
Poverty in Colquitt
Income Below Poverty by Sex and Age in Colquitt
With 37.5% poverty level for males and 44.9% for females among the residents of Colquitt, 75 year old and over males and under 5 year old females are the most vulnerable to poverty, with 31 males (62.0%) and 71 females (100.0%) in their respective age groups living below the poverty level.
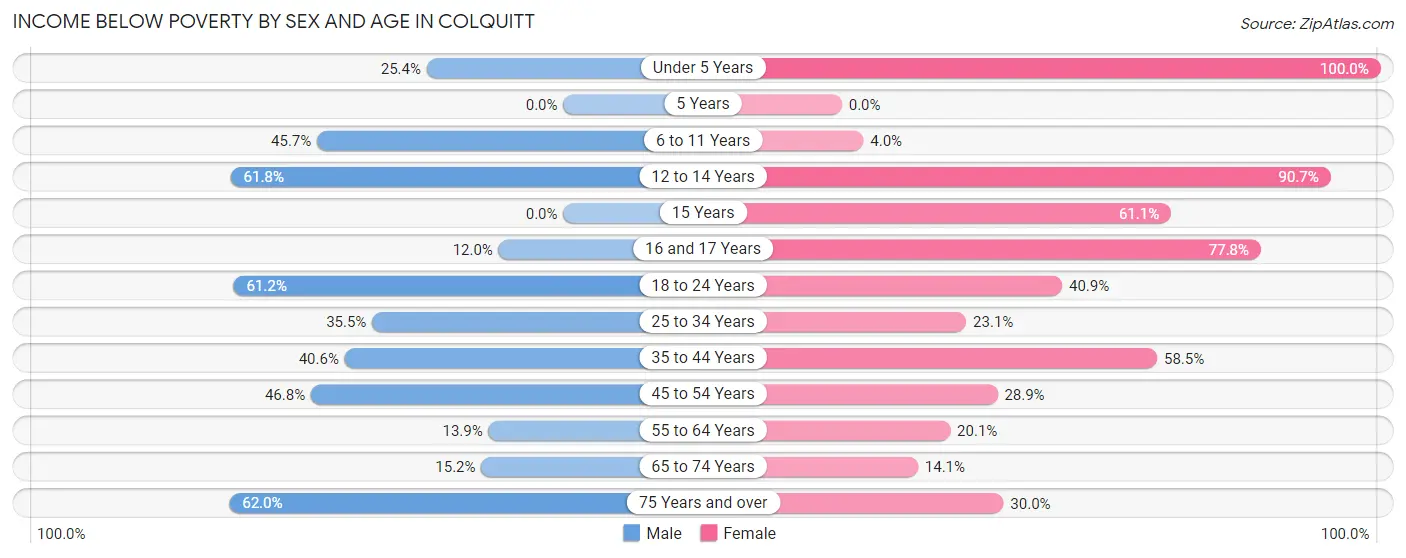
| Age Bracket | Male | Female |
| Under 5 Years | 18 (25.4%) | 71 (100.0%) |
| 5 Years | 0 (0.0%) | 0 (0.0%) |
| 6 to 11 Years | 32 (45.7%) | 1 (4.0%) |
| 12 to 14 Years | 42 (61.8%) | 88 (90.7%) |
| 15 Years | 0 (0.0%) | 22 (61.1%) |
| 16 and 17 Years | 3 (12.0%) | 21 (77.8%) |
| 18 to 24 Years | 60 (61.2%) | 65 (40.9%) |
| 25 to 34 Years | 22 (35.5%) | 18 (23.1%) |
| 35 to 44 Years | 28 (40.6%) | 141 (58.5%) |
| 45 to 54 Years | 37 (46.8%) | 13 (28.9%) |
| 55 to 64 Years | 20 (13.9%) | 36 (20.1%) |
| 65 to 74 Years | 7 (15.2%) | 12 (14.1%) |
| 75 Years and over | 31 (62.0%) | 39 (30.0%) |
| Total | 300 (37.5%) | 527 (44.9%) |
Income Above Poverty by Sex and Age in Colquitt
According to the poverty statistics in Colquitt, males aged 5 years and females aged 6 to 11 years are the age groups that are most secure financially, with 100.0% of males and 96.0% of females in these age groups living above the poverty line.
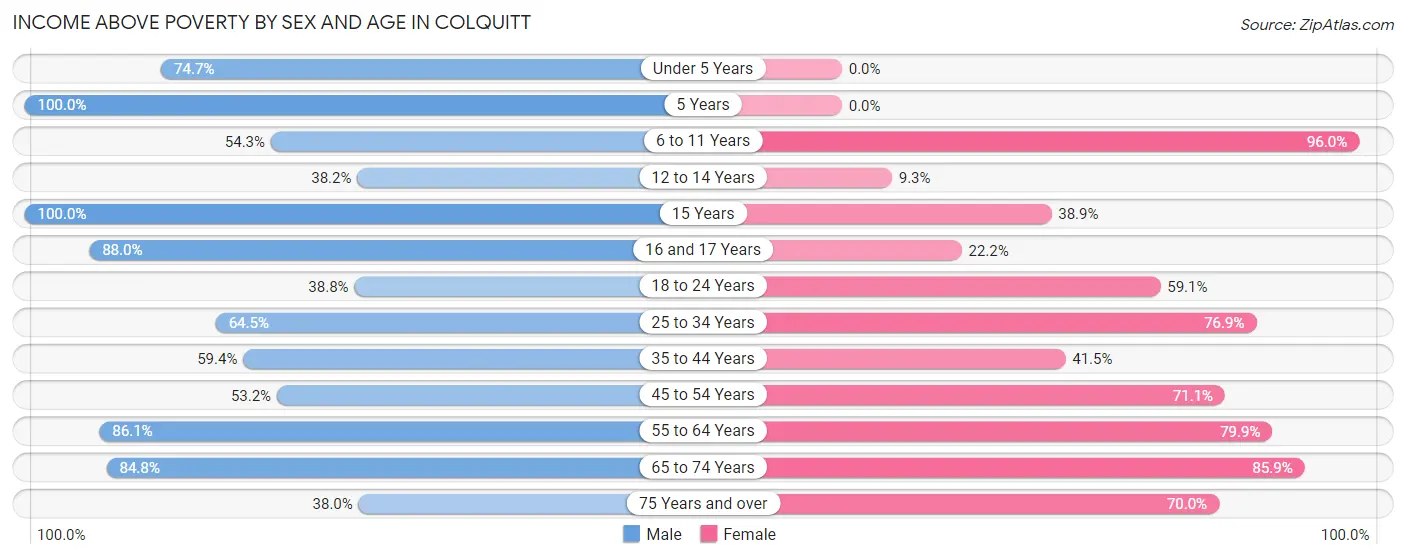
| Age Bracket | Male | Female |
| Under 5 Years | 53 (74.7%) | 0 (0.0%) |
| 5 Years | 5 (100.0%) | 0 (0.0%) |
| 6 to 11 Years | 38 (54.3%) | 24 (96.0%) |
| 12 to 14 Years | 26 (38.2%) | 9 (9.3%) |
| 15 Years | 13 (100.0%) | 14 (38.9%) |
| 16 and 17 Years | 22 (88.0%) | 6 (22.2%) |
| 18 to 24 Years | 38 (38.8%) | 94 (59.1%) |
| 25 to 34 Years | 40 (64.5%) | 60 (76.9%) |
| 35 to 44 Years | 41 (59.4%) | 100 (41.5%) |
| 45 to 54 Years | 42 (53.2%) | 32 (71.1%) |
| 55 to 64 Years | 124 (86.1%) | 143 (79.9%) |
| 65 to 74 Years | 39 (84.8%) | 73 (85.9%) |
| 75 Years and over | 19 (38.0%) | 91 (70.0%) |
| Total | 500 (62.5%) | 646 (55.1%) |
Income Below Poverty Among Married-Couple Families in Colquitt
The poverty statistics for married-couple families in Colquitt show that 19.3% or 43 of the total 223 families live below the poverty line. Families with 1 or 2 children have the highest poverty rate of 50.0%, comprising of 43 families. On the other hand, families with no children have the lowest poverty rate of 0.0%, which includes 0 families.
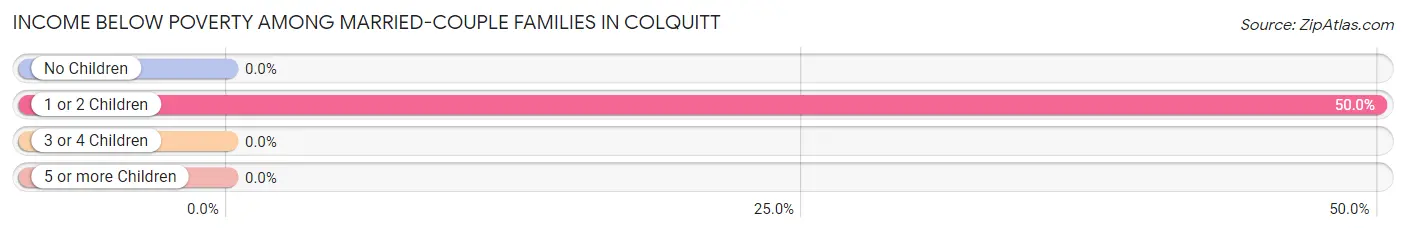
| Children | Above Poverty | Below Poverty |
| No Children | 137 (100.0%) | 0 (0.0%) |
| 1 or 2 Children | 43 (50.0%) | 43 (50.0%) |
| 3 or 4 Children | 0 (0.0%) | 0 (0.0%) |
| 5 or more Children | 0 (0.0%) | 0 (0.0%) |
| Total | 180 (80.7%) | 43 (19.3%) |
Income Below Poverty Among Single-Parent Households in Colquitt
According to the poverty data in Colquitt, 70.6% or 24 single-father households and 57.6% or 144 single-mother households are living below the poverty line. Among single-father households, those with 1 or 2 children have the highest poverty rate, with 20 households (90.9%) experiencing poverty. Likewise, among single-mother households, those with 3 or 4 children have the highest poverty rate, with 14 households (70.0%) falling below the poverty line.
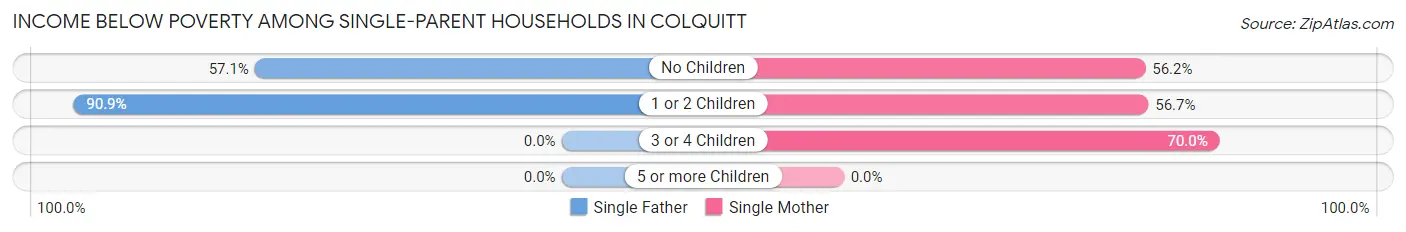
| Children | Single Father | Single Mother |
| No Children | 4 (57.1%) | 50 (56.2%) |
| 1 or 2 Children | 20 (90.9%) | 80 (56.7%) |
| 3 or 4 Children | 0 (0.0%) | 14 (70.0%) |
| 5 or more Children | 0 (0.0%) | 0 (0.0%) |
| Total | 24 (70.6%) | 144 (57.6%) |
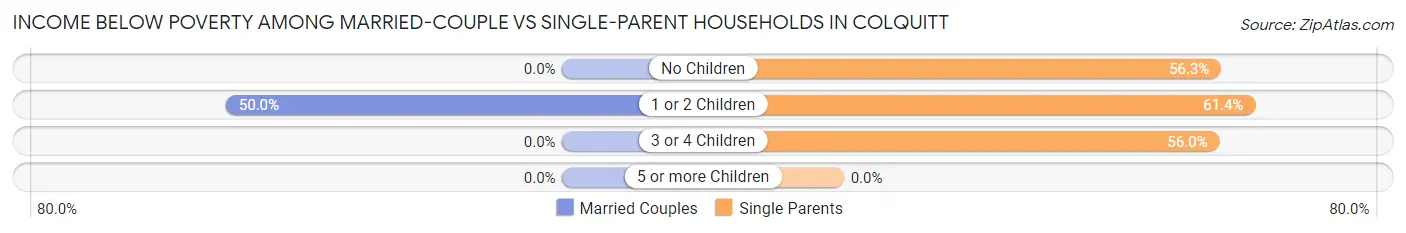
Income Below Poverty Among Married-Couple vs Single-Parent Households in Colquitt
The poverty data for Colquitt shows that 43 of the married-couple family households (19.3%) and 168 of the single-parent households (59.2%) are living below the poverty level. Within the married-couple family households, those with 1 or 2 children have the highest poverty rate, with 43 households (50.0%) falling below the poverty line. Among the single-parent households, those with 1 or 2 children have the highest poverty rate, with 100 household (61.4%) living below poverty.
| Children | Married-Couple Families | Single-Parent Households |
| No Children | 0 (0.0%) | 54 (56.2%) |
| 1 or 2 Children | 43 (50.0%) | 100 (61.4%) |
| 3 or 4 Children | 0 (0.0%) | 14 (56.0%) |
| 5 or more Children | 0 (0.0%) | 0 (0.0%) |
| Total | 43 (19.3%) | 168 (59.2%) |
Employment Characteristics in Colquitt
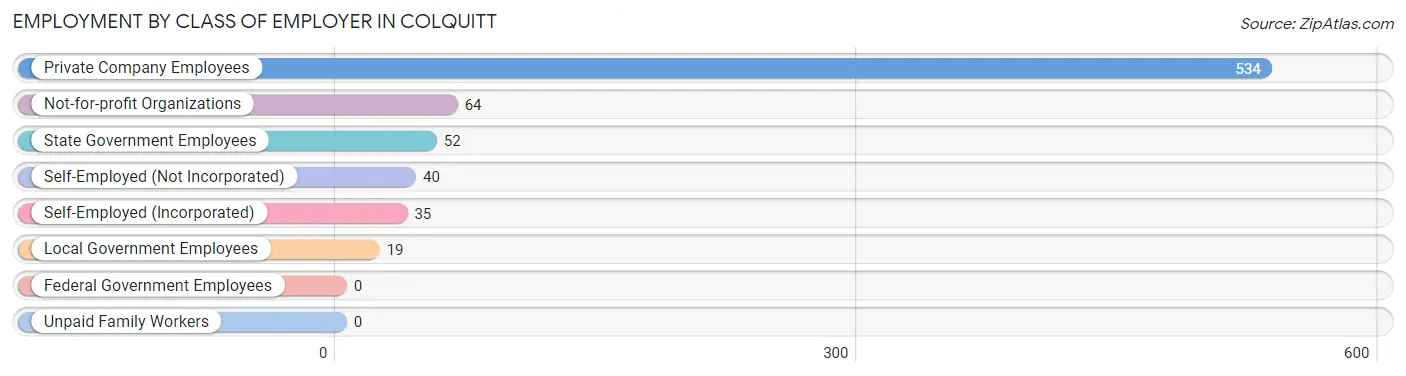
Employment by Class of Employer in Colquitt
Among the 744 employed individuals in Colquitt, private company employees (534 | 71.8%), not-for-profit organizations (64 | 8.6%), and state government employees (52 | 7.0%) make up the most common classes of employment.
| Employer Class | # Employees | % Employees |
| Private Company Employees | 534 | 71.8% |
| Self-Employed (Incorporated) | 35 | 4.7% |
| Self-Employed (Not Incorporated) | 40 | 5.4% |
| Not-for-profit Organizations | 64 | 8.6% |
| Local Government Employees | 19 | 2.5% |
| State Government Employees | 52 | 7.0% |
| Federal Government Employees | 0 | 0.0% |
| Unpaid Family Workers | 0 | 0.0% |
| Total | 744 | 100.0% |
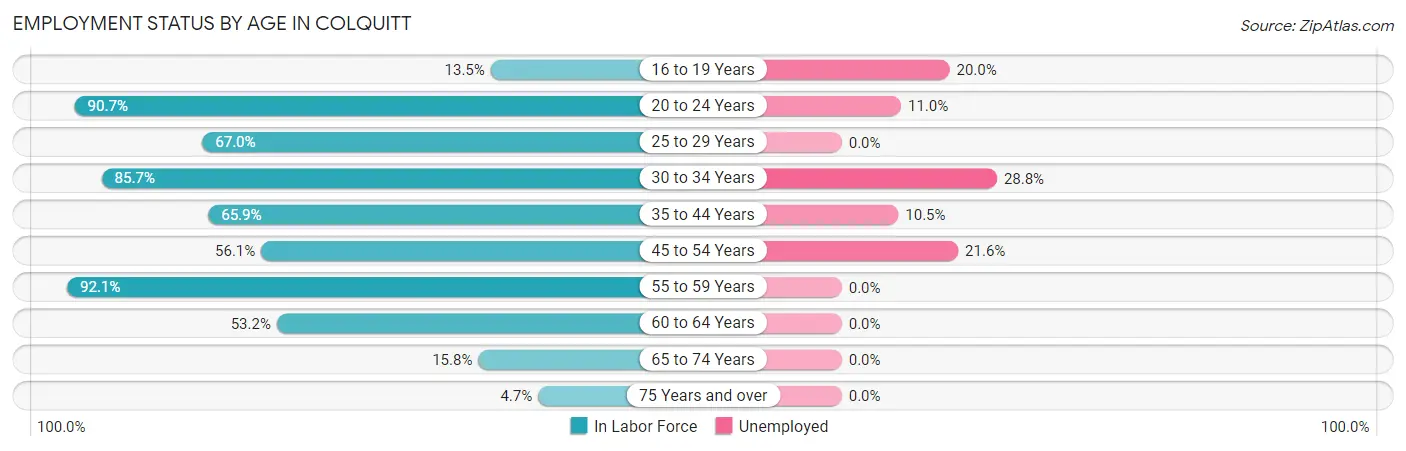
Employment Status by Age in Colquitt
According to the labor force statistics for Colquitt, out of the total population over 16 years of age (1,675), 50.8% or 851 individuals are in the labor force, with 9.0% or 77 of them unemployed. The age group with the highest labor force participation rate is 55 to 59 years, with 92.1% or 152 individuals in the labor force. Within the labor force, the 30 to 34 years age range has the highest percentage of unemployed individuals, with 28.8% or 19 of them being unemployed.
| Age Bracket | In Labor Force | Unemployed |
| 16 to 19 Years | 20 (13.5%) | 4 (20.0%) |
| 20 to 24 Years | 146 (90.7%) | 16 (11.0%) |
| 25 to 29 Years | 61 (67.0%) | 0 (0.0%) |
| 30 to 34 Years | 66 (85.7%) | 19 (28.8%) |
| 35 to 44 Years | 209 (65.9%) | 22 (10.5%) |
| 45 to 54 Years | 74 (56.1%) | 16 (21.6%) |
| 55 to 59 Years | 152 (92.1%) | 0 (0.0%) |
| 60 to 64 Years | 84 (53.2%) | 0 (0.0%) |
| 65 to 74 Years | 27 (15.8%) | 0 (0.0%) |
| 75 Years and over | 12 (4.7%) | 0 (0.0%) |
| Total | 851 (50.8%) | 77 (9.0%) |
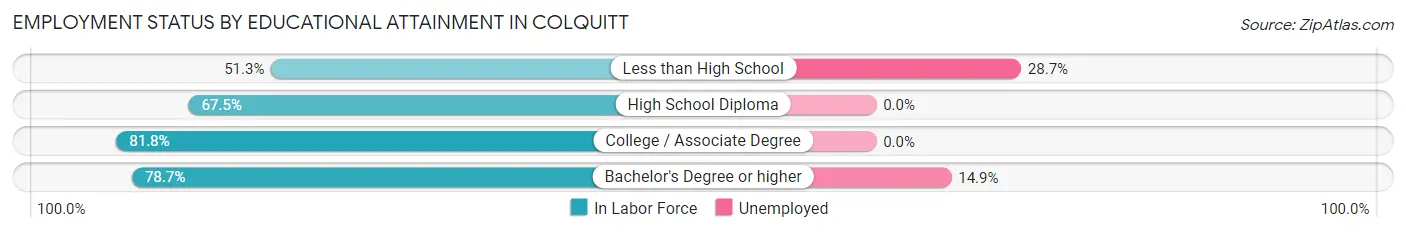
Employment Status by Educational Attainment in Colquitt
According to labor force statistics for Colquitt, 68.7% of individuals (646) out of the total population between 25 and 64 years of age (940) are in the labor force, with 8.8% or 57 of them being unemployed. The group with the highest labor force participation rate are those with the educational attainment of college / associate degree, with 81.8% or 166 individuals in the labor force. Within the labor force, individuals with less than high school education have the highest percentage of unemployment, with 28.7% or 35 of them being unemployed.
| Educational Attainment | In Labor Force | Unemployed |
| Less than High School | 122 (51.3%) | 68 (28.7%) |
| High School Diploma | 210 (67.5%) | 0 (0.0%) |
| College / Associate Degree | 166 (81.8%) | 0 (0.0%) |
| Bachelor's Degree or higher | 148 (78.7%) | 28 (14.9%) |
| Total | 646 (68.7%) | 83 (8.8%) |
Employment Occupations by Sex in Colquitt
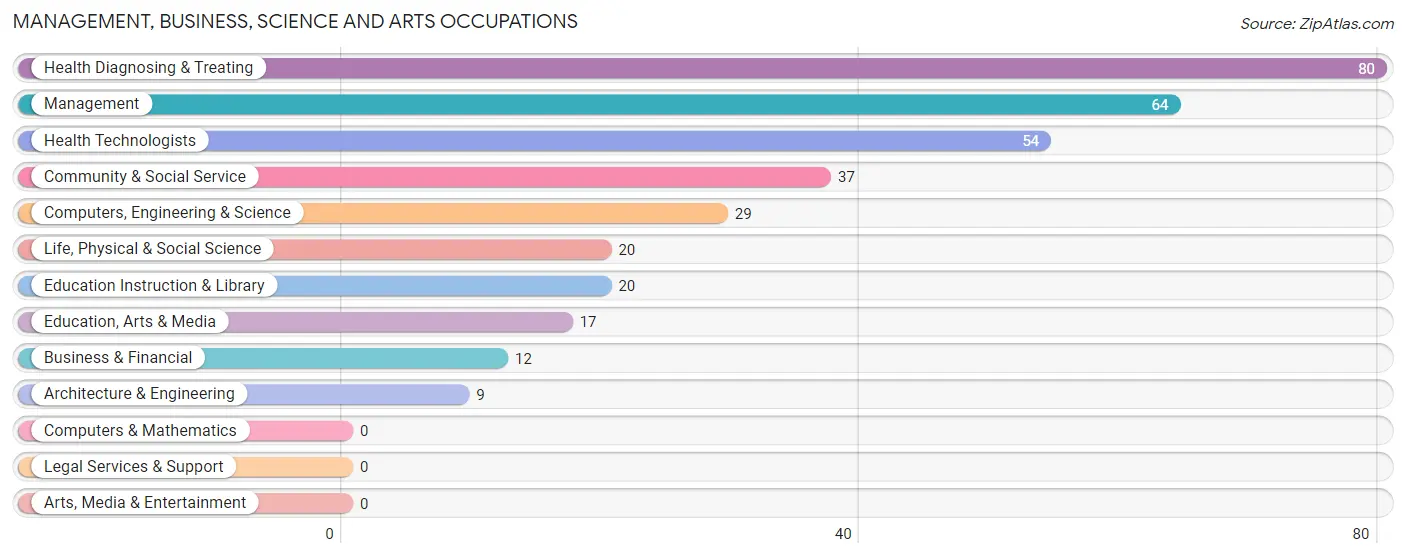
Management, Business, Science and Arts Occupations
The most common Management, Business, Science and Arts occupations in Colquitt are Health Diagnosing & Treating (80 | 10.3%), Management (64 | 8.3%), Health Technologists (54 | 7.0%), Community & Social Service (37 | 4.8%), and Computers, Engineering & Science (29 | 3.7%).
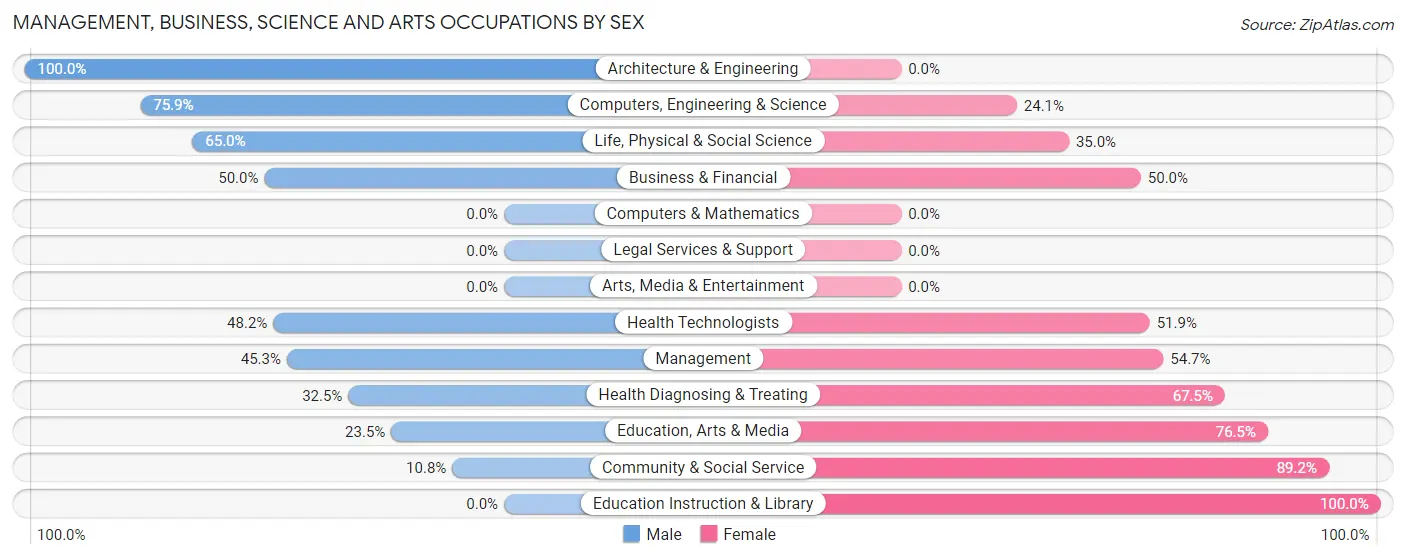
Management, Business, Science and Arts Occupations by Sex
Within the Management, Business, Science and Arts occupations in Colquitt, the most male-oriented occupations are Architecture & Engineering (100.0%), Computers, Engineering & Science (75.9%), and Life, Physical & Social Science (65.0%), while the most female-oriented occupations are Education Instruction & Library (100.0%), Community & Social Service (89.2%), and Education, Arts & Media (76.5%).
| Occupation | Male | Female |
| Management | 29 (45.3%) | 35 (54.7%) |
| Business & Financial | 6 (50.0%) | 6 (50.0%) |
| Computers, Engineering & Science | 22 (75.9%) | 7 (24.1%) |
| Computers & Mathematics | 0 (0.0%) | 0 (0.0%) |
| Architecture & Engineering | 9 (100.0%) | 0 (0.0%) |
| Life, Physical & Social Science | 13 (65.0%) | 7 (35.0%) |
| Community & Social Service | 4 (10.8%) | 33 (89.2%) |
| Education, Arts & Media | 4 (23.5%) | 13 (76.5%) |
| Legal Services & Support | 0 (0.0%) | 0 (0.0%) |
| Education Instruction & Library | 0 (0.0%) | 20 (100.0%) |
| Arts, Media & Entertainment | 0 (0.0%) | 0 (0.0%) |
| Health Diagnosing & Treating | 26 (32.5%) | 54 (67.5%) |
| Health Technologists | 26 (48.1%) | 28 (51.8%) |
| Total (Category) | 87 (39.2%) | 135 (60.8%) |
| Total (Overall) | 292 (37.7%) | 482 (62.3%) |
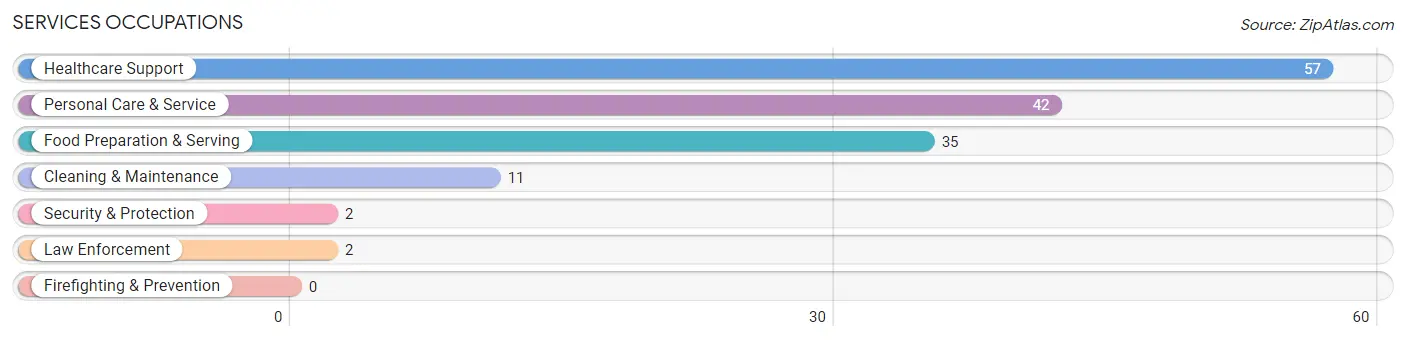
Services Occupations
The most common Services occupations in Colquitt are Healthcare Support (57 | 7.4%), Personal Care & Service (42 | 5.4%), Food Preparation & Serving (35 | 4.5%), Cleaning & Maintenance (11 | 1.4%), and Security & Protection (2 | 0.3%).
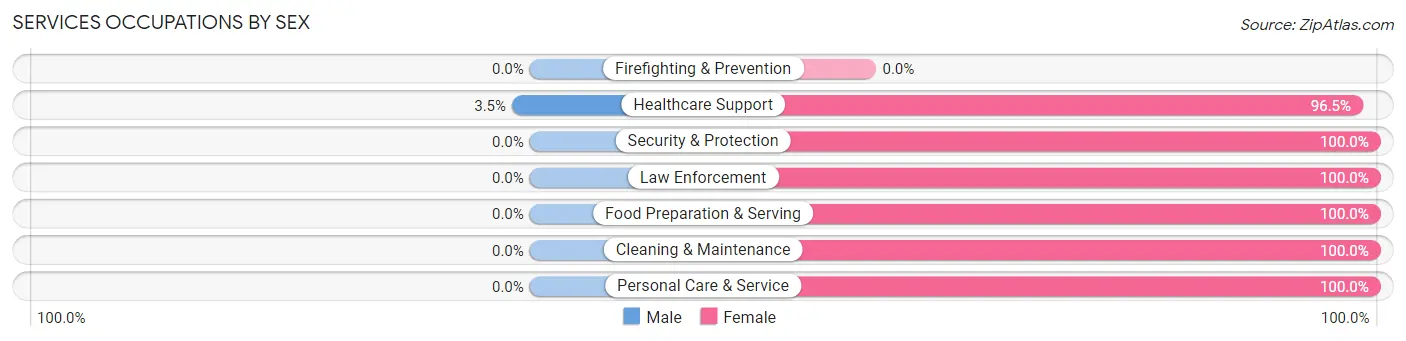
Services Occupations by Sex
| Occupation | Male | Female |
| Healthcare Support | 2 (3.5%) | 55 (96.5%) |
| Security & Protection | 0 (0.0%) | 2 (100.0%) |
| Firefighting & Prevention | 0 (0.0%) | 0 (0.0%) |
| Law Enforcement | 0 (0.0%) | 2 (100.0%) |
| Food Preparation & Serving | 0 (0.0%) | 35 (100.0%) |
| Cleaning & Maintenance | 0 (0.0%) | 11 (100.0%) |
| Personal Care & Service | 0 (0.0%) | 42 (100.0%) |
| Total (Category) | 2 (1.4%) | 145 (98.6%) |
| Total (Overall) | 292 (37.7%) | 482 (62.3%) |
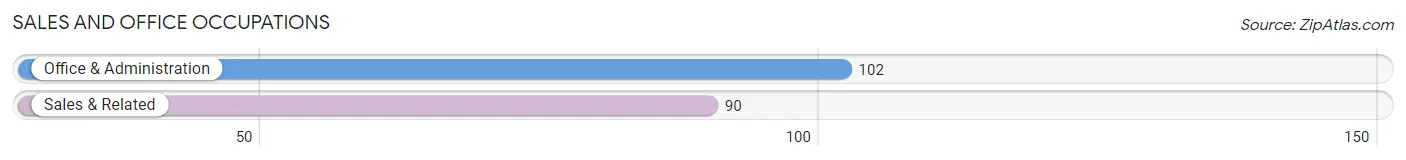
Sales and Office Occupations
The most common Sales and Office occupations in Colquitt are Office & Administration (102 | 13.2%), and Sales & Related (90 | 11.6%).
Sales and Office Occupations by Sex
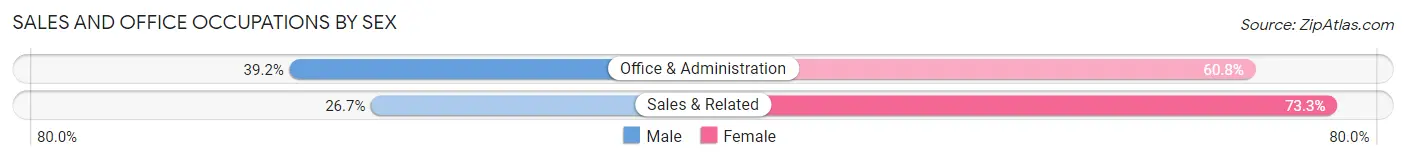
| Occupation | Male | Female |
| Sales & Related | 24 (26.7%) | 66 (73.3%) |
| Office & Administration | 40 (39.2%) | 62 (60.8%) |
| Total (Category) | 64 (33.3%) | 128 (66.7%) |
| Total (Overall) | 292 (37.7%) | 482 (62.3%) |
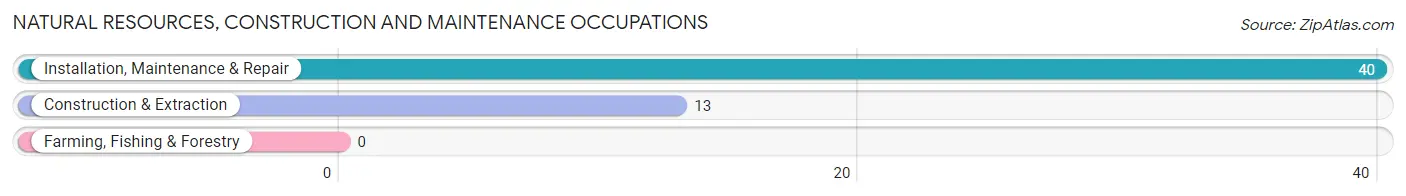
Natural Resources, Construction and Maintenance Occupations
The most common Natural Resources, Construction and Maintenance occupations in Colquitt are Installation, Maintenance & Repair (40 | 5.2%), and Construction & Extraction (13 | 1.7%).
Natural Resources, Construction and Maintenance Occupations by Sex
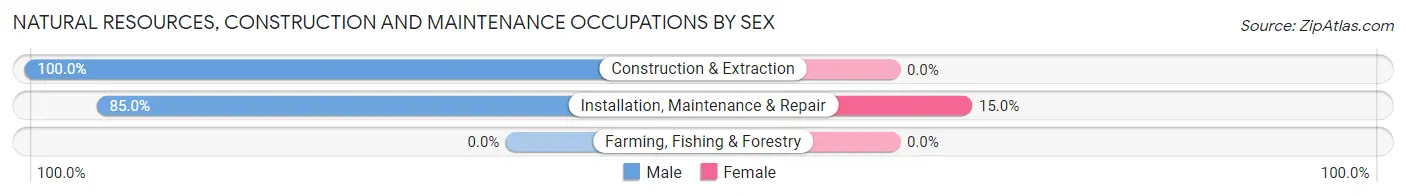
| Occupation | Male | Female |
| Farming, Fishing & Forestry | 0 (0.0%) | 0 (0.0%) |
| Construction & Extraction | 13 (100.0%) | 0 (0.0%) |
| Installation, Maintenance & Repair | 34 (85.0%) | 6 (15.0%) |
| Total (Category) | 47 (88.7%) | 6 (11.3%) |
| Total (Overall) | 292 (37.7%) | 482 (62.3%) |
Production, Transportation and Moving Occupations
The most common Production, Transportation and Moving occupations in Colquitt are Production (86 | 11.1%), Material Moving (64 | 8.3%), and Transportation (10 | 1.3%).
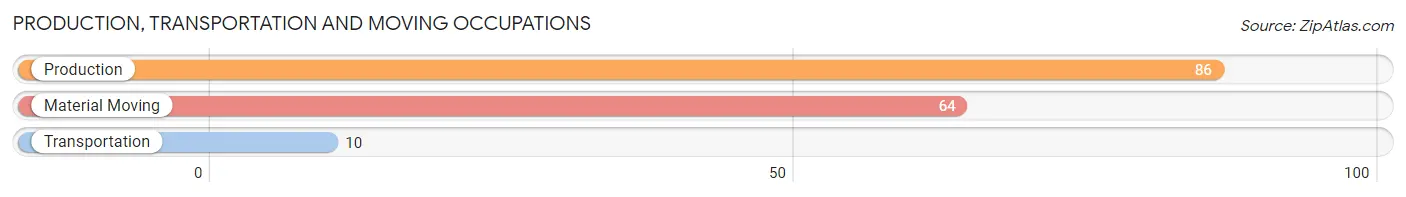
Production, Transportation and Moving Occupations by Sex
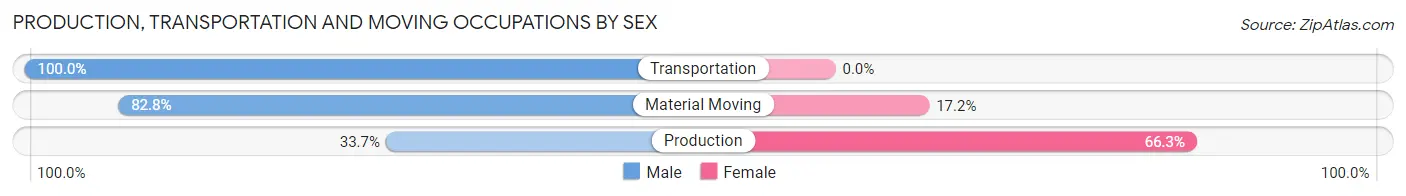
| Occupation | Male | Female |
| Production | 29 (33.7%) | 57 (66.3%) |
| Transportation | 10 (100.0%) | 0 (0.0%) |
| Material Moving | 53 (82.8%) | 11 (17.2%) |
| Total (Category) | 92 (57.5%) | 68 (42.5%) |
| Total (Overall) | 292 (37.7%) | 482 (62.3%) |
Employment Industries by Sex in Colquitt
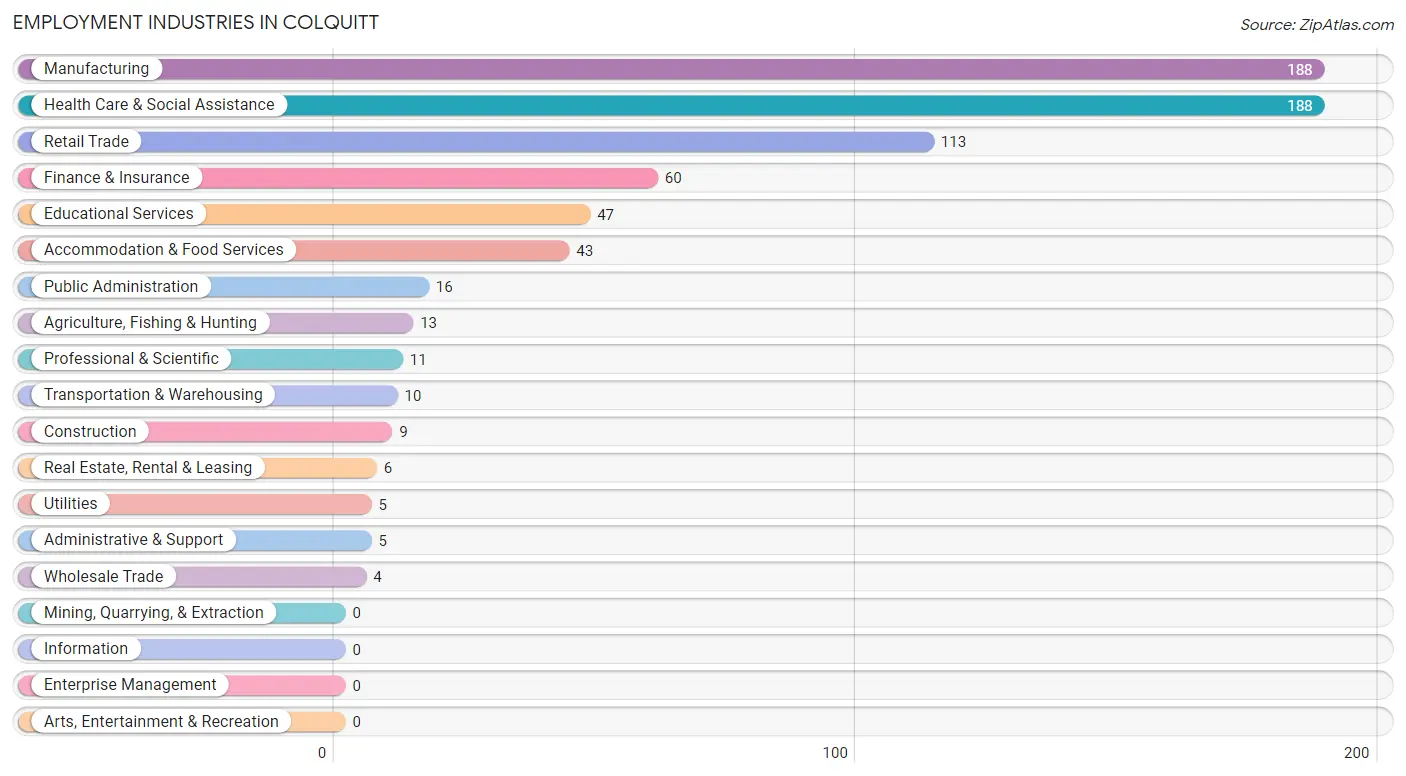
Employment Industries in Colquitt
The major employment industries in Colquitt include Manufacturing (188 | 24.3%), Health Care & Social Assistance (188 | 24.3%), Retail Trade (113 | 14.6%), Finance & Insurance (60 | 7.7%), and Educational Services (47 | 6.1%).
Employment Industries by Sex in Colquitt
The Colquitt industries that see more men than women are Agriculture, Fishing & Hunting (100.0%), Construction (100.0%), and Wholesale Trade (100.0%), whereas the industries that tend to have a higher number of women are Utilities (100.0%), Professional & Scientific (100.0%), and Educational Services (100.0%).
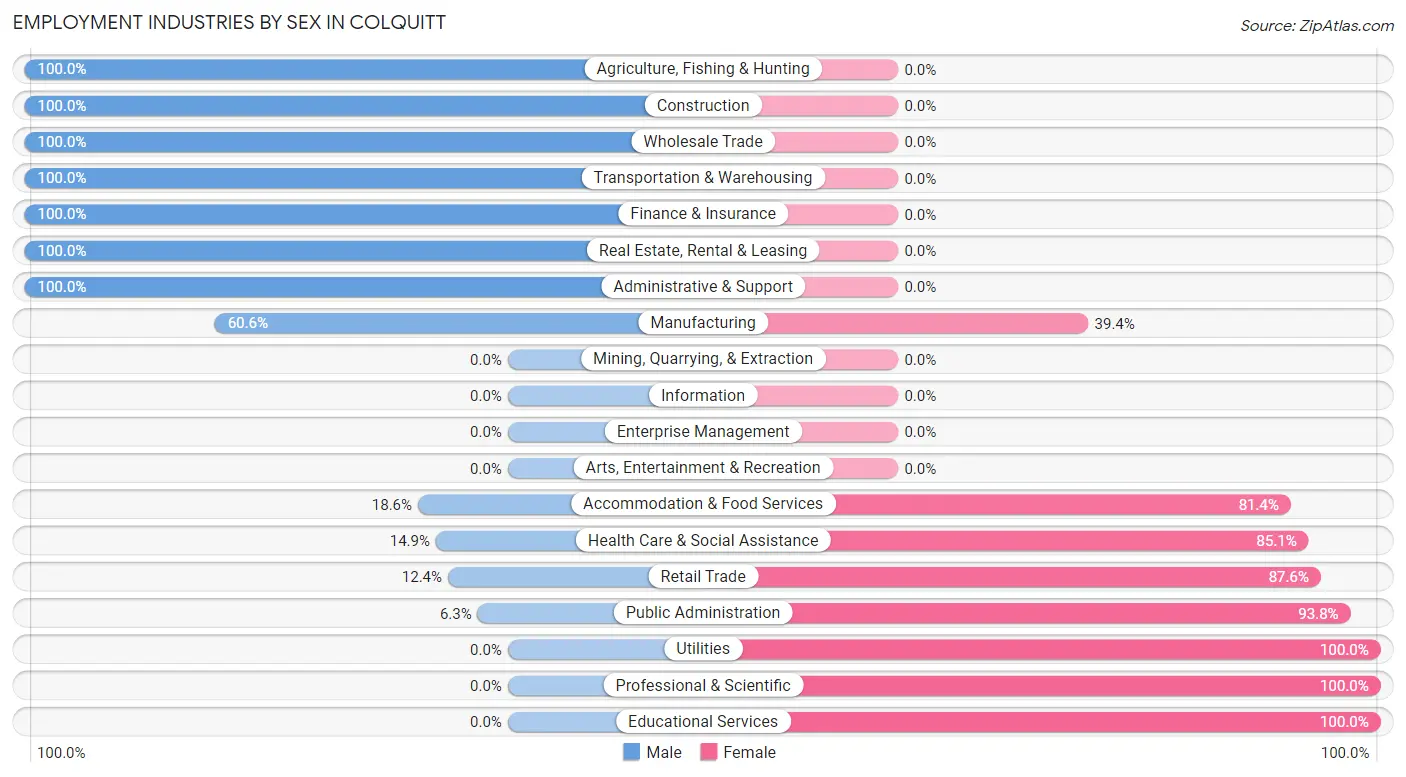
| Industry | Male | Female |
| Agriculture, Fishing & Hunting | 13 (100.0%) | 0 (0.0%) |
| Mining, Quarrying, & Extraction | 0 (0.0%) | 0 (0.0%) |
| Construction | 9 (100.0%) | 0 (0.0%) |
| Manufacturing | 114 (60.6%) | 74 (39.4%) |
| Wholesale Trade | 4 (100.0%) | 0 (0.0%) |
| Retail Trade | 14 (12.4%) | 99 (87.6%) |
| Transportation & Warehousing | 10 (100.0%) | 0 (0.0%) |
| Utilities | 0 (0.0%) | 5 (100.0%) |
| Information | 0 (0.0%) | 0 (0.0%) |
| Finance & Insurance | 60 (100.0%) | 0 (0.0%) |
| Real Estate, Rental & Leasing | 6 (100.0%) | 0 (0.0%) |
| Professional & Scientific | 0 (0.0%) | 11 (100.0%) |
| Enterprise Management | 0 (0.0%) | 0 (0.0%) |
| Administrative & Support | 5 (100.0%) | 0 (0.0%) |
| Educational Services | 0 (0.0%) | 47 (100.0%) |
| Health Care & Social Assistance | 28 (14.9%) | 160 (85.1%) |
| Arts, Entertainment & Recreation | 0 (0.0%) | 0 (0.0%) |
| Accommodation & Food Services | 8 (18.6%) | 35 (81.4%) |
| Public Administration | 1 (6.2%) | 15 (93.8%) |
| Total | 292 (37.7%) | 482 (62.3%) |
Education in Colquitt
School Enrollment in Colquitt
The most common levels of schooling among the 440 students in Colquitt are high school (171 | 38.9%), middle school (157 | 35.7%), and elementary school (40 | 9.1%).
| School Level | # Students | % Students |
| Nursery / Preschool | 24 | 5.4% |
| Kindergarten | 5 | 1.1% |
| Elementary School | 40 | 9.1% |
| Middle School | 157 | 35.7% |
| High School | 171 | 38.9% |
| College / Undergraduate | 37 | 8.4% |
| Graduate / Professional | 6 | 1.4% |
| Total | 440 | 100.0% |
School Enrollment by Age by Funding Source in Colquitt
Out of a total of 440 students who are enrolled in schools in Colquitt, 5 (1.1%) attend a private institution, while the remaining 435 (98.9%) are enrolled in public schools. The age group of 15 to 17 year olds has the highest likelihood of being enrolled in private schools, with 5 (5.0% in the age bracket) enrolled. Conversely, the age group of 3 to 4 year olds has the lowest likelihood of being enrolled in a private school, with 19 (100.0% in the age bracket) attending a public institution.
| Age Bracket | Public School | Private School |
| 3 to 4 Year Olds | 19 (100.0%) | 0 (0.0%) |
| 5 to 9 Year Old | 32 (100.0%) | 0 (0.0%) |
| 10 to 14 Year Olds | 210 (100.0%) | 0 (0.0%) |
| 15 to 17 Year Olds | 96 (95.1%) | 5 (5.0%) |
| 18 to 19 Year Olds | 35 (100.0%) | 0 (0.0%) |
| 20 to 24 Year Olds | 37 (100.0%) | 0 (0.0%) |
| 25 to 34 Year Olds | 6 (100.0%) | 0 (0.0%) |
| 35 Years and over | 0 (0.0%) | 0 (0.0%) |
| Total | 435 (98.9%) | 5 (1.1%) |
Educational Attainment by Field of Study in Colquitt
Science & technology (97 | 38.3%), education (39 | 15.4%), business (27 | 10.7%), arts & humanities (23 | 9.1%), and psychology (17 | 6.7%) are the most common fields of study among 253 individuals in Colquitt who have obtained a bachelor's degree or higher.
| Field of Study | # Graduates | % Graduates |
| Computers & Mathematics | 0 | 0.0% |
| Bio, Nature & Agricultural | 8 | 3.2% |
| Physical & Health Sciences | 5 | 2.0% |
| Psychology | 17 | 6.7% |
| Social Sciences | 11 | 4.3% |
| Engineering | 5 | 2.0% |
| Multidisciplinary Studies | 6 | 2.4% |
| Science & Technology | 97 | 38.3% |
| Business | 27 | 10.7% |
| Education | 39 | 15.4% |
| Literature & Languages | 0 | 0.0% |
| Liberal Arts & History | 15 | 5.9% |
| Visual & Performing Arts | 0 | 0.0% |
| Communications | 0 | 0.0% |
| Arts & Humanities | 23 | 9.1% |
| Total | 253 | 100.0% |
Transportation & Commute in Colquitt
Vehicle Availability by Sex in Colquitt
The most prevalent vehicle ownership categories in Colquitt are males with 3 vehicles (80, accounting for 27.8%) and females with 3 vehicles (56, making up 17.8%).
| Vehicles Available | Male | Female |
| No Vehicle | 41 (14.2%) | 33 (7.3%) |
| 1 Vehicle | 75 (26.0%) | 209 (46.4%) |
| 2 Vehicles | 68 (23.6%) | 105 (23.3%) |
| 3 Vehicles | 80 (27.8%) | 56 (12.4%) |
| 4 Vehicles | 24 (8.3%) | 47 (10.4%) |
| 5 or more Vehicles | 0 (0.0%) | 0 (0.0%) |
| Total | 288 (100.0%) | 450 (100.0%) |
Commute Time in Colquitt
The most frequently occuring commute durations in Colquitt are 20 to 24 minutes (115 commuters, 16.9%), 10 to 14 minutes (111 commuters, 16.3%), and less than 5 minutes (92 commuters, 13.5%).
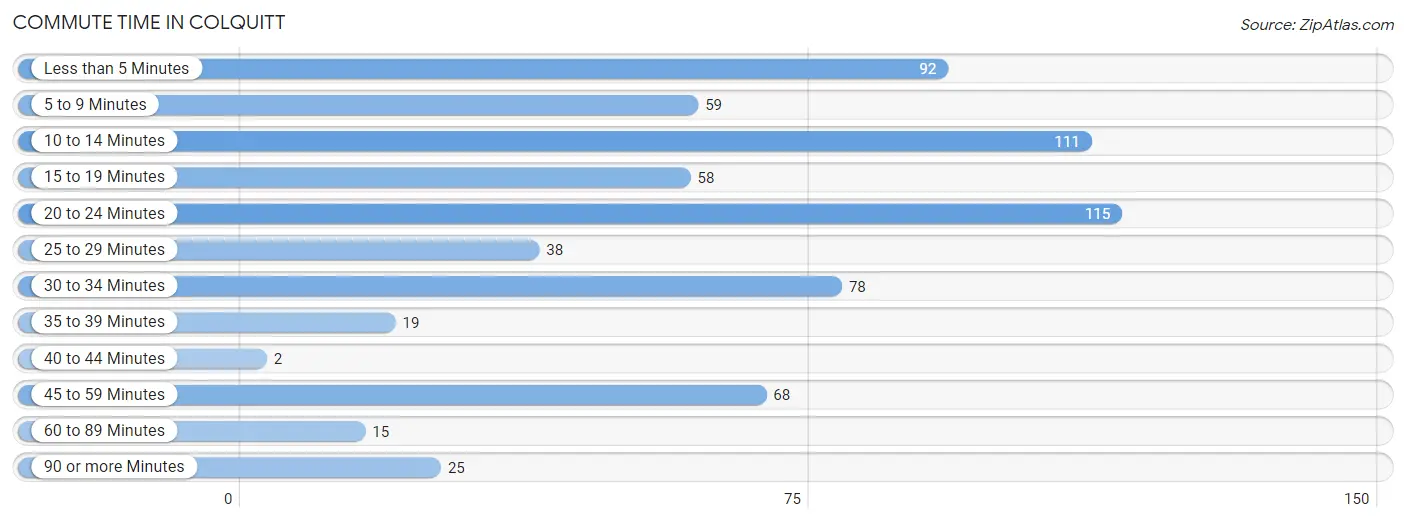
| Commute Time | # Commuters | % Commuters |
| Less than 5 Minutes | 92 | 13.5% |
| 5 to 9 Minutes | 59 | 8.7% |
| 10 to 14 Minutes | 111 | 16.3% |
| 15 to 19 Minutes | 58 | 8.5% |
| 20 to 24 Minutes | 115 | 16.9% |
| 25 to 29 Minutes | 38 | 5.6% |
| 30 to 34 Minutes | 78 | 11.5% |
| 35 to 39 Minutes | 19 | 2.8% |
| 40 to 44 Minutes | 2 | 0.3% |
| 45 to 59 Minutes | 68 | 10.0% |
| 60 to 89 Minutes | 15 | 2.2% |
| 90 or more Minutes | 25 | 3.7% |
Commute Time by Sex in Colquitt
The most common commute times in Colquitt are 10 to 14 minutes (59 commuters, 23.4%) for males and 20 to 24 minutes (90 commuters, 21.0%) for females.
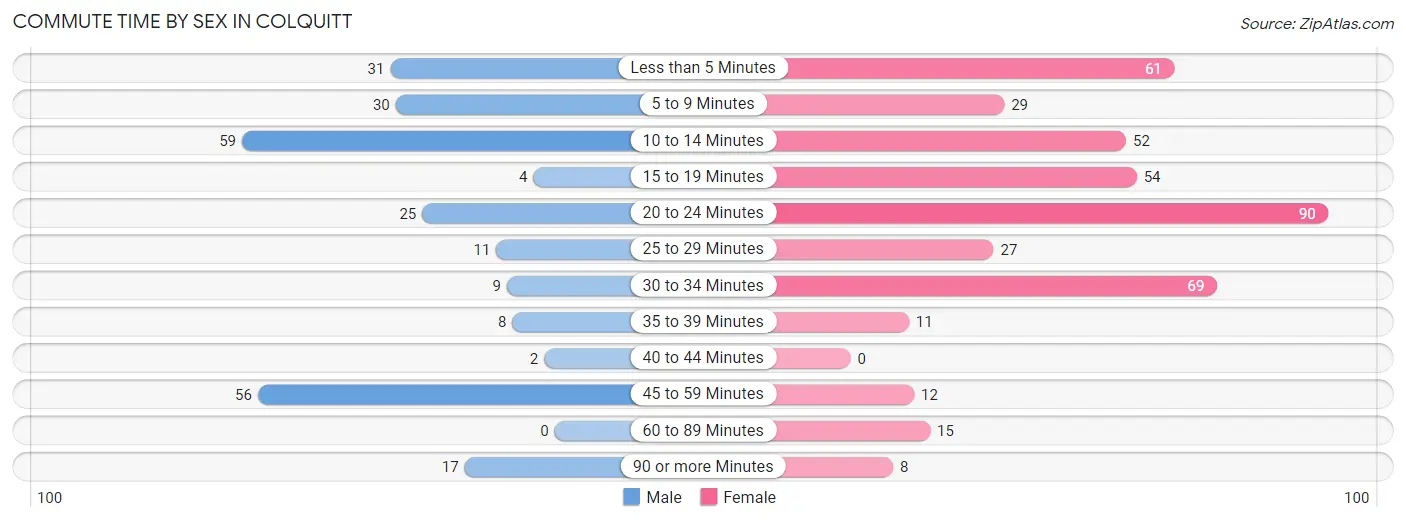
| Commute Time | Male | Female |
| Less than 5 Minutes | 31 (12.3%) | 61 (14.2%) |
| 5 to 9 Minutes | 30 (11.9%) | 29 (6.8%) |
| 10 to 14 Minutes | 59 (23.4%) | 52 (12.1%) |
| 15 to 19 Minutes | 4 (1.6%) | 54 (12.6%) |
| 20 to 24 Minutes | 25 (9.9%) | 90 (21.0%) |
| 25 to 29 Minutes | 11 (4.4%) | 27 (6.3%) |
| 30 to 34 Minutes | 9 (3.6%) | 69 (16.1%) |
| 35 to 39 Minutes | 8 (3.2%) | 11 (2.6%) |
| 40 to 44 Minutes | 2 (0.8%) | 0 (0.0%) |
| 45 to 59 Minutes | 56 (22.2%) | 12 (2.8%) |
| 60 to 89 Minutes | 0 (0.0%) | 15 (3.5%) |
| 90 or more Minutes | 17 (6.8%) | 8 (1.9%) |
Time of Departure to Work by Sex in Colquitt
The most frequent times of departure to work in Colquitt are 7:30 AM to 7:59 AM (62, 24.6%) for males and 7:30 AM to 7:59 AM (94, 22.0%) for females.
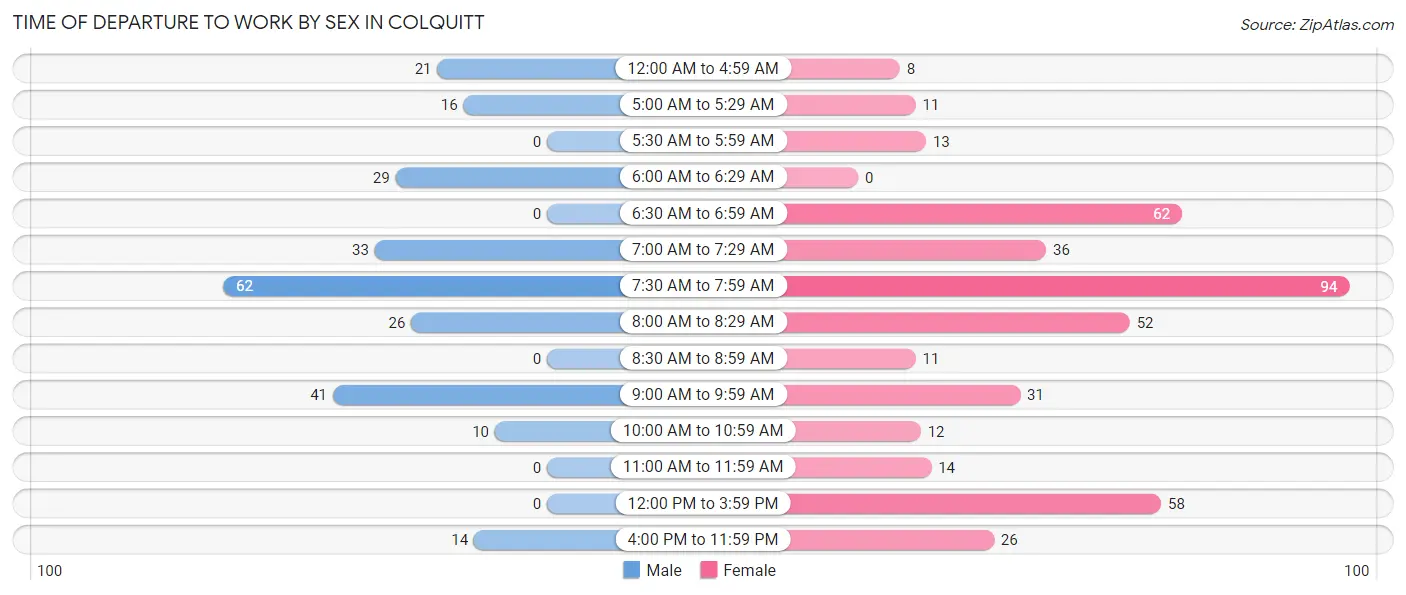
| Time of Departure | Male | Female |
| 12:00 AM to 4:59 AM | 21 (8.3%) | 8 (1.9%) |
| 5:00 AM to 5:29 AM | 16 (6.4%) | 11 (2.6%) |
| 5:30 AM to 5:59 AM | 0 (0.0%) | 13 (3.0%) |
| 6:00 AM to 6:29 AM | 29 (11.5%) | 0 (0.0%) |
| 6:30 AM to 6:59 AM | 0 (0.0%) | 62 (14.5%) |
| 7:00 AM to 7:29 AM | 33 (13.1%) | 36 (8.4%) |
| 7:30 AM to 7:59 AM | 62 (24.6%) | 94 (22.0%) |
| 8:00 AM to 8:29 AM | 26 (10.3%) | 52 (12.1%) |
| 8:30 AM to 8:59 AM | 0 (0.0%) | 11 (2.6%) |
| 9:00 AM to 9:59 AM | 41 (16.3%) | 31 (7.2%) |
| 10:00 AM to 10:59 AM | 10 (4.0%) | 12 (2.8%) |
| 11:00 AM to 11:59 AM | 0 (0.0%) | 14 (3.3%) |
| 12:00 PM to 3:59 PM | 0 (0.0%) | 58 (13.6%) |
| 4:00 PM to 11:59 PM | 14 (5.6%) | 26 (6.1%) |
| Total | 252 (100.0%) | 428 (100.0%) |
Housing Occupancy in Colquitt
Occupancy by Ownership in Colquitt
Of the total 895 dwellings in Colquitt, owner-occupied units account for 392 (43.8%), while renter-occupied units make up 503 (56.2%).
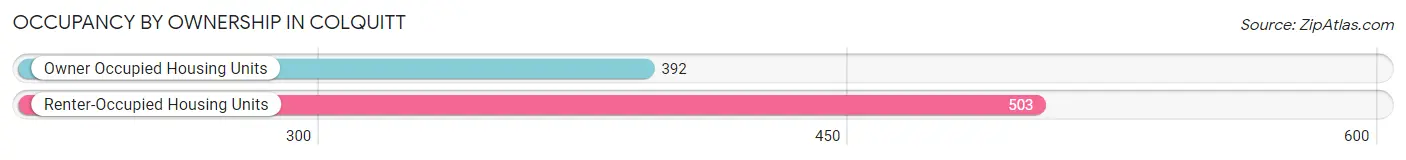
| Occupancy | # Housing Units | % Housing Units |
| Owner Occupied Housing Units | 392 | 43.8% |
| Renter-Occupied Housing Units | 503 | 56.2% |
| Total Occupied Housing Units | 895 | 100.0% |
Occupancy by Household Size in Colquitt
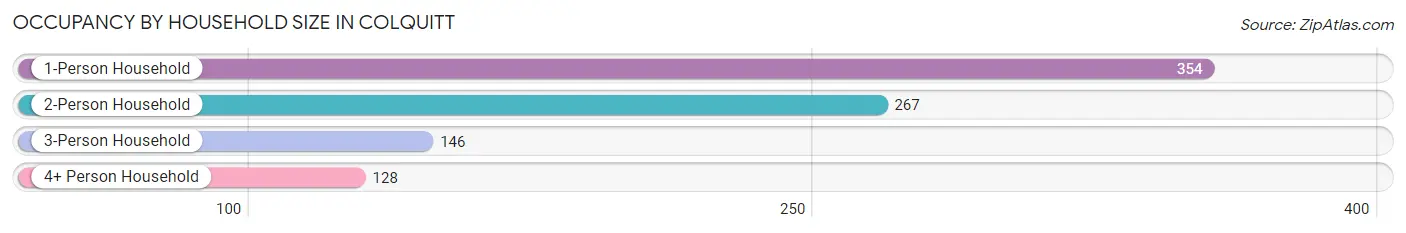
| Household Size | # Housing Units | % Housing Units |
| 1-Person Household | 354 | 39.6% |
| 2-Person Household | 267 | 29.8% |
| 3-Person Household | 146 | 16.3% |
| 4+ Person Household | 128 | 14.3% |
| Total Housing Units | 895 | 100.0% |
Occupancy by Ownership by Household Size in Colquitt
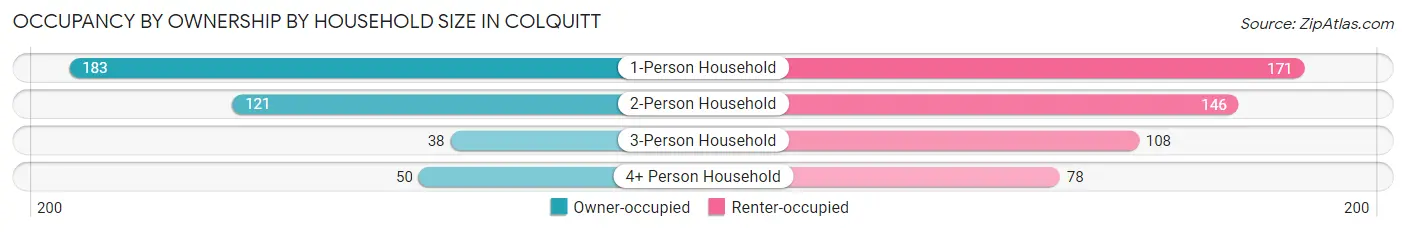
| Household Size | Owner-occupied | Renter-occupied |
| 1-Person Household | 183 (51.7%) | 171 (48.3%) |
| 2-Person Household | 121 (45.3%) | 146 (54.7%) |
| 3-Person Household | 38 (26.0%) | 108 (74.0%) |
| 4+ Person Household | 50 (39.1%) | 78 (60.9%) |
| Total Housing Units | 392 (43.8%) | 503 (56.2%) |
Occupancy by Educational Attainment in Colquitt
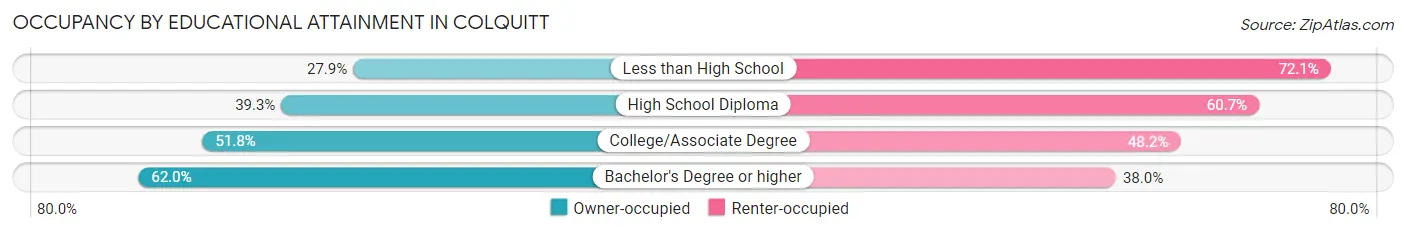
| Household Size | Owner-occupied | Renter-occupied |
| Less than High School | 72 (27.9%) | 186 (72.1%) |
| High School Diploma | 90 (39.3%) | 139 (60.7%) |
| College/Associate Degree | 116 (51.8%) | 108 (48.2%) |
| Bachelor's Degree or higher | 114 (62.0%) | 70 (38.0%) |
Occupancy by Age of Householder in Colquitt
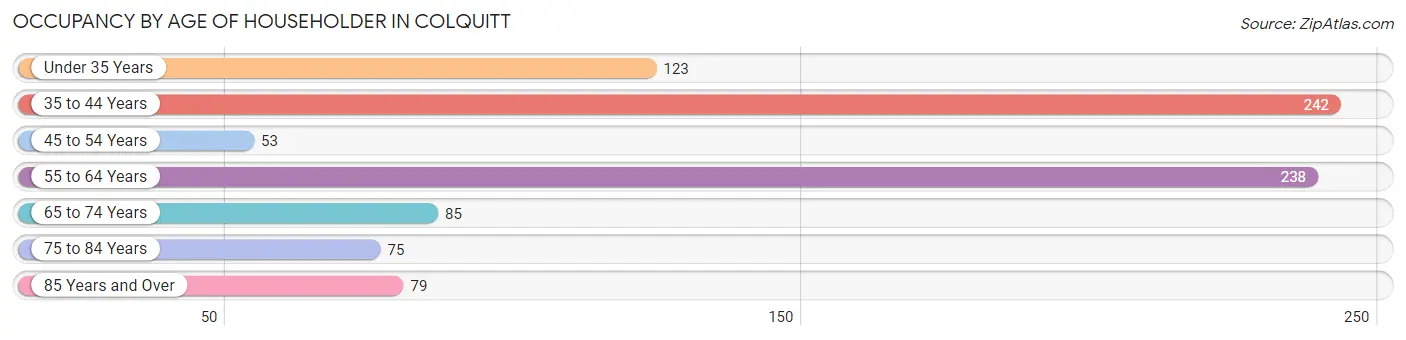
| Age Bracket | # Households | % Households |
| Under 35 Years | 123 | 13.7% |
| 35 to 44 Years | 242 | 27.0% |
| 45 to 54 Years | 53 | 5.9% |
| 55 to 64 Years | 238 | 26.6% |
| 65 to 74 Years | 85 | 9.5% |
| 75 to 84 Years | 75 | 8.4% |
| 85 Years and Over | 79 | 8.8% |
| Total | 895 | 100.0% |
Housing Finances in Colquitt
Median Income by Occupancy in Colquitt
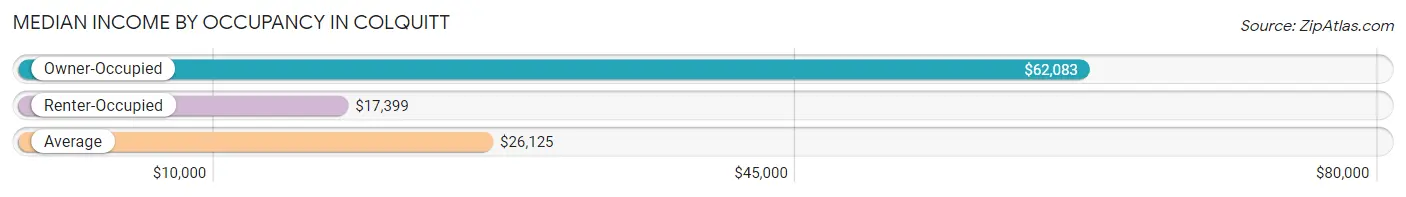
| Occupancy Type | # Households | Median Income |
| Owner-Occupied | 392 (43.8%) | $62,083 |
| Renter-Occupied | 503 (56.2%) | $17,399 |
| Average | 895 (100.0%) | $26,125 |
Occupancy by Householder Income Bracket in Colquitt
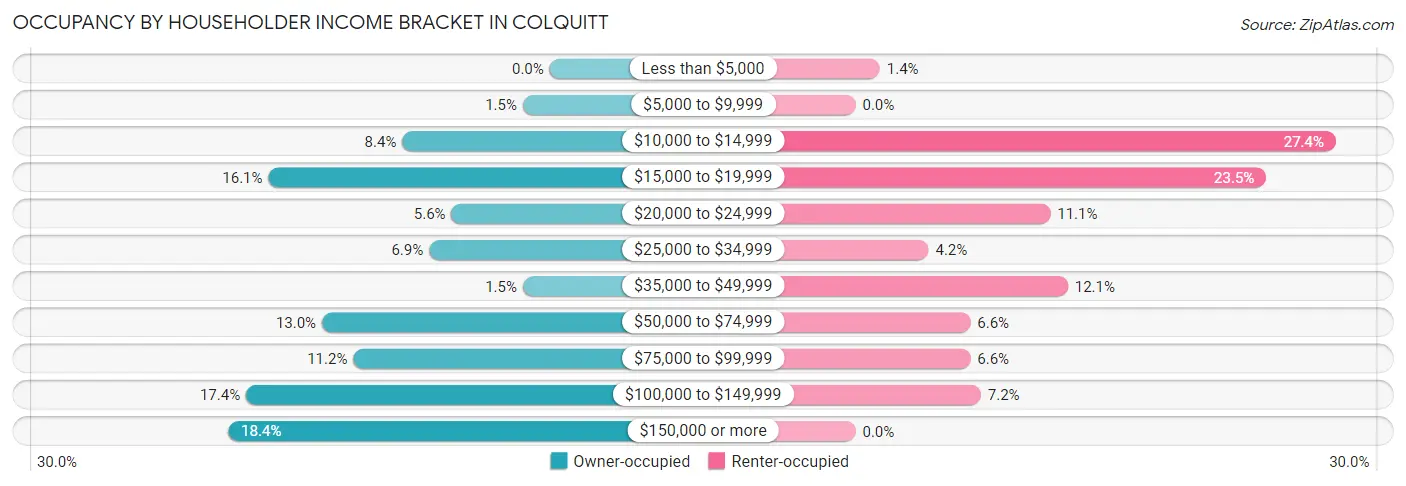
| Income Bracket | Owner-occupied | Renter-occupied |
| Less than $5,000 | 0 (0.0%) | 7 (1.4%) |
| $5,000 to $9,999 | 6 (1.5%) | 0 (0.0%) |
| $10,000 to $14,999 | 33 (8.4%) | 138 (27.4%) |
| $15,000 to $19,999 | 63 (16.1%) | 118 (23.5%) |
| $20,000 to $24,999 | 22 (5.6%) | 56 (11.1%) |
| $25,000 to $34,999 | 27 (6.9%) | 21 (4.2%) |
| $35,000 to $49,999 | 6 (1.5%) | 61 (12.1%) |
| $50,000 to $74,999 | 51 (13.0%) | 33 (6.6%) |
| $75,000 to $99,999 | 44 (11.2%) | 33 (6.6%) |
| $100,000 to $149,999 | 68 (17.3%) | 36 (7.2%) |
| $150,000 or more | 72 (18.4%) | 0 (0.0%) |
| Total | 392 (100.0%) | 503 (100.0%) |
Monthly Housing Cost Tiers in Colquitt
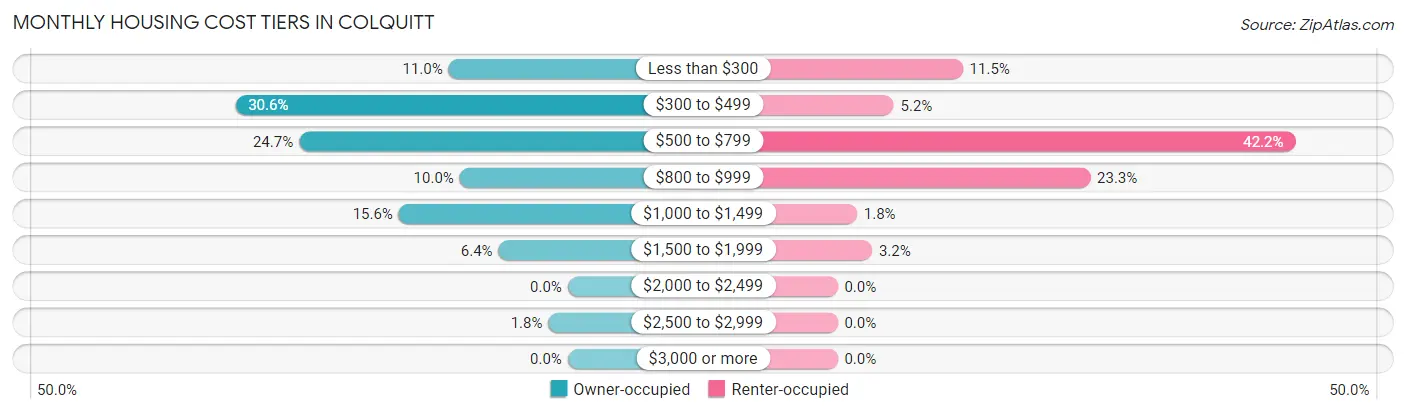
| Monthly Cost | Owner-occupied | Renter-occupied |
| Less than $300 | 43 (11.0%) | 58 (11.5%) |
| $300 to $499 | 120 (30.6%) | 26 (5.2%) |
| $500 to $799 | 97 (24.7%) | 212 (42.1%) |
| $800 to $999 | 39 (10.0%) | 117 (23.3%) |
| $1,000 to $1,499 | 61 (15.6%) | 9 (1.8%) |
| $1,500 to $1,999 | 25 (6.4%) | 16 (3.2%) |
| $2,000 to $2,499 | 0 (0.0%) | 0 (0.0%) |
| $2,500 to $2,999 | 7 (1.8%) | 0 (0.0%) |
| $3,000 or more | 0 (0.0%) | 0 (0.0%) |
| Total | 392 (100.0%) | 503 (100.0%) |
Physical Housing Characteristics in Colquitt
Housing Structures in Colquitt
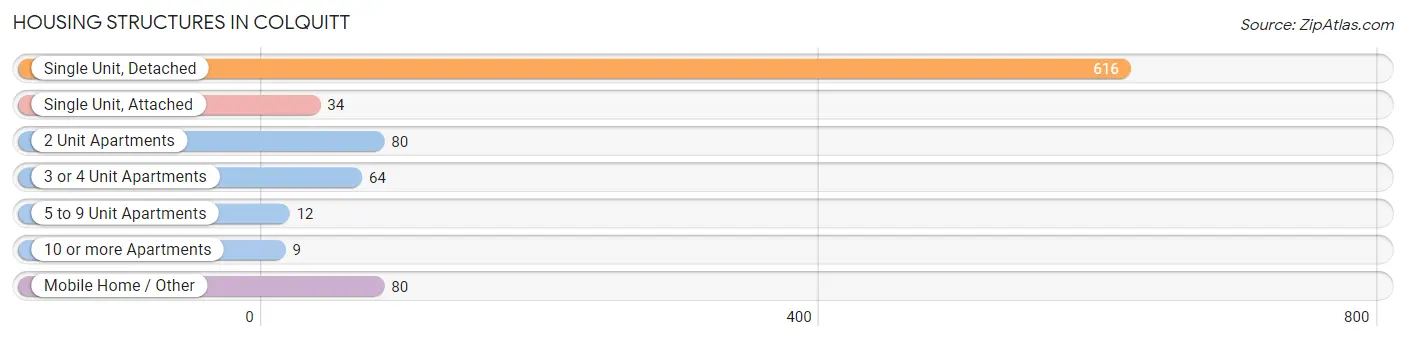
| Structure Type | # Housing Units | % Housing Units |
| Single Unit, Detached | 616 | 68.8% |
| Single Unit, Attached | 34 | 3.8% |
| 2 Unit Apartments | 80 | 8.9% |
| 3 or 4 Unit Apartments | 64 | 7.1% |
| 5 to 9 Unit Apartments | 12 | 1.3% |
| 10 or more Apartments | 9 | 1.0% |
| Mobile Home / Other | 80 | 8.9% |
| Total | 895 | 100.0% |
Housing Structures by Occupancy in Colquitt
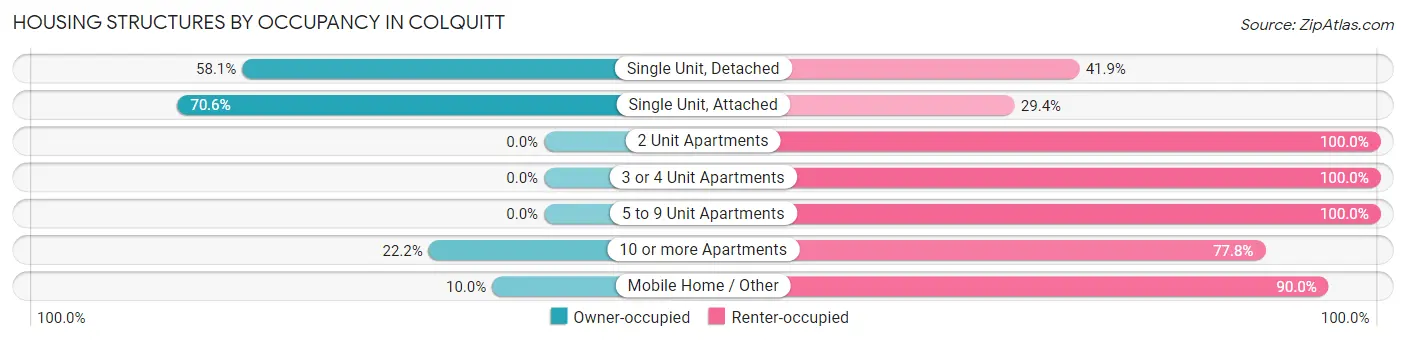
| Structure Type | Owner-occupied | Renter-occupied |
| Single Unit, Detached | 358 (58.1%) | 258 (41.9%) |
| Single Unit, Attached | 24 (70.6%) | 10 (29.4%) |
| 2 Unit Apartments | 0 (0.0%) | 80 (100.0%) |
| 3 or 4 Unit Apartments | 0 (0.0%) | 64 (100.0%) |
| 5 to 9 Unit Apartments | 0 (0.0%) | 12 (100.0%) |
| 10 or more Apartments | 2 (22.2%) | 7 (77.8%) |
| Mobile Home / Other | 8 (10.0%) | 72 (90.0%) |
| Total | 392 (43.8%) | 503 (56.2%) |
Housing Structures by Number of Rooms in Colquitt
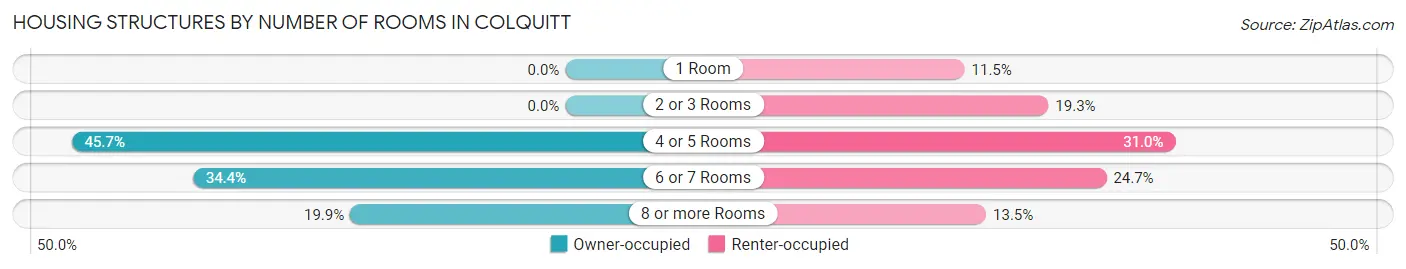
| Number of Rooms | Owner-occupied | Renter-occupied |
| 1 Room | 0 (0.0%) | 58 (11.5%) |
| 2 or 3 Rooms | 0 (0.0%) | 97 (19.3%) |
| 4 or 5 Rooms | 179 (45.7%) | 156 (31.0%) |
| 6 or 7 Rooms | 135 (34.4%) | 124 (24.6%) |
| 8 or more Rooms | 78 (19.9%) | 68 (13.5%) |
| Total | 392 (100.0%) | 503 (100.0%) |
Housing Structure by Heating Type in Colquitt
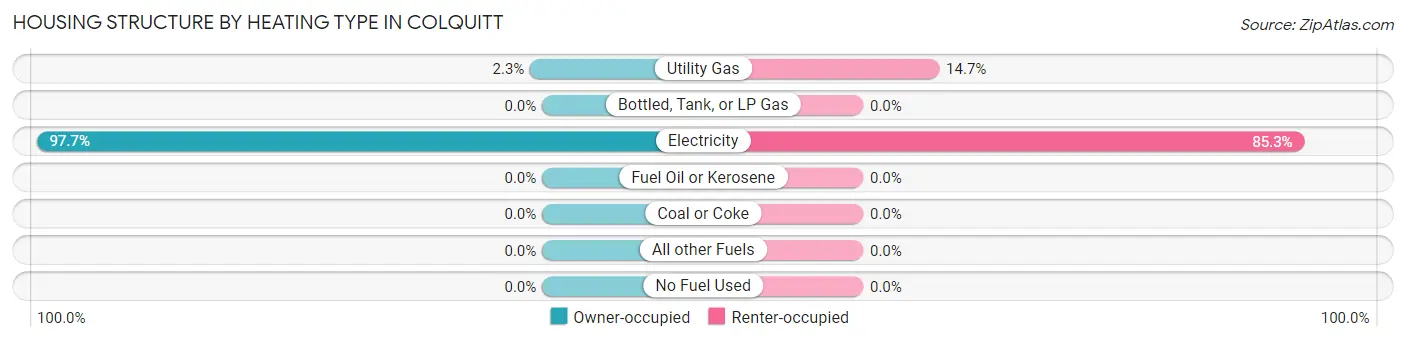
| Heating Type | Owner-occupied | Renter-occupied |
| Utility Gas | 9 (2.3%) | 74 (14.7%) |
| Bottled, Tank, or LP Gas | 0 (0.0%) | 0 (0.0%) |
| Electricity | 383 (97.7%) | 429 (85.3%) |
| Fuel Oil or Kerosene | 0 (0.0%) | 0 (0.0%) |
| Coal or Coke | 0 (0.0%) | 0 (0.0%) |
| All other Fuels | 0 (0.0%) | 0 (0.0%) |
| No Fuel Used | 0 (0.0%) | 0 (0.0%) |
| Total | 392 (100.0%) | 503 (100.0%) |
Household Vehicle Usage in Colquitt
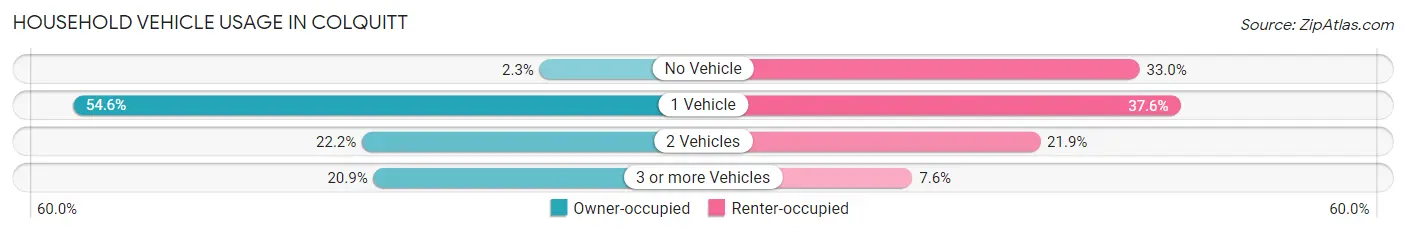
| Vehicles per Household | Owner-occupied | Renter-occupied |
| No Vehicle | 9 (2.3%) | 166 (33.0%) |
| 1 Vehicle | 214 (54.6%) | 189 (37.6%) |
| 2 Vehicles | 87 (22.2%) | 110 (21.9%) |
| 3 or more Vehicles | 82 (20.9%) | 38 (7.5%) |
| Total | 392 (100.0%) | 503 (100.0%) |
Real Estate & Mortgages in Colquitt
Real Estate and Mortgage Overview in Colquitt
| Characteristic | Without Mortgage | With Mortgage |
| Housing Units | 246 | 146 |
| Median Property Value | $98,100 | $99,300 |
| Median Household Income | - | - |
| Monthly Housing Costs | $438 | $0 |
| Real Estate Taxes | $1,494 | $7 |
Property Value by Mortgage Status in Colquitt
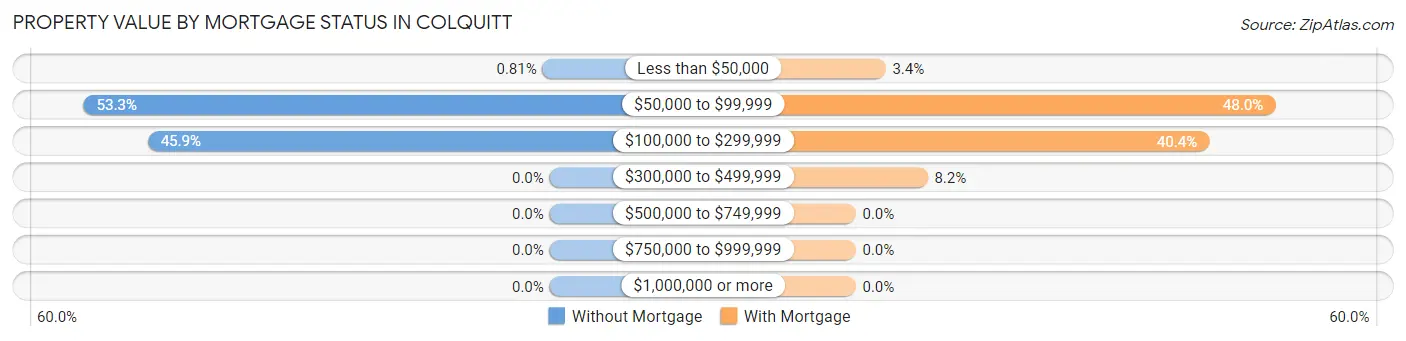
| Property Value | Without Mortgage | With Mortgage |
| Less than $50,000 | 2 (0.8%) | 5 (3.4%) |
| $50,000 to $99,999 | 131 (53.2%) | 70 (47.9%) |
| $100,000 to $299,999 | 113 (45.9%) | 59 (40.4%) |
| $300,000 to $499,999 | 0 (0.0%) | 12 (8.2%) |
| $500,000 to $749,999 | 0 (0.0%) | 0 (0.0%) |
| $750,000 to $999,999 | 0 (0.0%) | 0 (0.0%) |
| $1,000,000 or more | 0 (0.0%) | 0 (0.0%) |
| Total | 246 (100.0%) | 146 (100.0%) |
Household Income by Mortgage Status in Colquitt
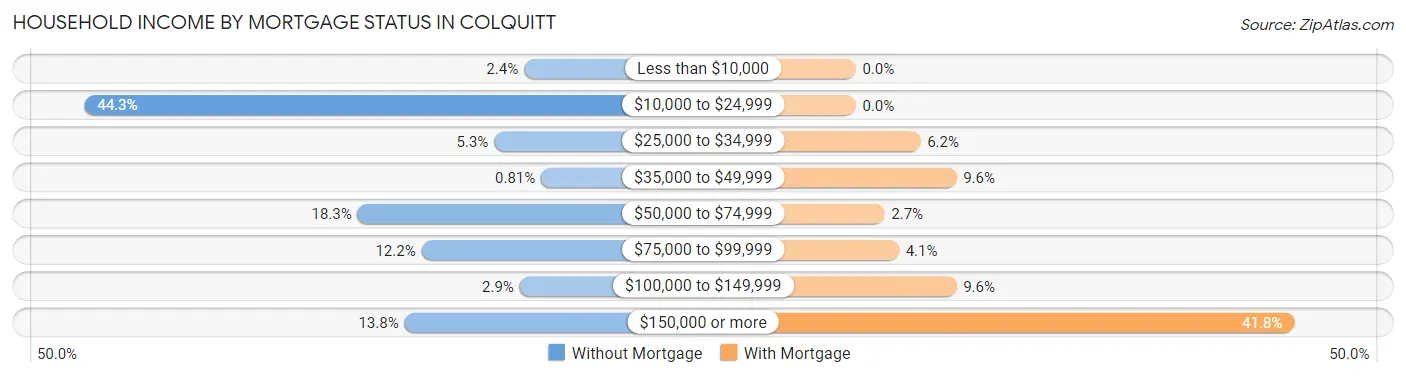
| Household Income | Without Mortgage | With Mortgage |
| Less than $10,000 | 6 (2.4%) | 0 (0.0%) |
| $10,000 to $24,999 | 109 (44.3%) | 0 (0.0%) |
| $25,000 to $34,999 | 13 (5.3%) | 9 (6.2%) |
| $35,000 to $49,999 | 2 (0.8%) | 14 (9.6%) |
| $50,000 to $74,999 | 45 (18.3%) | 4 (2.7%) |
| $75,000 to $99,999 | 30 (12.2%) | 6 (4.1%) |
| $100,000 to $149,999 | 7 (2.9%) | 14 (9.6%) |
| $150,000 or more | 34 (13.8%) | 61 (41.8%) |
| Total | 246 (100.0%) | 146 (100.0%) |
Property Value to Household Income Ratio in Colquitt
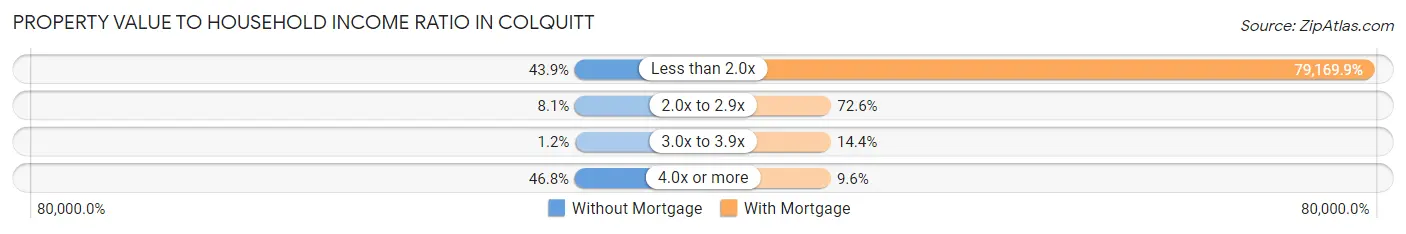
| Value-to-Income Ratio | Without Mortgage | With Mortgage |
| Less than 2.0x | 108 (43.9%) | 115,588 (79,169.9%) |
| 2.0x to 2.9x | 20 (8.1%) | 106 (72.6%) |
| 3.0x to 3.9x | 3 (1.2%) | 21 (14.4%) |
| 4.0x or more | 115 (46.8%) | 14 (9.6%) |
| Total | 246 (100.0%) | 146 (100.0%) |
Real Estate Taxes by Mortgage Status in Colquitt
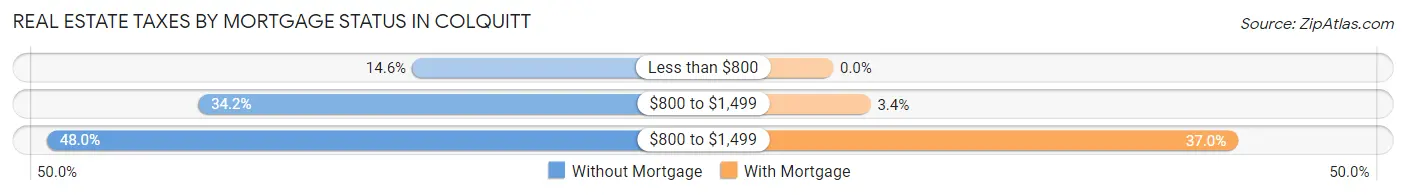
| Property Taxes | Without Mortgage | With Mortgage |
| Less than $800 | 36 (14.6%) | 0 (0.0%) |
| $800 to $1,499 | 84 (34.2%) | 5 (3.4%) |
| $800 to $1,499 | 118 (48.0%) | 54 (37.0%) |
| Total | 246 (100.0%) | 146 (100.0%) |
Health & Disability in Colquitt
Health Insurance Coverage by Age in Colquitt
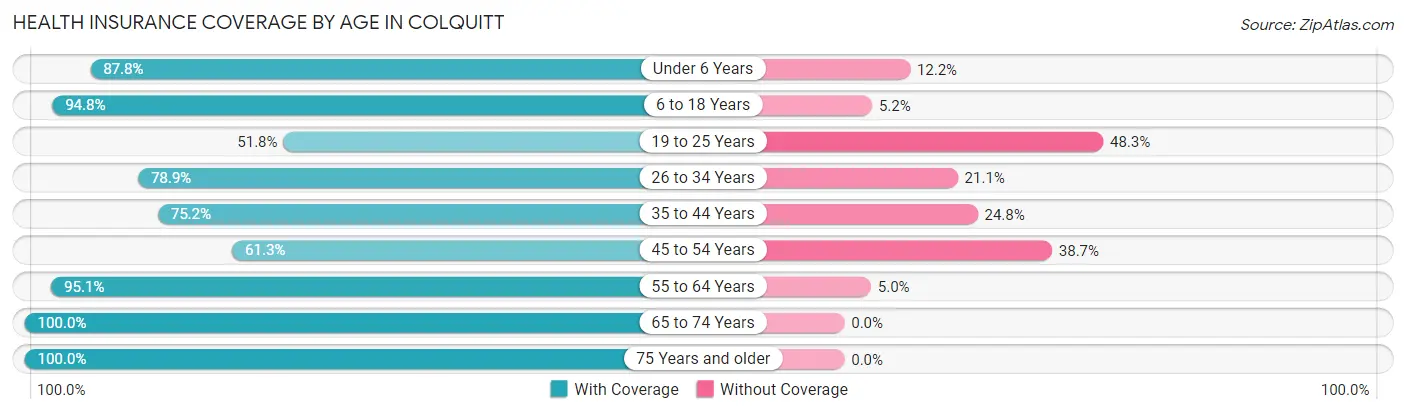
| Age Bracket | With Coverage | Without Coverage |
| Under 6 Years | 129 (87.8%) | 18 (12.2%) |
| 6 to 18 Years | 386 (94.8%) | 21 (5.2%) |
| 19 to 25 Years | 118 (51.7%) | 110 (48.2%) |
| 26 to 34 Years | 97 (78.9%) | 26 (21.1%) |
| 35 to 44 Years | 233 (75.2%) | 77 (24.8%) |
| 45 to 54 Years | 76 (61.3%) | 48 (38.7%) |
| 55 to 64 Years | 307 (95.1%) | 16 (5.0%) |
| 65 to 74 Years | 131 (100.0%) | 0 (0.0%) |
| 75 Years and older | 180 (100.0%) | 0 (0.0%) |
| Total | 1,657 (84.0%) | 316 (16.0%) |
Health Insurance Coverage by Citizenship Status in Colquitt
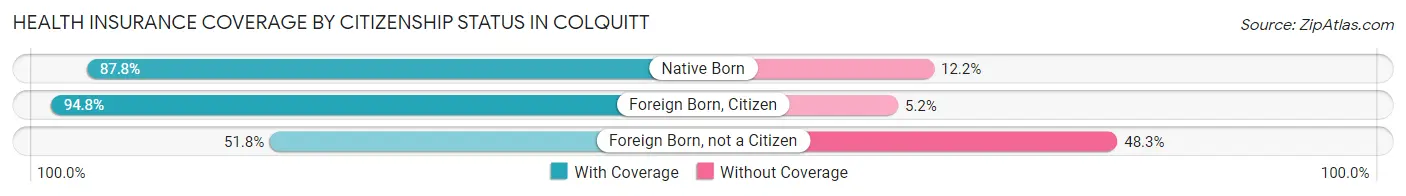
| Citizenship Status | With Coverage | Without Coverage |
| Native Born | 129 (87.8%) | 18 (12.2%) |
| Foreign Born, Citizen | 386 (94.8%) | 21 (5.2%) |
| Foreign Born, not a Citizen | 118 (51.7%) | 110 (48.2%) |
Health Insurance Coverage by Household Income in Colquitt
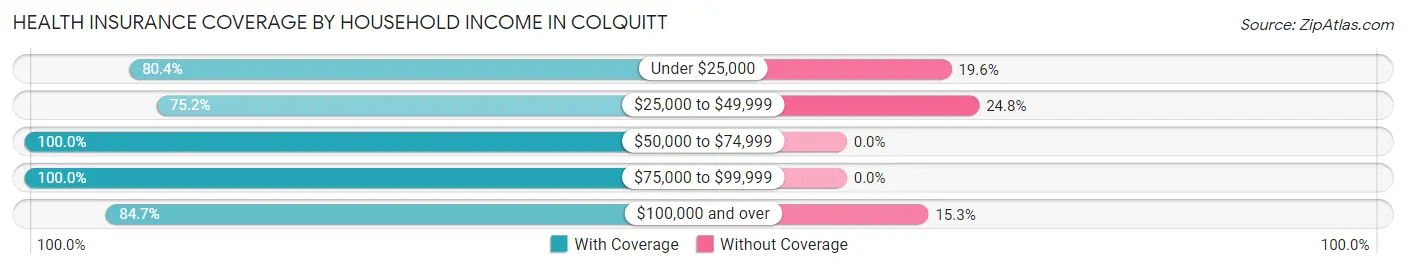
| Household Income | With Coverage | Without Coverage |
| Under $25,000 | 746 (80.4%) | 182 (19.6%) |
| $25,000 to $49,999 | 194 (75.2%) | 64 (24.8%) |
| $50,000 to $74,999 | 163 (100.0%) | 0 (0.0%) |
| $75,000 to $99,999 | 177 (100.0%) | 0 (0.0%) |
| $100,000 and over | 365 (84.7%) | 66 (15.3%) |
Public vs Private Health Insurance Coverage by Age in Colquitt
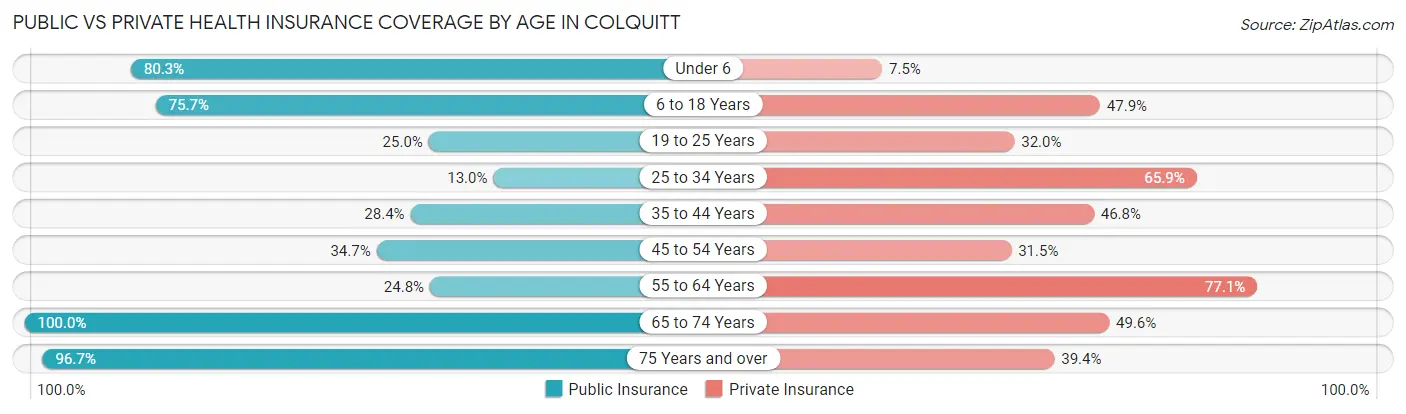
| Age Bracket | Public Insurance | Private Insurance |
| Under 6 | 118 (80.3%) | 11 (7.5%) |
| 6 to 18 Years | 308 (75.7%) | 195 (47.9%) |
| 19 to 25 Years | 57 (25.0%) | 73 (32.0%) |
| 25 to 34 Years | 16 (13.0%) | 81 (65.8%) |
| 35 to 44 Years | 88 (28.4%) | 145 (46.8%) |
| 45 to 54 Years | 43 (34.7%) | 39 (31.5%) |
| 55 to 64 Years | 80 (24.8%) | 249 (77.1%) |
| 65 to 74 Years | 131 (100.0%) | 65 (49.6%) |
| 75 Years and over | 174 (96.7%) | 71 (39.4%) |
| Total | 1,015 (51.4%) | 929 (47.1%) |
Disability Status by Sex by Age in Colquitt
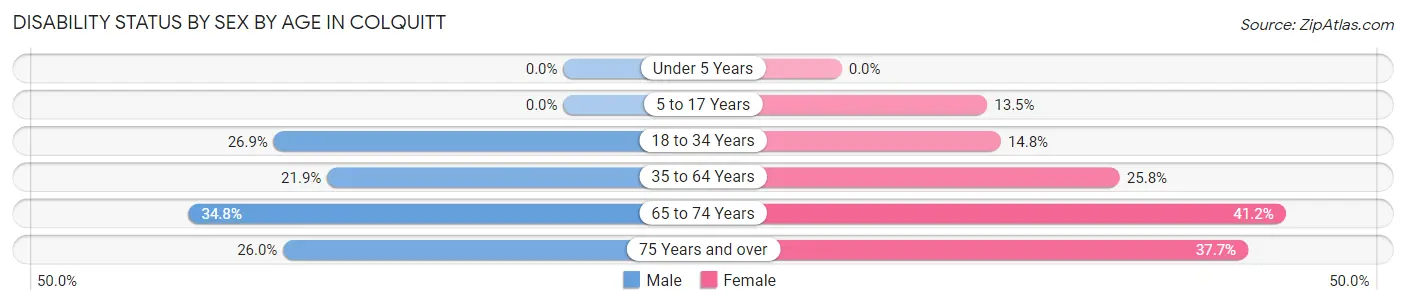
| Age Bracket | Male | Female |
| Under 5 Years | 0 (0.0%) | 0 (0.0%) |
| 5 to 17 Years | 0 (0.0%) | 25 (13.5%) |
| 18 to 34 Years | 43 (26.9%) | 35 (14.8%) |
| 35 to 64 Years | 64 (21.9%) | 120 (25.8%) |
| 65 to 74 Years | 16 (34.8%) | 35 (41.2%) |
| 75 Years and over | 13 (26.0%) | 49 (37.7%) |
Disability Class by Sex by Age in Colquitt
Disability Class: Hearing Difficulty
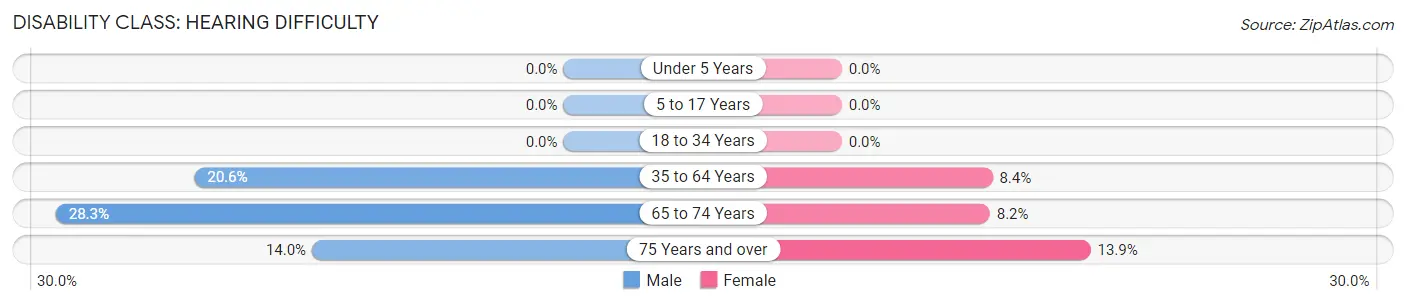
| Age Bracket | Male | Female |
| Under 5 Years | 0 (0.0%) | 0 (0.0%) |
| 5 to 17 Years | 0 (0.0%) | 0 (0.0%) |
| 18 to 34 Years | 0 (0.0%) | 0 (0.0%) |
| 35 to 64 Years | 60 (20.5%) | 39 (8.4%) |
| 65 to 74 Years | 13 (28.3%) | 7 (8.2%) |
| 75 Years and over | 7 (14.0%) | 18 (13.9%) |
Disability Class: Vision Difficulty
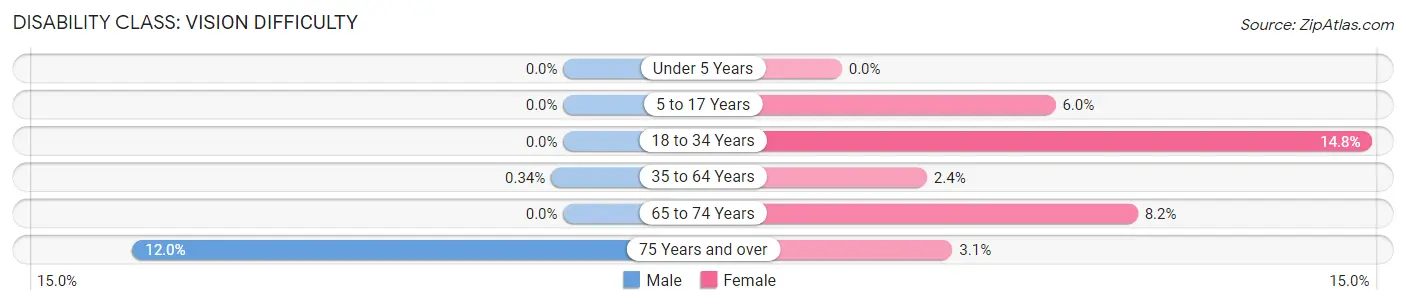
| Age Bracket | Male | Female |
| Under 5 Years | 0 (0.0%) | 0 (0.0%) |
| 5 to 17 Years | 0 (0.0%) | 11 (5.9%) |
| 18 to 34 Years | 0 (0.0%) | 35 (14.8%) |
| 35 to 64 Years | 1 (0.3%) | 11 (2.4%) |
| 65 to 74 Years | 0 (0.0%) | 7 (8.2%) |
| 75 Years and over | 6 (12.0%) | 4 (3.1%) |
Disability Class: Cognitive Difficulty
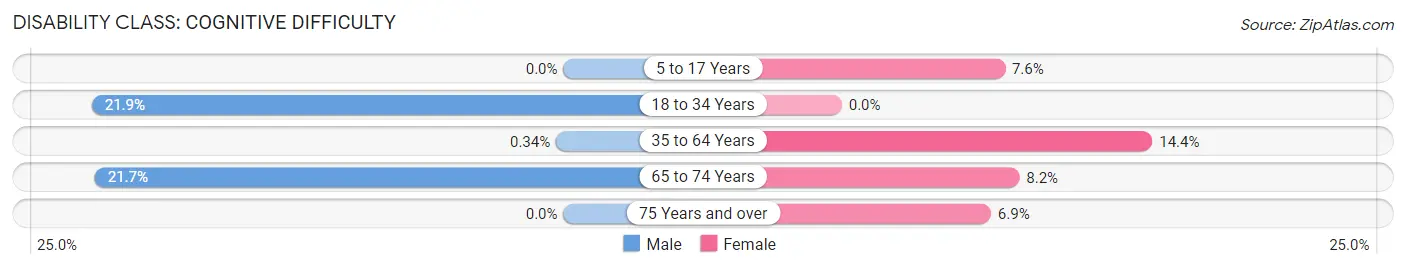
| Age Bracket | Male | Female |
| 5 to 17 Years | 0 (0.0%) | 14 (7.6%) |
| 18 to 34 Years | 35 (21.9%) | 0 (0.0%) |
| 35 to 64 Years | 1 (0.3%) | 67 (14.4%) |
| 65 to 74 Years | 10 (21.7%) | 7 (8.2%) |
| 75 Years and over | 0 (0.0%) | 9 (6.9%) |
Disability Class: Ambulatory Difficulty
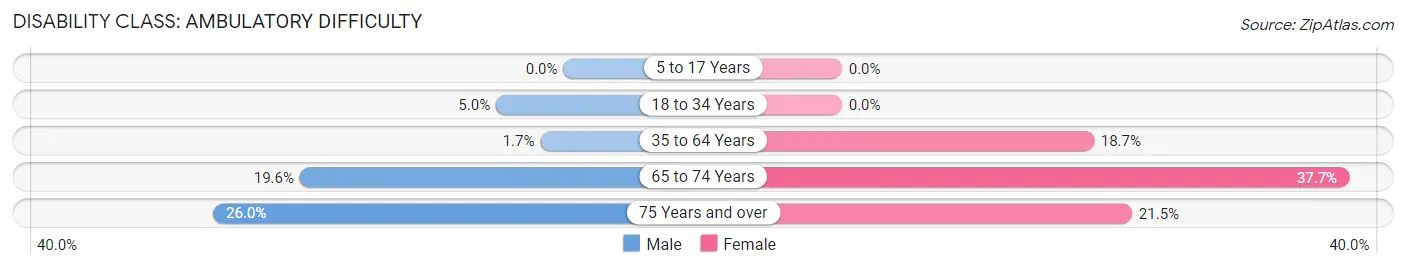
| Age Bracket | Male | Female |
| 5 to 17 Years | 0 (0.0%) | 0 (0.0%) |
| 18 to 34 Years | 8 (5.0%) | 0 (0.0%) |
| 35 to 64 Years | 5 (1.7%) | 87 (18.7%) |
| 65 to 74 Years | 9 (19.6%) | 32 (37.7%) |
| 75 Years and over | 13 (26.0%) | 28 (21.5%) |
Disability Class: Self-Care Difficulty
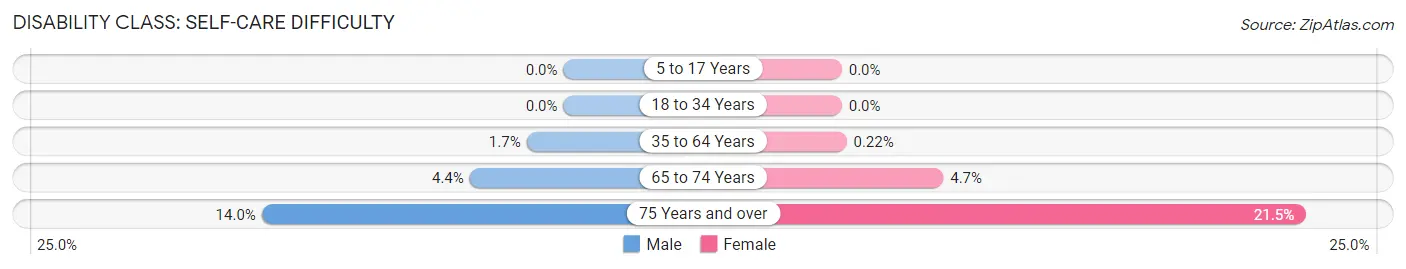
| Age Bracket | Male | Female |
| 5 to 17 Years | 0 (0.0%) | 0 (0.0%) |
| 18 to 34 Years | 0 (0.0%) | 0 (0.0%) |
| 35 to 64 Years | 5 (1.7%) | 1 (0.2%) |
| 65 to 74 Years | 2 (4.3%) | 4 (4.7%) |
| 75 Years and over | 7 (14.0%) | 28 (21.5%) |
Technology Access in Colquitt
Computing Device Access in Colquitt
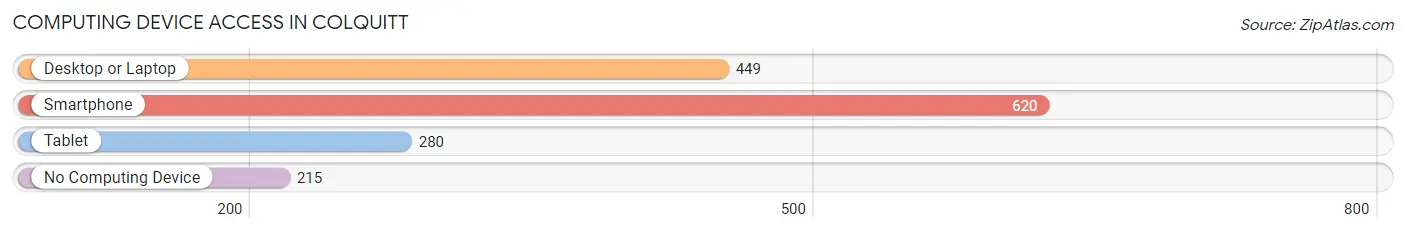
| Device Type | # Households | % Households |
| Desktop or Laptop | 449 | 50.2% |
| Smartphone | 620 | 69.3% |
| Tablet | 280 | 31.3% |
| No Computing Device | 215 | 24.0% |
| Total | 895 | 100.0% |
Internet Access in Colquitt
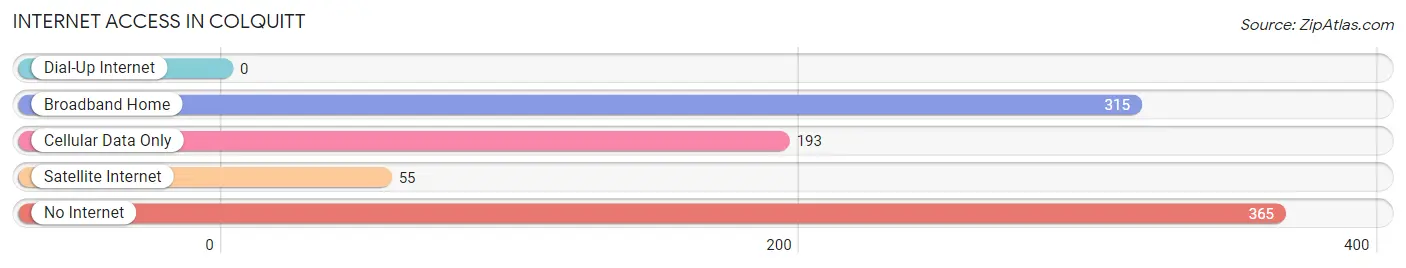
| Internet Type | # Households | % Households |
| Dial-Up Internet | 0 | 0.0% |
| Broadband Home | 315 | 35.2% |
| Cellular Data Only | 193 | 21.6% |
| Satellite Internet | 55 | 6.1% |
| No Internet | 365 | 40.8% |
| Total | 895 | 100.0% |
Colquitt Summary
Colquitt, Georgia is a small town located in Miller County, Georgia. It is situated on the banks of the Flint River, approximately 30 miles south of Albany. The town was founded in 1854 and named after Walter Terry Colquitt, a prominent lawyer and politician from the area. The population of Colquitt was 1,845 in the 2010 census.
History
Colquitt was founded in 1854 by a group of settlers from South Carolina. The town was named after Walter Terry Colquitt, a prominent lawyer and politician from the area. The town was incorporated in 1856 and quickly became a center of commerce and industry. The town was home to several cotton mills, a sawmill, a gristmill, and a brickyard. The town also had a thriving agricultural industry, with cotton, corn, and peanuts being the main crops.
The town was also home to several churches, including the First Baptist Church, which was founded in 1856. The town also had a school, which was established in 1858.
The town was also home to several Confederate soldiers during the Civil War. The town was occupied by Union forces in 1864 and was the site of several skirmishes. After the war, the town slowly began to rebuild and by the late 19th century, the town had become a center of commerce and industry.
Geography
Colquitt is located in Miller County, Georgia, approximately 30 miles south of Albany. The town is situated on the banks of the Flint River. The town is surrounded by rolling hills and is located in a rural area. The town has a total area of 2.2 square miles, all of which is land.
Economy
The economy of Colquitt is largely based on agriculture. Cotton, corn, and peanuts are the main crops grown in the area. The town also has several small businesses, including a grocery store, a hardware store, and a few restaurants.
Demographics
As of the 2010 census, the population of Colquitt was 1,845. The racial makeup of the town was 79.2% White, 18.2% African American, 0.3% Native American, 0.2% Asian, 0.1% Pacific Islander, 0.7% from other races, and 1.5% from two or more races. Hispanic or Latino of any race were 1.7% of the population.
The median income for a household in Colquitt was $30,938, and the median income for a family was $37,917. The per capita income for the town was $15,945. About 18.2% of families and 22.2% of the population were below the poverty line, including 28.3% of those under age 18 and 16.2% of those age 65 or over.
Common Questions
What is the Total Population of Colquitt?
Total Population of Colquitt is 2,131.
What is the Total Male Population of Colquitt?
Total Male Population of Colquitt is 889.
What is the Total Female Population of Colquitt?
Total Female Population of Colquitt is 1,242.
What is the Ratio of Males per 100 Females in Colquitt?
There are 71.58 Males per 100 Females in Colquitt.
What is the Ratio of Females per 100 Males in Colquitt?
There are 139.71 Females per 100 Males in Colquitt.
What is the Median Population Age in Colquitt?
Median Population Age in Colquitt is 42.5 Years.
What is the Average Family Size in Colquitt
Average Family Size in Colquitt is 2.9 People.
What is the Average Household Size in Colquitt
Average Household Size in Colquitt is 2.2 People.
What is Per Capita Income in Colquitt?
Per Capita income in Colquitt is $25,544.
What is the Median Family Income in Colquitt?
Median Family Income in Colquitt is $35,625.
What is the Median Household income in Colquitt?
Median Household Income in Colquitt is $26,125.
What is Income or Wage Gap in Colquitt?
Income or Wage Gap in Colquitt is 36.2%.
Women in Colquitt earn 63.8 cents for every dollar earned by a man.
What is Inequality or Gini Index in Colquitt?
Inequality or Gini Index in Colquitt is 0.54.
How Large is the Labor Force in Colquitt?
There are 851 People in the Labor Forcein in Colquitt.
What is the Percentage of People in the Labor Force in Colquitt?
50.8% of People are in the Labor Force in Colquitt.
What is the Unemployment Rate in Colquitt?
Unemployment Rate in Colquitt is 9.0%.