Henderson, GA
Henderson Map
Henderson Overview
3,005
TOTAL POPULATION
1,453
MALE POPULATION
1,552
FEMALE POPULATION
93.62
MALES / 100 FEMALES
106.81
FEMALES / 100 MALES
40.3
MEDIAN AGE
2.7
AVG FAMILY SIZE
2.4
AVG HOUSEHOLD SIZE
$39,160
PER CAPITA INCOME
$96,691
AVG FAMILY INCOME
$69,646
AVG HOUSEHOLD INCOME
0.37
INEQUALITY / GINI INDEX
1,803
LABOR FORCE [ PEOPLE ]
68.8%
PERCENT IN LABOR FORCE
6.4%
UNEMPLOYMENT RATE
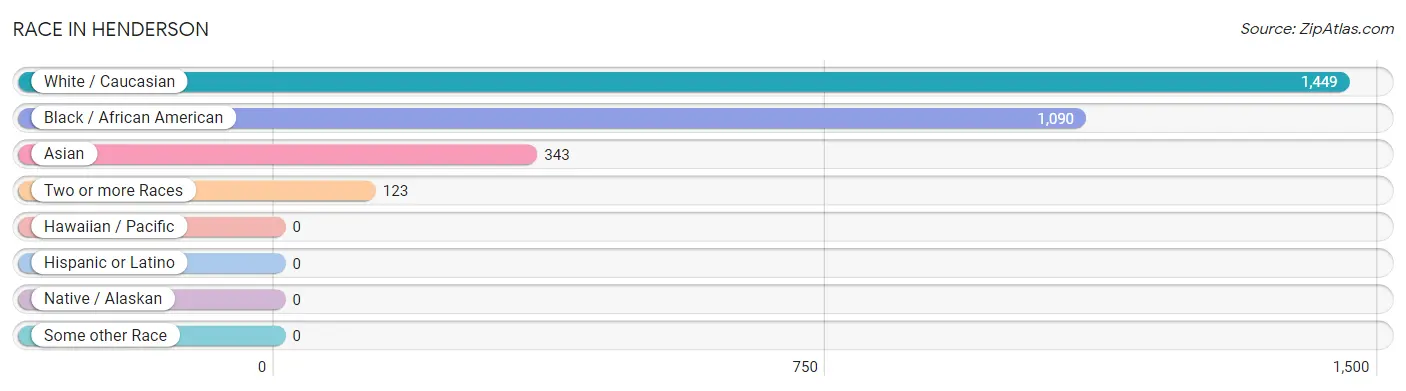
Race in Henderson
The most populous races in Henderson are White / Caucasian (1,449 | 48.2%), Black / African American (1,090 | 36.3%), and Asian (343 | 11.4%).
| Race | # Population | % Population |
| Asian | 343 | 11.4% |
| Black / African American | 1,090 | 36.3% |
| Hawaiian / Pacific | 0 | 0.0% |
| Hispanic or Latino | 0 | 0.0% |
| Native / Alaskan | 0 | 0.0% |
| White / Caucasian | 1,449 | 48.2% |
| Two or more Races | 123 | 4.1% |
| Some other Race | 0 | 0.0% |
| Total | 3,005 | 100.0% |
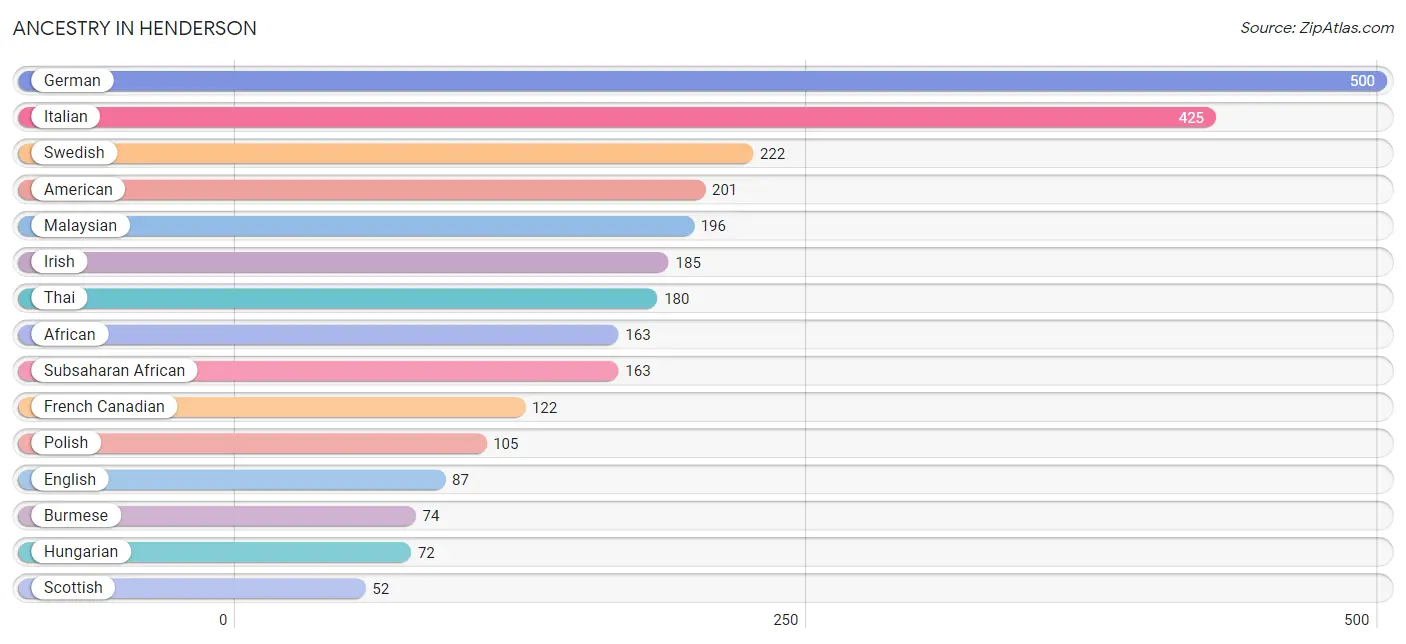
Ancestry in Henderson
The most populous ancestries reported in Henderson are German (500 | 16.6%), Italian (425 | 14.1%), Swedish (222 | 7.4%), American (201 | 6.7%), and Malaysian (196 | 6.5%), together accounting for 51.4% of all Henderson residents.
| Ancestry | # Population | % Population |
| African | 163 | 5.4% |
| American | 201 | 6.7% |
| Blackfeet | 16 | 0.5% |
| Burmese | 74 | 2.5% |
| Czech | 46 | 1.5% |
| Danish | 24 | 0.8% |
| English | 87 | 2.9% |
| European | 38 | 1.3% |
| French Canadian | 122 | 4.1% |
| German | 500 | 16.6% |
| Hungarian | 72 | 2.4% |
| Irish | 185 | 6.2% |
| Italian | 425 | 14.1% |
| Latvian | 51 | 1.7% |
| Lithuanian | 51 | 1.7% |
| Malaysian | 196 | 6.5% |
| Polish | 105 | 3.5% |
| Scottish | 52 | 1.7% |
| Slovene | 46 | 1.5% |
| Subsaharan African | 163 | 5.4% |
| Swedish | 222 | 7.4% |
| Thai | 180 | 6.0% | View All 22 Rows |
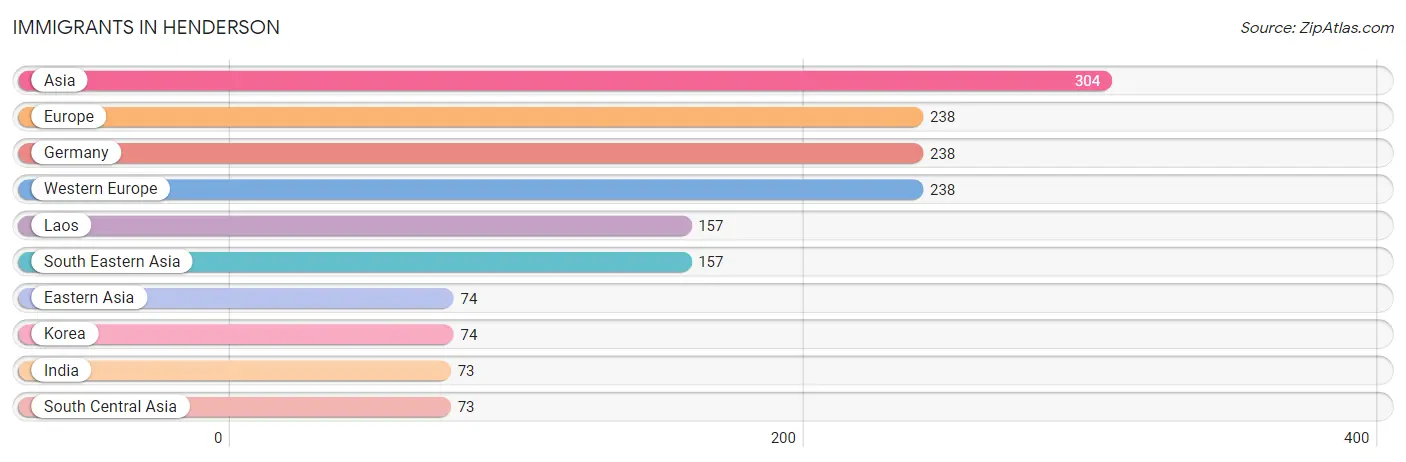
Immigrants in Henderson
The most numerous immigrant groups reported in Henderson came from Asia (304 | 10.1%), Europe (238 | 7.9%), Germany (238 | 7.9%), Western Europe (238 | 7.9%), and Laos (157 | 5.2%), together accounting for 39.1% of all Henderson residents.
| Immigration Origin | # Population | % Population |
| Asia | 304 | 10.1% |
| Eastern Asia | 74 | 2.5% |
| Europe | 238 | 7.9% |
| Germany | 238 | 7.9% |
| India | 73 | 2.4% |
| Korea | 74 | 2.5% |
| Laos | 157 | 5.2% |
| South Central Asia | 73 | 2.4% |
| South Eastern Asia | 157 | 5.2% |
| Western Europe | 238 | 7.9% | View All 10 Rows |
Sex and Age in Henderson
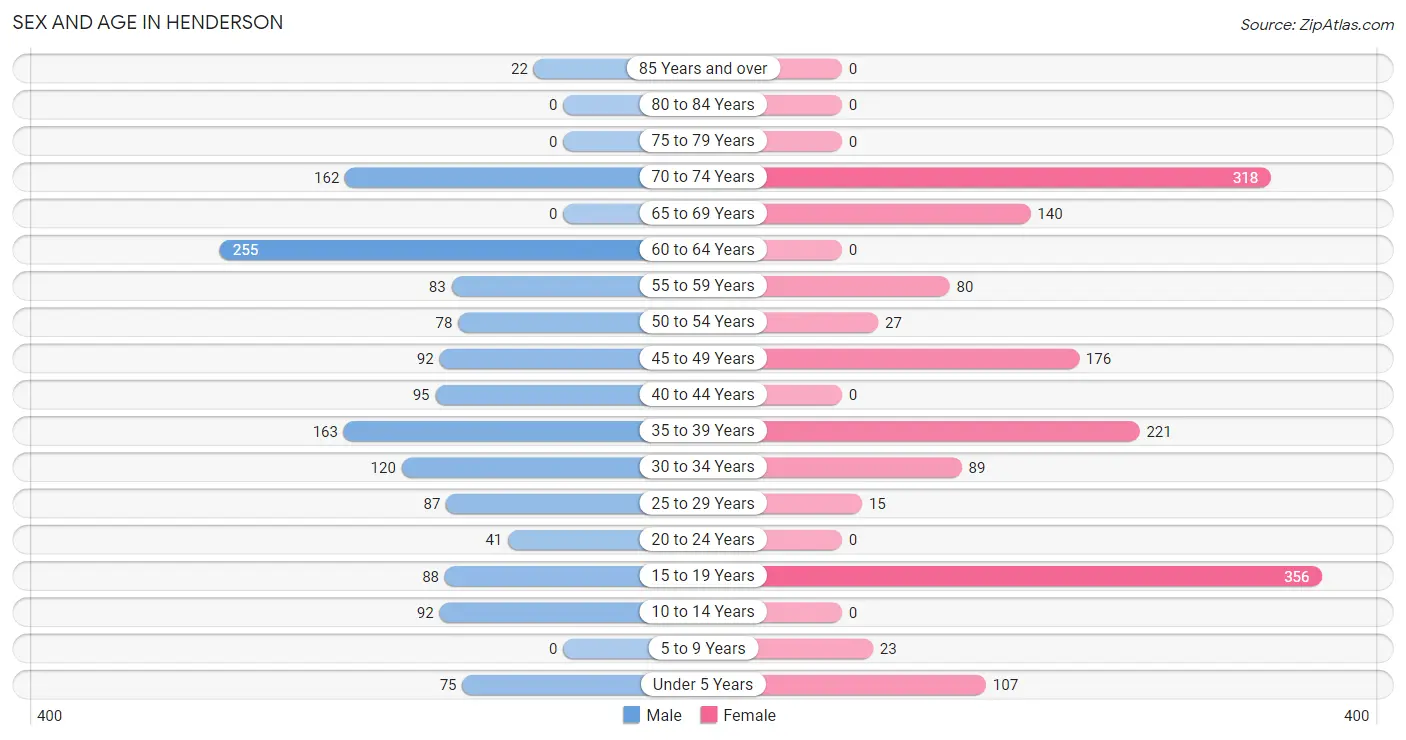
Sex and Age in Henderson
The most populous age groups in Henderson are 60 to 64 Years (255 | 17.5%) for men and 15 to 19 Years (356 | 22.9%) for women.
| Age Bracket | Male | Female |
| Under 5 Years | 75 (5.2%) | 107 (6.9%) |
| 5 to 9 Years | 0 (0.0%) | 23 (1.5%) |
| 10 to 14 Years | 92 (6.3%) | 0 (0.0%) |
| 15 to 19 Years | 88 (6.1%) | 356 (22.9%) |
| 20 to 24 Years | 41 (2.8%) | 0 (0.0%) |
| 25 to 29 Years | 87 (6.0%) | 15 (1.0%) |
| 30 to 34 Years | 120 (8.3%) | 89 (5.7%) |
| 35 to 39 Years | 163 (11.2%) | 221 (14.2%) |
| 40 to 44 Years | 95 (6.5%) | 0 (0.0%) |
| 45 to 49 Years | 92 (6.3%) | 176 (11.3%) |
| 50 to 54 Years | 78 (5.4%) | 27 (1.7%) |
| 55 to 59 Years | 83 (5.7%) | 80 (5.1%) |
| 60 to 64 Years | 255 (17.5%) | 0 (0.0%) |
| 65 to 69 Years | 0 (0.0%) | 140 (9.0%) |
| 70 to 74 Years | 162 (11.2%) | 318 (20.5%) |
| 75 to 79 Years | 0 (0.0%) | 0 (0.0%) |
| 80 to 84 Years | 0 (0.0%) | 0 (0.0%) |
| 85 Years and over | 22 (1.5%) | 0 (0.0%) |
| Total | 1,453 (100.0%) | 1,552 (100.0%) |
Families and Households in Henderson
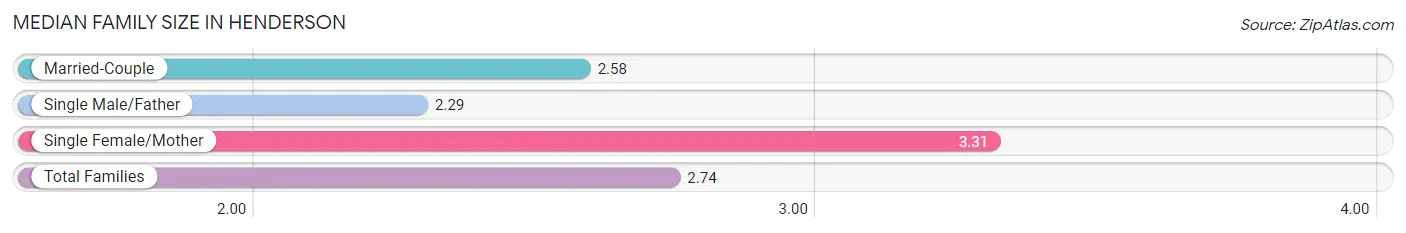
Median Family Size in Henderson
The median family size in Henderson is 2.74 persons per family, with single female/mother families (203 | 22.4%) accounting for the largest median family size of 3.31 persons per family. On the other hand, single male/father families (17 | 1.9%) represent the smallest median family size with 2.29 persons per family.
| Family Type | # Families | Family Size |
| Married-Couple | 685 (75.7%) | 2.58 |
| Single Male/Father | 17 (1.9%) | 2.29 |
| Single Female/Mother | 203 (22.4%) | 3.31 |
| Total Families | 905 (100.0%) | 2.74 |
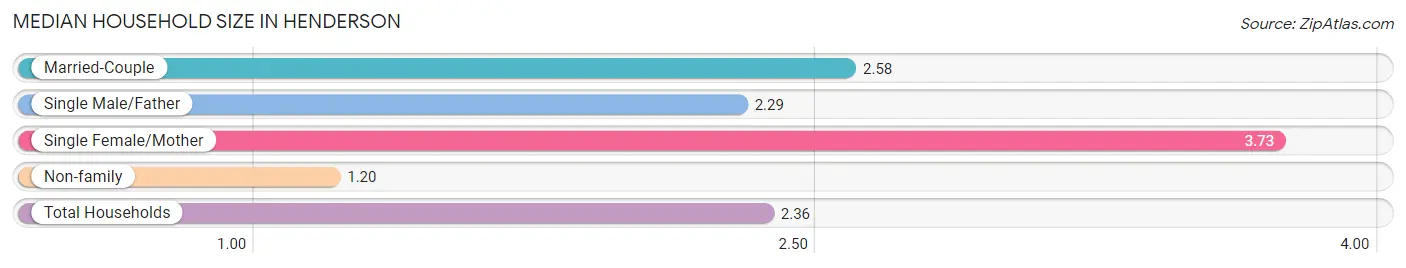
Median Household Size in Henderson
The median household size in Henderson is 2.36 persons per household, with single female/mother households (203 | 15.9%) accounting for the largest median household size of 3.73 persons per household. non-family households (369 | 29.0%) represent the smallest median household size with 1.20 persons per household.
| Household Type | # Households | Household Size |
| Married-Couple | 685 (53.8%) | 2.58 |
| Single Male/Father | 17 (1.3%) | 2.29 |
| Single Female/Mother | 203 (15.9%) | 3.73 |
| Non-family | 369 (29.0%) | 1.20 |
| Total Households | 1,274 (100.0%) | 2.36 |
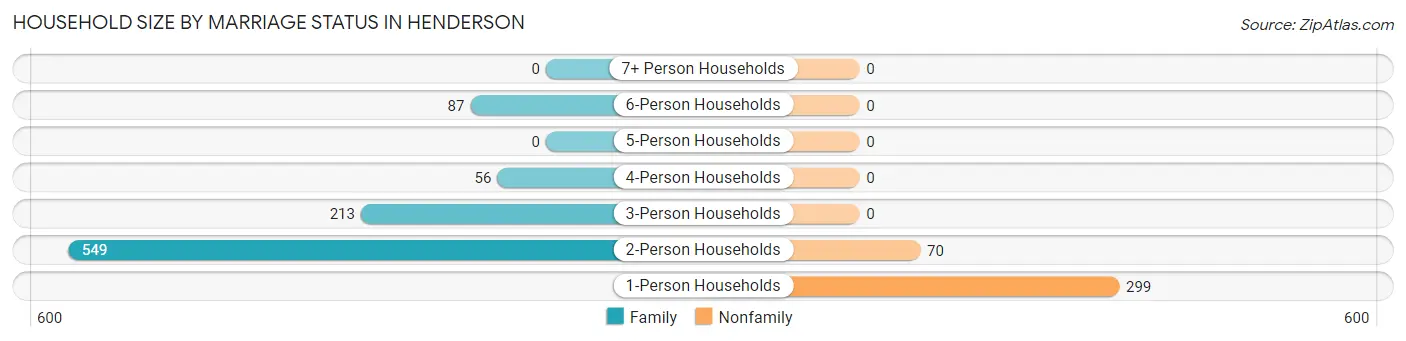
Household Size by Marriage Status in Henderson
Out of a total of 1,274 households in Henderson, 905 (71.0%) are family households, while 369 (29.0%) are nonfamily households. The most numerous type of family households are 2-person households, comprising 549, and the most common type of nonfamily households are 1-person households, comprising 299.
| Household Size | Family Households | Nonfamily Households |
| 1-Person Households | - | 299 (23.5%) |
| 2-Person Households | 549 (43.1%) | 70 (5.5%) |
| 3-Person Households | 213 (16.7%) | 0 (0.0%) |
| 4-Person Households | 56 (4.4%) | 0 (0.0%) |
| 5-Person Households | 0 (0.0%) | 0 (0.0%) |
| 6-Person Households | 87 (6.8%) | 0 (0.0%) |
| 7+ Person Households | 0 (0.0%) | 0 (0.0%) |
| Total | 905 (71.0%) | 369 (29.0%) |
Female Fertility in Henderson
Fertility by Age in Henderson
Average fertility rate in Henderson is 17.0 births per 1,000 women. Women in the age bracket of 20 to 34 years have the highest fertility rate with 144.0 births per 1,000 women. Women in the age bracket of 20 to 34 years acount for 100.0% of all women with births.
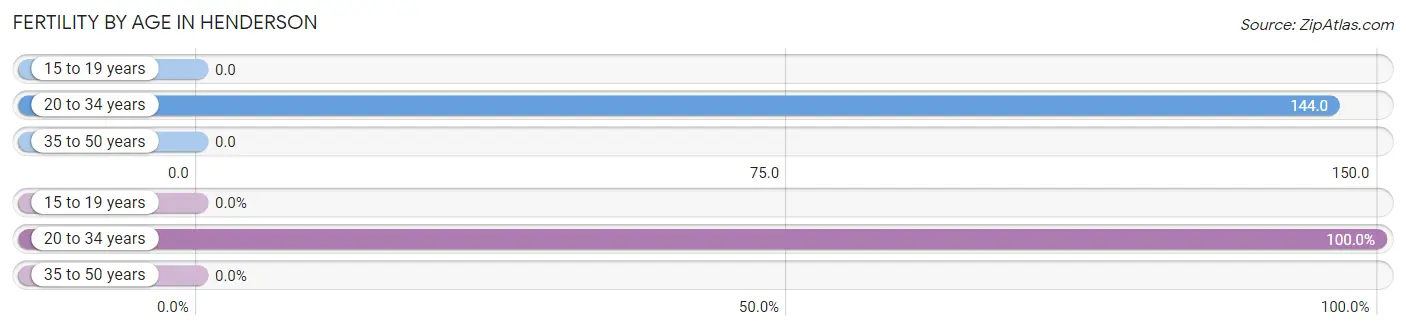
| Age Bracket | Women with Births | Births / 1,000 Women |
| 15 to 19 years | 0 (0.0%) | 0.0 |
| 20 to 34 years | 15 (100.0%) | 144.0 |
| 35 to 50 years | 0 (0.0%) | 0.0 |
| Total | 15 (100.0%) | 17.0 |
Fertility by Age by Marriage Status in Henderson
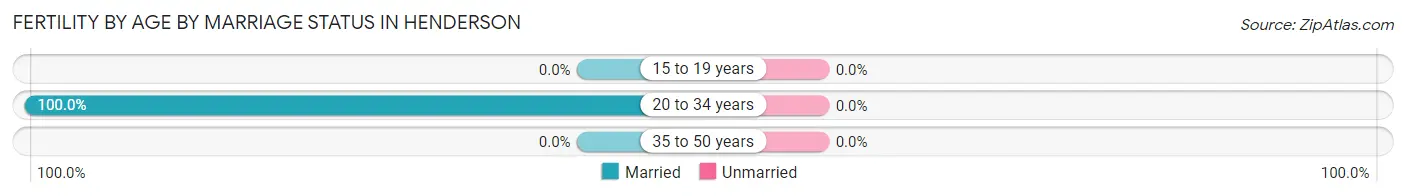
| Age Bracket | Married | Unmarried |
| 15 to 19 years | 0 (0.0%) | 0 (0.0%) |
| 20 to 34 years | 15 (100.0%) | 0 (0.0%) |
| 35 to 50 years | 0 (0.0%) | 0 (0.0%) |
| Total | 15 (100.0%) | 0 (0.0%) |
Fertility by Education in Henderson
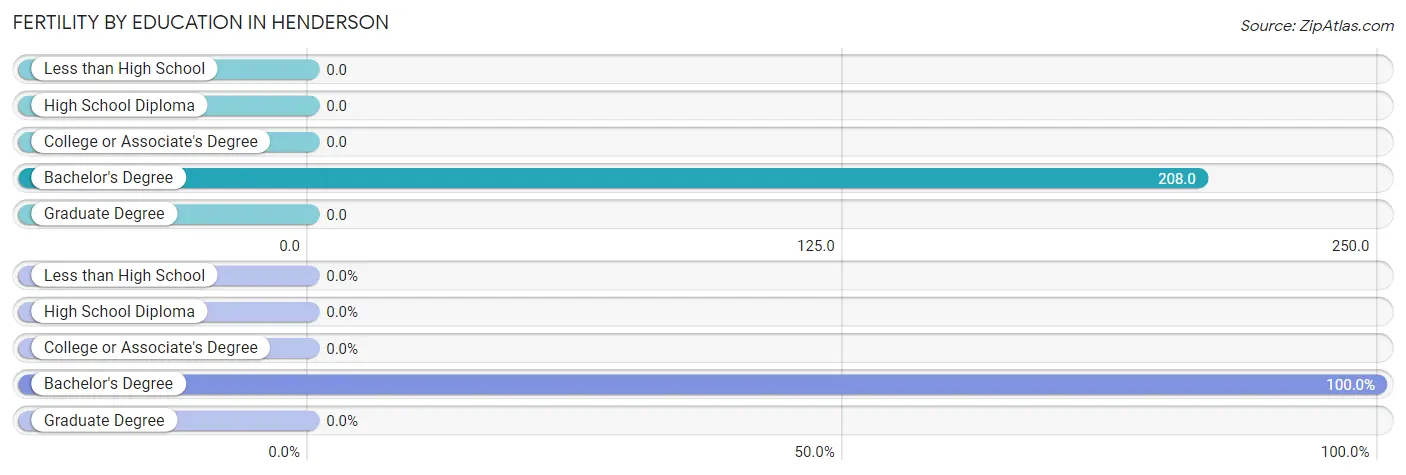
| Educational Attainment | Women with Births | Births / 1,000 Women |
| Less than High School | 0 (0.0%) | 0.0 |
| High School Diploma | 0 (0.0%) | 0.0 |
| College or Associate's Degree | 0 (0.0%) | 0.0 |
| Bachelor's Degree | 15 (100.0%) | 208.0 |
| Graduate Degree | 0 (0.0%) | 0.0 |
| Total | 15 (100.0%) | 17.0 |
Fertility by Education by Marriage Status in Henderson
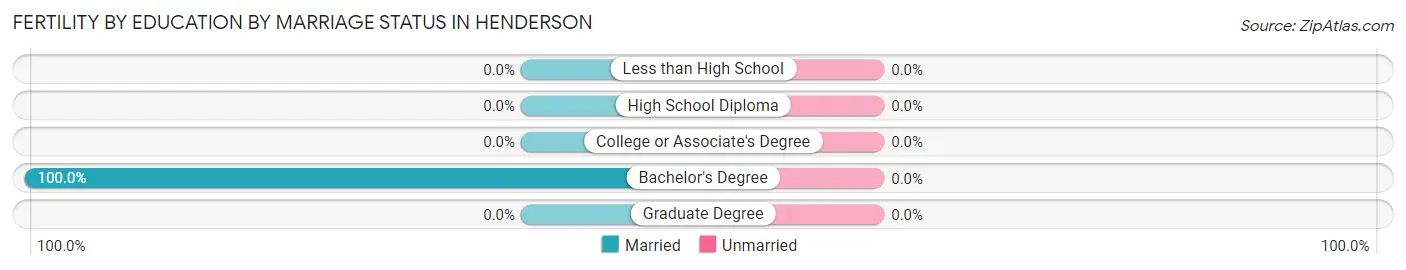
| Educational Attainment | Married | Unmarried |
| Less than High School | 0 (0.0%) | 0 (0.0%) |
| High School Diploma | 0 (0.0%) | 0 (0.0%) |
| College or Associate's Degree | 0 (0.0%) | 0 (0.0%) |
| Bachelor's Degree | 15 (100.0%) | 0 (0.0%) |
| Graduate Degree | 0 (0.0%) | 0 (0.0%) |
| Total | 15 (100.0%) | 0 (0.0%) |
Income in Henderson
Income Overview in Henderson
Per Capita Income in Henderson is $39,160, while median incomes of families and households are $96,691 and $69,646 respectively.
| Characteristic | Number | Measure |
| Per Capita Income | 3,005 | $39,160 |
| Median Family Income | 905 | $96,691 |
| Mean Family Income | 905 | $98,383 |
| Median Household Income | 1,274 | $69,646 |
| Mean Household Income | 1,274 | $89,226 |
| Income Deficit | 905 | $0 |
| Wage / Income Gap (%) | 3,005 | 0.00% |
| Wage / Income Gap ($) | 3,005 | 100.00¢ per $1 |
| Gini / Inequality Index | 3,005 | 0.37 |
Earnings by Sex in Henderson
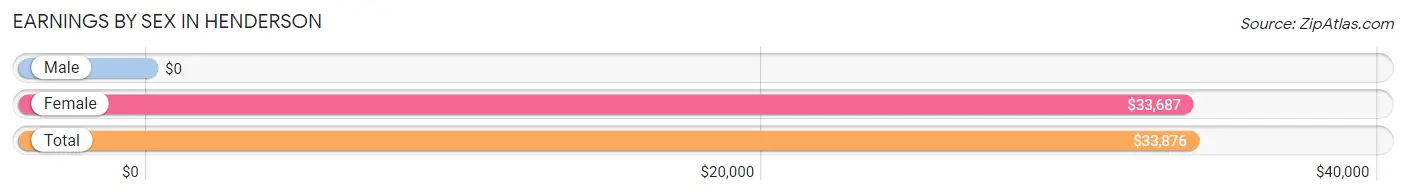
| Sex | Number | Average Earnings |
| Male | 1,000 (53.7%) | $0 |
| Female | 862 (46.3%) | $33,687 |
| Total | 1,862 (100.0%) | $33,876 |
Earnings by Sex by Income Bracket in Henderson
The most common earnings brackets in Henderson are $7,500 to $9,999 for men (263 | 26.3%) and $30,000 to $34,999 for women (238 | 27.6%).
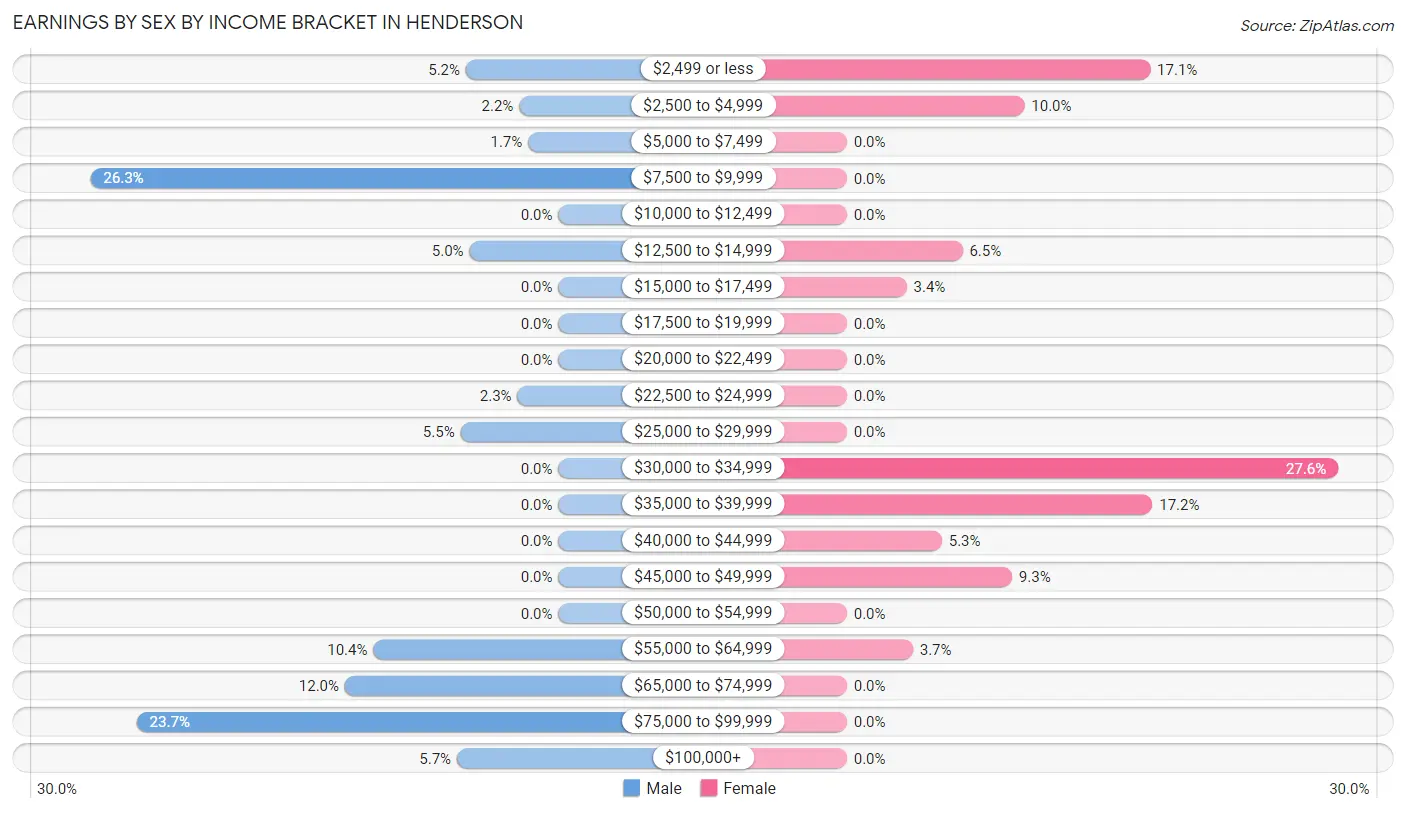
| Income | Male | Female |
| $2,499 or less | 52 (5.2%) | 147 (17.1%) |
| $2,500 to $4,999 | 22 (2.2%) | 86 (10.0%) |
| $5,000 to $7,499 | 17 (1.7%) | 0 (0.0%) |
| $7,500 to $9,999 | 263 (26.3%) | 0 (0.0%) |
| $10,000 to $12,499 | 0 (0.0%) | 0 (0.0%) |
| $12,500 to $14,999 | 50 (5.0%) | 56 (6.5%) |
| $15,000 to $17,499 | 0 (0.0%) | 29 (3.4%) |
| $17,500 to $19,999 | 0 (0.0%) | 0 (0.0%) |
| $20,000 to $22,499 | 0 (0.0%) | 0 (0.0%) |
| $22,500 to $24,999 | 23 (2.3%) | 0 (0.0%) |
| $25,000 to $29,999 | 55 (5.5%) | 0 (0.0%) |
| $30,000 to $34,999 | 0 (0.0%) | 238 (27.6%) |
| $35,000 to $39,999 | 0 (0.0%) | 148 (17.2%) |
| $40,000 to $44,999 | 0 (0.0%) | 46 (5.3%) |
| $45,000 to $49,999 | 0 (0.0%) | 80 (9.3%) |
| $50,000 to $54,999 | 0 (0.0%) | 0 (0.0%) |
| $55,000 to $64,999 | 104 (10.4%) | 32 (3.7%) |
| $65,000 to $74,999 | 120 (12.0%) | 0 (0.0%) |
| $75,000 to $99,999 | 237 (23.7%) | 0 (0.0%) |
| $100,000+ | 57 (5.7%) | 0 (0.0%) |
| Total | 1,000 (100.0%) | 862 (100.0%) |
Earnings by Sex by Educational Attainment in Henderson
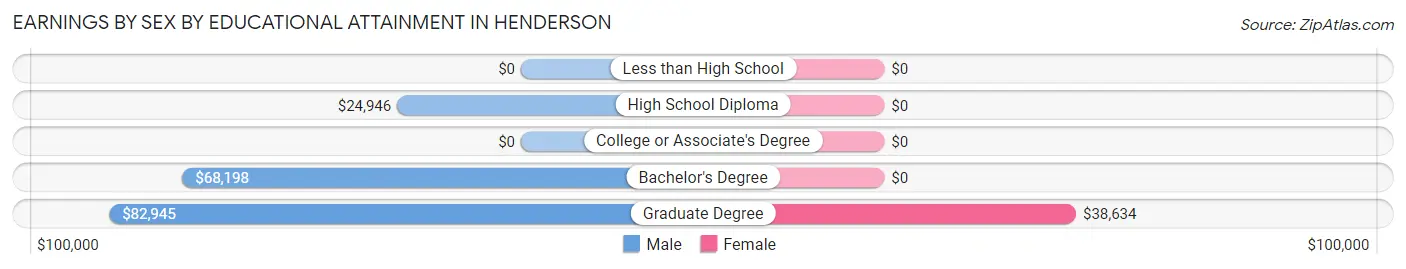
| Educational Attainment | Male Income | Female Income |
| Less than High School | - | - |
| High School Diploma | $24,946 | $0 |
| College or Associate's Degree | - | - |
| Bachelor's Degree | $68,198 | $0 |
| Graduate Degree | $82,945 | $38,634 |
| Total | - | - |
Family Income in Henderson
Family Income Brackets in Henderson
According to the Henderson family income data, there are 287 families falling into the $100,000 to $149,999 income range, which is the most common income bracket and makes up 31.7% of all families.
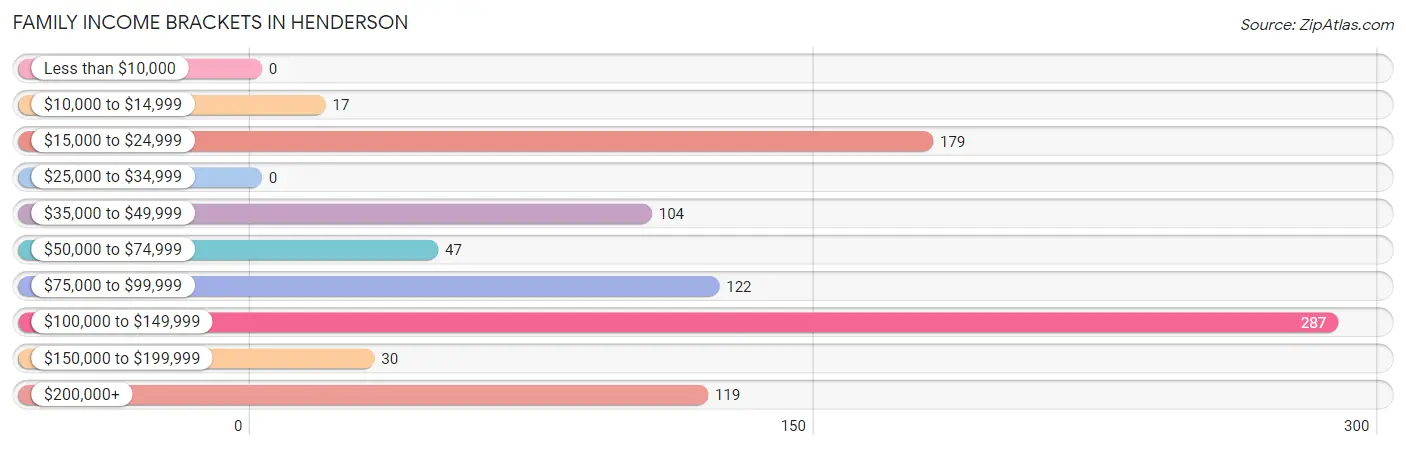
| Income Bracket | # Families | % Families |
| Less than $10,000 | 0 | 0.0% |
| $10,000 to $14,999 | 17 | 1.9% |
| $15,000 to $24,999 | 179 | 19.8% |
| $25,000 to $34,999 | 0 | 0.0% |
| $35,000 to $49,999 | 104 | 11.5% |
| $50,000 to $74,999 | 47 | 5.2% |
| $75,000 to $99,999 | 122 | 13.5% |
| $100,000 to $149,999 | 287 | 31.7% |
| $150,000 to $199,999 | 30 | 3.3% |
| $200,000+ | 119 | 13.1% |
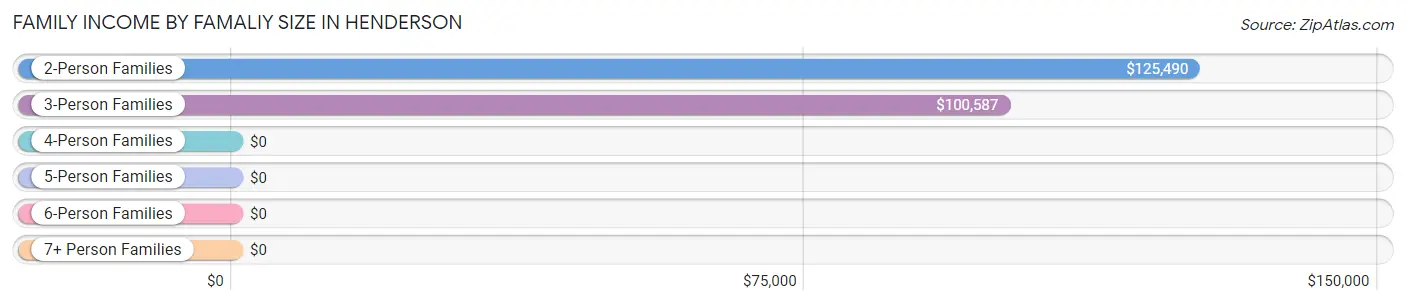
Family Income by Famaliy Size in Henderson
2-person families (549 | 60.7%) account for the highest median family income in Henderson with $125,490 per family, while 2-person families (549 | 60.7%) have the highest median income of $62,745 per family member.
| Income Bracket | # Families | Median Income |
| 2-Person Families | 549 (60.7%) | $125,490 |
| 3-Person Families | 213 (23.5%) | $100,587 |
| 4-Person Families | 56 (6.2%) | $0 |
| 5-Person Families | 87 (9.6%) | $0 |
| 6-Person Families | 0 (0.0%) | $0 |
| 7+ Person Families | 0 (0.0%) | $0 |
| Total | 905 (100.0%) | $96,691 |
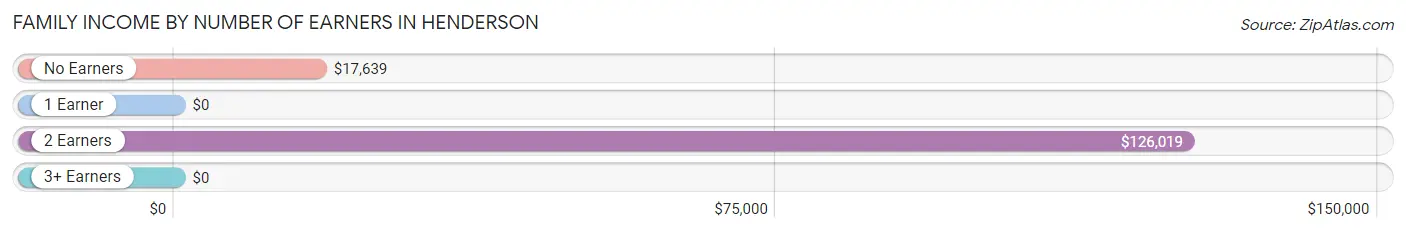
Family Income by Number of Earners in Henderson
| Number of Earners | # Families | Median Income |
| No Earners | 116 (12.8%) | $17,639 |
| 1 Earner | 304 (33.6%) | $0 |
| 2 Earners | 455 (50.3%) | $126,019 |
| 3+ Earners | 30 (3.3%) | $0 |
| Total | 905 (100.0%) | $96,691 |
Household Income in Henderson
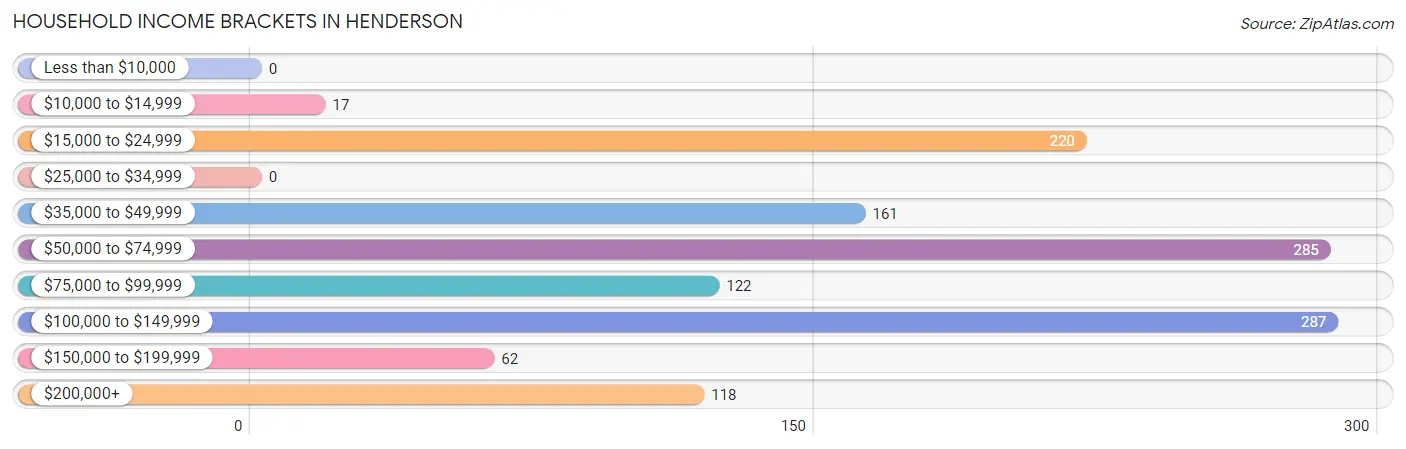
Household Income Brackets in Henderson
With 287 households falling in the category, the $100,000 to $149,999 income range is the most frequent in Henderson, accounting for 22.5% of all households.
| Income Bracket | # Households | % Households |
| Less than $10,000 | 0 | 0.0% |
| $10,000 to $14,999 | 17 | 1.3% |
| $15,000 to $24,999 | 220 | 17.3% |
| $25,000 to $34,999 | 0 | 0.0% |
| $35,000 to $49,999 | 161 | 12.6% |
| $50,000 to $74,999 | 285 | 22.4% |
| $75,000 to $99,999 | 122 | 9.6% |
| $100,000 to $149,999 | 287 | 22.5% |
| $150,000 to $199,999 | 62 | 4.9% |
| $200,000+ | 118 | 9.3% |
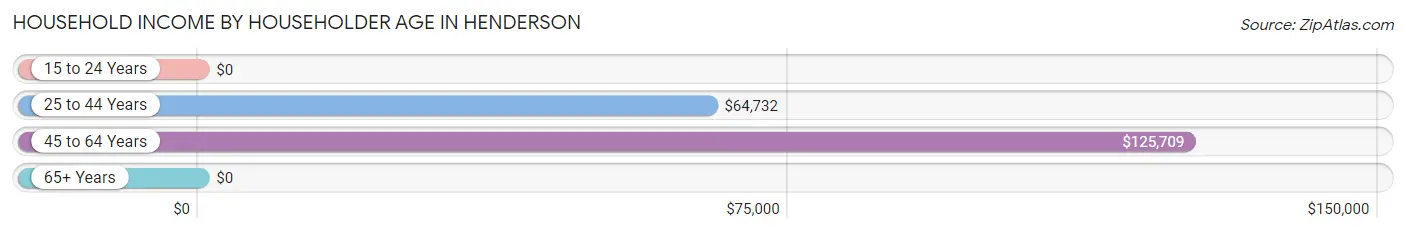
Household Income by Householder Age in Henderson
The median household income in Henderson is $69,646, with the highest median household income of $125,709 found in the 45 to 64 years age bracket for the primary householder. A total of 594 households (46.6%) fall into this category. Meanwhile, the 15 to 24 years age bracket for the primary householder has the lowest median household income of $0, with 41 households (3.2%) in this group.
| Income Bracket | # Households | Median Income |
| 15 to 24 Years | 41 (3.2%) | $0 |
| 25 to 44 Years | 413 (32.4%) | $64,732 |
| 45 to 64 Years | 594 (46.6%) | $125,709 |
| 65+ Years | 226 (17.7%) | $0 |
| Total | 1,274 (100.0%) | $69,646 |
Poverty in Henderson
Income Below Poverty by Sex and Age in Henderson
With 29.4% poverty level for males and 26.0% for females among the residents of Henderson, 12 to 14 year old males and 18 to 24 year old females are the most vulnerable to poverty, with 92 males (100.0%) and 86 females (100.0%) in their respective age groups living below the poverty level.
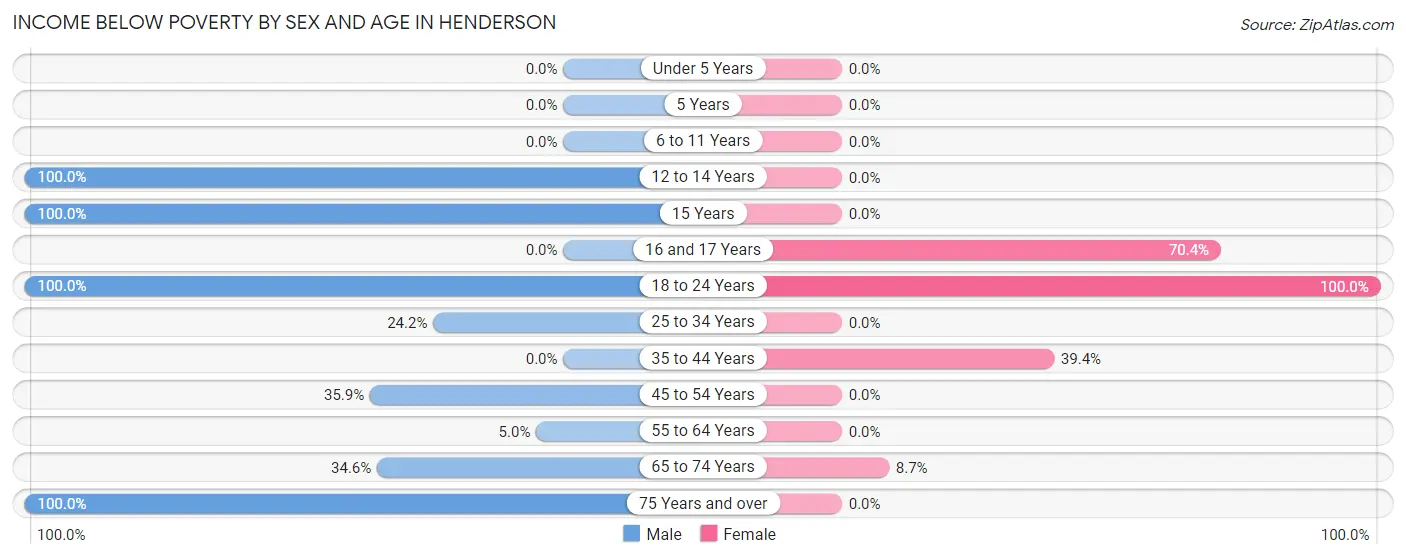
| Age Bracket | Male | Female |
| Under 5 Years | 0 (0.0%) | 0 (0.0%) |
| 5 Years | 0 (0.0%) | 0 (0.0%) |
| 6 to 11 Years | 0 (0.0%) | 0 (0.0%) |
| 12 to 14 Years | 92 (100.0%) | 0 (0.0%) |
| 15 Years | 88 (100.0%) | 0 (0.0%) |
| 16 and 17 Years | 0 (0.0%) | 190 (70.4%) |
| 18 to 24 Years | 41 (100.0%) | 86 (100.0%) |
| 25 to 34 Years | 50 (24.1%) | 0 (0.0%) |
| 35 to 44 Years | 0 (0.0%) | 87 (39.4%) |
| 45 to 54 Years | 61 (35.9%) | 0 (0.0%) |
| 55 to 64 Years | 17 (5.0%) | 0 (0.0%) |
| 65 to 74 Years | 56 (34.6%) | 40 (8.7%) |
| 75 Years and over | 22 (100.0%) | 0 (0.0%) |
| Total | 427 (29.4%) | 403 (26.0%) |
Income Above Poverty by Sex and Age in Henderson
According to the poverty statistics in Henderson, males aged under 5 years and females aged under 5 years are the age groups that are most secure financially, with 100.0% of males and 100.0% of females in these age groups living above the poverty line.
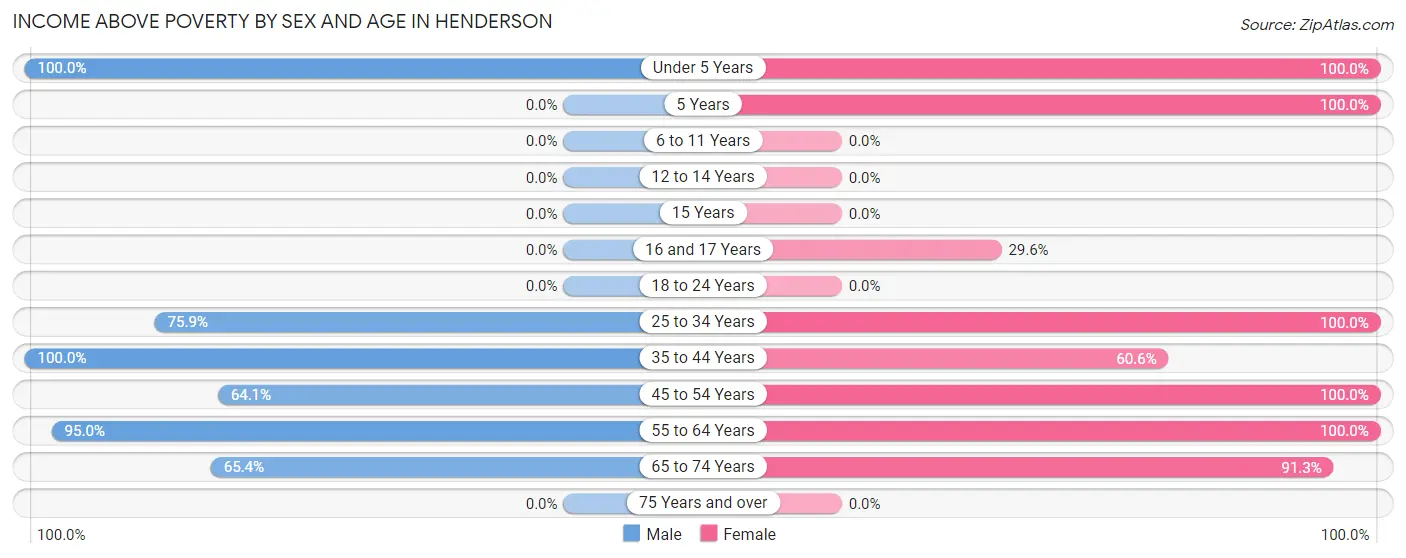
| Age Bracket | Male | Female |
| Under 5 Years | 75 (100.0%) | 107 (100.0%) |
| 5 Years | 0 (0.0%) | 23 (100.0%) |
| 6 to 11 Years | 0 (0.0%) | 0 (0.0%) |
| 12 to 14 Years | 0 (0.0%) | 0 (0.0%) |
| 15 Years | 0 (0.0%) | 0 (0.0%) |
| 16 and 17 Years | 0 (0.0%) | 80 (29.6%) |
| 18 to 24 Years | 0 (0.0%) | 0 (0.0%) |
| 25 to 34 Years | 157 (75.8%) | 104 (100.0%) |
| 35 to 44 Years | 258 (100.0%) | 134 (60.6%) |
| 45 to 54 Years | 109 (64.1%) | 203 (100.0%) |
| 55 to 64 Years | 321 (95.0%) | 80 (100.0%) |
| 65 to 74 Years | 106 (65.4%) | 418 (91.3%) |
| 75 Years and over | 0 (0.0%) | 0 (0.0%) |
| Total | 1,026 (70.6%) | 1,149 (74.0%) |
Income Below Poverty Among Married-Couple Families in Henderson
The poverty statistics for married-couple families in Henderson show that 8.2% or 56 of the total 685 families live below the poverty line. Families with 1 or 2 children have the highest poverty rate of 26.1%, comprising of 56 families. On the other hand, families with no children have the lowest poverty rate of 0.0%, which includes 0 families.
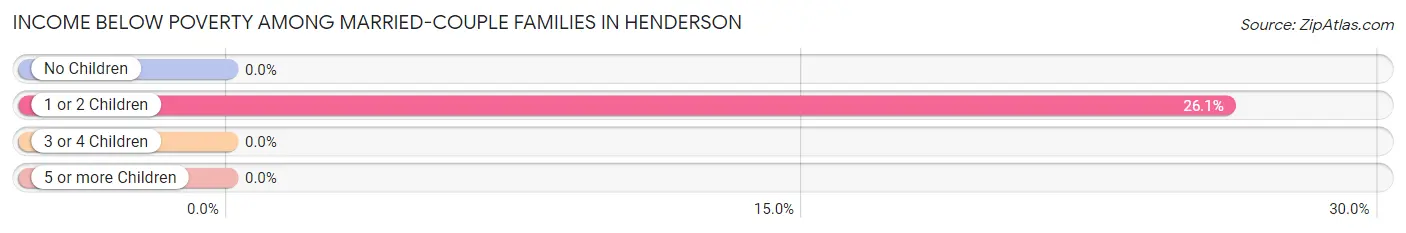
| Children | Above Poverty | Below Poverty |
| No Children | 470 (100.0%) | 0 (0.0%) |
| 1 or 2 Children | 159 (74.0%) | 56 (26.1%) |
| 3 or 4 Children | 0 (0.0%) | 0 (0.0%) |
| 5 or more Children | 0 (0.0%) | 0 (0.0%) |
| Total | 629 (91.8%) | 56 (8.2%) |
Income Below Poverty Among Single-Parent Households in Henderson
According to the poverty data in Henderson, 100.0% or 17 single-father households and 42.9% or 87 single-mother households are living below the poverty line. Among single-father households, those with no children have the highest poverty rate, with 17 households (100.0%) experiencing poverty. Likewise, among single-mother households, those with 3 or 4 children have the highest poverty rate, with 87 households (100.0%) falling below the poverty line.
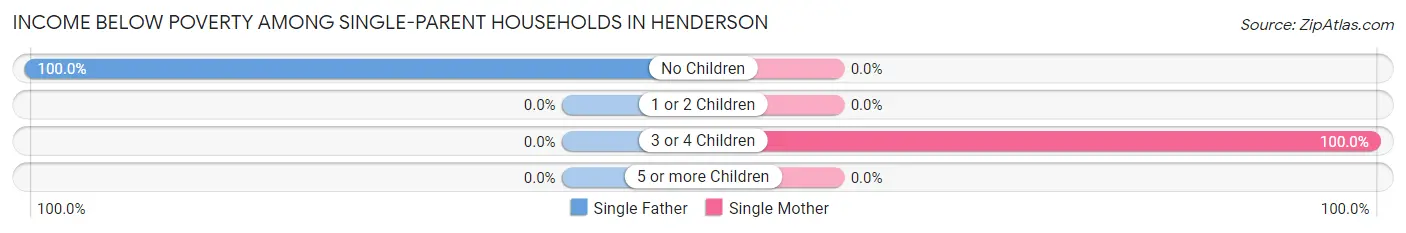
| Children | Single Father | Single Mother |
| No Children | 17 (100.0%) | 0 (0.0%) |
| 1 or 2 Children | 0 (0.0%) | 0 (0.0%) |
| 3 or 4 Children | 0 (0.0%) | 87 (100.0%) |
| 5 or more Children | 0 (0.0%) | 0 (0.0%) |
| Total | 17 (100.0%) | 87 (42.9%) |
Income Below Poverty Among Married-Couple vs Single-Parent Households in Henderson
The poverty data for Henderson shows that 56 of the married-couple family households (8.2%) and 104 of the single-parent households (47.3%) are living below the poverty level. Within the married-couple family households, those with 1 or 2 children have the highest poverty rate, with 56 households (26.1%) falling below the poverty line. Among the single-parent households, those with 3 or 4 children have the highest poverty rate, with 87 household (100.0%) living below poverty.
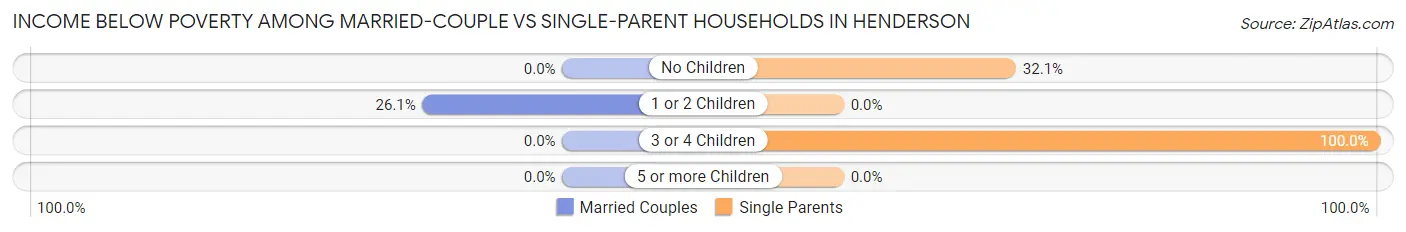
| Children | Married-Couple Families | Single-Parent Households |
| No Children | 0 (0.0%) | 17 (32.1%) |
| 1 or 2 Children | 56 (26.1%) | 0 (0.0%) |
| 3 or 4 Children | 0 (0.0%) | 87 (100.0%) |
| 5 or more Children | 0 (0.0%) | 0 (0.0%) |
| Total | 56 (8.2%) | 104 (47.3%) |
Employment Characteristics in Henderson
Employment by Class of Employer in Henderson
Among the 1,473 employed individuals in Henderson, private company employees (871 | 59.1%), federal government employees (347 | 23.6%), and state government employees (126 | 8.6%) make up the most common classes of employment.
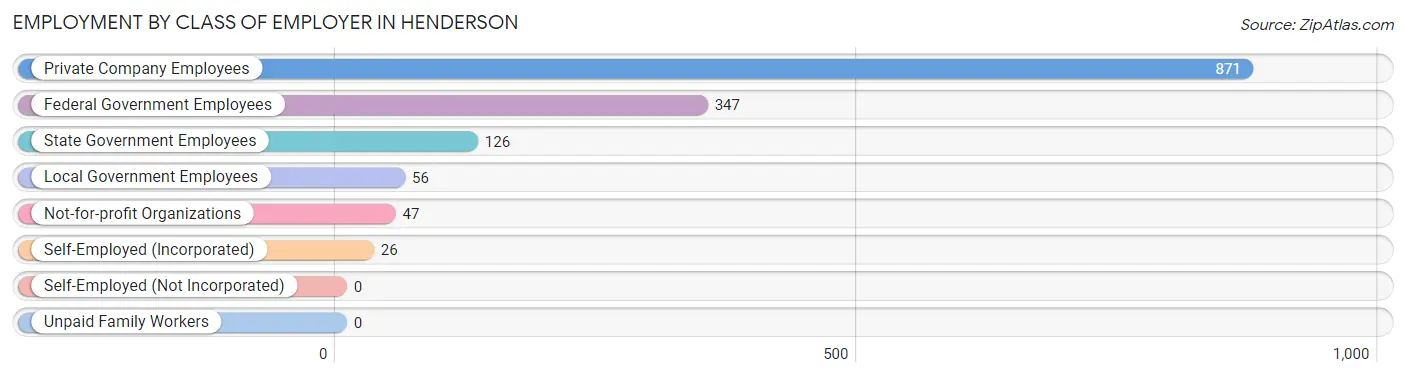
| Employer Class | # Employees | % Employees |
| Private Company Employees | 871 | 59.1% |
| Self-Employed (Incorporated) | 26 | 1.8% |
| Self-Employed (Not Incorporated) | 0 | 0.0% |
| Not-for-profit Organizations | 47 | 3.2% |
| Local Government Employees | 56 | 3.8% |
| State Government Employees | 126 | 8.6% |
| Federal Government Employees | 347 | 23.6% |
| Unpaid Family Workers | 0 | 0.0% |
| Total | 1,473 | 100.0% |
Employment Status by Age in Henderson
According to the labor force statistics for Henderson, out of the total population over 16 years of age (2,620), 68.8% or 1,803 individuals are in the labor force, with 6.4% or 115 of them unemployed. The age group with the highest labor force participation rate is 20 to 24 years, with 100.0% or 41 individuals in the labor force. Within the labor force, the 16 to 19 years age range has the highest percentage of unemployed individuals, with 48.2% or 80 of them being unemployed.
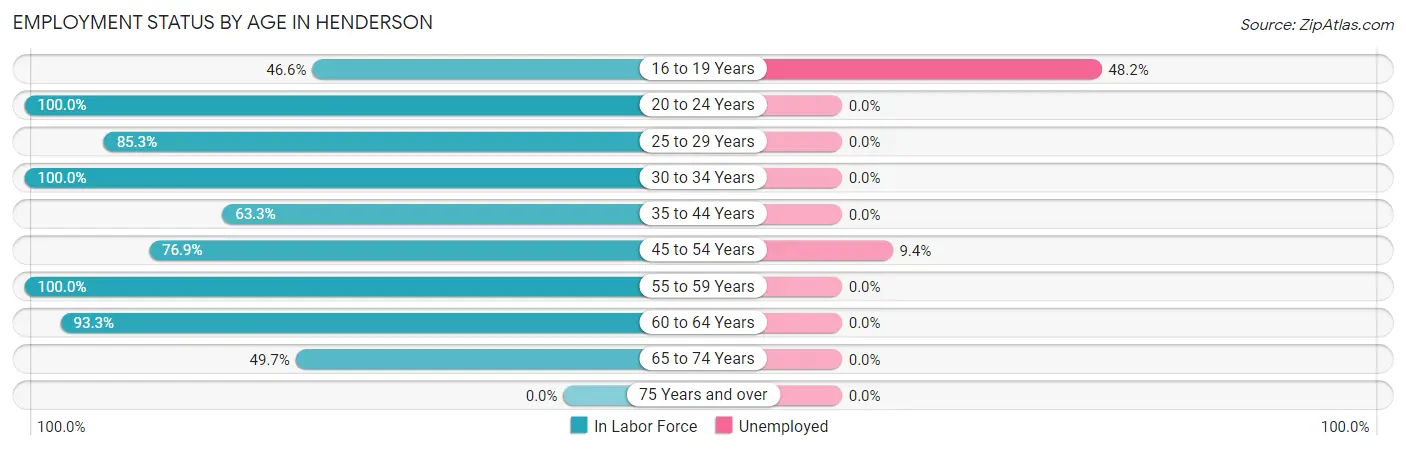
| Age Bracket | In Labor Force | Unemployed |
| 16 to 19 Years | 166 (46.6%) | 80 (48.2%) |
| 20 to 24 Years | 41 (100.0%) | 0 (0.0%) |
| 25 to 29 Years | 87 (85.3%) | 0 (0.0%) |
| 30 to 34 Years | 209 (100.0%) | 0 (0.0%) |
| 35 to 44 Years | 303 (63.3%) | 0 (0.0%) |
| 45 to 54 Years | 287 (76.9%) | 27 (9.4%) |
| 55 to 59 Years | 163 (100.0%) | 0 (0.0%) |
| 60 to 64 Years | 238 (93.3%) | 0 (0.0%) |
| 65 to 74 Years | 308 (49.7%) | 0 (0.0%) |
| 75 Years and over | 0 (0.0%) | 0 (0.0%) |
| Total | 1,803 (68.8%) | 115 (6.4%) |
Employment Status by Educational Attainment in Henderson
According to labor force statistics for Henderson, 81.4% of individuals (1,287) out of the total population between 25 and 64 years of age (1,581) are in the labor force, with 2.3% or 30 of them being unemployed. The group with the highest labor force participation rate are those with the educational attainment of college / associate degree, with 100.0% or 536 individuals in the labor force. Within the labor force, individuals with high school diploma education have the highest percentage of unemployment, with 28.7% or 27 of them being unemployed.
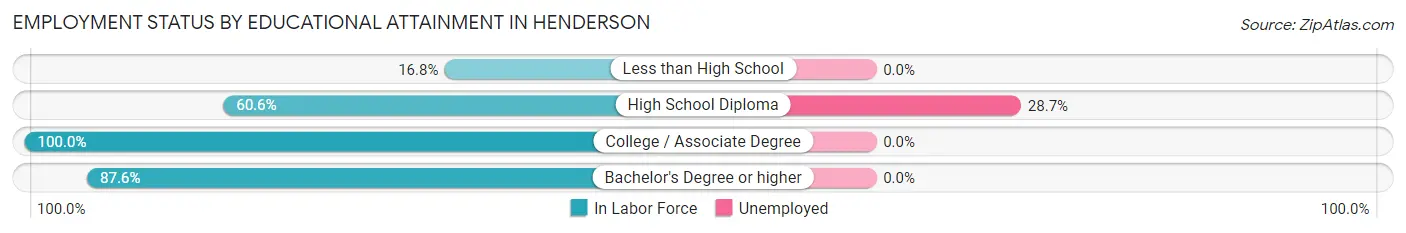
| Educational Attainment | In Labor Force | Unemployed |
| Less than High School | 29 (16.8%) | 0 (0.0%) |
| High School Diploma | 94 (60.6%) | 44 (28.7%) |
| College / Associate Degree | 536 (100.0%) | 0 (0.0%) |
| Bachelor's Degree or higher | 628 (87.6%) | 0 (0.0%) |
| Total | 1,287 (81.4%) | 36 (2.3%) |
Employment Occupations by Sex in Henderson
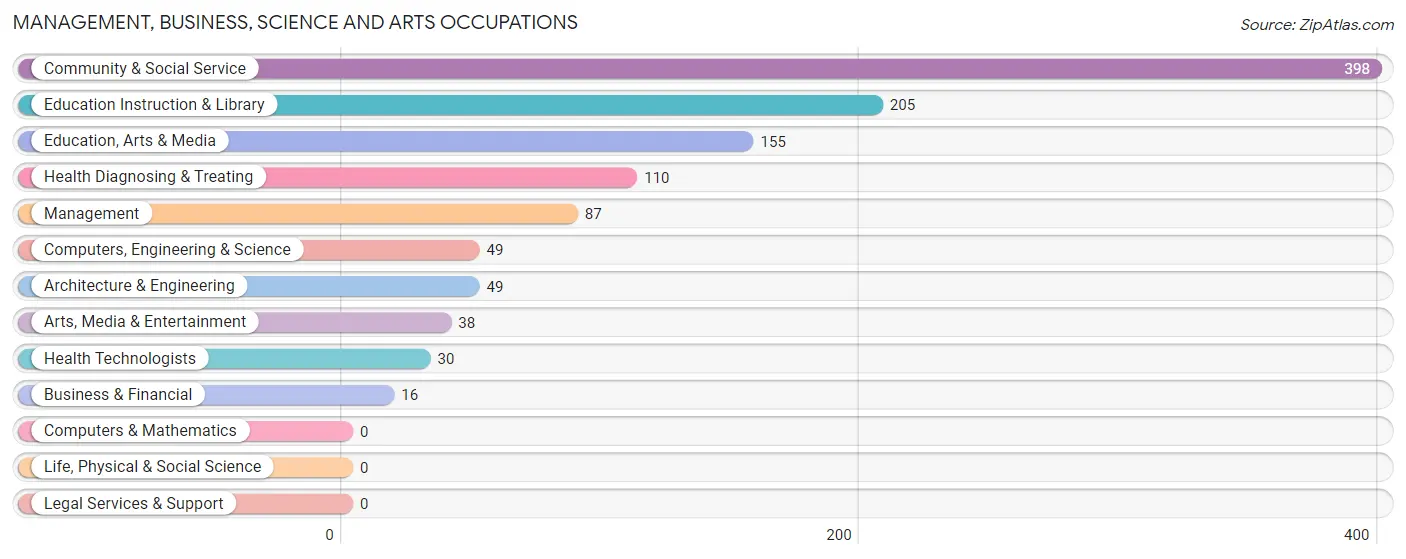
Management, Business, Science and Arts Occupations
The most common Management, Business, Science and Arts occupations in Henderson are Community & Social Service (398 | 25.5%), Education Instruction & Library (205 | 13.2%), Education, Arts & Media (155 | 9.9%), Health Diagnosing & Treating (110 | 7.1%), and Management (87 | 5.6%).
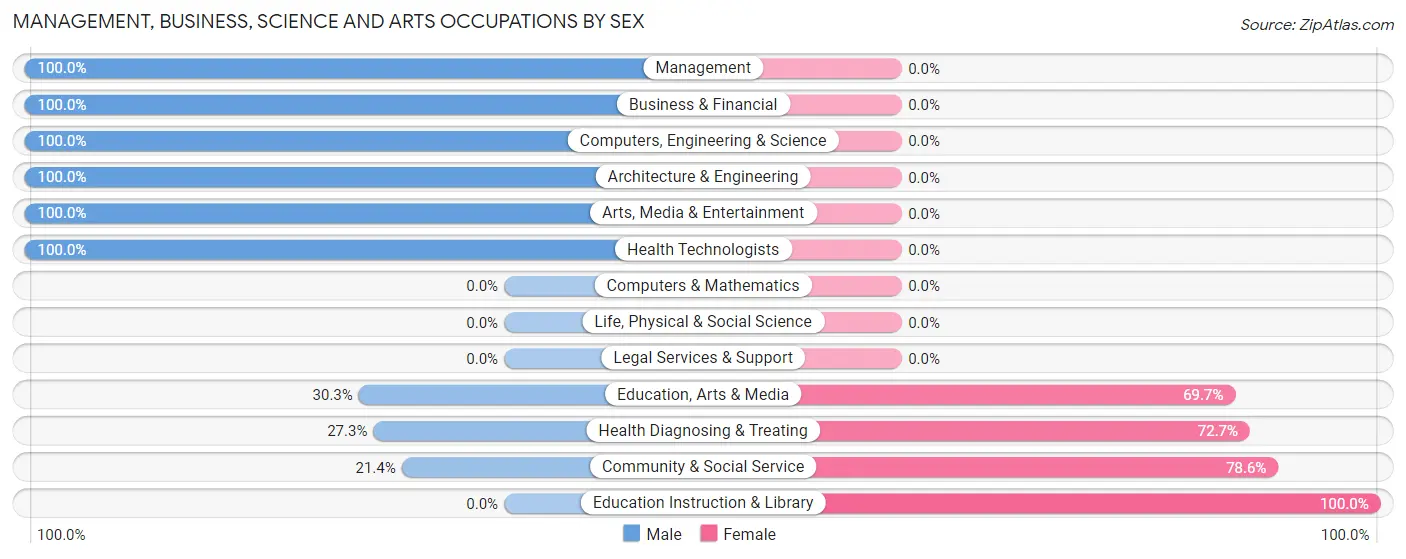
Management, Business, Science and Arts Occupations by Sex
Within the Management, Business, Science and Arts occupations in Henderson, the most male-oriented occupations are Management (100.0%), Business & Financial (100.0%), and Computers, Engineering & Science (100.0%), while the most female-oriented occupations are Education Instruction & Library (100.0%), Community & Social Service (78.6%), and Health Diagnosing & Treating (72.7%).
| Occupation | Male | Female |
| Management | 87 (100.0%) | 0 (0.0%) |
| Business & Financial | 16 (100.0%) | 0 (0.0%) |
| Computers, Engineering & Science | 49 (100.0%) | 0 (0.0%) |
| Computers & Mathematics | 0 (0.0%) | 0 (0.0%) |
| Architecture & Engineering | 49 (100.0%) | 0 (0.0%) |
| Life, Physical & Social Science | 0 (0.0%) | 0 (0.0%) |
| Community & Social Service | 85 (21.4%) | 313 (78.6%) |
| Education, Arts & Media | 47 (30.3%) | 108 (69.7%) |
| Legal Services & Support | 0 (0.0%) | 0 (0.0%) |
| Education Instruction & Library | 0 (0.0%) | 205 (100.0%) |
| Arts, Media & Entertainment | 38 (100.0%) | 0 (0.0%) |
| Health Diagnosing & Treating | 30 (27.3%) | 80 (72.7%) |
| Health Technologists | 30 (100.0%) | 0 (0.0%) |
| Total (Category) | 267 (40.5%) | 393 (59.6%) |
| Total (Overall) | 773 (49.6%) | 786 (50.4%) |
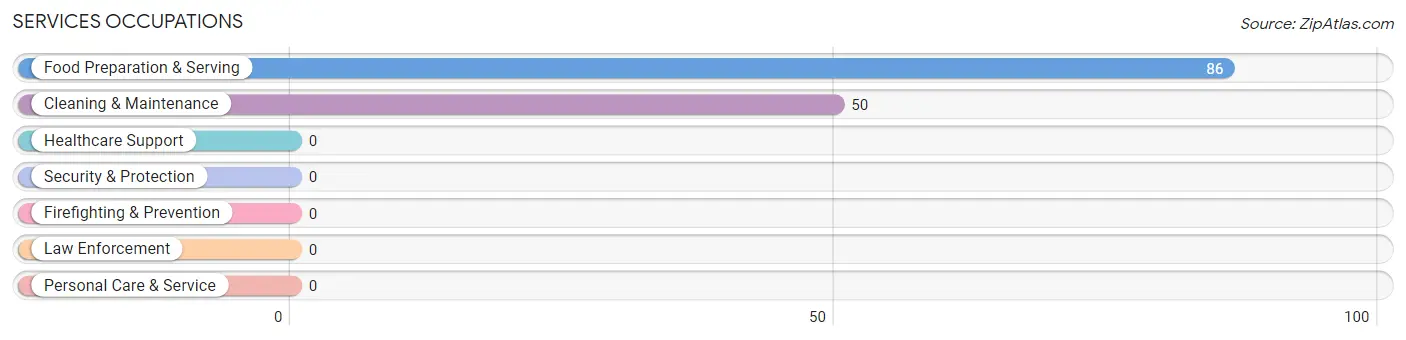
Services Occupations
The most common Services occupations in Henderson are Food Preparation & Serving (86 | 5.5%), and Cleaning & Maintenance (50 | 3.2%).
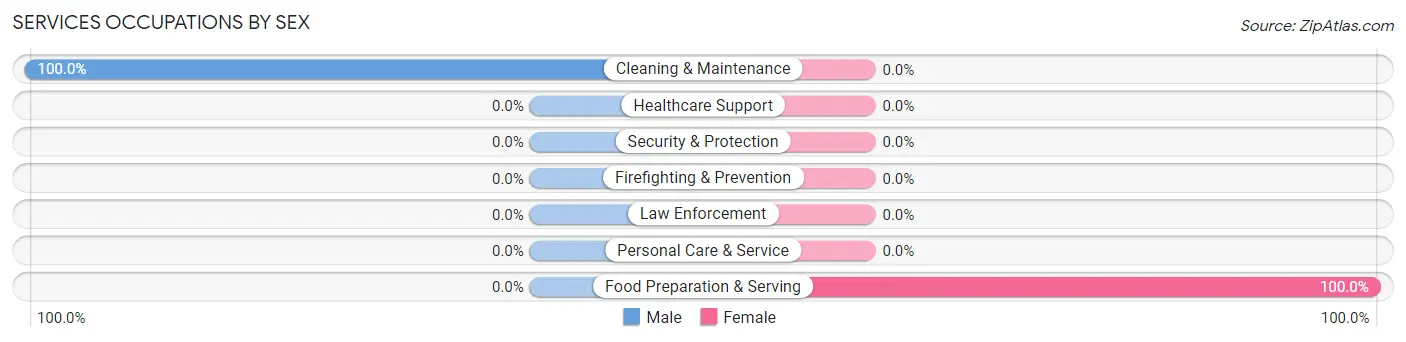
Services Occupations by Sex
| Occupation | Male | Female |
| Healthcare Support | 0 (0.0%) | 0 (0.0%) |
| Security & Protection | 0 (0.0%) | 0 (0.0%) |
| Firefighting & Prevention | 0 (0.0%) | 0 (0.0%) |
| Law Enforcement | 0 (0.0%) | 0 (0.0%) |
| Food Preparation & Serving | 0 (0.0%) | 86 (100.0%) |
| Cleaning & Maintenance | 50 (100.0%) | 0 (0.0%) |
| Personal Care & Service | 0 (0.0%) | 0 (0.0%) |
| Total (Category) | 50 (36.8%) | 86 (63.2%) |
| Total (Overall) | 773 (49.6%) | 786 (50.4%) |
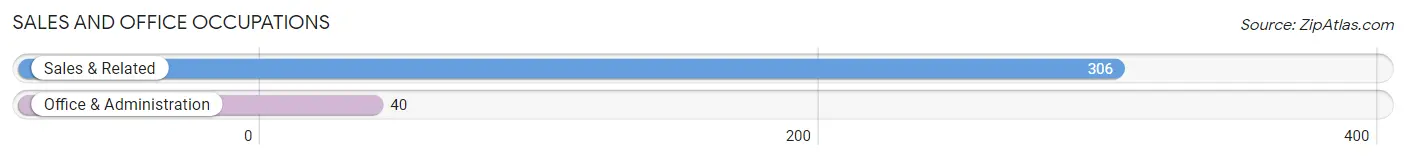
Sales and Office Occupations
The most common Sales and Office occupations in Henderson are Sales & Related (306 | 19.6%), and Office & Administration (40 | 2.6%).
Sales and Office Occupations by Sex
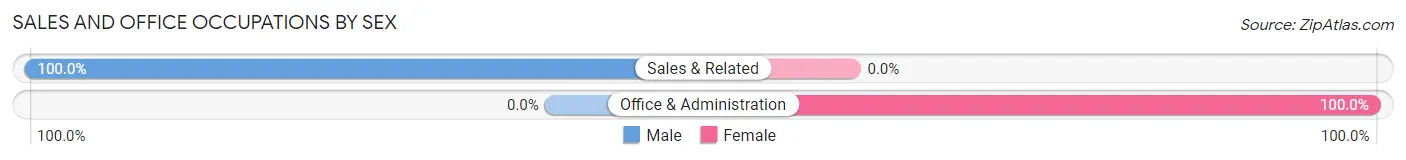
| Occupation | Male | Female |
| Sales & Related | 306 (100.0%) | 0 (0.0%) |
| Office & Administration | 0 (0.0%) | 40 (100.0%) |
| Total (Category) | 306 (88.4%) | 40 (11.6%) |
| Total (Overall) | 773 (49.6%) | 786 (50.4%) |
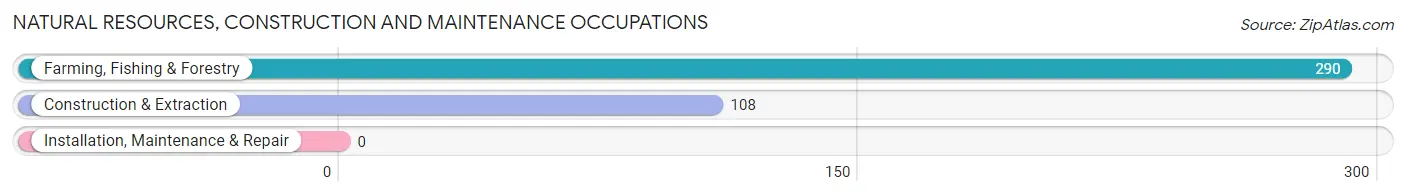
Natural Resources, Construction and Maintenance Occupations
The most common Natural Resources, Construction and Maintenance occupations in Henderson are Farming, Fishing & Forestry (290 | 18.6%), and Construction & Extraction (108 | 6.9%).
Natural Resources, Construction and Maintenance Occupations by Sex
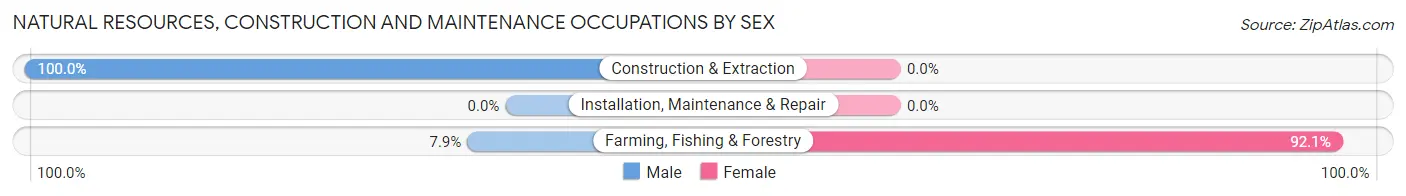
| Occupation | Male | Female |
| Farming, Fishing & Forestry | 23 (7.9%) | 267 (92.1%) |
| Construction & Extraction | 108 (100.0%) | 0 (0.0%) |
| Installation, Maintenance & Repair | 0 (0.0%) | 0 (0.0%) |
| Total (Category) | 131 (32.9%) | 267 (67.1%) |
| Total (Overall) | 773 (49.6%) | 786 (50.4%) |
Production, Transportation and Moving Occupations
The most common Production, Transportation and Moving occupations in Henderson are , and Transportation (19 | 1.2%).
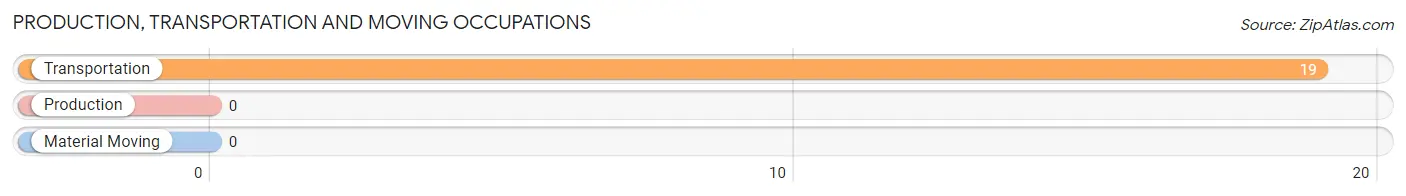
Production, Transportation and Moving Occupations by Sex
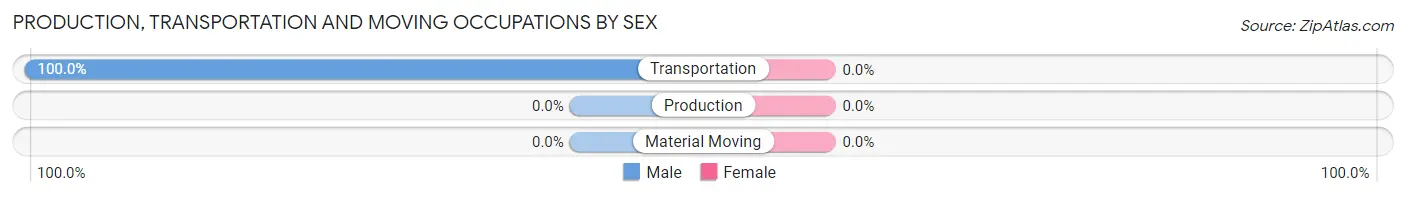
| Occupation | Male | Female |
| Production | 0 (0.0%) | 0 (0.0%) |
| Transportation | 19 (100.0%) | 0 (0.0%) |
| Material Moving | 0 (0.0%) | 0 (0.0%) |
| Total (Category) | 19 (100.0%) | 0 (0.0%) |
| Total (Overall) | 773 (49.6%) | 786 (50.4%) |
Employment Industries by Sex in Henderson
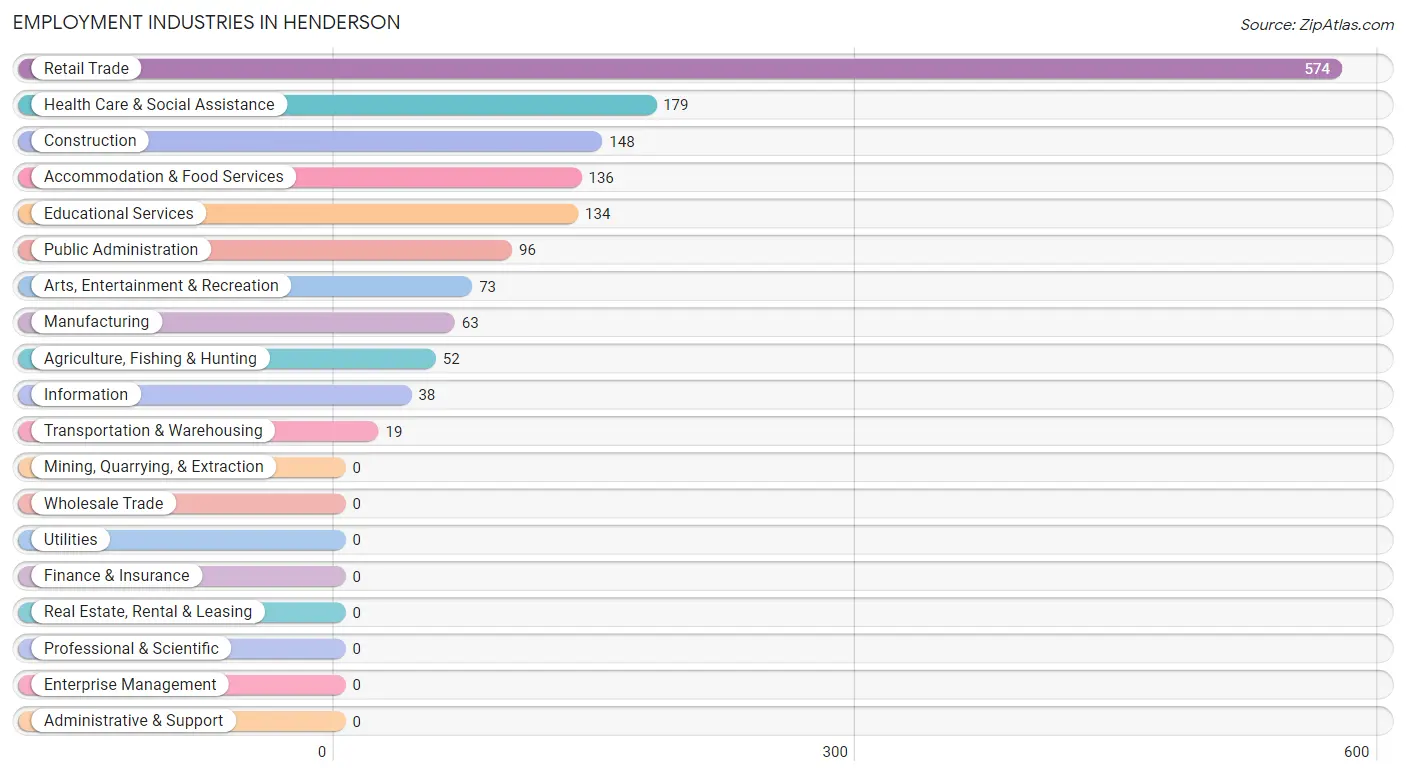
Employment Industries in Henderson
The major employment industries in Henderson include Retail Trade (574 | 36.8%), Health Care & Social Assistance (179 | 11.5%), Construction (148 | 9.5%), Accommodation & Food Services (136 | 8.7%), and Educational Services (134 | 8.6%).
Employment Industries by Sex in Henderson
The Henderson industries that see more men than women are Manufacturing (100.0%), Transportation & Warehousing (100.0%), and Information (100.0%), whereas the industries that tend to have a higher number of women are Educational Services (100.0%), Health Care & Social Assistance (100.0%), and Public Administration (83.3%).
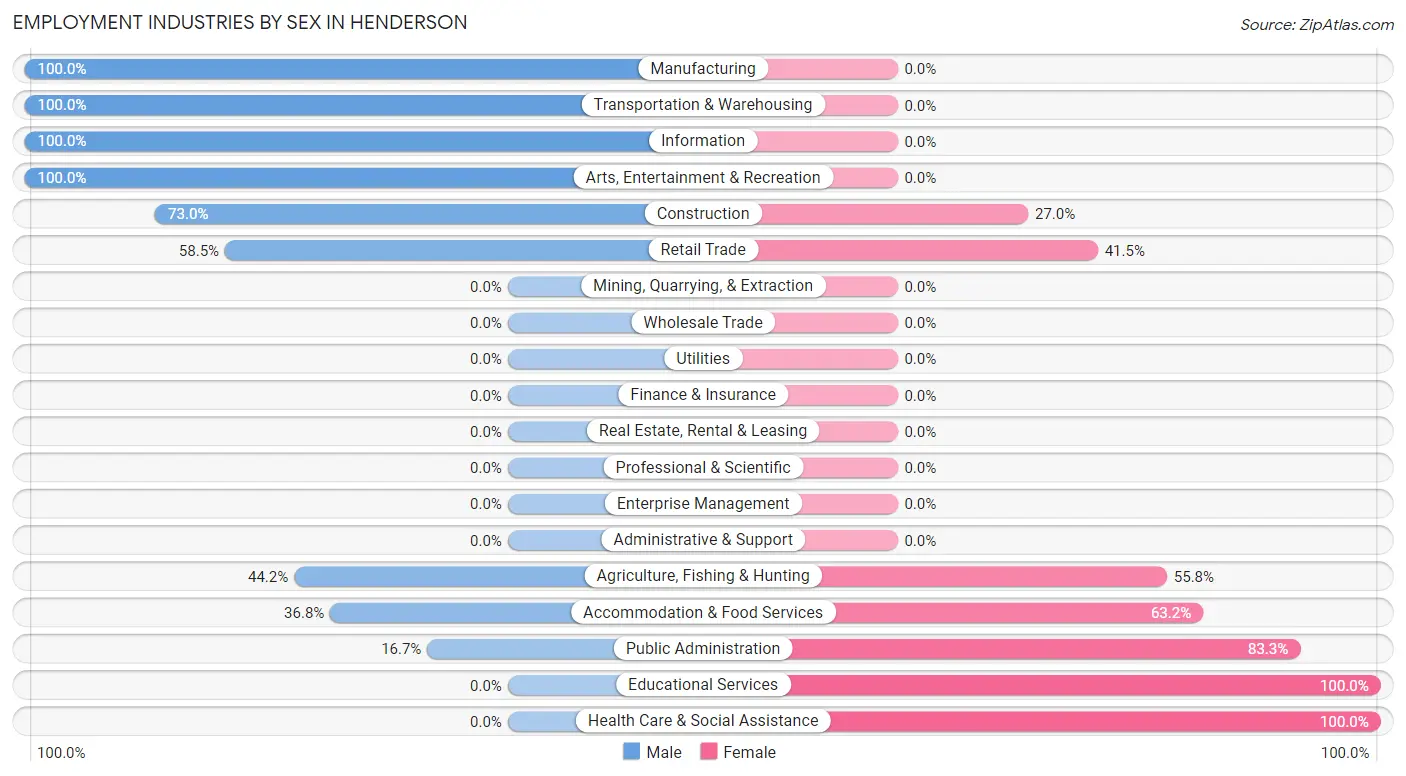
| Industry | Male | Female |
| Agriculture, Fishing & Hunting | 23 (44.2%) | 29 (55.8%) |
| Mining, Quarrying, & Extraction | 0 (0.0%) | 0 (0.0%) |
| Construction | 108 (73.0%) | 40 (27.0%) |
| Manufacturing | 63 (100.0%) | 0 (0.0%) |
| Wholesale Trade | 0 (0.0%) | 0 (0.0%) |
| Retail Trade | 336 (58.5%) | 238 (41.5%) |
| Transportation & Warehousing | 19 (100.0%) | 0 (0.0%) |
| Utilities | 0 (0.0%) | 0 (0.0%) |
| Information | 38 (100.0%) | 0 (0.0%) |
| Finance & Insurance | 0 (0.0%) | 0 (0.0%) |
| Real Estate, Rental & Leasing | 0 (0.0%) | 0 (0.0%) |
| Professional & Scientific | 0 (0.0%) | 0 (0.0%) |
| Enterprise Management | 0 (0.0%) | 0 (0.0%) |
| Administrative & Support | 0 (0.0%) | 0 (0.0%) |
| Educational Services | 0 (0.0%) | 134 (100.0%) |
| Health Care & Social Assistance | 0 (0.0%) | 179 (100.0%) |
| Arts, Entertainment & Recreation | 73 (100.0%) | 0 (0.0%) |
| Accommodation & Food Services | 50 (36.8%) | 86 (63.2%) |
| Public Administration | 16 (16.7%) | 80 (83.3%) |
| Total | 773 (49.6%) | 786 (50.4%) |
Education in Henderson
School Enrollment in Henderson
The most common levels of schooling among the 874 students in Henderson are high school (338 | 38.7%), nursery / preschool (186 | 21.3%), and middle school (180 | 20.6%).
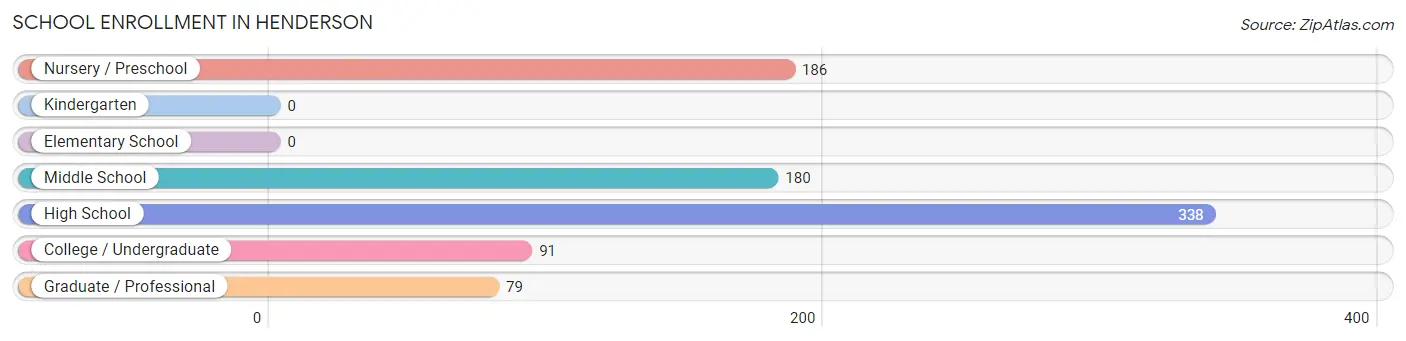
| School Level | # Students | % Students |
| Nursery / Preschool | 186 | 21.3% |
| Kindergarten | 0 | 0.0% |
| Elementary School | 0 | 0.0% |
| Middle School | 180 | 20.6% |
| High School | 338 | 38.7% |
| College / Undergraduate | 91 | 10.4% |
| Graduate / Professional | 79 | 9.0% |
| Total | 874 | 100.0% |
School Enrollment by Age by Funding Source in Henderson
Out of a total of 874 students who are enrolled in schools in Henderson, 233 (26.7%) attend a private institution, while the remaining 641 (73.3%) are enrolled in public schools. The age group of 5 to 9 year old has the highest likelihood of being enrolled in private schools, with 23 (100.0% in the age bracket) enrolled. Conversely, the age group of 10 to 14 year olds has the lowest likelihood of being enrolled in a private school, with 92 (100.0% in the age bracket) attending a public institution.
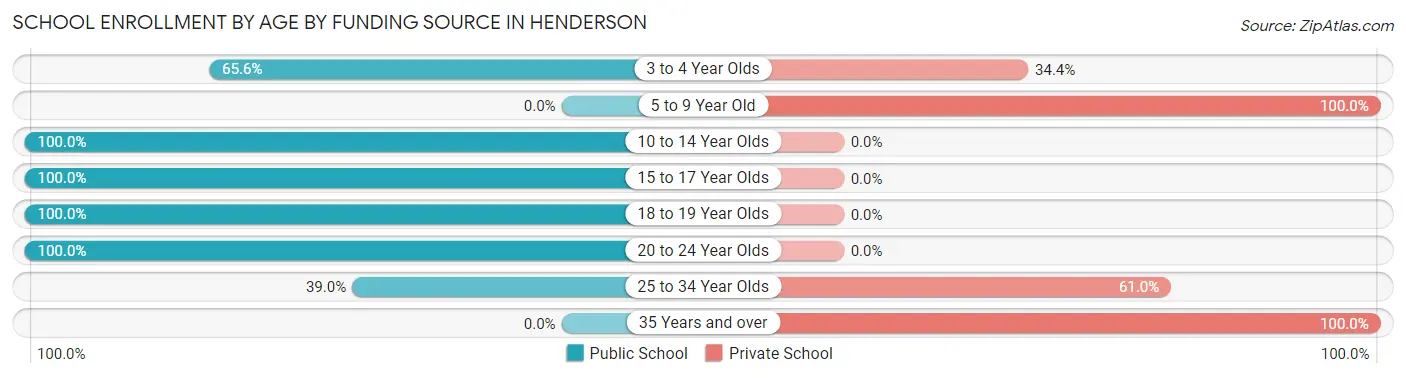
| Age Bracket | Public School | Private School |
| 3 to 4 Year Olds | 107 (65.6%) | 56 (34.4%) |
| 5 to 9 Year Old | 0 (0.0%) | 23 (100.0%) |
| 10 to 14 Year Olds | 92 (100.0%) | 0 (0.0%) |
| 15 to 17 Year Olds | 283 (100.0%) | 0 (0.0%) |
| 18 to 19 Year Olds | 86 (100.0%) | 0 (0.0%) |
| 20 to 24 Year Olds | 41 (100.0%) | 0 (0.0%) |
| 25 to 34 Year Olds | 32 (39.0%) | 50 (61.0%) |
| 35 Years and over | 0 (0.0%) | 104 (100.0%) |
| Total | 641 (73.3%) | 233 (26.7%) |
Educational Attainment by Field of Study in Henderson
Engineering (287 | 24.1%), business (277 | 23.2%), visual & performing arts (112 | 9.4%), bio, nature & agricultural (97 | 8.1%), and social sciences (83 | 7.0%) are the most common fields of study among 1,193 individuals in Henderson who have obtained a bachelor's degree or higher.
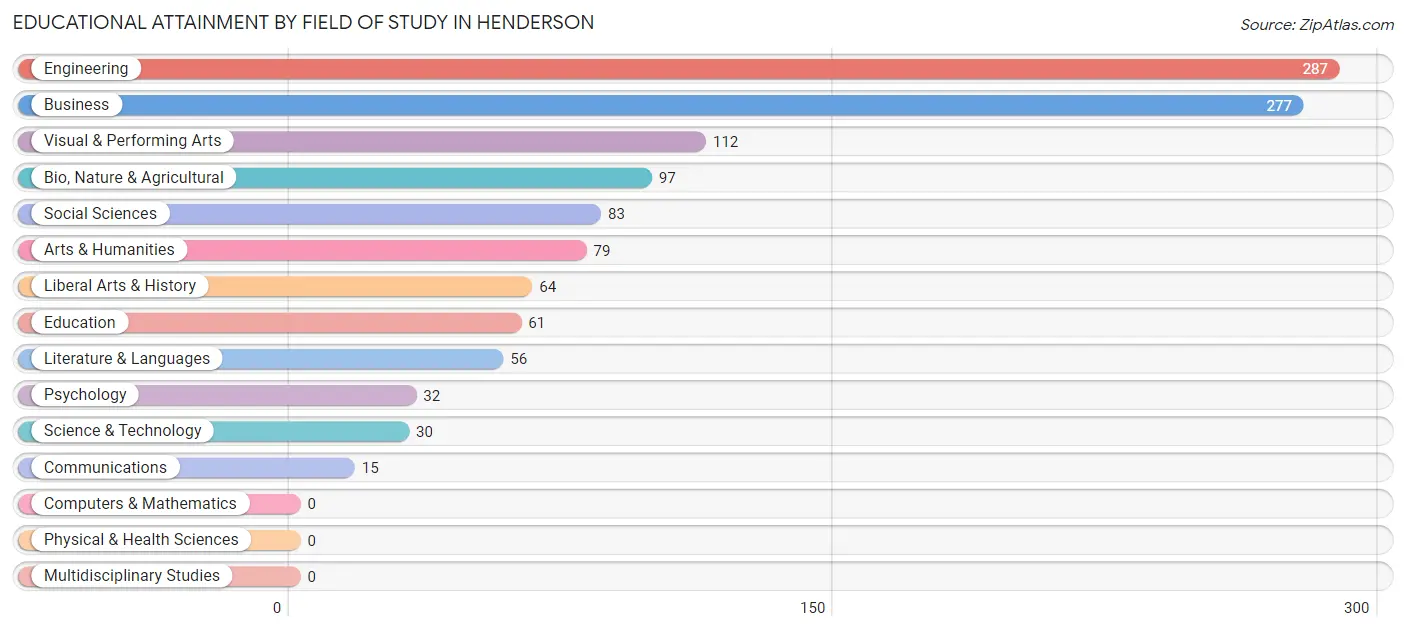
| Field of Study | # Graduates | % Graduates |
| Computers & Mathematics | 0 | 0.0% |
| Bio, Nature & Agricultural | 97 | 8.1% |
| Physical & Health Sciences | 0 | 0.0% |
| Psychology | 32 | 2.7% |
| Social Sciences | 83 | 7.0% |
| Engineering | 287 | 24.1% |
| Multidisciplinary Studies | 0 | 0.0% |
| Science & Technology | 30 | 2.5% |
| Business | 277 | 23.2% |
| Education | 61 | 5.1% |
| Literature & Languages | 56 | 4.7% |
| Liberal Arts & History | 64 | 5.4% |
| Visual & Performing Arts | 112 | 9.4% |
| Communications | 15 | 1.3% |
| Arts & Humanities | 79 | 6.6% |
| Total | 1,193 | 100.0% |
Transportation & Commute in Henderson
Vehicle Availability by Sex in Henderson
The most prevalent vehicle ownership categories in Henderson are males with 1 vehicle (324, accounting for 47.2%) and females with 1 vehicle (413, making up 41.2%).
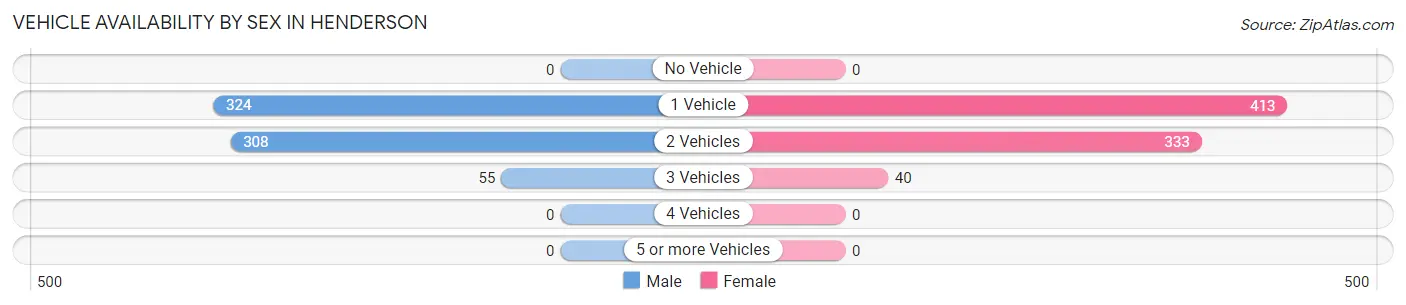
| Vehicles Available | Male | Female |
| No Vehicle | 0 (0.0%) | 0 (0.0%) |
| 1 Vehicle | 324 (47.2%) | 413 (52.5%) |
| 2 Vehicles | 308 (44.8%) | 333 (42.4%) |
| 3 Vehicles | 55 (8.0%) | 40 (5.1%) |
| 4 Vehicles | 0 (0.0%) | 0 (0.0%) |
| 5 or more Vehicles | 0 (0.0%) | 0 (0.0%) |
| Total | 687 (100.0%) | 786 (100.0%) |
Commute Time in Henderson
The most frequently occuring commute durations in Henderson are 20 to 24 minutes (527 commuters, 39.5%), 30 to 34 minutes (199 commuters, 14.9%), and 35 to 39 minutes (151 commuters, 11.3%).
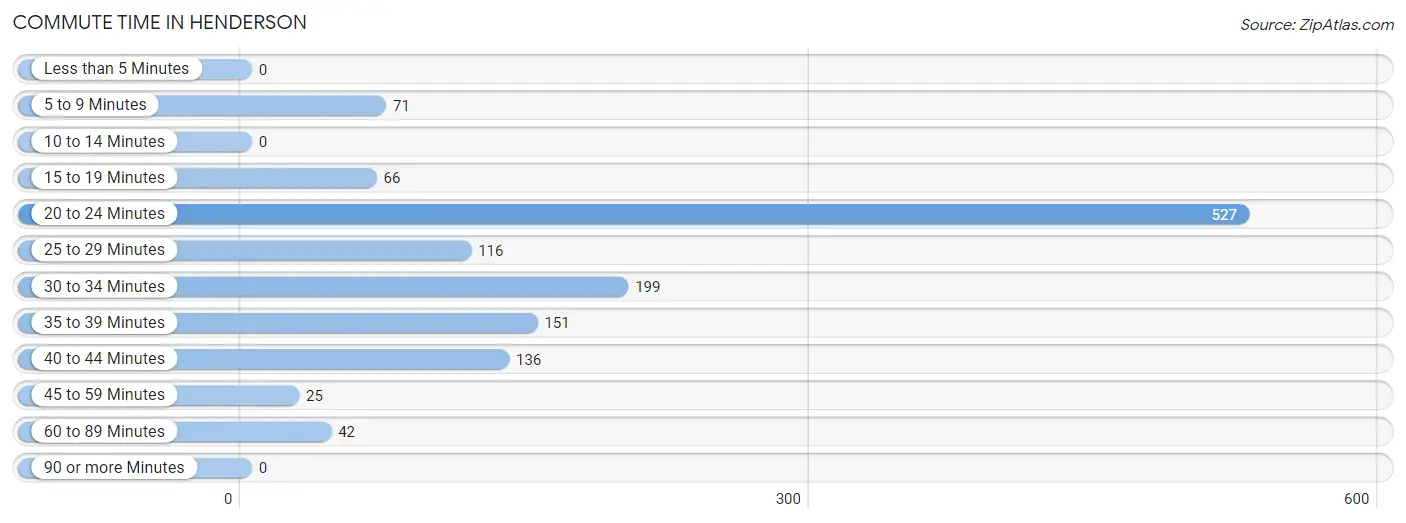
| Commute Time | # Commuters | % Commuters |
| Less than 5 Minutes | 0 | 0.0% |
| 5 to 9 Minutes | 71 | 5.3% |
| 10 to 14 Minutes | 0 | 0.0% |
| 15 to 19 Minutes | 66 | 5.0% |
| 20 to 24 Minutes | 527 | 39.5% |
| 25 to 29 Minutes | 116 | 8.7% |
| 30 to 34 Minutes | 199 | 14.9% |
| 35 to 39 Minutes | 151 | 11.3% |
| 40 to 44 Minutes | 136 | 10.2% |
| 45 to 59 Minutes | 25 | 1.9% |
| 60 to 89 Minutes | 42 | 3.2% |
| 90 or more Minutes | 0 | 0.0% |
Commute Time by Sex in Henderson
The most common commute times in Henderson are 30 to 34 minutes (199 commuters, 33.9%) for males and 20 to 24 minutes (375 commuters, 50.3%) for females.
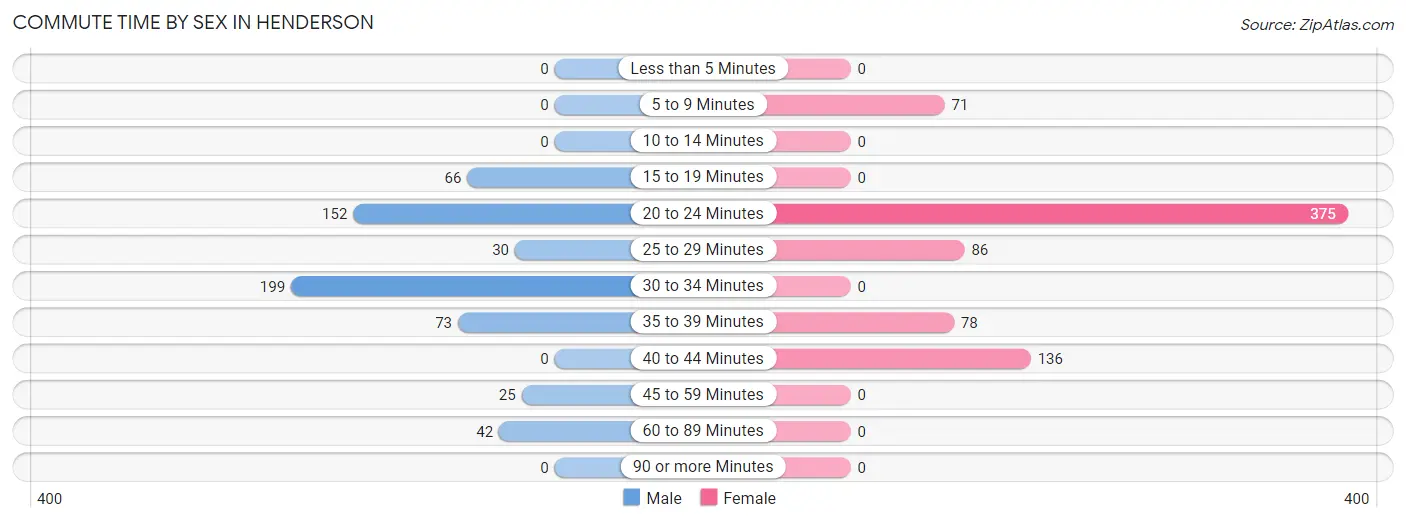
| Commute Time | Male | Female |
| Less than 5 Minutes | 0 (0.0%) | 0 (0.0%) |
| 5 to 9 Minutes | 0 (0.0%) | 71 (9.5%) |
| 10 to 14 Minutes | 0 (0.0%) | 0 (0.0%) |
| 15 to 19 Minutes | 66 (11.2%) | 0 (0.0%) |
| 20 to 24 Minutes | 152 (25.9%) | 375 (50.3%) |
| 25 to 29 Minutes | 30 (5.1%) | 86 (11.5%) |
| 30 to 34 Minutes | 199 (33.9%) | 0 (0.0%) |
| 35 to 39 Minutes | 73 (12.4%) | 78 (10.5%) |
| 40 to 44 Minutes | 0 (0.0%) | 136 (18.2%) |
| 45 to 59 Minutes | 25 (4.3%) | 0 (0.0%) |
| 60 to 89 Minutes | 42 (7.2%) | 0 (0.0%) |
| 90 or more Minutes | 0 (0.0%) | 0 (0.0%) |
Time of Departure to Work by Sex in Henderson
The most frequent times of departure to work in Henderson are 7:30 AM to 7:59 AM (182, 31.0%) for males and 5:30 AM to 5:59 AM (238, 31.9%) for females.
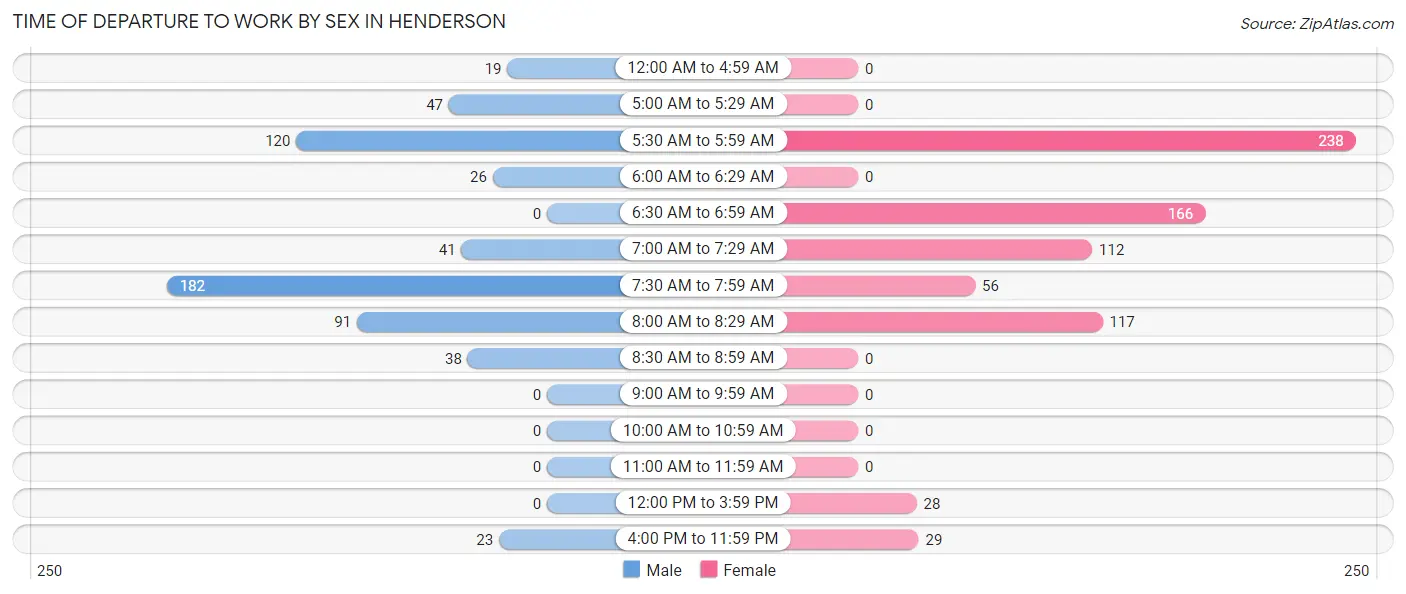
| Time of Departure | Male | Female |
| 12:00 AM to 4:59 AM | 19 (3.2%) | 0 (0.0%) |
| 5:00 AM to 5:29 AM | 47 (8.0%) | 0 (0.0%) |
| 5:30 AM to 5:59 AM | 120 (20.4%) | 238 (31.9%) |
| 6:00 AM to 6:29 AM | 26 (4.4%) | 0 (0.0%) |
| 6:30 AM to 6:59 AM | 0 (0.0%) | 166 (22.3%) |
| 7:00 AM to 7:29 AM | 41 (7.0%) | 112 (15.0%) |
| 7:30 AM to 7:59 AM | 182 (31.0%) | 56 (7.5%) |
| 8:00 AM to 8:29 AM | 91 (15.5%) | 117 (15.7%) |
| 8:30 AM to 8:59 AM | 38 (6.5%) | 0 (0.0%) |
| 9:00 AM to 9:59 AM | 0 (0.0%) | 0 (0.0%) |
| 10:00 AM to 10:59 AM | 0 (0.0%) | 0 (0.0%) |
| 11:00 AM to 11:59 AM | 0 (0.0%) | 0 (0.0%) |
| 12:00 PM to 3:59 PM | 0 (0.0%) | 28 (3.7%) |
| 4:00 PM to 11:59 PM | 23 (3.9%) | 29 (3.9%) |
| Total | 587 (100.0%) | 746 (100.0%) |
Housing Occupancy in Henderson
Occupancy by Ownership in Henderson
Of the total 1,274 dwellings in Henderson, owner-occupied units account for 790 (62.0%), while renter-occupied units make up 484 (38.0%).
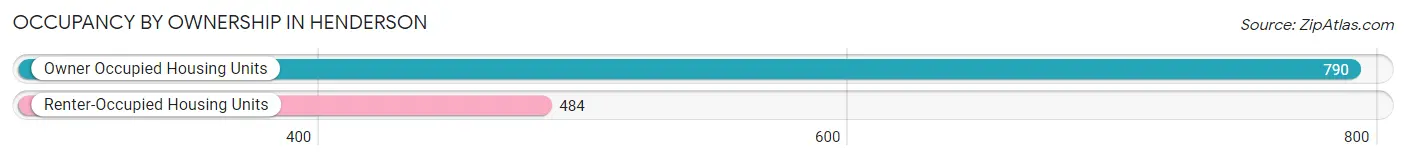
| Occupancy | # Housing Units | % Housing Units |
| Owner Occupied Housing Units | 790 | 62.0% |
| Renter-Occupied Housing Units | 484 | 38.0% |
| Total Occupied Housing Units | 1,274 | 100.0% |
Occupancy by Household Size in Henderson
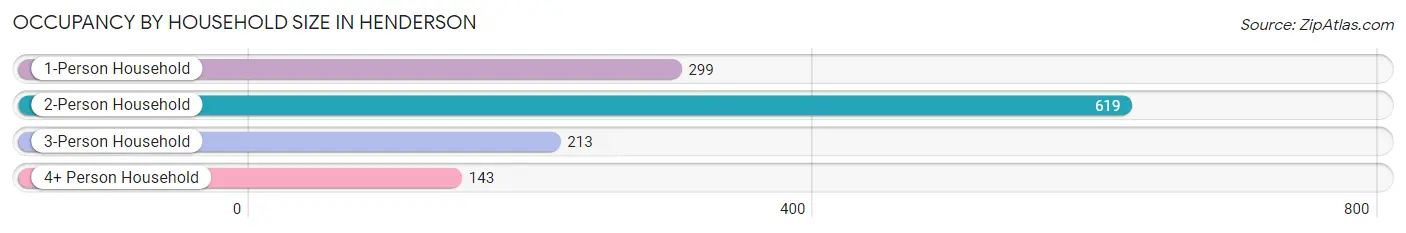
| Household Size | # Housing Units | % Housing Units |
| 1-Person Household | 299 | 23.5% |
| 2-Person Household | 619 | 48.6% |
| 3-Person Household | 213 | 16.7% |
| 4+ Person Household | 143 | 11.2% |
| Total Housing Units | 1,274 | 100.0% |
Occupancy by Ownership by Household Size in Henderson
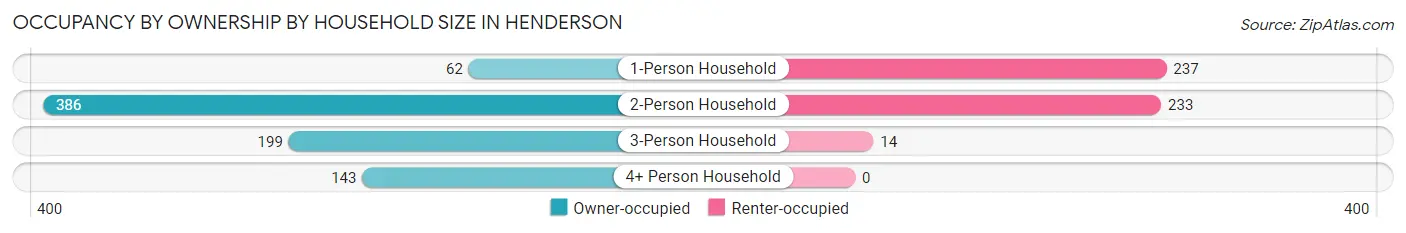
| Household Size | Owner-occupied | Renter-occupied |
| 1-Person Household | 62 (20.7%) | 237 (79.3%) |
| 2-Person Household | 386 (62.4%) | 233 (37.6%) |
| 3-Person Household | 199 (93.4%) | 14 (6.6%) |
| 4+ Person Household | 143 (100.0%) | 0 (0.0%) |
| Total Housing Units | 790 (62.0%) | 484 (38.0%) |
Occupancy by Educational Attainment in Henderson
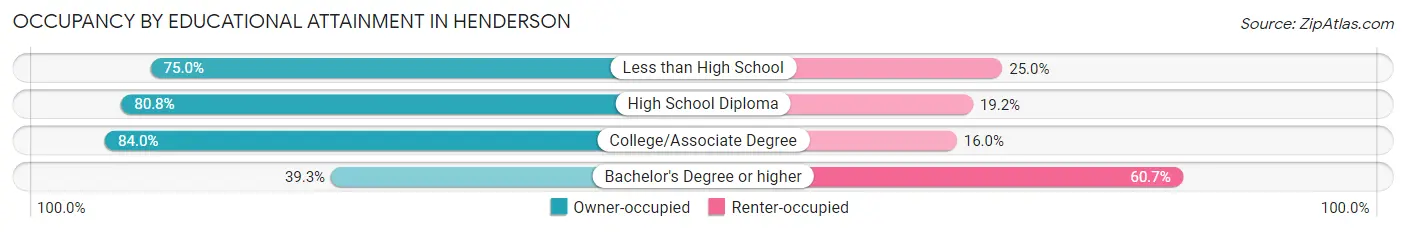
| Household Size | Owner-occupied | Renter-occupied |
| Less than High School | 87 (75.0%) | 29 (25.0%) |
| High School Diploma | 80 (80.8%) | 19 (19.2%) |
| College/Associate Degree | 389 (84.0%) | 74 (16.0%) |
| Bachelor's Degree or higher | 234 (39.3%) | 362 (60.7%) |
Occupancy by Age of Householder in Henderson
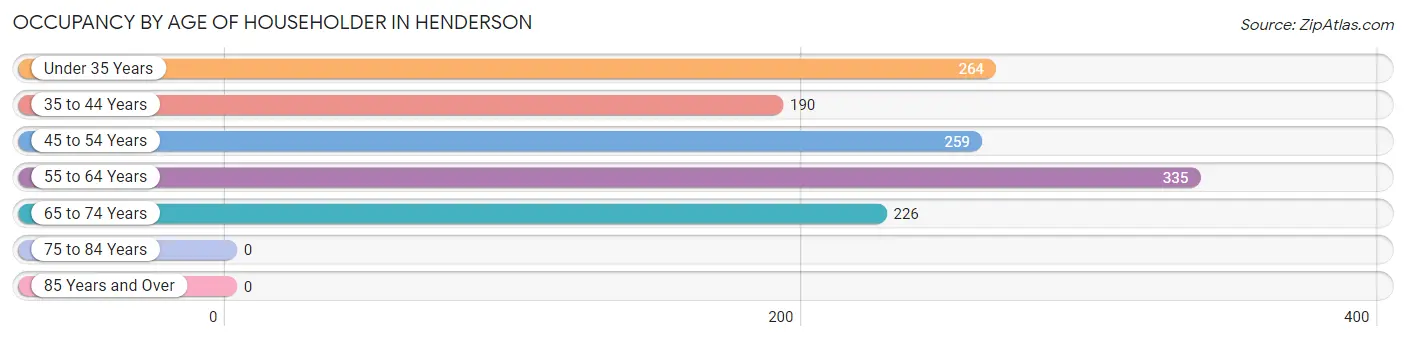
| Age Bracket | # Households | % Households |
| Under 35 Years | 264 | 20.7% |
| 35 to 44 Years | 190 | 14.9% |
| 45 to 54 Years | 259 | 20.3% |
| 55 to 64 Years | 335 | 26.3% |
| 65 to 74 Years | 226 | 17.7% |
| 75 to 84 Years | 0 | 0.0% |
| 85 Years and Over | 0 | 0.0% |
| Total | 1,274 | 100.0% |
Housing Finances in Henderson
Median Income by Occupancy in Henderson
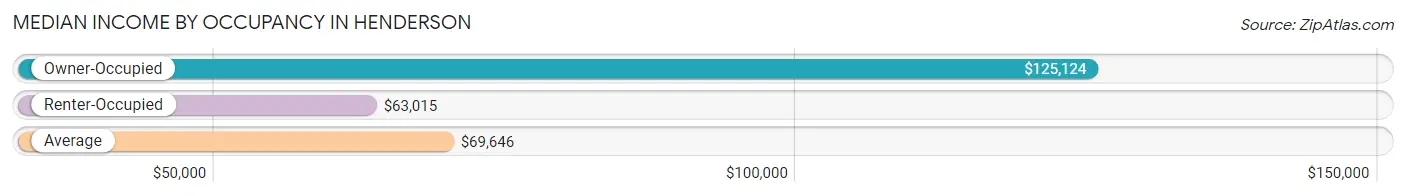
| Occupancy Type | # Households | Median Income |
| Owner-Occupied | 790 (62.0%) | $125,124 |
| Renter-Occupied | 484 (38.0%) | $63,015 |
| Average | 1,274 (100.0%) | $69,646 |
Occupancy by Householder Income Bracket in Henderson
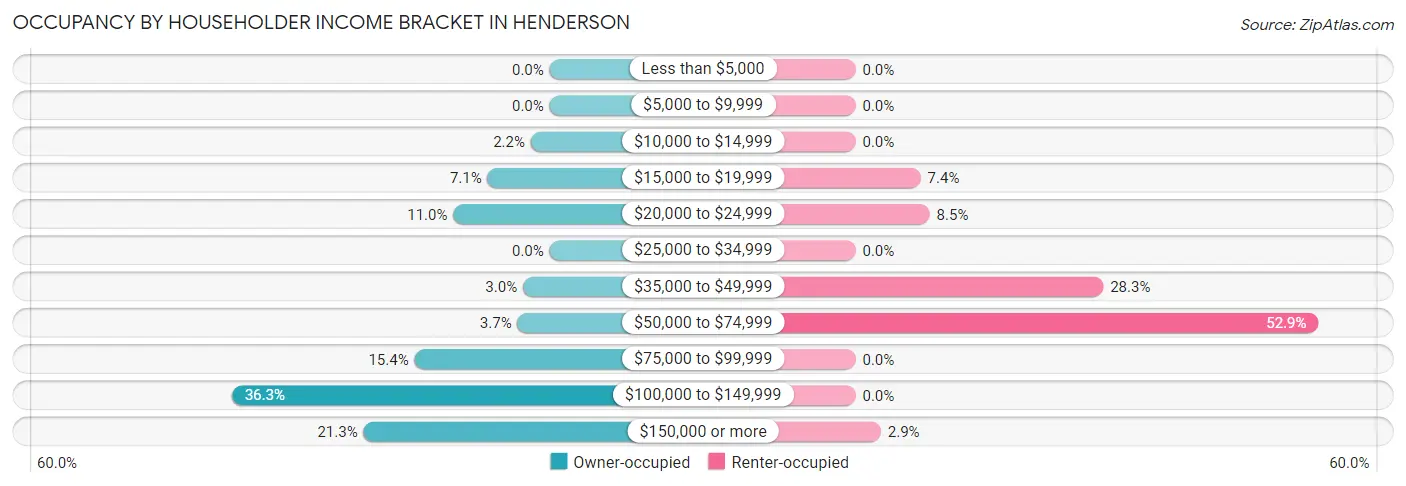
| Income Bracket | Owner-occupied | Renter-occupied |
| Less than $5,000 | 0 (0.0%) | 0 (0.0%) |
| $5,000 to $9,999 | 0 (0.0%) | 0 (0.0%) |
| $10,000 to $14,999 | 17 (2.1%) | 0 (0.0%) |
| $15,000 to $19,999 | 56 (7.1%) | 36 (7.4%) |
| $20,000 to $24,999 | 87 (11.0%) | 41 (8.5%) |
| $25,000 to $34,999 | 0 (0.0%) | 0 (0.0%) |
| $35,000 to $49,999 | 24 (3.0%) | 137 (28.3%) |
| $50,000 to $74,999 | 29 (3.7%) | 256 (52.9%) |
| $75,000 to $99,999 | 122 (15.4%) | 0 (0.0%) |
| $100,000 to $149,999 | 287 (36.3%) | 0 (0.0%) |
| $150,000 or more | 168 (21.3%) | 14 (2.9%) |
| Total | 790 (100.0%) | 484 (100.0%) |
Monthly Housing Cost Tiers in Henderson
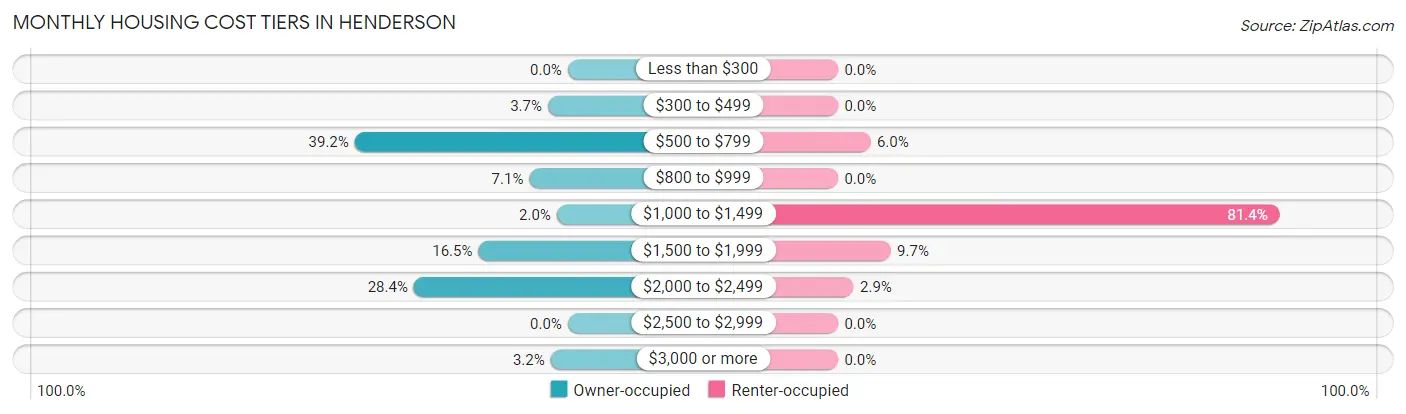
| Monthly Cost | Owner-occupied | Renter-occupied |
| Less than $300 | 0 (0.0%) | 0 (0.0%) |
| $300 to $499 | 29 (3.7%) | 0 (0.0%) |
| $500 to $799 | 310 (39.2%) | 29 (6.0%) |
| $800 to $999 | 56 (7.1%) | 0 (0.0%) |
| $1,000 to $1,499 | 16 (2.0%) | 394 (81.4%) |
| $1,500 to $1,999 | 130 (16.5%) | 47 (9.7%) |
| $2,000 to $2,499 | 224 (28.3%) | 14 (2.9%) |
| $2,500 to $2,999 | 0 (0.0%) | 0 (0.0%) |
| $3,000 or more | 25 (3.2%) | 0 (0.0%) |
| Total | 790 (100.0%) | 484 (100.0%) |
Physical Housing Characteristics in Henderson
Housing Structures in Henderson
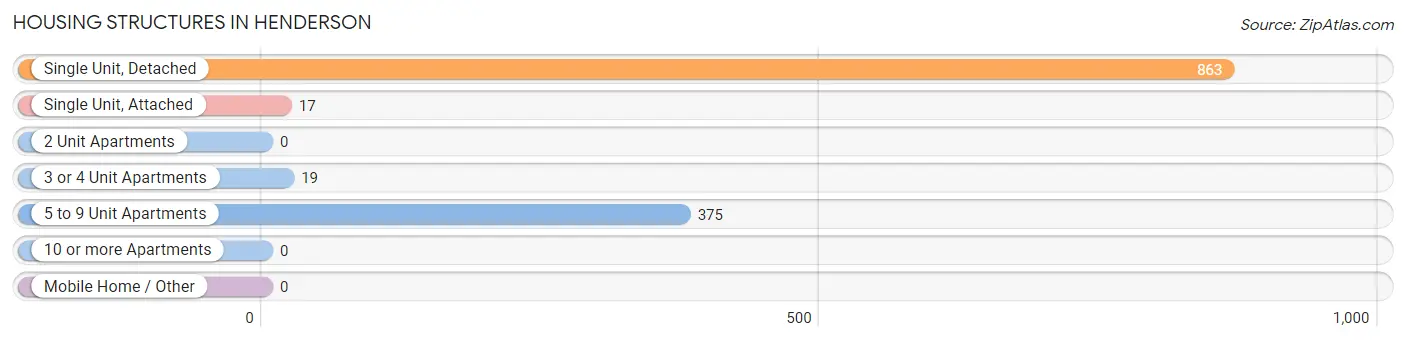
| Structure Type | # Housing Units | % Housing Units |
| Single Unit, Detached | 863 | 67.7% |
| Single Unit, Attached | 17 | 1.3% |
| 2 Unit Apartments | 0 | 0.0% |
| 3 or 4 Unit Apartments | 19 | 1.5% |
| 5 to 9 Unit Apartments | 375 | 29.4% |
| 10 or more Apartments | 0 | 0.0% |
| Mobile Home / Other | 0 | 0.0% |
| Total | 1,274 | 100.0% |
Housing Structures by Occupancy in Henderson
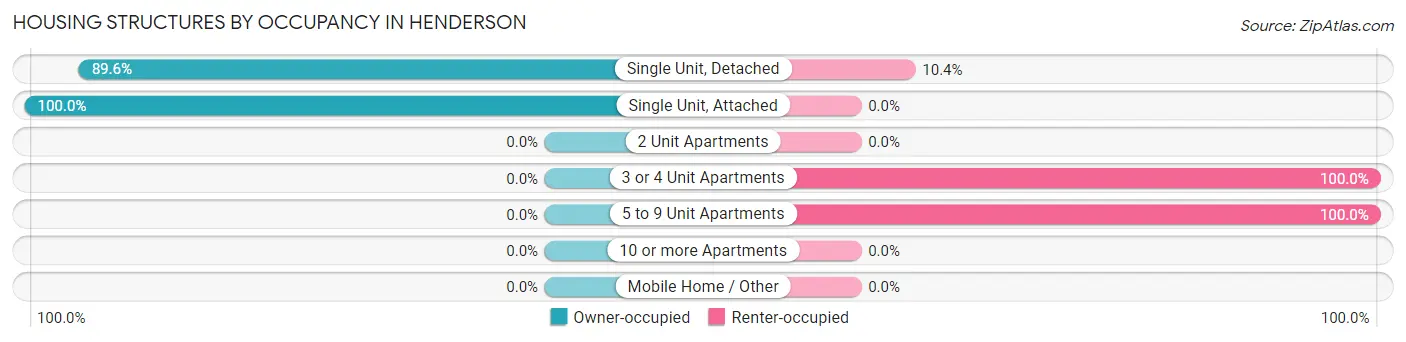
| Structure Type | Owner-occupied | Renter-occupied |
| Single Unit, Detached | 773 (89.6%) | 90 (10.4%) |
| Single Unit, Attached | 17 (100.0%) | 0 (0.0%) |
| 2 Unit Apartments | 0 (0.0%) | 0 (0.0%) |
| 3 or 4 Unit Apartments | 0 (0.0%) | 19 (100.0%) |
| 5 to 9 Unit Apartments | 0 (0.0%) | 375 (100.0%) |
| 10 or more Apartments | 0 (0.0%) | 0 (0.0%) |
| Mobile Home / Other | 0 (0.0%) | 0 (0.0%) |
| Total | 790 (62.0%) | 484 (38.0%) |
Housing Structures by Number of Rooms in Henderson
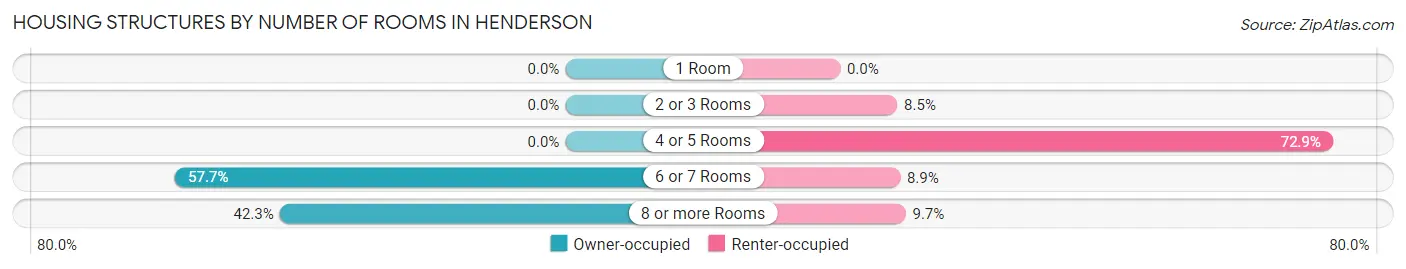
| Number of Rooms | Owner-occupied | Renter-occupied |
| 1 Room | 0 (0.0%) | 0 (0.0%) |
| 2 or 3 Rooms | 0 (0.0%) | 41 (8.5%) |
| 4 or 5 Rooms | 0 (0.0%) | 353 (72.9%) |
| 6 or 7 Rooms | 456 (57.7%) | 43 (8.9%) |
| 8 or more Rooms | 334 (42.3%) | 47 (9.7%) |
| Total | 790 (100.0%) | 484 (100.0%) |
Housing Structure by Heating Type in Henderson
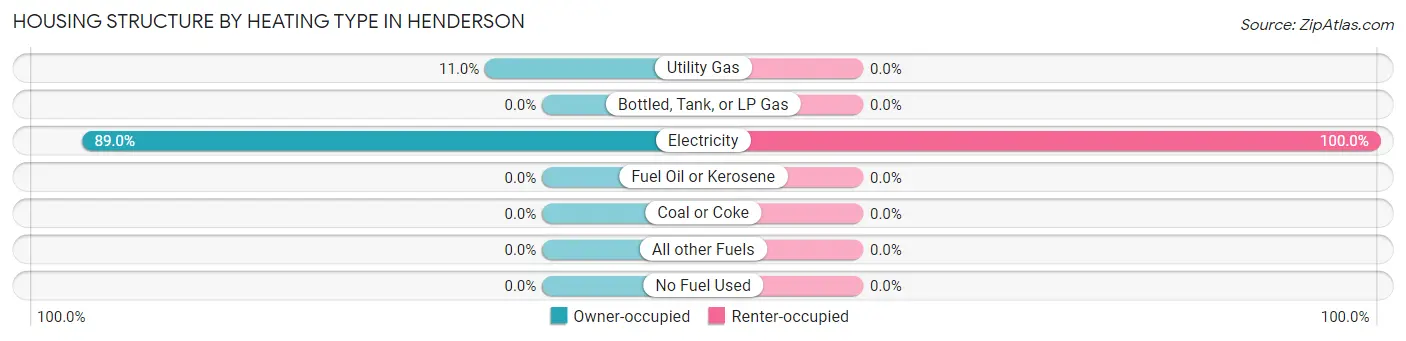
| Heating Type | Owner-occupied | Renter-occupied |
| Utility Gas | 87 (11.0%) | 0 (0.0%) |
| Bottled, Tank, or LP Gas | 0 (0.0%) | 0 (0.0%) |
| Electricity | 703 (89.0%) | 484 (100.0%) |
| Fuel Oil or Kerosene | 0 (0.0%) | 0 (0.0%) |
| Coal or Coke | 0 (0.0%) | 0 (0.0%) |
| All other Fuels | 0 (0.0%) | 0 (0.0%) |
| No Fuel Used | 0 (0.0%) | 0 (0.0%) |
| Total | 790 (100.0%) | 484 (100.0%) |
Household Vehicle Usage in Henderson
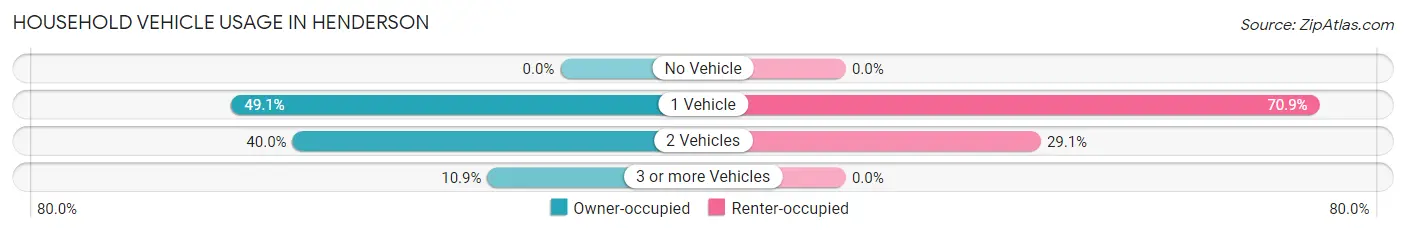
| Vehicles per Household | Owner-occupied | Renter-occupied |
| No Vehicle | 0 (0.0%) | 0 (0.0%) |
| 1 Vehicle | 388 (49.1%) | 343 (70.9%) |
| 2 Vehicles | 316 (40.0%) | 141 (29.1%) |
| 3 or more Vehicles | 86 (10.9%) | 0 (0.0%) |
| Total | 790 (100.0%) | 484 (100.0%) |
Real Estate & Mortgages in Henderson
Real Estate and Mortgage Overview in Henderson
| Characteristic | Without Mortgage | With Mortgage |
| Housing Units | 378 | 412 |
| Median Property Value | $279,300 | $354,700 |
| Median Household Income | $125,372 | $168 |
| Monthly Housing Costs | $740 | $25 |
| Real Estate Taxes | - | - |
Property Value by Mortgage Status in Henderson
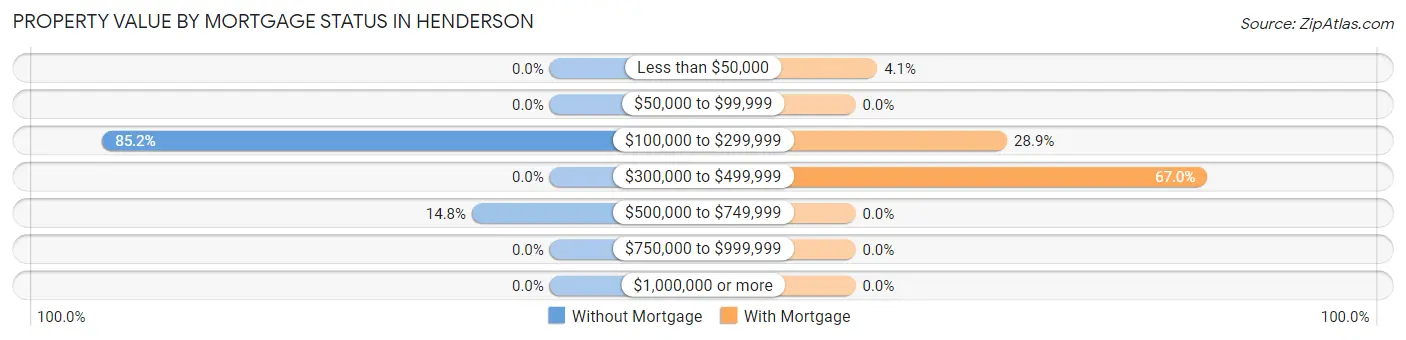
| Property Value | Without Mortgage | With Mortgage |
| Less than $50,000 | 0 (0.0%) | 17 (4.1%) |
| $50,000 to $99,999 | 0 (0.0%) | 0 (0.0%) |
| $100,000 to $299,999 | 322 (85.2%) | 119 (28.9%) |
| $300,000 to $499,999 | 0 (0.0%) | 276 (67.0%) |
| $500,000 to $749,999 | 56 (14.8%) | 0 (0.0%) |
| $750,000 to $999,999 | 0 (0.0%) | 0 (0.0%) |
| $1,000,000 or more | 0 (0.0%) | 0 (0.0%) |
| Total | 378 (100.0%) | 412 (100.0%) |
Household Income by Mortgage Status in Henderson
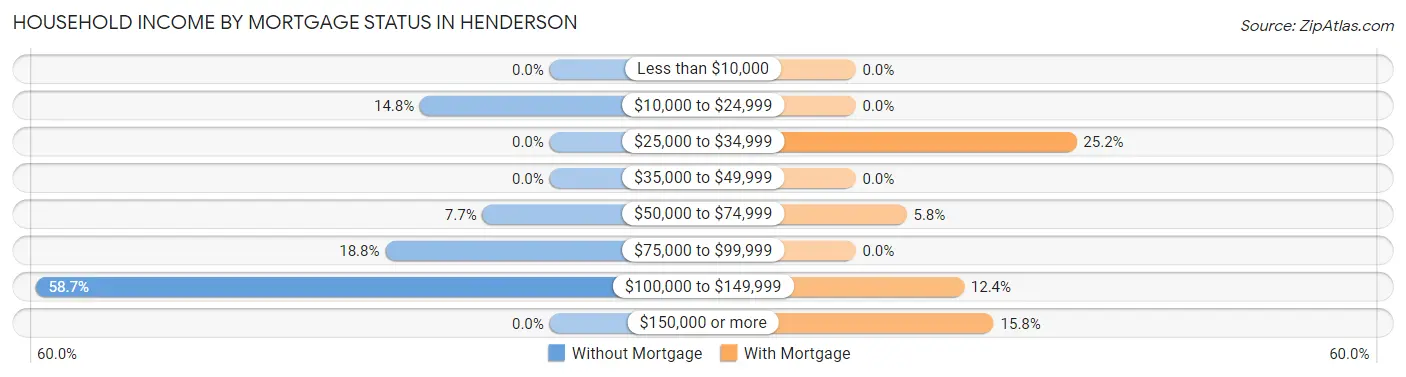
| Household Income | Without Mortgage | With Mortgage |
| Less than $10,000 | 0 (0.0%) | 0 (0.0%) |
| $10,000 to $24,999 | 56 (14.8%) | 0 (0.0%) |
| $25,000 to $34,999 | 0 (0.0%) | 104 (25.2%) |
| $35,000 to $49,999 | 0 (0.0%) | 0 (0.0%) |
| $50,000 to $74,999 | 29 (7.7%) | 24 (5.8%) |
| $75,000 to $99,999 | 71 (18.8%) | 0 (0.0%) |
| $100,000 to $149,999 | 222 (58.7%) | 51 (12.4%) |
| $150,000 or more | 0 (0.0%) | 65 (15.8%) |
| Total | 378 (100.0%) | 412 (100.0%) |
Property Value to Household Income Ratio in Henderson
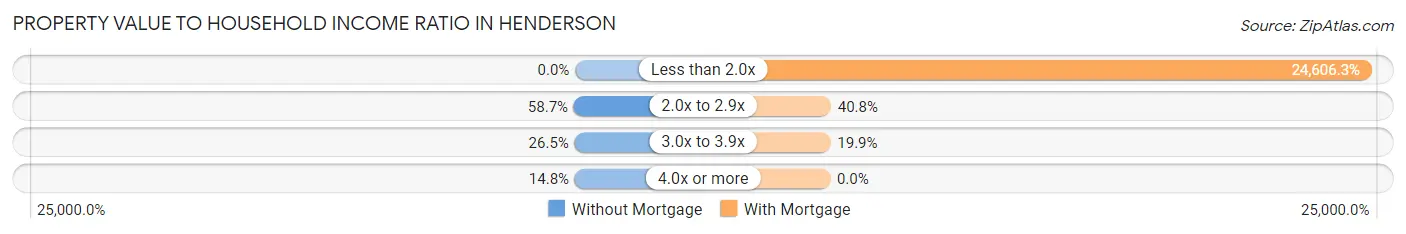
| Value-to-Income Ratio | Without Mortgage | With Mortgage |
| Less than 2.0x | 0 (0.0%) | 101,378 (24,606.3%) |
| 2.0x to 2.9x | 222 (58.7%) | 168 (40.8%) |
| 3.0x to 3.9x | 100 (26.5%) | 82 (19.9%) |
| 4.0x or more | 56 (14.8%) | 0 (0.0%) |
| Total | 378 (100.0%) | 412 (100.0%) |
Real Estate Taxes by Mortgage Status in Henderson
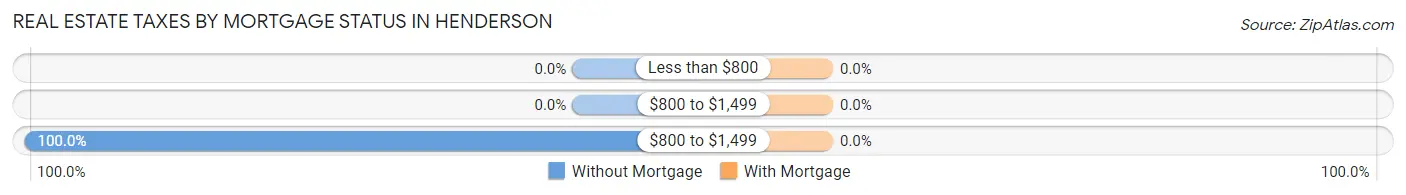
| Property Taxes | Without Mortgage | With Mortgage |
| Less than $800 | 0 (0.0%) | 0 (0.0%) |
| $800 to $1,499 | 0 (0.0%) | 0 (0.0%) |
| $800 to $1,499 | 378 (100.0%) | 0 (0.0%) |
| Total | 378 (100.0%) | 412 (100.0%) |
Health & Disability in Henderson
Health Insurance Coverage by Age in Henderson
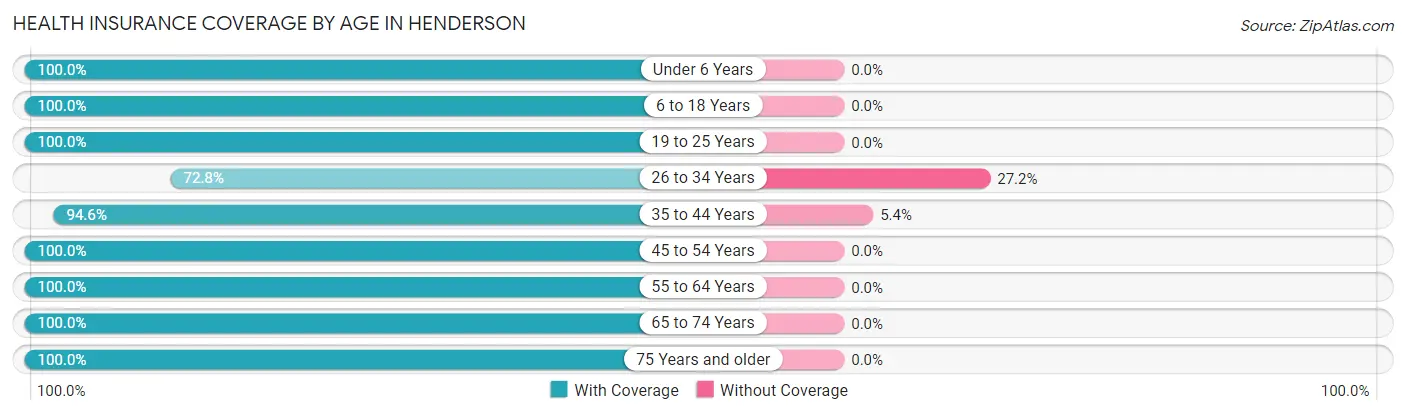
| Age Bracket | With Coverage | Without Coverage |
| Under 6 Years | 205 (100.0%) | 0 (0.0%) |
| 6 to 18 Years | 536 (100.0%) | 0 (0.0%) |
| 19 to 25 Years | 41 (100.0%) | 0 (0.0%) |
| 26 to 34 Years | 139 (72.8%) | 52 (27.2%) |
| 35 to 44 Years | 438 (94.6%) | 25 (5.4%) |
| 45 to 54 Years | 373 (100.0%) | 0 (0.0%) |
| 55 to 64 Years | 418 (100.0%) | 0 (0.0%) |
| 65 to 74 Years | 620 (100.0%) | 0 (0.0%) |
| 75 Years and older | 22 (100.0%) | 0 (0.0%) |
| Total | 2,792 (97.3%) | 77 (2.7%) |
Health Insurance Coverage by Citizenship Status in Henderson
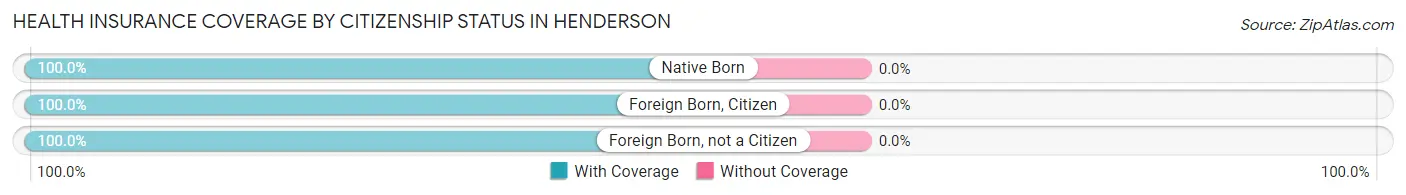
| Citizenship Status | With Coverage | Without Coverage |
| Native Born | 205 (100.0%) | 0 (0.0%) |
| Foreign Born, Citizen | 536 (100.0%) | 0 (0.0%) |
| Foreign Born, not a Citizen | 41 (100.0%) | 0 (0.0%) |
Health Insurance Coverage by Household Income in Henderson
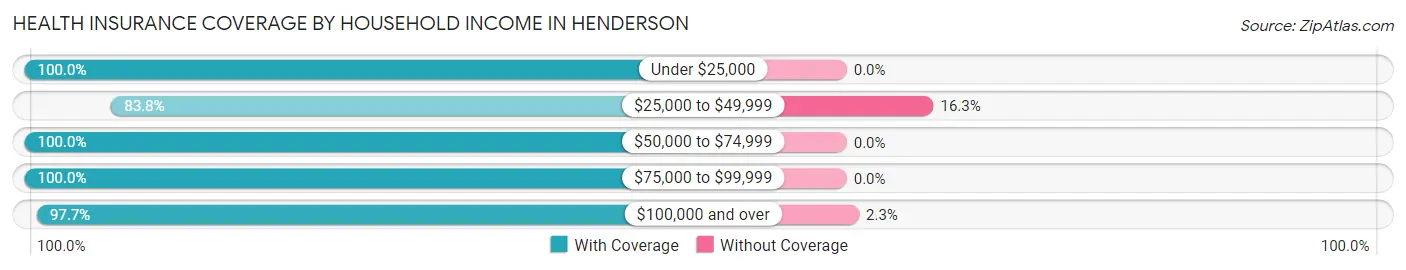
| Household Income | With Coverage | Without Coverage |
| Under $25,000 | 923 (100.0%) | 0 (0.0%) |
| $25,000 to $49,999 | 268 (83.8%) | 52 (16.3%) |
| $50,000 to $74,999 | 192 (100.0%) | 0 (0.0%) |
| $75,000 to $99,999 | 354 (100.0%) | 0 (0.0%) |
| $100,000 and over | 1,055 (97.7%) | 25 (2.3%) |
Public vs Private Health Insurance Coverage by Age in Henderson
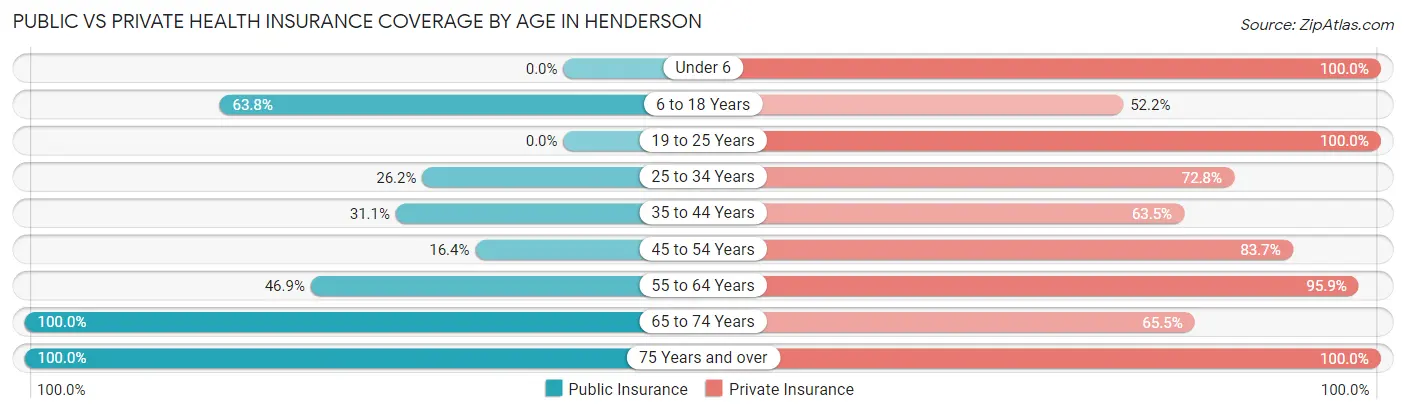
| Age Bracket | Public Insurance | Private Insurance |
| Under 6 | 0 (0.0%) | 205 (100.0%) |
| 6 to 18 Years | 342 (63.8%) | 280 (52.2%) |
| 19 to 25 Years | 0 (0.0%) | 41 (100.0%) |
| 25 to 34 Years | 50 (26.2%) | 139 (72.8%) |
| 35 to 44 Years | 144 (31.1%) | 294 (63.5%) |
| 45 to 54 Years | 61 (16.4%) | 312 (83.7%) |
| 55 to 64 Years | 196 (46.9%) | 401 (95.9%) |
| 65 to 74 Years | 620 (100.0%) | 406 (65.5%) |
| 75 Years and over | 22 (100.0%) | 22 (100.0%) |
| Total | 1,435 (50.0%) | 2,100 (73.2%) |
Disability Status by Sex by Age in Henderson
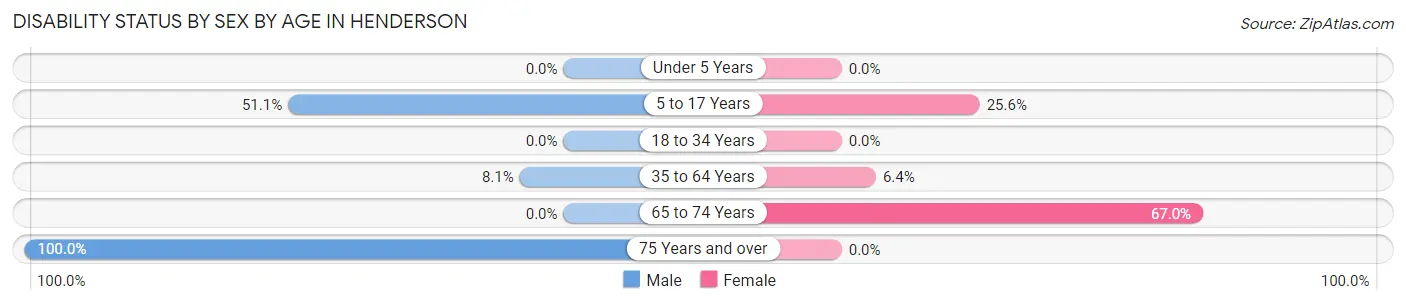
| Age Bracket | Male | Female |
| Under 5 Years | 0 (0.0%) | 0 (0.0%) |
| 5 to 17 Years | 92 (51.1%) | 75 (25.6%) |
| 18 to 34 Years | 0 (0.0%) | 0 (0.0%) |
| 35 to 64 Years | 61 (8.1%) | 32 (6.4%) |
| 65 to 74 Years | 0 (0.0%) | 307 (67.0%) |
| 75 Years and over | 22 (100.0%) | 0 (0.0%) |
Disability Class by Sex by Age in Henderson
Disability Class: Hearing Difficulty
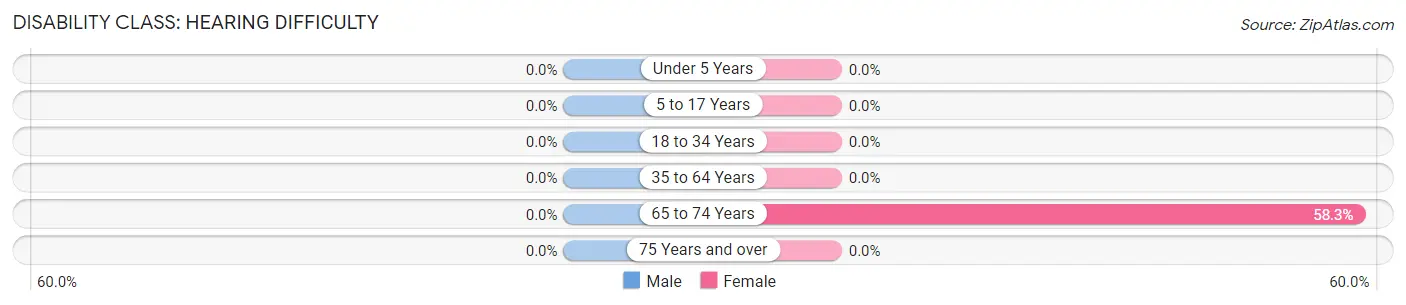
| Age Bracket | Male | Female |
| Under 5 Years | 0 (0.0%) | 0 (0.0%) |
| 5 to 17 Years | 0 (0.0%) | 0 (0.0%) |
| 18 to 34 Years | 0 (0.0%) | 0 (0.0%) |
| 35 to 64 Years | 0 (0.0%) | 0 (0.0%) |
| 65 to 74 Years | 0 (0.0%) | 267 (58.3%) |
| 75 Years and over | 0 (0.0%) | 0 (0.0%) |
Disability Class: Vision Difficulty
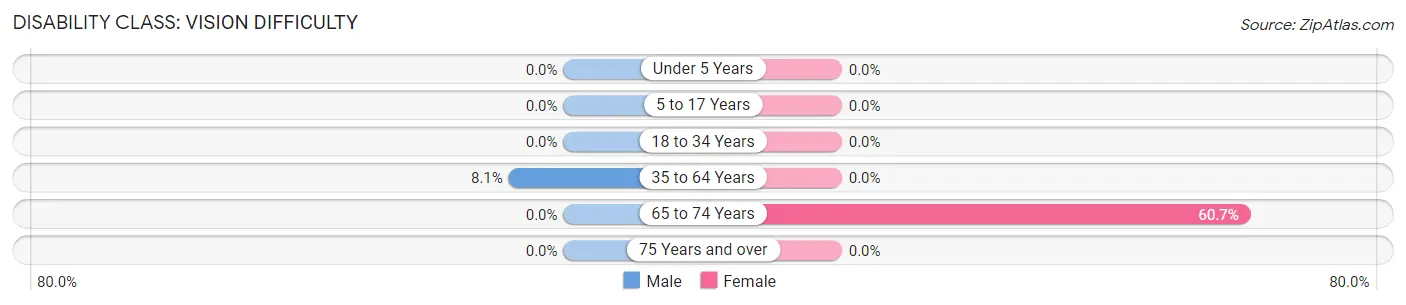
| Age Bracket | Male | Female |
| Under 5 Years | 0 (0.0%) | 0 (0.0%) |
| 5 to 17 Years | 0 (0.0%) | 0 (0.0%) |
| 18 to 34 Years | 0 (0.0%) | 0 (0.0%) |
| 35 to 64 Years | 61 (8.1%) | 0 (0.0%) |
| 65 to 74 Years | 0 (0.0%) | 278 (60.7%) |
| 75 Years and over | 0 (0.0%) | 0 (0.0%) |
Disability Class: Cognitive Difficulty

| Age Bracket | Male | Female |
| 5 to 17 Years | 92 (51.1%) | 75 (25.6%) |
| 18 to 34 Years | 0 (0.0%) | 0 (0.0%) |
| 35 to 64 Years | 61 (8.1%) | 32 (6.4%) |
| 65 to 74 Years | 0 (0.0%) | 238 (52.0%) |
| 75 Years and over | 0 (0.0%) | 0 (0.0%) |
Disability Class: Ambulatory Difficulty
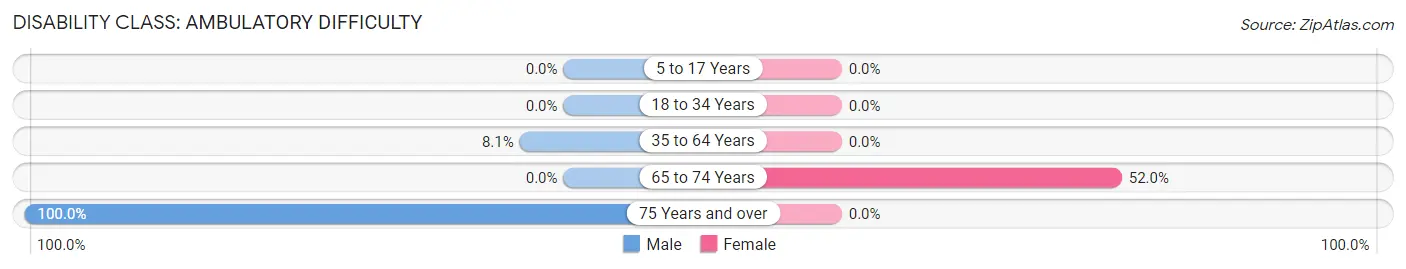
| Age Bracket | Male | Female |
| 5 to 17 Years | 0 (0.0%) | 0 (0.0%) |
| 18 to 34 Years | 0 (0.0%) | 0 (0.0%) |
| 35 to 64 Years | 61 (8.1%) | 0 (0.0%) |
| 65 to 74 Years | 0 (0.0%) | 238 (52.0%) |
| 75 Years and over | 22 (100.0%) | 0 (0.0%) |
Disability Class: Self-Care Difficulty
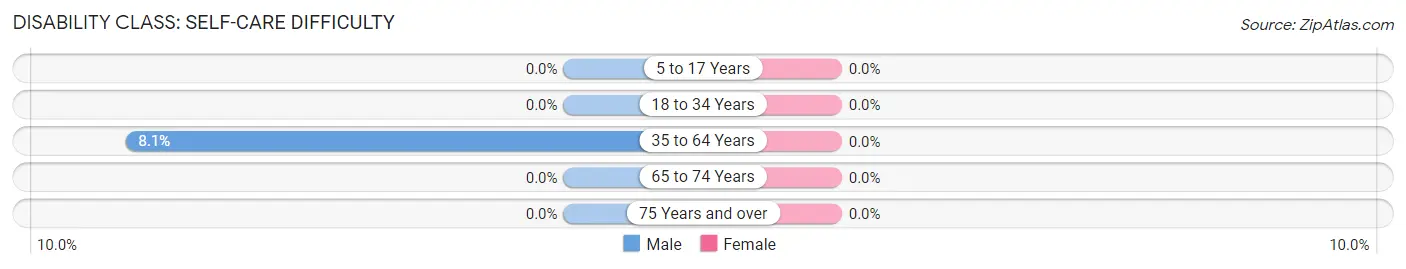
| Age Bracket | Male | Female |
| 5 to 17 Years | 0 (0.0%) | 0 (0.0%) |
| 18 to 34 Years | 0 (0.0%) | 0 (0.0%) |
| 35 to 64 Years | 61 (8.1%) | 0 (0.0%) |
| 65 to 74 Years | 0 (0.0%) | 0 (0.0%) |
| 75 Years and over | 0 (0.0%) | 0 (0.0%) |
Technology Access in Henderson
Computing Device Access in Henderson
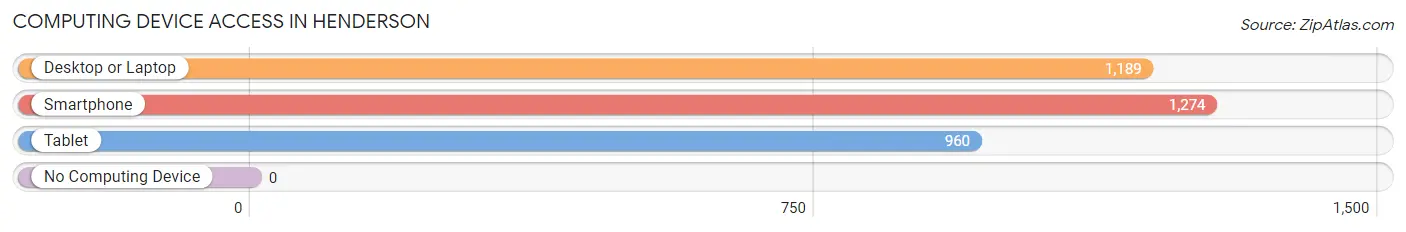
| Device Type | # Households | % Households |
| Desktop or Laptop | 1,189 | 93.3% |
| Smartphone | 1,274 | 100.0% |
| Tablet | 960 | 75.3% |
| No Computing Device | 0 | 0.0% |
| Total | 1,274 | 100.0% |
Internet Access in Henderson
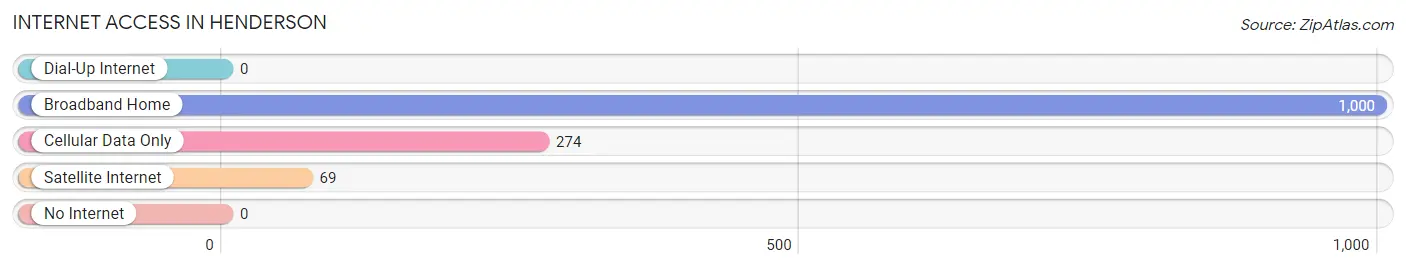
| Internet Type | # Households | % Households |
| Dial-Up Internet | 0 | 0.0% |
| Broadband Home | 1,000 | 78.5% |
| Cellular Data Only | 274 | 21.5% |
| Satellite Internet | 69 | 5.4% |
| No Internet | 0 | 0.0% |
| Total | 1,274 | 100.0% |
Henderson Summary
Henderson, Georgia is a small city located in the northeastern part of the state, in the foothills of the Appalachian Mountains. It is the county seat of Franklin County and is situated along the banks of the Broad River. The city has a population of approximately 2,500 people and is part of the Gainesville-Athens-Clarke County Metropolitan Statistical Area.
History
Henderson was founded in 1820 and named after James Henderson, a Revolutionary War veteran. The city was originally a trading post and was the site of a major battle during the Civil War. After the war, the city was rebuilt and became a center for cotton production. In the late 19th century, Henderson was a major stop on the Central of Georgia Railway.
Geography
Henderson is located in the foothills of the Appalachian Mountains, in the northeastern part of the state. The city is situated along the banks of the Broad River and is surrounded by rolling hills and forests. The city has a total area of 2.2 square miles, all of which is land.
Economy
Henderson’s economy is largely based on agriculture and manufacturing. The city is home to several large poultry processing plants, as well as a number of smaller businesses. The city also has a thriving tourism industry, with many visitors coming to the area to enjoy the natural beauty of the Appalachian Mountains.
Demographics
As of the 2010 census, Henderson had a population of 2,500 people. The racial makeup of the city was 79.2% White, 17.2% African American, 0.4% Native American, 0.4% Asian, 0.2% Pacific Islander, and 2.6% from other races. The median household income was $30,938, and the median family income was $37,813.
Conclusion
Henderson, Georgia is a small city located in the northeastern part of the state, in the foothills of the Appalachian Mountains. It is the county seat of Franklin County and is situated along the banks of the Broad River. The city has a population of approximately 2,500 people and is part of the Gainesville-Athens-Clarke County Metropolitan Statistical Area. The city’s economy is largely based on agriculture and manufacturing, and it is also a popular tourist destination. The racial makeup of the city is 79.2% White, 17.2% African American, 0.4% Native American, 0.4% Asian, 0.2% Pacific Islander, and 2.6% from other races. The median household income was $30,938, and the median family income was $37,813.
Common Questions
What is the Total Population of Henderson?
Total Population of Henderson is 3,005.
What is the Total Male Population of Henderson?
Total Male Population of Henderson is 1,453.
What is the Total Female Population of Henderson?
Total Female Population of Henderson is 1,552.
What is the Ratio of Males per 100 Females in Henderson?
There are 93.62 Males per 100 Females in Henderson.
What is the Ratio of Females per 100 Males in Henderson?
There are 106.81 Females per 100 Males in Henderson.
What is the Median Population Age in Henderson?
Median Population Age in Henderson is 40.3 Years.
What is the Average Family Size in Henderson
Average Family Size in Henderson is 2.7 People.
What is the Average Household Size in Henderson
Average Household Size in Henderson is 2.4 People.
What is Per Capita Income in Henderson?
Per Capita income in Henderson is $39,160.
What is the Median Family Income in Henderson?
Median Family Income in Henderson is $96,691.
What is the Median Household income in Henderson?
Median Household Income in Henderson is $69,646.
What is Inequality or Gini Index in Henderson?
Inequality or Gini Index in Henderson is 0.37.
How Large is the Labor Force in Henderson?
There are 1,803 People in the Labor Forcein in Henderson.
What is the Percentage of People in the Labor Force in Henderson?
68.8% of People are in the Labor Force in Henderson.
What is the Unemployment Rate in Henderson?
Unemployment Rate in Henderson is 6.4%.