Cities with the Highest Percentage of Population Employed in Professional & Scientific Services in Georgia
RELATED REPORTS & OPTIONS
Professional & Scientific Services
Georgia
Compare Cities
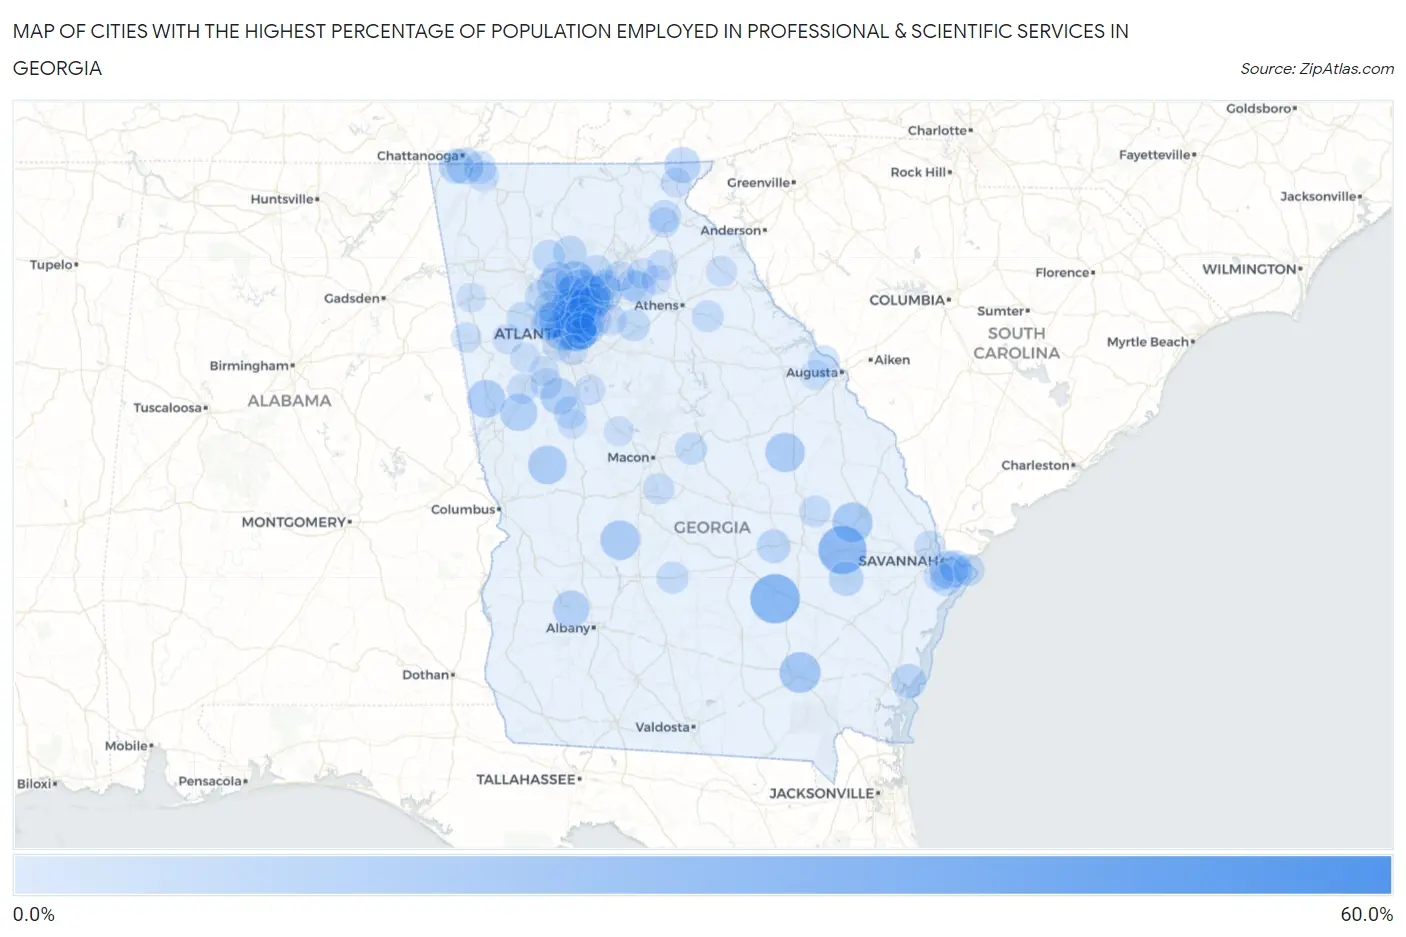
Map of Cities with the Highest Percentage of Population Employed in Professional & Scientific Services in Georgia
0.0%
60.0%
Cities with the Highest Percentage of Population Employed in Professional & Scientific Services in Georgia
| City | % Employed | vs State | vs National | |
| 1. | Clyattville | 58.4% | 8.2%(+50.2)#1 | 7.8%(+50.5)#42 |
| 2. | Satilla | 33.1% | 8.2%(+24.8)#2 | 7.8%(+25.2)#216 |
| 3. | Bellville | 31.4% | 8.2%(+23.2)#3 | 7.8%(+23.5)#251 |
| 4. | Druid Hills | 25.8% | 8.2%(+17.5)#4 | 7.8%(+17.9)#431 |
| 5. | Dunwoody | 22.7% | 8.2%(+14.5)#5 | 7.8%(+14.9)#606 |
| 6. | Sunnyside | 21.9% | 8.2%(+13.7)#6 | 7.8%(+14.1)#674 |
| 7. | Alpharetta | 21.9% | 8.2%(+13.7)#7 | 7.8%(+14.0)#678 |
| 8. | Brookhaven | 21.7% | 8.2%(+13.5)#8 | 7.8%(+13.8)#701 |
| 9. | Johns Creek | 21.4% | 8.2%(+13.2)#9 | 7.8%(+13.5)#738 |
| 10. | Milton | 21.2% | 8.2%(+13.0)#10 | 7.8%(+13.4)#754 |
| 11. | Register | 21.0% | 8.2%(+12.8)#11 | 7.8%(+13.1)#784 |
| 12. | Decatur | 20.5% | 8.2%(+12.3)#12 | 7.8%(+12.7)#831 |
| 13. | Sandy Springs | 20.1% | 8.2%(+11.9)#13 | 7.8%(+12.3)#872 |
| 14. | Dooling | 20.0% | 8.2%(+11.8)#14 | 7.8%(+12.2)#888 |
| 15. | Bartow | 19.9% | 8.2%(+11.6)#15 | 7.8%(+12.0)#905 |
| 16. | Berkeley Lake | 19.6% | 8.2%(+11.3)#16 | 7.8%(+11.7)#942 |
| 17. | Woodland | 19.1% | 8.2%(+10.9)#17 | 7.8%(+11.3)#1,002 |
| 18. | Atlanta | 18.9% | 8.2%(+10.7)#18 | 7.8%(+11.1)#1,041 |
| 19. | Vinings | 18.2% | 8.2%(+9.94)#19 | 7.8%(+10.3)#1,145 |
| 20. | Dutch Island | 18.1% | 8.2%(+9.93)#20 | 7.8%(+10.3)#1,147 |
| 21. | Franklin | 17.9% | 8.2%(+9.71)#21 | 7.8%(+10.1)#1,177 |
| 22. | Suwanee | 17.4% | 8.2%(+9.20)#22 | 7.8%(+9.57)#1,289 |
| 23. | Lone Oak | 17.1% | 8.2%(+8.93)#23 | 7.8%(+9.30)#1,342 |
| 24. | North Druid Hills | 16.7% | 8.2%(+8.49)#24 | 7.8%(+8.86)#1,436 |
| 25. | Sasser | 16.6% | 8.2%(+8.34)#25 | 7.8%(+8.71)#1,467 |
| 26. | Brooks | 16.4% | 8.2%(+8.23)#26 | 7.8%(+8.60)#1,502 |
| 27. | Rossville | 16.4% | 8.2%(+8.14)#27 | 7.8%(+8.51)#1,519 |
| 28. | Avondale Estates | 15.7% | 8.2%(+7.53)#28 | 7.8%(+7.90)#1,667 |
| 29. | Smyrna | 15.7% | 8.2%(+7.51)#29 | 7.8%(+7.88)#1,674 |
| 30. | Dillard | 15.6% | 8.2%(+7.36)#30 | 7.8%(+7.73)#1,719 |
| 31. | Roswell | 15.4% | 8.2%(+7.22)#31 | 7.8%(+7.59)#1,750 |
| 32. | North Decatur | 15.4% | 8.2%(+7.16)#32 | 7.8%(+7.53)#1,774 |
| 33. | Chamblee | 15.2% | 8.2%(+6.94)#33 | 7.8%(+7.31)#1,825 |
| 34. | St Simons | 14.0% | 8.2%(+5.78)#34 | 7.8%(+6.15)#2,179 |
| 35. | Peachtree Corners | 13.9% | 8.2%(+5.68)#35 | 7.8%(+6.05)#2,206 |
| 36. | Lookout Mountain | 13.8% | 8.2%(+5.60)#36 | 7.8%(+5.97)#2,226 |
| 37. | Glennville | 13.8% | 8.2%(+5.56)#37 | 7.8%(+5.93)#2,239 |
| 38. | Duluth | 13.1% | 8.2%(+4.90)#38 | 7.8%(+5.27)#2,497 |
| 39. | Ailey | 12.7% | 8.2%(+4.46)#39 | 7.8%(+4.83)#2,682 |
| 40. | Woodstock | 12.6% | 8.2%(+4.37)#40 | 7.8%(+4.73)#2,719 |
| 41. | Hoschton | 12.4% | 8.2%(+4.21)#41 | 7.8%(+4.58)#2,799 |
| 42. | Ball Ground | 12.2% | 8.2%(+3.99)#42 | 7.8%(+4.36)#2,900 |
| 43. | Tucker | 12.1% | 8.2%(+3.93)#43 | 7.8%(+4.30)#2,934 |
| 44. | Waleska | 11.5% | 8.2%(+3.32)#44 | 7.8%(+3.69)#3,233 |
| 45. | Kennesaw | 11.5% | 8.2%(+3.29)#45 | 7.8%(+3.66)#3,257 |
| 46. | Cumming | 11.3% | 8.2%(+3.10)#46 | 7.8%(+3.47)#3,353 |
| 47. | Williamson | 11.3% | 8.2%(+3.04)#47 | 7.8%(+3.41)#3,390 |
| 48. | Between | 11.2% | 8.2%(+3.01)#48 | 7.8%(+3.38)#3,407 |
| 49. | Indian Springs | 11.2% | 8.2%(+2.95)#49 | 7.8%(+3.32)#3,423 |
| 50. | Wilmington Island | 11.1% | 8.2%(+2.88)#50 | 7.8%(+3.25)#3,472 |
| 51. | Fairplay | 11.1% | 8.2%(+2.88)#51 | 7.8%(+3.25)#3,473 |
| 52. | Clarkesville | 11.1% | 8.2%(+2.84)#52 | 7.8%(+3.21)#3,487 |
| 53. | Mableton | 11.0% | 8.2%(+2.80)#53 | 7.8%(+3.17)#3,499 |
| 54. | Rochelle | 10.9% | 8.2%(+2.65)#54 | 7.8%(+3.02)#3,605 |
| 55. | Skidaway Island | 10.8% | 8.2%(+2.55)#55 | 7.8%(+2.91)#3,668 |
| 56. | Antioch | 10.7% | 8.2%(+2.51)#56 | 7.8%(+2.88)#3,695 |
| 57. | Holly Springs | 10.6% | 8.2%(+2.43)#57 | 7.8%(+2.80)#3,749 |
| 58. | Pine Lake | 10.6% | 8.2%(+2.42)#58 | 7.8%(+2.79)#3,757 |
| 59. | Talahi Island | 10.6% | 8.2%(+2.42)#59 | 7.8%(+2.78)#3,760 |
| 60. | Marietta | 10.6% | 8.2%(+2.35)#60 | 7.8%(+2.72)#3,794 |
| 61. | Tybee Island | 10.5% | 8.2%(+2.32)#61 | 7.8%(+2.69)#3,818 |
| 62. | Ivey | 10.5% | 8.2%(+2.28)#62 | 7.8%(+2.65)#3,843 |
| 63. | Stillmore | 10.4% | 8.2%(+2.22)#63 | 7.8%(+2.59)#3,886 |
| 64. | Doraville | 10.4% | 8.2%(+2.15)#64 | 7.8%(+2.52)#3,938 |
| 65. | Hiram | 10.3% | 8.2%(+2.06)#65 | 7.8%(+2.43)#3,994 |
| 66. | Crawford | 10.3% | 8.2%(+2.04)#66 | 7.8%(+2.41)#4,005 |
| 67. | Braselton | 10.2% | 8.2%(+2.03)#67 | 7.8%(+2.40)#4,015 |
| 68. | Evans | 10.1% | 8.2%(+1.93)#68 | 7.8%(+2.30)#4,075 |
| 69. | Belvedere Park | 10.1% | 8.2%(+1.84)#69 | 7.8%(+2.21)#4,118 |
| 70. | Peachtree City | 9.9% | 8.2%(+1.69)#70 | 7.8%(+2.06)#4,213 |
| 71. | Port Wentworth | 9.7% | 8.2%(+1.50)#71 | 7.8%(+1.87)#4,352 |
| 72. | Sugar Hill | 9.7% | 8.2%(+1.48)#72 | 7.8%(+1.85)#4,370 |
| 73. | Snellville | 9.6% | 8.2%(+1.40)#73 | 7.8%(+1.77)#4,438 |
| 74. | Robins Afb | 9.6% | 8.2%(+1.36)#74 | 7.8%(+1.73)#4,463 |
| 75. | Scottdale | 9.5% | 8.2%(+1.32)#75 | 7.8%(+1.69)#4,498 |
| 76. | Stockton | 9.4% | 8.2%(+1.23)#76 | 7.8%(+1.60)#4,577 |
| 77. | East Point | 9.2% | 8.2%(+0.968)#77 | 7.8%(+1.34)#4,797 |
| 78. | Bowman | 9.1% | 8.2%(+0.931)#78 | 7.8%(+1.30)#4,822 |
| 79. | Mountain Park | 9.1% | 8.2%(+0.931)#79 | 7.8%(+1.30)#4,824 |
| 80. | Flowery Branch | 9.1% | 8.2%(+0.922)#80 | 7.8%(+1.29)#4,831 |
| 81. | Ringgold | 9.1% | 8.2%(+0.902)#81 | 7.8%(+1.27)#4,849 |
| 82. | Cataula | 9.0% | 8.2%(+0.807)#82 | 7.8%(+1.18)#4,943 |
| 83. | Bolingbroke | 9.0% | 8.2%(+0.799)#83 | 7.8%(+1.17)#4,949 |
| 84. | Conley | 9.0% | 8.2%(+0.743)#84 | 7.8%(+1.11)#4,992 |
| 85. | Talmo | 8.9% | 8.2%(+0.681)#85 | 7.8%(+1.05)#5,059 |
| 86. | East Newnan | 8.7% | 8.2%(+0.479)#86 | 7.8%(+0.848)#5,239 |
| 87. | Maysville | 8.7% | 8.2%(+0.446)#87 | 7.8%(+0.815)#5,268 |
| 88. | Demorest | 8.6% | 8.2%(+0.354)#88 | 7.8%(+0.724)#5,351 |
| 89. | Jefferson | 8.6% | 8.2%(+0.337)#89 | 7.8%(+0.706)#5,363 |
| 90. | Vernonburg | 8.5% | 8.2%(+0.294)#90 | 7.8%(+0.663)#5,400 |
| 91. | Heron Bay | 8.5% | 8.2%(+0.246)#91 | 7.8%(+0.615)#5,432 |
| 92. | Villa Rica | 8.4% | 8.2%(+0.224)#92 | 7.8%(+0.594)#5,448 |
| 93. | Tiger | 8.4% | 8.2%(+0.210)#93 | 7.8%(+0.579)#5,469 |
| 94. | Tallapoosa | 8.4% | 8.2%(+0.190)#94 | 7.8%(+0.559)#5,498 |
| 95. | Grovetown | 8.3% | 8.2%(+0.064)#95 | 7.8%(+0.433)#5,610 |
| 96. | Chattahoochee Hills | 8.3% | 8.2%(+0.054)#96 | 7.8%(+0.423)#5,619 |
| 97. | Tyrone | 8.2% | 8.2%(+0.025)#97 | 7.8%(+0.394)#5,644 |
| 98. | Forsyth | 8.1% | 8.2%(-0.077)#98 | 7.8%(+0.292)#5,747 |
| 99. | Zebulon | 8.1% | 8.2%(-0.158)#99 | 7.8%(+0.212)#5,855 |
| 100. | Cedartown | 7.9% | 8.2%(-0.276)#100 | 7.8%(+0.094)#5,974 |
Common Questions
What are the Top 10 Cities with the Highest Percentage of Population Employed in Professional & Scientific Services in Georgia?
Top 10 Cities with the Highest Percentage of Population Employed in Professional & Scientific Services in Georgia are:
#1
33.1%
#2
31.4%
#3
25.8%
#4
22.7%
#5
21.9%
#6
21.9%
#7
21.7%
#8
21.4%
#9
21.2%
#10
21.0%
What city has the Highest Percentage of Population Employed in Professional & Scientific Services in Georgia?
Satilla has the Highest Percentage of Population Employed in Professional & Scientific Services in Georgia with 33.1%.
What is the Percentage of Population Employed in Professional & Scientific Services in the State of Georgia?
Percentage of Population Employed in Professional & Scientific Services in Georgia is 8.2%.
What is the Percentage of Population Employed in Professional & Scientific Services in the United States?
Percentage of Population Employed in Professional & Scientific Services in the United States is 7.8%.