Morganton, GA
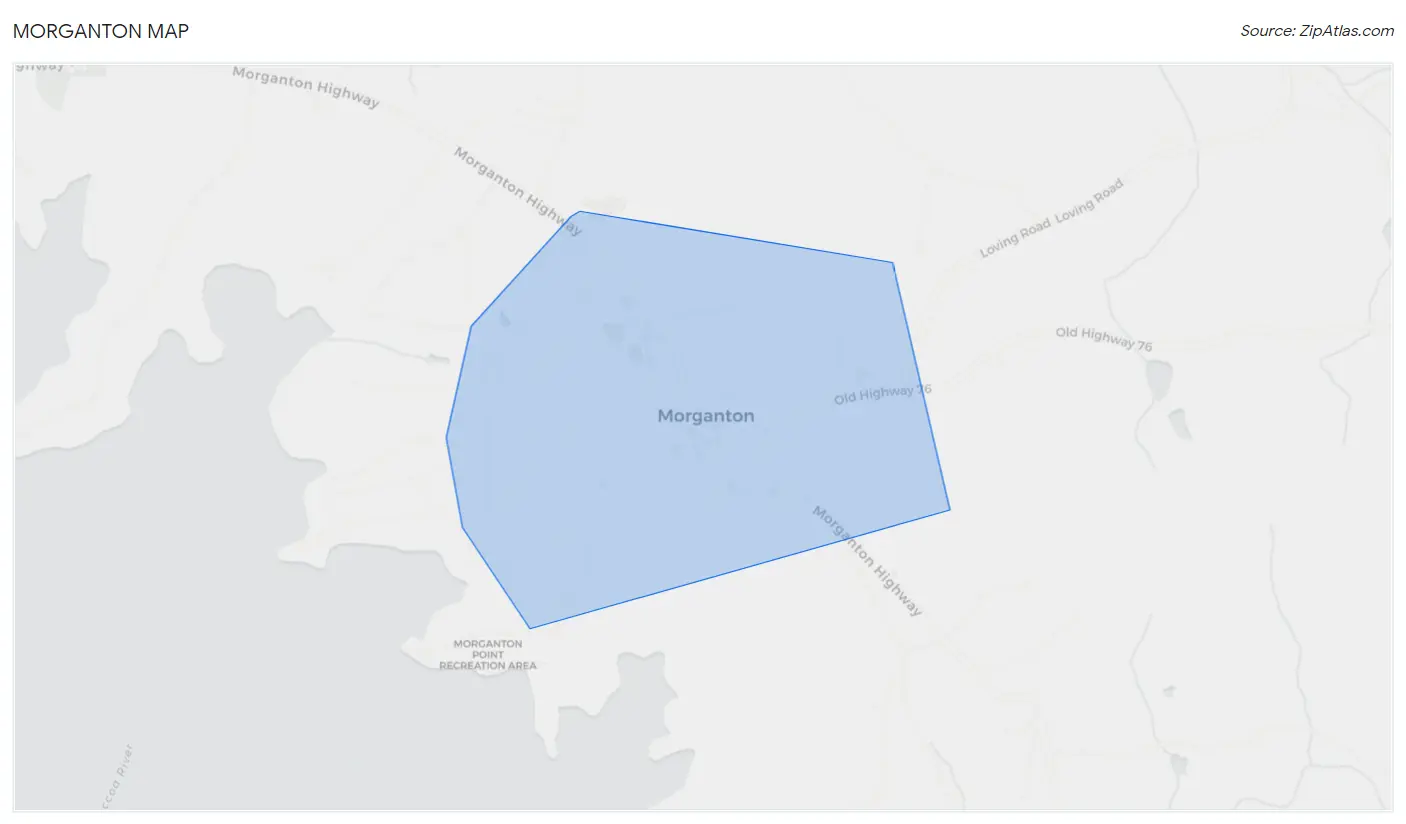
Morganton Map
Morganton Overview
288
TOTAL POPULATION
153
MALE POPULATION
135
FEMALE POPULATION
113.33
MALES / 100 FEMALES
88.24
FEMALES / 100 MALES
42.2
MEDIAN AGE
3.0
AVG FAMILY SIZE
2.6
AVG HOUSEHOLD SIZE
$31,254
PER CAPITA INCOME
$40,417
AVG HOUSEHOLD INCOME
75.5%
WAGE / INCOME GAP [ % ]
24.5¢/ $1
WAGE / INCOME GAP [ $ ]
0.51
INEQUALITY / GINI INDEX
131
LABOR FORCE [ PEOPLE ]
54.4%
PERCENT IN LABOR FORCE
4.6%
UNEMPLOYMENT RATE
Morganton Zip Codes
Morganton Area Codes
Race in Morganton
The most populous races in Morganton are White / Caucasian (253 | 87.8%), Two or more Races (33 | 11.5%), and Hispanic or Latino (23 | 8.0%).
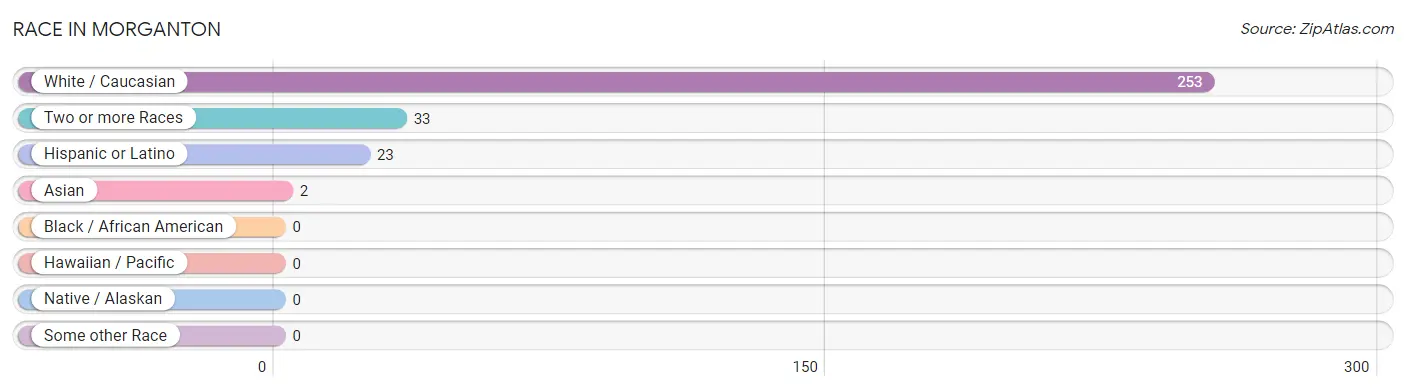
| Race | # Population | % Population |
| Asian | 2 | 0.7% |
| Black / African American | 0 | 0.0% |
| Hawaiian / Pacific | 0 | 0.0% |
| Hispanic or Latino | 23 | 8.0% |
| Native / Alaskan | 0 | 0.0% |
| White / Caucasian | 253 | 87.8% |
| Two or more Races | 33 | 11.5% |
| Some other Race | 0 | 0.0% |
| Total | 288 | 100.0% |
Ancestry in Morganton
The most populous ancestries reported in Morganton are Irish (99 | 34.4%), British (41 | 14.2%), Polish (34 | 11.8%), English (28 | 9.7%), and Dutch (25 | 8.7%), together accounting for 78.8% of all Morganton residents.
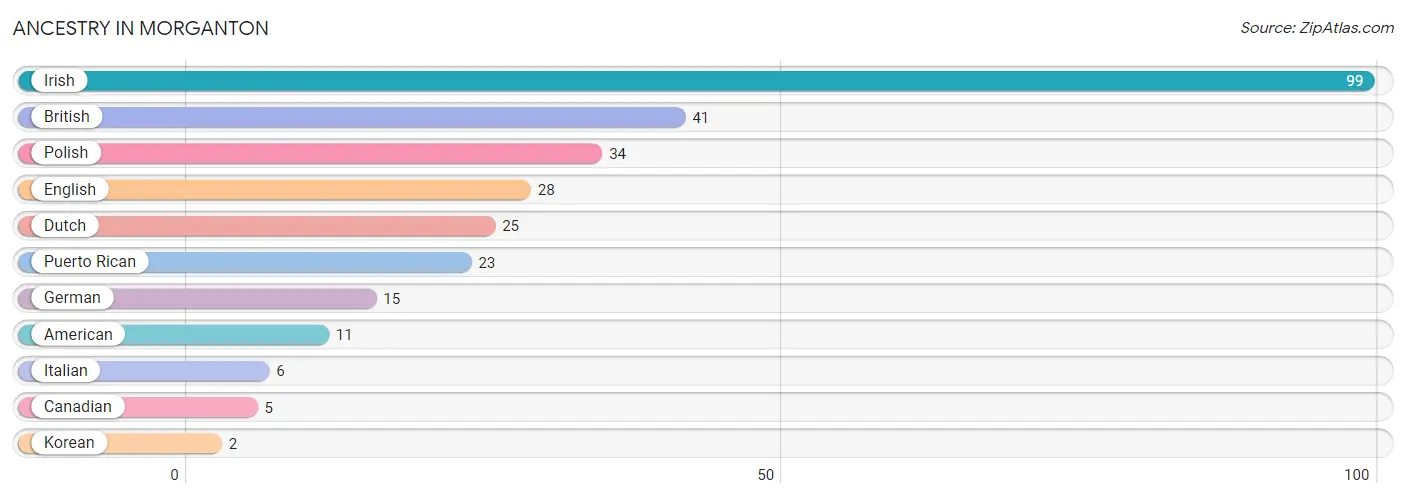
| Ancestry | # Population | % Population |
| American | 11 | 3.8% |
| British | 41 | 14.2% |
| Canadian | 5 | 1.7% |
| Dutch | 25 | 8.7% |
| English | 28 | 9.7% |
| German | 15 | 5.2% |
| Irish | 99 | 34.4% |
| Italian | 6 | 2.1% |
| Korean | 2 | 0.7% |
| Polish | 34 | 11.8% |
| Puerto Rican | 23 | 8.0% | View All 11 Rows |
Immigrants in Morganton
The most numerous immigrant groups reported in Morganton came from Eastern Europe (6 | 2.1%), Europe (6 | 2.1%), Poland (6 | 2.1%), Asia (2 | 0.7%), and South Eastern Asia (2 | 0.7%), together accounting for 7.6% of all Morganton residents.
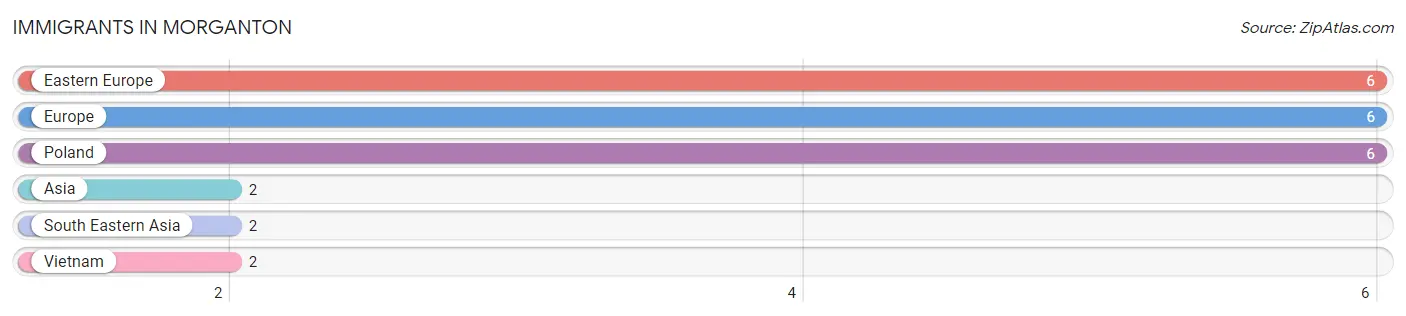
| Immigration Origin | # Population | % Population |
| Asia | 2 | 0.7% |
| Eastern Europe | 6 | 2.1% |
| Europe | 6 | 2.1% |
| Poland | 6 | 2.1% |
| South Eastern Asia | 2 | 0.7% |
| Vietnam | 2 | 0.7% | View All 6 Rows |
Sex and Age in Morganton
Sex and Age in Morganton
The most populous age groups in Morganton are 25 to 29 Years (23 | 15.0%) for men and 35 to 39 Years (25 | 18.5%) for women.
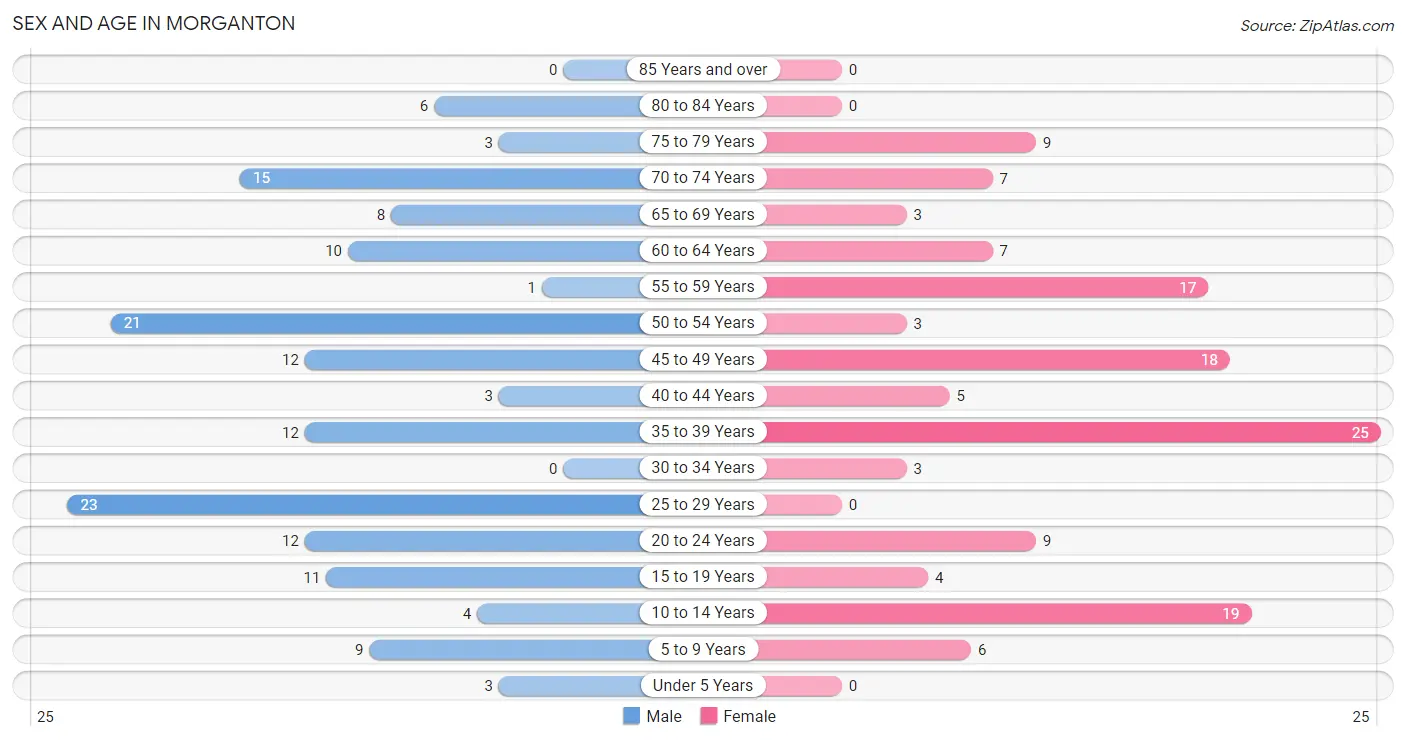
| Age Bracket | Male | Female |
| Under 5 Years | 3 (2.0%) | 0 (0.0%) |
| 5 to 9 Years | 9 (5.9%) | 6 (4.4%) |
| 10 to 14 Years | 4 (2.6%) | 19 (14.1%) |
| 15 to 19 Years | 11 (7.2%) | 4 (3.0%) |
| 20 to 24 Years | 12 (7.8%) | 9 (6.7%) |
| 25 to 29 Years | 23 (15.0%) | 0 (0.0%) |
| 30 to 34 Years | 0 (0.0%) | 3 (2.2%) |
| 35 to 39 Years | 12 (7.8%) | 25 (18.5%) |
| 40 to 44 Years | 3 (2.0%) | 5 (3.7%) |
| 45 to 49 Years | 12 (7.8%) | 18 (13.3%) |
| 50 to 54 Years | 21 (13.7%) | 3 (2.2%) |
| 55 to 59 Years | 1 (0.6%) | 17 (12.6%) |
| 60 to 64 Years | 10 (6.5%) | 7 (5.2%) |
| 65 to 69 Years | 8 (5.2%) | 3 (2.2%) |
| 70 to 74 Years | 15 (9.8%) | 7 (5.2%) |
| 75 to 79 Years | 3 (2.0%) | 9 (6.7%) |
| 80 to 84 Years | 6 (3.9%) | 0 (0.0%) |
| 85 Years and over | 0 (0.0%) | 0 (0.0%) |
| Total | 153 (100.0%) | 135 (100.0%) |
Families and Households in Morganton
Median Family Size in Morganton
The median family size in Morganton is 2.99 persons per family, with single female/mother families (19 | 22.4%) accounting for the largest median family size of 3.21 persons per family. On the other hand, single male/father families (2 | 2.4%) represent the smallest median family size with 2.00 persons per family.
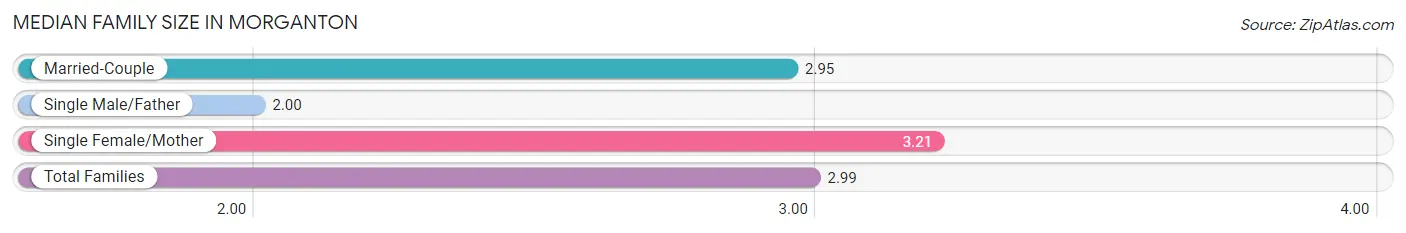
| Family Type | # Families | Family Size |
| Married-Couple | 64 (75.3%) | 2.95 |
| Single Male/Father | 2 (2.4%) | 2.00 |
| Single Female/Mother | 19 (22.4%) | 3.21 |
| Total Families | 85 (100.0%) | 2.99 |
Median Household Size in Morganton
The median household size in Morganton is 2.59 persons per household, with single female/mother households (19 | 17.1%) accounting for the largest median household size of 3.42 persons per household. non-family households (26 | 23.4%) represent the smallest median household size with 1.15 persons per household.
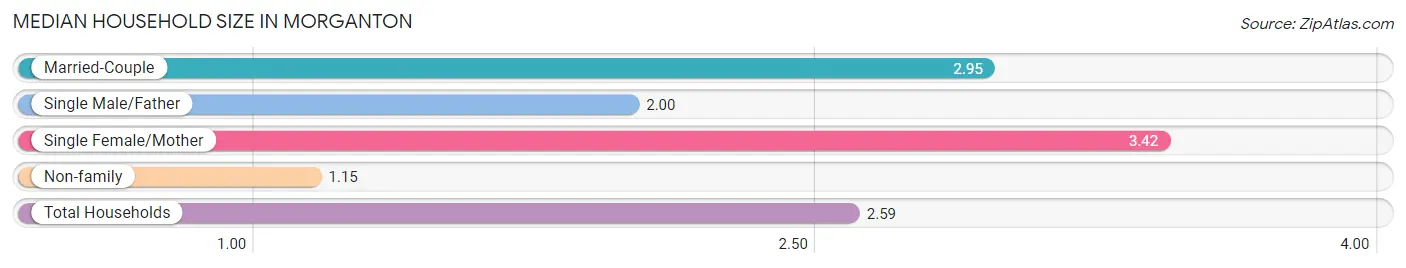
| Household Type | # Households | Household Size |
| Married-Couple | 64 (57.7%) | 2.95 |
| Single Male/Father | 2 (1.8%) | 2.00 |
| Single Female/Mother | 19 (17.1%) | 3.42 |
| Non-family | 26 (23.4%) | 1.15 |
| Total Households | 111 (100.0%) | 2.59 |
Household Size by Marriage Status in Morganton
Out of a total of 111 households in Morganton, 85 (76.6%) are family households, while 26 (23.4%) are nonfamily households. The most numerous type of family households are 2-person households, comprising 33, and the most common type of nonfamily households are 1-person households, comprising 18.
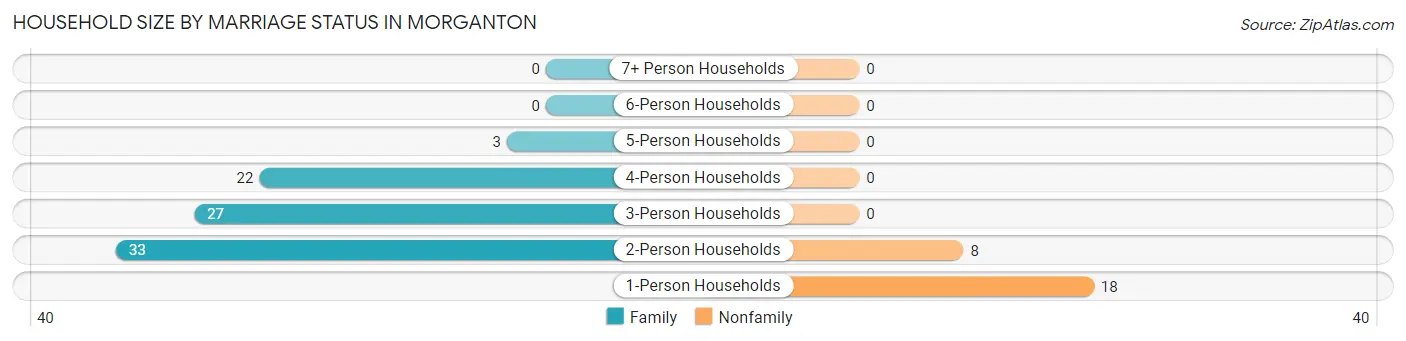
| Household Size | Family Households | Nonfamily Households |
| 1-Person Households | - | 18 (16.2%) |
| 2-Person Households | 33 (29.7%) | 8 (7.2%) |
| 3-Person Households | 27 (24.3%) | 0 (0.0%) |
| 4-Person Households | 22 (19.8%) | 0 (0.0%) |
| 5-Person Households | 3 (2.7%) | 0 (0.0%) |
| 6-Person Households | 0 (0.0%) | 0 (0.0%) |
| 7+ Person Households | 0 (0.0%) | 0 (0.0%) |
| Total | 85 (76.6%) | 26 (23.4%) |
Female Fertility in Morganton
Fertility by Age in Morganton
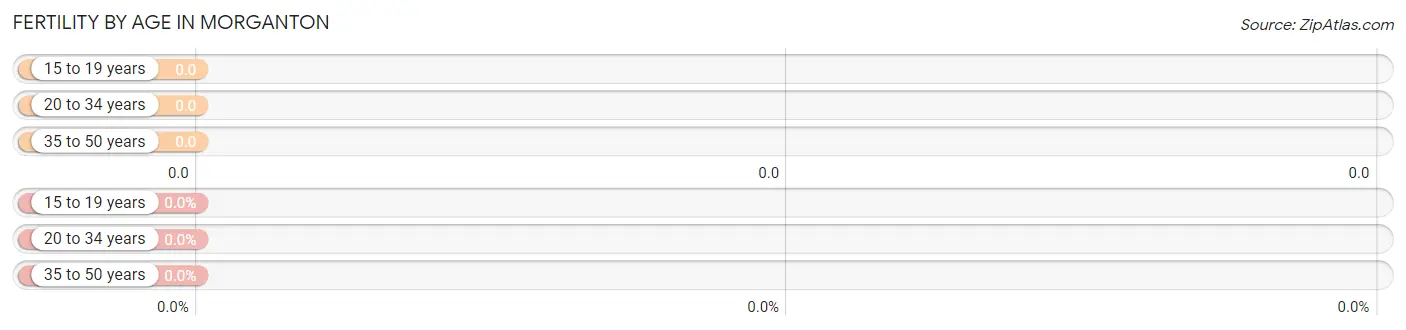
| Age Bracket | Women with Births | Births / 1,000 Women |
| 15 to 19 years | 0 (0.0%) | 0.0 |
| 20 to 34 years | 0 (0.0%) | 0.0 |
| 35 to 50 years | 0 (0.0%) | 0.0 |
| Total | 0 (0.0%) | 0.0 |
Fertility by Age by Marriage Status in Morganton
| Age Bracket | Married | Unmarried |
| 15 to 19 years | 0 (0.0%) | 0 (0.0%) |
| 20 to 34 years | 0 (0.0%) | 0 (0.0%) |
| 35 to 50 years | 0 (0.0%) | 0 (0.0%) |
| Total | 0 (0.0%) | 0 (0.0%) |
Fertility by Education in Morganton
| Educational Attainment | Women with Births | Births / 1,000 Women |
| Less than High School | 0 (0.0%) | 0.0 |
| High School Diploma | 0 (0.0%) | 0.0 |
| College or Associate's Degree | 0 (0.0%) | 0.0 |
| Bachelor's Degree | 0 (0.0%) | 0.0 |
| Graduate Degree | 0 (0.0%) | 0.0 |
| Total | 0 (0.0%) | 0.0 |
Fertility by Education by Marriage Status in Morganton
| Educational Attainment | Married | Unmarried |
| Less than High School | 0 (0.0%) | 0 (0.0%) |
| High School Diploma | 0 (0.0%) | 0 (0.0%) |
| College or Associate's Degree | 0 (0.0%) | 0 (0.0%) |
| Bachelor's Degree | 0 (0.0%) | 0 (0.0%) |
| Graduate Degree | 0 (0.0%) | 0 (0.0%) |
| Total | 0 (0.0%) | 0 (0.0%) |
Income in Morganton
Income Overview in Morganton
| Characteristic | Number | Measure |
| Per Capita Income | 288 | $31,254 |
| Median Family Income | 85 | $0 |
| Mean Family Income | 85 | $88,256 |
| Median Household Income | 111 | $40,417 |
| Mean Household Income | 111 | $75,995 |
| Income Deficit | 85 | $0 |
| Wage / Income Gap (%) | 288 | 75.46% |
| Wage / Income Gap ($) | 288 | 24.54¢ per $1 |
| Gini / Inequality Index | 288 | 0.51 |
Earnings by Sex in Morganton
Average Earnings in Morganton are $41,000, $66,528 for men and $16,324 for women, a difference of 75.5%.
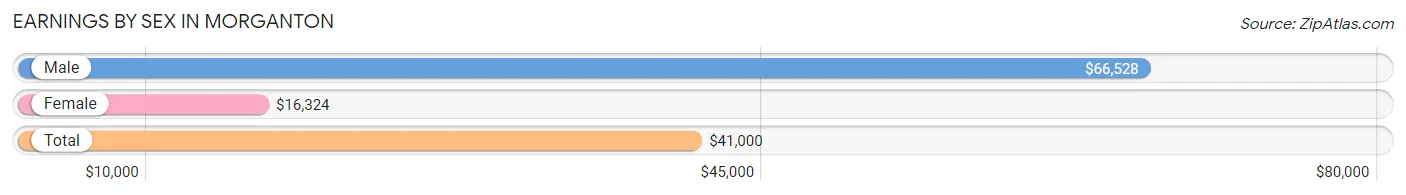
| Sex | Number | Average Earnings |
| Male | 64 (44.4%) | $66,528 |
| Female | 80 (55.6%) | $16,324 |
| Total | 144 (100.0%) | $41,000 |
Earnings by Sex by Income Bracket in Morganton
The most common earnings brackets in Morganton are $65,000 to $74,999 for men (21 | 32.8%) and $10,000 to $12,499 for women (23 | 28.7%).
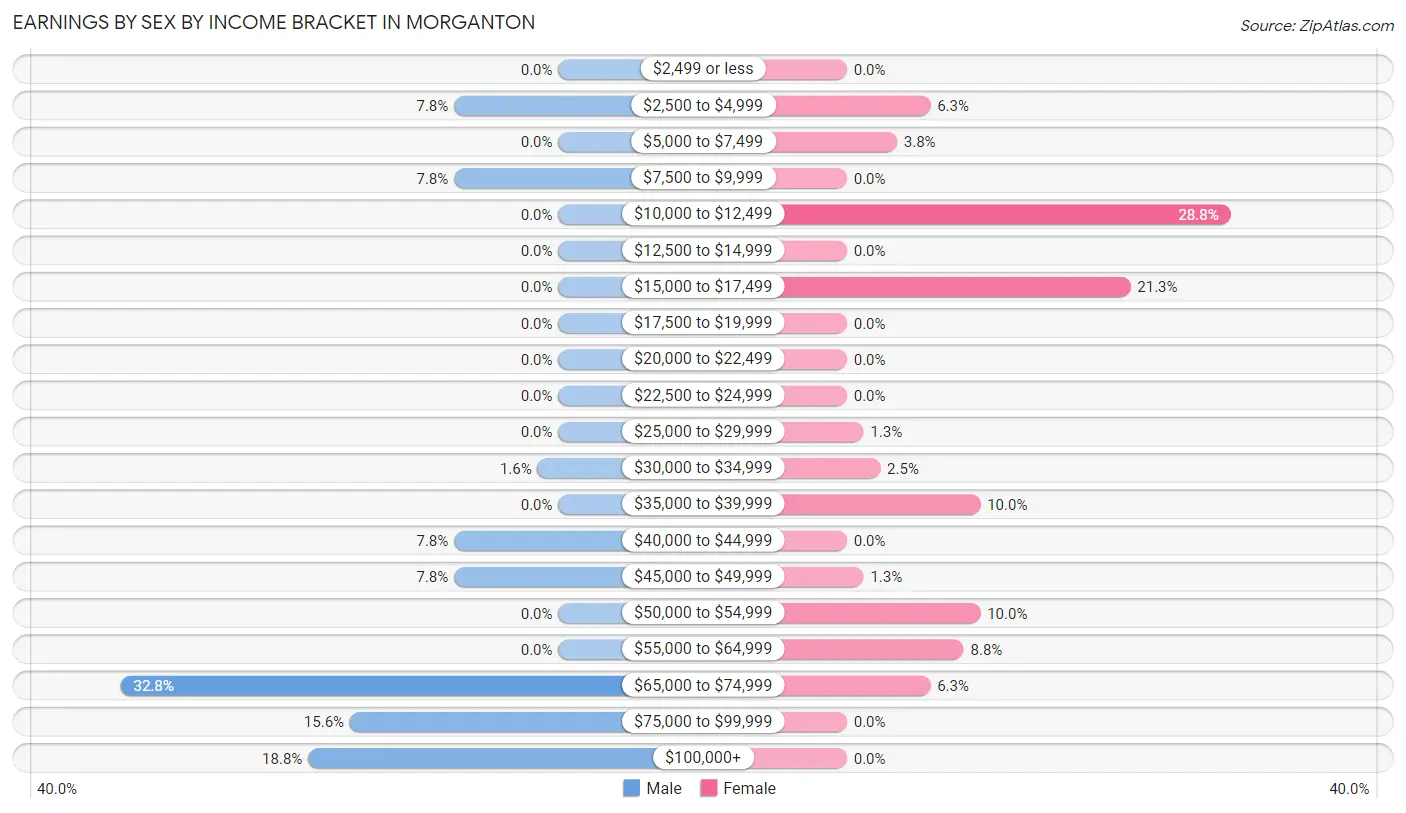
| Income | Male | Female |
| $2,499 or less | 0 (0.0%) | 0 (0.0%) |
| $2,500 to $4,999 | 5 (7.8%) | 5 (6.2%) |
| $5,000 to $7,499 | 0 (0.0%) | 3 (3.7%) |
| $7,500 to $9,999 | 5 (7.8%) | 0 (0.0%) |
| $10,000 to $12,499 | 0 (0.0%) | 23 (28.7%) |
| $12,500 to $14,999 | 0 (0.0%) | 0 (0.0%) |
| $15,000 to $17,499 | 0 (0.0%) | 17 (21.2%) |
| $17,500 to $19,999 | 0 (0.0%) | 0 (0.0%) |
| $20,000 to $22,499 | 0 (0.0%) | 0 (0.0%) |
| $22,500 to $24,999 | 0 (0.0%) | 0 (0.0%) |
| $25,000 to $29,999 | 0 (0.0%) | 1 (1.3%) |
| $30,000 to $34,999 | 1 (1.6%) | 2 (2.5%) |
| $35,000 to $39,999 | 0 (0.0%) | 8 (10.0%) |
| $40,000 to $44,999 | 5 (7.8%) | 0 (0.0%) |
| $45,000 to $49,999 | 5 (7.8%) | 1 (1.3%) |
| $50,000 to $54,999 | 0 (0.0%) | 8 (10.0%) |
| $55,000 to $64,999 | 0 (0.0%) | 7 (8.7%) |
| $65,000 to $74,999 | 21 (32.8%) | 5 (6.2%) |
| $75,000 to $99,999 | 10 (15.6%) | 0 (0.0%) |
| $100,000+ | 12 (18.8%) | 0 (0.0%) |
| Total | 64 (100.0%) | 80 (100.0%) |
Earnings by Sex by Educational Attainment in Morganton
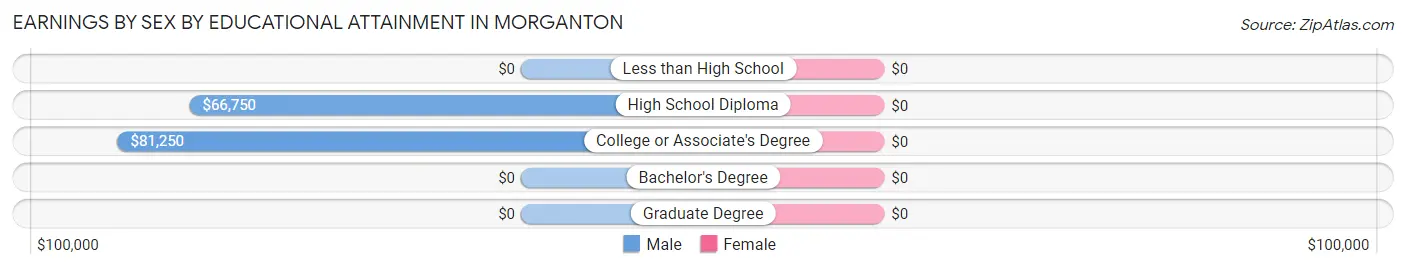
| Educational Attainment | Male Income | Female Income |
| Less than High School | - | - |
| High School Diploma | $66,750 | $0 |
| College or Associate's Degree | $81,250 | $0 |
| Bachelor's Degree | - | - |
| Graduate Degree | - | - |
| Total | $66,528 | $0 |
Family Income in Morganton
Family Income Brackets in Morganton
According to the Morganton family income data, there are 18 families falling into the $15,000 to $24,999 income range, which is the most common income bracket and makes up 21.2% of all families.
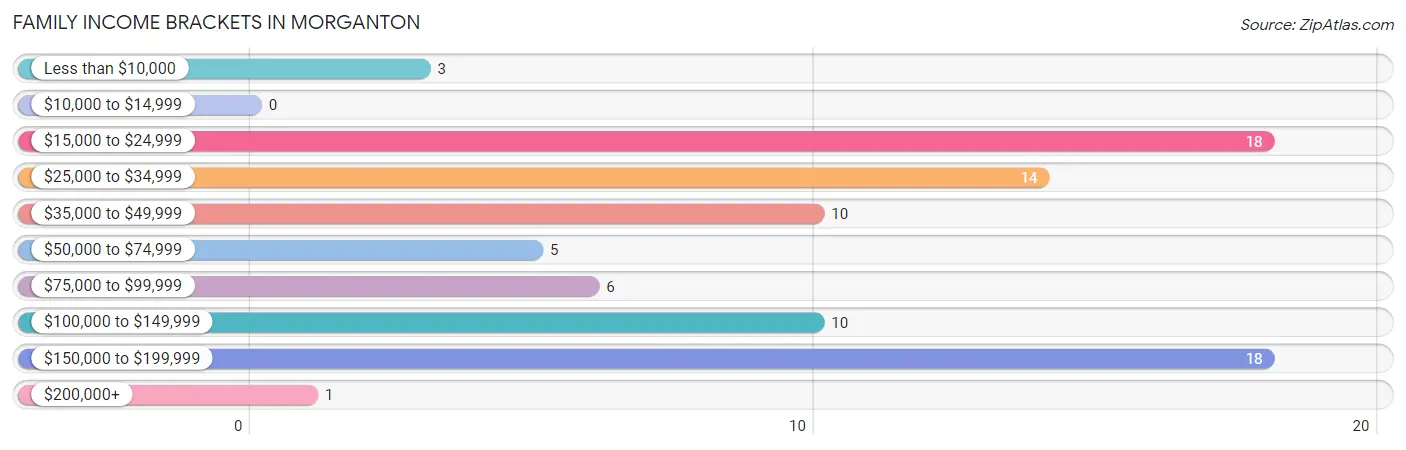
| Income Bracket | # Families | % Families |
| Less than $10,000 | 3 | 3.5% |
| $10,000 to $14,999 | 0 | 0.0% |
| $15,000 to $24,999 | 18 | 21.2% |
| $25,000 to $34,999 | 14 | 16.5% |
| $35,000 to $49,999 | 10 | 11.8% |
| $50,000 to $74,999 | 5 | 5.9% |
| $75,000 to $99,999 | 6 | 7.1% |
| $100,000 to $149,999 | 10 | 11.8% |
| $150,000 to $199,999 | 18 | 21.2% |
| $200,000+ | 1 | 1.2% |
Family Income by Famaliy Size in Morganton
2-person families (33 | 38.8%) account for the highest median family income in Morganton with $34,554 per family, while 2-person families (33 | 38.8%) have the highest median income of $17,277 per family member.
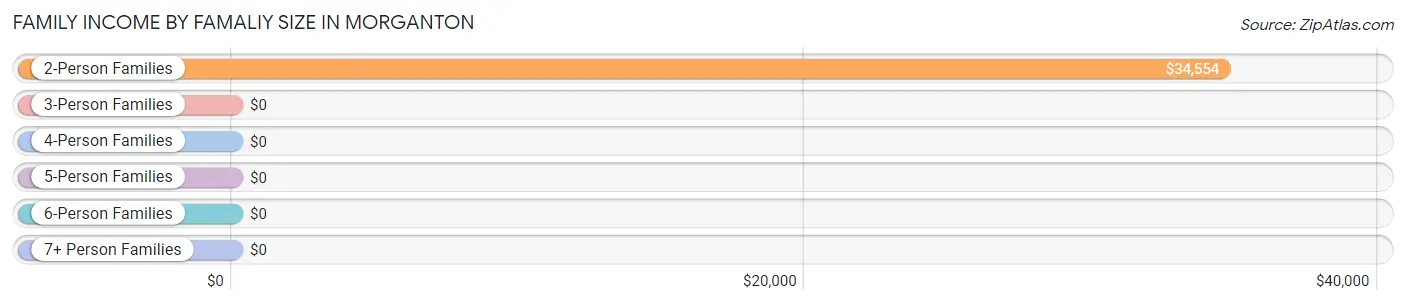
| Income Bracket | # Families | Median Income |
| 2-Person Families | 33 (38.8%) | $34,554 |
| 3-Person Families | 30 (35.3%) | $0 |
| 4-Person Families | 19 (22.4%) | $0 |
| 5-Person Families | 3 (3.5%) | $0 |
| 6-Person Families | 0 (0.0%) | $0 |
| 7+ Person Families | 0 (0.0%) | $0 |
| Total | 85 (100.0%) | $0 |
Family Income by Number of Earners in Morganton
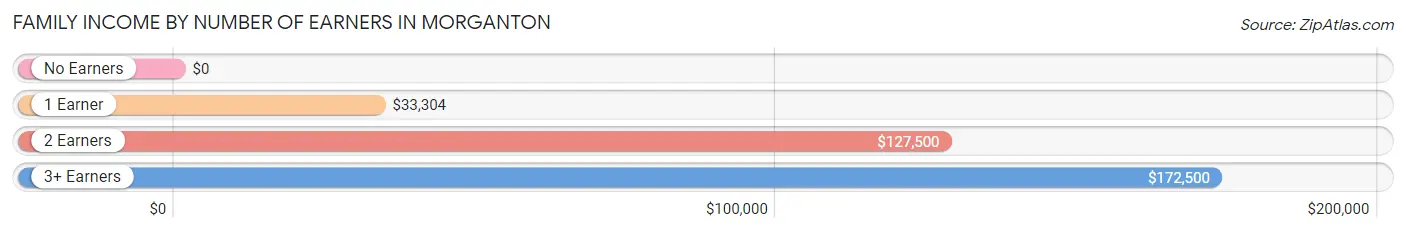
| Number of Earners | # Families | Median Income |
| No Earners | 10 (11.8%) | $0 |
| 1 Earner | 49 (57.7%) | $33,304 |
| 2 Earners | 8 (9.4%) | $127,500 |
| 3+ Earners | 18 (21.2%) | $172,500 |
| Total | 85 (100.0%) | $0 |
Household Income in Morganton
Household Income Brackets in Morganton
With 20 households falling in the category, the $15,000 to $24,999 income range is the most frequent in Morganton, accounting for 18.0% of all households.
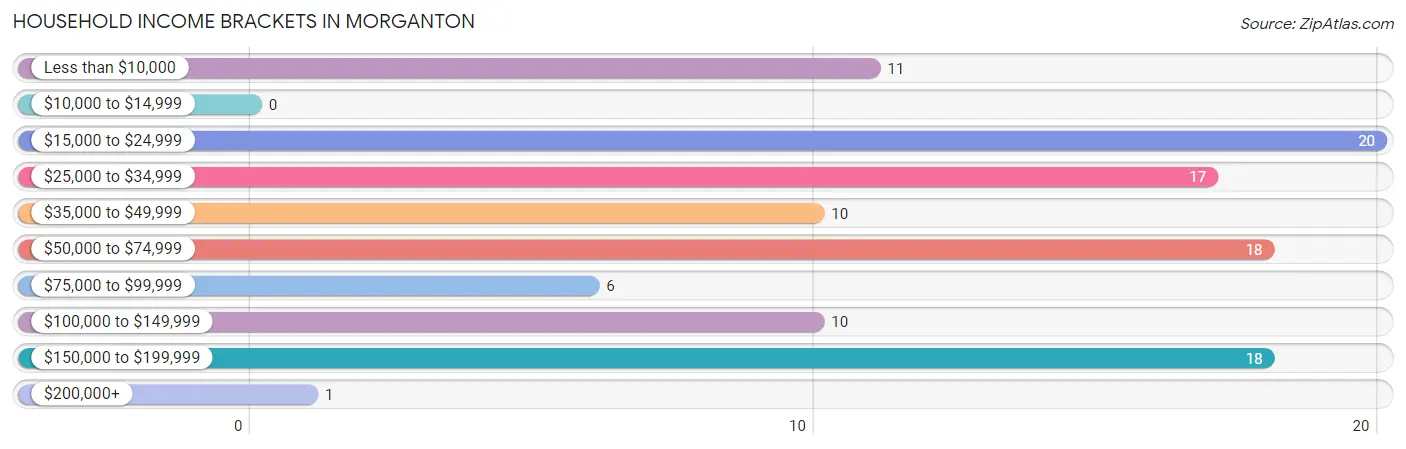
| Income Bracket | # Households | % Households |
| Less than $10,000 | 11 | 9.9% |
| $10,000 to $14,999 | 0 | 0.0% |
| $15,000 to $24,999 | 20 | 18.0% |
| $25,000 to $34,999 | 17 | 15.3% |
| $35,000 to $49,999 | 10 | 9.0% |
| $50,000 to $74,999 | 18 | 16.2% |
| $75,000 to $99,999 | 6 | 5.4% |
| $100,000 to $149,999 | 10 | 9.0% |
| $150,000 to $199,999 | 18 | 16.2% |
| $200,000+ | 1 | 0.9% |
Household Income by Householder Age in Morganton
The median household income in Morganton is $40,417, with the highest median household income of $66,827 found in the 25 to 44 years age bracket for the primary householder. A total of 25 households (22.5%) fall into this category.
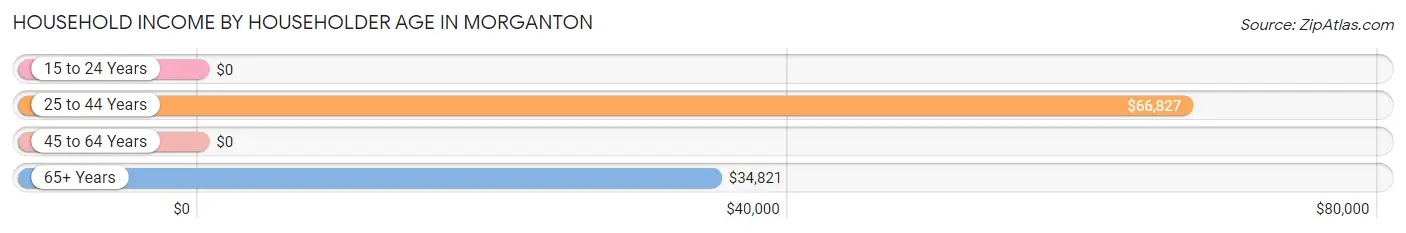
| Income Bracket | # Households | Median Income |
| 15 to 24 Years | 0 (0.0%) | $0 |
| 25 to 44 Years | 25 (22.5%) | $66,827 |
| 45 to 64 Years | 48 (43.2%) | $0 |
| 65+ Years | 38 (34.2%) | $34,821 |
| Total | 111 (100.0%) | $40,417 |
Poverty in Morganton
Income Below Poverty by Sex and Age in Morganton
With 36.6% poverty level for males and 19.3% for females among the residents of Morganton, under 5 year old males and 25 to 34 year old females are the most vulnerable to poverty, with 3 males (100.0%) and 3 females (100.0%) in their respective age groups living below the poverty level.
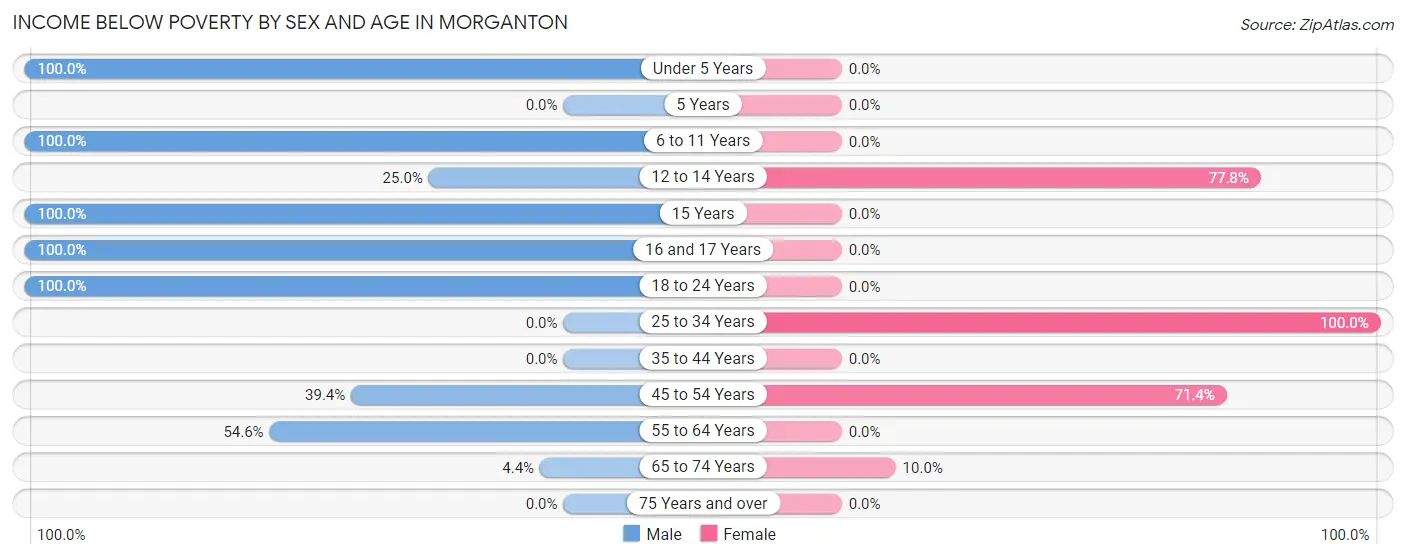
| Age Bracket | Male | Female |
| Under 5 Years | 3 (100.0%) | 0 (0.0%) |
| 5 Years | 0 (0.0%) | 0 (0.0%) |
| 6 to 11 Years | 9 (100.0%) | 0 (0.0%) |
| 12 to 14 Years | 1 (25.0%) | 7 (77.8%) |
| 15 Years | 2 (100.0%) | 0 (0.0%) |
| 16 and 17 Years | 9 (100.0%) | 0 (0.0%) |
| 18 to 24 Years | 12 (100.0%) | 0 (0.0%) |
| 25 to 34 Years | 0 (0.0%) | 3 (100.0%) |
| 35 to 44 Years | 0 (0.0%) | 0 (0.0%) |
| 45 to 54 Years | 13 (39.4%) | 15 (71.4%) |
| 55 to 64 Years | 6 (54.5%) | 0 (0.0%) |
| 65 to 74 Years | 1 (4.3%) | 1 (10.0%) |
| 75 Years and over | 0 (0.0%) | 0 (0.0%) |
| Total | 56 (36.6%) | 26 (19.3%) |
Income Above Poverty by Sex and Age in Morganton
According to the poverty statistics in Morganton, males aged 25 to 34 years and females aged 6 to 11 years are the age groups that are most secure financially, with 100.0% of males and 100.0% of females in these age groups living above the poverty line.
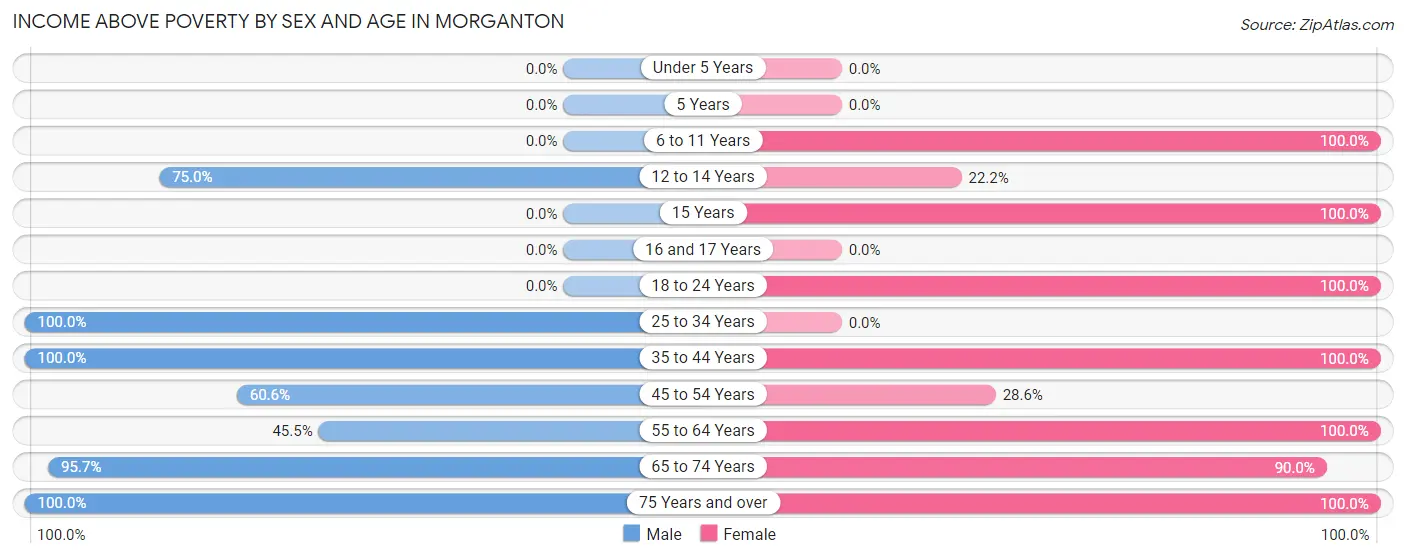
| Age Bracket | Male | Female |
| Under 5 Years | 0 (0.0%) | 0 (0.0%) |
| 5 Years | 0 (0.0%) | 0 (0.0%) |
| 6 to 11 Years | 0 (0.0%) | 16 (100.0%) |
| 12 to 14 Years | 3 (75.0%) | 2 (22.2%) |
| 15 Years | 0 (0.0%) | 4 (100.0%) |
| 16 and 17 Years | 0 (0.0%) | 0 (0.0%) |
| 18 to 24 Years | 0 (0.0%) | 9 (100.0%) |
| 25 to 34 Years | 23 (100.0%) | 0 (0.0%) |
| 35 to 44 Years | 15 (100.0%) | 30 (100.0%) |
| 45 to 54 Years | 20 (60.6%) | 6 (28.6%) |
| 55 to 64 Years | 5 (45.5%) | 24 (100.0%) |
| 65 to 74 Years | 22 (95.7%) | 9 (90.0%) |
| 75 Years and over | 9 (100.0%) | 9 (100.0%) |
| Total | 97 (63.4%) | 109 (80.7%) |
Income Below Poverty Among Married-Couple Families in Morganton
The poverty statistics for married-couple families in Morganton show that 7.8% or 5 of the total 64 families live below the poverty line. Families with 1 or 2 children have the highest poverty rate of 21.0%, comprising of 4 families. On the other hand, families with no children have the lowest poverty rate of 2.2%, which includes 1 families.
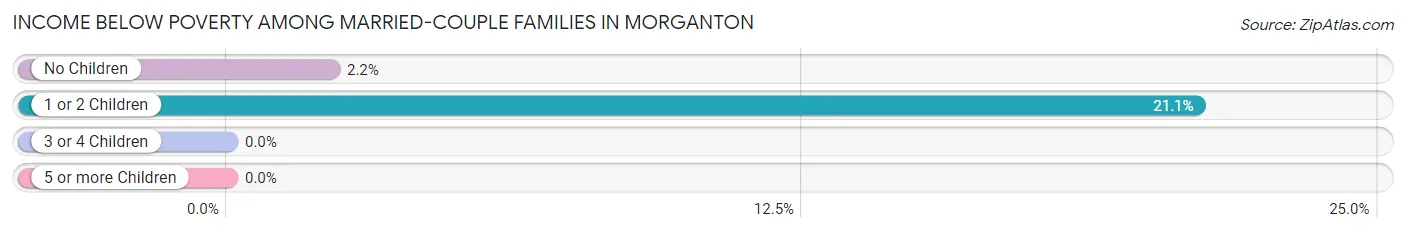
| Children | Above Poverty | Below Poverty |
| No Children | 44 (97.8%) | 1 (2.2%) |
| 1 or 2 Children | 15 (78.9%) | 4 (21.0%) |
| 3 or 4 Children | 0 (0.0%) | 0 (0.0%) |
| 5 or more Children | 0 (0.0%) | 0 (0.0%) |
| Total | 59 (92.2%) | 5 (7.8%) |
Income Below Poverty Among Single-Parent Households in Morganton
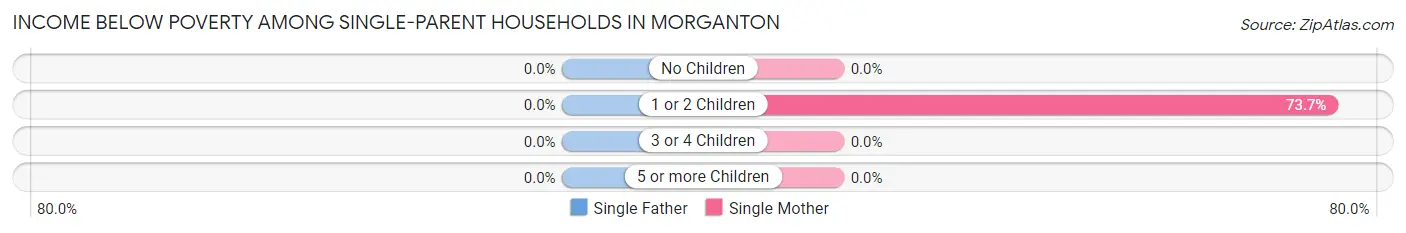
| Children | Single Father | Single Mother |
| No Children | 0 (0.0%) | 0 (0.0%) |
| 1 or 2 Children | 0 (0.0%) | 14 (73.7%) |
| 3 or 4 Children | 0 (0.0%) | 0 (0.0%) |
| 5 or more Children | 0 (0.0%) | 0 (0.0%) |
| Total | 0 (0.0%) | 14 (73.7%) |
Income Below Poverty Among Married-Couple vs Single-Parent Households in Morganton
The poverty data for Morganton shows that 5 of the married-couple family households (7.8%) and 14 of the single-parent households (66.7%) are living below the poverty level. Within the married-couple family households, those with 1 or 2 children have the highest poverty rate, with 4 households (21.0%) falling below the poverty line. Among the single-parent households, those with 1 or 2 children have the highest poverty rate, with 14 household (73.7%) living below poverty.
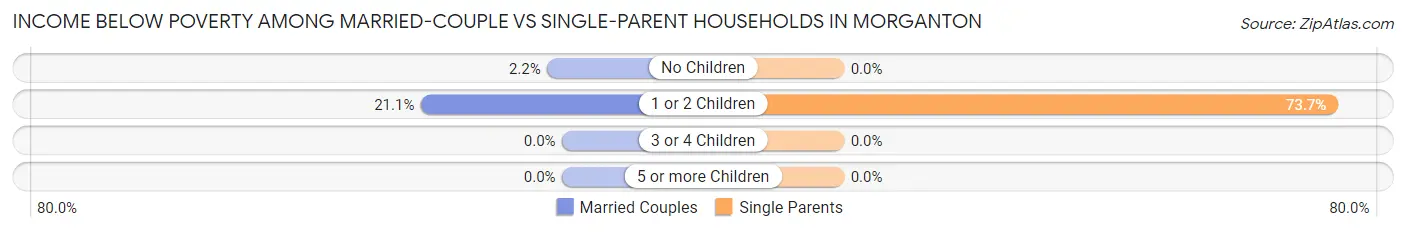
| Children | Married-Couple Families | Single-Parent Households |
| No Children | 1 (2.2%) | 0 (0.0%) |
| 1 or 2 Children | 4 (21.0%) | 14 (73.7%) |
| 3 or 4 Children | 0 (0.0%) | 0 (0.0%) |
| 5 or more Children | 0 (0.0%) | 0 (0.0%) |
| Total | 5 (7.8%) | 14 (66.7%) |
Employment Characteristics in Morganton
Employment by Class of Employer in Morganton
Among the 125 employed individuals in Morganton, private company employees (110 | 88.0%), local government employees (11 | 8.8%), and federal government employees (4 | 3.2%) make up the most common classes of employment.
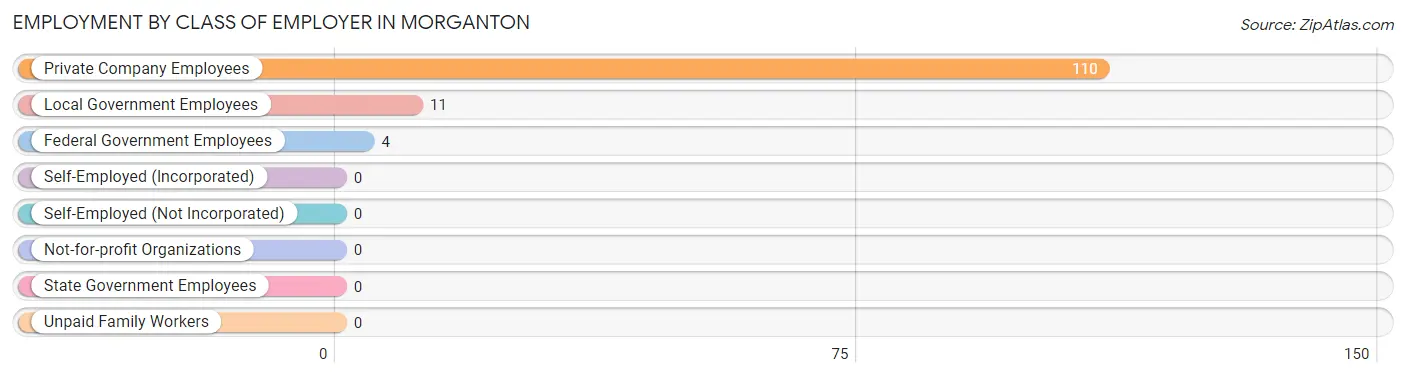
| Employer Class | # Employees | % Employees |
| Private Company Employees | 110 | 88.0% |
| Self-Employed (Incorporated) | 0 | 0.0% |
| Self-Employed (Not Incorporated) | 0 | 0.0% |
| Not-for-profit Organizations | 0 | 0.0% |
| Local Government Employees | 11 | 8.8% |
| State Government Employees | 0 | 0.0% |
| Federal Government Employees | 4 | 3.2% |
| Unpaid Family Workers | 0 | 0.0% |
| Total | 125 | 100.0% |
Employment Status by Age in Morganton
According to the labor force statistics for Morganton, out of the total population over 16 years of age (241), 54.4% or 131 individuals are in the labor force, with 4.6% or 6 of them unemployed. The age group with the highest labor force participation rate is 25 to 29 years, with 100.0% or 23 individuals in the labor force. Within the labor force, the 45 to 54 years age range has the highest percentage of unemployed individuals, with 15.0% or 6 of them being unemployed.
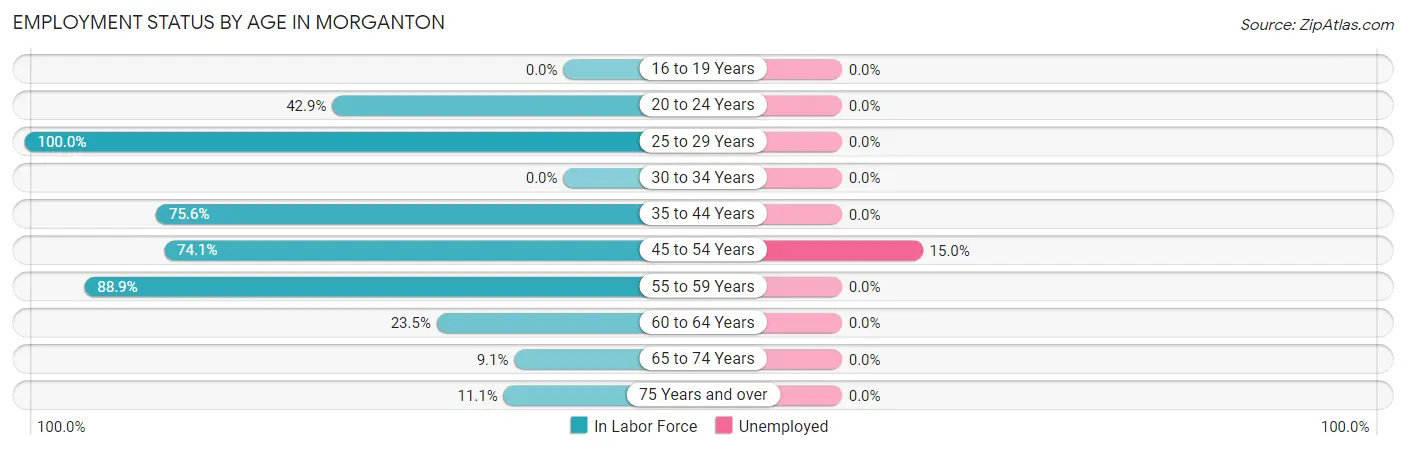
| Age Bracket | In Labor Force | Unemployed |
| 16 to 19 Years | 0 (0.0%) | 0 (0.0%) |
| 20 to 24 Years | 9 (42.9%) | 0 (0.0%) |
| 25 to 29 Years | 23 (100.0%) | 0 (0.0%) |
| 30 to 34 Years | 0 (0.0%) | 0 (0.0%) |
| 35 to 44 Years | 34 (75.6%) | 0 (0.0%) |
| 45 to 54 Years | 40 (74.1%) | 6 (15.0%) |
| 55 to 59 Years | 16 (88.9%) | 0 (0.0%) |
| 60 to 64 Years | 4 (23.5%) | 0 (0.0%) |
| 65 to 74 Years | 3 (9.1%) | 0 (0.0%) |
| 75 Years and over | 2 (11.1%) | 0 (0.0%) |
| Total | 131 (54.4%) | 6 (4.6%) |
Employment Status by Educational Attainment in Morganton
According to labor force statistics for Morganton, 73.1% of individuals (117) out of the total population between 25 and 64 years of age (160) are in the labor force, with 5.1% or 6 of them being unemployed. The group with the highest labor force participation rate are those with the educational attainment of less than high school, with 100.0% or 17 individuals in the labor force. Within the labor force, individuals with college / associate degree education have the highest percentage of unemployment, with 13.6% or 6 of them being unemployed.
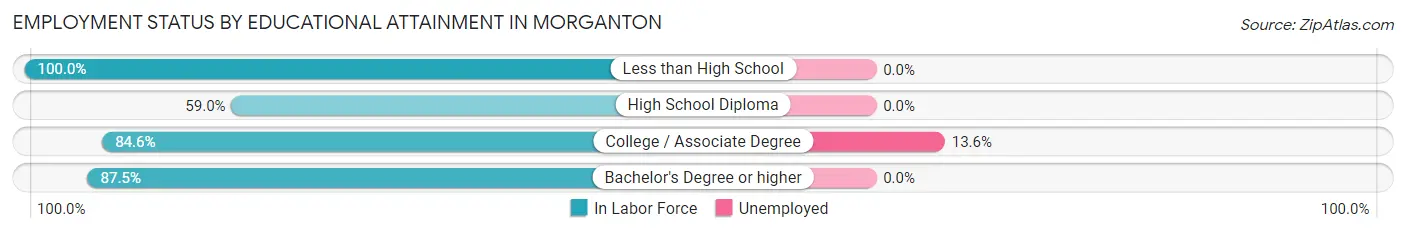
| Educational Attainment | In Labor Force | Unemployed |
| Less than High School | 17 (100.0%) | 0 (0.0%) |
| High School Diploma | 49 (59.0%) | 0 (0.0%) |
| College / Associate Degree | 44 (84.6%) | 7 (13.6%) |
| Bachelor's Degree or higher | 7 (87.5%) | 0 (0.0%) |
| Total | 117 (73.1%) | 8 (5.1%) |
Employment Occupations by Sex in Morganton
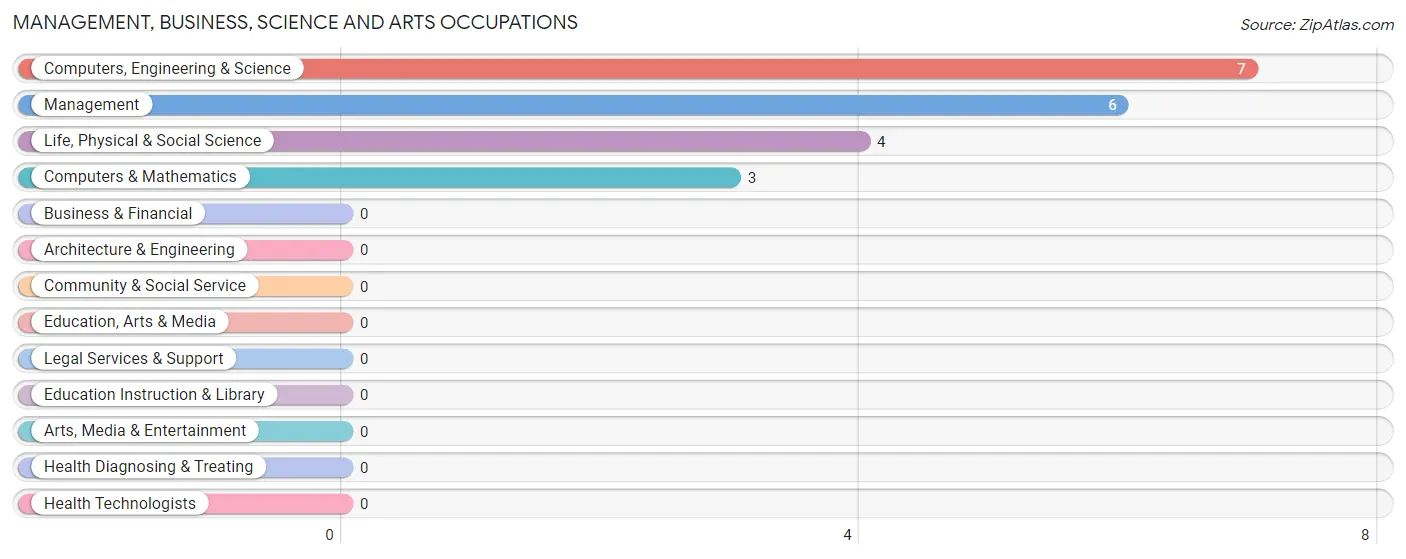
Management, Business, Science and Arts Occupations
The most common Management, Business, Science and Arts occupations in Morganton are Computers, Engineering & Science (7 | 5.6%), Management (6 | 4.8%), Life, Physical & Social Science (4 | 3.2%), and Computers & Mathematics (3 | 2.4%).
Management, Business, Science and Arts Occupations by Sex
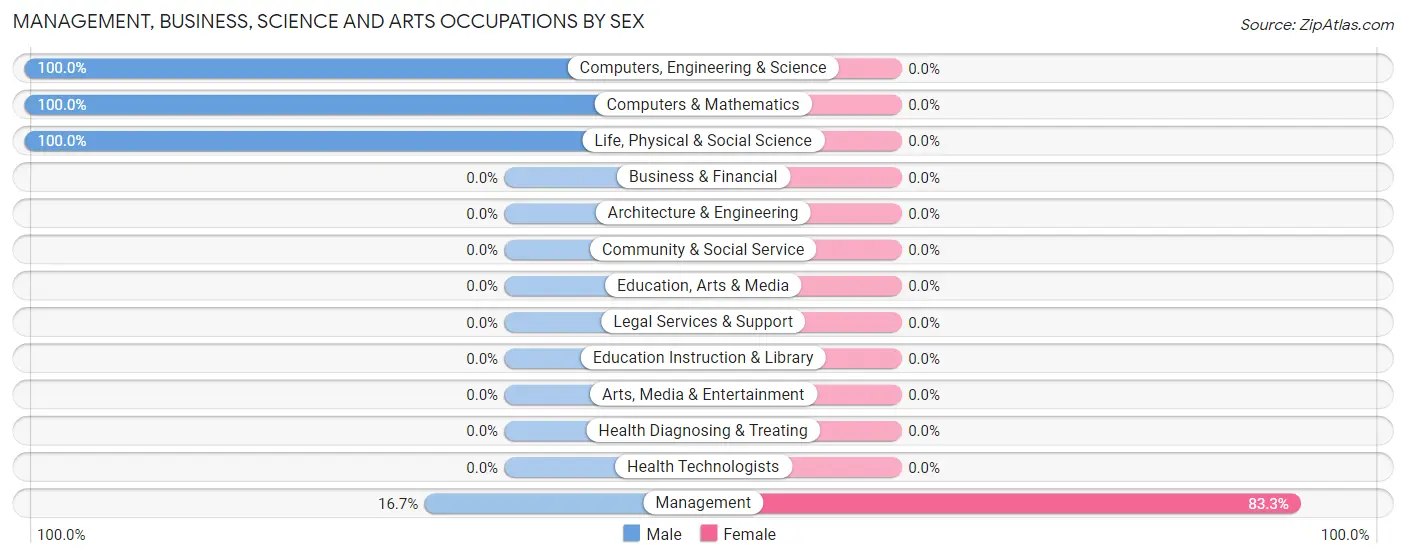
| Occupation | Male | Female |
| Management | 1 (16.7%) | 5 (83.3%) |
| Business & Financial | 0 (0.0%) | 0 (0.0%) |
| Computers, Engineering & Science | 7 (100.0%) | 0 (0.0%) |
| Computers & Mathematics | 3 (100.0%) | 0 (0.0%) |
| Architecture & Engineering | 0 (0.0%) | 0 (0.0%) |
| Life, Physical & Social Science | 4 (100.0%) | 0 (0.0%) |
| Community & Social Service | 0 (0.0%) | 0 (0.0%) |
| Education, Arts & Media | 0 (0.0%) | 0 (0.0%) |
| Legal Services & Support | 0 (0.0%) | 0 (0.0%) |
| Education Instruction & Library | 0 (0.0%) | 0 (0.0%) |
| Arts, Media & Entertainment | 0 (0.0%) | 0 (0.0%) |
| Health Diagnosing & Treating | 0 (0.0%) | 0 (0.0%) |
| Health Technologists | 0 (0.0%) | 0 (0.0%) |
| Total (Category) | 8 (61.5%) | 5 (38.5%) |
| Total (Overall) | 53 (42.4%) | 72 (57.6%) |
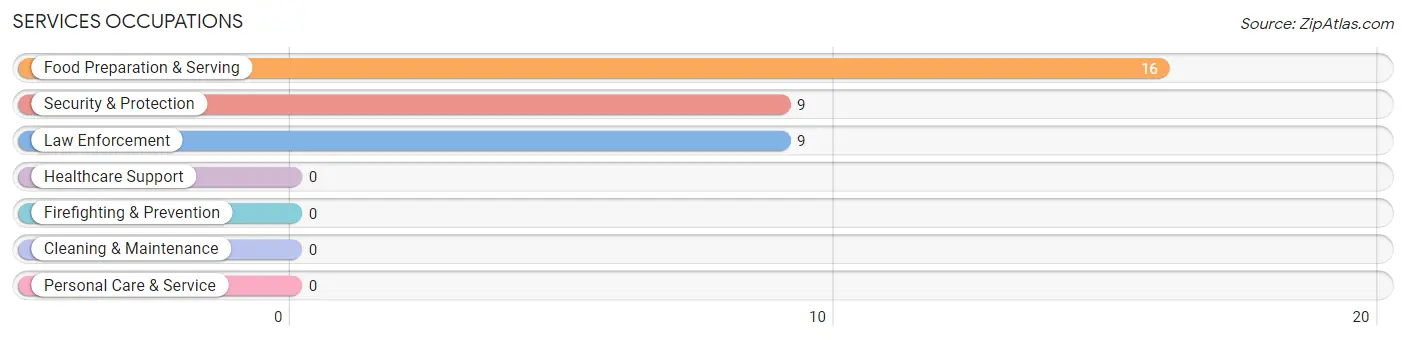
Services Occupations
The most common Services occupations in Morganton are Food Preparation & Serving (16 | 12.8%), Security & Protection (9 | 7.2%), and Law Enforcement (9 | 7.2%).
Services Occupations by Sex
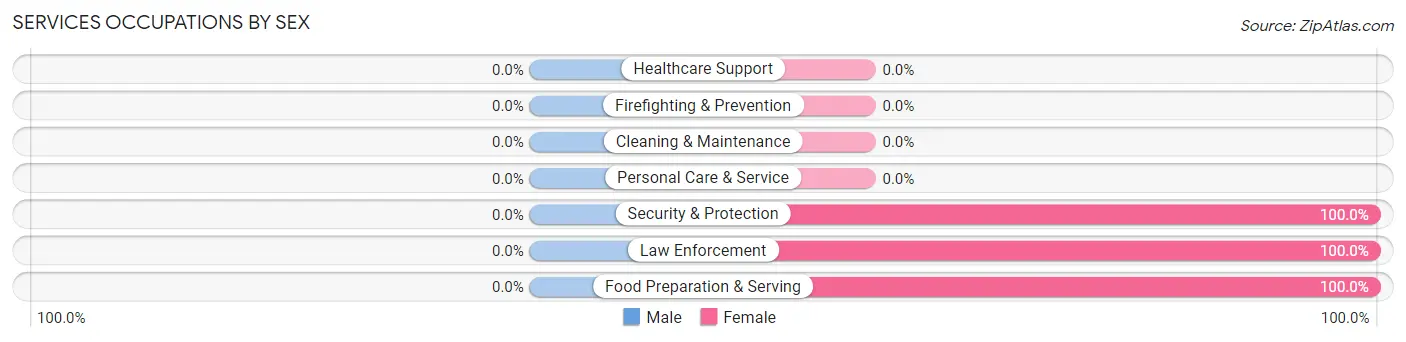
| Occupation | Male | Female |
| Healthcare Support | 0 (0.0%) | 0 (0.0%) |
| Security & Protection | 0 (0.0%) | 9 (100.0%) |
| Firefighting & Prevention | 0 (0.0%) | 0 (0.0%) |
| Law Enforcement | 0 (0.0%) | 9 (100.0%) |
| Food Preparation & Serving | 0 (0.0%) | 16 (100.0%) |
| Cleaning & Maintenance | 0 (0.0%) | 0 (0.0%) |
| Personal Care & Service | 0 (0.0%) | 0 (0.0%) |
| Total (Category) | 0 (0.0%) | 25 (100.0%) |
| Total (Overall) | 53 (42.4%) | 72 (57.6%) |
Sales and Office Occupations
The most common Sales and Office occupations in Morganton are Sales & Related (35 | 28.0%), and Office & Administration (7 | 5.6%).
Sales and Office Occupations by Sex
| Occupation | Male | Female |
| Sales & Related | 3 (8.6%) | 32 (91.4%) |
| Office & Administration | 0 (0.0%) | 7 (100.0%) |
| Total (Category) | 3 (7.1%) | 39 (92.9%) |
| Total (Overall) | 53 (42.4%) | 72 (57.6%) |
Natural Resources, Construction and Maintenance Occupations
The most common Natural Resources, Construction and Maintenance occupations in Morganton are Construction & Extraction (15 | 12.0%), and Installation, Maintenance & Repair (1 | 0.8%).
Natural Resources, Construction and Maintenance Occupations by Sex
| Occupation | Male | Female |
| Farming, Fishing & Forestry | 0 (0.0%) | 0 (0.0%) |
| Construction & Extraction | 14 (93.3%) | 1 (6.7%) |
| Installation, Maintenance & Repair | 1 (100.0%) | 0 (0.0%) |
| Total (Category) | 15 (93.8%) | 1 (6.2%) |
| Total (Overall) | 53 (42.4%) | 72 (57.6%) |
Production, Transportation and Moving Occupations
The most common Production, Transportation and Moving occupations in Morganton are Transportation (15 | 12.0%), Production (9 | 7.2%), and Material Moving (5 | 4.0%).
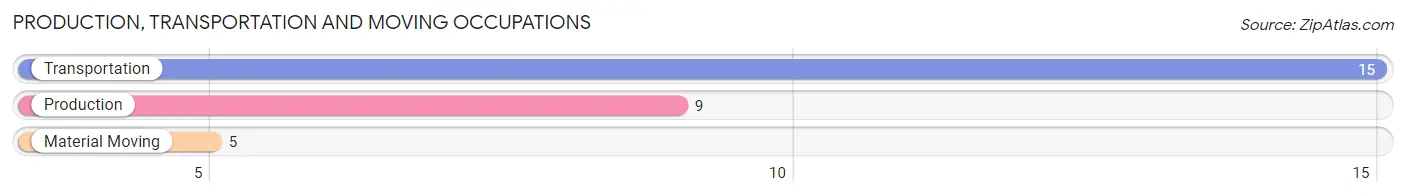
Production, Transportation and Moving Occupations by Sex
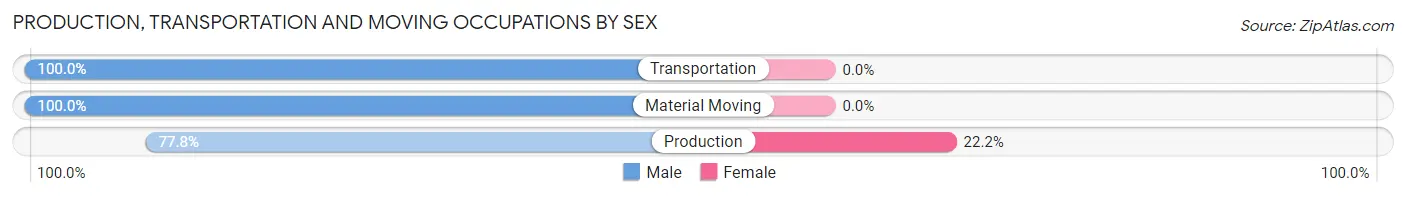
| Occupation | Male | Female |
| Production | 7 (77.8%) | 2 (22.2%) |
| Transportation | 15 (100.0%) | 0 (0.0%) |
| Material Moving | 5 (100.0%) | 0 (0.0%) |
| Total (Category) | 27 (93.1%) | 2 (6.9%) |
| Total (Overall) | 53 (42.4%) | 72 (57.6%) |
Employment Industries by Sex in Morganton
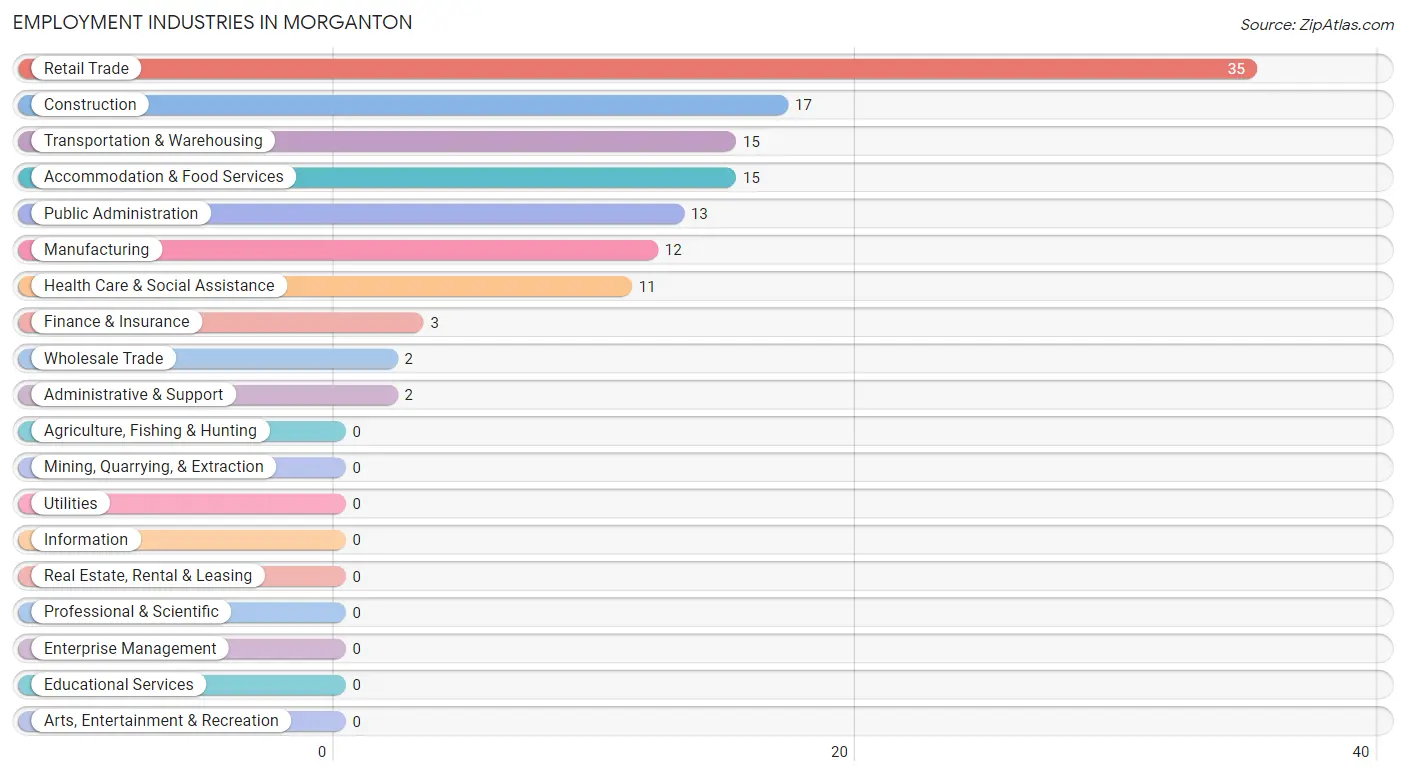
Employment Industries in Morganton
The major employment industries in Morganton include Retail Trade (35 | 28.0%), Construction (17 | 13.6%), Transportation & Warehousing (15 | 12.0%), Accommodation & Food Services (15 | 12.0%), and Public Administration (13 | 10.4%).
Employment Industries by Sex in Morganton
The Morganton industries that see more men than women are Manufacturing (100.0%), Transportation & Warehousing (100.0%), and Finance & Insurance (100.0%), whereas the industries that tend to have a higher number of women are Wholesale Trade (100.0%), Administrative & Support (100.0%), and Health Care & Social Assistance (100.0%).
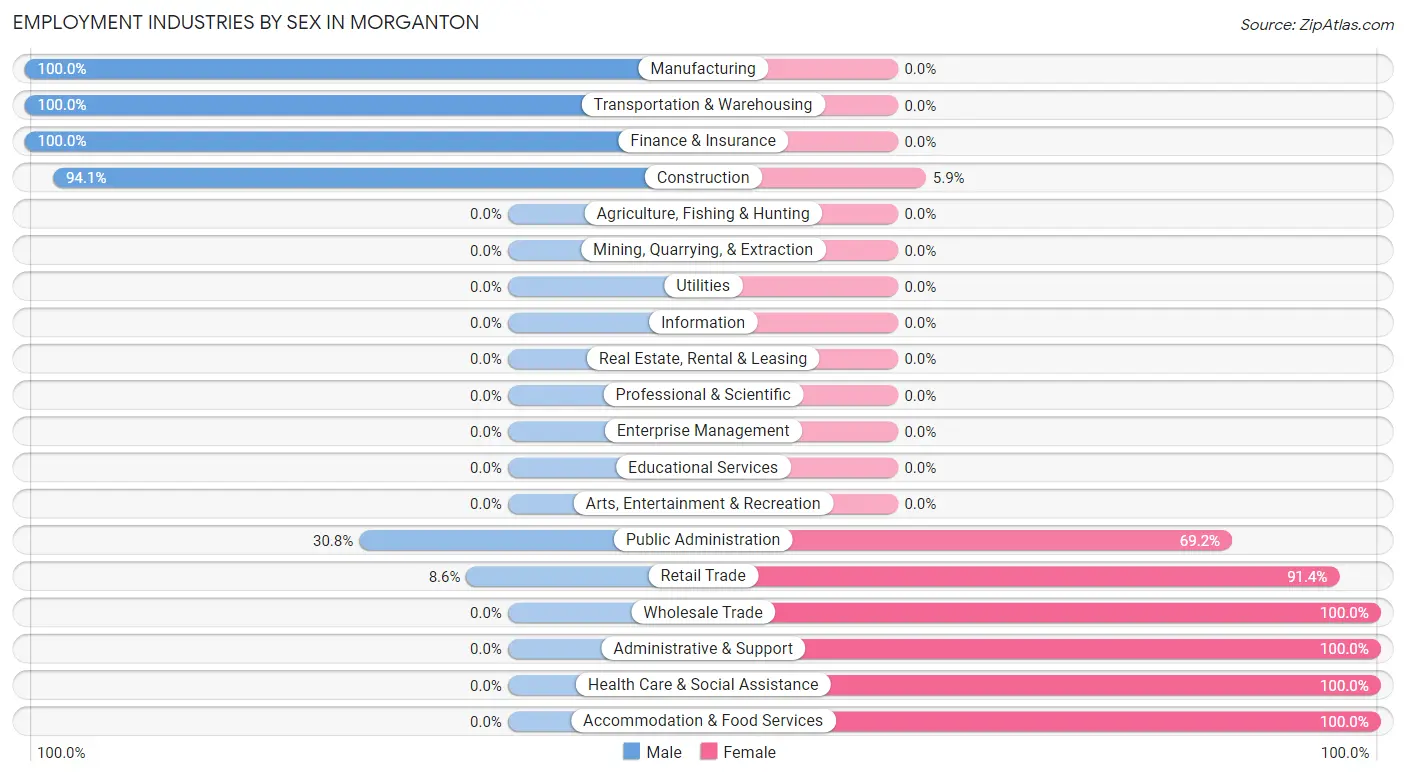
| Industry | Male | Female |
| Agriculture, Fishing & Hunting | 0 (0.0%) | 0 (0.0%) |
| Mining, Quarrying, & Extraction | 0 (0.0%) | 0 (0.0%) |
| Construction | 16 (94.1%) | 1 (5.9%) |
| Manufacturing | 12 (100.0%) | 0 (0.0%) |
| Wholesale Trade | 0 (0.0%) | 2 (100.0%) |
| Retail Trade | 3 (8.6%) | 32 (91.4%) |
| Transportation & Warehousing | 15 (100.0%) | 0 (0.0%) |
| Utilities | 0 (0.0%) | 0 (0.0%) |
| Information | 0 (0.0%) | 0 (0.0%) |
| Finance & Insurance | 3 (100.0%) | 0 (0.0%) |
| Real Estate, Rental & Leasing | 0 (0.0%) | 0 (0.0%) |
| Professional & Scientific | 0 (0.0%) | 0 (0.0%) |
| Enterprise Management | 0 (0.0%) | 0 (0.0%) |
| Administrative & Support | 0 (0.0%) | 2 (100.0%) |
| Educational Services | 0 (0.0%) | 0 (0.0%) |
| Health Care & Social Assistance | 0 (0.0%) | 11 (100.0%) |
| Arts, Entertainment & Recreation | 0 (0.0%) | 0 (0.0%) |
| Accommodation & Food Services | 0 (0.0%) | 15 (100.0%) |
| Public Administration | 4 (30.8%) | 9 (69.2%) |
| Total | 53 (42.4%) | 72 (57.6%) |
Education in Morganton
School Enrollment in Morganton
The most common levels of schooling among the 61 students in Morganton are middle school (32 | 52.5%), elementary school (15 | 24.6%), and college / undergraduate (8 | 13.1%).
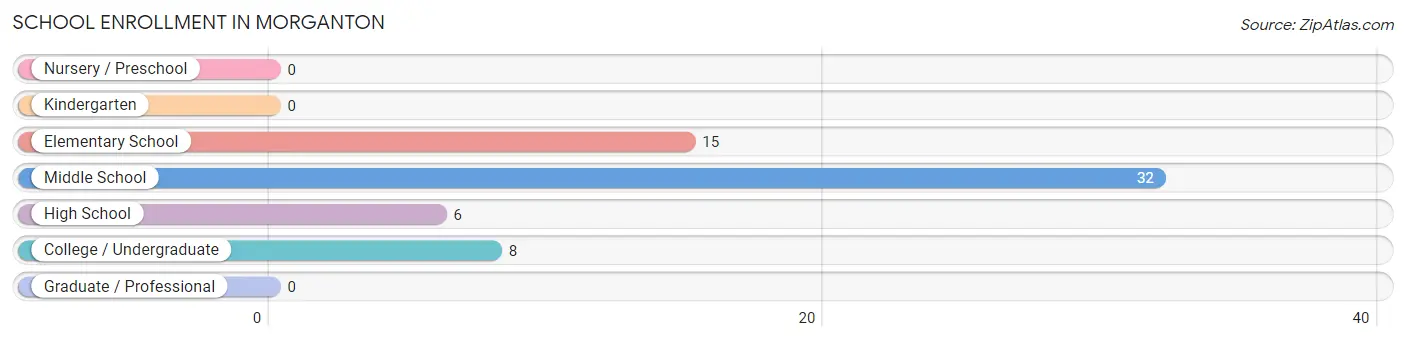
| School Level | # Students | % Students |
| Nursery / Preschool | 0 | 0.0% |
| Kindergarten | 0 | 0.0% |
| Elementary School | 15 | 24.6% |
| Middle School | 32 | 52.5% |
| High School | 6 | 9.8% |
| College / Undergraduate | 8 | 13.1% |
| Graduate / Professional | 0 | 0.0% |
| Total | 61 | 100.0% |
School Enrollment by Age by Funding Source in Morganton
Out of a total of 61 students who are enrolled in schools in Morganton, 28 (45.9%) attend a private institution, while the remaining 33 (54.1%) are enrolled in public schools. The age group of 15 to 17 year olds has the highest likelihood of being enrolled in private schools, with 10 (66.7% in the age bracket) enrolled. Conversely, the age group of 10 to 14 year olds has the lowest likelihood of being enrolled in a private school, with 18 (78.3% in the age bracket) attending a public institution.
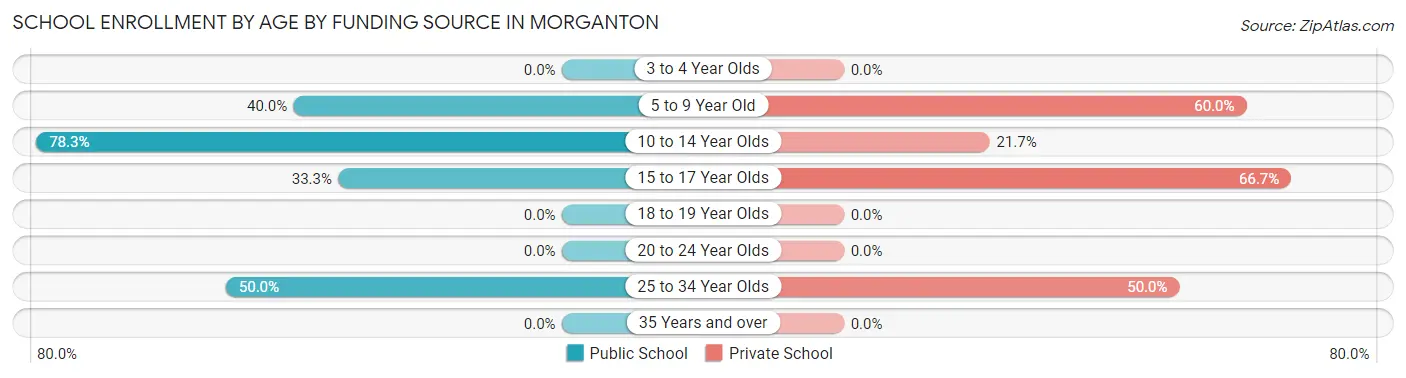
| Age Bracket | Public School | Private School |
| 3 to 4 Year Olds | 0 (0.0%) | 0 (0.0%) |
| 5 to 9 Year Old | 6 (40.0%) | 9 (60.0%) |
| 10 to 14 Year Olds | 18 (78.3%) | 5 (21.7%) |
| 15 to 17 Year Olds | 5 (33.3%) | 10 (66.7%) |
| 18 to 19 Year Olds | 0 (0.0%) | 0 (0.0%) |
| 20 to 24 Year Olds | 0 (0.0%) | 0 (0.0%) |
| 25 to 34 Year Olds | 4 (50.0%) | 4 (50.0%) |
| 35 Years and over | 0 (0.0%) | 0 (0.0%) |
| Total | 33 (54.1%) | 28 (45.9%) |
Educational Attainment by Field of Study in Morganton
Business (10 | 50.0%), science & technology (6 | 30.0%), communications (2 | 10.0%), psychology (1 | 5.0%), and education (1 | 5.0%) are the most common fields of study among 20 individuals in Morganton who have obtained a bachelor's degree or higher.
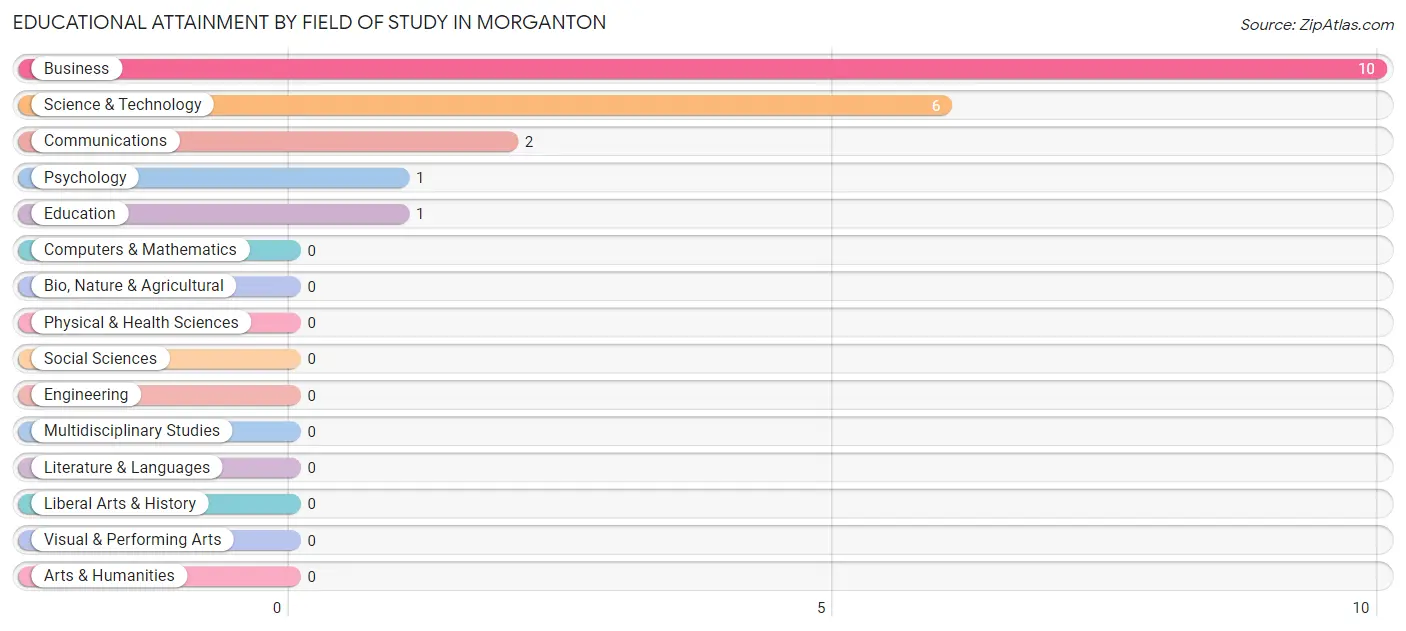
| Field of Study | # Graduates | % Graduates |
| Computers & Mathematics | 0 | 0.0% |
| Bio, Nature & Agricultural | 0 | 0.0% |
| Physical & Health Sciences | 0 | 0.0% |
| Psychology | 1 | 5.0% |
| Social Sciences | 0 | 0.0% |
| Engineering | 0 | 0.0% |
| Multidisciplinary Studies | 0 | 0.0% |
| Science & Technology | 6 | 30.0% |
| Business | 10 | 50.0% |
| Education | 1 | 5.0% |
| Literature & Languages | 0 | 0.0% |
| Liberal Arts & History | 0 | 0.0% |
| Visual & Performing Arts | 0 | 0.0% |
| Communications | 2 | 10.0% |
| Arts & Humanities | 0 | 0.0% |
| Total | 20 | 100.0% |
Transportation & Commute in Morganton
Vehicle Availability by Sex in Morganton
The most prevalent vehicle ownership categories in Morganton are males with 3 vehicles (28, accounting for 52.8%) and females with 3 vehicles (11, making up 38.9%).
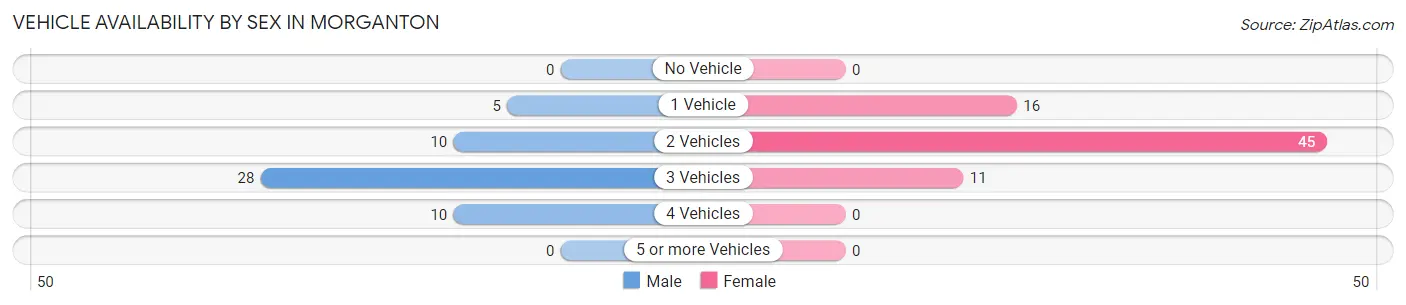
| Vehicles Available | Male | Female |
| No Vehicle | 0 (0.0%) | 0 (0.0%) |
| 1 Vehicle | 5 (9.4%) | 16 (22.2%) |
| 2 Vehicles | 10 (18.9%) | 45 (62.5%) |
| 3 Vehicles | 28 (52.8%) | 11 (15.3%) |
| 4 Vehicles | 10 (18.9%) | 0 (0.0%) |
| 5 or more Vehicles | 0 (0.0%) | 0 (0.0%) |
| Total | 53 (100.0%) | 72 (100.0%) |
Commute Time in Morganton
The most frequently occuring commute durations in Morganton are 30 to 34 minutes (24 commuters, 20.0%), 10 to 14 minutes (23 commuters, 19.2%), and 5 to 9 minutes (21 commuters, 17.5%).
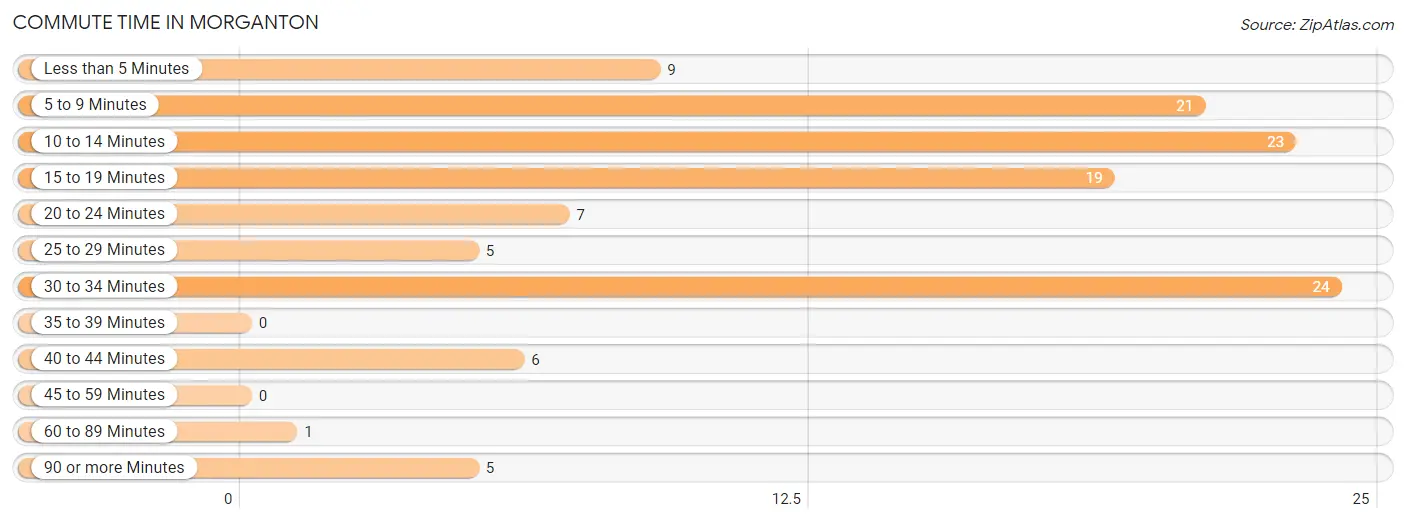
| Commute Time | # Commuters | % Commuters |
| Less than 5 Minutes | 9 | 7.5% |
| 5 to 9 Minutes | 21 | 17.5% |
| 10 to 14 Minutes | 23 | 19.2% |
| 15 to 19 Minutes | 19 | 15.8% |
| 20 to 24 Minutes | 7 | 5.8% |
| 25 to 29 Minutes | 5 | 4.2% |
| 30 to 34 Minutes | 24 | 20.0% |
| 35 to 39 Minutes | 0 | 0.0% |
| 40 to 44 Minutes | 6 | 5.0% |
| 45 to 59 Minutes | 0 | 0.0% |
| 60 to 89 Minutes | 1 | 0.8% |
| 90 or more Minutes | 5 | 4.2% |
Commute Time by Sex in Morganton
The most common commute times in Morganton are 30 to 34 minutes (24 commuters, 45.3%) for males and 10 to 14 minutes (17 commuters, 25.4%) for females.
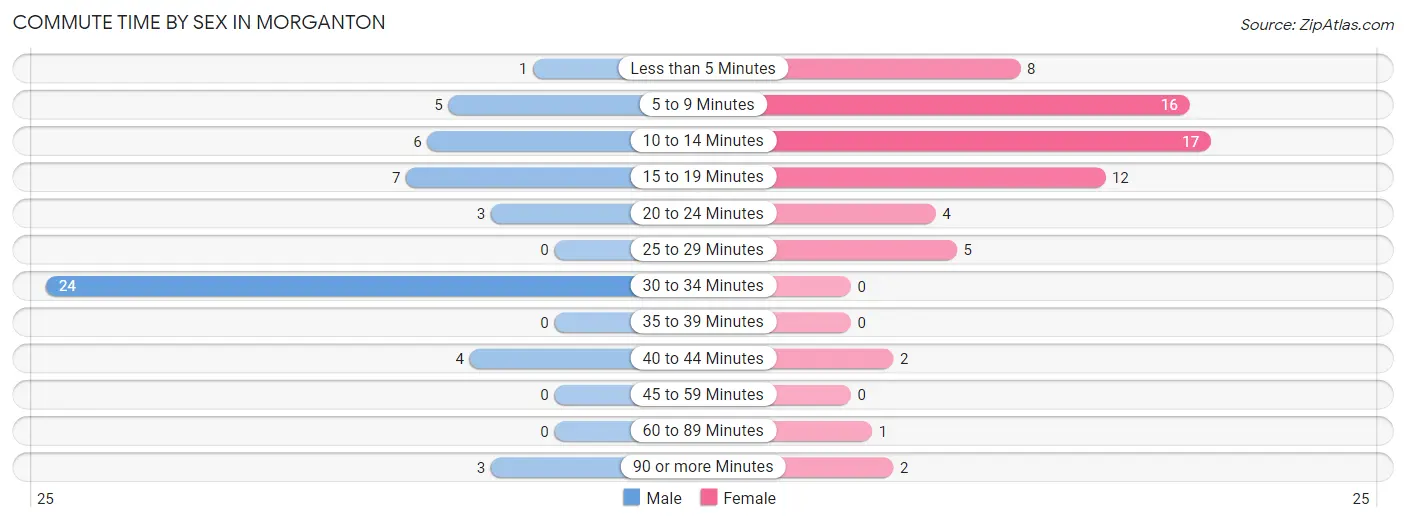
| Commute Time | Male | Female |
| Less than 5 Minutes | 1 (1.9%) | 8 (11.9%) |
| 5 to 9 Minutes | 5 (9.4%) | 16 (23.9%) |
| 10 to 14 Minutes | 6 (11.3%) | 17 (25.4%) |
| 15 to 19 Minutes | 7 (13.2%) | 12 (17.9%) |
| 20 to 24 Minutes | 3 (5.7%) | 4 (6.0%) |
| 25 to 29 Minutes | 0 (0.0%) | 5 (7.5%) |
| 30 to 34 Minutes | 24 (45.3%) | 0 (0.0%) |
| 35 to 39 Minutes | 0 (0.0%) | 0 (0.0%) |
| 40 to 44 Minutes | 4 (7.5%) | 2 (3.0%) |
| 45 to 59 Minutes | 0 (0.0%) | 0 (0.0%) |
| 60 to 89 Minutes | 0 (0.0%) | 1 (1.5%) |
| 90 or more Minutes | 3 (5.7%) | 2 (3.0%) |
Time of Departure to Work by Sex in Morganton
The most frequent times of departure to work in Morganton are 9:00 AM to 9:59 AM (24, 45.3%) for males and 10:00 AM to 10:59 AM (20, 29.8%) for females.
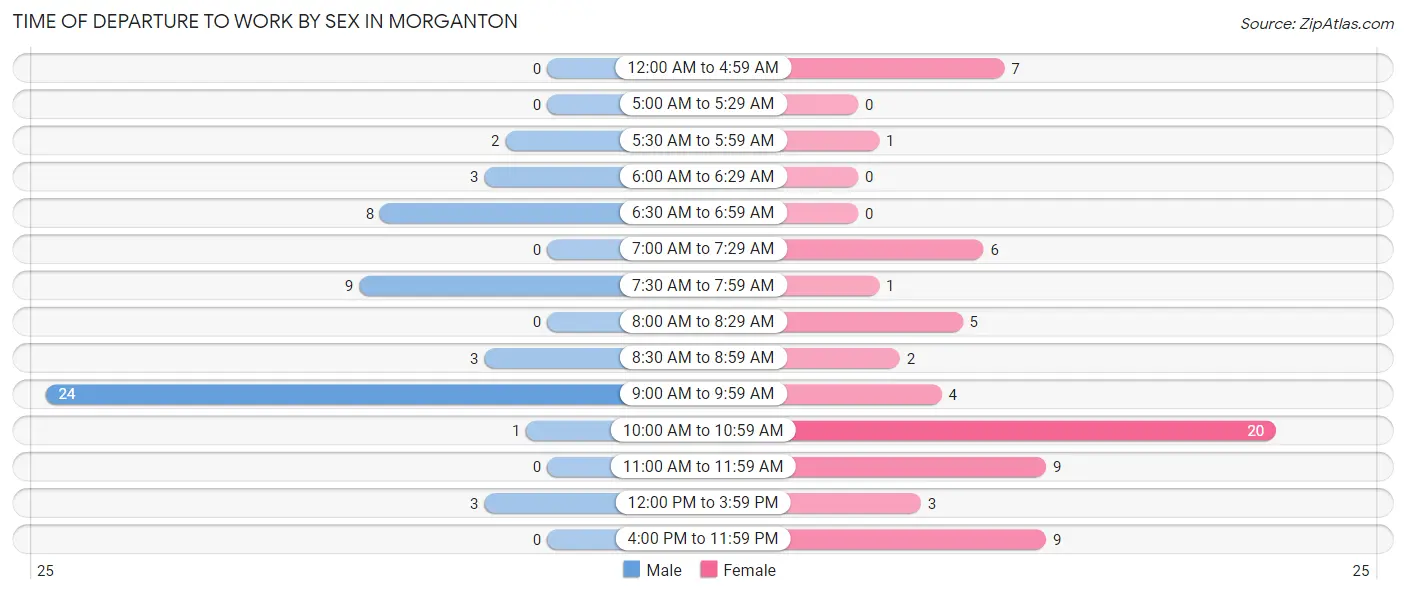
| Time of Departure | Male | Female |
| 12:00 AM to 4:59 AM | 0 (0.0%) | 7 (10.4%) |
| 5:00 AM to 5:29 AM | 0 (0.0%) | 0 (0.0%) |
| 5:30 AM to 5:59 AM | 2 (3.8%) | 1 (1.5%) |
| 6:00 AM to 6:29 AM | 3 (5.7%) | 0 (0.0%) |
| 6:30 AM to 6:59 AM | 8 (15.1%) | 0 (0.0%) |
| 7:00 AM to 7:29 AM | 0 (0.0%) | 6 (9.0%) |
| 7:30 AM to 7:59 AM | 9 (17.0%) | 1 (1.5%) |
| 8:00 AM to 8:29 AM | 0 (0.0%) | 5 (7.5%) |
| 8:30 AM to 8:59 AM | 3 (5.7%) | 2 (3.0%) |
| 9:00 AM to 9:59 AM | 24 (45.3%) | 4 (6.0%) |
| 10:00 AM to 10:59 AM | 1 (1.9%) | 20 (29.8%) |
| 11:00 AM to 11:59 AM | 0 (0.0%) | 9 (13.4%) |
| 12:00 PM to 3:59 PM | 3 (5.7%) | 3 (4.5%) |
| 4:00 PM to 11:59 PM | 0 (0.0%) | 9 (13.4%) |
| Total | 53 (100.0%) | 67 (100.0%) |
Housing Occupancy in Morganton
Occupancy by Ownership in Morganton
Of the total 111 dwellings in Morganton, owner-occupied units account for 79 (71.2%), while renter-occupied units make up 32 (28.8%).
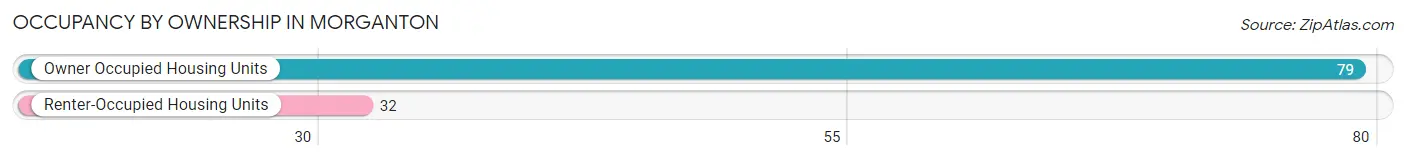
| Occupancy | # Housing Units | % Housing Units |
| Owner Occupied Housing Units | 79 | 71.2% |
| Renter-Occupied Housing Units | 32 | 28.8% |
| Total Occupied Housing Units | 111 | 100.0% |
Occupancy by Household Size in Morganton
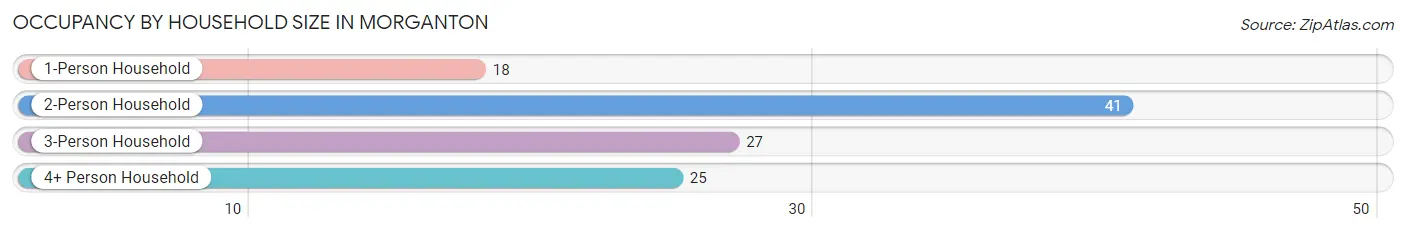
| Household Size | # Housing Units | % Housing Units |
| 1-Person Household | 18 | 16.2% |
| 2-Person Household | 41 | 36.9% |
| 3-Person Household | 27 | 24.3% |
| 4+ Person Household | 25 | 22.5% |
| Total Housing Units | 111 | 100.0% |
Occupancy by Ownership by Household Size in Morganton
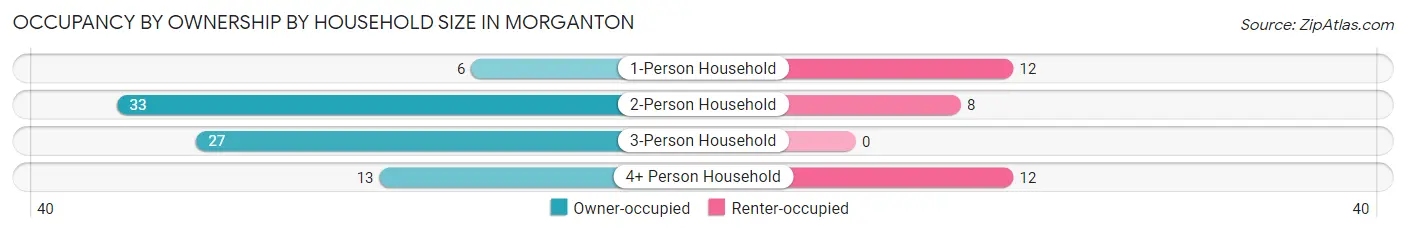
| Household Size | Owner-occupied | Renter-occupied |
| 1-Person Household | 6 (33.3%) | 12 (66.7%) |
| 2-Person Household | 33 (80.5%) | 8 (19.5%) |
| 3-Person Household | 27 (100.0%) | 0 (0.0%) |
| 4+ Person Household | 13 (52.0%) | 12 (48.0%) |
| Total Housing Units | 79 (71.2%) | 32 (28.8%) |
Occupancy by Educational Attainment in Morganton
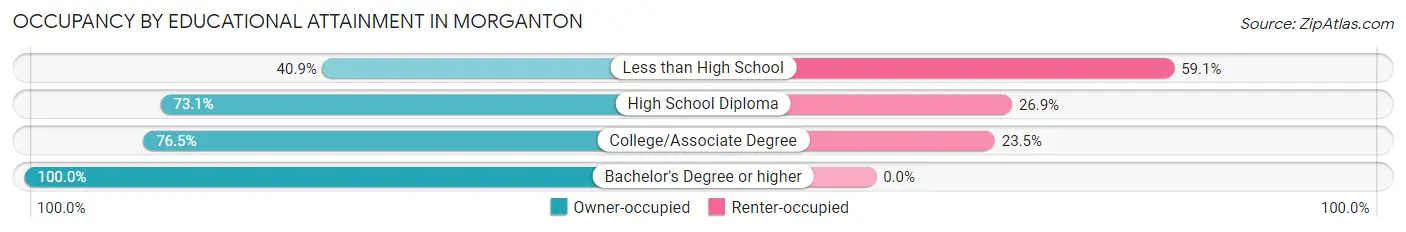
| Household Size | Owner-occupied | Renter-occupied |
| Less than High School | 9 (40.9%) | 13 (59.1%) |
| High School Diploma | 19 (73.1%) | 7 (26.9%) |
| College/Associate Degree | 39 (76.5%) | 12 (23.5%) |
| Bachelor's Degree or higher | 12 (100.0%) | 0 (0.0%) |
Occupancy by Age of Householder in Morganton

| Age Bracket | # Households | % Households |
| Under 35 Years | 7 | 6.3% |
| 35 to 44 Years | 18 | 16.2% |
| 45 to 54 Years | 36 | 32.4% |
| 55 to 64 Years | 12 | 10.8% |
| 65 to 74 Years | 25 | 22.5% |
| 75 to 84 Years | 13 | 11.7% |
| 85 Years and Over | 0 | 0.0% |
| Total | 111 | 100.0% |
Housing Finances in Morganton
Median Income by Occupancy in Morganton
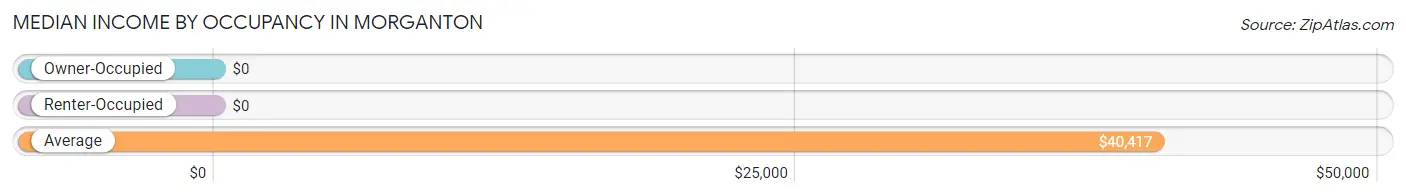
| Occupancy Type | # Households | Median Income |
| Owner-Occupied | 79 (71.2%) | $0 |
| Renter-Occupied | 32 (28.8%) | $0 |
| Average | 111 (100.0%) | $40,417 |
Occupancy by Householder Income Bracket in Morganton
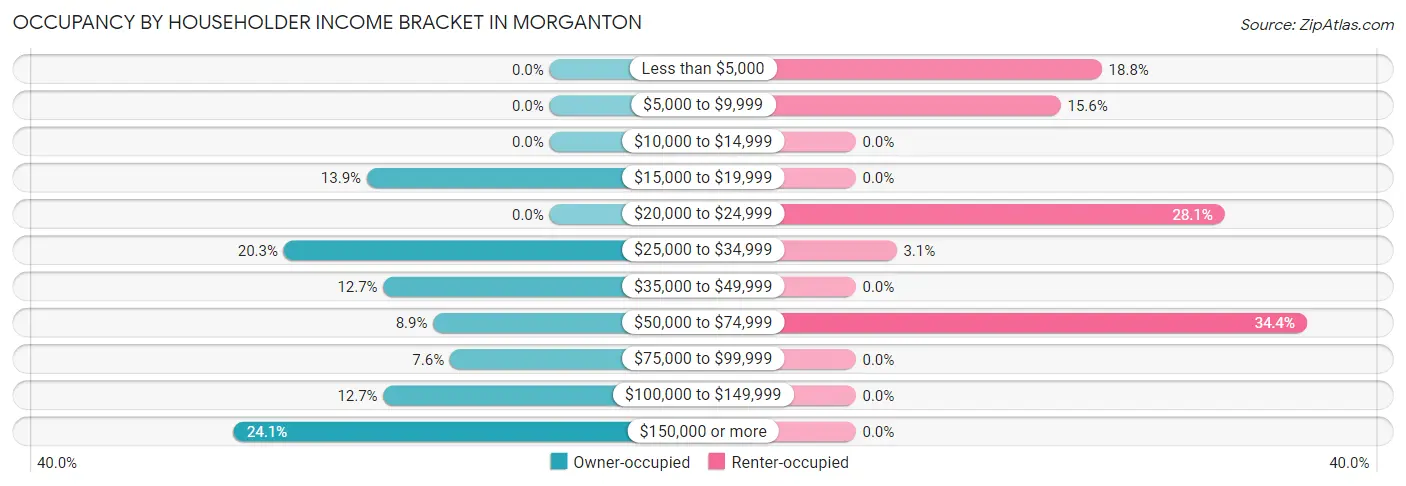
| Income Bracket | Owner-occupied | Renter-occupied |
| Less than $5,000 | 0 (0.0%) | 6 (18.8%) |
| $5,000 to $9,999 | 0 (0.0%) | 5 (15.6%) |
| $10,000 to $14,999 | 0 (0.0%) | 0 (0.0%) |
| $15,000 to $19,999 | 11 (13.9%) | 0 (0.0%) |
| $20,000 to $24,999 | 0 (0.0%) | 9 (28.1%) |
| $25,000 to $34,999 | 16 (20.3%) | 1 (3.1%) |
| $35,000 to $49,999 | 10 (12.7%) | 0 (0.0%) |
| $50,000 to $74,999 | 7 (8.9%) | 11 (34.4%) |
| $75,000 to $99,999 | 6 (7.6%) | 0 (0.0%) |
| $100,000 to $149,999 | 10 (12.7%) | 0 (0.0%) |
| $150,000 or more | 19 (24.0%) | 0 (0.0%) |
| Total | 79 (100.0%) | 32 (100.0%) |
Monthly Housing Cost Tiers in Morganton
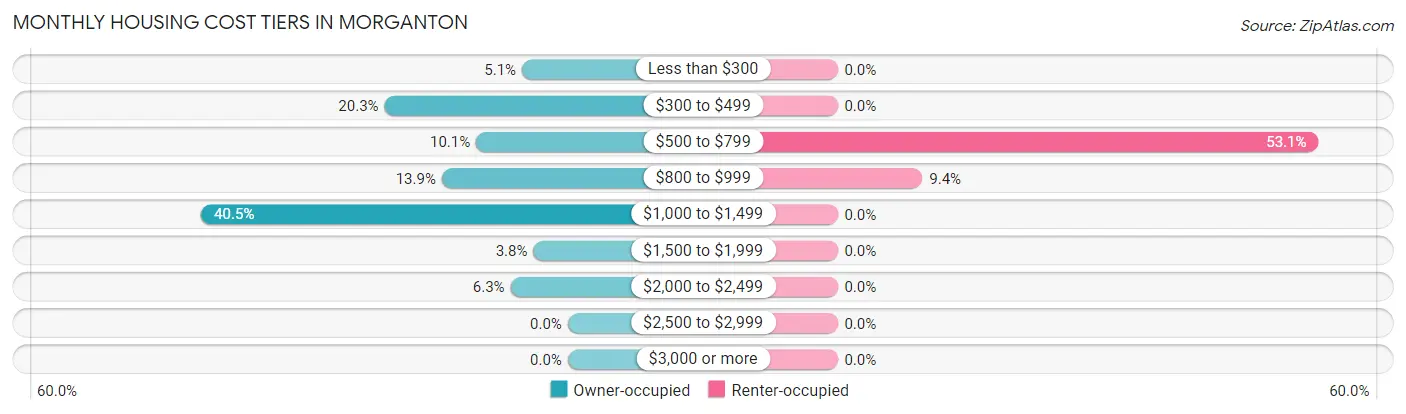
| Monthly Cost | Owner-occupied | Renter-occupied |
| Less than $300 | 4 (5.1%) | 0 (0.0%) |
| $300 to $499 | 16 (20.3%) | 0 (0.0%) |
| $500 to $799 | 8 (10.1%) | 17 (53.1%) |
| $800 to $999 | 11 (13.9%) | 3 (9.4%) |
| $1,000 to $1,499 | 32 (40.5%) | 0 (0.0%) |
| $1,500 to $1,999 | 3 (3.8%) | 0 (0.0%) |
| $2,000 to $2,499 | 5 (6.3%) | 0 (0.0%) |
| $2,500 to $2,999 | 0 (0.0%) | 0 (0.0%) |
| $3,000 or more | 0 (0.0%) | 0 (0.0%) |
| Total | 79 (100.0%) | 32 (100.0%) |
Physical Housing Characteristics in Morganton
Housing Structures in Morganton
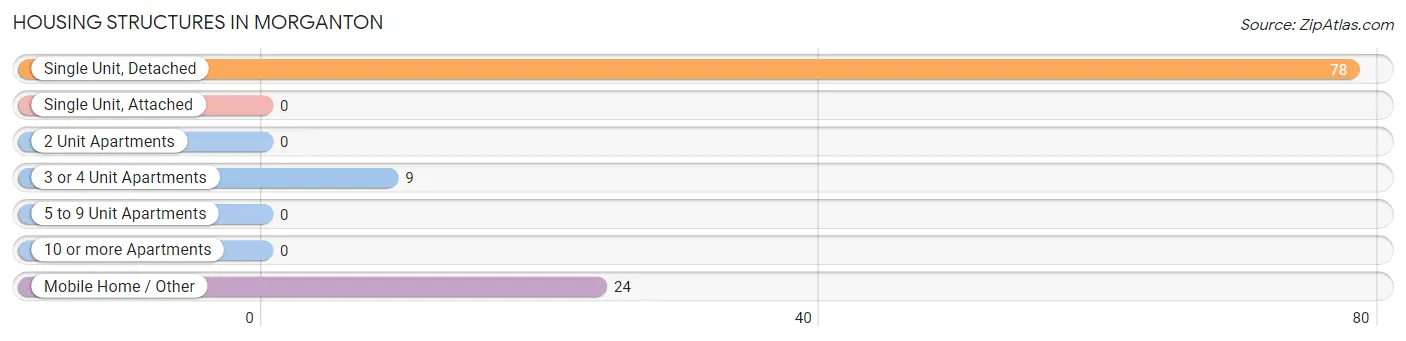
| Structure Type | # Housing Units | % Housing Units |
| Single Unit, Detached | 78 | 70.3% |
| Single Unit, Attached | 0 | 0.0% |
| 2 Unit Apartments | 0 | 0.0% |
| 3 or 4 Unit Apartments | 9 | 8.1% |
| 5 to 9 Unit Apartments | 0 | 0.0% |
| 10 or more Apartments | 0 | 0.0% |
| Mobile Home / Other | 24 | 21.6% |
| Total | 111 | 100.0% |
Housing Structures by Occupancy in Morganton
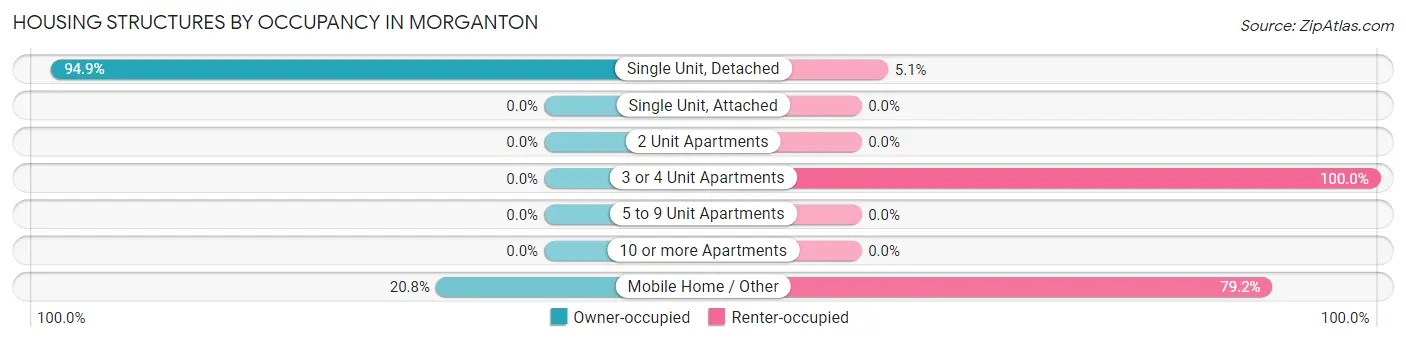
| Structure Type | Owner-occupied | Renter-occupied |
| Single Unit, Detached | 74 (94.9%) | 4 (5.1%) |
| Single Unit, Attached | 0 (0.0%) | 0 (0.0%) |
| 2 Unit Apartments | 0 (0.0%) | 0 (0.0%) |
| 3 or 4 Unit Apartments | 0 (0.0%) | 9 (100.0%) |
| 5 to 9 Unit Apartments | 0 (0.0%) | 0 (0.0%) |
| 10 or more Apartments | 0 (0.0%) | 0 (0.0%) |
| Mobile Home / Other | 5 (20.8%) | 19 (79.2%) |
| Total | 79 (71.2%) | 32 (28.8%) |
Housing Structures by Number of Rooms in Morganton
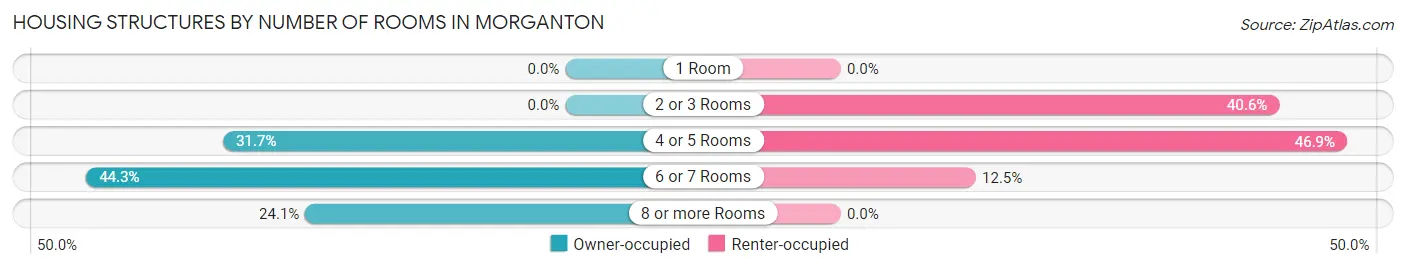
| Number of Rooms | Owner-occupied | Renter-occupied |
| 1 Room | 0 (0.0%) | 0 (0.0%) |
| 2 or 3 Rooms | 0 (0.0%) | 13 (40.6%) |
| 4 or 5 Rooms | 25 (31.7%) | 15 (46.9%) |
| 6 or 7 Rooms | 35 (44.3%) | 4 (12.5%) |
| 8 or more Rooms | 19 (24.0%) | 0 (0.0%) |
| Total | 79 (100.0%) | 32 (100.0%) |
Housing Structure by Heating Type in Morganton
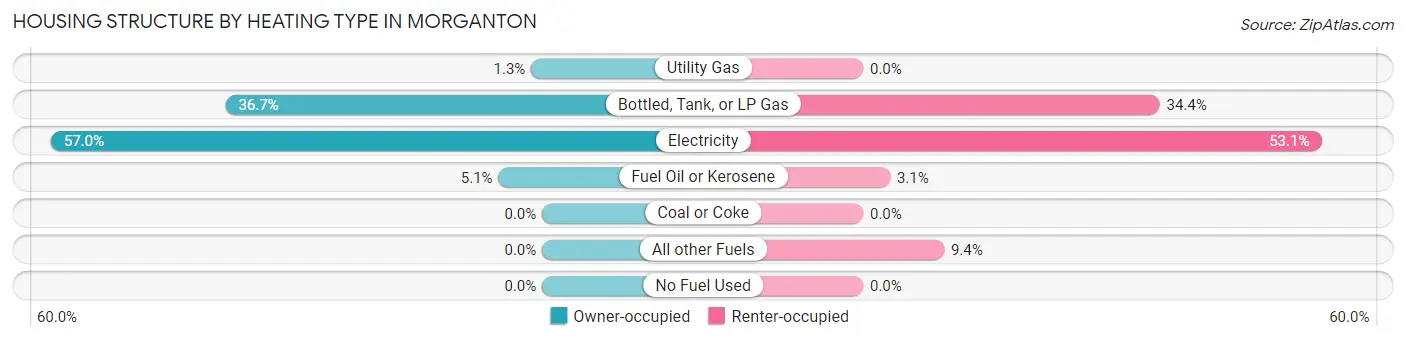
| Heating Type | Owner-occupied | Renter-occupied |
| Utility Gas | 1 (1.3%) | 0 (0.0%) |
| Bottled, Tank, or LP Gas | 29 (36.7%) | 11 (34.4%) |
| Electricity | 45 (57.0%) | 17 (53.1%) |
| Fuel Oil or Kerosene | 4 (5.1%) | 1 (3.1%) |
| Coal or Coke | 0 (0.0%) | 0 (0.0%) |
| All other Fuels | 0 (0.0%) | 3 (9.4%) |
| No Fuel Used | 0 (0.0%) | 0 (0.0%) |
| Total | 79 (100.0%) | 32 (100.0%) |
Household Vehicle Usage in Morganton
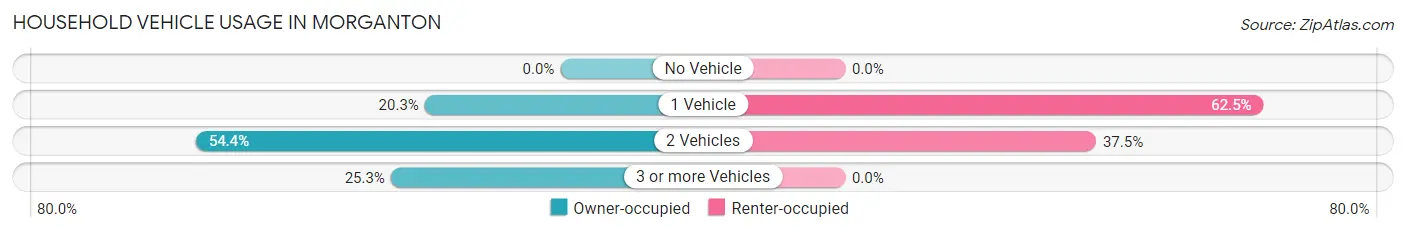
| Vehicles per Household | Owner-occupied | Renter-occupied |
| No Vehicle | 0 (0.0%) | 0 (0.0%) |
| 1 Vehicle | 16 (20.3%) | 20 (62.5%) |
| 2 Vehicles | 43 (54.4%) | 12 (37.5%) |
| 3 or more Vehicles | 20 (25.3%) | 0 (0.0%) |
| Total | 79 (100.0%) | 32 (100.0%) |
Real Estate & Mortgages in Morganton
Real Estate and Mortgage Overview in Morganton
| Characteristic | Without Mortgage | With Mortgage |
| Housing Units | 26 | 53 |
| Median Property Value | $116,100 | $231,900 |
| Median Household Income | $33,214 | $18 |
| Monthly Housing Costs | $450 | $0 |
| Real Estate Taxes | $514 | $0 |
Property Value by Mortgage Status in Morganton
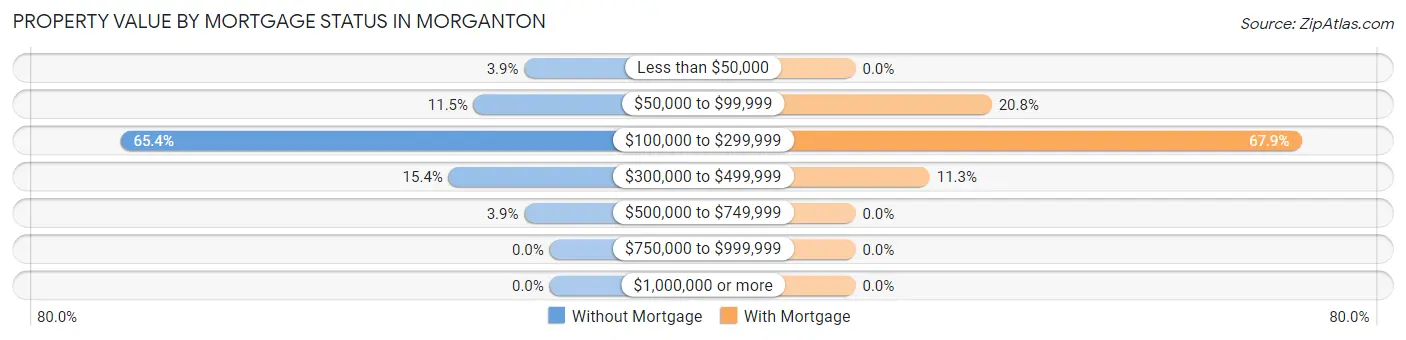
| Property Value | Without Mortgage | With Mortgage |
| Less than $50,000 | 1 (3.8%) | 0 (0.0%) |
| $50,000 to $99,999 | 3 (11.5%) | 11 (20.7%) |
| $100,000 to $299,999 | 17 (65.4%) | 36 (67.9%) |
| $300,000 to $499,999 | 4 (15.4%) | 6 (11.3%) |
| $500,000 to $749,999 | 1 (3.8%) | 0 (0.0%) |
| $750,000 to $999,999 | 0 (0.0%) | 0 (0.0%) |
| $1,000,000 or more | 0 (0.0%) | 0 (0.0%) |
| Total | 26 (100.0%) | 53 (100.0%) |
Household Income by Mortgage Status in Morganton
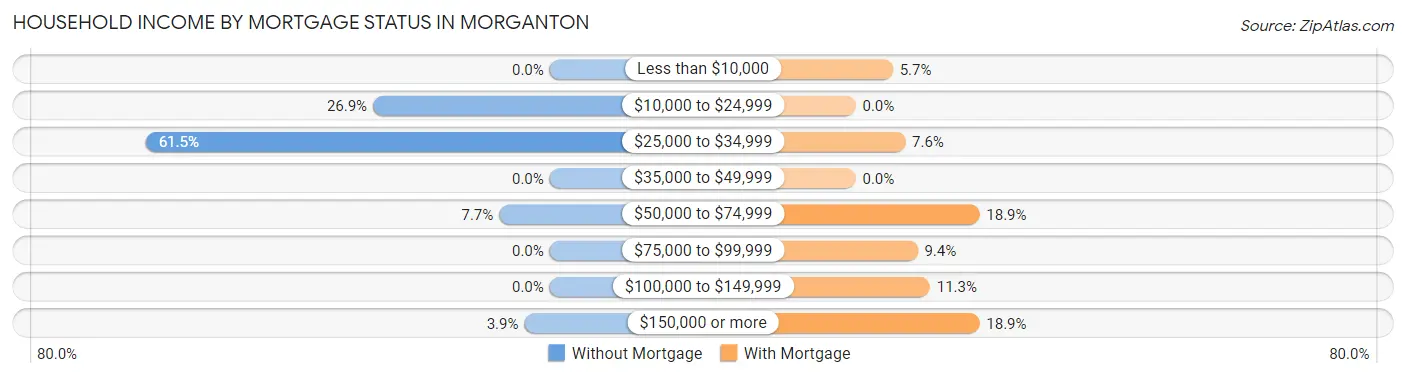
| Household Income | Without Mortgage | With Mortgage |
| Less than $10,000 | 0 (0.0%) | 3 (5.7%) |
| $10,000 to $24,999 | 7 (26.9%) | 0 (0.0%) |
| $25,000 to $34,999 | 16 (61.5%) | 4 (7.5%) |
| $35,000 to $49,999 | 0 (0.0%) | 0 (0.0%) |
| $50,000 to $74,999 | 2 (7.7%) | 10 (18.9%) |
| $75,000 to $99,999 | 0 (0.0%) | 5 (9.4%) |
| $100,000 to $149,999 | 0 (0.0%) | 6 (11.3%) |
| $150,000 or more | 1 (3.8%) | 10 (18.9%) |
| Total | 26 (100.0%) | 53 (100.0%) |
Property Value to Household Income Ratio in Morganton
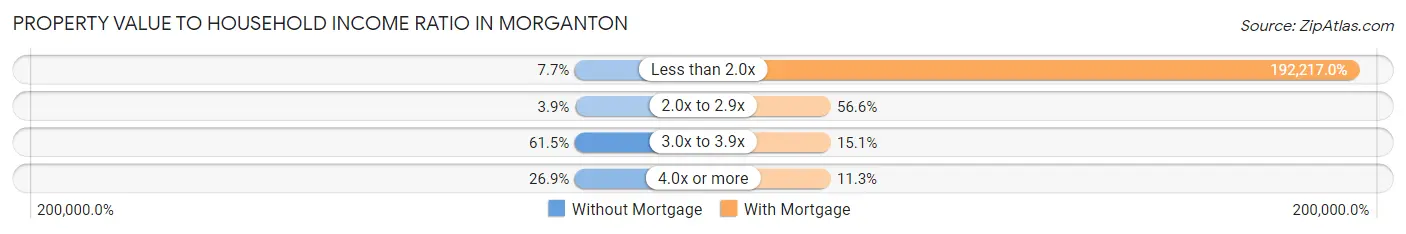
| Value-to-Income Ratio | Without Mortgage | With Mortgage |
| Less than 2.0x | 2 (7.7%) | 101,875 (192,217.0%) |
| 2.0x to 2.9x | 1 (3.8%) | 30 (56.6%) |
| 3.0x to 3.9x | 16 (61.5%) | 8 (15.1%) |
| 4.0x or more | 7 (26.9%) | 6 (11.3%) |
| Total | 26 (100.0%) | 53 (100.0%) |
Real Estate Taxes by Mortgage Status in Morganton
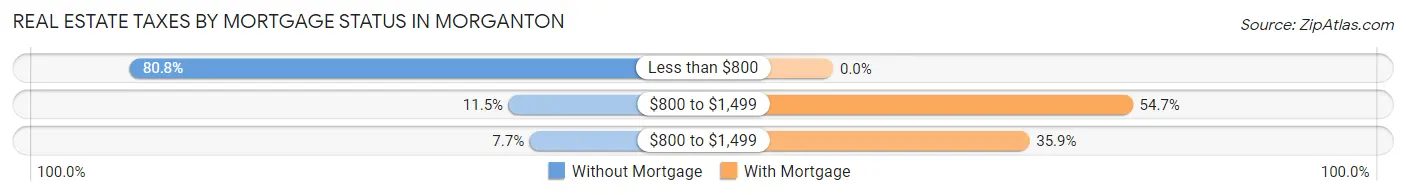
| Property Taxes | Without Mortgage | With Mortgage |
| Less than $800 | 21 (80.8%) | 0 (0.0%) |
| $800 to $1,499 | 3 (11.5%) | 29 (54.7%) |
| $800 to $1,499 | 2 (7.7%) | 19 (35.8%) |
| Total | 26 (100.0%) | 53 (100.0%) |
Health & Disability in Morganton
Health Insurance Coverage by Age in Morganton
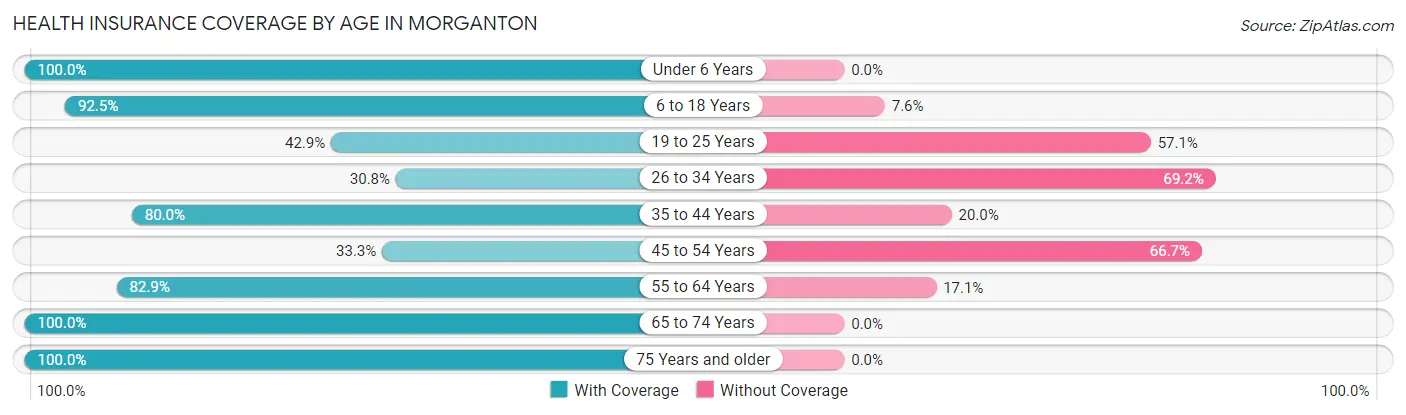
| Age Bracket | With Coverage | Without Coverage |
| Under 6 Years | 3 (100.0%) | 0 (0.0%) |
| 6 to 18 Years | 49 (92.4%) | 4 (7.5%) |
| 19 to 25 Years | 9 (42.9%) | 12 (57.1%) |
| 26 to 34 Years | 8 (30.8%) | 18 (69.2%) |
| 35 to 44 Years | 36 (80.0%) | 9 (20.0%) |
| 45 to 54 Years | 18 (33.3%) | 36 (66.7%) |
| 55 to 64 Years | 29 (82.9%) | 6 (17.1%) |
| 65 to 74 Years | 33 (100.0%) | 0 (0.0%) |
| 75 Years and older | 18 (100.0%) | 0 (0.0%) |
| Total | 203 (70.5%) | 85 (29.5%) |
Health Insurance Coverage by Citizenship Status in Morganton
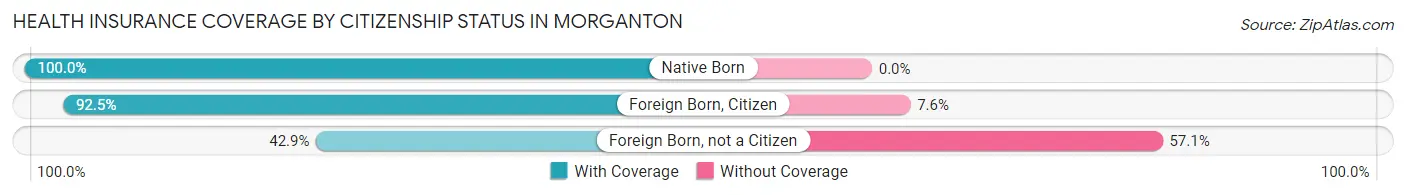
| Citizenship Status | With Coverage | Without Coverage |
| Native Born | 3 (100.0%) | 0 (0.0%) |
| Foreign Born, Citizen | 49 (92.4%) | 4 (7.5%) |
| Foreign Born, not a Citizen | 9 (42.9%) | 12 (57.1%) |
Health Insurance Coverage by Household Income in Morganton
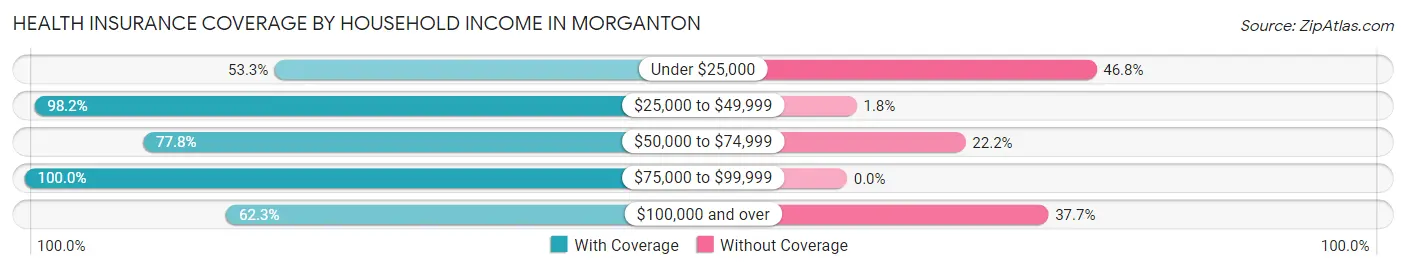
| Household Income | With Coverage | Without Coverage |
| Under $25,000 | 41 (53.2%) | 36 (46.8%) |
| $25,000 to $49,999 | 54 (98.2%) | 1 (1.8%) |
| $50,000 to $74,999 | 28 (77.8%) | 8 (22.2%) |
| $75,000 to $99,999 | 14 (100.0%) | 0 (0.0%) |
| $100,000 and over | 66 (62.3%) | 40 (37.7%) |
Public vs Private Health Insurance Coverage by Age in Morganton
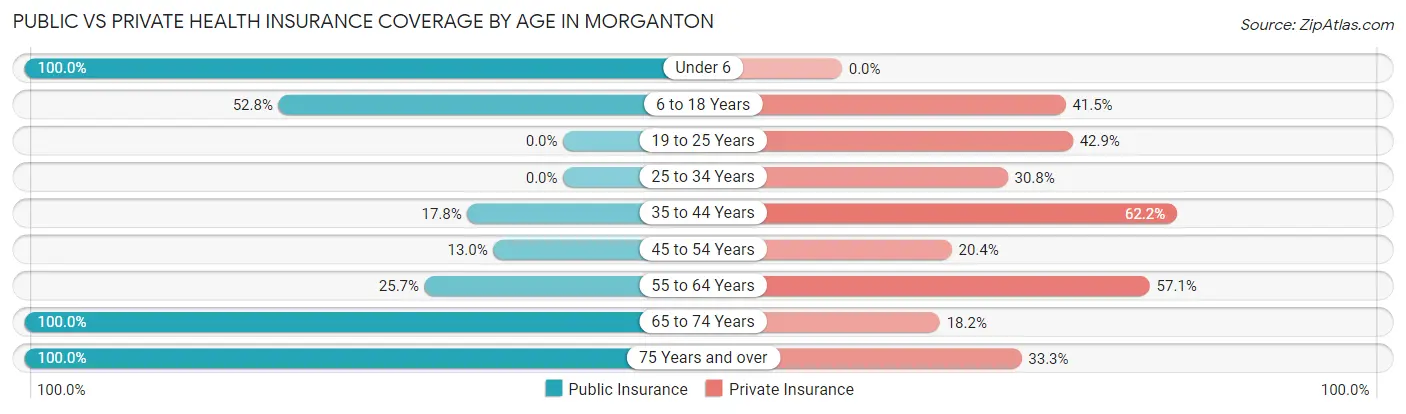
| Age Bracket | Public Insurance | Private Insurance |
| Under 6 | 3 (100.0%) | 0 (0.0%) |
| 6 to 18 Years | 28 (52.8%) | 22 (41.5%) |
| 19 to 25 Years | 0 (0.0%) | 9 (42.9%) |
| 25 to 34 Years | 0 (0.0%) | 8 (30.8%) |
| 35 to 44 Years | 8 (17.8%) | 28 (62.2%) |
| 45 to 54 Years | 7 (13.0%) | 11 (20.4%) |
| 55 to 64 Years | 9 (25.7%) | 20 (57.1%) |
| 65 to 74 Years | 33 (100.0%) | 6 (18.2%) |
| 75 Years and over | 18 (100.0%) | 6 (33.3%) |
| Total | 106 (36.8%) | 110 (38.2%) |
Disability Status by Sex by Age in Morganton
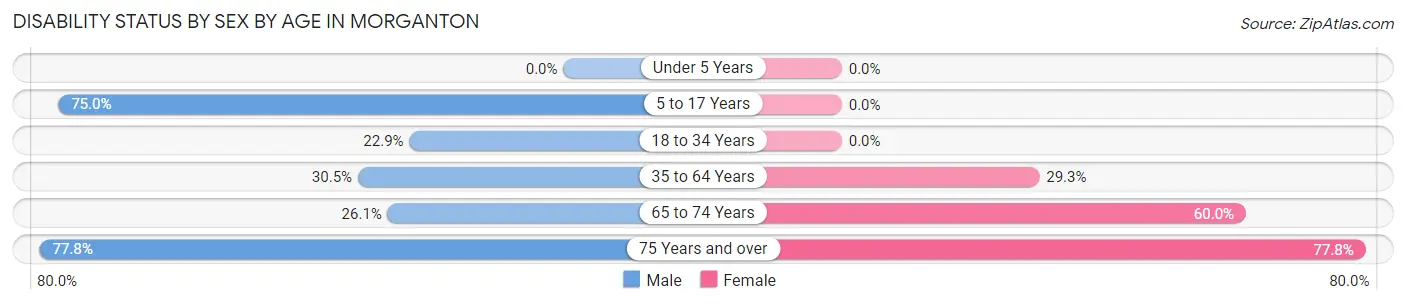
| Age Bracket | Male | Female |
| Under 5 Years | 0 (0.0%) | 0 (0.0%) |
| 5 to 17 Years | 18 (75.0%) | 0 (0.0%) |
| 18 to 34 Years | 8 (22.9%) | 0 (0.0%) |
| 35 to 64 Years | 18 (30.5%) | 22 (29.3%) |
| 65 to 74 Years | 6 (26.1%) | 6 (60.0%) |
| 75 Years and over | 7 (77.8%) | 7 (77.8%) |
Disability Class by Sex by Age in Morganton
Disability Class: Hearing Difficulty
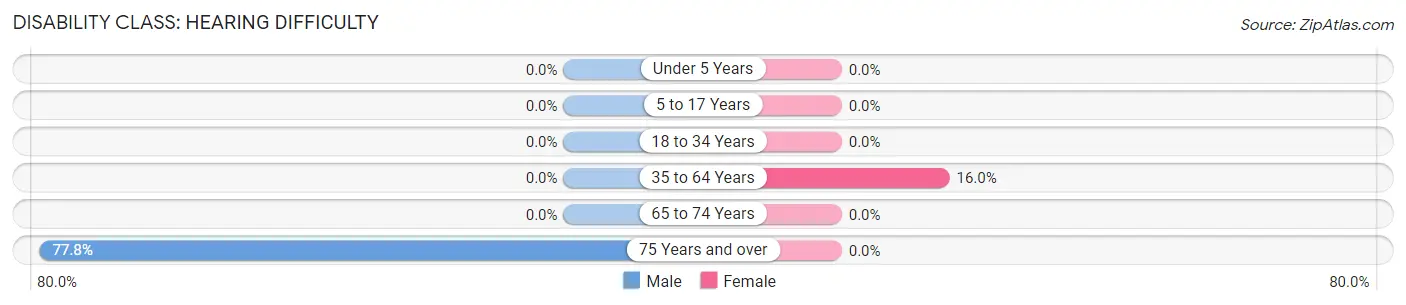
| Age Bracket | Male | Female |
| Under 5 Years | 0 (0.0%) | 0 (0.0%) |
| 5 to 17 Years | 0 (0.0%) | 0 (0.0%) |
| 18 to 34 Years | 0 (0.0%) | 0 (0.0%) |
| 35 to 64 Years | 0 (0.0%) | 12 (16.0%) |
| 65 to 74 Years | 0 (0.0%) | 0 (0.0%) |
| 75 Years and over | 7 (77.8%) | 0 (0.0%) |
Disability Class: Vision Difficulty
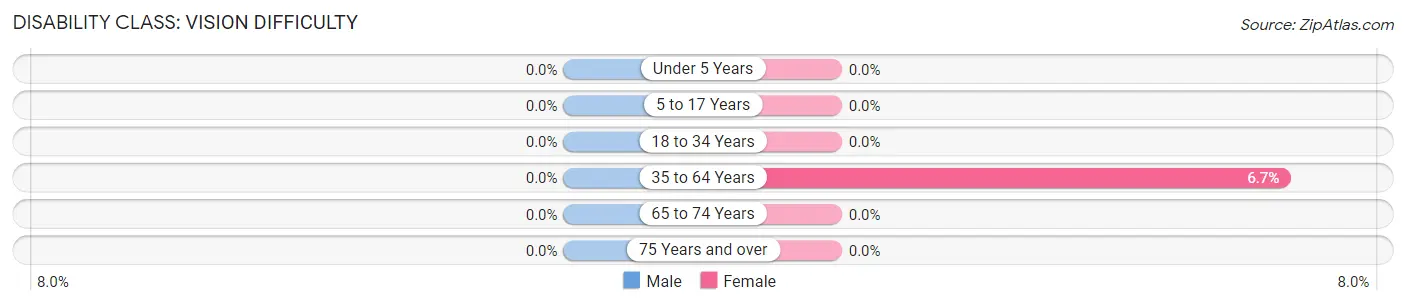
| Age Bracket | Male | Female |
| Under 5 Years | 0 (0.0%) | 0 (0.0%) |
| 5 to 17 Years | 0 (0.0%) | 0 (0.0%) |
| 18 to 34 Years | 0 (0.0%) | 0 (0.0%) |
| 35 to 64 Years | 0 (0.0%) | 5 (6.7%) |
| 65 to 74 Years | 0 (0.0%) | 0 (0.0%) |
| 75 Years and over | 0 (0.0%) | 0 (0.0%) |
Disability Class: Cognitive Difficulty
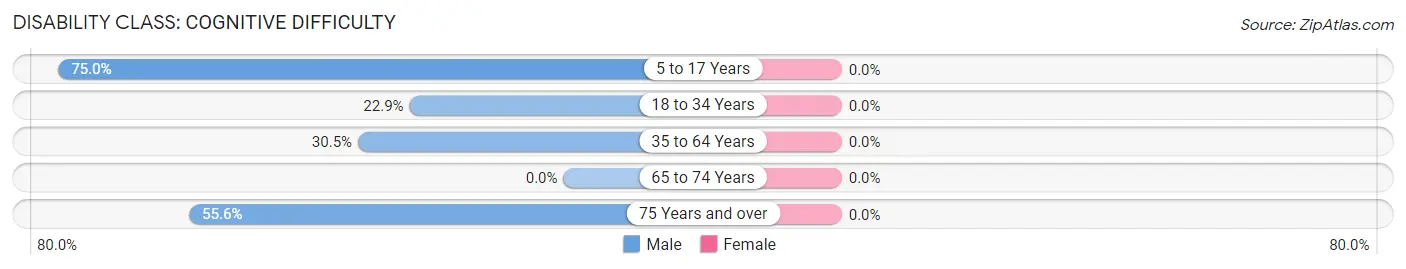
| Age Bracket | Male | Female |
| 5 to 17 Years | 18 (75.0%) | 0 (0.0%) |
| 18 to 34 Years | 8 (22.9%) | 0 (0.0%) |
| 35 to 64 Years | 18 (30.5%) | 0 (0.0%) |
| 65 to 74 Years | 0 (0.0%) | 0 (0.0%) |
| 75 Years and over | 5 (55.6%) | 0 (0.0%) |
Disability Class: Ambulatory Difficulty
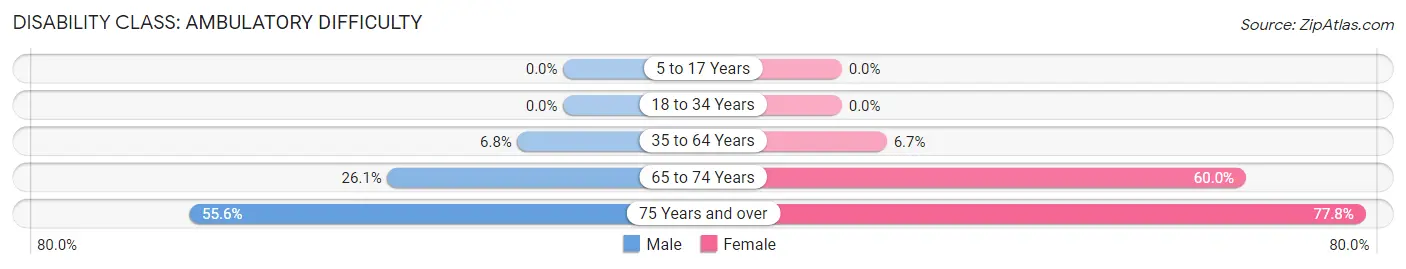
| Age Bracket | Male | Female |
| 5 to 17 Years | 0 (0.0%) | 0 (0.0%) |
| 18 to 34 Years | 0 (0.0%) | 0 (0.0%) |
| 35 to 64 Years | 4 (6.8%) | 5 (6.7%) |
| 65 to 74 Years | 6 (26.1%) | 6 (60.0%) |
| 75 Years and over | 5 (55.6%) | 7 (77.8%) |
Disability Class: Self-Care Difficulty
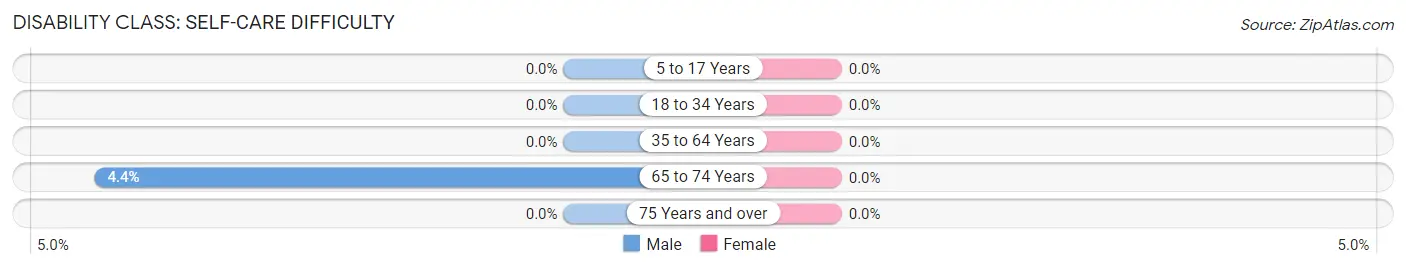
| Age Bracket | Male | Female |
| 5 to 17 Years | 0 (0.0%) | 0 (0.0%) |
| 18 to 34 Years | 0 (0.0%) | 0 (0.0%) |
| 35 to 64 Years | 0 (0.0%) | 0 (0.0%) |
| 65 to 74 Years | 1 (4.3%) | 0 (0.0%) |
| 75 Years and over | 0 (0.0%) | 0 (0.0%) |
Technology Access in Morganton
Computing Device Access in Morganton
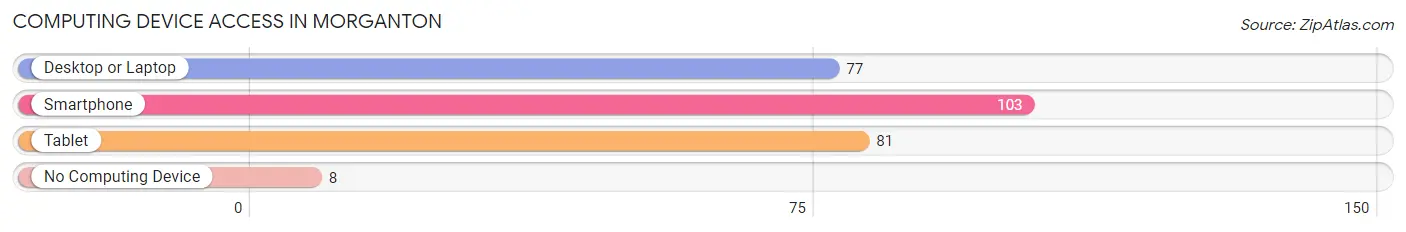
| Device Type | # Households | % Households |
| Desktop or Laptop | 77 | 69.4% |
| Smartphone | 103 | 92.8% |
| Tablet | 81 | 73.0% |
| No Computing Device | 8 | 7.2% |
| Total | 111 | 100.0% |
Internet Access in Morganton
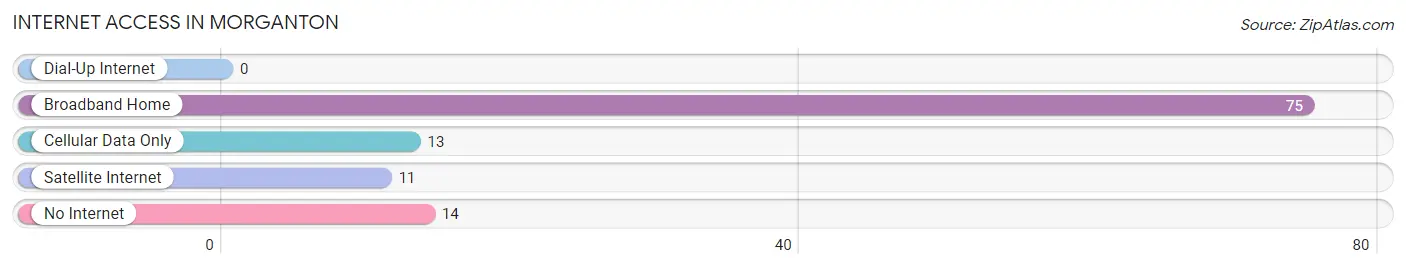
| Internet Type | # Households | % Households |
| Dial-Up Internet | 0 | 0.0% |
| Broadband Home | 75 | 67.6% |
| Cellular Data Only | 13 | 11.7% |
| Satellite Internet | 11 | 9.9% |
| No Internet | 14 | 12.6% |
| Total | 111 | 100.0% |
Morganton Summary
Morganton is a small city located in Fannin County, Georgia, United States. It is situated in the foothills of the Blue Ridge Mountains, about 90 miles north of Atlanta. The city has a population of approximately 1,500 people and is the county seat of Fannin County.
History
Morganton was founded in 1837 by a group of settlers from North Carolina. The town was named after the nearby Morganton Creek, which was named after a Revolutionary War hero, Colonel William Morganton. The town was originally a trading post and was the first county seat of Fannin County.
In the late 1800s, Morganton was a thriving agricultural center, with cotton, corn, and tobacco being the main crops. The town also had a number of sawmills and gristmills, as well as a number of stores and businesses.
In the early 1900s, the town began to decline as the railroad bypassed it and the population began to move away. The town was revitalized in the 1950s when the Georgia Power Company built a hydroelectric dam on the nearby Toccoa River. This provided the town with a reliable source of electricity and helped to attract new businesses and industry to the area.
Geography
Morganton is located in the foothills of the Blue Ridge Mountains in northern Georgia. The city is situated at the confluence of the Toccoa and Morganton Creeks, which form the Toccoa River. The city is surrounded by the Chattahoochee National Forest and is located about 90 miles north of Atlanta.
The city has a total area of 2.2 square miles, all of which is land. The city has a humid subtropical climate, with hot, humid summers and mild winters.
Economy
Morganton’s economy is largely based on agriculture and tourism. The city is home to a number of farms, which produce a variety of crops, including corn, cotton, and tobacco. The city is also home to a number of small businesses, including restaurants, retail stores, and service providers.
The city is also a popular tourist destination, with visitors coming to enjoy the nearby mountains and rivers. The city is home to a number of outdoor recreation activities, including fishing, camping, and hiking.
Demographics
As of the 2010 census, the city had a population of 1,500 people. The racial makeup of the city was 95.3% White, 0.7% African American, 0.3% Native American, 0.7% Asian, 0.3% from other races, and 2.7% from two or more races. Hispanic or Latino of any race were 1.3% of the population.
The median income for a household in the city was $30,000, and the median income for a family was $35,000. The per capita income for the city was $17,000. About 17.5% of families and 20.3% of the population were below the poverty line, including 28.3% of those under age 18 and 11.3% of those age 65 or over.
Common Questions
What is the Total Population of Morganton?
Total Population of Morganton is 288.
What is the Total Male Population of Morganton?
Total Male Population of Morganton is 153.
What is the Total Female Population of Morganton?
Total Female Population of Morganton is 135.
What is the Ratio of Males per 100 Females in Morganton?
There are 113.33 Males per 100 Females in Morganton.
What is the Ratio of Females per 100 Males in Morganton?
There are 88.24 Females per 100 Males in Morganton.
What is the Median Population Age in Morganton?
Median Population Age in Morganton is 42.2 Years.
What is the Average Family Size in Morganton
Average Family Size in Morganton is 3.0 People.
What is the Average Household Size in Morganton
Average Household Size in Morganton is 2.6 People.
What is Per Capita Income in Morganton?
Per Capita income in Morganton is $31,254.
What is the Median Household income in Morganton?
Median Household Income in Morganton is $40,417.
What is Income or Wage Gap in Morganton?
Income or Wage Gap in Morganton is 75.5%.
Women in Morganton earn 24.5 cents for every dollar earned by a man.
What is Inequality or Gini Index in Morganton?
Inequality or Gini Index in Morganton is 0.51.
How Large is the Labor Force in Morganton?
There are 131 People in the Labor Forcein in Morganton.
What is the Percentage of People in the Labor Force in Morganton?
54.4% of People are in the Labor Force in Morganton.
What is the Unemployment Rate in Morganton?
Unemployment Rate in Morganton is 4.6%.