Carl, GA
Carl Map
Carl Overview
296
TOTAL POPULATION
138
MALE POPULATION
158
FEMALE POPULATION
87.34
MALES / 100 FEMALES
114.49
FEMALES / 100 MALES
47.8
MEDIAN AGE
2.9
AVG FAMILY SIZE
2.5
AVG HOUSEHOLD SIZE
$26,871
PER CAPITA INCOME
$57,917
AVG FAMILY INCOME
$55,982
AVG HOUSEHOLD INCOME
37.6%
WAGE / INCOME GAP [ % ]
62.4¢/ $1
WAGE / INCOME GAP [ $ ]
0.29
INEQUALITY / GINI INDEX
115
LABOR FORCE [ PEOPLE ]
42.8%
PERCENT IN LABOR FORCE
4.3%
UNEMPLOYMENT RATE
Carl Area Codes
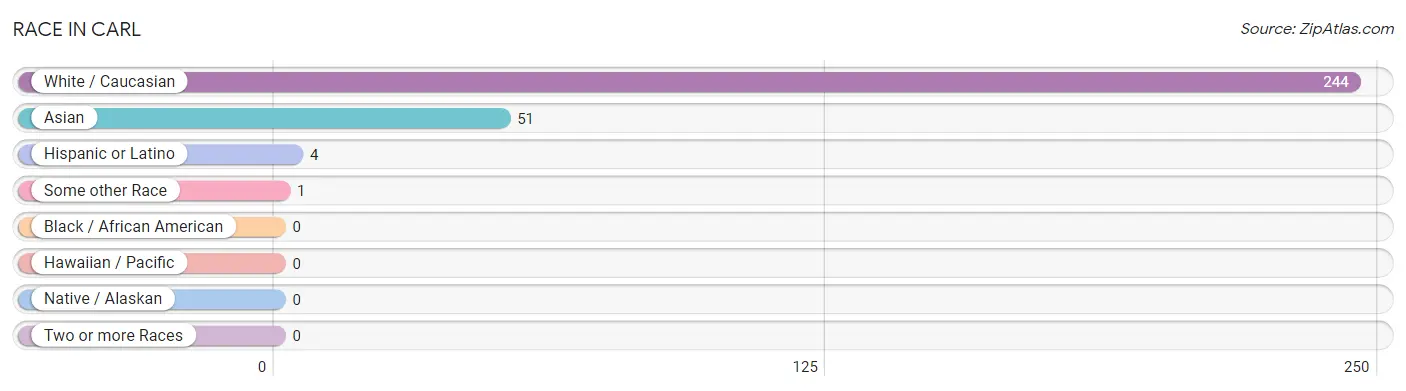
Race in Carl
The most populous races in Carl are White / Caucasian (244 | 82.4%), Asian (51 | 17.2%), and Hispanic or Latino (4 | 1.3%).
| Race | # Population | % Population |
| Asian | 51 | 17.2% |
| Black / African American | 0 | 0.0% |
| Hawaiian / Pacific | 0 | 0.0% |
| Hispanic or Latino | 4 | 1.3% |
| Native / Alaskan | 0 | 0.0% |
| White / Caucasian | 244 | 82.4% |
| Two or more Races | 0 | 0.0% |
| Some other Race | 1 | 0.3% |
| Total | 296 | 100.0% |
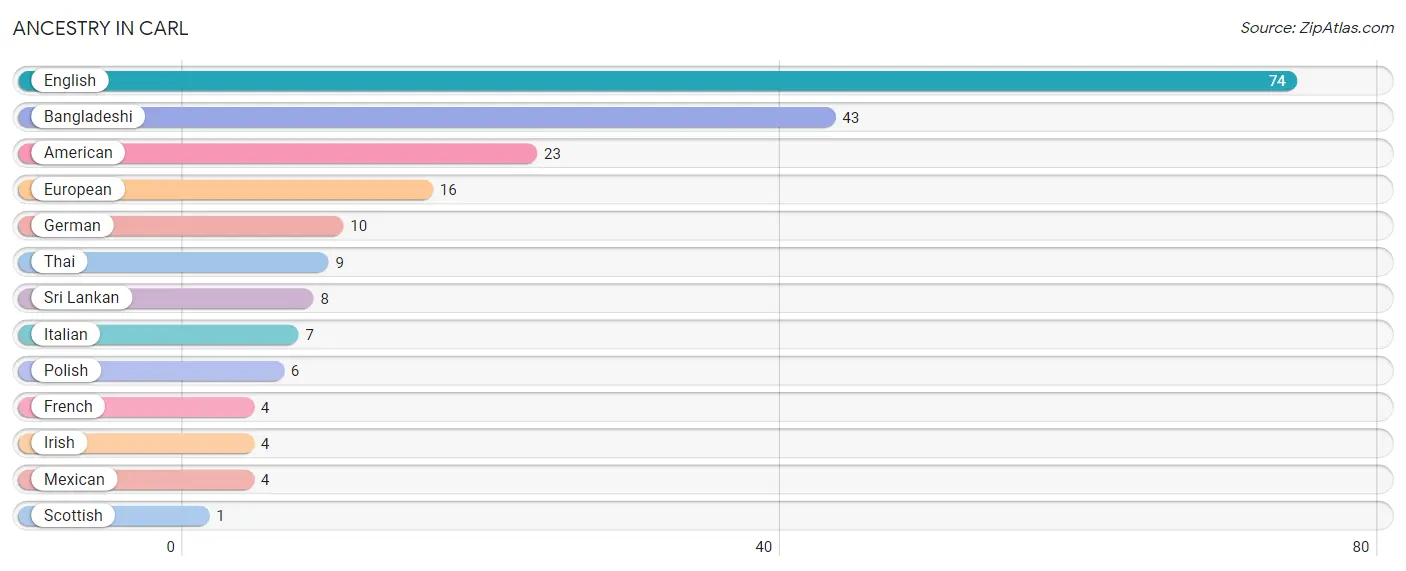
Ancestry in Carl
The most populous ancestries reported in Carl are English (74 | 25.0%), Bangladeshi (43 | 14.5%), American (23 | 7.8%), European (16 | 5.4%), and German (10 | 3.4%), together accounting for 56.1% of all Carl residents.
| Ancestry | # Population | % Population |
| American | 23 | 7.8% |
| Bangladeshi | 43 | 14.5% |
| English | 74 | 25.0% |
| European | 16 | 5.4% |
| French | 4 | 1.3% |
| German | 10 | 3.4% |
| Irish | 4 | 1.3% |
| Italian | 7 | 2.4% |
| Mexican | 4 | 1.3% |
| Polish | 6 | 2.0% |
| Scottish | 1 | 0.3% |
| Sri Lankan | 8 | 2.7% |
| Thai | 9 | 3.0% | View All 13 Rows |
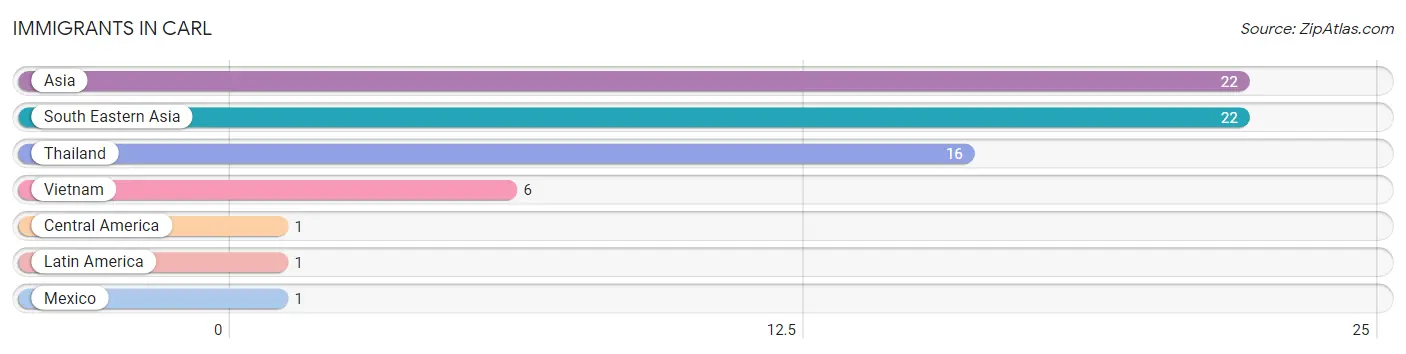
Immigrants in Carl
The most numerous immigrant groups reported in Carl came from Asia (22 | 7.4%), South Eastern Asia (22 | 7.4%), Thailand (16 | 5.4%), Vietnam (6 | 2.0%), and Central America (1 | 0.3%), together accounting for 22.6% of all Carl residents.
| Immigration Origin | # Population | % Population |
| Asia | 22 | 7.4% |
| Central America | 1 | 0.3% |
| Latin America | 1 | 0.3% |
| Mexico | 1 | 0.3% |
| South Eastern Asia | 22 | 7.4% |
| Thailand | 16 | 5.4% |
| Vietnam | 6 | 2.0% | View All 7 Rows |
Sex and Age in Carl
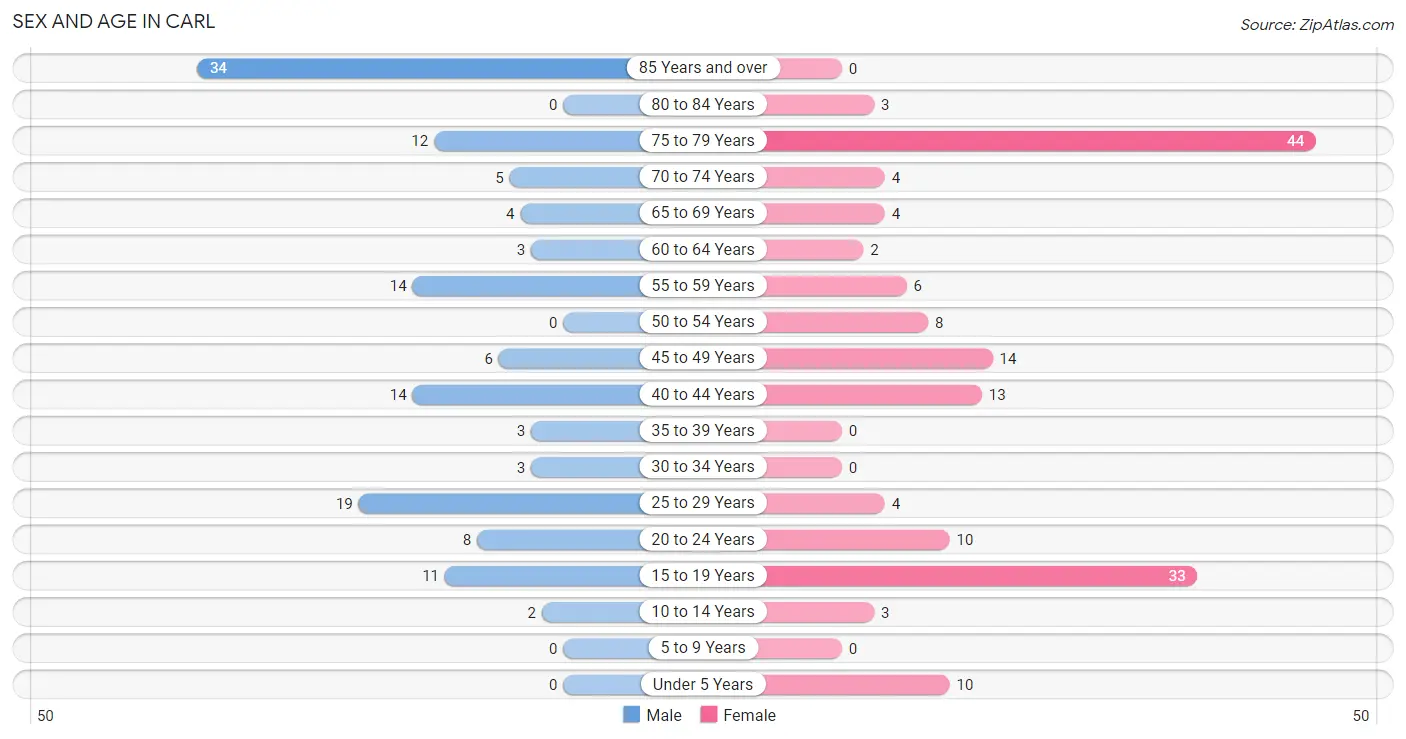
Sex and Age in Carl
The most populous age groups in Carl are 85 Years and over (34 | 24.6%) for men and 75 to 79 Years (44 | 27.9%) for women.
| Age Bracket | Male | Female |
| Under 5 Years | 0 (0.0%) | 10 (6.3%) |
| 5 to 9 Years | 0 (0.0%) | 0 (0.0%) |
| 10 to 14 Years | 2 (1.5%) | 3 (1.9%) |
| 15 to 19 Years | 11 (8.0%) | 33 (20.9%) |
| 20 to 24 Years | 8 (5.8%) | 10 (6.3%) |
| 25 to 29 Years | 19 (13.8%) | 4 (2.5%) |
| 30 to 34 Years | 3 (2.2%) | 0 (0.0%) |
| 35 to 39 Years | 3 (2.2%) | 0 (0.0%) |
| 40 to 44 Years | 14 (10.1%) | 13 (8.2%) |
| 45 to 49 Years | 6 (4.3%) | 14 (8.9%) |
| 50 to 54 Years | 0 (0.0%) | 8 (5.1%) |
| 55 to 59 Years | 14 (10.1%) | 6 (3.8%) |
| 60 to 64 Years | 3 (2.2%) | 2 (1.3%) |
| 65 to 69 Years | 4 (2.9%) | 4 (2.5%) |
| 70 to 74 Years | 5 (3.6%) | 4 (2.5%) |
| 75 to 79 Years | 12 (8.7%) | 44 (27.9%) |
| 80 to 84 Years | 0 (0.0%) | 3 (1.9%) |
| 85 Years and over | 34 (24.6%) | 0 (0.0%) |
| Total | 138 (100.0%) | 158 (100.0%) |
Families and Households in Carl
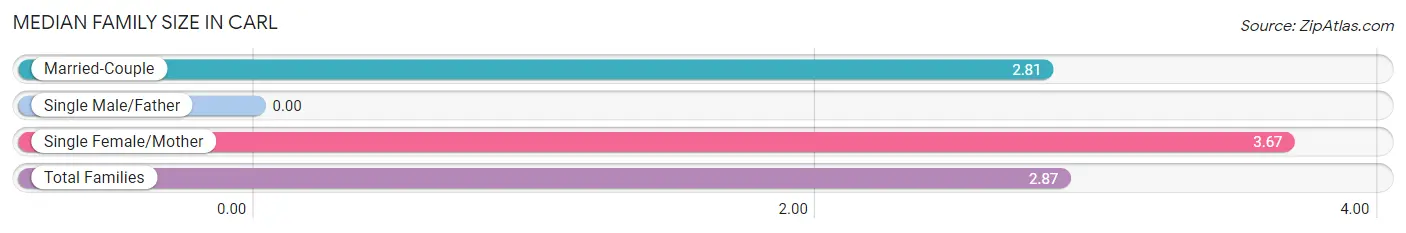
Median Family Size in Carl
| Family Type | # Families | Family Size |
| Married-Couple | 84 (93.3%) | 2.81 |
| Single Male/Father | 0 (0.0%) | - |
| Single Female/Mother | 6 (6.7%) | 3.67 |
| Total Families | 90 (100.0%) | 2.87 |
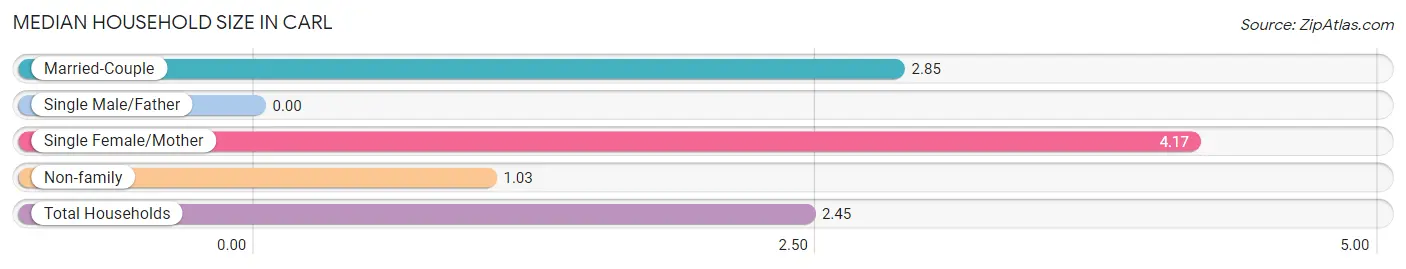
Median Household Size in Carl
| Household Type | # Households | Household Size |
| Married-Couple | 84 (69.4%) | 2.85 |
| Single Male/Father | 0 (0.0%) | - |
| Single Female/Mother | 6 (5.0%) | 4.17 |
| Non-family | 31 (25.6%) | 1.03 |
| Total Households | 121 (100.0%) | 2.45 |
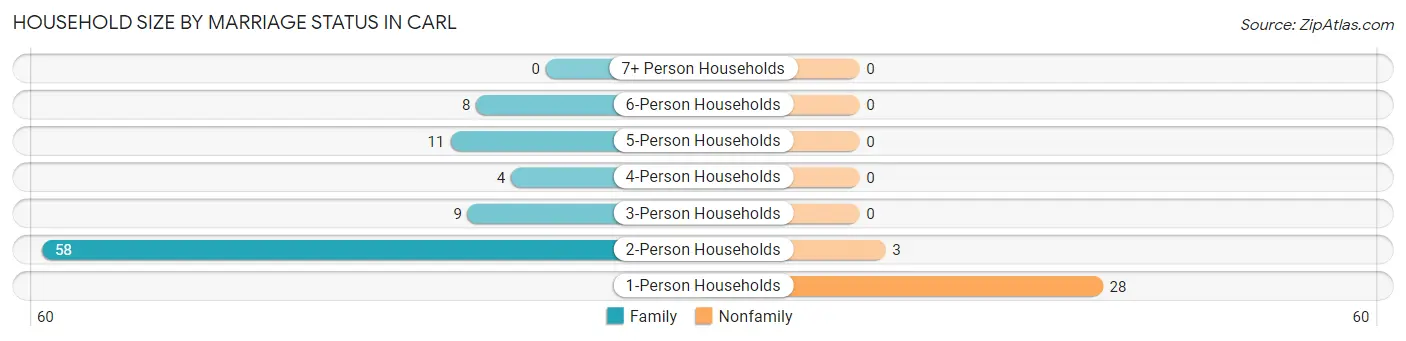
Household Size by Marriage Status in Carl
Out of a total of 121 households in Carl, 90 (74.4%) are family households, while 31 (25.6%) are nonfamily households. The most numerous type of family households are 2-person households, comprising 58, and the most common type of nonfamily households are 1-person households, comprising 28.
| Household Size | Family Households | Nonfamily Households |
| 1-Person Households | - | 28 (23.1%) |
| 2-Person Households | 58 (47.9%) | 3 (2.5%) |
| 3-Person Households | 9 (7.4%) | 0 (0.0%) |
| 4-Person Households | 4 (3.3%) | 0 (0.0%) |
| 5-Person Households | 11 (9.1%) | 0 (0.0%) |
| 6-Person Households | 8 (6.6%) | 0 (0.0%) |
| 7+ Person Households | 0 (0.0%) | 0 (0.0%) |
| Total | 90 (74.4%) | 31 (25.6%) |
Female Fertility in Carl
Fertility by Age in Carl
Average fertility rate in Carl is 130.0 births per 1,000 women. Women in the age bracket of 35 to 50 years have the highest fertility rate with 333.0 births per 1,000 women. Women in the age bracket of 35 to 50 years acount for 100.0% of all women with births.
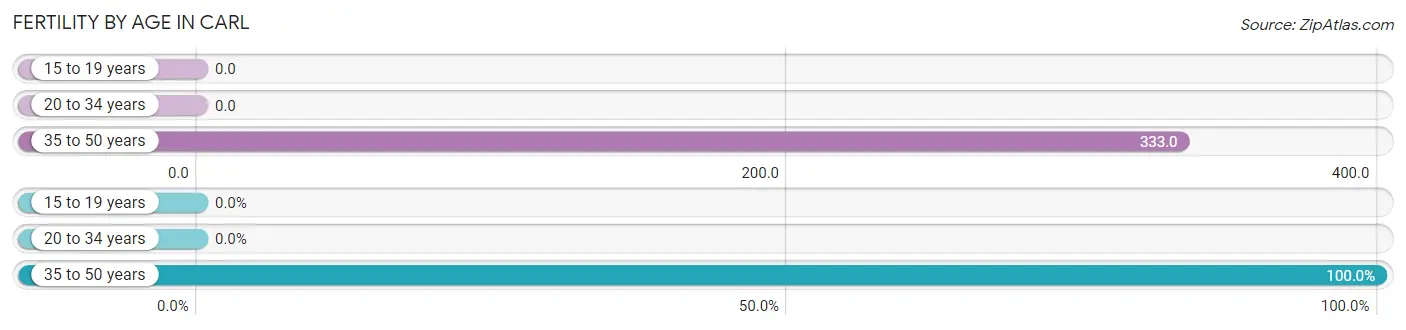
| Age Bracket | Women with Births | Births / 1,000 Women |
| 15 to 19 years | 0 (0.0%) | 0.0 |
| 20 to 34 years | 0 (0.0%) | 0.0 |
| 35 to 50 years | 10 (100.0%) | 333.0 |
| Total | 10 (100.0%) | 130.0 |
Fertility by Age by Marriage Status in Carl
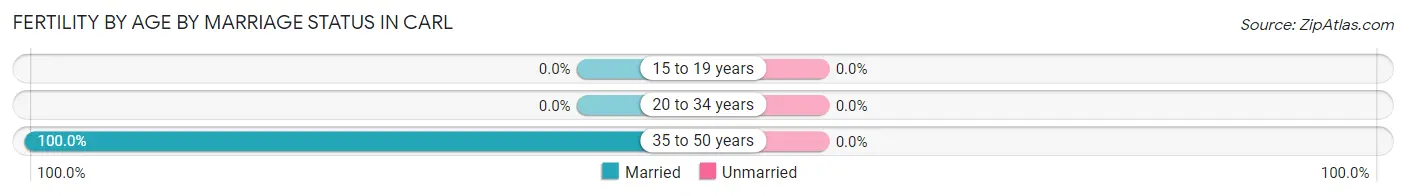
| Age Bracket | Married | Unmarried |
| 15 to 19 years | 0 (0.0%) | 0 (0.0%) |
| 20 to 34 years | 0 (0.0%) | 0 (0.0%) |
| 35 to 50 years | 10 (100.0%) | 0 (0.0%) |
| Total | 10 (100.0%) | 0 (0.0%) |
Fertility by Education in Carl
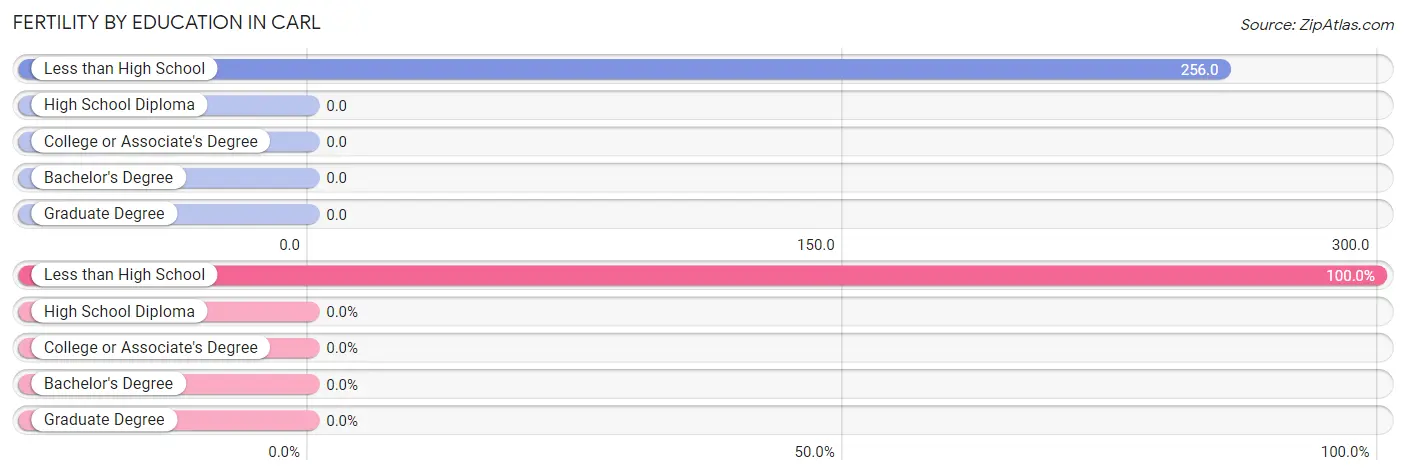
| Educational Attainment | Women with Births | Births / 1,000 Women |
| Less than High School | 10 (100.0%) | 256.0 |
| High School Diploma | 0 (0.0%) | 0.0 |
| College or Associate's Degree | 0 (0.0%) | 0.0 |
| Bachelor's Degree | 0 (0.0%) | 0.0 |
| Graduate Degree | 0 (0.0%) | 0.0 |
| Total | 10 (100.0%) | 130.0 |
Fertility by Education by Marriage Status in Carl
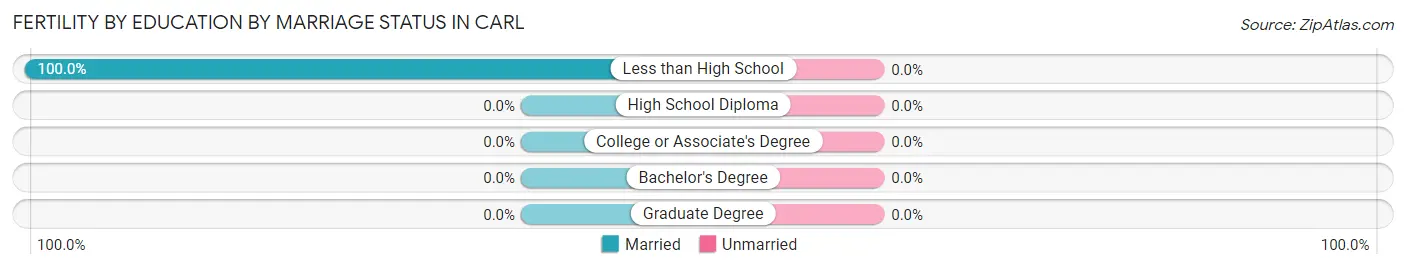
| Educational Attainment | Married | Unmarried |
| Less than High School | 10 (100.0%) | 0 (0.0%) |
| High School Diploma | 0 (0.0%) | 0 (0.0%) |
| College or Associate's Degree | 0 (0.0%) | 0 (0.0%) |
| Bachelor's Degree | 0 (0.0%) | 0 (0.0%) |
| Graduate Degree | 0 (0.0%) | 0 (0.0%) |
| Total | 10 (100.0%) | 0 (0.0%) |
Income in Carl
Income Overview in Carl
Per Capita Income in Carl is $26,871, while median incomes of families and households are $57,917 and $55,982 respectively.
| Characteristic | Number | Measure |
| Per Capita Income | 296 | $26,871 |
| Median Family Income | 90 | $57,917 |
| Mean Family Income | 90 | $61,787 |
| Median Household Income | 121 | $55,982 |
| Mean Household Income | 121 | $65,288 |
| Income Deficit | 90 | $0 |
| Wage / Income Gap (%) | 296 | 37.63% |
| Wage / Income Gap ($) | 296 | 62.37¢ per $1 |
| Gini / Inequality Index | 296 | 0.29 |
Earnings by Sex in Carl
Average Earnings in Carl are $31,875, $42,375 for men and $26,429 for women, a difference of 37.6%.
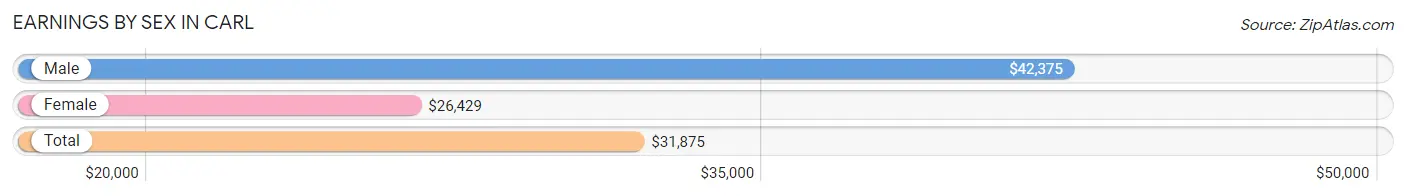
| Sex | Number | Average Earnings |
| Male | 69 (59.0%) | $42,375 |
| Female | 48 (41.0%) | $26,429 |
| Total | 117 (100.0%) | $31,875 |
Earnings by Sex by Income Bracket in Carl
The most common earnings brackets in Carl are $55,000 to $64,999 for men (18 | 26.1%) and $25,000 to $29,999 for women (14 | 29.2%).
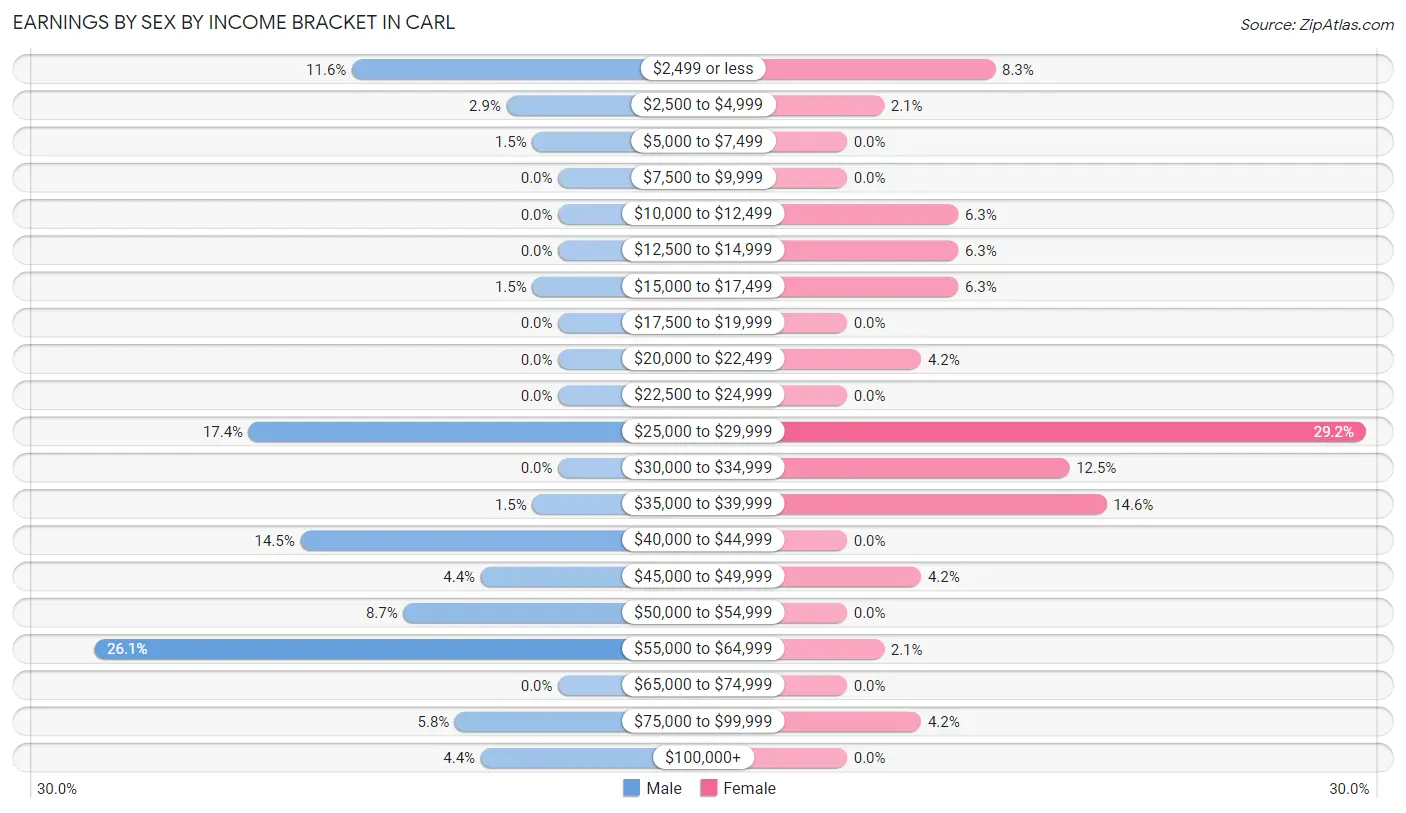
| Income | Male | Female |
| $2,499 or less | 8 (11.6%) | 4 (8.3%) |
| $2,500 to $4,999 | 2 (2.9%) | 1 (2.1%) |
| $5,000 to $7,499 | 1 (1.5%) | 0 (0.0%) |
| $7,500 to $9,999 | 0 (0.0%) | 0 (0.0%) |
| $10,000 to $12,499 | 0 (0.0%) | 3 (6.2%) |
| $12,500 to $14,999 | 0 (0.0%) | 3 (6.2%) |
| $15,000 to $17,499 | 1 (1.5%) | 3 (6.2%) |
| $17,500 to $19,999 | 0 (0.0%) | 0 (0.0%) |
| $20,000 to $22,499 | 0 (0.0%) | 2 (4.2%) |
| $22,500 to $24,999 | 0 (0.0%) | 0 (0.0%) |
| $25,000 to $29,999 | 12 (17.4%) | 14 (29.2%) |
| $30,000 to $34,999 | 0 (0.0%) | 6 (12.5%) |
| $35,000 to $39,999 | 1 (1.5%) | 7 (14.6%) |
| $40,000 to $44,999 | 10 (14.5%) | 0 (0.0%) |
| $45,000 to $49,999 | 3 (4.3%) | 2 (4.2%) |
| $50,000 to $54,999 | 6 (8.7%) | 0 (0.0%) |
| $55,000 to $64,999 | 18 (26.1%) | 1 (2.1%) |
| $65,000 to $74,999 | 0 (0.0%) | 0 (0.0%) |
| $75,000 to $99,999 | 4 (5.8%) | 2 (4.2%) |
| $100,000+ | 3 (4.3%) | 0 (0.0%) |
| Total | 69 (100.0%) | 48 (100.0%) |
Earnings by Sex by Educational Attainment in Carl
Average earnings in Carl are $54,583 for men and $26,429 for women, a difference of 51.6%. Men with an educational attainment of college or associate's degree enjoy the highest average annual earnings of $55,385, while those with less than high school education earn the least with $41,250. Women with an educational attainment of college or associate's degree earn the most with the average annual earnings of $27,250, while those with high school diploma education have the smallest earnings of $25,972.
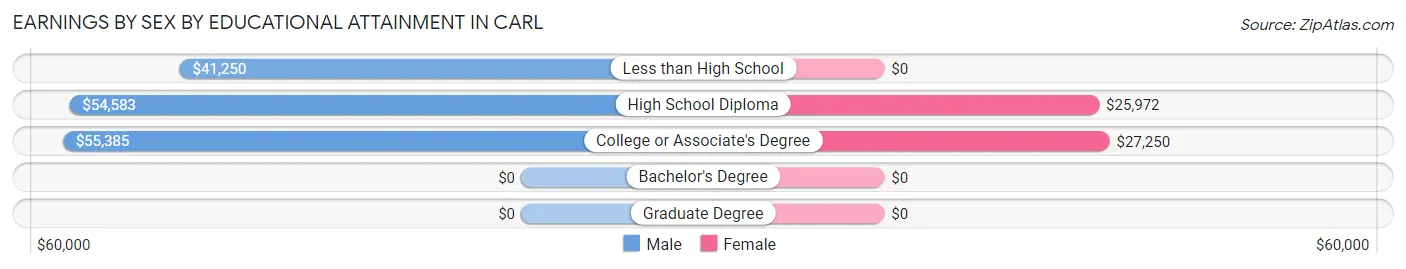
| Educational Attainment | Male Income | Female Income |
| Less than High School | $41,250 | $0 |
| High School Diploma | $54,583 | $25,972 |
| College or Associate's Degree | $55,385 | $27,250 |
| Bachelor's Degree | - | - |
| Graduate Degree | - | - |
| Total | $54,583 | $26,429 |
Family Income in Carl
Family Income Brackets in Carl
According to the Carl family income data, there are 35 families falling into the $35,000 to $49,999 income range, which is the most common income bracket and makes up 38.9% of all families.
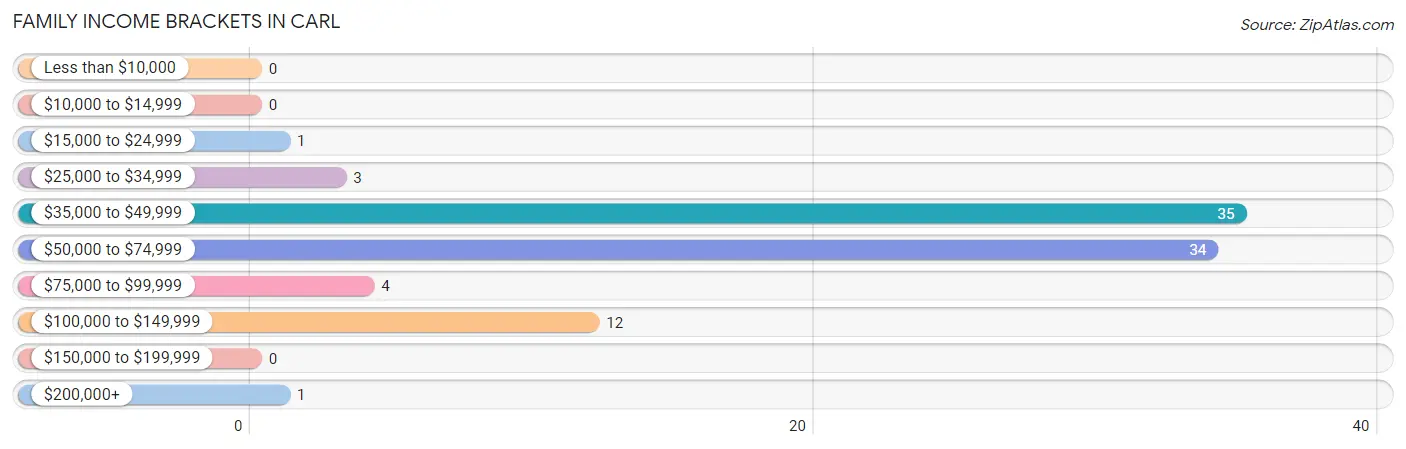
| Income Bracket | # Families | % Families |
| Less than $10,000 | 0 | 0.0% |
| $10,000 to $14,999 | 0 | 0.0% |
| $15,000 to $24,999 | 1 | 1.1% |
| $25,000 to $34,999 | 3 | 3.3% |
| $35,000 to $49,999 | 35 | 38.9% |
| $50,000 to $74,999 | 34 | 37.8% |
| $75,000 to $99,999 | 4 | 4.4% |
| $100,000 to $149,999 | 12 | 13.3% |
| $150,000 to $199,999 | 0 | 0.0% |
| $200,000+ | 1 | 1.1% |
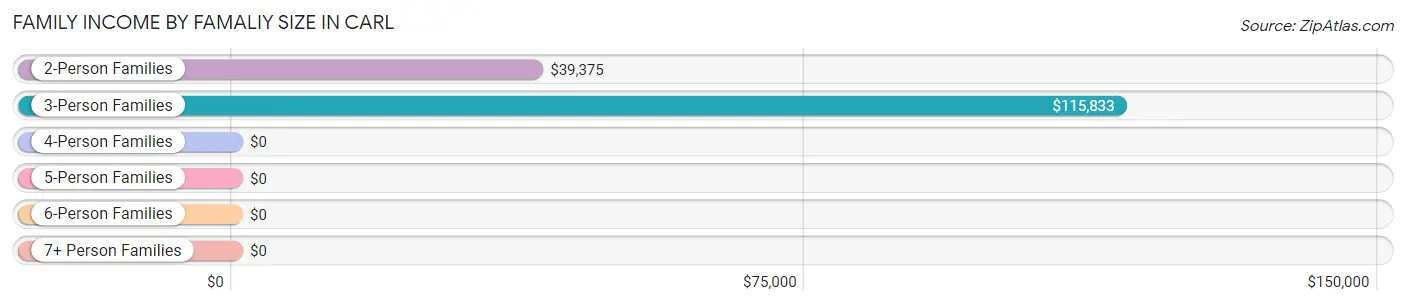
Family Income by Famaliy Size in Carl
3-person families (8 | 8.9%) account for the highest median family income in Carl with $115,833 per family, while 3-person families (8 | 8.9%) have the highest median income of $38,611 per family member.
| Income Bracket | # Families | Median Income |
| 2-Person Families | 59 (65.6%) | $39,375 |
| 3-Person Families | 8 (8.9%) | $115,833 |
| 4-Person Families | 6 (6.7%) | $0 |
| 5-Person Families | 9 (10.0%) | $0 |
| 6-Person Families | 8 (8.9%) | $0 |
| 7+ Person Families | 0 (0.0%) | $0 |
| Total | 90 (100.0%) | $57,917 |
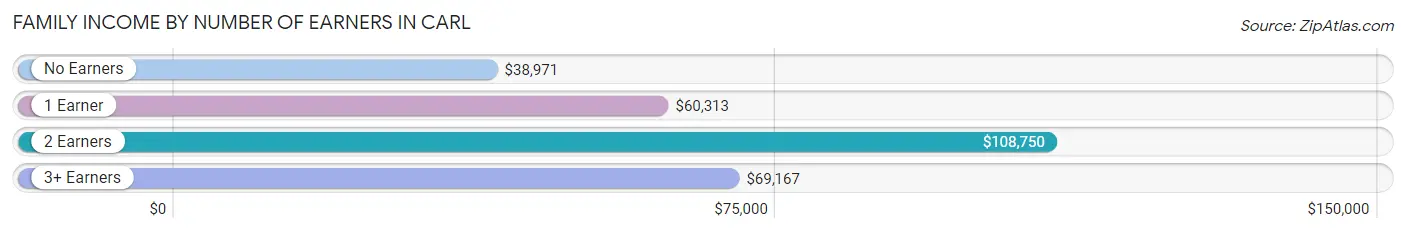
Family Income by Number of Earners in Carl
The median family income in Carl is $57,917, with families comprising 2 earners (16) having the highest median family income of $108,750, while families with no earners (44) have the lowest median family income of $38,971, accounting for 17.8% and 48.9% of families, respectively.
| Number of Earners | # Families | Median Income |
| No Earners | 44 (48.9%) | $38,971 |
| 1 Earner | 18 (20.0%) | $60,313 |
| 2 Earners | 16 (17.8%) | $108,750 |
| 3+ Earners | 12 (13.3%) | $69,167 |
| Total | 90 (100.0%) | $57,917 |
Household Income in Carl
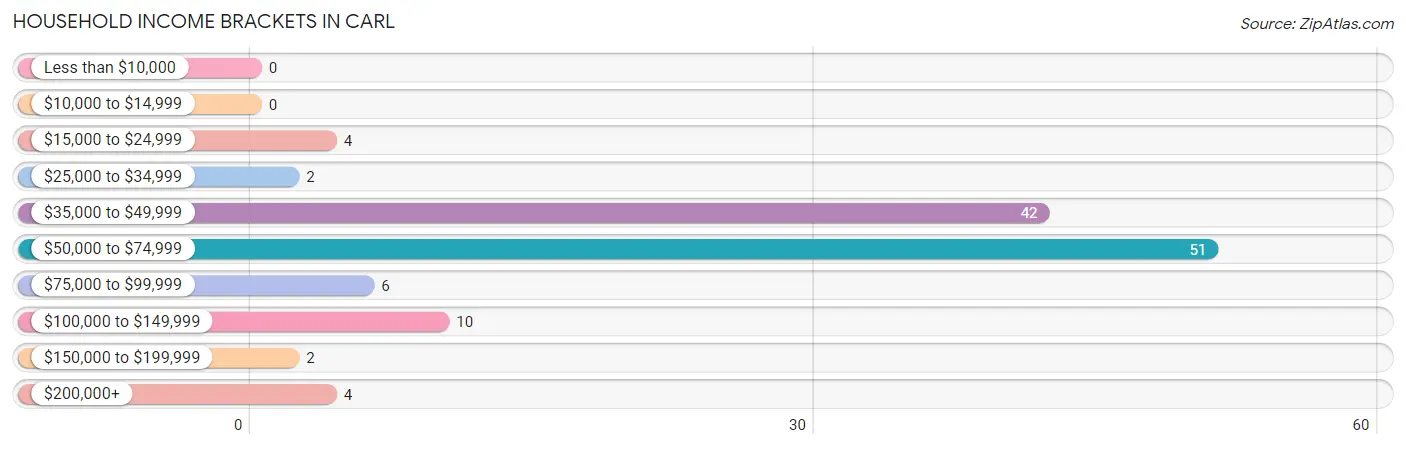
Household Income Brackets in Carl
With 51 households falling in the category, the $50,000 to $74,999 income range is the most frequent in Carl, accounting for 42.1% of all households.
| Income Bracket | # Households | % Households |
| Less than $10,000 | 0 | 0.0% |
| $10,000 to $14,999 | 0 | 0.0% |
| $15,000 to $24,999 | 4 | 3.3% |
| $25,000 to $34,999 | 2 | 1.7% |
| $35,000 to $49,999 | 42 | 34.7% |
| $50,000 to $74,999 | 51 | 42.1% |
| $75,000 to $99,999 | 6 | 5.0% |
| $100,000 to $149,999 | 10 | 8.3% |
| $150,000 to $199,999 | 2 | 1.7% |
| $200,000+ | 4 | 3.3% |
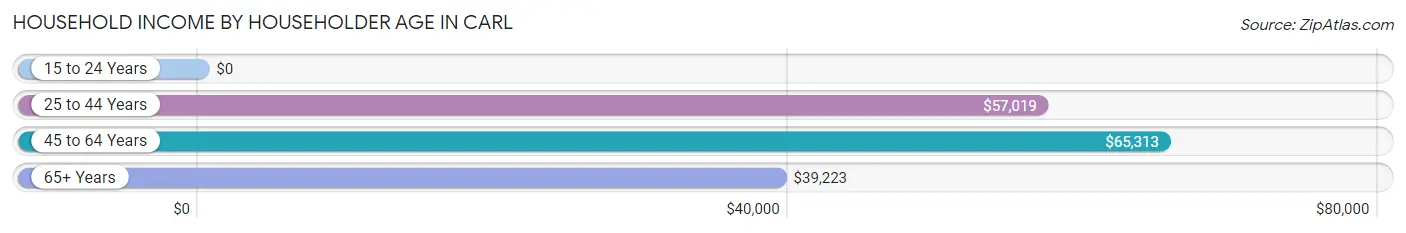
Household Income by Householder Age in Carl
The median household income in Carl is $55,982, with the highest median household income of $65,313 found in the 45 to 64 years age bracket for the primary householder. A total of 29 households (24.0%) fall into this category.
| Income Bracket | # Households | Median Income |
| 15 to 24 Years | 0 (0.0%) | $0 |
| 25 to 44 Years | 33 (27.3%) | $57,019 |
| 45 to 64 Years | 29 (24.0%) | $65,313 |
| 65+ Years | 59 (48.8%) | $39,223 |
| Total | 121 (100.0%) | $55,982 |
Poverty in Carl
Income Below Poverty by Sex and Age in Carl
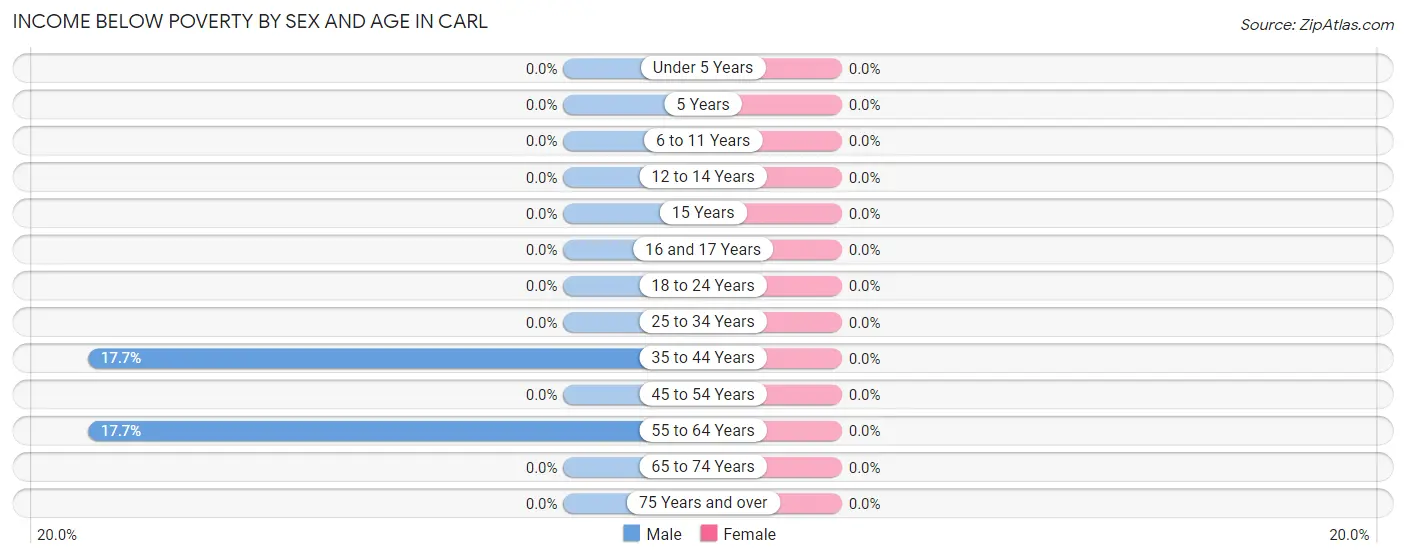
| Age Bracket | Male | Female |
| Under 5 Years | 0 (0.0%) | 0 (0.0%) |
| 5 Years | 0 (0.0%) | 0 (0.0%) |
| 6 to 11 Years | 0 (0.0%) | 0 (0.0%) |
| 12 to 14 Years | 0 (0.0%) | 0 (0.0%) |
| 15 Years | 0 (0.0%) | 0 (0.0%) |
| 16 and 17 Years | 0 (0.0%) | 0 (0.0%) |
| 18 to 24 Years | 0 (0.0%) | 0 (0.0%) |
| 25 to 34 Years | 0 (0.0%) | 0 (0.0%) |
| 35 to 44 Years | 3 (17.6%) | 0 (0.0%) |
| 45 to 54 Years | 0 (0.0%) | 0 (0.0%) |
| 55 to 64 Years | 3 (17.6%) | 0 (0.0%) |
| 65 to 74 Years | 0 (0.0%) | 0 (0.0%) |
| 75 Years and over | 0 (0.0%) | 0 (0.0%) |
| Total | 6 (4.3%) | 0 (0.0%) |
Income Above Poverty by Sex and Age in Carl
According to the poverty statistics in Carl, males aged 6 to 11 years and females aged under 5 years are the age groups that are most secure financially, with 100.0% of males and 100.0% of females in these age groups living above the poverty line.
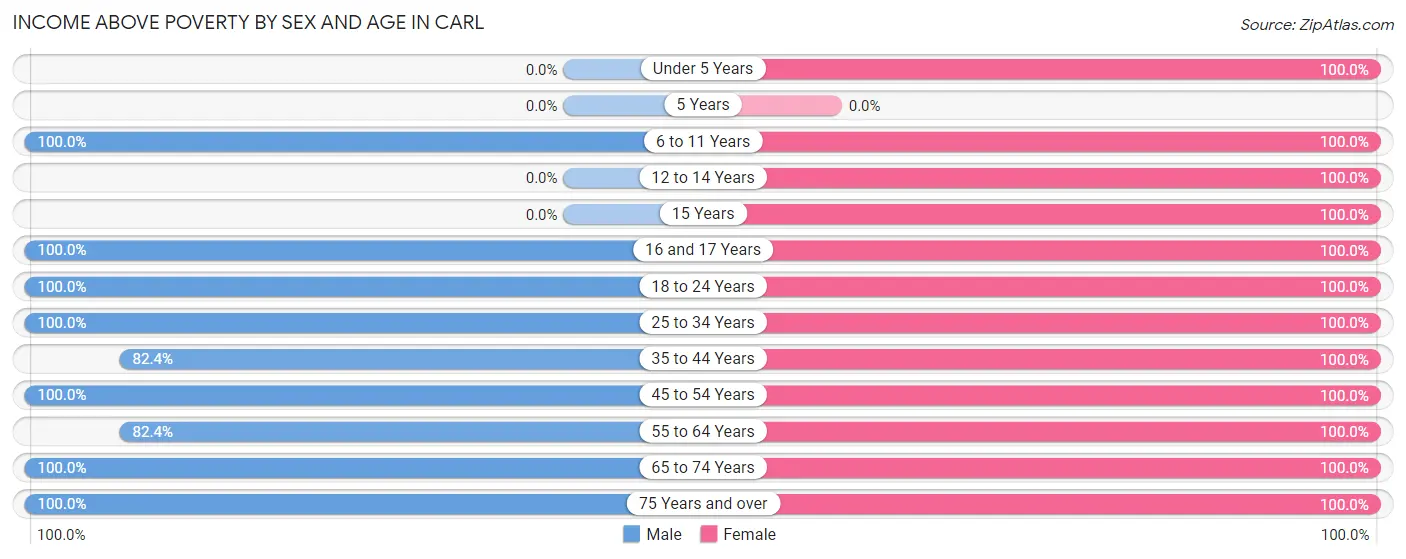
| Age Bracket | Male | Female |
| Under 5 Years | 0 (0.0%) | 10 (100.0%) |
| 5 Years | 0 (0.0%) | 0 (0.0%) |
| 6 to 11 Years | 2 (100.0%) | 1 (100.0%) |
| 12 to 14 Years | 0 (0.0%) | 2 (100.0%) |
| 15 Years | 0 (0.0%) | 12 (100.0%) |
| 16 and 17 Years | 2 (100.0%) | 17 (100.0%) |
| 18 to 24 Years | 17 (100.0%) | 14 (100.0%) |
| 25 to 34 Years | 22 (100.0%) | 4 (100.0%) |
| 35 to 44 Years | 14 (82.4%) | 13 (100.0%) |
| 45 to 54 Years | 6 (100.0%) | 22 (100.0%) |
| 55 to 64 Years | 14 (82.4%) | 8 (100.0%) |
| 65 to 74 Years | 9 (100.0%) | 8 (100.0%) |
| 75 Years and over | 46 (100.0%) | 47 (100.0%) |
| Total | 132 (95.7%) | 158 (100.0%) |
Income Below Poverty Among Married-Couple Families in Carl
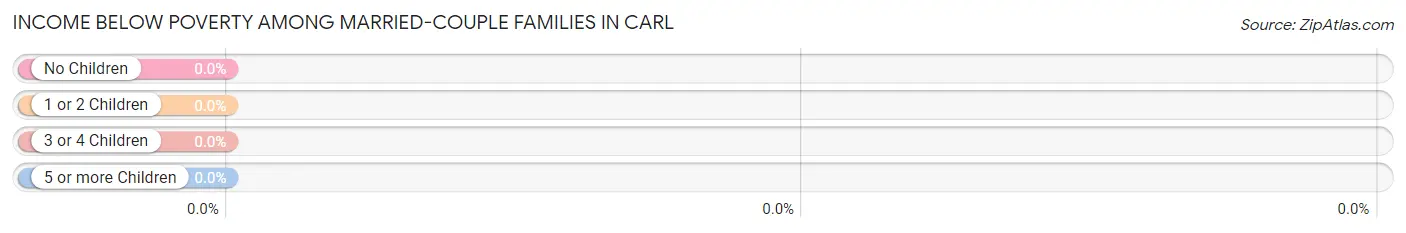
| Children | Above Poverty | Below Poverty |
| No Children | 62 (100.0%) | 0 (0.0%) |
| 1 or 2 Children | 14 (100.0%) | 0 (0.0%) |
| 3 or 4 Children | 8 (100.0%) | 0 (0.0%) |
| 5 or more Children | 0 (0.0%) | 0 (0.0%) |
| Total | 84 (100.0%) | 0 (0.0%) |
Income Below Poverty Among Single-Parent Households in Carl
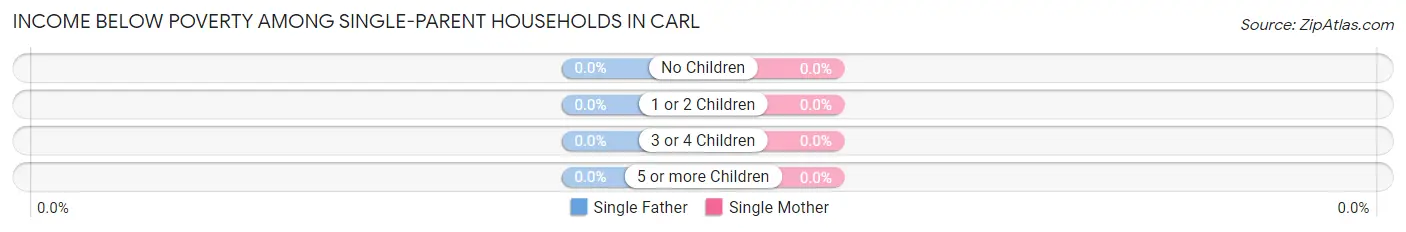
| Children | Single Father | Single Mother |
| No Children | 0 (0.0%) | 0 (0.0%) |
| 1 or 2 Children | 0 (0.0%) | 0 (0.0%) |
| 3 or 4 Children | 0 (0.0%) | 0 (0.0%) |
| 5 or more Children | 0 (0.0%) | 0 (0.0%) |
| Total | 0 (0.0%) | 0 (0.0%) |
Income Below Poverty Among Married-Couple vs Single-Parent Households in Carl
| Children | Married-Couple Families | Single-Parent Households |
| No Children | 0 (0.0%) | 0 (0.0%) |
| 1 or 2 Children | 0 (0.0%) | 0 (0.0%) |
| 3 or 4 Children | 0 (0.0%) | 0 (0.0%) |
| 5 or more Children | 0 (0.0%) | 0 (0.0%) |
| Total | 0 (0.0%) | 0 (0.0%) |
Employment Characteristics in Carl
Employment by Class of Employer in Carl
Among the 110 employed individuals in Carl, private company employees (88 | 80.0%), local government employees (9 | 8.2%), and not-for-profit organizations (5 | 4.5%) make up the most common classes of employment.
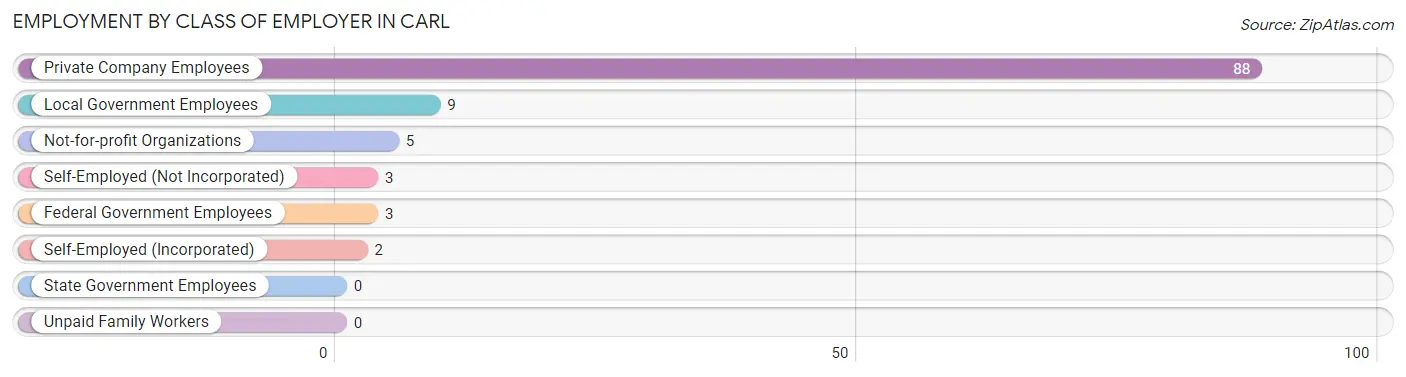
| Employer Class | # Employees | % Employees |
| Private Company Employees | 88 | 80.0% |
| Self-Employed (Incorporated) | 2 | 1.8% |
| Self-Employed (Not Incorporated) | 3 | 2.7% |
| Not-for-profit Organizations | 5 | 4.5% |
| Local Government Employees | 9 | 8.2% |
| State Government Employees | 0 | 0.0% |
| Federal Government Employees | 3 | 2.7% |
| Unpaid Family Workers | 0 | 0.0% |
| Total | 110 | 100.0% |
Employment Status by Age in Carl
According to the labor force statistics for Carl, out of the total population over 16 years of age (269), 42.8% or 115 individuals are in the labor force, with 4.3% or 5 of them unemployed. The age group with the highest labor force participation rate is 25 to 29 years, with 100.0% or 23 individuals in the labor force. Within the labor force, the 65 to 74 years age range has the highest percentage of unemployed individuals, with 50.0% or 1 of them being unemployed.
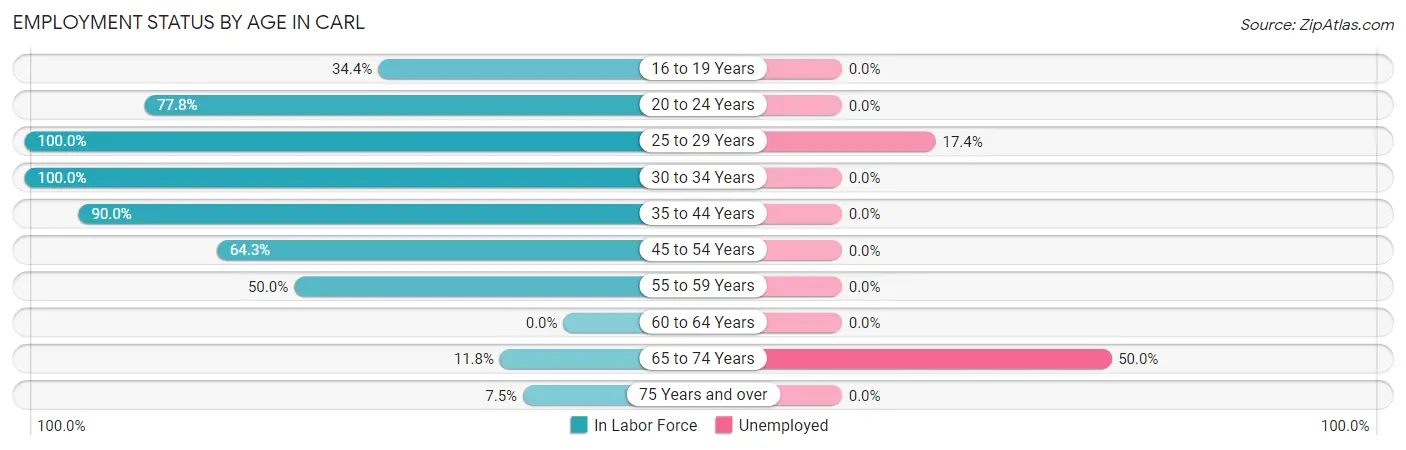
| Age Bracket | In Labor Force | Unemployed |
| 16 to 19 Years | 11 (34.4%) | 0 (0.0%) |
| 20 to 24 Years | 14 (77.8%) | 0 (0.0%) |
| 25 to 29 Years | 23 (100.0%) | 4 (17.4%) |
| 30 to 34 Years | 3 (100.0%) | 0 (0.0%) |
| 35 to 44 Years | 27 (90.0%) | 0 (0.0%) |
| 45 to 54 Years | 18 (64.3%) | 0 (0.0%) |
| 55 to 59 Years | 10 (50.0%) | 0 (0.0%) |
| 60 to 64 Years | 0 (0.0%) | 0 (0.0%) |
| 65 to 74 Years | 2 (11.8%) | 1 (50.0%) |
| 75 Years and over | 7 (7.5%) | 0 (0.0%) |
| Total | 115 (42.8%) | 5 (4.3%) |
Employment Status by Educational Attainment in Carl
According to labor force statistics for Carl, 74.3% of individuals (81) out of the total population between 25 and 64 years of age (109) are in the labor force, with 4.9% or 4 of them being unemployed. The group with the highest labor force participation rate are those with the educational attainment of high school diploma, with 89.3% or 25 individuals in the labor force. Within the labor force, individuals with bachelor's degree or higher education have the highest percentage of unemployment, with 26.7% or 4 of them being unemployed.
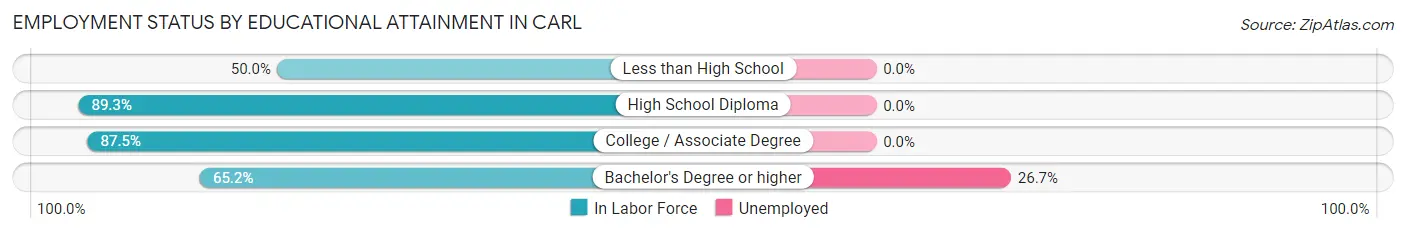
| Educational Attainment | In Labor Force | Unemployed |
| Less than High School | 13 (50.0%) | 0 (0.0%) |
| High School Diploma | 25 (89.3%) | 0 (0.0%) |
| College / Associate Degree | 28 (87.5%) | 0 (0.0%) |
| Bachelor's Degree or higher | 15 (65.2%) | 6 (26.7%) |
| Total | 81 (74.3%) | 5 (4.9%) |
Employment Occupations by Sex in Carl
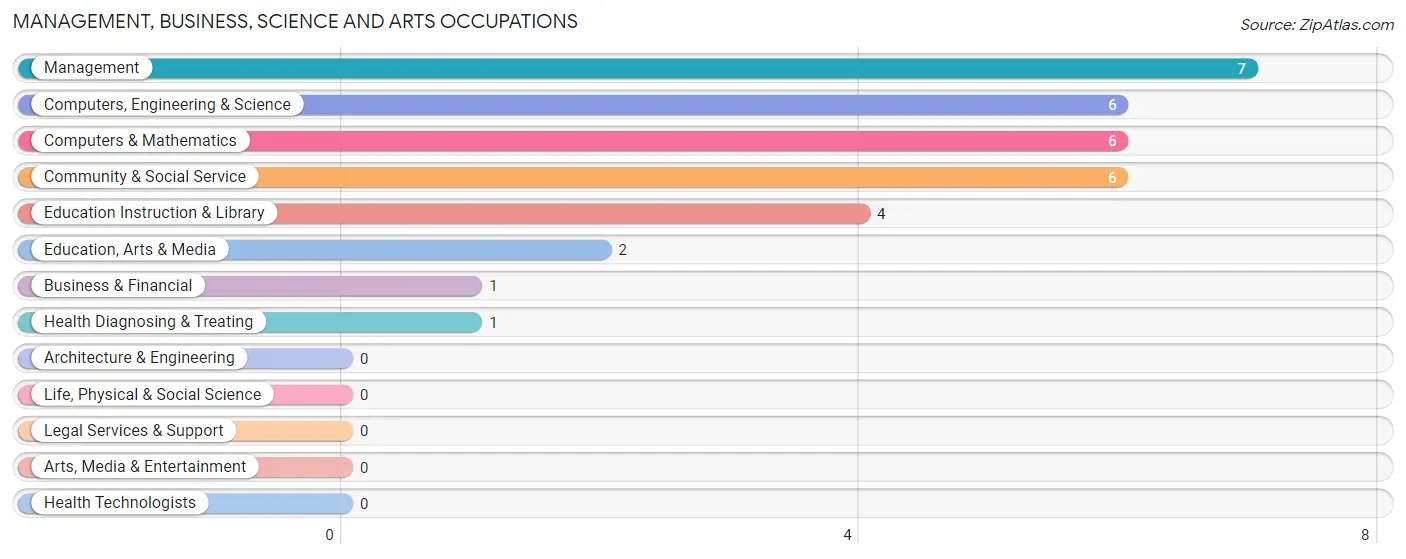
Management, Business, Science and Arts Occupations
The most common Management, Business, Science and Arts occupations in Carl are Management (7 | 6.4%), Computers, Engineering & Science (6 | 5.4%), Computers & Mathematics (6 | 5.4%), Community & Social Service (6 | 5.4%), and Education Instruction & Library (4 | 3.6%).
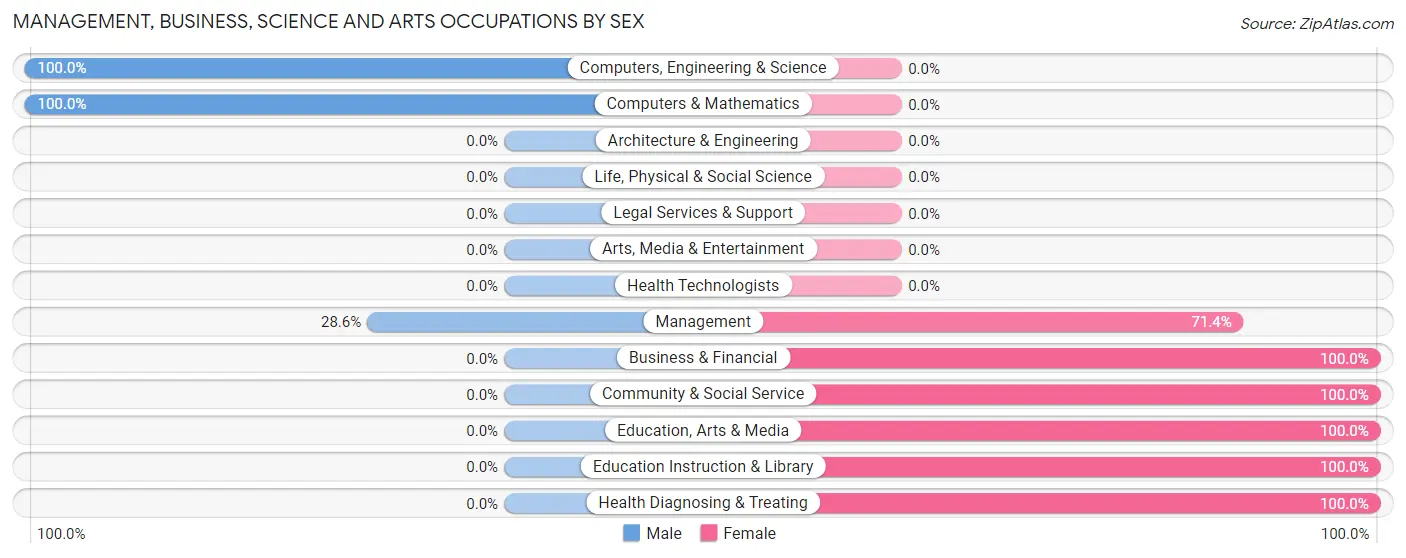
Management, Business, Science and Arts Occupations by Sex
Within the Management, Business, Science and Arts occupations in Carl, the most male-oriented occupations are Computers, Engineering & Science (100.0%), Computers & Mathematics (100.0%), and Management (28.6%), while the most female-oriented occupations are Business & Financial (100.0%), Community & Social Service (100.0%), and Education, Arts & Media (100.0%).
| Occupation | Male | Female |
| Management | 2 (28.6%) | 5 (71.4%) |
| Business & Financial | 0 (0.0%) | 1 (100.0%) |
| Computers, Engineering & Science | 6 (100.0%) | 0 (0.0%) |
| Computers & Mathematics | 6 (100.0%) | 0 (0.0%) |
| Architecture & Engineering | 0 (0.0%) | 0 (0.0%) |
| Life, Physical & Social Science | 0 (0.0%) | 0 (0.0%) |
| Community & Social Service | 0 (0.0%) | 6 (100.0%) |
| Education, Arts & Media | 0 (0.0%) | 2 (100.0%) |
| Legal Services & Support | 0 (0.0%) | 0 (0.0%) |
| Education Instruction & Library | 0 (0.0%) | 4 (100.0%) |
| Arts, Media & Entertainment | 0 (0.0%) | 0 (0.0%) |
| Health Diagnosing & Treating | 0 (0.0%) | 1 (100.0%) |
| Health Technologists | 0 (0.0%) | 0 (0.0%) |
| Total (Category) | 8 (38.1%) | 13 (61.9%) |
| Total (Overall) | 66 (60.0%) | 44 (40.0%) |
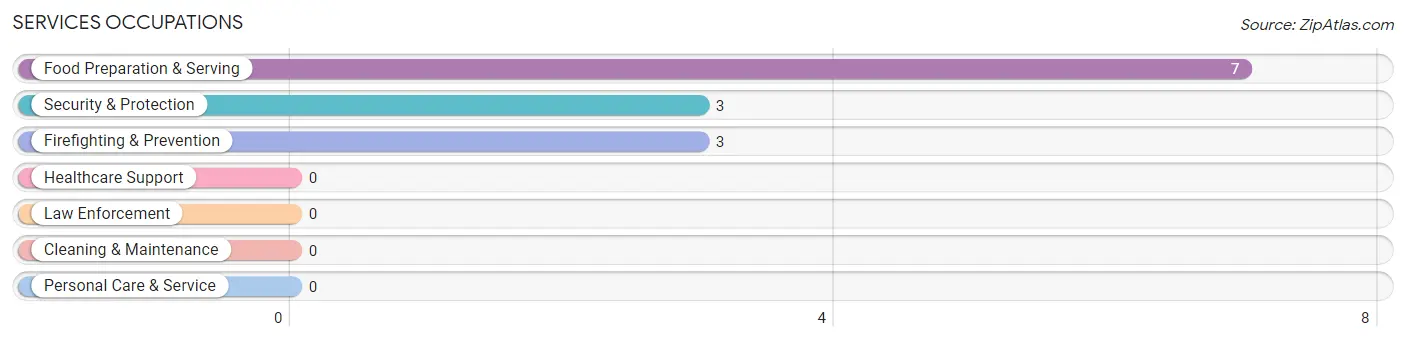
Services Occupations
The most common Services occupations in Carl are Food Preparation & Serving (7 | 6.4%), Security & Protection (3 | 2.7%), and Firefighting & Prevention (3 | 2.7%).
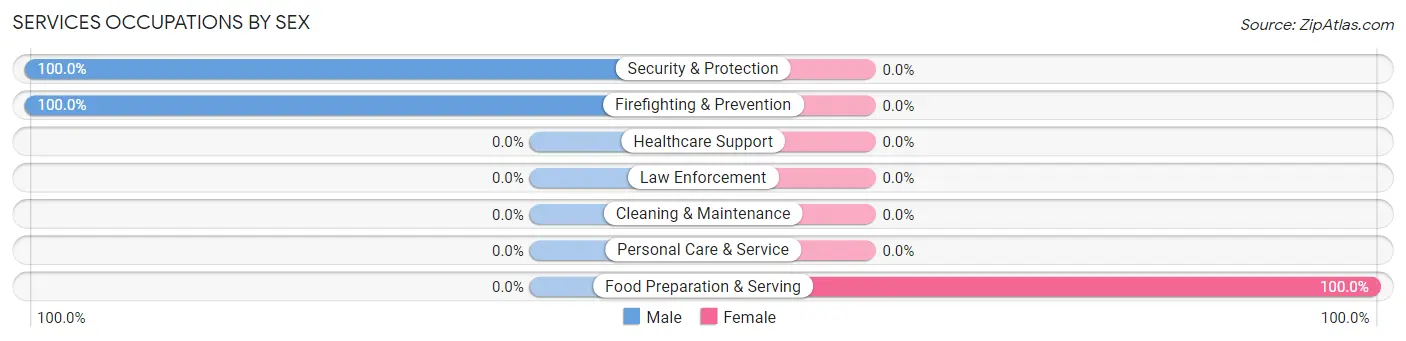
Services Occupations by Sex
| Occupation | Male | Female |
| Healthcare Support | 0 (0.0%) | 0 (0.0%) |
| Security & Protection | 3 (100.0%) | 0 (0.0%) |
| Firefighting & Prevention | 3 (100.0%) | 0 (0.0%) |
| Law Enforcement | 0 (0.0%) | 0 (0.0%) |
| Food Preparation & Serving | 0 (0.0%) | 7 (100.0%) |
| Cleaning & Maintenance | 0 (0.0%) | 0 (0.0%) |
| Personal Care & Service | 0 (0.0%) | 0 (0.0%) |
| Total (Category) | 3 (30.0%) | 7 (70.0%) |
| Total (Overall) | 66 (60.0%) | 44 (40.0%) |
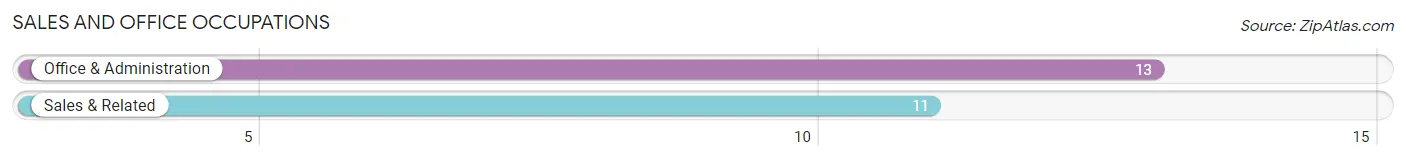
Sales and Office Occupations
The most common Sales and Office occupations in Carl are Office & Administration (13 | 11.8%), and Sales & Related (11 | 10.0%).
Sales and Office Occupations by Sex
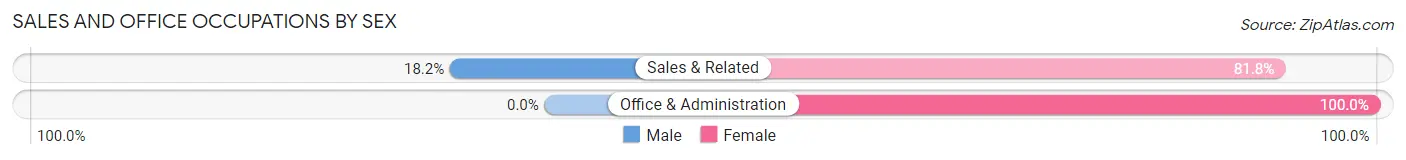
| Occupation | Male | Female |
| Sales & Related | 2 (18.2%) | 9 (81.8%) |
| Office & Administration | 0 (0.0%) | 13 (100.0%) |
| Total (Category) | 2 (8.3%) | 22 (91.7%) |
| Total (Overall) | 66 (60.0%) | 44 (40.0%) |
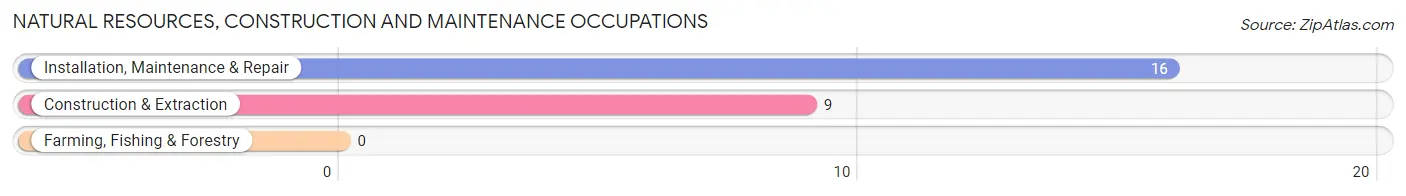
Natural Resources, Construction and Maintenance Occupations
The most common Natural Resources, Construction and Maintenance occupations in Carl are Installation, Maintenance & Repair (16 | 14.5%), and Construction & Extraction (9 | 8.2%).
Natural Resources, Construction and Maintenance Occupations by Sex
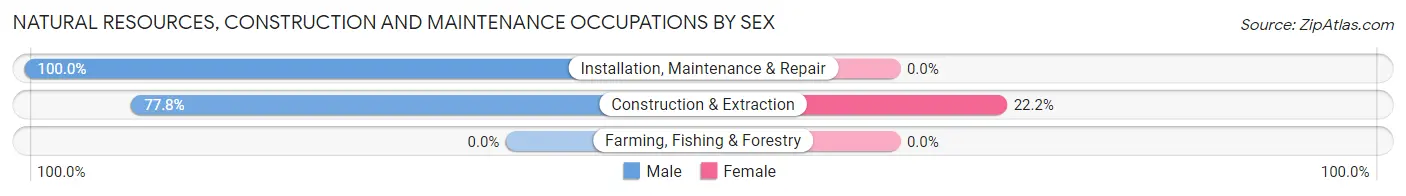
| Occupation | Male | Female |
| Farming, Fishing & Forestry | 0 (0.0%) | 0 (0.0%) |
| Construction & Extraction | 7 (77.8%) | 2 (22.2%) |
| Installation, Maintenance & Repair | 16 (100.0%) | 0 (0.0%) |
| Total (Category) | 23 (92.0%) | 2 (8.0%) |
| Total (Overall) | 66 (60.0%) | 44 (40.0%) |
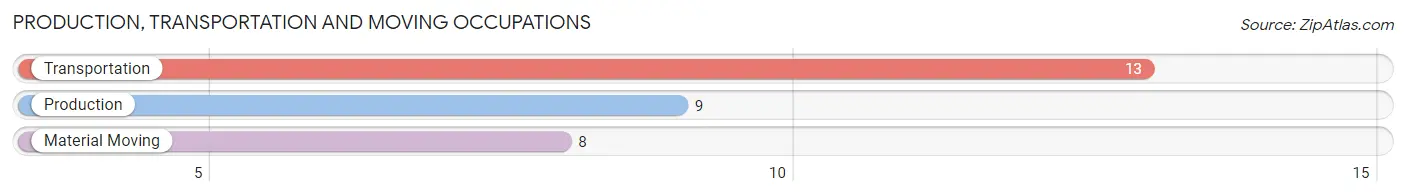
Production, Transportation and Moving Occupations
The most common Production, Transportation and Moving occupations in Carl are Transportation (13 | 11.8%), Production (9 | 8.2%), and Material Moving (8 | 7.3%).
Production, Transportation and Moving Occupations by Sex
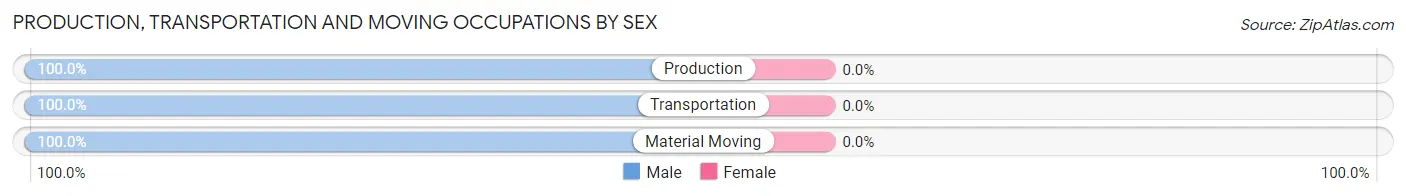
| Occupation | Male | Female |
| Production | 9 (100.0%) | 0 (0.0%) |
| Transportation | 13 (100.0%) | 0 (0.0%) |
| Material Moving | 8 (100.0%) | 0 (0.0%) |
| Total (Category) | 30 (100.0%) | 0 (0.0%) |
| Total (Overall) | 66 (60.0%) | 44 (40.0%) |
Employment Industries by Sex in Carl
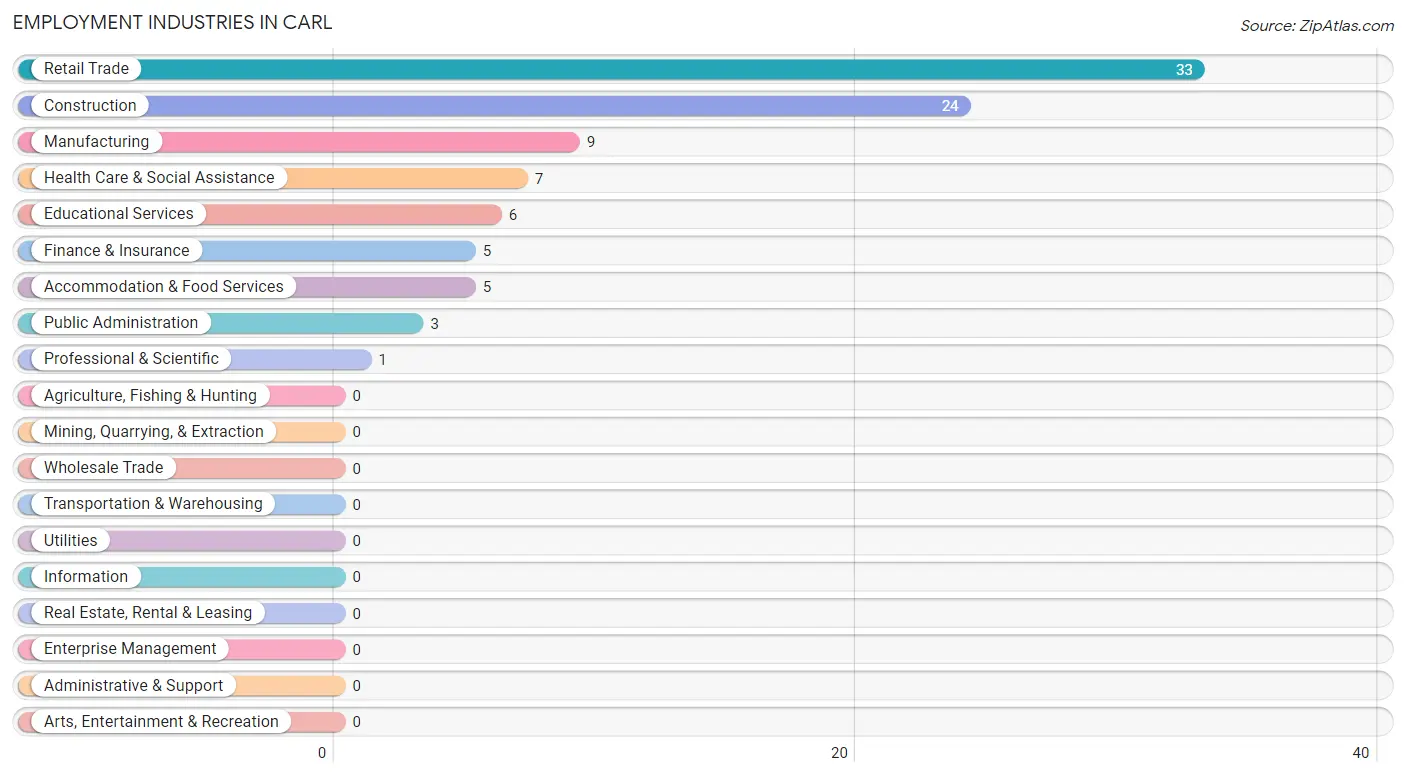
Employment Industries in Carl
The major employment industries in Carl include Retail Trade (33 | 30.0%), Construction (24 | 21.8%), Manufacturing (9 | 8.2%), Health Care & Social Assistance (7 | 6.4%), and Educational Services (6 | 5.4%).
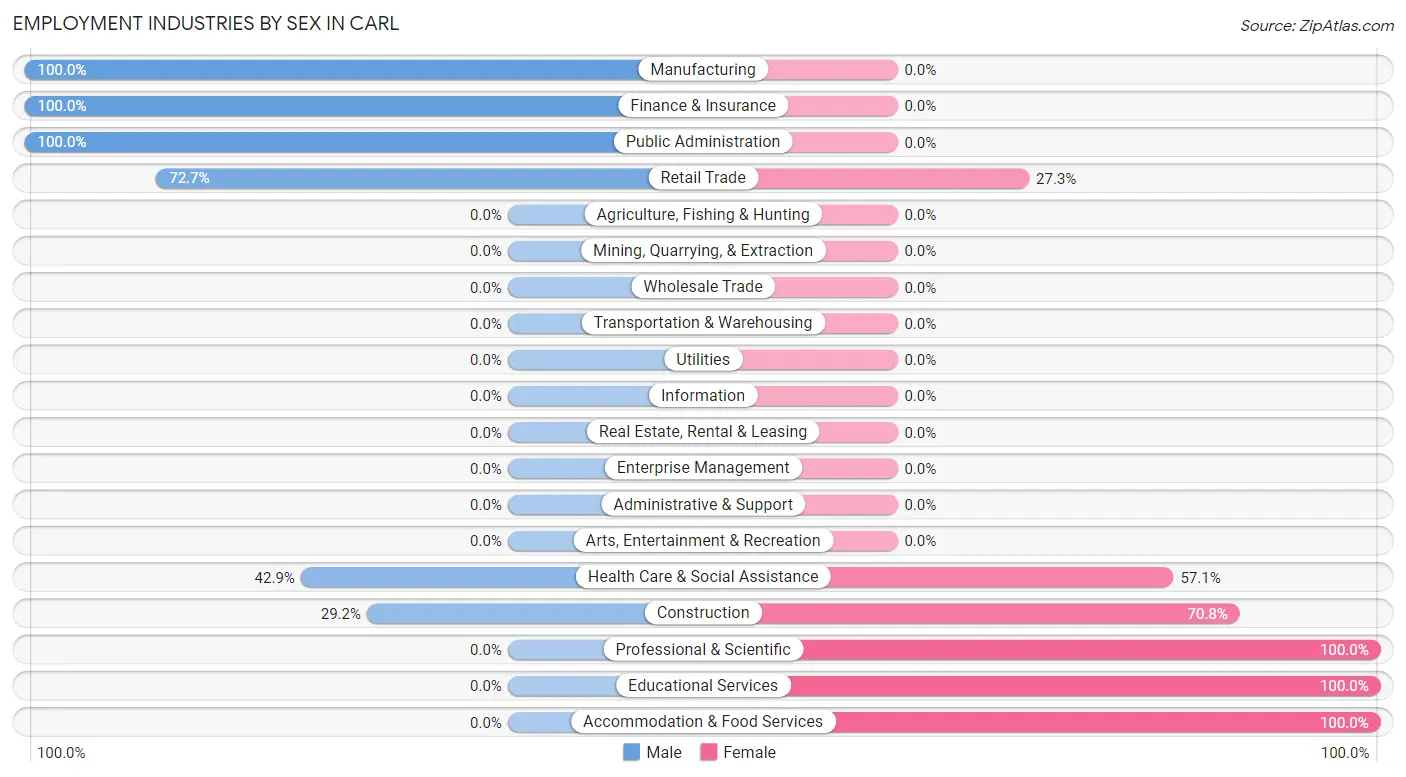
Employment Industries by Sex in Carl
The Carl industries that see more men than women are Manufacturing (100.0%), Finance & Insurance (100.0%), and Public Administration (100.0%), whereas the industries that tend to have a higher number of women are Professional & Scientific (100.0%), Educational Services (100.0%), and Accommodation & Food Services (100.0%).
| Industry | Male | Female |
| Agriculture, Fishing & Hunting | 0 (0.0%) | 0 (0.0%) |
| Mining, Quarrying, & Extraction | 0 (0.0%) | 0 (0.0%) |
| Construction | 7 (29.2%) | 17 (70.8%) |
| Manufacturing | 9 (100.0%) | 0 (0.0%) |
| Wholesale Trade | 0 (0.0%) | 0 (0.0%) |
| Retail Trade | 24 (72.7%) | 9 (27.3%) |
| Transportation & Warehousing | 0 (0.0%) | 0 (0.0%) |
| Utilities | 0 (0.0%) | 0 (0.0%) |
| Information | 0 (0.0%) | 0 (0.0%) |
| Finance & Insurance | 5 (100.0%) | 0 (0.0%) |
| Real Estate, Rental & Leasing | 0 (0.0%) | 0 (0.0%) |
| Professional & Scientific | 0 (0.0%) | 1 (100.0%) |
| Enterprise Management | 0 (0.0%) | 0 (0.0%) |
| Administrative & Support | 0 (0.0%) | 0 (0.0%) |
| Educational Services | 0 (0.0%) | 6 (100.0%) |
| Health Care & Social Assistance | 3 (42.9%) | 4 (57.1%) |
| Arts, Entertainment & Recreation | 0 (0.0%) | 0 (0.0%) |
| Accommodation & Food Services | 0 (0.0%) | 5 (100.0%) |
| Public Administration | 3 (100.0%) | 0 (0.0%) |
| Total | 66 (60.0%) | 44 (40.0%) |
Education in Carl
School Enrollment in Carl
The most common levels of schooling among the 66 students in Carl are high school (44 | 66.7%), college / undergraduate (11 | 16.7%), and graduate / professional (8 | 12.1%).
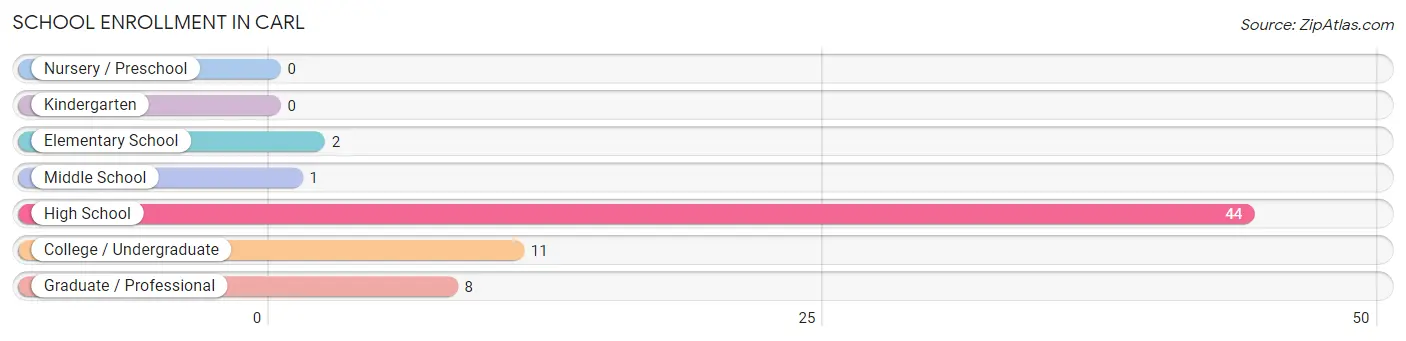
| School Level | # Students | % Students |
| Nursery / Preschool | 0 | 0.0% |
| Kindergarten | 0 | 0.0% |
| Elementary School | 2 | 3.0% |
| Middle School | 1 | 1.5% |
| High School | 44 | 66.7% |
| College / Undergraduate | 11 | 16.7% |
| Graduate / Professional | 8 | 12.1% |
| Total | 66 | 100.0% |
School Enrollment by Age by Funding Source in Carl
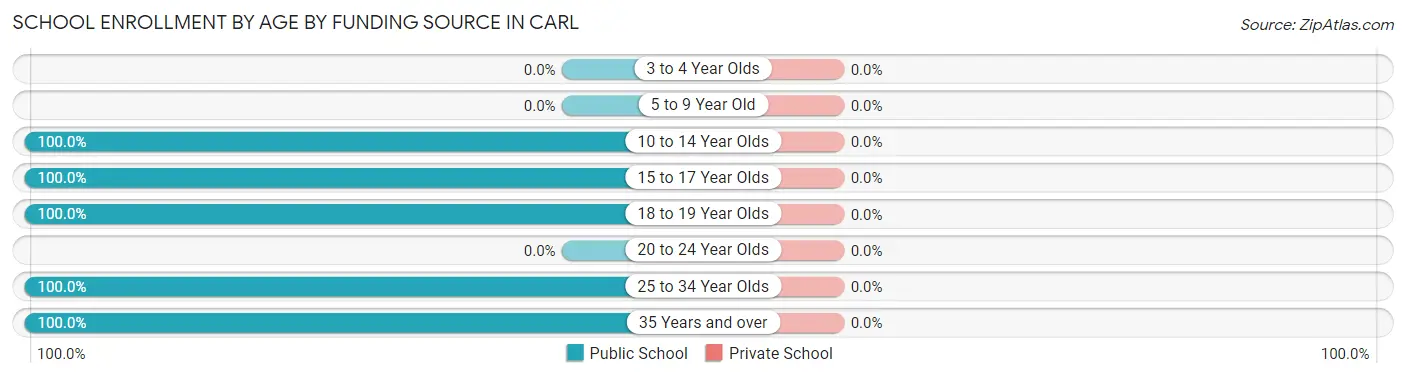
| Age Bracket | Public School | Private School |
| 3 to 4 Year Olds | 0 (0.0%) | 0 (0.0%) |
| 5 to 9 Year Old | 0 (0.0%) | 0 (0.0%) |
| 10 to 14 Year Olds | 5 (100.0%) | 0 (0.0%) |
| 15 to 17 Year Olds | 31 (100.0%) | 0 (0.0%) |
| 18 to 19 Year Olds | 12 (100.0%) | 0 (0.0%) |
| 20 to 24 Year Olds | 0 (0.0%) | 0 (0.0%) |
| 25 to 34 Year Olds | 10 (100.0%) | 0 (0.0%) |
| 35 Years and over | 8 (100.0%) | 0 (0.0%) |
| Total | 66 (100.0%) | 0 (0.0%) |
Educational Attainment by Field of Study in Carl
Arts & humanities (8 | 30.8%), literature & languages (5 | 19.2%), education (4 | 15.4%), bio, nature & agricultural (3 | 11.5%), and engineering (3 | 11.5%) are the most common fields of study among 26 individuals in Carl who have obtained a bachelor's degree or higher.
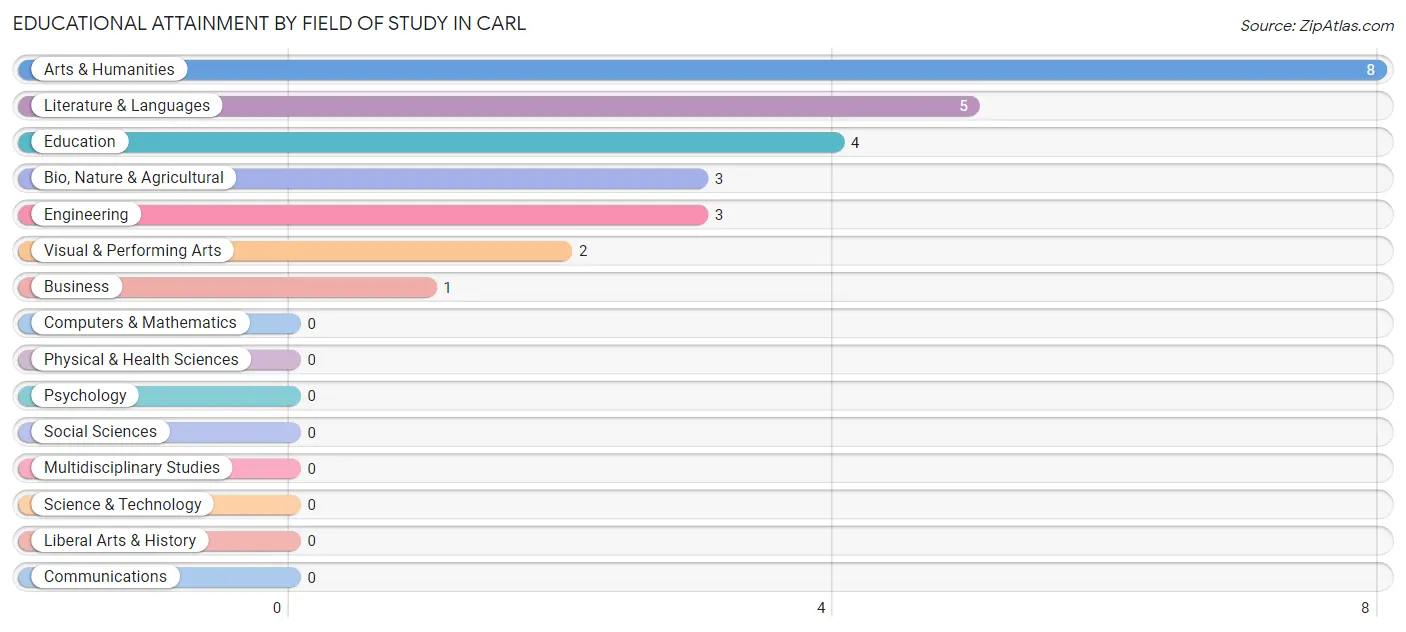
| Field of Study | # Graduates | % Graduates |
| Computers & Mathematics | 0 | 0.0% |
| Bio, Nature & Agricultural | 3 | 11.5% |
| Physical & Health Sciences | 0 | 0.0% |
| Psychology | 0 | 0.0% |
| Social Sciences | 0 | 0.0% |
| Engineering | 3 | 11.5% |
| Multidisciplinary Studies | 0 | 0.0% |
| Science & Technology | 0 | 0.0% |
| Business | 1 | 3.8% |
| Education | 4 | 15.4% |
| Literature & Languages | 5 | 19.2% |
| Liberal Arts & History | 0 | 0.0% |
| Visual & Performing Arts | 2 | 7.7% |
| Communications | 0 | 0.0% |
| Arts & Humanities | 8 | 30.8% |
| Total | 26 | 100.0% |
Transportation & Commute in Carl
Vehicle Availability by Sex in Carl
The most prevalent vehicle ownership categories in Carl are males with 2 vehicles (24, accounting for 36.4%) and females with 2 vehicles (14, making up 54.5%).
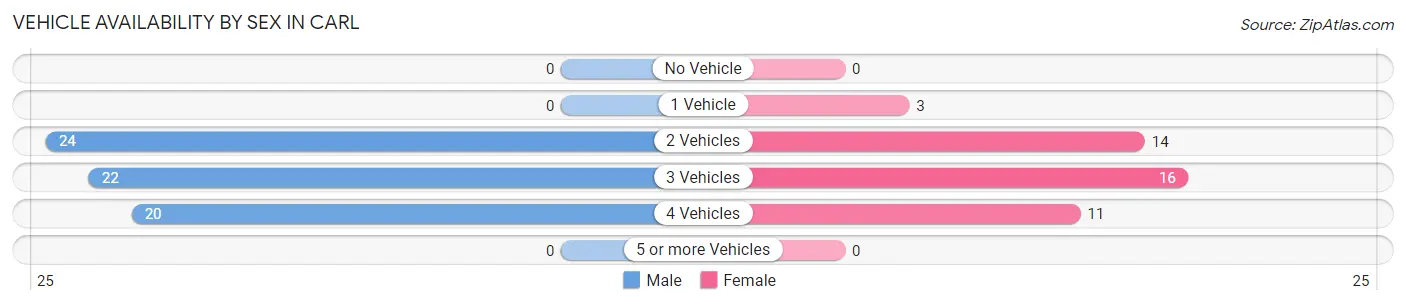
| Vehicles Available | Male | Female |
| No Vehicle | 0 (0.0%) | 0 (0.0%) |
| 1 Vehicle | 0 (0.0%) | 3 (6.8%) |
| 2 Vehicles | 24 (36.4%) | 14 (31.8%) |
| 3 Vehicles | 22 (33.3%) | 16 (36.4%) |
| 4 Vehicles | 20 (30.3%) | 11 (25.0%) |
| 5 or more Vehicles | 0 (0.0%) | 0 (0.0%) |
| Total | 66 (100.0%) | 44 (100.0%) |
Commute Time in Carl
The most frequently occuring commute durations in Carl are 30 to 34 minutes (52 commuters, 47.3%), 10 to 14 minutes (11 commuters, 10.0%), and 20 to 24 minutes (11 commuters, 10.0%).
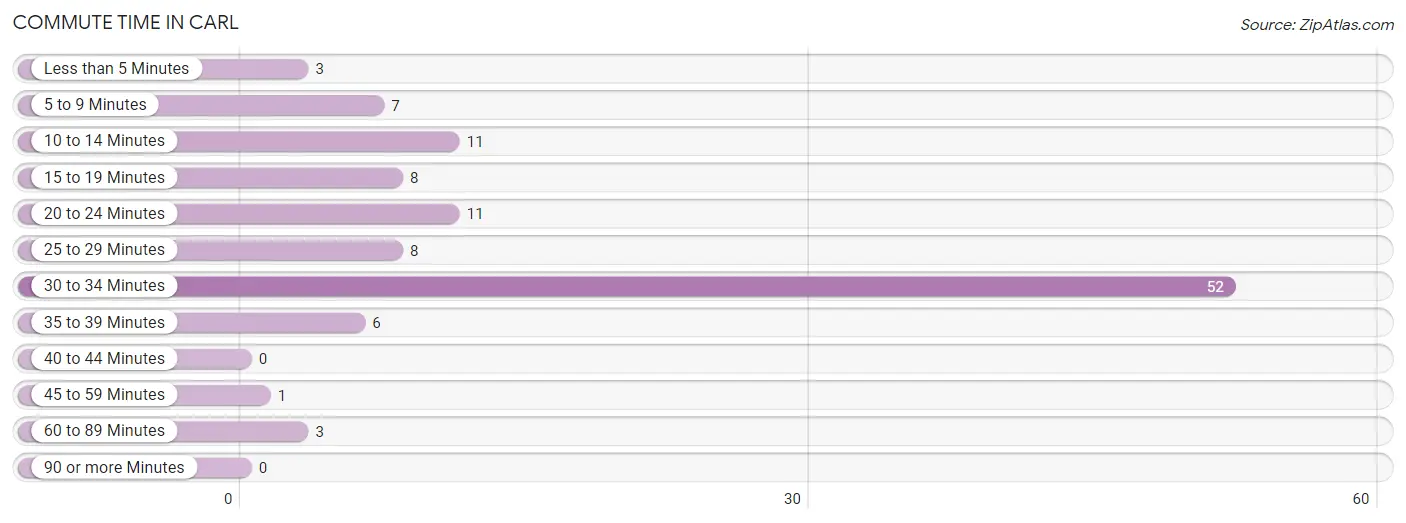
| Commute Time | # Commuters | % Commuters |
| Less than 5 Minutes | 3 | 2.7% |
| 5 to 9 Minutes | 7 | 6.4% |
| 10 to 14 Minutes | 11 | 10.0% |
| 15 to 19 Minutes | 8 | 7.3% |
| 20 to 24 Minutes | 11 | 10.0% |
| 25 to 29 Minutes | 8 | 7.3% |
| 30 to 34 Minutes | 52 | 47.3% |
| 35 to 39 Minutes | 6 | 5.4% |
| 40 to 44 Minutes | 0 | 0.0% |
| 45 to 59 Minutes | 1 | 0.9% |
| 60 to 89 Minutes | 3 | 2.7% |
| 90 or more Minutes | 0 | 0.0% |
Commute Time by Sex in Carl
The most common commute times in Carl are 30 to 34 minutes (42 commuters, 63.6%) for males and 30 to 34 minutes (10 commuters, 22.7%) for females.
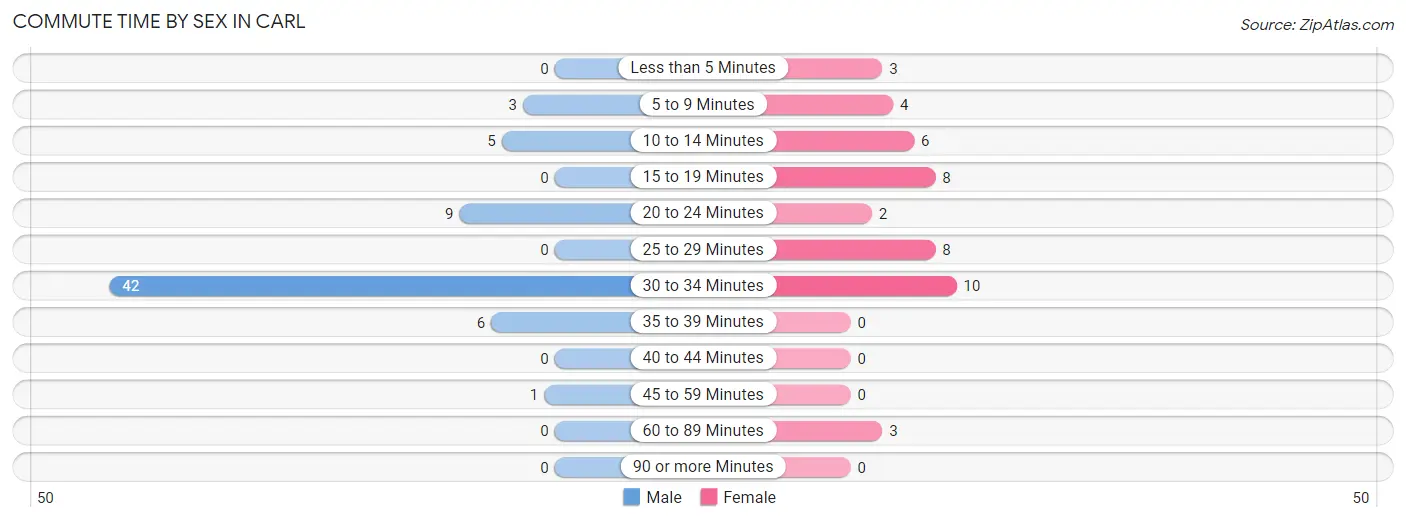
| Commute Time | Male | Female |
| Less than 5 Minutes | 0 (0.0%) | 3 (6.8%) |
| 5 to 9 Minutes | 3 (4.5%) | 4 (9.1%) |
| 10 to 14 Minutes | 5 (7.6%) | 6 (13.6%) |
| 15 to 19 Minutes | 0 (0.0%) | 8 (18.2%) |
| 20 to 24 Minutes | 9 (13.6%) | 2 (4.5%) |
| 25 to 29 Minutes | 0 (0.0%) | 8 (18.2%) |
| 30 to 34 Minutes | 42 (63.6%) | 10 (22.7%) |
| 35 to 39 Minutes | 6 (9.1%) | 0 (0.0%) |
| 40 to 44 Minutes | 0 (0.0%) | 0 (0.0%) |
| 45 to 59 Minutes | 1 (1.5%) | 0 (0.0%) |
| 60 to 89 Minutes | 0 (0.0%) | 3 (6.8%) |
| 90 or more Minutes | 0 (0.0%) | 0 (0.0%) |
Time of Departure to Work by Sex in Carl
The most frequent times of departure to work in Carl are 5:00 AM to 5:29 AM (23, 34.8%) for males and 8:00 AM to 8:29 AM (14, 31.8%) for females.
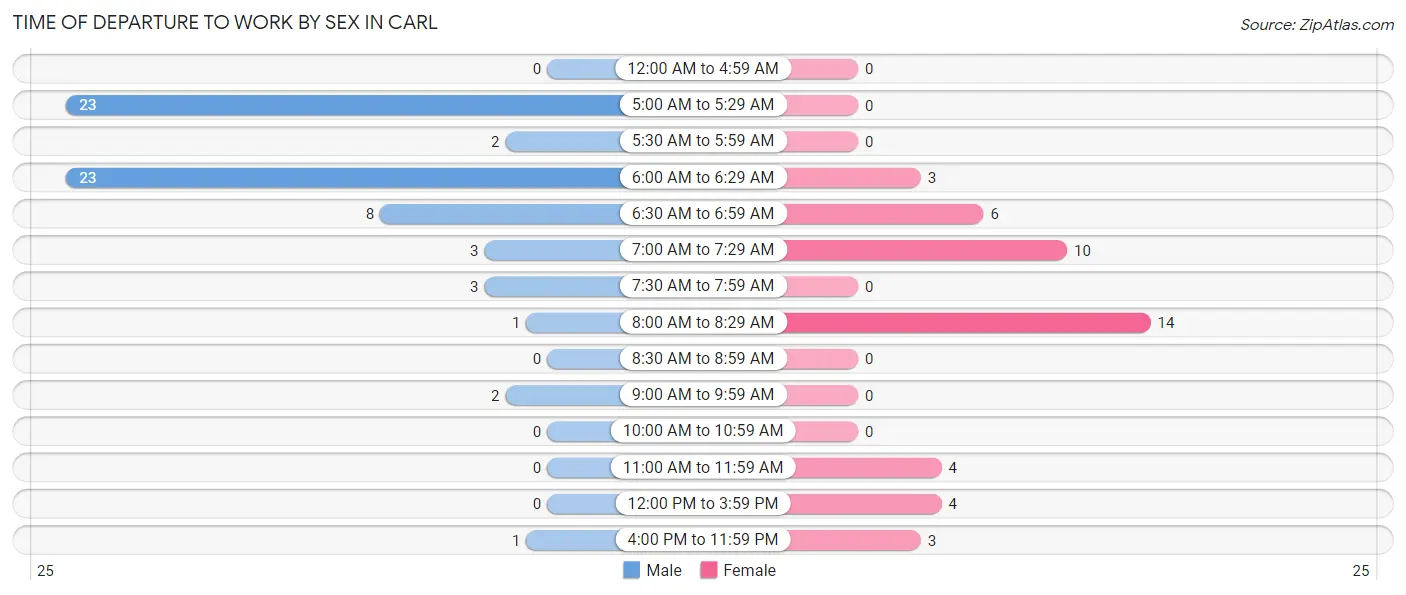
| Time of Departure | Male | Female |
| 12:00 AM to 4:59 AM | 0 (0.0%) | 0 (0.0%) |
| 5:00 AM to 5:29 AM | 23 (34.8%) | 0 (0.0%) |
| 5:30 AM to 5:59 AM | 2 (3.0%) | 0 (0.0%) |
| 6:00 AM to 6:29 AM | 23 (34.8%) | 3 (6.8%) |
| 6:30 AM to 6:59 AM | 8 (12.1%) | 6 (13.6%) |
| 7:00 AM to 7:29 AM | 3 (4.5%) | 10 (22.7%) |
| 7:30 AM to 7:59 AM | 3 (4.5%) | 0 (0.0%) |
| 8:00 AM to 8:29 AM | 1 (1.5%) | 14 (31.8%) |
| 8:30 AM to 8:59 AM | 0 (0.0%) | 0 (0.0%) |
| 9:00 AM to 9:59 AM | 2 (3.0%) | 0 (0.0%) |
| 10:00 AM to 10:59 AM | 0 (0.0%) | 0 (0.0%) |
| 11:00 AM to 11:59 AM | 0 (0.0%) | 4 (9.1%) |
| 12:00 PM to 3:59 PM | 0 (0.0%) | 4 (9.1%) |
| 4:00 PM to 11:59 PM | 1 (1.5%) | 3 (6.8%) |
| Total | 66 (100.0%) | 44 (100.0%) |
Housing Occupancy in Carl
Occupancy by Ownership in Carl
Of the total 121 dwellings in Carl, owner-occupied units account for 68 (56.2%), while renter-occupied units make up 53 (43.8%).
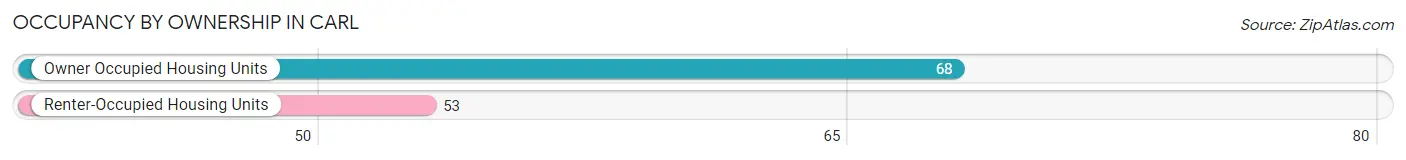
| Occupancy | # Housing Units | % Housing Units |
| Owner Occupied Housing Units | 68 | 56.2% |
| Renter-Occupied Housing Units | 53 | 43.8% |
| Total Occupied Housing Units | 121 | 100.0% |
Occupancy by Household Size in Carl
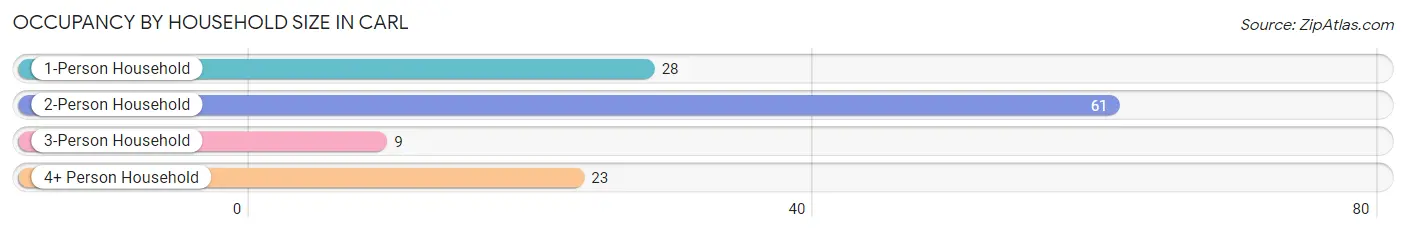
| Household Size | # Housing Units | % Housing Units |
| 1-Person Household | 28 | 23.1% |
| 2-Person Household | 61 | 50.4% |
| 3-Person Household | 9 | 7.4% |
| 4+ Person Household | 23 | 19.0% |
| Total Housing Units | 121 | 100.0% |
Occupancy by Ownership by Household Size in Carl
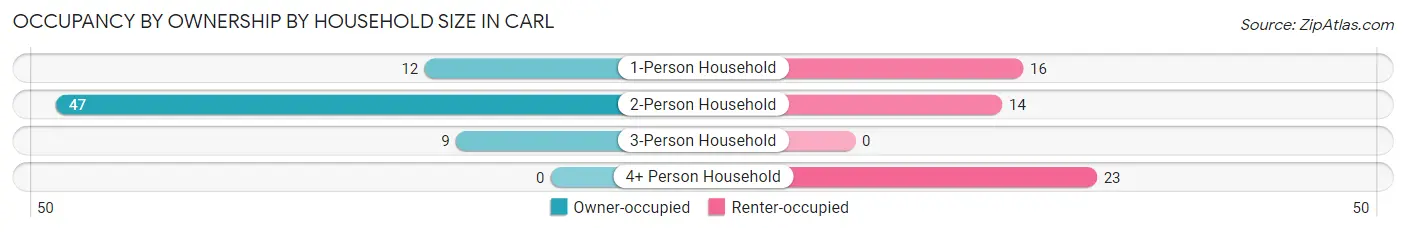
| Household Size | Owner-occupied | Renter-occupied |
| 1-Person Household | 12 (42.9%) | 16 (57.1%) |
| 2-Person Household | 47 (77.0%) | 14 (23.0%) |
| 3-Person Household | 9 (100.0%) | 0 (0.0%) |
| 4+ Person Household | 0 (0.0%) | 23 (100.0%) |
| Total Housing Units | 68 (56.2%) | 53 (43.8%) |
Occupancy by Educational Attainment in Carl
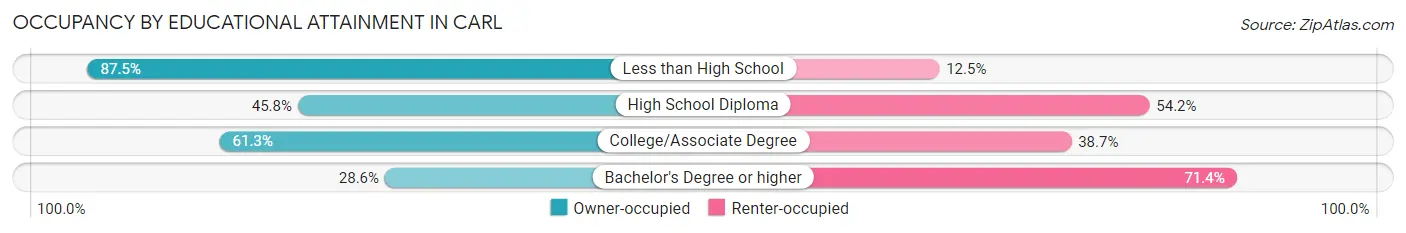
| Household Size | Owner-occupied | Renter-occupied |
| Less than High School | 7 (87.5%) | 1 (12.5%) |
| High School Diploma | 11 (45.8%) | 13 (54.2%) |
| College/Associate Degree | 46 (61.3%) | 29 (38.7%) |
| Bachelor's Degree or higher | 4 (28.6%) | 10 (71.4%) |
Occupancy by Age of Householder in Carl
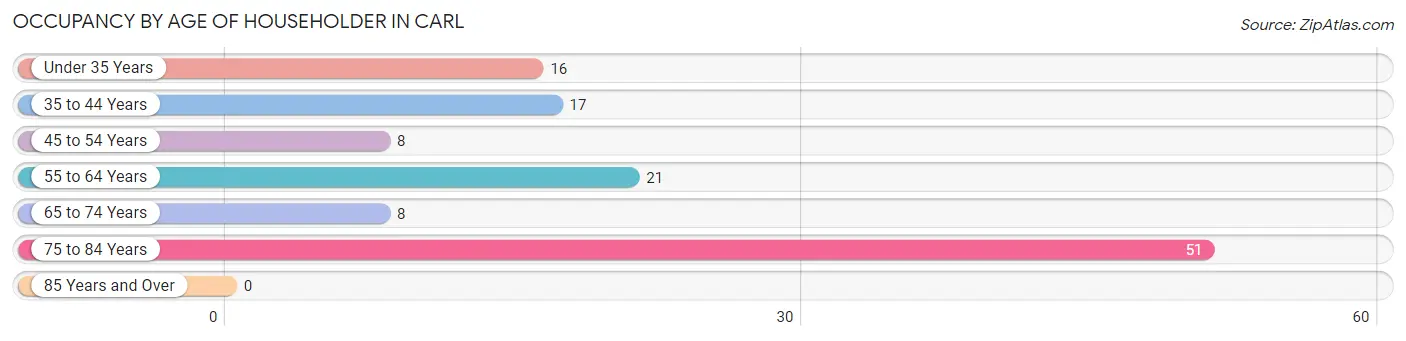
| Age Bracket | # Households | % Households |
| Under 35 Years | 16 | 13.2% |
| 35 to 44 Years | 17 | 14.1% |
| 45 to 54 Years | 8 | 6.6% |
| 55 to 64 Years | 21 | 17.4% |
| 65 to 74 Years | 8 | 6.6% |
| 75 to 84 Years | 51 | 42.1% |
| 85 Years and Over | 0 | 0.0% |
| Total | 121 | 100.0% |
Housing Finances in Carl
Median Income by Occupancy in Carl
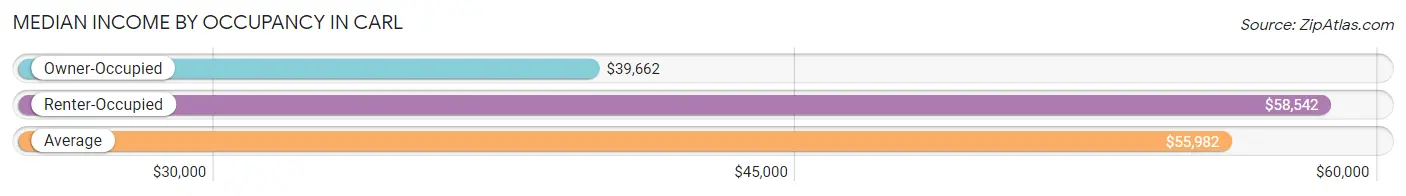
| Occupancy Type | # Households | Median Income |
| Owner-Occupied | 68 (56.2%) | $39,662 |
| Renter-Occupied | 53 (43.8%) | $58,542 |
| Average | 121 (100.0%) | $55,982 |
Occupancy by Householder Income Bracket in Carl
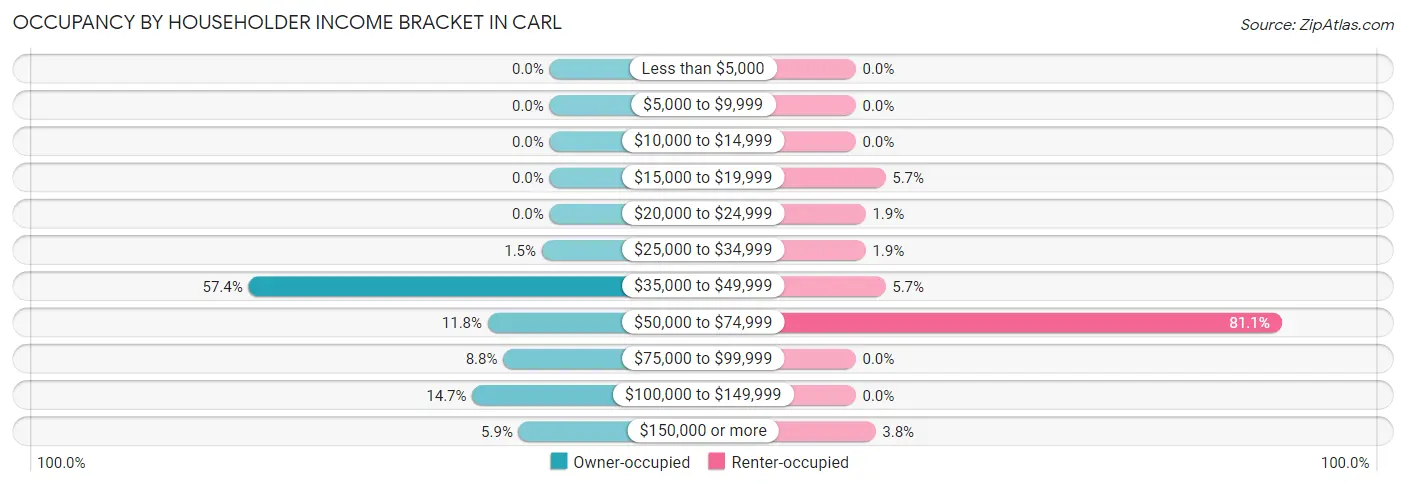
| Income Bracket | Owner-occupied | Renter-occupied |
| Less than $5,000 | 0 (0.0%) | 0 (0.0%) |
| $5,000 to $9,999 | 0 (0.0%) | 0 (0.0%) |
| $10,000 to $14,999 | 0 (0.0%) | 0 (0.0%) |
| $15,000 to $19,999 | 0 (0.0%) | 3 (5.7%) |
| $20,000 to $24,999 | 0 (0.0%) | 1 (1.9%) |
| $25,000 to $34,999 | 1 (1.5%) | 1 (1.9%) |
| $35,000 to $49,999 | 39 (57.4%) | 3 (5.7%) |
| $50,000 to $74,999 | 8 (11.8%) | 43 (81.1%) |
| $75,000 to $99,999 | 6 (8.8%) | 0 (0.0%) |
| $100,000 to $149,999 | 10 (14.7%) | 0 (0.0%) |
| $150,000 or more | 4 (5.9%) | 2 (3.8%) |
| Total | 68 (100.0%) | 53 (100.0%) |
Monthly Housing Cost Tiers in Carl
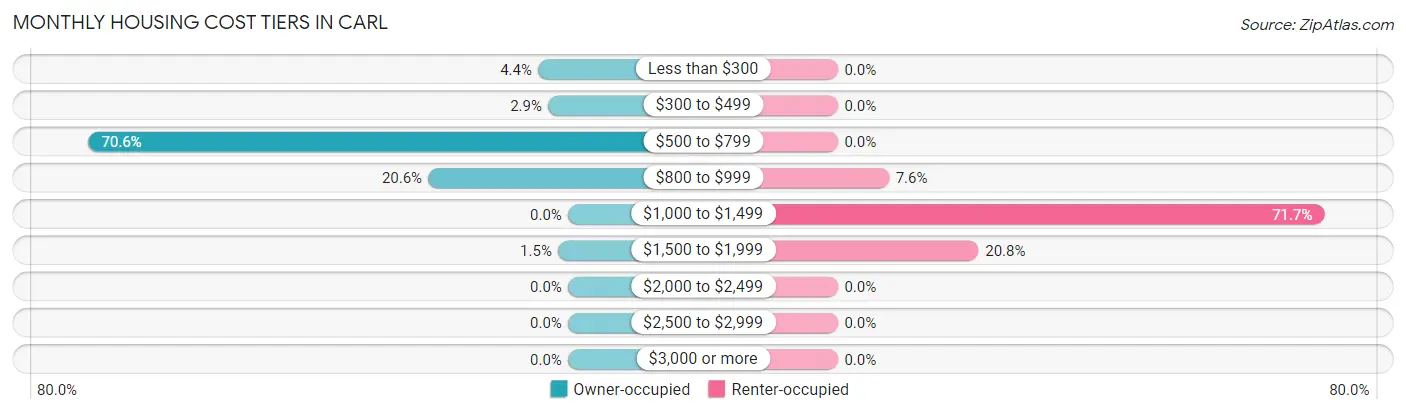
| Monthly Cost | Owner-occupied | Renter-occupied |
| Less than $300 | 3 (4.4%) | 0 (0.0%) |
| $300 to $499 | 2 (2.9%) | 0 (0.0%) |
| $500 to $799 | 48 (70.6%) | 0 (0.0%) |
| $800 to $999 | 14 (20.6%) | 4 (7.5%) |
| $1,000 to $1,499 | 0 (0.0%) | 38 (71.7%) |
| $1,500 to $1,999 | 1 (1.5%) | 11 (20.7%) |
| $2,000 to $2,499 | 0 (0.0%) | 0 (0.0%) |
| $2,500 to $2,999 | 0 (0.0%) | 0 (0.0%) |
| $3,000 or more | 0 (0.0%) | 0 (0.0%) |
| Total | 68 (100.0%) | 53 (100.0%) |
Physical Housing Characteristics in Carl
Housing Structures in Carl
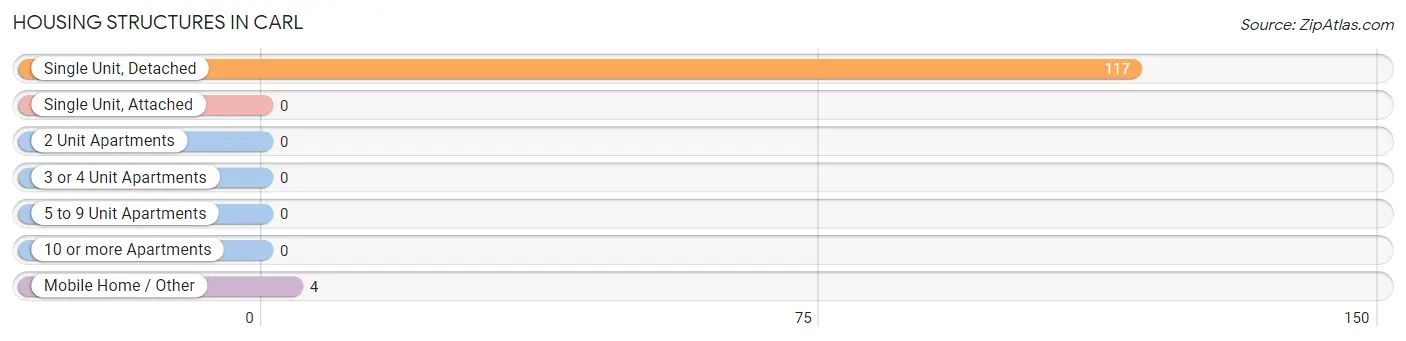
| Structure Type | # Housing Units | % Housing Units |
| Single Unit, Detached | 117 | 96.7% |
| Single Unit, Attached | 0 | 0.0% |
| 2 Unit Apartments | 0 | 0.0% |
| 3 or 4 Unit Apartments | 0 | 0.0% |
| 5 to 9 Unit Apartments | 0 | 0.0% |
| 10 or more Apartments | 0 | 0.0% |
| Mobile Home / Other | 4 | 3.3% |
| Total | 121 | 100.0% |
Housing Structures by Occupancy in Carl
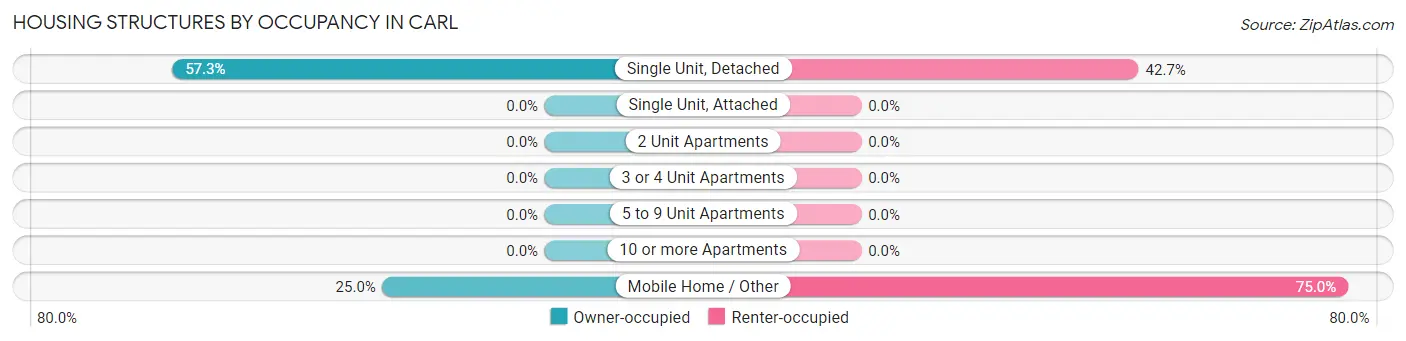
| Structure Type | Owner-occupied | Renter-occupied |
| Single Unit, Detached | 67 (57.3%) | 50 (42.7%) |
| Single Unit, Attached | 0 (0.0%) | 0 (0.0%) |
| 2 Unit Apartments | 0 (0.0%) | 0 (0.0%) |
| 3 or 4 Unit Apartments | 0 (0.0%) | 0 (0.0%) |
| 5 to 9 Unit Apartments | 0 (0.0%) | 0 (0.0%) |
| 10 or more Apartments | 0 (0.0%) | 0 (0.0%) |
| Mobile Home / Other | 1 (25.0%) | 3 (75.0%) |
| Total | 68 (56.2%) | 53 (43.8%) |
Housing Structures by Number of Rooms in Carl
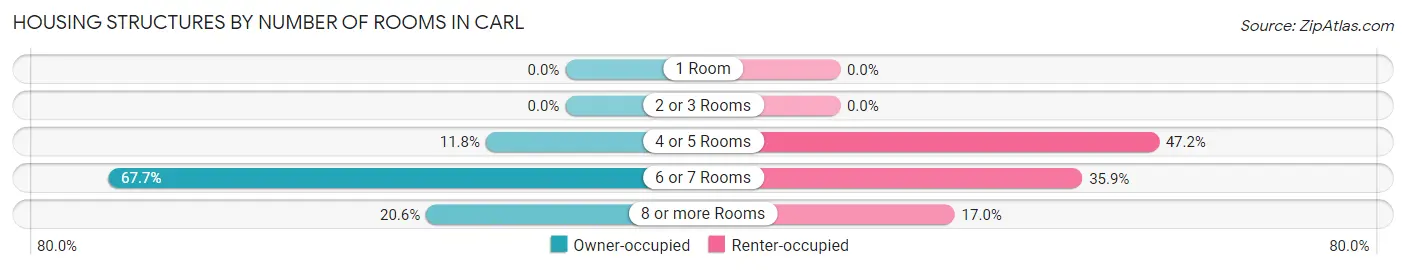
| Number of Rooms | Owner-occupied | Renter-occupied |
| 1 Room | 0 (0.0%) | 0 (0.0%) |
| 2 or 3 Rooms | 0 (0.0%) | 0 (0.0%) |
| 4 or 5 Rooms | 8 (11.8%) | 25 (47.2%) |
| 6 or 7 Rooms | 46 (67.6%) | 19 (35.8%) |
| 8 or more Rooms | 14 (20.6%) | 9 (17.0%) |
| Total | 68 (100.0%) | 53 (100.0%) |
Housing Structure by Heating Type in Carl
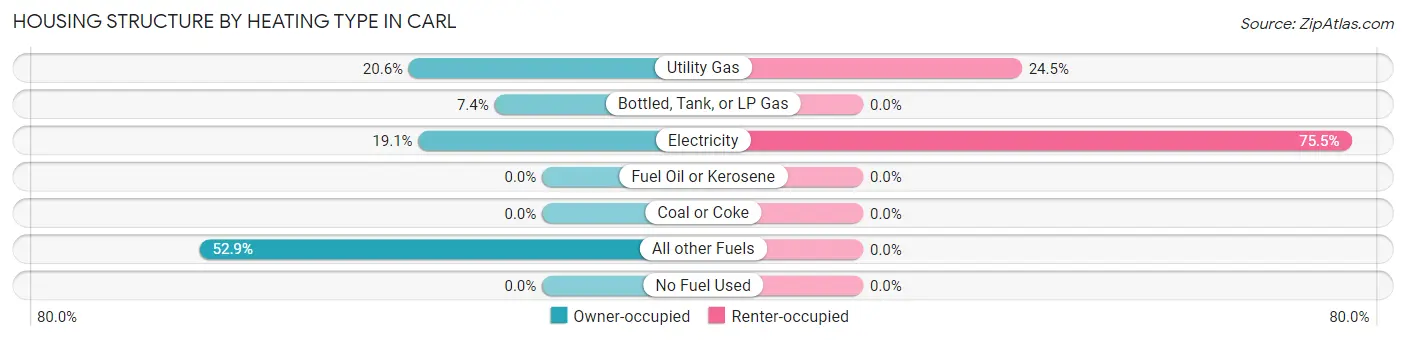
| Heating Type | Owner-occupied | Renter-occupied |
| Utility Gas | 14 (20.6%) | 13 (24.5%) |
| Bottled, Tank, or LP Gas | 5 (7.3%) | 0 (0.0%) |
| Electricity | 13 (19.1%) | 40 (75.5%) |
| Fuel Oil or Kerosene | 0 (0.0%) | 0 (0.0%) |
| Coal or Coke | 0 (0.0%) | 0 (0.0%) |
| All other Fuels | 36 (52.9%) | 0 (0.0%) |
| No Fuel Used | 0 (0.0%) | 0 (0.0%) |
| Total | 68 (100.0%) | 53 (100.0%) |
Household Vehicle Usage in Carl
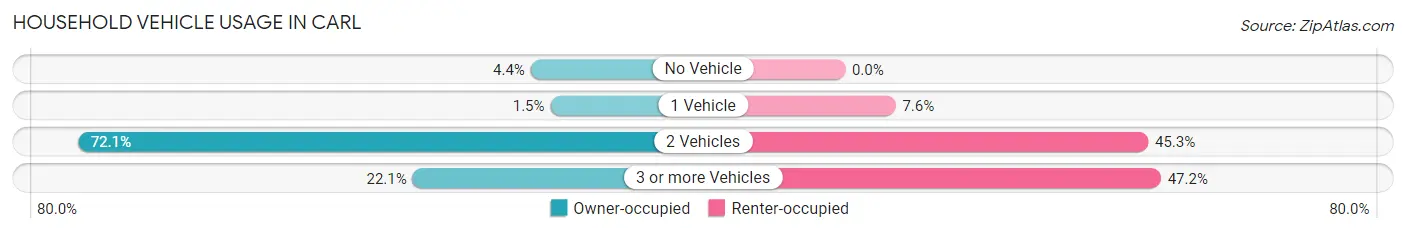
| Vehicles per Household | Owner-occupied | Renter-occupied |
| No Vehicle | 3 (4.4%) | 0 (0.0%) |
| 1 Vehicle | 1 (1.5%) | 4 (7.5%) |
| 2 Vehicles | 49 (72.1%) | 24 (45.3%) |
| 3 or more Vehicles | 15 (22.1%) | 25 (47.2%) |
| Total | 68 (100.0%) | 53 (100.0%) |
Real Estate & Mortgages in Carl
Real Estate and Mortgage Overview in Carl
| Characteristic | Without Mortgage | With Mortgage |
| Housing Units | 54 | 14 |
| Median Property Value | $334,200 | $0 |
| Median Household Income | $39,286 | $0 |
| Monthly Housing Costs | $552 | $0 |
| Real Estate Taxes | $2,447 | $0 |
Property Value by Mortgage Status in Carl
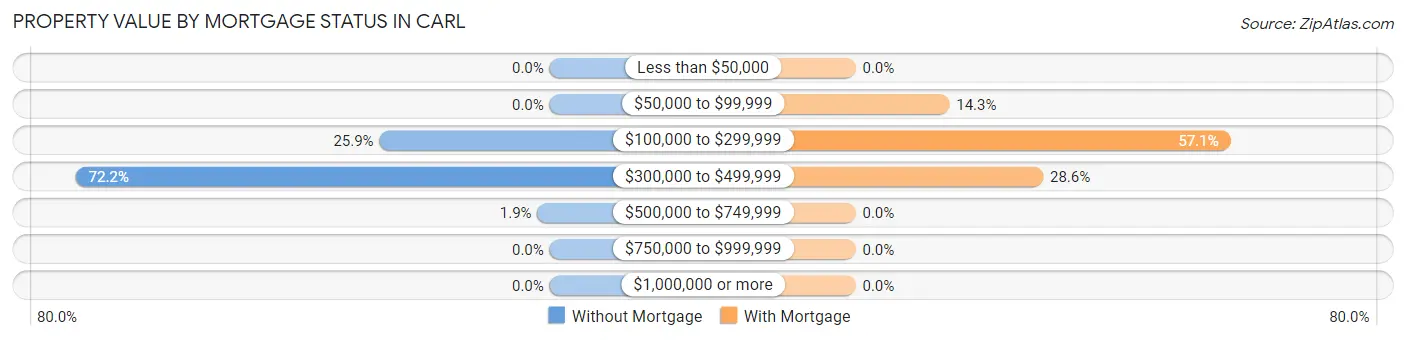
| Property Value | Without Mortgage | With Mortgage |
| Less than $50,000 | 0 (0.0%) | 0 (0.0%) |
| $50,000 to $99,999 | 0 (0.0%) | 2 (14.3%) |
| $100,000 to $299,999 | 14 (25.9%) | 8 (57.1%) |
| $300,000 to $499,999 | 39 (72.2%) | 4 (28.6%) |
| $500,000 to $749,999 | 1 (1.8%) | 0 (0.0%) |
| $750,000 to $999,999 | 0 (0.0%) | 0 (0.0%) |
| $1,000,000 or more | 0 (0.0%) | 0 (0.0%) |
| Total | 54 (100.0%) | 14 (100.0%) |
Household Income by Mortgage Status in Carl
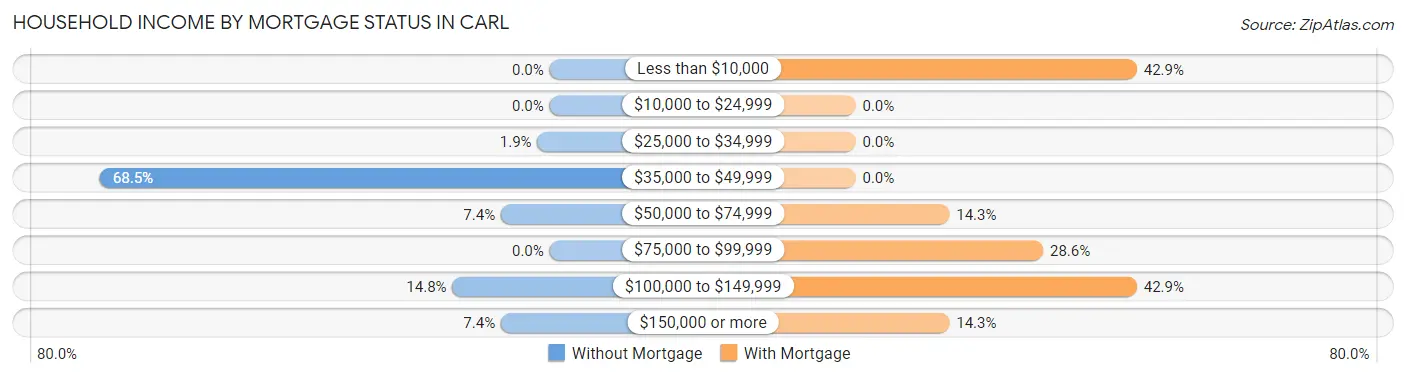
| Household Income | Without Mortgage | With Mortgage |
| Less than $10,000 | 0 (0.0%) | 6 (42.9%) |
| $10,000 to $24,999 | 0 (0.0%) | 0 (0.0%) |
| $25,000 to $34,999 | 1 (1.8%) | 0 (0.0%) |
| $35,000 to $49,999 | 37 (68.5%) | 0 (0.0%) |
| $50,000 to $74,999 | 4 (7.4%) | 2 (14.3%) |
| $75,000 to $99,999 | 0 (0.0%) | 4 (28.6%) |
| $100,000 to $149,999 | 8 (14.8%) | 6 (42.9%) |
| $150,000 or more | 4 (7.4%) | 2 (14.3%) |
| Total | 54 (100.0%) | 14 (100.0%) |
Property Value to Household Income Ratio in Carl
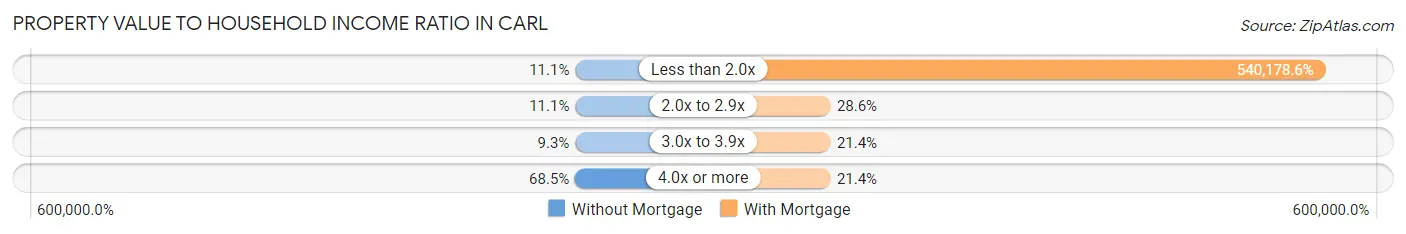
| Value-to-Income Ratio | Without Mortgage | With Mortgage |
| Less than 2.0x | 6 (11.1%) | 75,625 (540,178.6%) |
| 2.0x to 2.9x | 6 (11.1%) | 4 (28.6%) |
| 3.0x to 3.9x | 5 (9.3%) | 3 (21.4%) |
| 4.0x or more | 37 (68.5%) | 3 (21.4%) |
| Total | 54 (100.0%) | 14 (100.0%) |
Real Estate Taxes by Mortgage Status in Carl
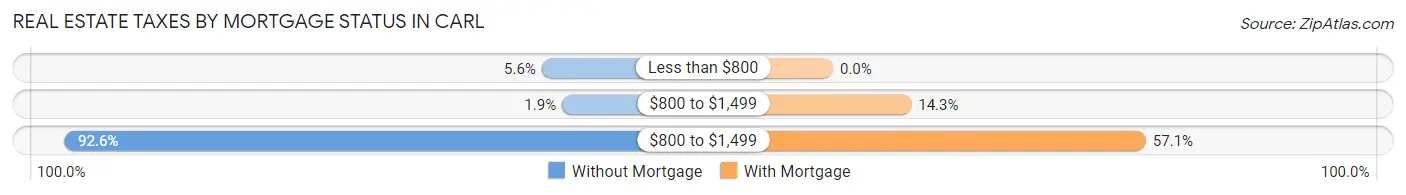
| Property Taxes | Without Mortgage | With Mortgage |
| Less than $800 | 3 (5.6%) | 0 (0.0%) |
| $800 to $1,499 | 1 (1.8%) | 2 (14.3%) |
| $800 to $1,499 | 50 (92.6%) | 8 (57.1%) |
| Total | 54 (100.0%) | 14 (100.0%) |
Health & Disability in Carl
Health Insurance Coverage by Age in Carl
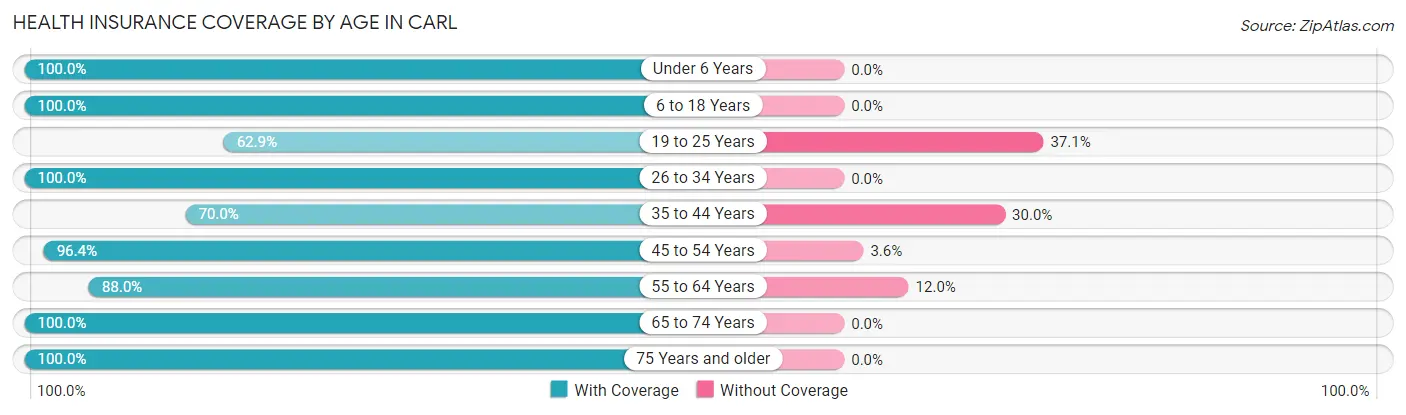
| Age Bracket | With Coverage | Without Coverage |
| Under 6 Years | 10 (100.0%) | 0 (0.0%) |
| 6 to 18 Years | 48 (100.0%) | 0 (0.0%) |
| 19 to 25 Years | 22 (62.9%) | 13 (37.1%) |
| 26 to 34 Years | 10 (100.0%) | 0 (0.0%) |
| 35 to 44 Years | 21 (70.0%) | 9 (30.0%) |
| 45 to 54 Years | 27 (96.4%) | 1 (3.6%) |
| 55 to 64 Years | 22 (88.0%) | 3 (12.0%) |
| 65 to 74 Years | 17 (100.0%) | 0 (0.0%) |
| 75 Years and older | 93 (100.0%) | 0 (0.0%) |
| Total | 270 (91.2%) | 26 (8.8%) |
Health Insurance Coverage by Citizenship Status in Carl
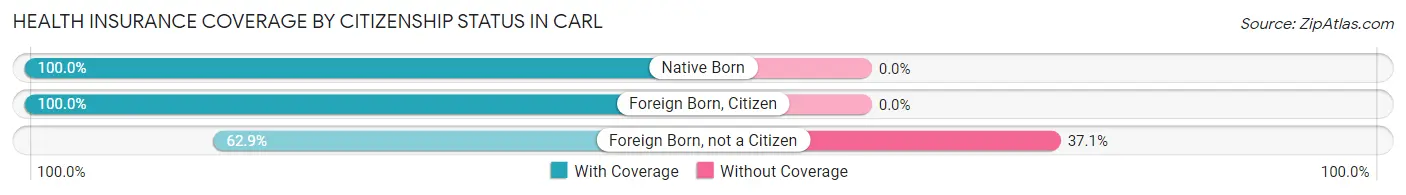
| Citizenship Status | With Coverage | Without Coverage |
| Native Born | 10 (100.0%) | 0 (0.0%) |
| Foreign Born, Citizen | 48 (100.0%) | 0 (0.0%) |
| Foreign Born, not a Citizen | 22 (62.9%) | 13 (37.1%) |
Health Insurance Coverage by Household Income in Carl
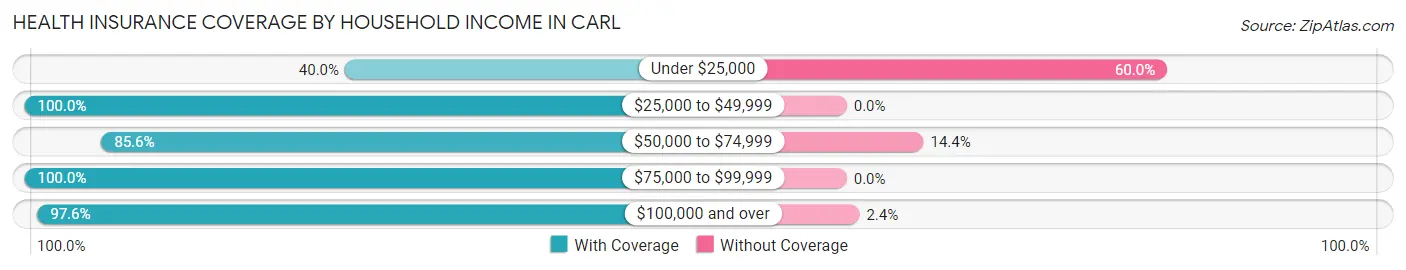
| Household Income | With Coverage | Without Coverage |
| Under $25,000 | 2 (40.0%) | 3 (60.0%) |
| $25,000 to $49,999 | 88 (100.0%) | 0 (0.0%) |
| $50,000 to $74,999 | 131 (85.6%) | 22 (14.4%) |
| $75,000 to $99,999 | 8 (100.0%) | 0 (0.0%) |
| $100,000 and over | 41 (97.6%) | 1 (2.4%) |
Public vs Private Health Insurance Coverage by Age in Carl
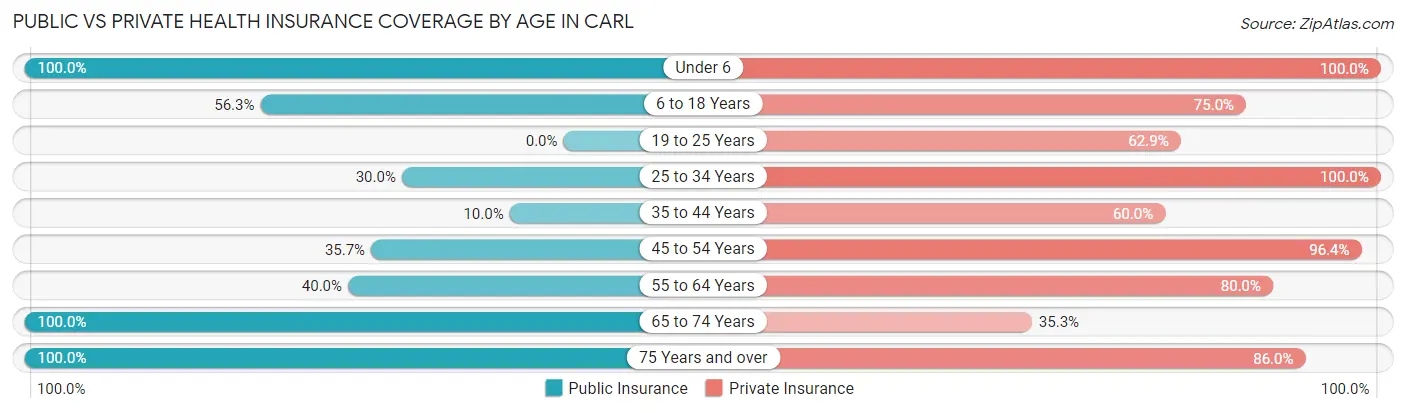
| Age Bracket | Public Insurance | Private Insurance |
| Under 6 | 10 (100.0%) | 10 (100.0%) |
| 6 to 18 Years | 27 (56.2%) | 36 (75.0%) |
| 19 to 25 Years | 0 (0.0%) | 22 (62.9%) |
| 25 to 34 Years | 3 (30.0%) | 10 (100.0%) |
| 35 to 44 Years | 3 (10.0%) | 18 (60.0%) |
| 45 to 54 Years | 10 (35.7%) | 27 (96.4%) |
| 55 to 64 Years | 10 (40.0%) | 20 (80.0%) |
| 65 to 74 Years | 17 (100.0%) | 6 (35.3%) |
| 75 Years and over | 93 (100.0%) | 80 (86.0%) |
| Total | 173 (58.5%) | 229 (77.4%) |
Disability Status by Sex by Age in Carl
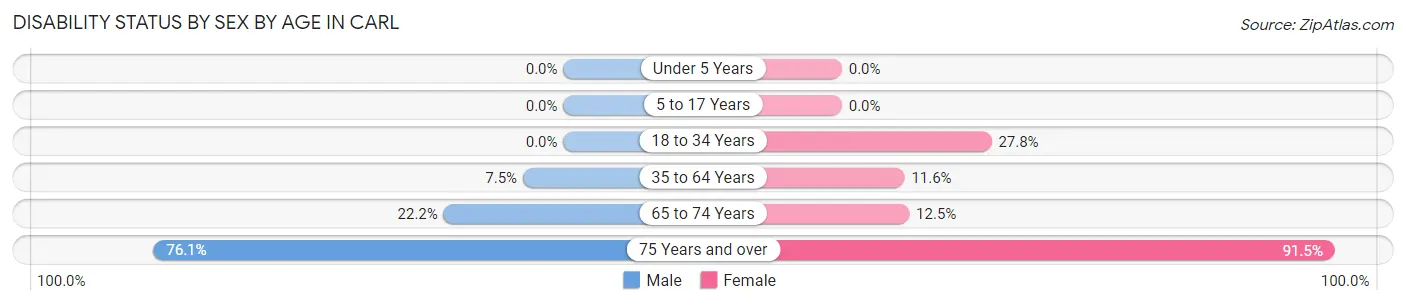
| Age Bracket | Male | Female |
| Under 5 Years | 0 (0.0%) | 0 (0.0%) |
| 5 to 17 Years | 0 (0.0%) | 0 (0.0%) |
| 18 to 34 Years | 0 (0.0%) | 5 (27.8%) |
| 35 to 64 Years | 3 (7.5%) | 5 (11.6%) |
| 65 to 74 Years | 2 (22.2%) | 1 (12.5%) |
| 75 Years and over | 35 (76.1%) | 43 (91.5%) |
Disability Class by Sex by Age in Carl
Disability Class: Hearing Difficulty
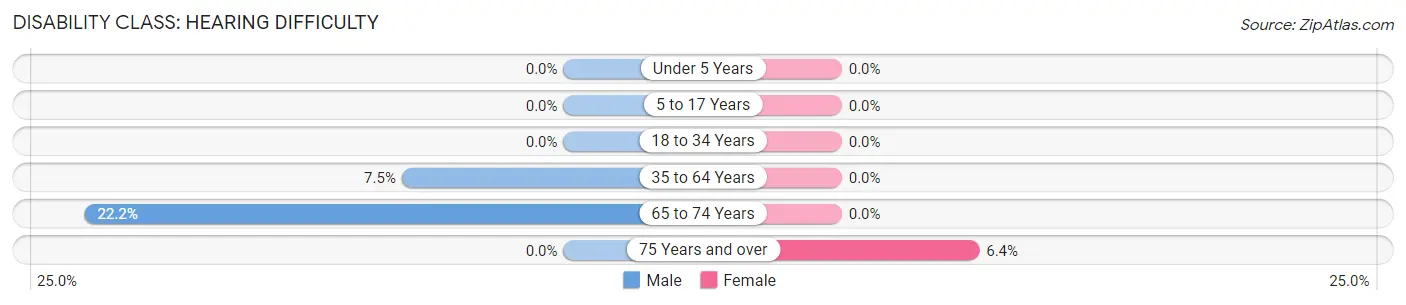
| Age Bracket | Male | Female |
| Under 5 Years | 0 (0.0%) | 0 (0.0%) |
| 5 to 17 Years | 0 (0.0%) | 0 (0.0%) |
| 18 to 34 Years | 0 (0.0%) | 0 (0.0%) |
| 35 to 64 Years | 3 (7.5%) | 0 (0.0%) |
| 65 to 74 Years | 2 (22.2%) | 0 (0.0%) |
| 75 Years and over | 0 (0.0%) | 3 (6.4%) |
Disability Class: Vision Difficulty
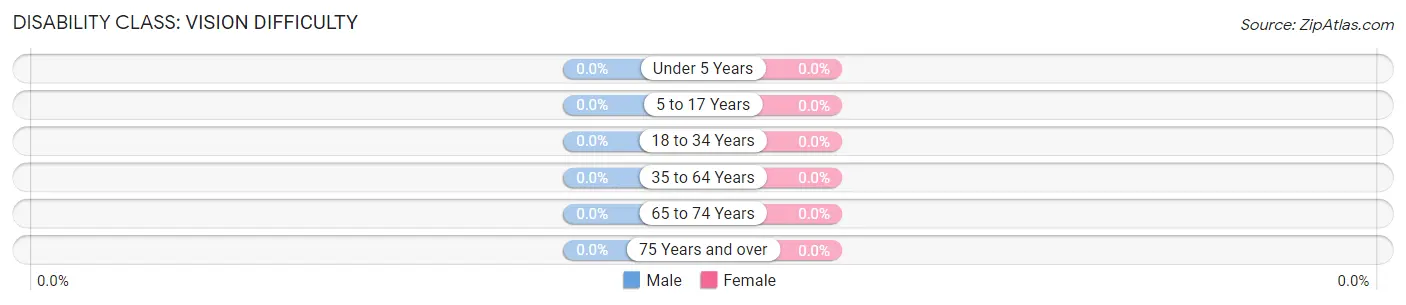
| Age Bracket | Male | Female |
| Under 5 Years | 0 (0.0%) | 0 (0.0%) |
| 5 to 17 Years | 0 (0.0%) | 0 (0.0%) |
| 18 to 34 Years | 0 (0.0%) | 0 (0.0%) |
| 35 to 64 Years | 0 (0.0%) | 0 (0.0%) |
| 65 to 74 Years | 0 (0.0%) | 0 (0.0%) |
| 75 Years and over | 0 (0.0%) | 0 (0.0%) |
Disability Class: Cognitive Difficulty
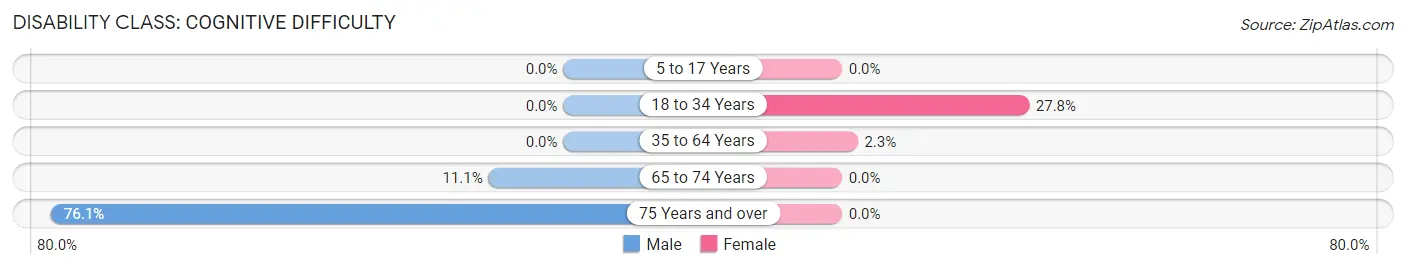
| Age Bracket | Male | Female |
| 5 to 17 Years | 0 (0.0%) | 0 (0.0%) |
| 18 to 34 Years | 0 (0.0%) | 5 (27.8%) |
| 35 to 64 Years | 0 (0.0%) | 1 (2.3%) |
| 65 to 74 Years | 1 (11.1%) | 0 (0.0%) |
| 75 Years and over | 35 (76.1%) | 0 (0.0%) |
Disability Class: Ambulatory Difficulty
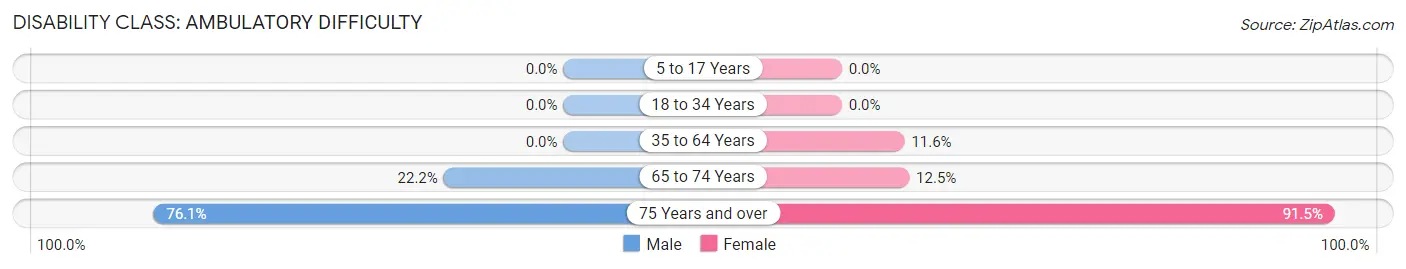
| Age Bracket | Male | Female |
| 5 to 17 Years | 0 (0.0%) | 0 (0.0%) |
| 18 to 34 Years | 0 (0.0%) | 0 (0.0%) |
| 35 to 64 Years | 0 (0.0%) | 5 (11.6%) |
| 65 to 74 Years | 2 (22.2%) | 1 (12.5%) |
| 75 Years and over | 35 (76.1%) | 43 (91.5%) |
Disability Class: Self-Care Difficulty
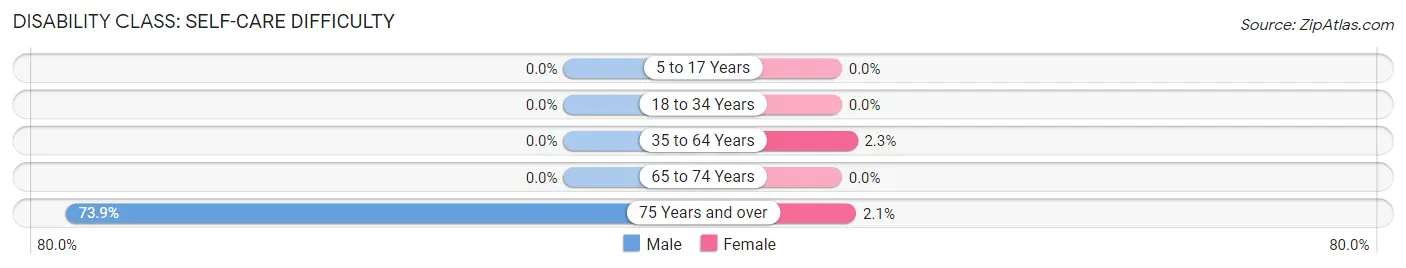
| Age Bracket | Male | Female |
| 5 to 17 Years | 0 (0.0%) | 0 (0.0%) |
| 18 to 34 Years | 0 (0.0%) | 0 (0.0%) |
| 35 to 64 Years | 0 (0.0%) | 1 (2.3%) |
| 65 to 74 Years | 0 (0.0%) | 0 (0.0%) |
| 75 Years and over | 34 (73.9%) | 1 (2.1%) |
Technology Access in Carl
Computing Device Access in Carl
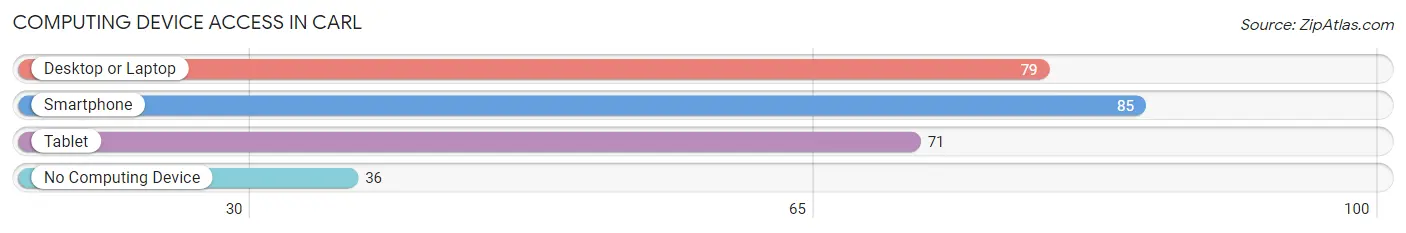
| Device Type | # Households | % Households |
| Desktop or Laptop | 79 | 65.3% |
| Smartphone | 85 | 70.3% |
| Tablet | 71 | 58.7% |
| No Computing Device | 36 | 29.7% |
| Total | 121 | 100.0% |
Internet Access in Carl
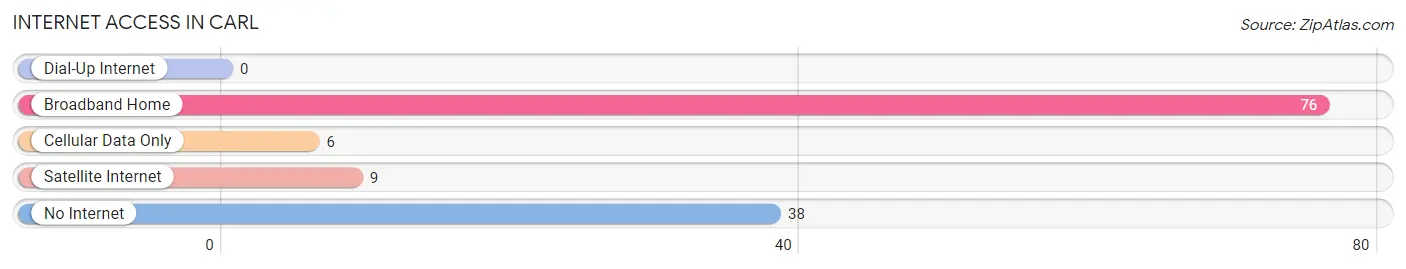
| Internet Type | # Households | % Households |
| Dial-Up Internet | 0 | 0.0% |
| Broadband Home | 76 | 62.8% |
| Cellular Data Only | 6 | 5.0% |
| Satellite Internet | 9 | 7.4% |
| No Internet | 38 | 31.4% |
| Total | 121 | 100.0% |
Carl Summary
Georgia is a state located in the southeastern United States. It is bordered by Tennessee to the north, North Carolina to the northeast, South Carolina to the southeast, and Alabama to the west. Georgia is the 24th largest state in the United States, with an area of 59,441 square miles. It is the 8th most populous state in the country, with a population of 10,617,423 as of 2019.
History
The area that is now Georgia was first inhabited by Native American tribes, including the Creek, Cherokee, and Choctaw. The first Europeans to explore the area were Spanish explorers in the 16th century. In 1732, the British established the colony of Georgia, which was named after King George II. The colony was established as a buffer between the British colonies in the north and the Spanish colonies in the south.
The American Revolution began in 1775, and Georgia declared its independence from Britain in 1776. Georgia was one of the original 13 colonies that formed the United States of America. In 1788, Georgia became the fourth state to ratify the United States Constitution.
During the 19th century, Georgia was a major cotton producer, and the state’s economy was heavily dependent on slavery. After the Civil War, Georgia was the last Confederate state to be readmitted to the Union in 1870.
In the 20th century, Georgia experienced rapid economic growth, fueled by the development of the cotton, tobacco, and timber industries. The state also experienced a population boom, as people moved to the state for jobs in the growing industries.
Geography
Georgia is located in the southeastern United States, and is bordered by Tennessee to the north, North Carolina to the northeast, South Carolina to the southeast, and Alabama to the west. The state has a total area of 59,441 square miles, making it the 24th largest state in the country.
The state is divided into three distinct geographic regions: the Appalachian Mountains in the north, the Piedmont Plateau in the middle, and the Coastal Plain in the south. The highest point in the state is Brasstown Bald, which has an elevation of 4,784 feet. The state’s lowest point is sea level, along the Atlantic Ocean.
Economy
Georgia’s economy is largely driven by the service industry, which accounts for about 80% of the state’s GDP. The state’s largest industries include tourism, finance, insurance, real estate, and government.
Agriculture is also an important part of the state’s economy. Georgia is the leading producer of peanuts, pecans, and peaches in the United States. Other important agricultural products include cotton, corn, soybeans, and tobacco.
Demographics
As of 2019, Georgia had a population of 10,617,423, making it the 8th most populous state in the country. The state’s population is diverse, with a majority of the population being white (60.7%), followed by African American (31.5%), Hispanic or Latino (7.9%), and Asian (3.2%).
The median household income in Georgia is $54,822, and the median home value is $179,400. The state’s poverty rate is 14.3%, and the unemployment rate is 3.7%.
Conclusion
Georgia is a state located in the southeastern United States. It has a rich history, diverse geography, and a thriving economy. The state is home to a diverse population, with a majority of the population being white. The state’s economy is largely driven by the service industry, and agriculture is also an important part of the state’s economy. Georgia is a vibrant and diverse state, and it is an important part of the United States.
Common Questions
What is the Total Population of Carl?
Total Population of Carl is 296.
What is the Total Male Population of Carl?
Total Male Population of Carl is 138.
What is the Total Female Population of Carl?
Total Female Population of Carl is 158.
What is the Ratio of Males per 100 Females in Carl?
There are 87.34 Males per 100 Females in Carl.
What is the Ratio of Females per 100 Males in Carl?
There are 114.49 Females per 100 Males in Carl.
What is the Median Population Age in Carl?
Median Population Age in Carl is 47.8 Years.
What is the Average Family Size in Carl
Average Family Size in Carl is 2.9 People.
What is the Average Household Size in Carl
Average Household Size in Carl is 2.5 People.
What is Per Capita Income in Carl?
Per Capita income in Carl is $26,871.
What is the Median Family Income in Carl?
Median Family Income in Carl is $57,917.
What is the Median Household income in Carl?
Median Household Income in Carl is $55,982.
What is Income or Wage Gap in Carl?
Income or Wage Gap in Carl is 37.6%.
Women in Carl earn 62.4 cents for every dollar earned by a man.
What is Inequality or Gini Index in Carl?
Inequality or Gini Index in Carl is 0.29.
How Large is the Labor Force in Carl?
There are 115 People in the Labor Forcein in Carl.
What is the Percentage of People in the Labor Force in Carl?
42.8% of People are in the Labor Force in Carl.
What is the Unemployment Rate in Carl?
Unemployment Rate in Carl is 4.3%.