Cities with the Highest Percentage of Immigrants from Panama in Georgia
RELATED REPORTS & OPTIONS
Panama
Georgia
Compare Cities
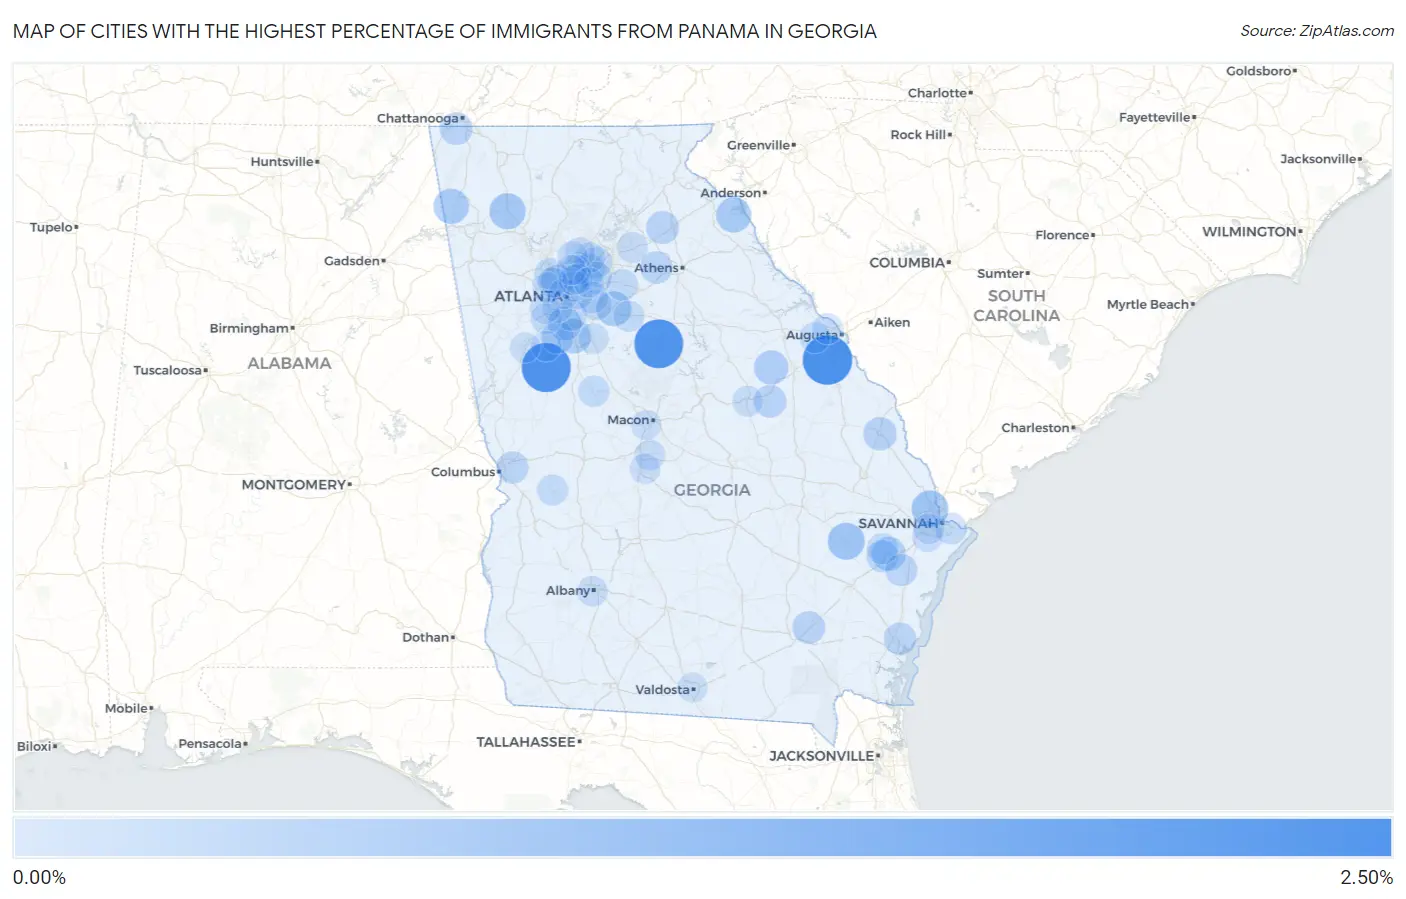
Map of Cities with the Highest Percentage of Immigrants from Panama in Georgia
0.00%
2.50%
Cities with the Highest Percentage of Immigrants from Panama in Georgia
| City | Panama | vs State | vs National | |
| 1. | Hephzibah | 2.17% | 0.047%(+2.12)#-1 | 0.032%(+2.14)#0 |
| 2. | Haralson | 2.12% | 0.047%(+2.07)#0 | 0.032%(+2.09)#1 |
| 3. | Shady Dale | 2.08% | 0.047%(+2.04)#1 | 0.032%(+2.05)#2 |
| 4. | Bemiss | 2.03% | 0.047%(+1.99)#2 | 0.032%(+2.00)#3 |
| 5. | Glennville | 0.73% | 0.047%(+0.683)#3 | 0.032%(+0.698)#4 |
| 6. | Port Wentworth | 0.70% | 0.047%(+0.656)#4 | 0.032%(+0.671)#5 |
| 7. | Adairsville | 0.63% | 0.047%(+0.584)#5 | 0.032%(+0.599)#6 |
| 8. | Lyerly | 0.55% | 0.047%(+0.501)#6 | 0.032%(+0.516)#7 |
| 9. | Hartwell | 0.54% | 0.047%(+0.489)#7 | 0.032%(+0.504)#8 |
| 10. | Conyers | 0.51% | 0.047%(+0.464)#8 | 0.032%(+0.479)#44 |
| 11. | Bonanza | 0.47% | 0.047%(+0.420)#9 | 0.032%(+0.435)#45 |
| 12. | Gibson | 0.45% | 0.047%(+0.399)#10 | 0.032%(+0.414)#46 |
| 13. | Flemington | 0.42% | 0.047%(+0.369)#11 | 0.032%(+0.384)#47 |
| 14. | Riverdale | 0.37% | 0.047%(+0.321)#12 | 0.032%(+0.337)#48 |
| 15. | Sylvania | 0.34% | 0.047%(+0.297)#13 | 0.032%(+0.312)#49 |
| 16. | Vinings | 0.32% | 0.047%(+0.270)#14 | 0.032%(+0.285)#50 |
| 17. | Maysville | 0.30% | 0.047%(+0.253)#15 | 0.032%(+0.269)#51 |
| 18. | Blackshear | 0.28% | 0.047%(+0.237)#16 | 0.032%(+0.252)#52 |
| 19. | Lookout Mountain | 0.28% | 0.047%(+0.232)#17 | 0.032%(+0.247)#53 |
| 20. | Davisboro | 0.27% | 0.047%(+0.226)#18 | 0.032%(+0.241)#54 |
| 21. | Norcross | 0.26% | 0.047%(+0.216)#19 | 0.032%(+0.231)#55 |
| 22. | Statham | 0.25% | 0.047%(+0.201)#20 | 0.032%(+0.216)#56 |
| 23. | Country Club Estates | 0.24% | 0.047%(+0.196)#21 | 0.032%(+0.211)#57 |
| 24. | Fayetteville | 0.24% | 0.047%(+0.190)#22 | 0.032%(+0.205)#116 |
| 25. | Hinesville | 0.22% | 0.047%(+0.178)#23 | 0.032%(+0.193)#117 |
| 26. | Columbus | 0.22% | 0.047%(+0.178)#24 | 0.032%(+0.193)#118 |
| 27. | Riceboro | 0.21% | 0.047%(+0.160)#25 | 0.032%(+0.175)#119 |
| 28. | Duluth | 0.20% | 0.047%(+0.152)#26 | 0.032%(+0.167)#120 |
| 29. | Loganville | 0.15% | 0.047%(+0.107)#27 | 0.032%(+0.122)#121 |
| 30. | Lilburn | 0.14% | 0.047%(+0.096)#28 | 0.032%(+0.111)#122 |
| 31. | Forest Park | 0.14% | 0.047%(+0.091)#29 | 0.032%(+0.106)#123 |
| 32. | Fair Oaks | 0.14% | 0.047%(+0.088)#30 | 0.032%(+0.103)#124 |
| 33. | Whitemarsh Island | 0.13% | 0.047%(+0.086)#31 | 0.032%(+0.101)#125 |
| 34. | Augusta-Richmond County Consolidated Government (Balance) | 0.13% | 0.047%(+0.084)#32 | 0.032%(+0.099)#219 |
| 35. | Barnesville | 0.13% | 0.047%(+0.082)#33 | 0.032%(+0.097)#220 |
| 36. | Fort Stewart | 0.12% | 0.047%(+0.071)#34 | 0.032%(+0.086)#221 |
| 37. | Covington | 0.11% | 0.047%(+0.059)#35 | 0.032%(+0.074)#222 |
| 38. | Redan | 0.11% | 0.047%(+0.058)#36 | 0.032%(+0.074)#223 |
| 39. | Buena Vista | 0.10% | 0.047%(+0.055)#37 | 0.032%(+0.070)#224 |
| 40. | Grovetown | 0.093% | 0.047%(+0.047)#38 | 0.032%(+0.062)#225 |
| 41. | Union City | 0.093% | 0.047%(+0.046)#39 | 0.032%(+0.061)#226 |
| 42. | Braselton | 0.087% | 0.047%(+0.040)#40 | 0.032%(+0.055)#227 |
| 43. | Georgetown | 0.080% | 0.047%(+0.033)#41 | 0.032%(+0.048)#228 |
| 44. | Stonecrest | 0.079% | 0.047%(+0.032)#42 | 0.032%(+0.047)#229 |
| 45. | Decatur | 0.074% | 0.047%(+0.027)#43 | 0.032%(+0.042)#230 |
| 46. | Sandersville | 0.070% | 0.047%(+0.023)#44 | 0.032%(+0.038)#231 |
| 47. | Albany | 0.064% | 0.047%(+0.017)#45 | 0.032%(+0.032)#232 |
| 48. | Warner Robins | 0.062% | 0.047%(+0.015)#46 | 0.032%(+0.030)#233 |
| 49. | Martinez | 0.062% | 0.047%(+0.015)#47 | 0.032%(+0.030)#234 |
| 50. | North Druid Hills | 0.058% | 0.047%(+0.011)#48 | 0.032%(+0.026)#235 |
| 51. | Savannah | 0.050% | 0.047%(+0.003)#49 | 0.032%(+0.018)#236 |
| 52. | Peachtree City | 0.044% | 0.047%(-0.003)#50 | 0.032%(+0.012)#237 |
| 53. | Macon Bibb County | 0.040% | 0.047%(-0.007)#51 | 0.032%(+0.008)#238 |
| 54. | Athens-Clarke County Unified Government (Balance) | 0.038% | 0.047%(-0.009)#52 | 0.032%(+0.006)#239 |
| 55. | Perry | 0.038% | 0.047%(-0.009)#53 | 0.032%(+0.006)#240 |
| 56. | East Point | 0.031% | 0.047%(-0.015)#54 | 0.032%(-0.000)#241 |
| 57. | Mableton | 0.031% | 0.047%(-0.016)#55 | 0.032%(-0.001)#242 |
| 58. | Atlanta | 0.030% | 0.047%(-0.017)#56 | 0.032%(-0.002)#245 |
| 59. | Newnan | 0.026% | 0.047%(-0.021)#57 | 0.032%(-0.006)#246 |
| 60. | Mcdonough | 0.024% | 0.047%(-0.023)#58 | 0.032%(-0.008)#247 |
| 61. | South Fulton | 0.022% | 0.047%(-0.025)#59 | 0.032%(-0.010)#248 |
| 62. | Johns Creek | 0.022% | 0.047%(-0.025)#60 | 0.032%(-0.010)#249 |
| 63. | Alpharetta | 0.020% | 0.047%(-0.027)#61 | 0.032%(-0.012)#250 |
| 64. | Dunwoody | 0.019% | 0.047%(-0.027)#62 | 0.032%(-0.012)#251 |
| 65. | Roswell | 0.019% | 0.047%(-0.027)#63 | 0.032%(-0.012)#252 |
| 66. | Brookhaven | 0.019% | 0.047%(-0.027)#64 | 0.032%(-0.012)#253 |
| 67. | Chamblee | 0.017% | 0.047%(-0.030)#65 | 0.032%(-0.015)#254 |
| 68. | Sandy Springs | 0.011% | 0.047%(-0.036)#66 | 0.032%(-0.021)#255 |
| 69. | Smyrna | 0.011% | 0.047%(-0.036)#67 | 0.032%(-0.021)#256 |
| 70. | Valdosta | 0.0072% | 0.047%(-0.040)#68 | 0.032%(-0.025)#257 |
| 71. | Tucker | 0.0054% | 0.047%(-0.041)#69 | 0.032%(-0.026)#258 |
Common Questions
What are the Top 10 Cities with the Highest Percentage of Immigrants from Panama in Georgia?
Top 10 Cities with the Highest Percentage of Immigrants from Panama in Georgia are:
#1
2.17%
#2
2.12%
#3
2.08%
#4
0.73%
#5
0.70%
#6
0.63%
#7
0.55%
#8
0.54%
#9
0.51%
#10
0.47%
What city has the Highest Percentage of Immigrants from Panama in Georgia?
Hephzibah has the Highest Percentage of Immigrants from Panama in Georgia with 2.17%.
What is the Percentage of Immigrants from Panama in the State of Georgia?
Percentage of Immigrants from Panama in Georgia is 0.047%.
What is the Percentage of Immigrants from Panama in the United States?
Percentage of Immigrants from Panama in the United States is 0.032%.