Cities with the Most Immigrants from Eastern Europe in Georgia
RELATED REPORTS & OPTIONS
Eastern Europe
Georgia
Compare Cities
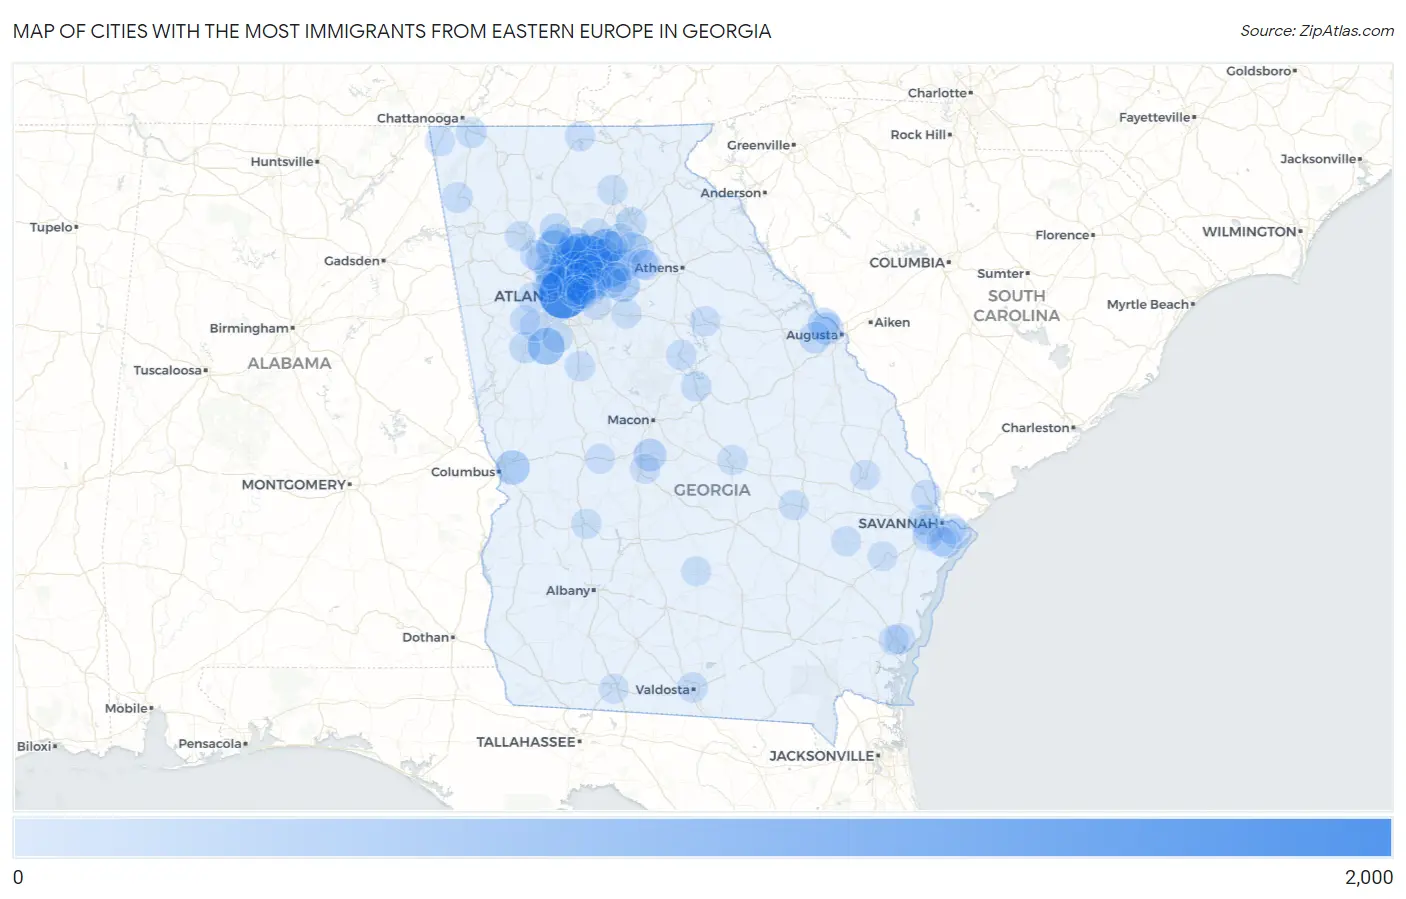
Map of Cities with the Most Immigrants from Eastern Europe in Georgia
0
2,000
Cities with the Most Immigrants from Eastern Europe in Georgia
| City | Eastern Europe | vs State | vs National | |
| 1. | Atlanta | 1,513 | 34,642(4.37%)#1 | 2,208,794(0.07%)#182 |
| 2. | Sandy Springs | 1,052 | 34,642(3.04%)#2 | 2,208,794(0.05%)#279 |
| 3. | Johns Creek | 1,022 | 34,642(2.95%)#3 | 2,208,794(0.05%)#296 |
| 4. | Brookhaven | 793 | 34,642(2.29%)#4 | 2,208,794(0.04%)#401 |
| 5. | Roswell | 742 | 34,642(2.14%)#5 | 2,208,794(0.03%)#424 |
| 6. | Alpharetta | 637 | 34,642(1.84%)#6 | 2,208,794(0.03%)#489 |
| 7. | Dunwoody | 545 | 34,642(1.57%)#7 | 2,208,794(0.02%)#569 |
| 8. | Sugar Hill | 518 | 34,642(1.50%)#8 | 2,208,794(0.02%)#600 |
| 9. | Peachtree City | 504 | 34,642(1.45%)#9 | 2,208,794(0.02%)#619 |
| 10. | Lawrenceville | 502 | 34,642(1.45%)#10 | 2,208,794(0.02%)#622 |
| 11. | Woodstock | 352 | 34,642(1.02%)#11 | 2,208,794(0.02%)#860 |
| 12. | Loganville | 332 | 34,642(0.96%)#12 | 2,208,794(0.02%)#906 |
| 13. | Tucker | 325 | 34,642(0.94%)#13 | 2,208,794(0.01%)#931 |
| 14. | Columbus | 324 | 34,642(0.94%)#14 | 2,208,794(0.01%)#933 |
| 15. | Duluth | 284 | 34,642(0.82%)#15 | 2,208,794(0.01%)#1,062 |
| 16. | Athens-Clarke County Unified Government (Balance) | 249 | 34,642(0.72%)#16 | 2,208,794(0.01%)#1,184 |
| 17. | Suwanee | 225 | 34,642(0.65%)#17 | 2,208,794(0.01%)#1,293 |
| 18. | Warner Robins | 211 | 34,642(0.61%)#18 | 2,208,794(0.01%)#1,364 |
| 19. | Dacula | 203 | 34,642(0.59%)#19 | 2,208,794(0.01%)#1,408 |
| 20. | Smyrna | 200 | 34,642(0.58%)#20 | 2,208,794(0.01%)#1,420 |
| 21. | Milton | 198 | 34,642(0.57%)#21 | 2,208,794(0.01%)#1,438 |
| 22. | Peachtree Corners | 191 | 34,642(0.55%)#22 | 2,208,794(0.01%)#1,464 |
| 23. | Martinez | 176 | 34,642(0.51%)#23 | 2,208,794(0.01%)#1,547 |
| 24. | Holly Springs | 174 | 34,642(0.50%)#24 | 2,208,794(0.01%)#1,560 |
| 25. | Augusta-Richmond County Consolidated Government (Balance) | 158 | 34,642(0.46%)#25 | 2,208,794(0.01%)#1,673 |
| 26. | Evans | 153 | 34,642(0.44%)#26 | 2,208,794(0.01%)#1,721 |
| 27. | North Druid Hills | 139 | 34,642(0.40%)#27 | 2,208,794(0.01%)#1,869 |
| 28. | Lilburn | 129 | 34,642(0.37%)#28 | 2,208,794(0.01%)#1,954 |
| 29. | Grovetown | 127 | 34,642(0.37%)#29 | 2,208,794(0.01%)#1,969 |
| 30. | Newnan | 111 | 34,642(0.32%)#30 | 2,208,794(0.01%)#2,151 |
| 31. | Chamblee | 105 | 34,642(0.30%)#31 | 2,208,794(0.00%)#2,239 |
| 32. | Snellville | 105 | 34,642(0.30%)#32 | 2,208,794(0.00%)#2,244 |
| 33. | Skidaway Island | 104 | 34,642(0.30%)#33 | 2,208,794(0.00%)#2,256 |
| 34. | Savannah | 88 | 34,642(0.25%)#34 | 2,208,794(0.00%)#2,481 |
| 35. | Gainesville | 84 | 34,642(0.24%)#35 | 2,208,794(0.00%)#2,550 |
| 36. | Fort Oglethorpe | 84 | 34,642(0.24%)#36 | 2,208,794(0.00%)#2,556 |
| 37. | Cumming | 83 | 34,642(0.24%)#37 | 2,208,794(0.00%)#2,590 |
| 38. | Marietta | 82 | 34,642(0.24%)#38 | 2,208,794(0.00%)#2,598 |
| 39. | Canton | 80 | 34,642(0.23%)#39 | 2,208,794(0.00%)#2,631 |
| 40. | North Decatur | 78 | 34,642(0.23%)#40 | 2,208,794(0.00%)#2,679 |
| 41. | Decatur | 71 | 34,642(0.20%)#41 | 2,208,794(0.00%)#2,820 |
| 42. | Vinings | 66 | 34,642(0.19%)#42 | 2,208,794(0.00%)#2,933 |
| 43. | Flowery Branch | 64 | 34,642(0.18%)#43 | 2,208,794(0.00%)#2,968 |
| 44. | Mountain Park | 63 | 34,642(0.18%)#44 | 2,208,794(0.00%)#2,991 |
| 45. | Fair Oaks | 63 | 34,642(0.18%)#45 | 2,208,794(0.00%)#2,995 |
| 46. | Hoschton | 62 | 34,642(0.18%)#46 | 2,208,794(0.00%)#3,019 |
| 47. | Summerville | 59 | 34,642(0.17%)#47 | 2,208,794(0.00%)#3,097 |
| 48. | Wilmington Island | 52 | 34,642(0.15%)#48 | 2,208,794(0.00%)#3,289 |
| 49. | Eatonton | 52 | 34,642(0.15%)#49 | 2,208,794(0.00%)#3,298 |
| 50. | Pooler | 51 | 34,642(0.15%)#50 | 2,208,794(0.00%)#3,315 |
| 51. | Braselton | 51 | 34,642(0.15%)#51 | 2,208,794(0.00%)#3,327 |
| 52. | Kennesaw | 50 | 34,642(0.14%)#52 | 2,208,794(0.00%)#3,351 |
| 53. | Winder | 50 | 34,642(0.14%)#53 | 2,208,794(0.00%)#3,356 |
| 54. | Palmetto | 49 | 34,642(0.14%)#54 | 2,208,794(0.00%)#3,408 |
| 55. | Valdosta | 48 | 34,642(0.14%)#55 | 2,208,794(0.00%)#3,417 |
| 56. | Fayetteville | 48 | 34,642(0.14%)#56 | 2,208,794(0.00%)#3,426 |
| 57. | Doraville | 45 | 34,642(0.13%)#57 | 2,208,794(0.00%)#3,536 |
| 58. | Buford | 44 | 34,642(0.13%)#58 | 2,208,794(0.00%)#3,567 |
| 59. | Milledgeville | 43 | 34,642(0.12%)#59 | 2,208,794(0.00%)#3,617 |
| 60. | Stone Mountain | 43 | 34,642(0.12%)#60 | 2,208,794(0.00%)#3,630 |
| 61. | Country Club Estates | 41 | 34,642(0.12%)#61 | 2,208,794(0.00%)#3,709 |
| 62. | Griffin | 38 | 34,642(0.11%)#62 | 2,208,794(0.00%)#3,827 |
| 63. | Rincon | 38 | 34,642(0.11%)#63 | 2,208,794(0.00%)#3,835 |
| 64. | Cusseta Chattahoochee County Unified Government | 38 | 34,642(0.11%)#64 | 2,208,794(0.00%)#3,840 |
| 65. | Belvedere Park | 37 | 34,642(0.11%)#65 | 2,208,794(0.00%)#3,873 |
| 66. | Russell | 37 | 34,642(0.11%)#66 | 2,208,794(0.00%)#3,908 |
| 67. | East Point | 34 | 34,642(0.10%)#67 | 2,208,794(0.00%)#3,995 |
| 68. | Acworth | 33 | 34,642(0.10%)#68 | 2,208,794(0.00%)#4,047 |
| 69. | Mineral Bluff | 33 | 34,642(0.10%)#69 | 2,208,794(0.00%)#4,095 |
| 70. | Dahlonega | 32 | 34,642(0.09%)#70 | 2,208,794(0.00%)#4,124 |
| 71. | Whitemarsh Island | 32 | 34,642(0.09%)#71 | 2,208,794(0.00%)#4,125 |
| 72. | Norcross | 31 | 34,642(0.09%)#72 | 2,208,794(0.00%)#4,159 |
| 73. | Druid Hills | 30 | 34,642(0.09%)#73 | 2,208,794(0.00%)#4,231 |
| 74. | Berry College | 30 | 34,642(0.09%)#74 | 2,208,794(0.00%)#4,257 |
| 75. | Scottdale | 27 | 34,642(0.08%)#75 | 2,208,794(0.00%)#4,390 |
| 76. | Dublin | 26 | 34,642(0.08%)#76 | 2,208,794(0.00%)#4,440 |
| 77. | Mableton | 25 | 34,642(0.07%)#77 | 2,208,794(0.00%)#4,499 |
| 78. | Grayson | 24 | 34,642(0.07%)#78 | 2,208,794(0.00%)#4,618 |
| 79. | Vidalia | 21 | 34,642(0.06%)#79 | 2,208,794(0.00%)#4,816 |
| 80. | Douglasville | 20 | 34,642(0.06%)#80 | 2,208,794(0.00%)#4,889 |
| 81. | Dock Junction | 20 | 34,642(0.06%)#81 | 2,208,794(0.00%)#4,905 |
| 82. | Greensboro | 20 | 34,642(0.06%)#82 | 2,208,794(0.00%)#4,924 |
| 83. | Avondale Estates | 20 | 34,642(0.06%)#83 | 2,208,794(0.00%)#4,925 |
| 84. | Statesboro | 19 | 34,642(0.05%)#84 | 2,208,794(0.00%)#4,962 |
| 85. | Stonecrest | 18 | 34,642(0.05%)#85 | 2,208,794(0.00%)#5,055 |
| 86. | Glennville | 18 | 34,642(0.05%)#86 | 2,208,794(0.00%)#5,110 |
| 87. | Perry | 17 | 34,642(0.05%)#87 | 2,208,794(0.00%)#5,178 |
| 88. | Fairfield Plantation | 17 | 34,642(0.05%)#88 | 2,208,794(0.00%)#5,204 |
| 89. | Chattahoochee Hills | 17 | 34,642(0.05%)#89 | 2,208,794(0.00%)#5,227 |
| 90. | Cataula | 17 | 34,642(0.05%)#90 | 2,208,794(0.00%)#5,251 |
| 91. | Cartersville | 16 | 34,642(0.05%)#91 | 2,208,794(0.00%)#5,287 |
| 92. | Americus | 14 | 34,642(0.04%)#92 | 2,208,794(0.00%)#5,528 |
| 93. | Georgetown | 14 | 34,642(0.04%)#93 | 2,208,794(0.00%)#5,539 |
| 94. | Trenton | 14 | 34,642(0.04%)#94 | 2,208,794(0.00%)#5,611 |
| 95. | Oxford | 14 | 34,642(0.04%)#95 | 2,208,794(0.00%)#5,613 |
| 96. | Fitzgerald | 13 | 34,642(0.04%)#96 | 2,208,794(0.00%)#5,690 |
| 97. | Reynolds | 13 | 34,642(0.04%)#97 | 2,208,794(0.00%)#5,777 |
| 98. | Thomasville | 12 | 34,642(0.03%)#98 | 2,208,794(0.00%)#5,797 |
| 99. | Montgomery | 12 | 34,642(0.03%)#99 | 2,208,794(0.00%)#5,841 |
| 100. | Hinesville | 11 | 34,642(0.03%)#100 | 2,208,794(0.00%)#5,923 |
Common Questions
What are the Top 10 Cities with the Most Immigrants from Eastern Europe in Georgia?
Top 10 Cities with the Most Immigrants from Eastern Europe in Georgia are:
#1
1,513
#2
1,052
#3
1,022
#4
793
#5
742
#6
637
#7
545
#8
518
#9
504
#10
502
What city has the Most Immigrants from Eastern Europe in Georgia?
Atlanta has the Most Immigrants from Eastern Europe in Georgia with 1,513.
What is the Total Immigrants from Eastern Europe in the State of Georgia?
Total Immigrants from Eastern Europe in Georgia is 34,642.
What is the Total Immigrants from Eastern Europe in the United States?
Total Immigrants from Eastern Europe in the United States is 2,208,794.