Smyrna, GA
Smyrna Map
Smyrna Overview
55,863
TOTAL POPULATION
26,731
MALE POPULATION
29,132
FEMALE POPULATION
91.76
MALES / 100 FEMALES
108.98
FEMALES / 100 MALES
35.6
MEDIAN AGE
3.0
AVG FAMILY SIZE
2.2
AVG HOUSEHOLD SIZE
$59,851
PER CAPITA INCOME
$125,741
AVG FAMILY INCOME
$92,258
AVG HOUSEHOLD INCOME
16.3%
WAGE / INCOME GAP [ % ]
83.7¢/ $1
WAGE / INCOME GAP [ $ ]
$10,273
FAMILY INCOME DEFICIT
0.47
INEQUALITY / GINI INDEX
34,890
LABOR FORCE [ PEOPLE ]
78.4%
PERCENT IN LABOR FORCE
4.2%
UNEMPLOYMENT RATE
Smyrna Area Codes
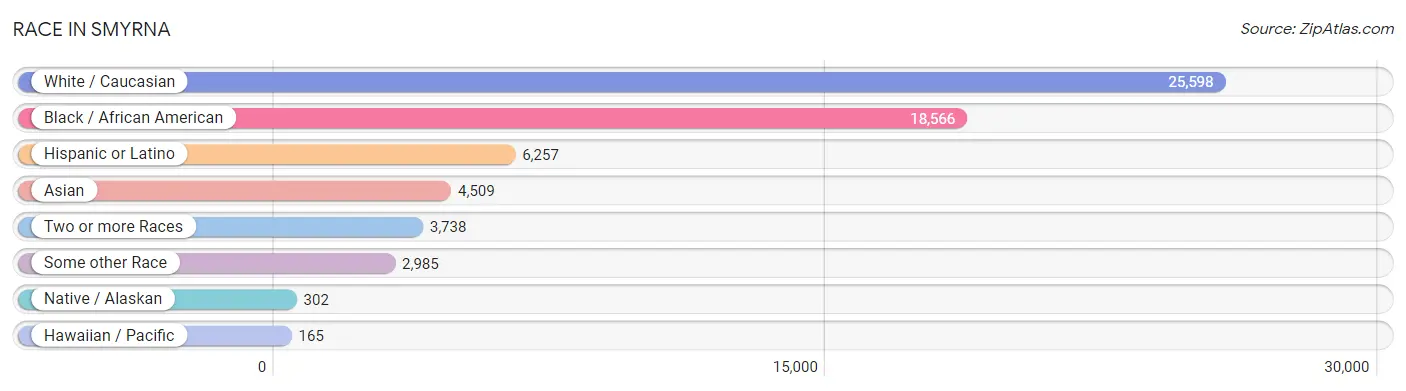
Race in Smyrna
The most populous races in Smyrna are White / Caucasian (25,598 | 45.8%), Black / African American (18,566 | 33.2%), and Hispanic or Latino (6,257 | 11.2%).
| Race | # Population | % Population |
| Asian | 4,509 | 8.1% |
| Black / African American | 18,566 | 33.2% |
| Hawaiian / Pacific | 165 | 0.3% |
| Hispanic or Latino | 6,257 | 11.2% |
| Native / Alaskan | 302 | 0.5% |
| White / Caucasian | 25,598 | 45.8% |
| Two or more Races | 3,738 | 6.7% |
| Some other Race | 2,985 | 5.3% |
| Total | 55,863 | 100.0% |
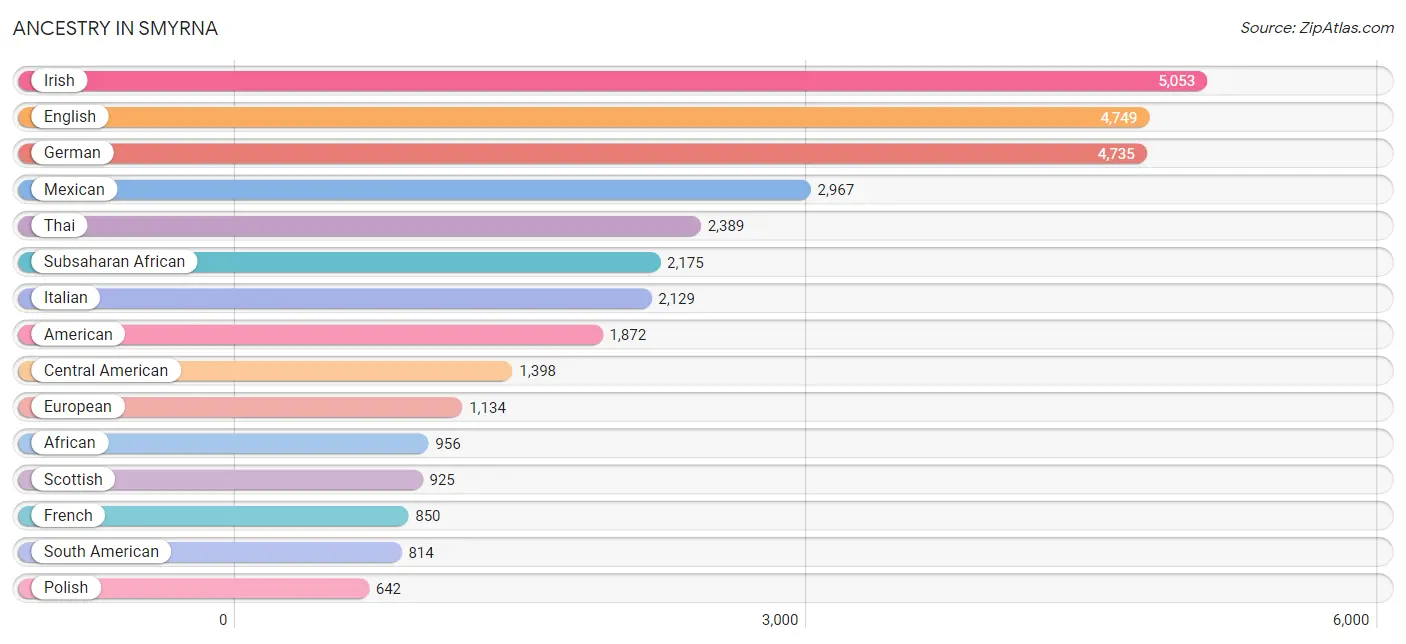
Ancestry in Smyrna
The most populous ancestries reported in Smyrna are Irish (5,053 | 9.0%), English (4,749 | 8.5%), German (4,735 | 8.5%), Mexican (2,967 | 5.3%), and Thai (2,389 | 4.3%), together accounting for 35.6% of all Smyrna residents.
| Ancestry | # Population | % Population |
| African | 956 | 1.7% |
| American | 1,872 | 3.4% |
| Apache | 27 | 0.1% |
| Arab | 145 | 0.3% |
| Argentinean | 24 | 0.0% |
| Armenian | 49 | 0.1% |
| Austrian | 101 | 0.2% |
| Bhutanese | 185 | 0.3% |
| Blackfeet | 14 | 0.0% |
| Brazilian | 296 | 0.5% |
| British | 576 | 1.0% |
| British West Indian | 21 | 0.0% |
| Bulgarian | 19 | 0.0% |
| Burmese | 608 | 1.1% |
| Cajun | 27 | 0.1% |
| Canadian | 143 | 0.3% |
| Cape Verdean | 153 | 0.3% |
| Central American | 1,398 | 2.5% |
| Central American Indian | 18 | 0.0% |
| Cherokee | 126 | 0.2% |
| Chilean | 32 | 0.1% |
| Colombian | 261 | 0.5% |
| Costa Rican | 49 | 0.1% |
| Creek | 11 | 0.0% |
| Cuban | 185 | 0.3% |
| Czech | 143 | 0.3% |
| Czechoslovakian | 27 | 0.1% |
| Danish | 146 | 0.3% |
| Dominican | 113 | 0.2% |
| Dutch | 337 | 0.6% |
| Eastern European | 103 | 0.2% |
| Egyptian | 7 | 0.0% |
| English | 4,749 | 8.5% |
| Ethiopian | 78 | 0.1% |
| European | 1,134 | 2.0% |
| Filipino | 157 | 0.3% |
| Finnish | 68 | 0.1% |
| French | 850 | 1.5% |
| French American Indian | 5 | 0.0% |
| French Canadian | 130 | 0.2% |
| German | 4,735 | 8.5% |
| Greek | 122 | 0.2% |
| Guamanian / Chamorro | 64 | 0.1% |
| Guatemalan | 483 | 0.9% |
| Guyanese | 42 | 0.1% |
| Haitian | 299 | 0.5% |
| Honduran | 453 | 0.8% |
| Hungarian | 76 | 0.1% |
| Indian (Asian) | 240 | 0.4% |
| Iranian | 8 | 0.0% |
| Irish | 5,053 | 9.0% |
| Iroquois | 12 | 0.0% |
| Israeli | 57 | 0.1% |
| Italian | 2,129 | 3.8% |
| Jamaican | 225 | 0.4% |
| Japanese | 43 | 0.1% |
| Jordanian | 18 | 0.0% |
| Kenyan | 25 | 0.0% |
| Korean | 346 | 0.6% |
| Lebanese | 111 | 0.2% |
| Lithuanian | 74 | 0.1% |
| Malaysian | 128 | 0.2% |
| Mexican | 2,967 | 5.3% |
| Mexican American Indian | 1 | 0.0% |
| Mongolian | 22 | 0.0% |
| Moroccan | 9 | 0.0% |
| Native Hawaiian | 148 | 0.3% |
| Nicaraguan | 207 | 0.4% |
| Nigerian | 556 | 1.0% |
| Northern European | 61 | 0.1% |
| Norwegian | 176 | 0.3% |
| Pakistani | 176 | 0.3% |
| Panamanian | 6 | 0.0% |
| Paraguayan | 108 | 0.2% |
| Peruvian | 242 | 0.4% |
| Polish | 642 | 1.1% |
| Portuguese | 47 | 0.1% |
| Puerto Rican | 616 | 1.1% |
| Romanian | 5 | 0.0% |
| Russian | 260 | 0.5% |
| Salvadoran | 200 | 0.4% |
| Scandinavian | 124 | 0.2% |
| Scotch-Irish | 621 | 1.1% |
| Scottish | 925 | 1.7% |
| Seminole | 17 | 0.0% |
| Senegalese | 42 | 0.1% |
| Sioux | 64 | 0.1% |
| Slovak | 14 | 0.0% |
| Somali | 17 | 0.0% |
| South American | 814 | 1.5% |
| South American Indian | 8 | 0.0% |
| Spaniard | 39 | 0.1% |
| Spanish | 26 | 0.1% |
| Sri Lankan | 319 | 0.6% |
| Subsaharan African | 2,175 | 3.9% |
| Swedish | 335 | 0.6% |
| Swiss | 26 | 0.1% |
| Thai | 2,389 | 4.3% |
| Trinidadian and Tobagonian | 31 | 0.1% |
| Turkish | 23 | 0.0% |
| Ukrainian | 154 | 0.3% |
| Uruguayan | 32 | 0.1% |
| Venezuelan | 115 | 0.2% |
| Vietnamese | 34 | 0.1% |
| Welsh | 312 | 0.6% |
| West Indian | 81 | 0.1% | View All 106 Rows |
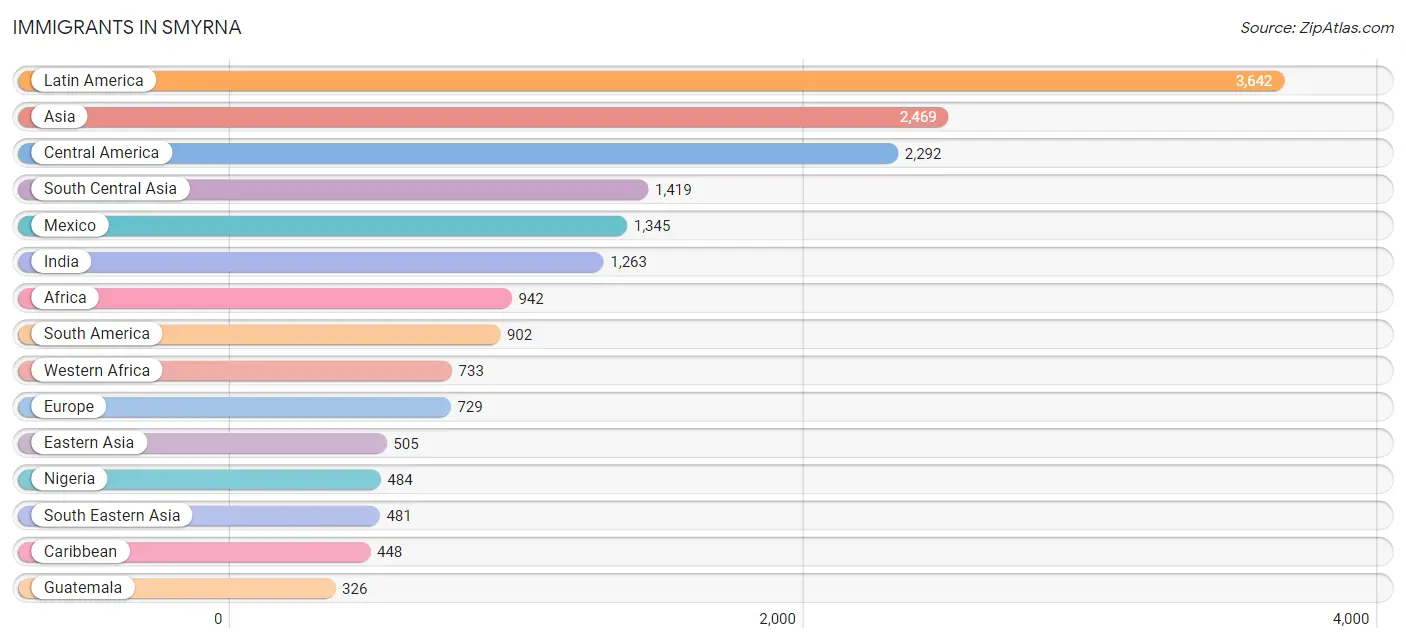
Immigrants in Smyrna
The most numerous immigrant groups reported in Smyrna came from Latin America (3,642 | 6.5%), Asia (2,469 | 4.4%), Central America (2,292 | 4.1%), South Central Asia (1,419 | 2.5%), and Mexico (1,345 | 2.4%), together accounting for 20.0% of all Smyrna residents.
| Immigration Origin | # Population | % Population |
| Africa | 942 | 1.7% |
| Asia | 2,469 | 4.4% |
| Bangladesh | 17 | 0.0% |
| Brazil | 278 | 0.5% |
| Bulgaria | 33 | 0.1% |
| Cameroon | 15 | 0.0% |
| Canada | 274 | 0.5% |
| Caribbean | 448 | 0.8% |
| Central America | 2,292 | 4.1% |
| China | 301 | 0.5% |
| Colombia | 213 | 0.4% |
| Cuba | 90 | 0.2% |
| Czechoslovakia | 45 | 0.1% |
| Eastern Africa | 114 | 0.2% |
| Eastern Asia | 505 | 0.9% |
| Eastern Europe | 200 | 0.4% |
| Egypt | 14 | 0.0% |
| El Salvador | 146 | 0.3% |
| England | 34 | 0.1% |
| Ethiopia | 61 | 0.1% |
| Europe | 729 | 1.3% |
| France | 13 | 0.0% |
| Germany | 167 | 0.3% |
| Greece | 14 | 0.0% |
| Guatemala | 326 | 0.6% |
| Guyana | 56 | 0.1% |
| Haiti | 205 | 0.4% |
| Honduras | 298 | 0.5% |
| Hong Kong | 4 | 0.0% |
| India | 1,263 | 2.3% |
| Iran | 8 | 0.0% |
| Ireland | 13 | 0.0% |
| Israel | 41 | 0.1% |
| Italy | 39 | 0.1% |
| Jamaica | 68 | 0.1% |
| Japan | 23 | 0.0% |
| Kenya | 25 | 0.0% |
| Korea | 181 | 0.3% |
| Laos | 14 | 0.0% |
| Latin America | 3,642 | 6.5% |
| Lebanon | 14 | 0.0% |
| Liberia | 59 | 0.1% |
| Mexico | 1,345 | 2.4% |
| Middle Africa | 15 | 0.0% |
| Nepal | 80 | 0.1% |
| Netherlands | 36 | 0.1% |
| Nicaragua | 171 | 0.3% |
| Nigeria | 484 | 0.9% |
| Northern Africa | 14 | 0.0% |
| Northern Europe | 239 | 0.4% |
| Pakistan | 20 | 0.0% |
| Panama | 6 | 0.0% |
| Peru | 195 | 0.4% |
| Philippines | 136 | 0.2% |
| Poland | 17 | 0.0% |
| Russia | 50 | 0.1% |
| South Africa | 8 | 0.0% |
| South America | 902 | 1.6% |
| South Central Asia | 1,419 | 2.5% |
| South Eastern Asia | 481 | 0.9% |
| Southern Europe | 74 | 0.1% |
| Spain | 21 | 0.0% |
| Sri Lanka | 31 | 0.1% |
| Sweden | 43 | 0.1% |
| Taiwan | 142 | 0.3% |
| Thailand | 181 | 0.3% |
| Trinidad and Tobago | 31 | 0.1% |
| Turkey | 9 | 0.0% |
| Uganda | 28 | 0.1% |
| Ukraine | 10 | 0.0% |
| Uruguay | 32 | 0.1% |
| Venezuela | 83 | 0.2% |
| Vietnam | 150 | 0.3% |
| Western Africa | 733 | 1.3% |
| Western Asia | 64 | 0.1% |
| Western Europe | 216 | 0.4% | View All 76 Rows |
Sex and Age in Smyrna
Sex and Age in Smyrna
The most populous age groups in Smyrna are 25 to 29 Years (2,868 | 10.7%) for men and 25 to 29 Years (3,071 | 10.5%) for women.
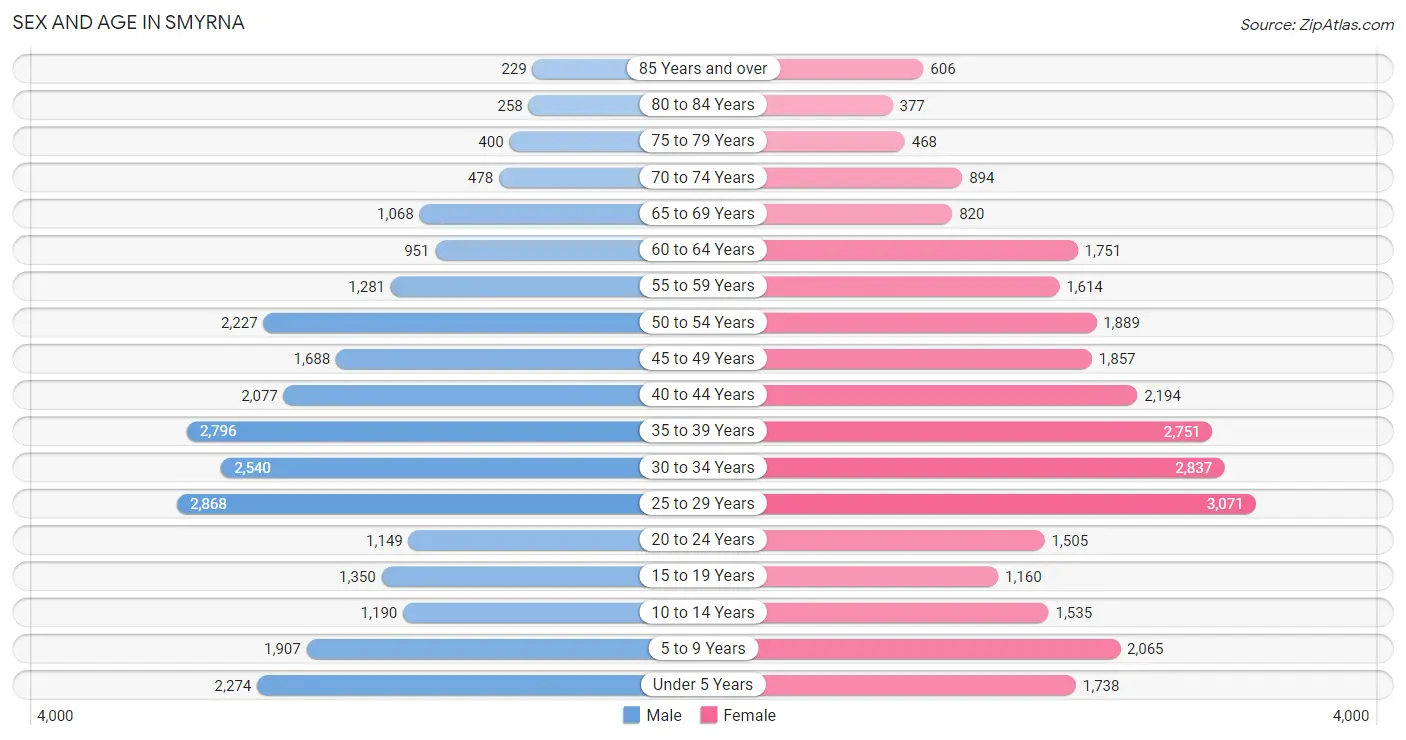
| Age Bracket | Male | Female |
| Under 5 Years | 2,274 (8.5%) | 1,738 (6.0%) |
| 5 to 9 Years | 1,907 (7.1%) | 2,065 (7.1%) |
| 10 to 14 Years | 1,190 (4.4%) | 1,535 (5.3%) |
| 15 to 19 Years | 1,350 (5.1%) | 1,160 (4.0%) |
| 20 to 24 Years | 1,149 (4.3%) | 1,505 (5.2%) |
| 25 to 29 Years | 2,868 (10.7%) | 3,071 (10.5%) |
| 30 to 34 Years | 2,540 (9.5%) | 2,837 (9.7%) |
| 35 to 39 Years | 2,796 (10.5%) | 2,751 (9.4%) |
| 40 to 44 Years | 2,077 (7.8%) | 2,194 (7.5%) |
| 45 to 49 Years | 1,688 (6.3%) | 1,857 (6.4%) |
| 50 to 54 Years | 2,227 (8.3%) | 1,889 (6.5%) |
| 55 to 59 Years | 1,281 (4.8%) | 1,614 (5.5%) |
| 60 to 64 Years | 951 (3.6%) | 1,751 (6.0%) |
| 65 to 69 Years | 1,068 (4.0%) | 820 (2.8%) |
| 70 to 74 Years | 478 (1.8%) | 894 (3.1%) |
| 75 to 79 Years | 400 (1.5%) | 468 (1.6%) |
| 80 to 84 Years | 258 (1.0%) | 377 (1.3%) |
| 85 Years and over | 229 (0.9%) | 606 (2.1%) |
| Total | 26,731 (100.0%) | 29,132 (100.0%) |
Families and Households in Smyrna
Median Family Size in Smyrna
The median family size in Smyrna is 2.98 persons per family, with single male/father families (1,092 | 8.1%) accounting for the largest median family size of 3.13 persons per family. On the other hand, single female/mother families (2,629 | 19.5%) represent the smallest median family size with 2.89 persons per family.
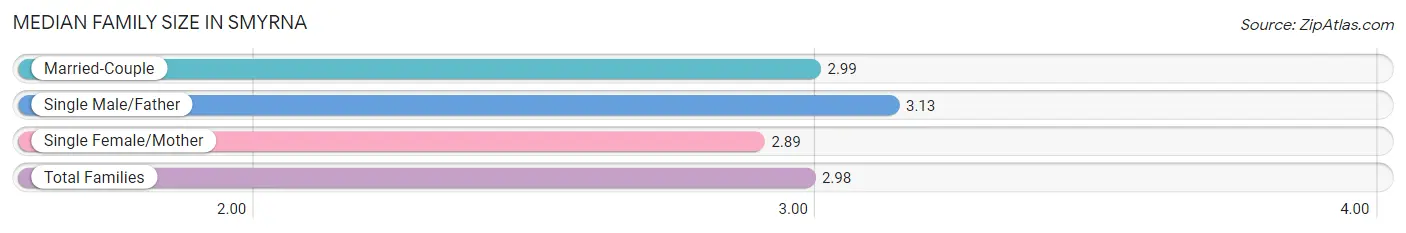
| Family Type | # Families | Family Size |
| Married-Couple | 9,757 (72.4%) | 2.99 |
| Single Male/Father | 1,092 (8.1%) | 3.13 |
| Single Female/Mother | 2,629 (19.5%) | 2.89 |
| Total Families | 13,478 (100.0%) | 2.98 |
Median Household Size in Smyrna
The median household size in Smyrna is 2.25 persons per household, with single male/father households (1,092 | 4.4%) accounting for the largest median household size of 3.48 persons per household. non-family households (11,216 | 45.4%) represent the smallest median household size with 1.27 persons per household.
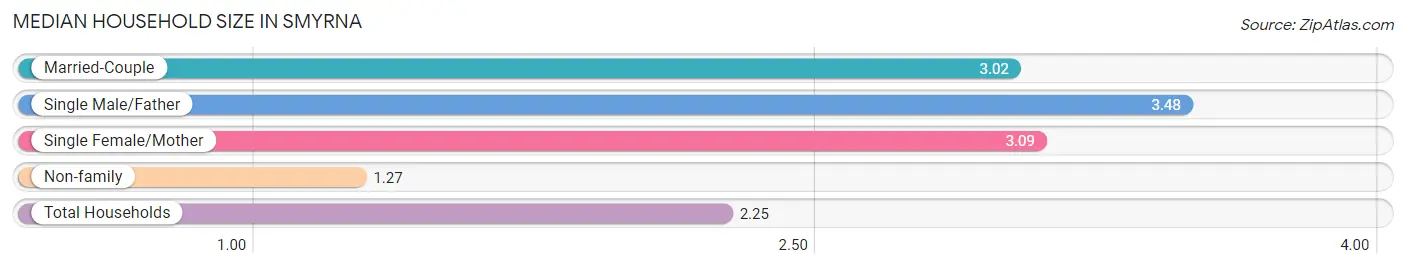
| Household Type | # Households | Household Size |
| Married-Couple | 9,757 (39.5%) | 3.02 |
| Single Male/Father | 1,092 (4.4%) | 3.48 |
| Single Female/Mother | 2,629 (10.6%) | 3.09 |
| Non-family | 11,216 (45.4%) | 1.27 |
| Total Households | 24,694 (100.0%) | 2.25 |
Household Size by Marriage Status in Smyrna
Out of a total of 24,694 households in Smyrna, 13,478 (54.6%) are family households, while 11,216 (45.4%) are nonfamily households. The most numerous type of family households are 2-person households, comprising 5,782, and the most common type of nonfamily households are 1-person households, comprising 8,960.
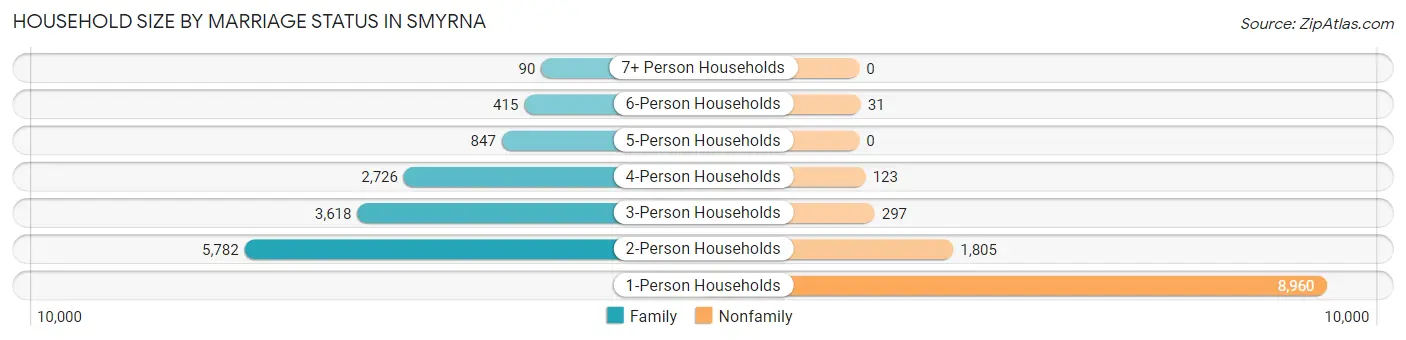
| Household Size | Family Households | Nonfamily Households |
| 1-Person Households | - | 8,960 (36.3%) |
| 2-Person Households | 5,782 (23.4%) | 1,805 (7.3%) |
| 3-Person Households | 3,618 (14.6%) | 297 (1.2%) |
| 4-Person Households | 2,726 (11.0%) | 123 (0.5%) |
| 5-Person Households | 847 (3.4%) | 0 (0.0%) |
| 6-Person Households | 415 (1.7%) | 31 (0.1%) |
| 7+ Person Households | 90 (0.4%) | 0 (0.0%) |
| Total | 13,478 (54.6%) | 11,216 (45.4%) |
Female Fertility in Smyrna
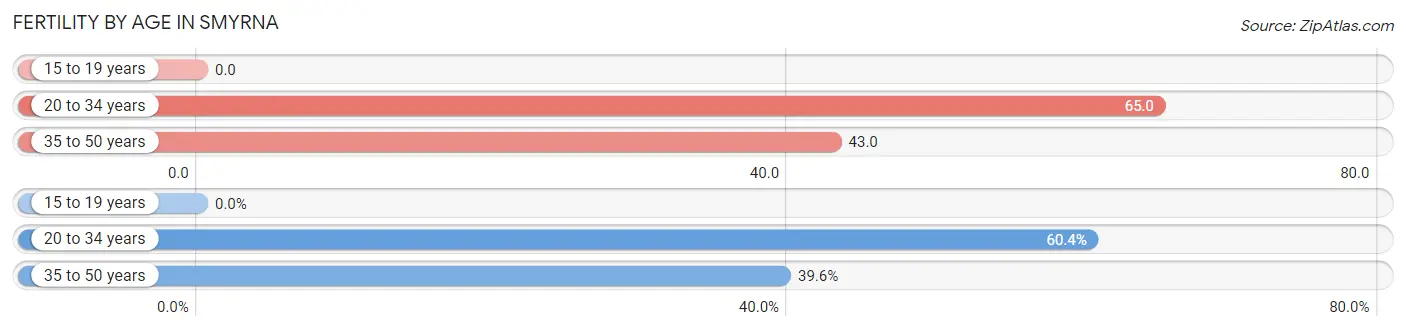
Fertility by Age in Smyrna
Average fertility rate in Smyrna is 50.0 births per 1,000 women. Women in the age bracket of 20 to 34 years have the highest fertility rate with 65.0 births per 1,000 women. Women in the age bracket of 20 to 34 years acount for 60.4% of all women with births.
| Age Bracket | Women with Births | Births / 1,000 Women |
| 15 to 19 years | 0 (0.0%) | 0.0 |
| 20 to 34 years | 481 (60.4%) | 65.0 |
| 35 to 50 years | 315 (39.6%) | 43.0 |
| Total | 796 (100.0%) | 50.0 |
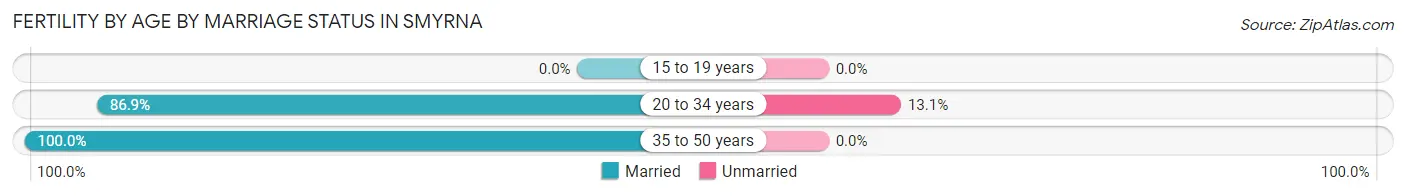
Fertility by Age by Marriage Status in Smyrna
92.1% of women with births (796) in Smyrna are married. The highest percentage of unmarried women with births falls into 20 to 34 years age bracket with 13.1% of them unmarried at the time of birth, while the lowest percentage of unmarried women with births belong to 35 to 50 years age bracket with 0.0% of them unmarried.
| Age Bracket | Married | Unmarried |
| 15 to 19 years | 0 (0.0%) | 0 (0.0%) |
| 20 to 34 years | 418 (86.9%) | 63 (13.1%) |
| 35 to 50 years | 315 (100.0%) | 0 (0.0%) |
| Total | 733 (92.1%) | 63 (7.9%) |
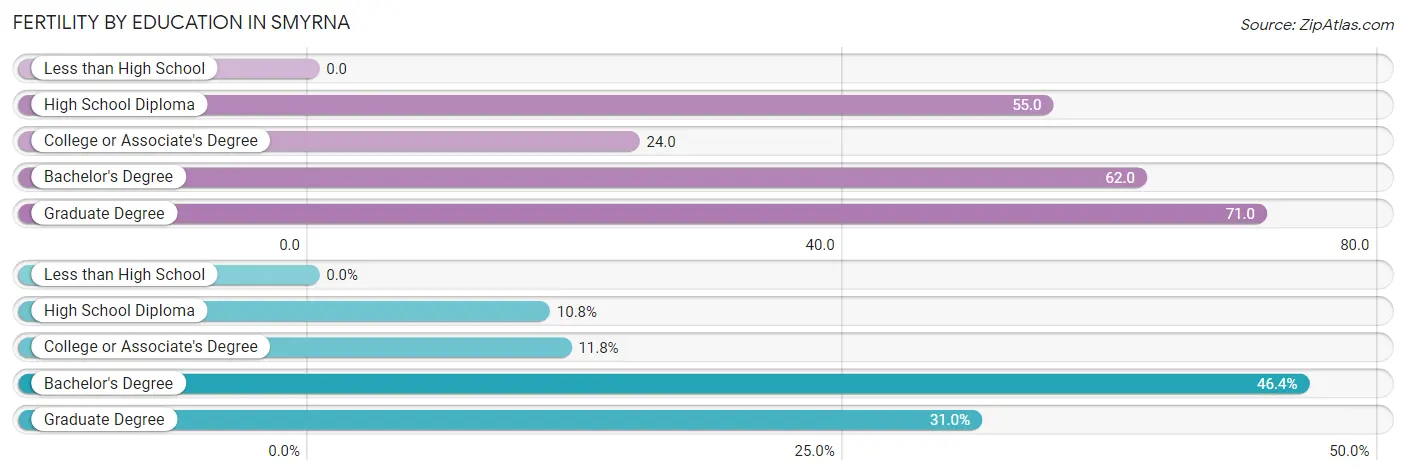
Fertility by Education in Smyrna
| Educational Attainment | Women with Births | Births / 1,000 Women |
| Less than High School | 0 (0.0%) | 0.0 |
| High School Diploma | 86 (10.8%) | 55.0 |
| College or Associate's Degree | 94 (11.8%) | 24.0 |
| Bachelor's Degree | 369 (46.4%) | 62.0 |
| Graduate Degree | 247 (31.0%) | 71.0 |
| Total | 796 (100.0%) | 50.0 |
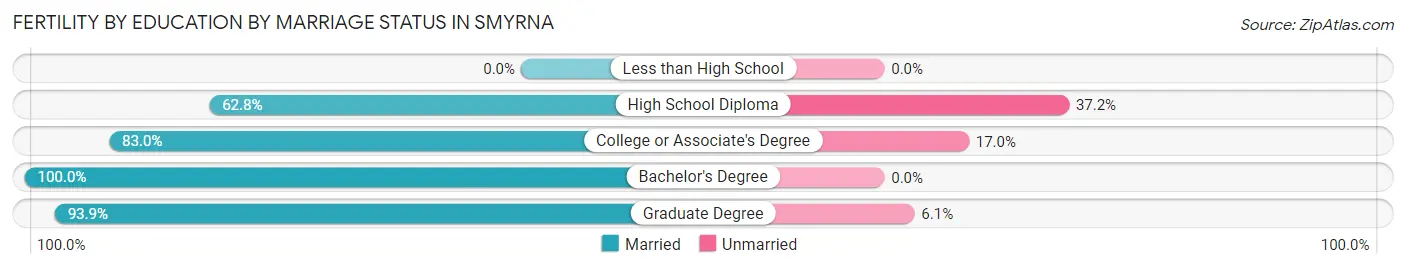
Fertility by Education by Marriage Status in Smyrna
7.9% of women with births in Smyrna are unmarried. Women with the educational attainment of bachelor's degree are most likely to be married with 100.0% of them married at childbirth, while women with the educational attainment of high school diploma are least likely to be married with 37.2% of them unmarried at childbirth.
| Educational Attainment | Married | Unmarried |
| Less than High School | 0 (0.0%) | 0 (0.0%) |
| High School Diploma | 54 (62.8%) | 32 (37.2%) |
| College or Associate's Degree | 78 (83.0%) | 16 (17.0%) |
| Bachelor's Degree | 369 (100.0%) | 0 (0.0%) |
| Graduate Degree | 232 (93.9%) | 15 (6.1%) |
| Total | 733 (92.1%) | 63 (7.9%) |
Income in Smyrna
Income Overview in Smyrna
Per Capita Income in Smyrna is $59,851, while median incomes of families and households are $125,741 and $92,258 respectively.
| Characteristic | Number | Measure |
| Per Capita Income | 55,863 | $59,851 |
| Median Family Income | 13,478 | $125,741 |
| Mean Family Income | 13,478 | $172,655 |
| Median Household Income | 24,694 | $92,258 |
| Mean Household Income | 24,694 | $134,466 |
| Income Deficit | 13,478 | $10,273 |
| Wage / Income Gap (%) | 55,863 | 16.29% |
| Wage / Income Gap ($) | 55,863 | 83.71¢ per $1 |
| Gini / Inequality Index | 55,863 | 0.47 |
Earnings by Sex in Smyrna
Average Earnings in Smyrna are $59,730, $65,544 for men and $54,868 for women, a difference of 16.3%.
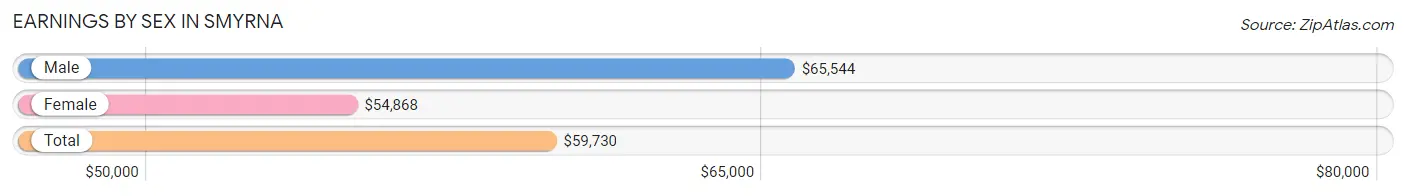
| Sex | Number | Average Earnings |
| Male | 17,699 (49.7%) | $65,544 |
| Female | 17,886 (50.3%) | $54,868 |
| Total | 35,585 (100.0%) | $59,730 |
Earnings by Sex by Income Bracket in Smyrna
The most common earnings brackets in Smyrna are $100,000+ for men (5,452 | 30.8%) and $100,000+ for women (3,509 | 19.6%).
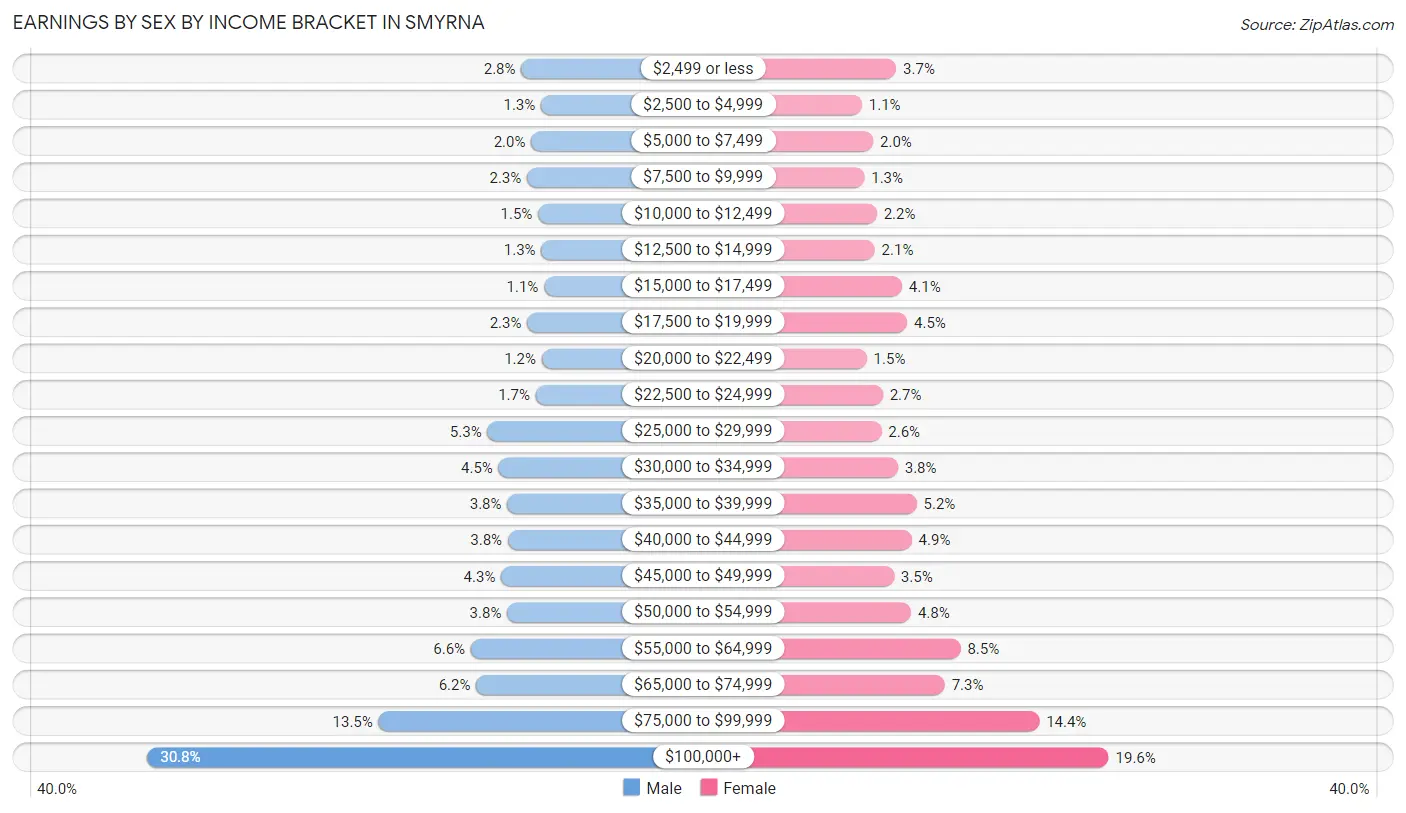
| Income | Male | Female |
| $2,499 or less | 490 (2.8%) | 662 (3.7%) |
| $2,500 to $4,999 | 229 (1.3%) | 202 (1.1%) |
| $5,000 to $7,499 | 360 (2.0%) | 352 (2.0%) |
| $7,500 to $9,999 | 414 (2.3%) | 235 (1.3%) |
| $10,000 to $12,499 | 267 (1.5%) | 401 (2.2%) |
| $12,500 to $14,999 | 224 (1.3%) | 373 (2.1%) |
| $15,000 to $17,499 | 188 (1.1%) | 738 (4.1%) |
| $17,500 to $19,999 | 413 (2.3%) | 808 (4.5%) |
| $20,000 to $22,499 | 220 (1.2%) | 267 (1.5%) |
| $22,500 to $24,999 | 299 (1.7%) | 481 (2.7%) |
| $25,000 to $29,999 | 939 (5.3%) | 463 (2.6%) |
| $30,000 to $34,999 | 791 (4.5%) | 683 (3.8%) |
| $35,000 to $39,999 | 676 (3.8%) | 936 (5.2%) |
| $40,000 to $44,999 | 669 (3.8%) | 869 (4.9%) |
| $45,000 to $49,999 | 758 (4.3%) | 631 (3.5%) |
| $50,000 to $54,999 | 677 (3.8%) | 861 (4.8%) |
| $55,000 to $64,999 | 1,160 (6.6%) | 1,523 (8.5%) |
| $65,000 to $74,999 | 1,089 (6.1%) | 1,313 (7.3%) |
| $75,000 to $99,999 | 2,384 (13.5%) | 2,579 (14.4%) |
| $100,000+ | 5,452 (30.8%) | 3,509 (19.6%) |
| Total | 17,699 (100.0%) | 17,886 (100.0%) |
Earnings by Sex by Educational Attainment in Smyrna
Average earnings in Smyrna are $71,164 for men and $60,069 for women, a difference of 15.6%. Men with an educational attainment of graduate degree enjoy the highest average annual earnings of $117,102, while those with less than high school education earn the least with $31,683. Women with an educational attainment of graduate degree earn the most with the average annual earnings of $90,185, while those with less than high school education have the smallest earnings of $20,417.
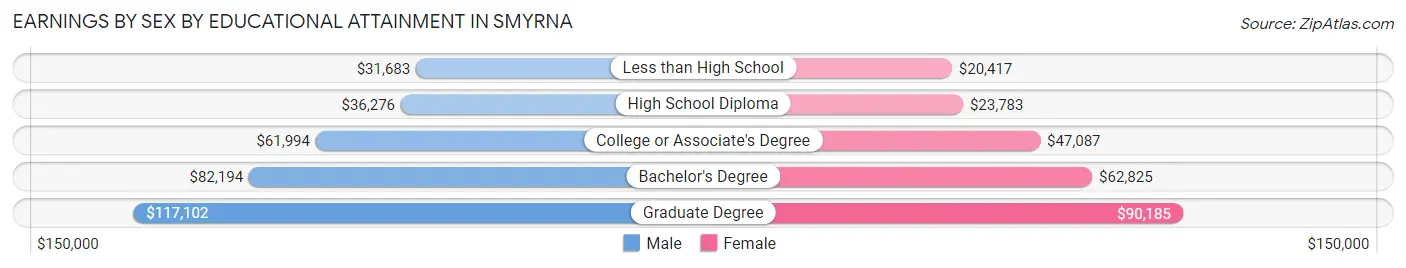
| Educational Attainment | Male Income | Female Income |
| Less than High School | $31,683 | $20,417 |
| High School Diploma | $36,276 | $23,783 |
| College or Associate's Degree | $61,994 | $47,087 |
| Bachelor's Degree | $82,194 | $62,825 |
| Graduate Degree | $117,102 | $90,185 |
| Total | $71,164 | $60,069 |
Family Income in Smyrna
Family Income Brackets in Smyrna
According to the Smyrna family income data, there are 3,693 families falling into the $200,000+ income range, which is the most common income bracket and makes up 27.4% of all families. Conversely, the $10,000 to $14,999 income bracket is the least frequent group with only 121 families (0.9%) belonging to this category.
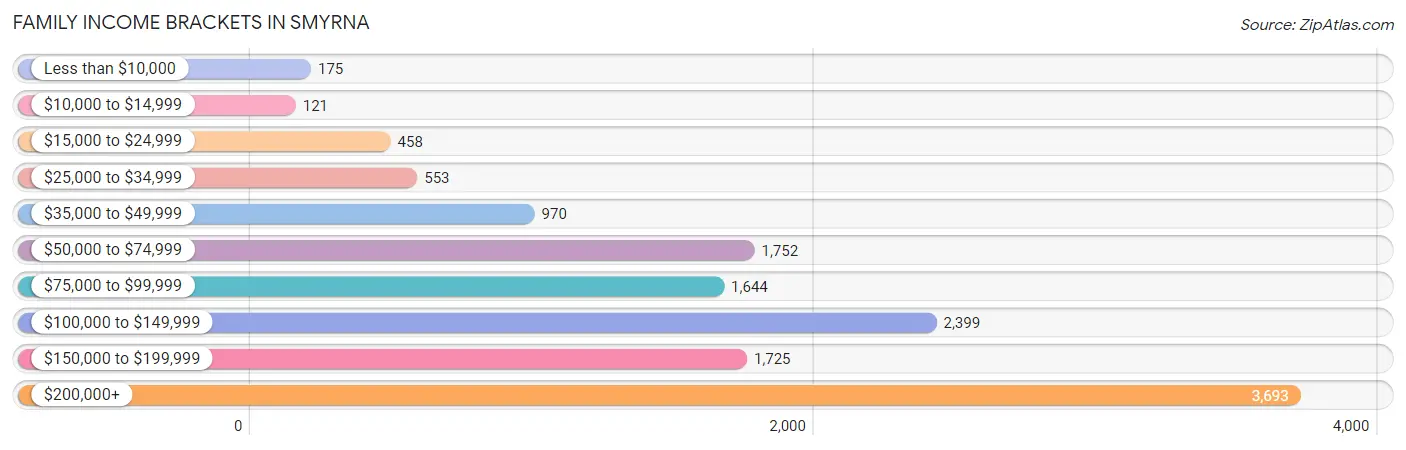
| Income Bracket | # Families | % Families |
| Less than $10,000 | 175 | 1.3% |
| $10,000 to $14,999 | 121 | 0.9% |
| $15,000 to $24,999 | 458 | 3.4% |
| $25,000 to $34,999 | 553 | 4.1% |
| $35,000 to $49,999 | 970 | 7.2% |
| $50,000 to $74,999 | 1,752 | 13.0% |
| $75,000 to $99,999 | 1,644 | 12.2% |
| $100,000 to $149,999 | 2,399 | 17.8% |
| $150,000 to $199,999 | 1,725 | 12.8% |
| $200,000+ | 3,693 | 27.4% |
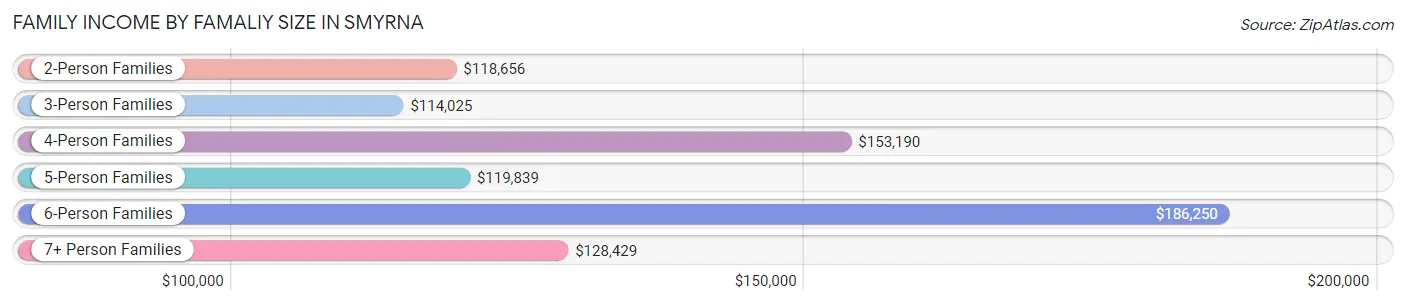
Family Income by Famaliy Size in Smyrna
6-person families (298 | 2.2%) account for the highest median family income in Smyrna with $186,250 per family, while 2-person families (6,531 | 48.5%) have the highest median income of $59,328 per family member.
| Income Bracket | # Families | Median Income |
| 2-Person Families | 6,531 (48.5%) | $118,656 |
| 3-Person Families | 3,015 (22.4%) | $114,025 |
| 4-Person Families | 2,712 (20.1%) | $153,190 |
| 5-Person Families | 832 (6.2%) | $119,839 |
| 6-Person Families | 298 (2.2%) | $186,250 |
| 7+ Person Families | 90 (0.7%) | $128,429 |
| Total | 13,478 (100.0%) | $125,741 |
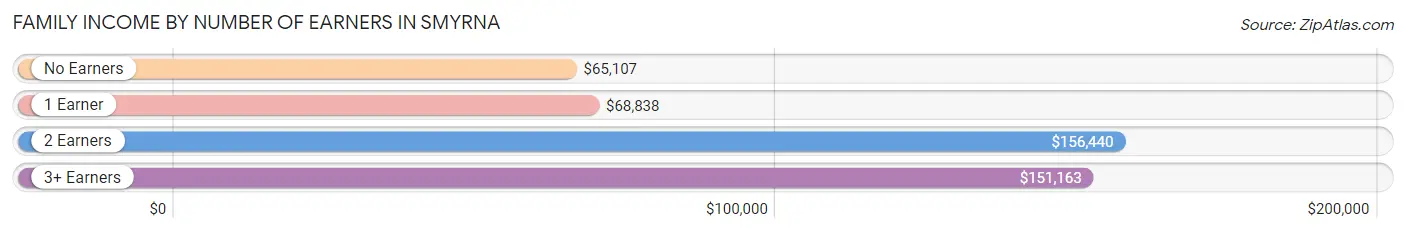
Family Income by Number of Earners in Smyrna
The median family income in Smyrna is $125,741, with families comprising 2 earners (7,581) having the highest median family income of $156,440, while families with no earners (899) have the lowest median family income of $65,107, accounting for 56.2% and 6.7% of families, respectively.
| Number of Earners | # Families | Median Income |
| No Earners | 899 (6.7%) | $65,107 |
| 1 Earner | 4,042 (30.0%) | $68,838 |
| 2 Earners | 7,581 (56.2%) | $156,440 |
| 3+ Earners | 956 (7.1%) | $151,163 |
| Total | 13,478 (100.0%) | $125,741 |
Household Income in Smyrna
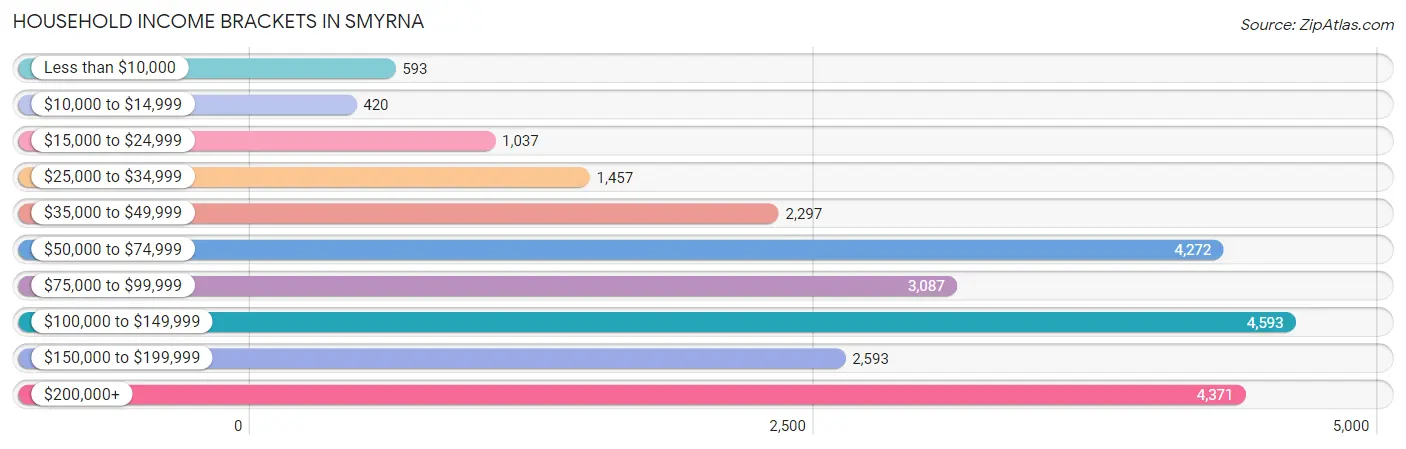
Household Income Brackets in Smyrna
With 4,593 households falling in the category, the $100,000 to $149,999 income range is the most frequent in Smyrna, accounting for 18.6% of all households. In contrast, only 420 households (1.7%) fall into the $10,000 to $14,999 income bracket, making it the least populous group.
| Income Bracket | # Households | % Households |
| Less than $10,000 | 593 | 2.4% |
| $10,000 to $14,999 | 420 | 1.7% |
| $15,000 to $24,999 | 1,037 | 4.2% |
| $25,000 to $34,999 | 1,457 | 5.9% |
| $35,000 to $49,999 | 2,297 | 9.3% |
| $50,000 to $74,999 | 4,272 | 17.3% |
| $75,000 to $99,999 | 3,087 | 12.5% |
| $100,000 to $149,999 | 4,593 | 18.6% |
| $150,000 to $199,999 | 2,593 | 10.5% |
| $200,000+ | 4,371 | 17.7% |
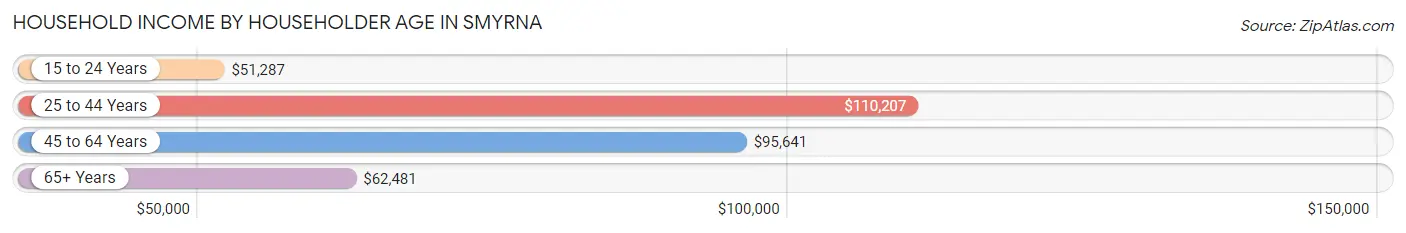
Household Income by Householder Age in Smyrna
The median household income in Smyrna is $92,258, with the highest median household income of $110,207 found in the 25 to 44 years age bracket for the primary householder. A total of 11,888 households (48.1%) fall into this category. Meanwhile, the 15 to 24 years age bracket for the primary householder has the lowest median household income of $51,287, with 1,099 households (4.4%) in this group.
| Income Bracket | # Households | Median Income |
| 15 to 24 Years | 1,099 (4.4%) | $51,287 |
| 25 to 44 Years | 11,888 (48.1%) | $110,207 |
| 45 to 64 Years | 7,969 (32.3%) | $95,641 |
| 65+ Years | 3,738 (15.1%) | $62,481 |
| Total | 24,694 (100.0%) | $92,258 |
Poverty in Smyrna
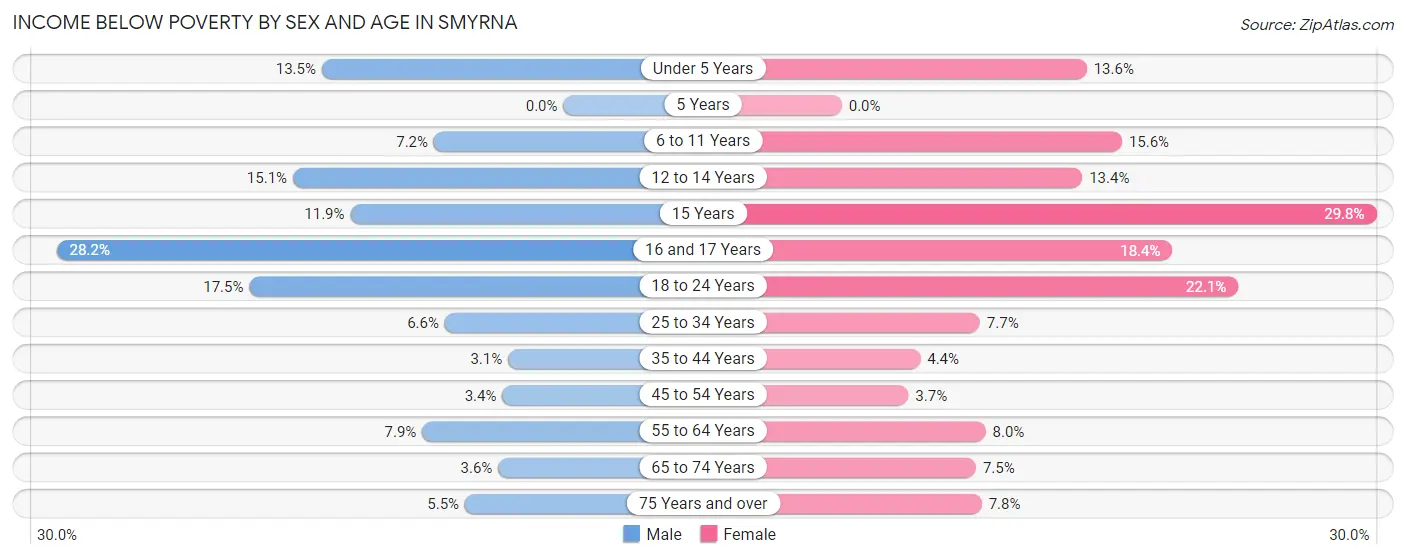
Income Below Poverty by Sex and Age in Smyrna
With 7.2% poverty level for males and 8.8% for females among the residents of Smyrna, 16 and 17 year old males and 15 year old females are the most vulnerable to poverty, with 116 males (28.2%) and 61 females (29.8%) in their respective age groups living below the poverty level.
| Age Bracket | Male | Female |
| Under 5 Years | 300 (13.5%) | 237 (13.6%) |
| 5 Years | 0 (0.0%) | 0 (0.0%) |
| 6 to 11 Years | 136 (7.2%) | 276 (15.6%) |
| 12 to 14 Years | 95 (15.1%) | 155 (13.4%) |
| 15 Years | 53 (11.9%) | 61 (29.8%) |
| 16 and 17 Years | 116 (28.2%) | 85 (18.4%) |
| 18 to 24 Years | 286 (17.5%) | 441 (22.1%) |
| 25 to 34 Years | 356 (6.6%) | 454 (7.7%) |
| 35 to 44 Years | 150 (3.1%) | 216 (4.4%) |
| 45 to 54 Years | 133 (3.4%) | 139 (3.7%) |
| 55 to 64 Years | 175 (7.9%) | 269 (8.0%) |
| 65 to 74 Years | 56 (3.6%) | 126 (7.5%) |
| 75 Years and over | 48 (5.5%) | 106 (7.8%) |
| Total | 1,904 (7.2%) | 2,565 (8.8%) |
Income Above Poverty by Sex and Age in Smyrna
According to the poverty statistics in Smyrna, males aged 5 years and females aged 5 years are the age groups that are most secure financially, with 100.0% of males and 100.0% of females in these age groups living above the poverty line.
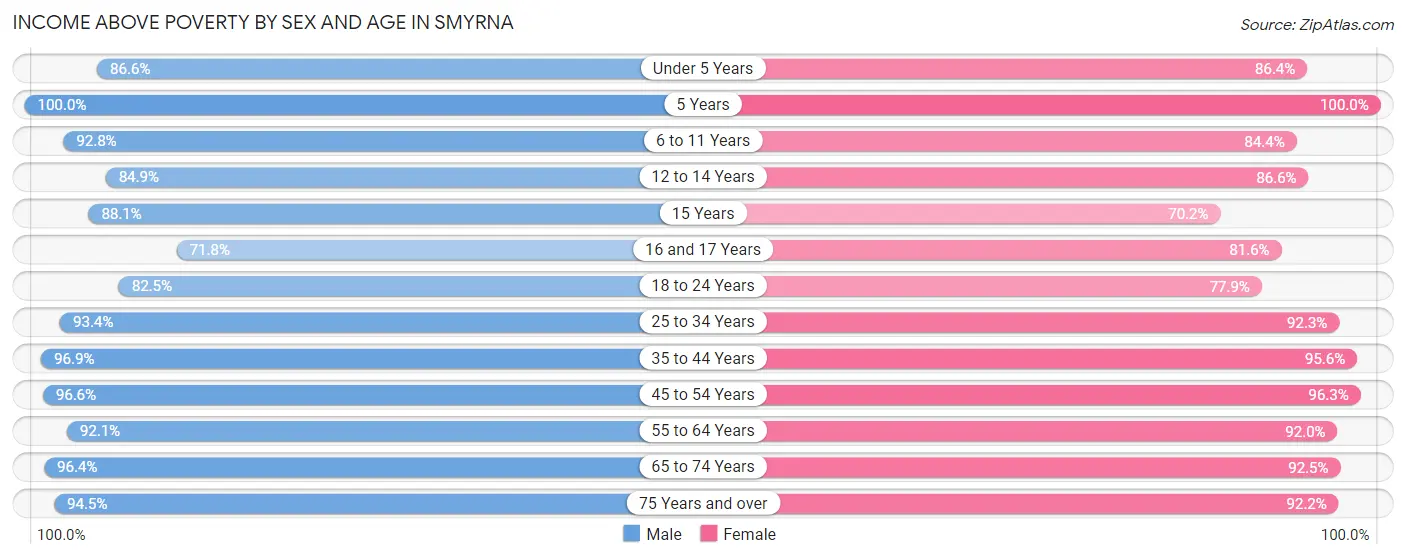
| Age Bracket | Male | Female |
| Under 5 Years | 1,930 (86.6%) | 1,500 (86.4%) |
| 5 Years | 502 (100.0%) | 673 (100.0%) |
| 6 to 11 Years | 1,750 (92.8%) | 1,493 (84.4%) |
| 12 to 14 Years | 536 (84.9%) | 1,003 (86.6%) |
| 15 Years | 394 (88.1%) | 144 (70.2%) |
| 16 and 17 Years | 295 (71.8%) | 377 (81.6%) |
| 18 to 24 Years | 1,349 (82.5%) | 1,557 (77.9%) |
| 25 to 34 Years | 5,038 (93.4%) | 5,452 (92.3%) |
| 35 to 44 Years | 4,720 (96.9%) | 4,729 (95.6%) |
| 45 to 54 Years | 3,775 (96.6%) | 3,607 (96.3%) |
| 55 to 64 Years | 2,051 (92.1%) | 3,091 (92.0%) |
| 65 to 74 Years | 1,485 (96.4%) | 1,561 (92.5%) |
| 75 Years and over | 828 (94.5%) | 1,254 (92.2%) |
| Total | 24,653 (92.8%) | 26,441 (91.2%) |
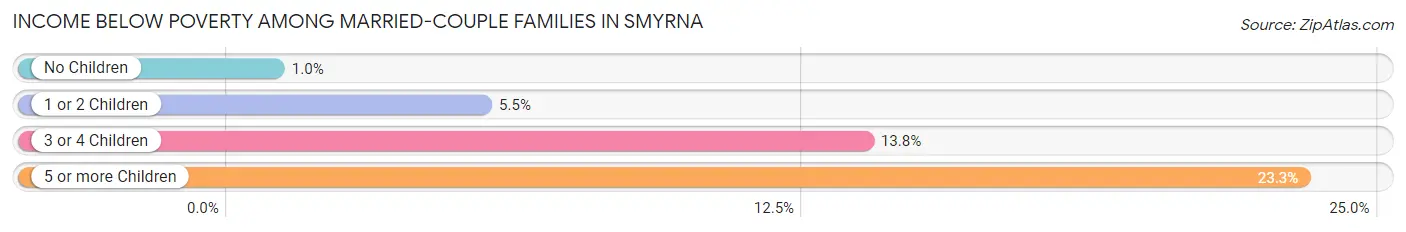
Income Below Poverty Among Married-Couple Families in Smyrna
The poverty statistics for married-couple families in Smyrna show that 3.7% or 358 of the total 9,757 families live below the poverty line. Families with 5 or more children have the highest poverty rate of 23.3%, comprising of 7 families. On the other hand, families with no children have the lowest poverty rate of 1.0%, which includes 54 families.
| Children | Above Poverty | Below Poverty |
| No Children | 5,216 (99.0%) | 54 (1.0%) |
| 1 or 2 Children | 3,637 (94.5%) | 213 (5.5%) |
| 3 or 4 Children | 523 (86.2%) | 84 (13.8%) |
| 5 or more Children | 23 (76.7%) | 7 (23.3%) |
| Total | 9,399 (96.3%) | 358 (3.7%) |
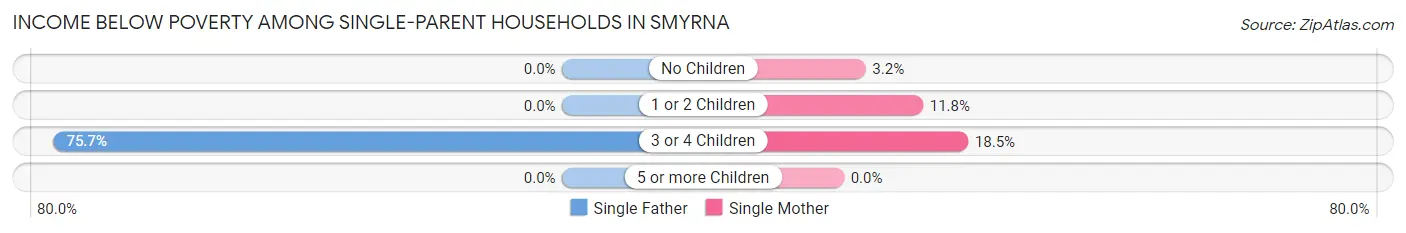
Income Below Poverty Among Single-Parent Households in Smyrna
According to the poverty data in Smyrna, 10.3% or 112 single-father households and 8.4% or 220 single-mother households are living below the poverty line. Among single-father households, those with 3 or 4 children have the highest poverty rate, with 112 households (75.7%) experiencing poverty. Likewise, among single-mother households, those with 3 or 4 children have the highest poverty rate, with 15 households (18.5%) falling below the poverty line.
| Children | Single Father | Single Mother |
| No Children | 0 (0.0%) | 35 (3.2%) |
| 1 or 2 Children | 0 (0.0%) | 170 (11.8%) |
| 3 or 4 Children | 112 (75.7%) | 15 (18.5%) |
| 5 or more Children | 0 (0.0%) | 0 (0.0%) |
| Total | 112 (10.3%) | 220 (8.4%) |
Income Below Poverty Among Married-Couple vs Single-Parent Households in Smyrna
The poverty data for Smyrna shows that 358 of the married-couple family households (3.7%) and 332 of the single-parent households (8.9%) are living below the poverty level. Within the married-couple family households, those with 5 or more children have the highest poverty rate, with 7 households (23.3%) falling below the poverty line. Among the single-parent households, those with 3 or 4 children have the highest poverty rate, with 127 household (55.5%) living below poverty.
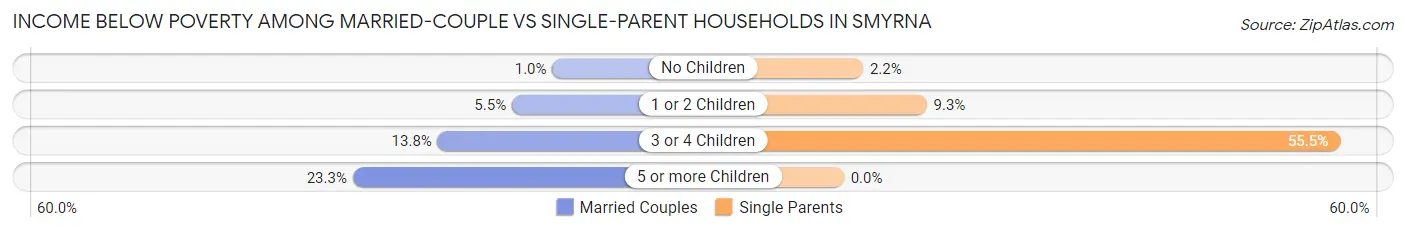
| Children | Married-Couple Families | Single-Parent Households |
| No Children | 54 (1.0%) | 35 (2.2%) |
| 1 or 2 Children | 213 (5.5%) | 170 (9.3%) |
| 3 or 4 Children | 84 (13.8%) | 127 (55.5%) |
| 5 or more Children | 7 (23.3%) | 0 (0.0%) |
| Total | 358 (3.7%) | 332 (8.9%) |
Employment Characteristics in Smyrna
Employment by Class of Employer in Smyrna
Among the 32,630 employed individuals in Smyrna, private company employees (23,633 | 72.4%), self-employed (incorporated) (1,949 | 6.0%), and not-for-profit organizations (1,921 | 5.9%) make up the most common classes of employment.
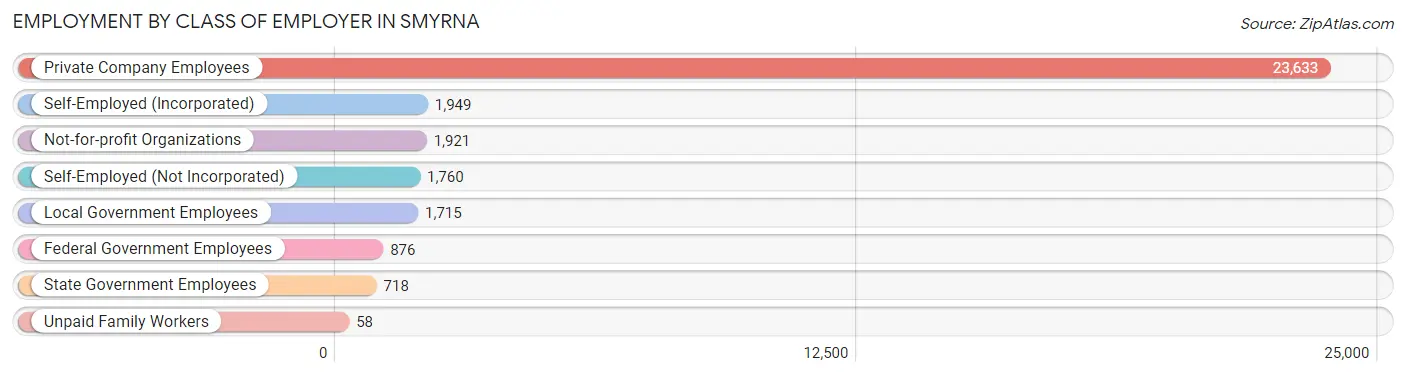
| Employer Class | # Employees | % Employees |
| Private Company Employees | 23,633 | 72.4% |
| Self-Employed (Incorporated) | 1,949 | 6.0% |
| Self-Employed (Not Incorporated) | 1,760 | 5.4% |
| Not-for-profit Organizations | 1,921 | 5.9% |
| Local Government Employees | 1,715 | 5.3% |
| State Government Employees | 718 | 2.2% |
| Federal Government Employees | 876 | 2.7% |
| Unpaid Family Workers | 58 | 0.2% |
| Total | 32,630 | 100.0% |
Employment Status by Age in Smyrna
According to the labor force statistics for Smyrna, out of the total population over 16 years of age (44,502), 78.4% or 34,890 individuals are in the labor force, with 4.2% or 1,465 of them unemployed. The age group with the highest labor force participation rate is 35 to 44 years, with 91.9% or 9,023 individuals in the labor force. Within the labor force, the 16 to 19 years age range has the highest percentage of unemployed individuals, with 34.2% or 258 of them being unemployed.
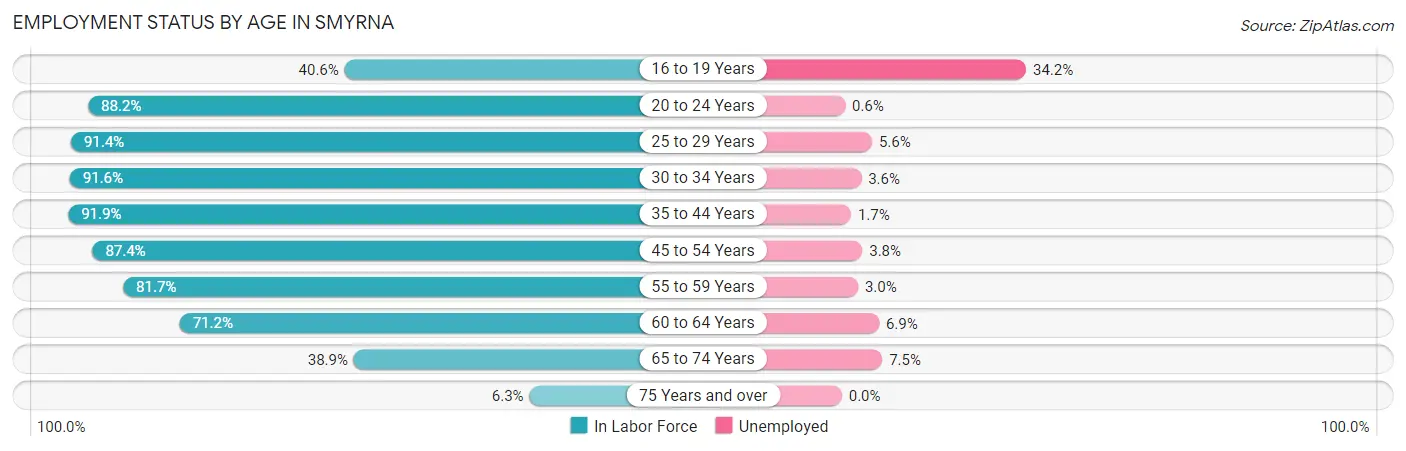
| Age Bracket | In Labor Force | Unemployed |
| 16 to 19 Years | 754 (40.6%) | 258 (34.2%) |
| 20 to 24 Years | 2,341 (88.2%) | 14 (0.6%) |
| 25 to 29 Years | 5,428 (91.4%) | 304 (5.6%) |
| 30 to 34 Years | 4,925 (91.6%) | 177 (3.6%) |
| 35 to 44 Years | 9,023 (91.9%) | 153 (1.7%) |
| 45 to 54 Years | 6,696 (87.4%) | 254 (3.8%) |
| 55 to 59 Years | 2,365 (81.7%) | 71 (3.0%) |
| 60 to 64 Years | 1,924 (71.2%) | 133 (6.9%) |
| 65 to 74 Years | 1,268 (38.9%) | 95 (7.5%) |
| 75 Years and over | 147 (6.3%) | 0 (0.0%) |
| Total | 34,890 (78.4%) | 1,465 (4.2%) |
Employment Status by Educational Attainment in Smyrna
According to labor force statistics for Smyrna, 88.3% of individuals (30,368) out of the total population between 25 and 64 years of age (34,392) are in the labor force, with 3.6% or 1,093 of them being unemployed. The group with the highest labor force participation rate are those with the educational attainment of bachelor's degree or higher, with 90.8% or 18,727 individuals in the labor force. Within the labor force, individuals with less than high school education have the highest percentage of unemployment, with 7.4% or 86 of them being unemployed.
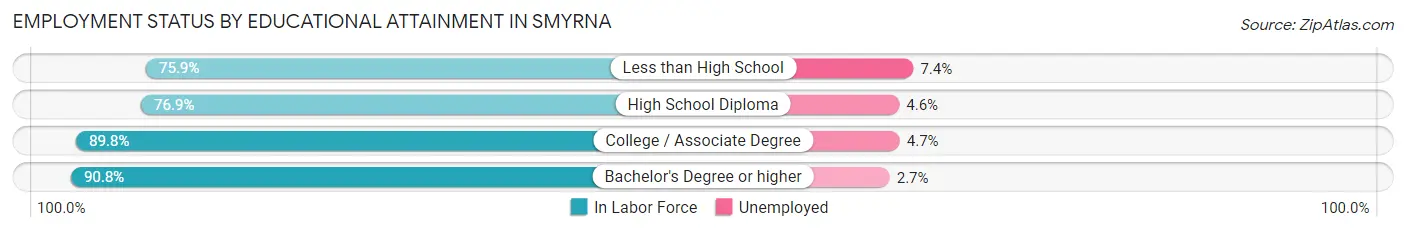
| Educational Attainment | In Labor Force | Unemployed |
| Less than High School | 1,161 (75.9%) | 113 (7.4%) |
| High School Diploma | 3,053 (76.9%) | 183 (4.6%) |
| College / Associate Degree | 7,426 (89.8%) | 389 (4.7%) |
| Bachelor's Degree or higher | 18,727 (90.8%) | 557 (2.7%) |
| Total | 30,368 (88.3%) | 1,238 (3.6%) |
Employment Occupations by Sex in Smyrna
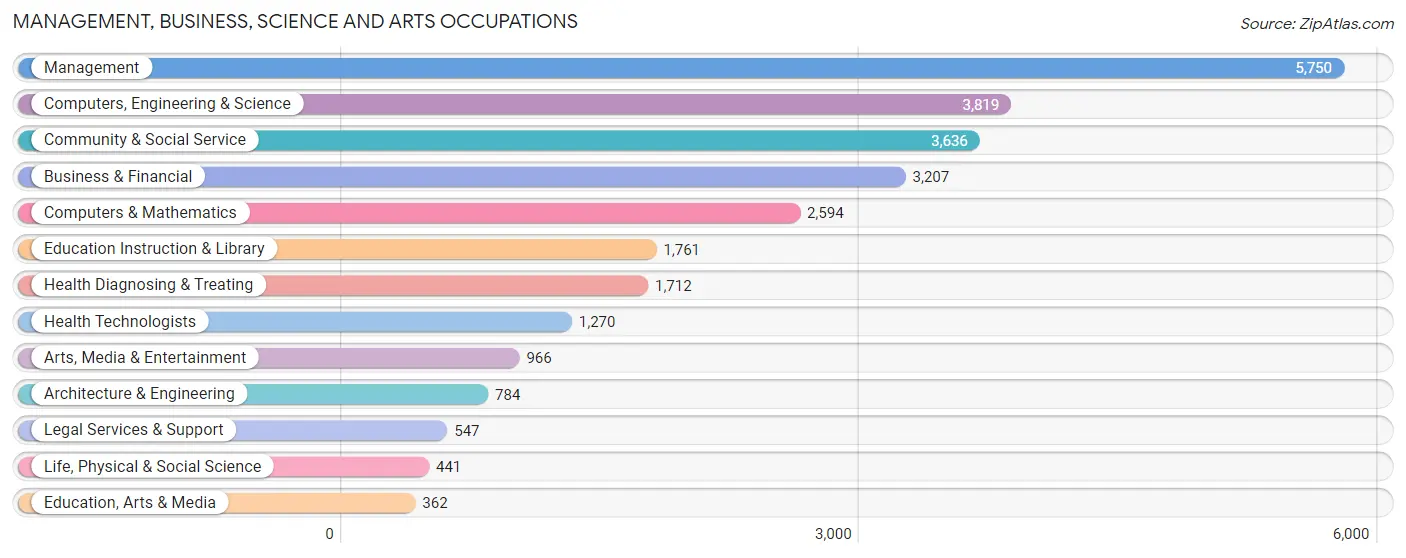
Management, Business, Science and Arts Occupations
The most common Management, Business, Science and Arts occupations in Smyrna are Management (5,750 | 17.2%), Computers, Engineering & Science (3,819 | 11.5%), Community & Social Service (3,636 | 10.9%), Business & Financial (3,207 | 9.6%), and Computers & Mathematics (2,594 | 7.8%).
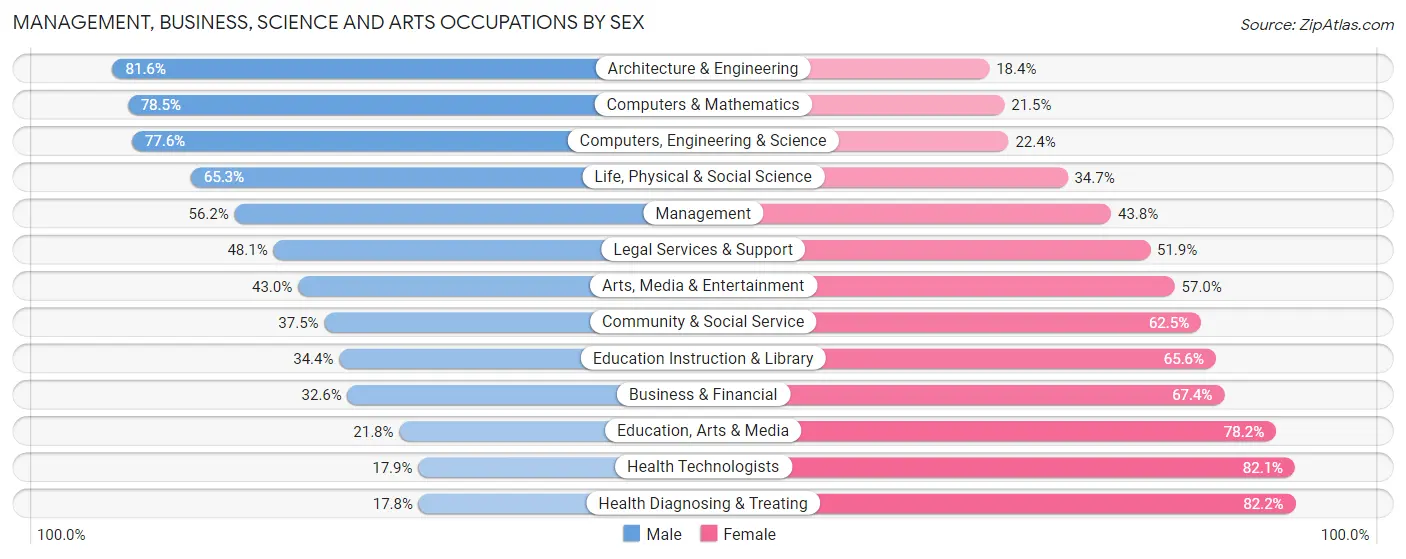
Management, Business, Science and Arts Occupations by Sex
Within the Management, Business, Science and Arts occupations in Smyrna, the most male-oriented occupations are Architecture & Engineering (81.6%), Computers & Mathematics (78.5%), and Computers, Engineering & Science (77.6%), while the most female-oriented occupations are Health Diagnosing & Treating (82.2%), Health Technologists (82.1%), and Education, Arts & Media (78.2%).
| Occupation | Male | Female |
| Management | 3,232 (56.2%) | 2,518 (43.8%) |
| Business & Financial | 1,046 (32.6%) | 2,161 (67.4%) |
| Computers, Engineering & Science | 2,964 (77.6%) | 855 (22.4%) |
| Computers & Mathematics | 2,036 (78.5%) | 558 (21.5%) |
| Architecture & Engineering | 640 (81.6%) | 144 (18.4%) |
| Life, Physical & Social Science | 288 (65.3%) | 153 (34.7%) |
| Community & Social Service | 1,362 (37.5%) | 2,274 (62.5%) |
| Education, Arts & Media | 79 (21.8%) | 283 (78.2%) |
| Legal Services & Support | 263 (48.1%) | 284 (51.9%) |
| Education Instruction & Library | 605 (34.4%) | 1,156 (65.6%) |
| Arts, Media & Entertainment | 415 (43.0%) | 551 (57.0%) |
| Health Diagnosing & Treating | 304 (17.8%) | 1,408 (82.2%) |
| Health Technologists | 227 (17.9%) | 1,043 (82.1%) |
| Total (Category) | 8,908 (49.1%) | 9,216 (50.8%) |
| Total (Overall) | 16,602 (49.8%) | 16,757 (50.2%) |
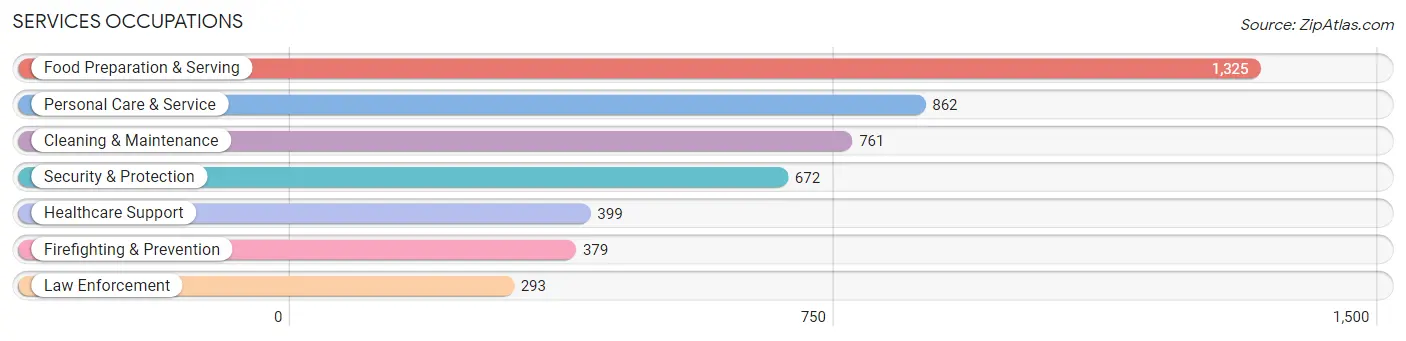
Services Occupations
The most common Services occupations in Smyrna are Food Preparation & Serving (1,325 | 4.0%), Personal Care & Service (862 | 2.6%), Cleaning & Maintenance (761 | 2.3%), Security & Protection (672 | 2.0%), and Healthcare Support (399 | 1.2%).
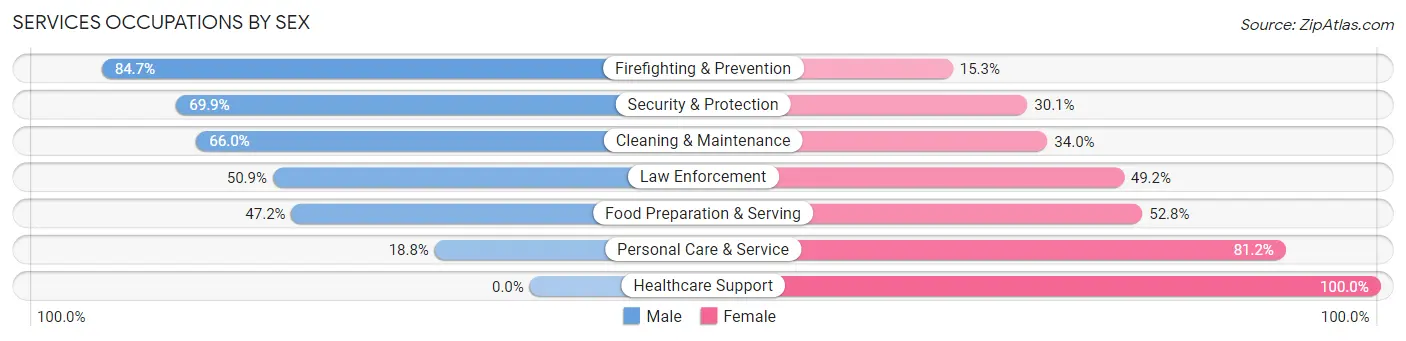
Services Occupations by Sex
Within the Services occupations in Smyrna, the most male-oriented occupations are Firefighting & Prevention (84.7%), Security & Protection (69.9%), and Cleaning & Maintenance (66.0%), while the most female-oriented occupations are Healthcare Support (100.0%), Personal Care & Service (81.2%), and Food Preparation & Serving (52.8%).
| Occupation | Male | Female |
| Healthcare Support | 0 (0.0%) | 399 (100.0%) |
| Security & Protection | 470 (69.9%) | 202 (30.1%) |
| Firefighting & Prevention | 321 (84.7%) | 58 (15.3%) |
| Law Enforcement | 149 (50.8%) | 144 (49.1%) |
| Food Preparation & Serving | 625 (47.2%) | 700 (52.8%) |
| Cleaning & Maintenance | 502 (66.0%) | 259 (34.0%) |
| Personal Care & Service | 162 (18.8%) | 700 (81.2%) |
| Total (Category) | 1,759 (43.8%) | 2,260 (56.2%) |
| Total (Overall) | 16,602 (49.8%) | 16,757 (50.2%) |
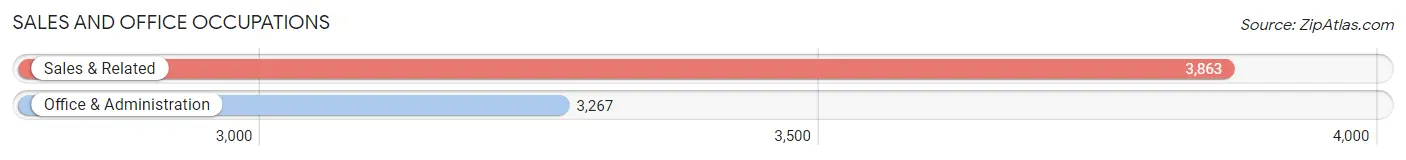
Sales and Office Occupations
The most common Sales and Office occupations in Smyrna are Sales & Related (3,863 | 11.6%), and Office & Administration (3,267 | 9.8%).
Sales and Office Occupations by Sex
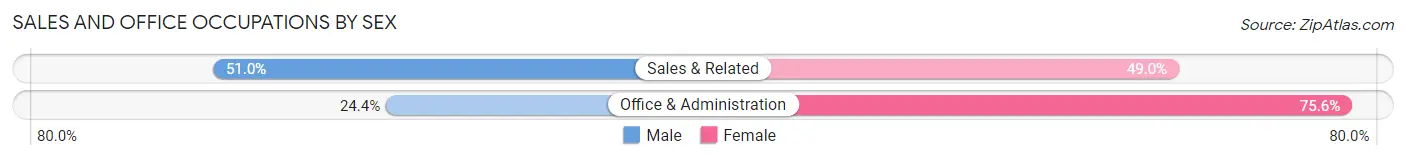
| Occupation | Male | Female |
| Sales & Related | 1,971 (51.0%) | 1,892 (49.0%) |
| Office & Administration | 797 (24.4%) | 2,470 (75.6%) |
| Total (Category) | 2,768 (38.8%) | 4,362 (61.2%) |
| Total (Overall) | 16,602 (49.8%) | 16,757 (50.2%) |
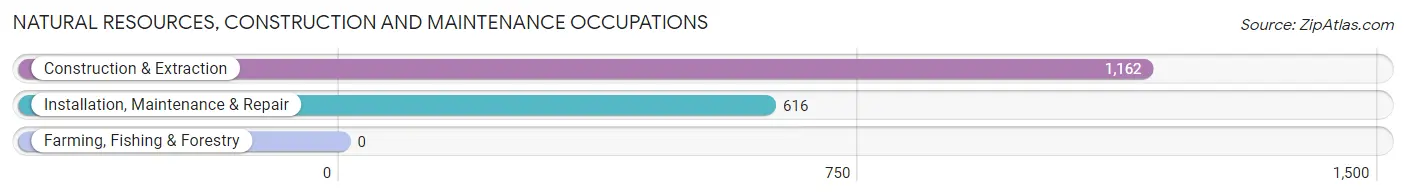
Natural Resources, Construction and Maintenance Occupations
The most common Natural Resources, Construction and Maintenance occupations in Smyrna are Construction & Extraction (1,162 | 3.5%), and Installation, Maintenance & Repair (616 | 1.8%).
Natural Resources, Construction and Maintenance Occupations by Sex
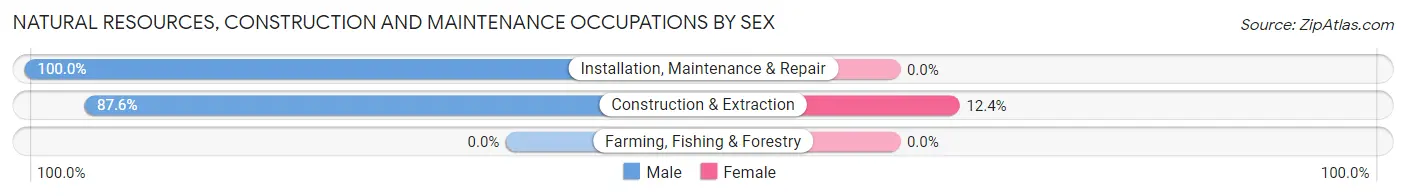
| Occupation | Male | Female |
| Farming, Fishing & Forestry | 0 (0.0%) | 0 (0.0%) |
| Construction & Extraction | 1,018 (87.6%) | 144 (12.4%) |
| Installation, Maintenance & Repair | 616 (100.0%) | 0 (0.0%) |
| Total (Category) | 1,634 (91.9%) | 144 (8.1%) |
| Total (Overall) | 16,602 (49.8%) | 16,757 (50.2%) |
Production, Transportation and Moving Occupations
The most common Production, Transportation and Moving occupations in Smyrna are Transportation (1,220 | 3.7%), Material Moving (717 | 2.1%), and Production (371 | 1.1%).
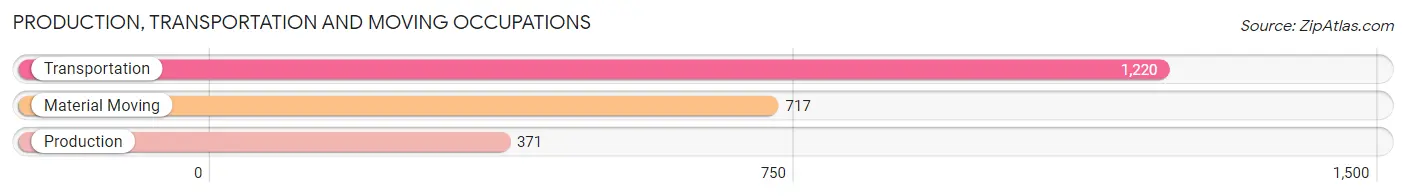
Production, Transportation and Moving Occupations by Sex
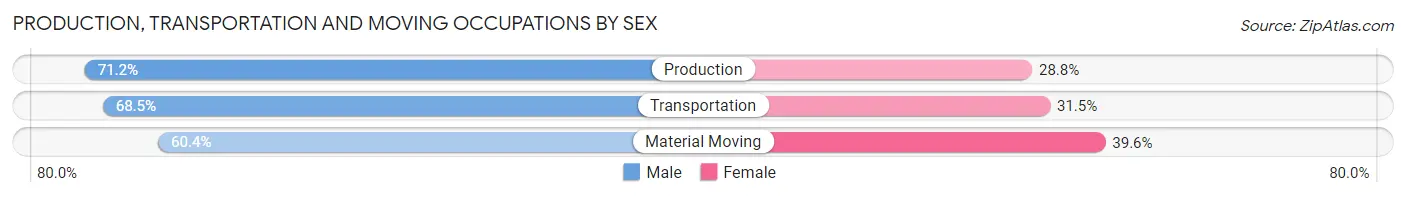
| Occupation | Male | Female |
| Production | 264 (71.2%) | 107 (28.8%) |
| Transportation | 836 (68.5%) | 384 (31.5%) |
| Material Moving | 433 (60.4%) | 284 (39.6%) |
| Total (Category) | 1,533 (66.4%) | 775 (33.6%) |
| Total (Overall) | 16,602 (49.8%) | 16,757 (50.2%) |
Employment Industries by Sex in Smyrna
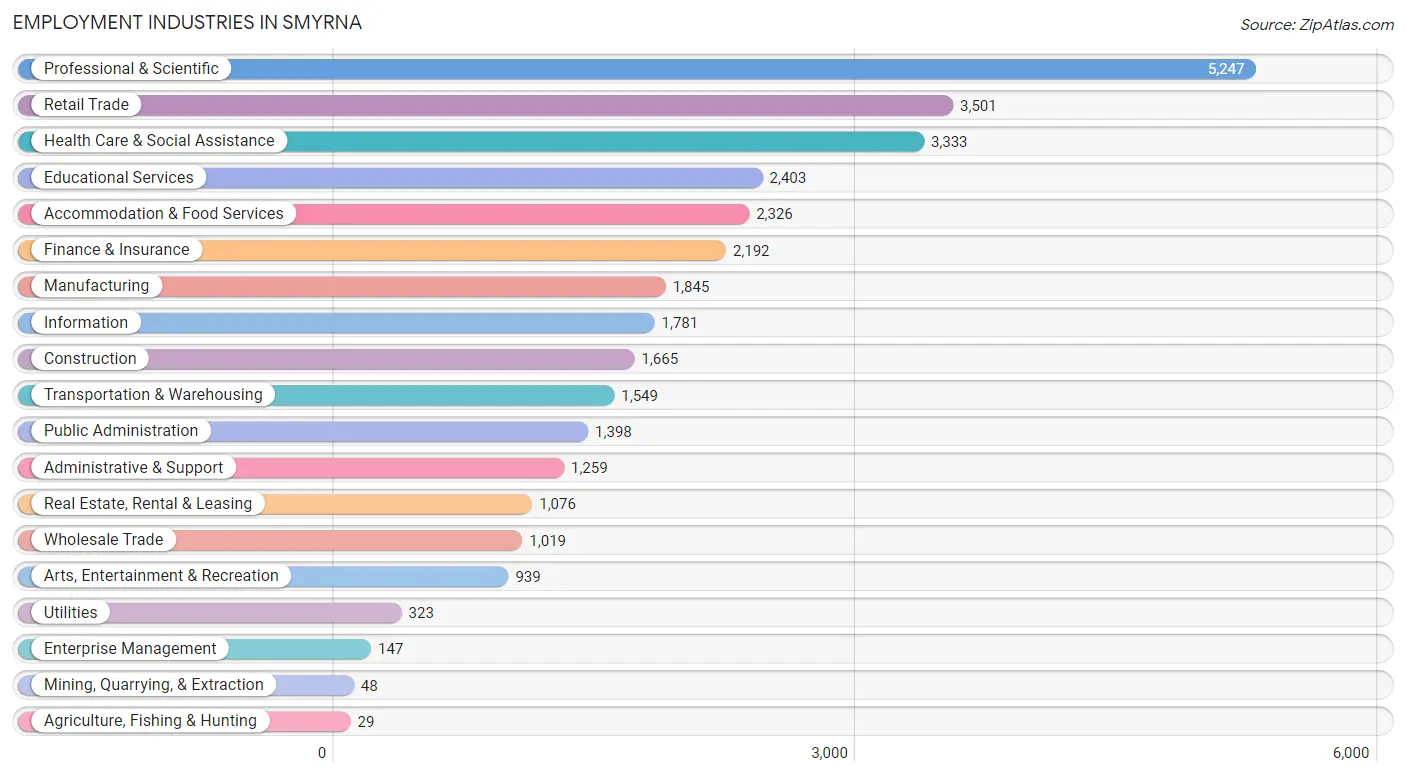
Employment Industries in Smyrna
The major employment industries in Smyrna include Professional & Scientific (5,247 | 15.7%), Retail Trade (3,501 | 10.5%), Health Care & Social Assistance (3,333 | 10.0%), Educational Services (2,403 | 7.2%), and Accommodation & Food Services (2,326 | 7.0%).
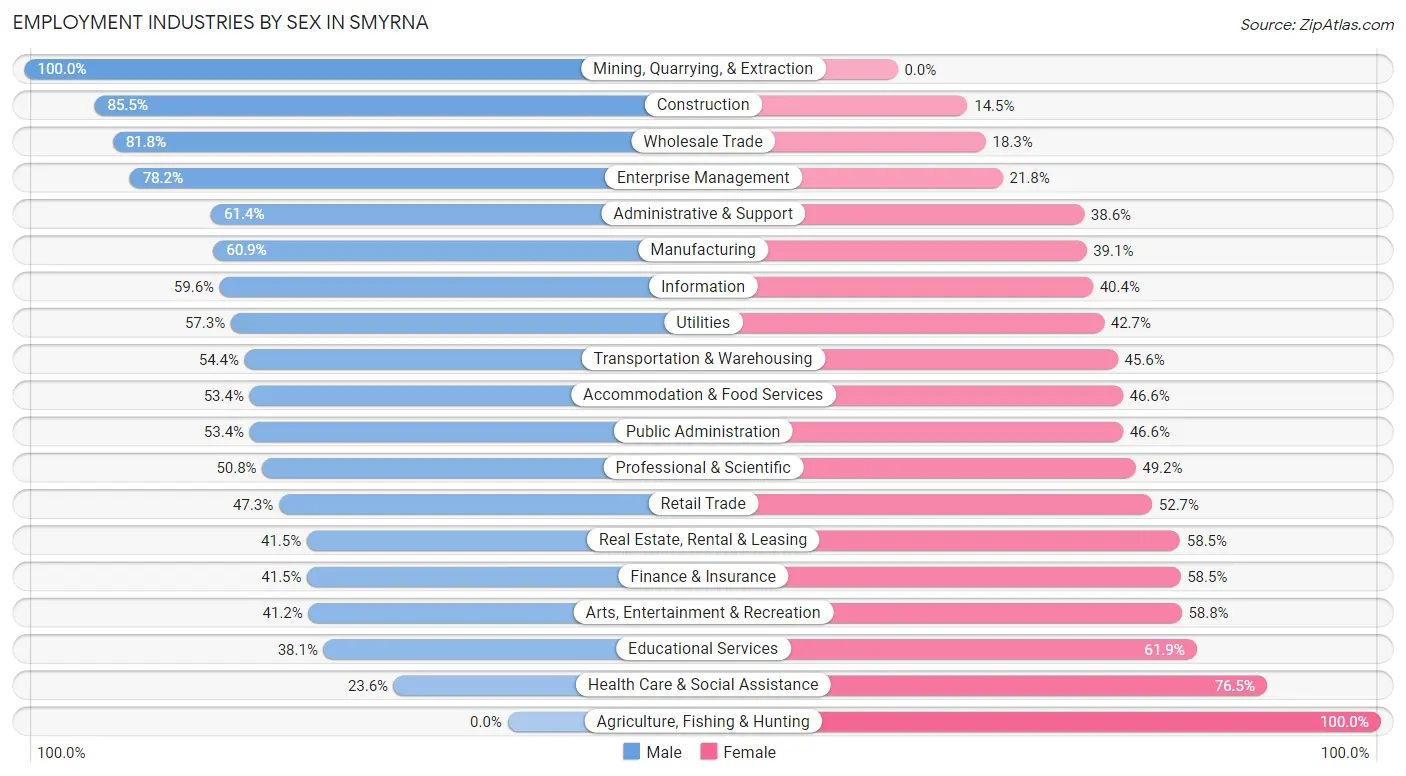
Employment Industries by Sex in Smyrna
The Smyrna industries that see more men than women are Mining, Quarrying, & Extraction (100.0%), Construction (85.5%), and Wholesale Trade (81.8%), whereas the industries that tend to have a higher number of women are Agriculture, Fishing & Hunting (100.0%), Health Care & Social Assistance (76.4%), and Educational Services (61.9%).
| Industry | Male | Female |
| Agriculture, Fishing & Hunting | 0 (0.0%) | 29 (100.0%) |
| Mining, Quarrying, & Extraction | 48 (100.0%) | 0 (0.0%) |
| Construction | 1,424 (85.5%) | 241 (14.5%) |
| Manufacturing | 1,124 (60.9%) | 721 (39.1%) |
| Wholesale Trade | 833 (81.8%) | 186 (18.2%) |
| Retail Trade | 1,657 (47.3%) | 1,844 (52.7%) |
| Transportation & Warehousing | 843 (54.4%) | 706 (45.6%) |
| Utilities | 185 (57.3%) | 138 (42.7%) |
| Information | 1,061 (59.6%) | 720 (40.4%) |
| Finance & Insurance | 909 (41.5%) | 1,283 (58.5%) |
| Real Estate, Rental & Leasing | 447 (41.5%) | 629 (58.5%) |
| Professional & Scientific | 2,664 (50.8%) | 2,583 (49.2%) |
| Enterprise Management | 115 (78.2%) | 32 (21.8%) |
| Administrative & Support | 773 (61.4%) | 486 (38.6%) |
| Educational Services | 915 (38.1%) | 1,488 (61.9%) |
| Health Care & Social Assistance | 785 (23.5%) | 2,548 (76.4%) |
| Arts, Entertainment & Recreation | 387 (41.2%) | 552 (58.8%) |
| Accommodation & Food Services | 1,242 (53.4%) | 1,084 (46.6%) |
| Public Administration | 746 (53.4%) | 652 (46.6%) |
| Total | 16,602 (49.8%) | 16,757 (50.2%) |
Education in Smyrna
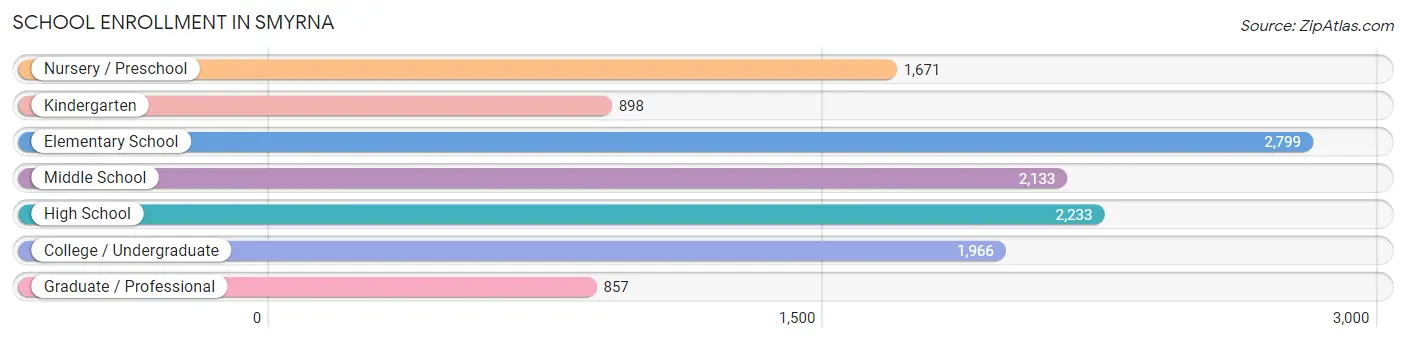
School Enrollment in Smyrna
The most common levels of schooling among the 12,557 students in Smyrna are elementary school (2,799 | 22.3%), high school (2,233 | 17.8%), and middle school (2,133 | 17.0%).
| School Level | # Students | % Students |
| Nursery / Preschool | 1,671 | 13.3% |
| Kindergarten | 898 | 7.1% |
| Elementary School | 2,799 | 22.3% |
| Middle School | 2,133 | 17.0% |
| High School | 2,233 | 17.8% |
| College / Undergraduate | 1,966 | 15.7% |
| Graduate / Professional | 857 | 6.8% |
| Total | 12,557 | 100.0% |
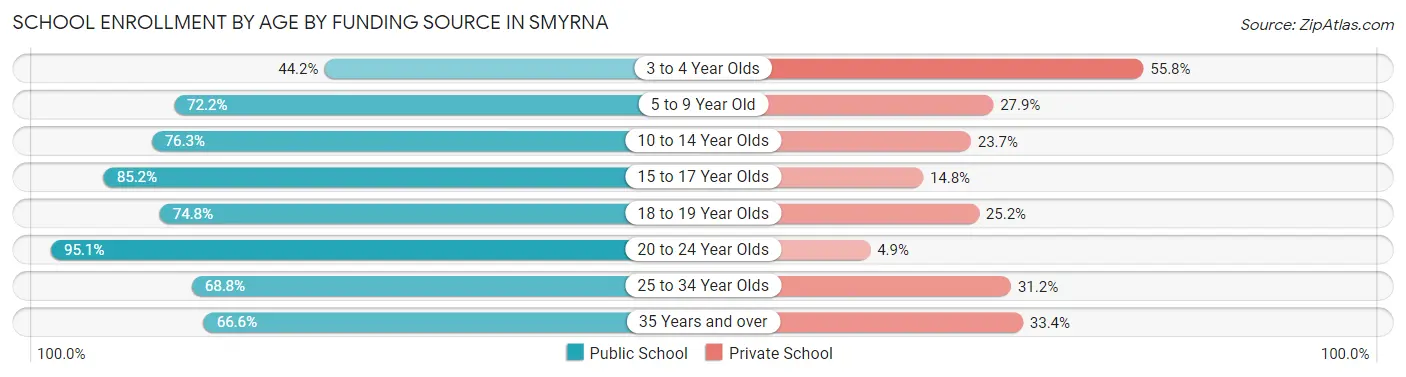
School Enrollment by Age by Funding Source in Smyrna
Out of a total of 12,557 students who are enrolled in schools in Smyrna, 3,416 (27.2%) attend a private institution, while the remaining 9,141 (72.8%) are enrolled in public schools. The age group of 3 to 4 year olds has the highest likelihood of being enrolled in private schools, with 715 (55.8% in the age bracket) enrolled. Conversely, the age group of 20 to 24 year olds has the lowest likelihood of being enrolled in a private school, with 769 (95.1% in the age bracket) attending a public institution.
| Age Bracket | Public School | Private School |
| 3 to 4 Year Olds | 566 (44.2%) | 715 (55.8%) |
| 5 to 9 Year Old | 2,723 (72.2%) | 1,051 (27.9%) |
| 10 to 14 Year Olds | 2,069 (76.3%) | 642 (23.7%) |
| 15 to 17 Year Olds | 1,287 (85.2%) | 223 (14.8%) |
| 18 to 19 Year Olds | 502 (74.8%) | 169 (25.2%) |
| 20 to 24 Year Olds | 769 (95.1%) | 40 (4.9%) |
| 25 to 34 Year Olds | 749 (68.8%) | 339 (31.2%) |
| 35 Years and over | 475 (66.6%) | 238 (33.4%) |
| Total | 9,141 (72.8%) | 3,416 (27.2%) |
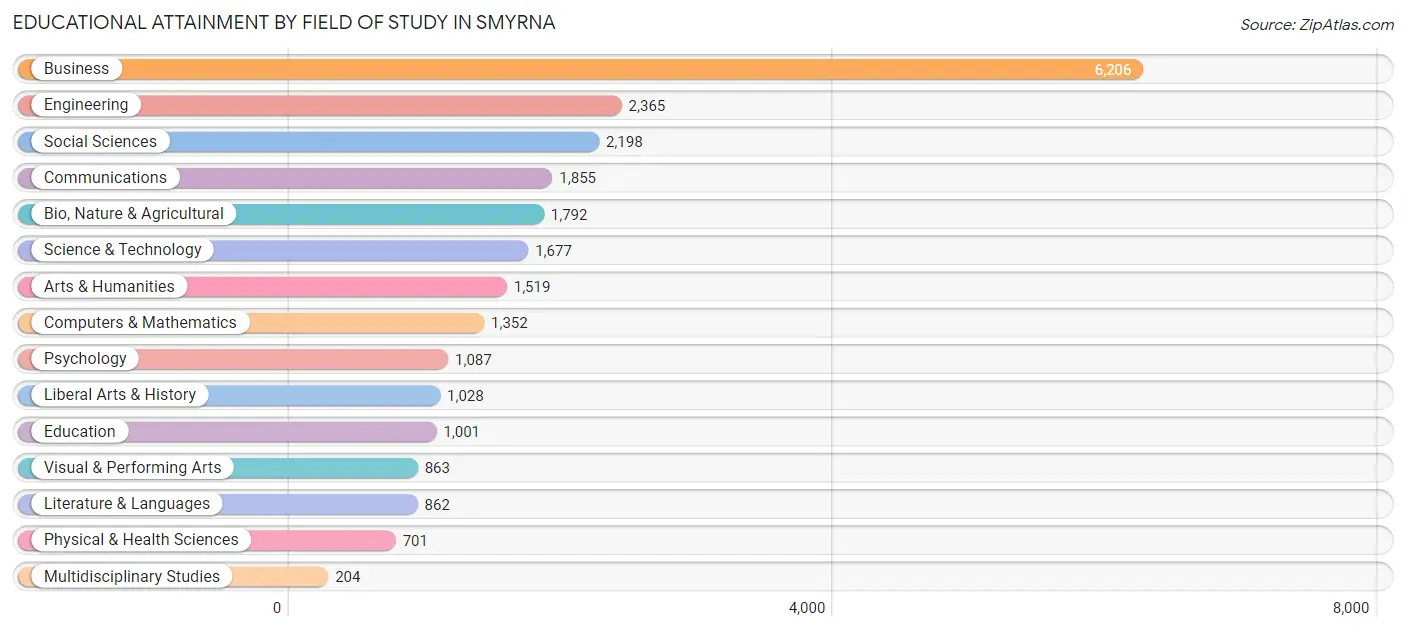
Educational Attainment by Field of Study in Smyrna
Business (6,206 | 25.1%), engineering (2,365 | 9.6%), social sciences (2,198 | 8.9%), communications (1,855 | 7.5%), and bio, nature & agricultural (1,792 | 7.2%) are the most common fields of study among 24,710 individuals in Smyrna who have obtained a bachelor's degree or higher.
| Field of Study | # Graduates | % Graduates |
| Computers & Mathematics | 1,352 | 5.5% |
| Bio, Nature & Agricultural | 1,792 | 7.2% |
| Physical & Health Sciences | 701 | 2.8% |
| Psychology | 1,087 | 4.4% |
| Social Sciences | 2,198 | 8.9% |
| Engineering | 2,365 | 9.6% |
| Multidisciplinary Studies | 204 | 0.8% |
| Science & Technology | 1,677 | 6.8% |
| Business | 6,206 | 25.1% |
| Education | 1,001 | 4.1% |
| Literature & Languages | 862 | 3.5% |
| Liberal Arts & History | 1,028 | 4.2% |
| Visual & Performing Arts | 863 | 3.5% |
| Communications | 1,855 | 7.5% |
| Arts & Humanities | 1,519 | 6.1% |
| Total | 24,710 | 100.0% |
Transportation & Commute in Smyrna
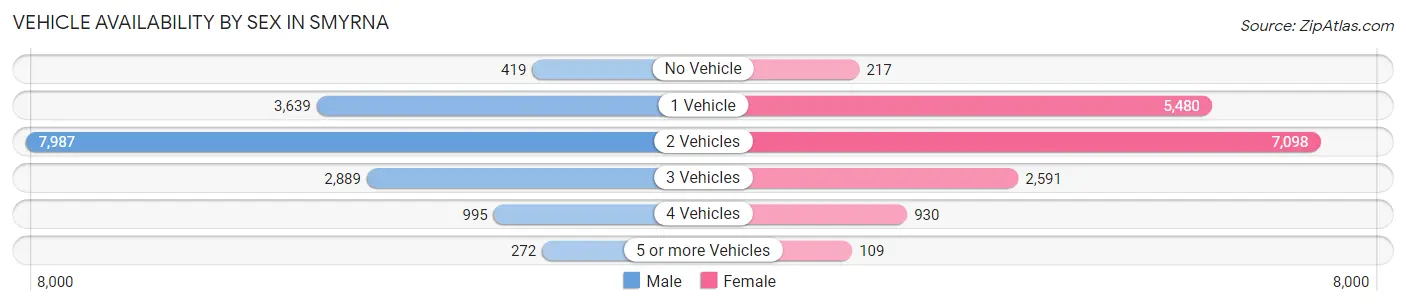
Vehicle Availability by Sex in Smyrna
The most prevalent vehicle ownership categories in Smyrna are males with 2 vehicles (7,987, accounting for 49.3%) and females with 2 vehicles (7,098, making up 48.6%).
| Vehicles Available | Male | Female |
| No Vehicle | 419 (2.6%) | 217 (1.3%) |
| 1 Vehicle | 3,639 (22.5%) | 5,480 (33.4%) |
| 2 Vehicles | 7,987 (49.3%) | 7,098 (43.2%) |
| 3 Vehicles | 2,889 (17.8%) | 2,591 (15.8%) |
| 4 Vehicles | 995 (6.1%) | 930 (5.7%) |
| 5 or more Vehicles | 272 (1.7%) | 109 (0.7%) |
| Total | 16,201 (100.0%) | 16,425 (100.0%) |
Commute Time in Smyrna
The most frequently occuring commute durations in Smyrna are 30 to 34 minutes (4,512 commuters, 18.2%), 20 to 24 minutes (3,663 commuters, 14.8%), and 15 to 19 minutes (3,189 commuters, 12.9%).
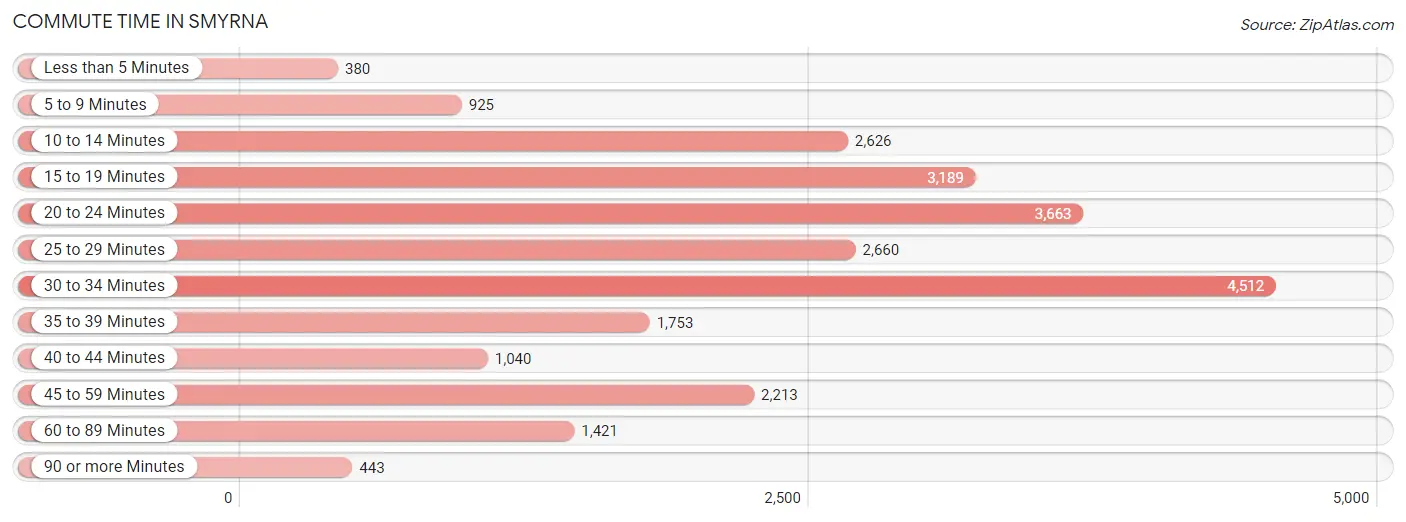
| Commute Time | # Commuters | % Commuters |
| Less than 5 Minutes | 380 | 1.5% |
| 5 to 9 Minutes | 925 | 3.7% |
| 10 to 14 Minutes | 2,626 | 10.6% |
| 15 to 19 Minutes | 3,189 | 12.9% |
| 20 to 24 Minutes | 3,663 | 14.8% |
| 25 to 29 Minutes | 2,660 | 10.7% |
| 30 to 34 Minutes | 4,512 | 18.2% |
| 35 to 39 Minutes | 1,753 | 7.1% |
| 40 to 44 Minutes | 1,040 | 4.2% |
| 45 to 59 Minutes | 2,213 | 8.9% |
| 60 to 89 Minutes | 1,421 | 5.7% |
| 90 or more Minutes | 443 | 1.8% |
Commute Time by Sex in Smyrna
The most common commute times in Smyrna are 30 to 34 minutes (2,563 commuters, 20.6%) for males and 20 to 24 minutes (2,107 commuters, 17.0%) for females.
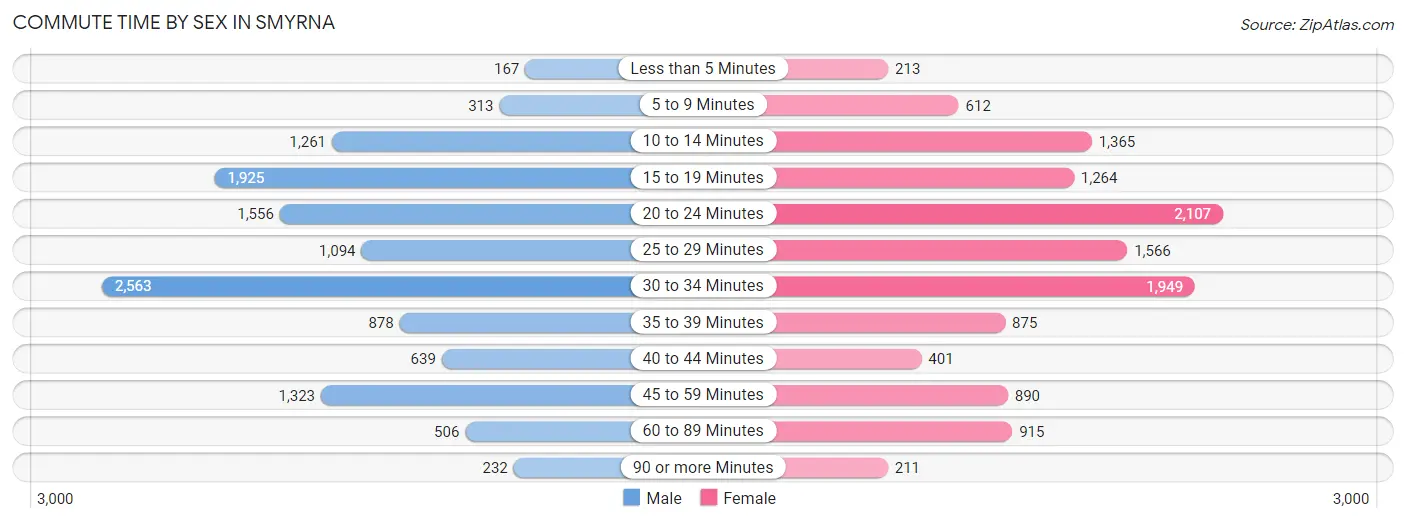
| Commute Time | Male | Female |
| Less than 5 Minutes | 167 (1.3%) | 213 (1.7%) |
| 5 to 9 Minutes | 313 (2.5%) | 612 (5.0%) |
| 10 to 14 Minutes | 1,261 (10.1%) | 1,365 (11.0%) |
| 15 to 19 Minutes | 1,925 (15.4%) | 1,264 (10.2%) |
| 20 to 24 Minutes | 1,556 (12.5%) | 2,107 (17.0%) |
| 25 to 29 Minutes | 1,094 (8.8%) | 1,566 (12.7%) |
| 30 to 34 Minutes | 2,563 (20.6%) | 1,949 (15.8%) |
| 35 to 39 Minutes | 878 (7.0%) | 875 (7.1%) |
| 40 to 44 Minutes | 639 (5.1%) | 401 (3.2%) |
| 45 to 59 Minutes | 1,323 (10.6%) | 890 (7.2%) |
| 60 to 89 Minutes | 506 (4.1%) | 915 (7.4%) |
| 90 or more Minutes | 232 (1.9%) | 211 (1.7%) |
Time of Departure to Work by Sex in Smyrna
The most frequent times of departure to work in Smyrna are 7:00 AM to 7:29 AM (1,812, 14.5%) for males and 7:30 AM to 7:59 AM (2,275, 18.4%) for females.
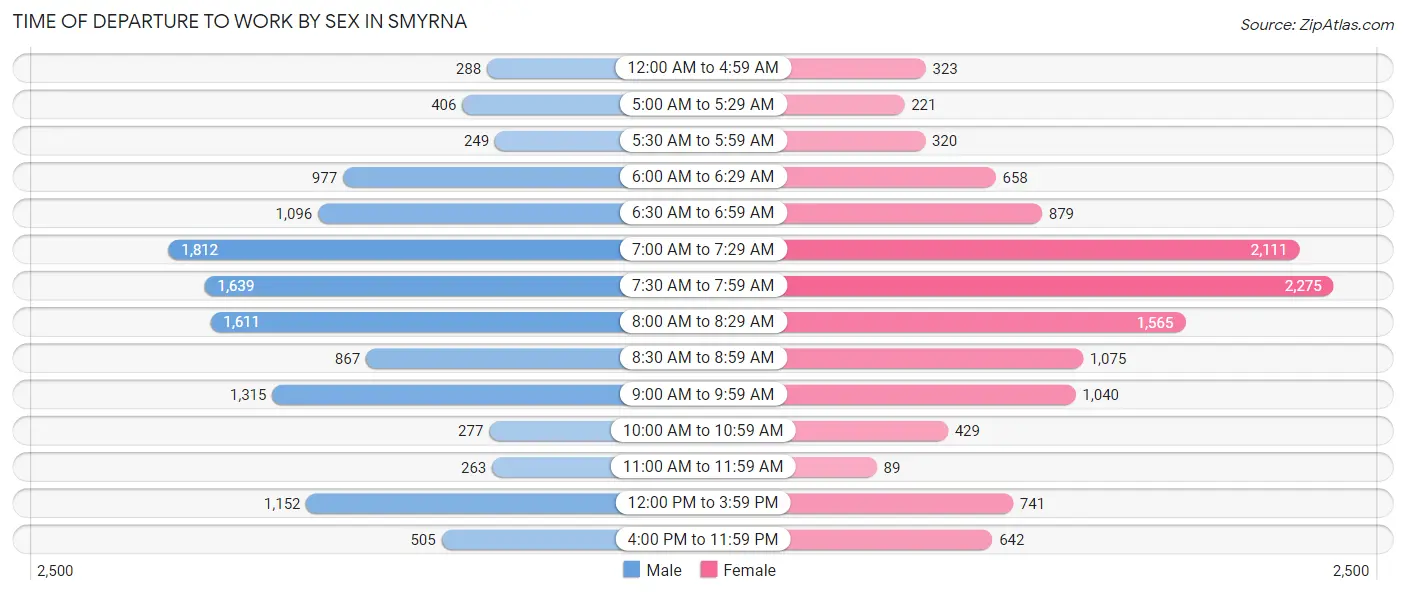
| Time of Departure | Male | Female |
| 12:00 AM to 4:59 AM | 288 (2.3%) | 323 (2.6%) |
| 5:00 AM to 5:29 AM | 406 (3.3%) | 221 (1.8%) |
| 5:30 AM to 5:59 AM | 249 (2.0%) | 320 (2.6%) |
| 6:00 AM to 6:29 AM | 977 (7.8%) | 658 (5.3%) |
| 6:30 AM to 6:59 AM | 1,096 (8.8%) | 879 (7.1%) |
| 7:00 AM to 7:29 AM | 1,812 (14.5%) | 2,111 (17.1%) |
| 7:30 AM to 7:59 AM | 1,639 (13.2%) | 2,275 (18.4%) |
| 8:00 AM to 8:29 AM | 1,611 (12.9%) | 1,565 (12.7%) |
| 8:30 AM to 8:59 AM | 867 (7.0%) | 1,075 (8.7%) |
| 9:00 AM to 9:59 AM | 1,315 (10.6%) | 1,040 (8.4%) |
| 10:00 AM to 10:59 AM | 277 (2.2%) | 429 (3.5%) |
| 11:00 AM to 11:59 AM | 263 (2.1%) | 89 (0.7%) |
| 12:00 PM to 3:59 PM | 1,152 (9.2%) | 741 (6.0%) |
| 4:00 PM to 11:59 PM | 505 (4.1%) | 642 (5.2%) |
| Total | 12,457 (100.0%) | 12,368 (100.0%) |
Housing Occupancy in Smyrna
Occupancy by Ownership in Smyrna
Of the total 24,694 dwellings in Smyrna, owner-occupied units account for 14,131 (57.2%), while renter-occupied units make up 10,563 (42.8%).
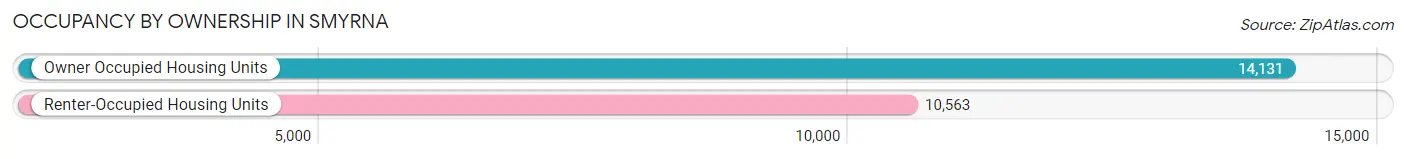
| Occupancy | # Housing Units | % Housing Units |
| Owner Occupied Housing Units | 14,131 | 57.2% |
| Renter-Occupied Housing Units | 10,563 | 42.8% |
| Total Occupied Housing Units | 24,694 | 100.0% |
Occupancy by Household Size in Smyrna
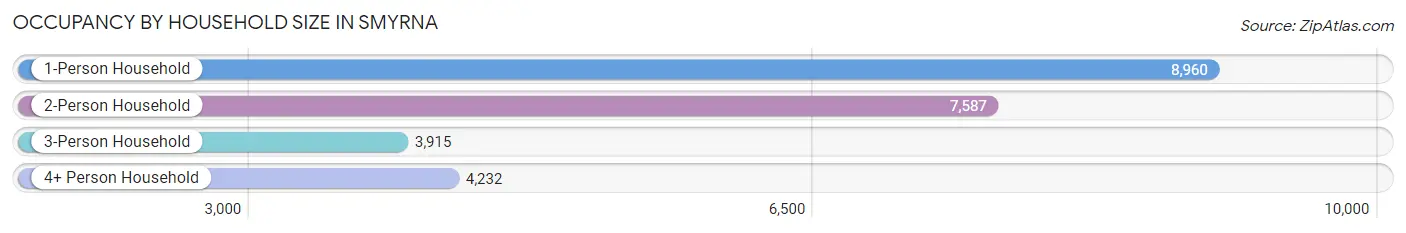
| Household Size | # Housing Units | % Housing Units |
| 1-Person Household | 8,960 | 36.3% |
| 2-Person Household | 7,587 | 30.7% |
| 3-Person Household | 3,915 | 15.9% |
| 4+ Person Household | 4,232 | 17.1% |
| Total Housing Units | 24,694 | 100.0% |
Occupancy by Ownership by Household Size in Smyrna
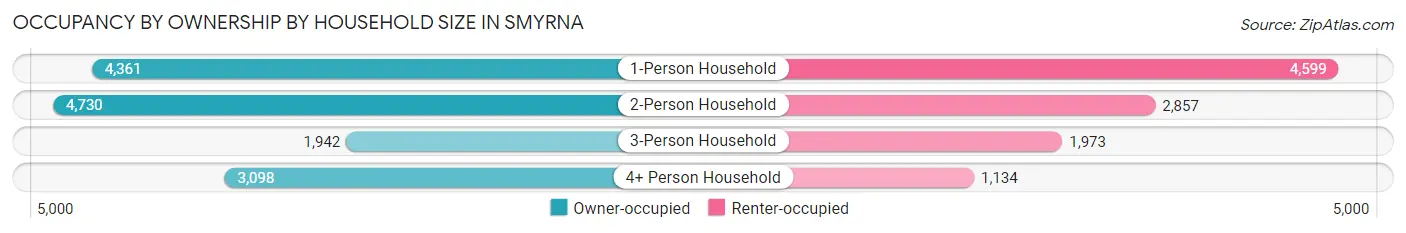
| Household Size | Owner-occupied | Renter-occupied |
| 1-Person Household | 4,361 (48.7%) | 4,599 (51.3%) |
| 2-Person Household | 4,730 (62.3%) | 2,857 (37.7%) |
| 3-Person Household | 1,942 (49.6%) | 1,973 (50.4%) |
| 4+ Person Household | 3,098 (73.2%) | 1,134 (26.8%) |
| Total Housing Units | 14,131 (57.2%) | 10,563 (42.8%) |
Occupancy by Educational Attainment in Smyrna
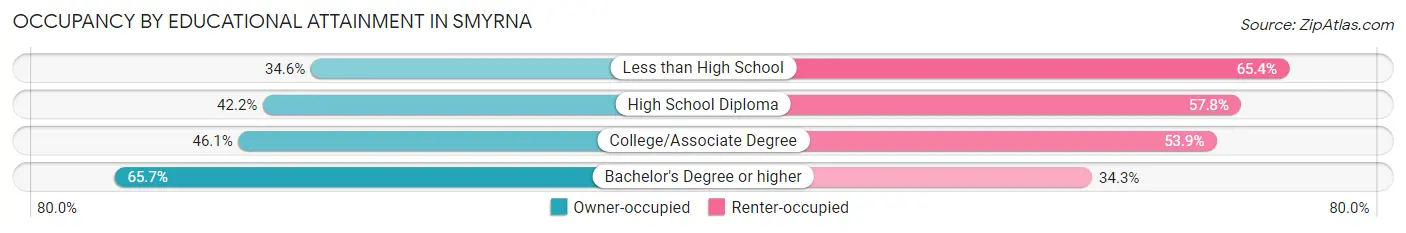
| Household Size | Owner-occupied | Renter-occupied |
| Less than High School | 308 (34.6%) | 583 (65.4%) |
| High School Diploma | 898 (42.2%) | 1,232 (57.8%) |
| College/Associate Degree | 3,098 (46.1%) | 3,626 (53.9%) |
| Bachelor's Degree or higher | 9,827 (65.7%) | 5,122 (34.3%) |
Occupancy by Age of Householder in Smyrna
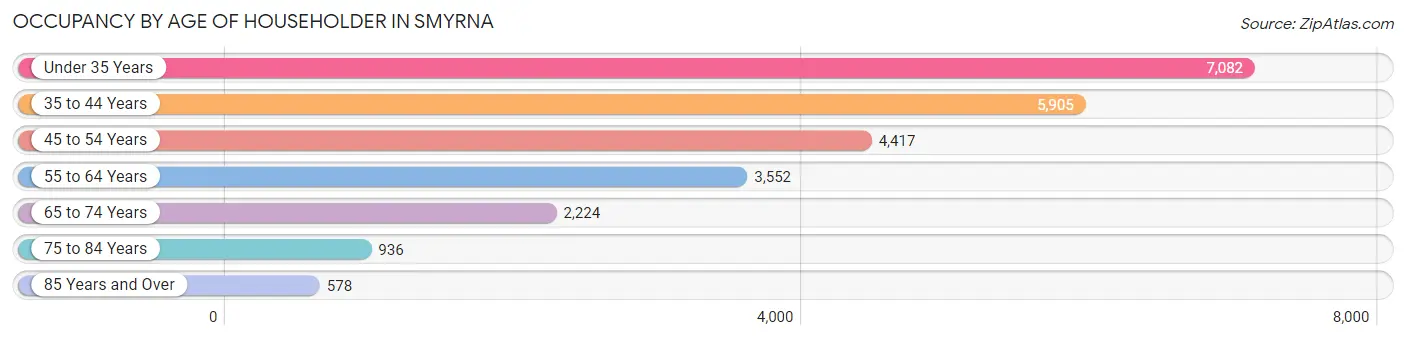
| Age Bracket | # Households | % Households |
| Under 35 Years | 7,082 | 28.7% |
| 35 to 44 Years | 5,905 | 23.9% |
| 45 to 54 Years | 4,417 | 17.9% |
| 55 to 64 Years | 3,552 | 14.4% |
| 65 to 74 Years | 2,224 | 9.0% |
| 75 to 84 Years | 936 | 3.8% |
| 85 Years and Over | 578 | 2.3% |
| Total | 24,694 | 100.0% |
Housing Finances in Smyrna
Median Income by Occupancy in Smyrna
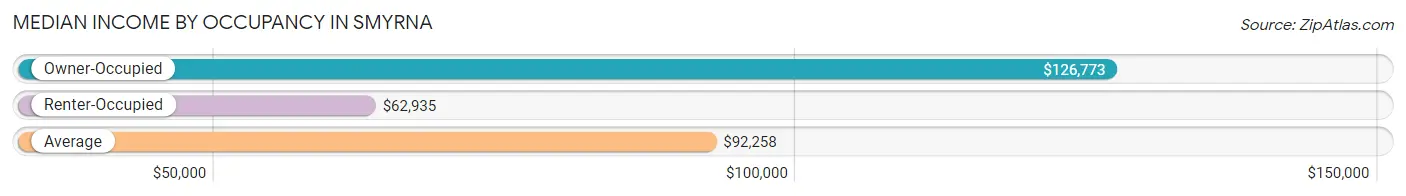
| Occupancy Type | # Households | Median Income |
| Owner-Occupied | 14,131 (57.2%) | $126,773 |
| Renter-Occupied | 10,563 (42.8%) | $62,935 |
| Average | 24,694 (100.0%) | $92,258 |
Occupancy by Householder Income Bracket in Smyrna
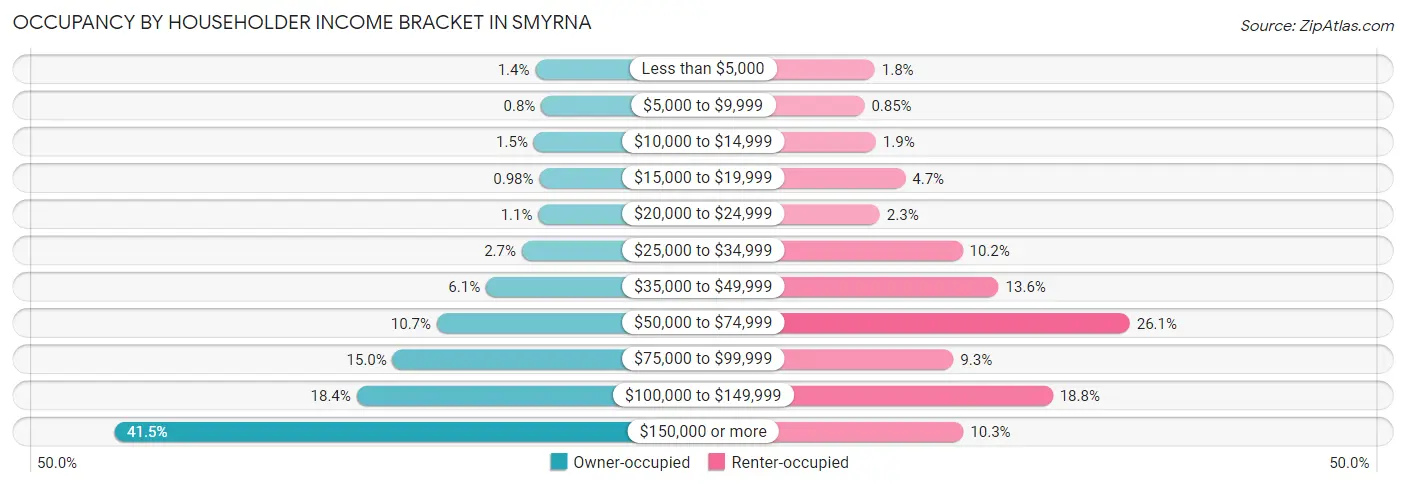
| Income Bracket | Owner-occupied | Renter-occupied |
| Less than $5,000 | 192 (1.4%) | 194 (1.8%) |
| $5,000 to $9,999 | 113 (0.8%) | 90 (0.9%) |
| $10,000 to $14,999 | 214 (1.5%) | 205 (1.9%) |
| $15,000 to $19,999 | 139 (1.0%) | 501 (4.7%) |
| $20,000 to $24,999 | 152 (1.1%) | 245 (2.3%) |
| $25,000 to $34,999 | 375 (2.6%) | 1,076 (10.2%) |
| $35,000 to $49,999 | 857 (6.1%) | 1,440 (13.6%) |
| $50,000 to $74,999 | 1,517 (10.7%) | 2,759 (26.1%) |
| $75,000 to $99,999 | 2,113 (14.9%) | 984 (9.3%) |
| $100,000 to $149,999 | 2,597 (18.4%) | 1,984 (18.8%) |
| $150,000 or more | 5,862 (41.5%) | 1,085 (10.3%) |
| Total | 14,131 (100.0%) | 10,563 (100.0%) |
Monthly Housing Cost Tiers in Smyrna
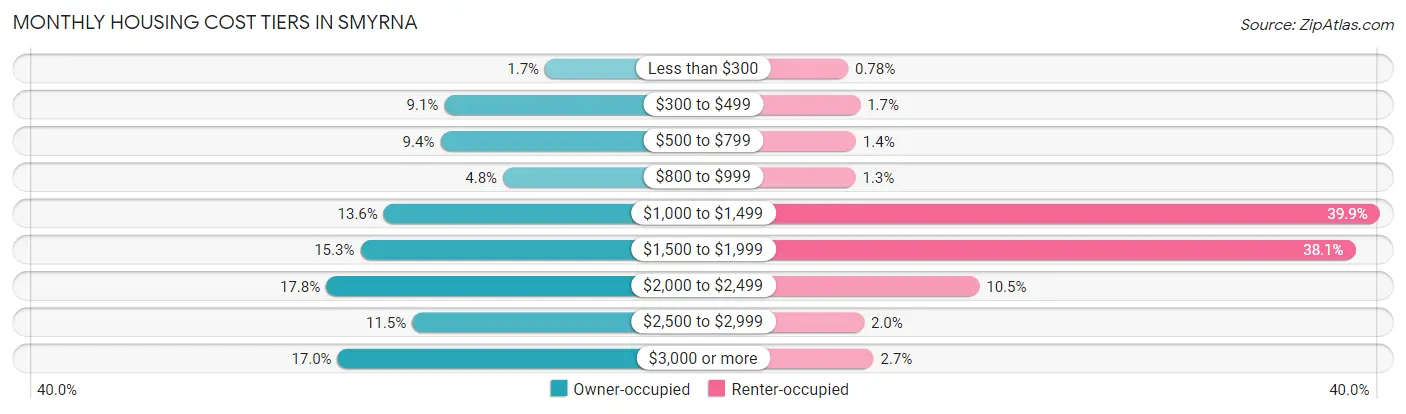
| Monthly Cost | Owner-occupied | Renter-occupied |
| Less than $300 | 237 (1.7%) | 82 (0.8%) |
| $300 to $499 | 1,286 (9.1%) | 177 (1.7%) |
| $500 to $799 | 1,327 (9.4%) | 144 (1.4%) |
| $800 to $999 | 674 (4.8%) | 141 (1.3%) |
| $1,000 to $1,499 | 1,916 (13.6%) | 4,218 (39.9%) |
| $1,500 to $1,999 | 2,159 (15.3%) | 4,029 (38.1%) |
| $2,000 to $2,499 | 2,515 (17.8%) | 1,104 (10.4%) |
| $2,500 to $2,999 | 1,620 (11.5%) | 207 (2.0%) |
| $3,000 or more | 2,397 (17.0%) | 281 (2.7%) |
| Total | 14,131 (100.0%) | 10,563 (100.0%) |
Physical Housing Characteristics in Smyrna
Housing Structures in Smyrna
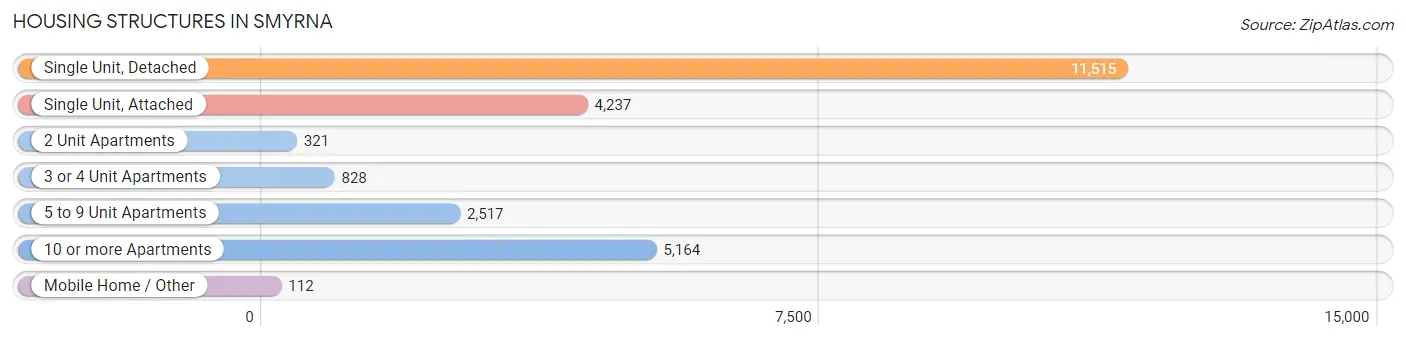
| Structure Type | # Housing Units | % Housing Units |
| Single Unit, Detached | 11,515 | 46.6% |
| Single Unit, Attached | 4,237 | 17.2% |
| 2 Unit Apartments | 321 | 1.3% |
| 3 or 4 Unit Apartments | 828 | 3.4% |
| 5 to 9 Unit Apartments | 2,517 | 10.2% |
| 10 or more Apartments | 5,164 | 20.9% |
| Mobile Home / Other | 112 | 0.4% |
| Total | 24,694 | 100.0% |
Housing Structures by Occupancy in Smyrna
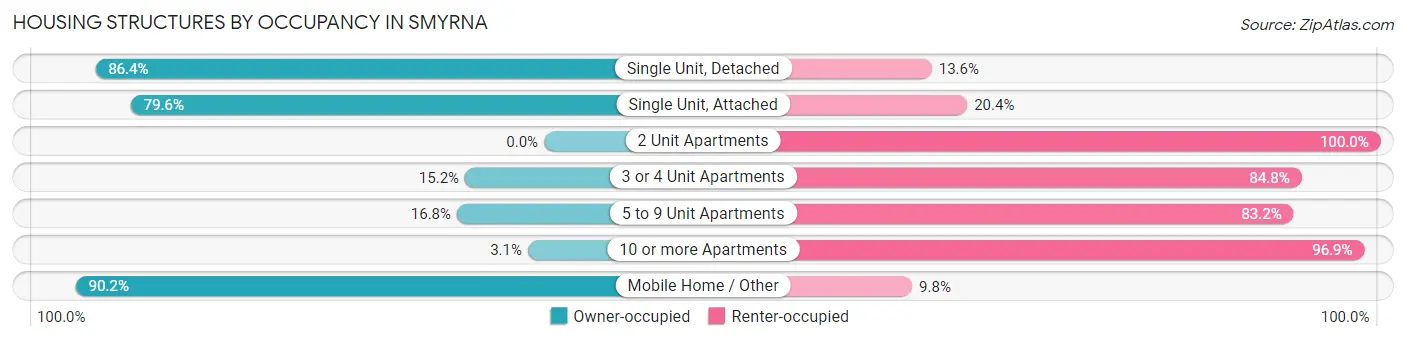
| Structure Type | Owner-occupied | Renter-occupied |
| Single Unit, Detached | 9,949 (86.4%) | 1,566 (13.6%) |
| Single Unit, Attached | 3,372 (79.6%) | 865 (20.4%) |
| 2 Unit Apartments | 0 (0.0%) | 321 (100.0%) |
| 3 or 4 Unit Apartments | 126 (15.2%) | 702 (84.8%) |
| 5 to 9 Unit Apartments | 422 (16.8%) | 2,095 (83.2%) |
| 10 or more Apartments | 161 (3.1%) | 5,003 (96.9%) |
| Mobile Home / Other | 101 (90.2%) | 11 (9.8%) |
| Total | 14,131 (57.2%) | 10,563 (42.8%) |
Housing Structures by Number of Rooms in Smyrna
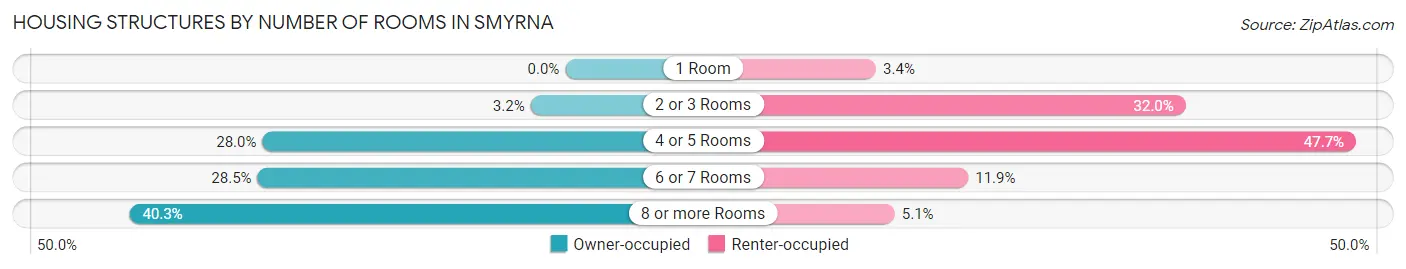
| Number of Rooms | Owner-occupied | Renter-occupied |
| 1 Room | 0 (0.0%) | 354 (3.4%) |
| 2 or 3 Rooms | 453 (3.2%) | 3,377 (32.0%) |
| 4 or 5 Rooms | 3,960 (28.0%) | 5,041 (47.7%) |
| 6 or 7 Rooms | 4,023 (28.5%) | 1,254 (11.9%) |
| 8 or more Rooms | 5,695 (40.3%) | 537 (5.1%) |
| Total | 14,131 (100.0%) | 10,563 (100.0%) |
Housing Structure by Heating Type in Smyrna
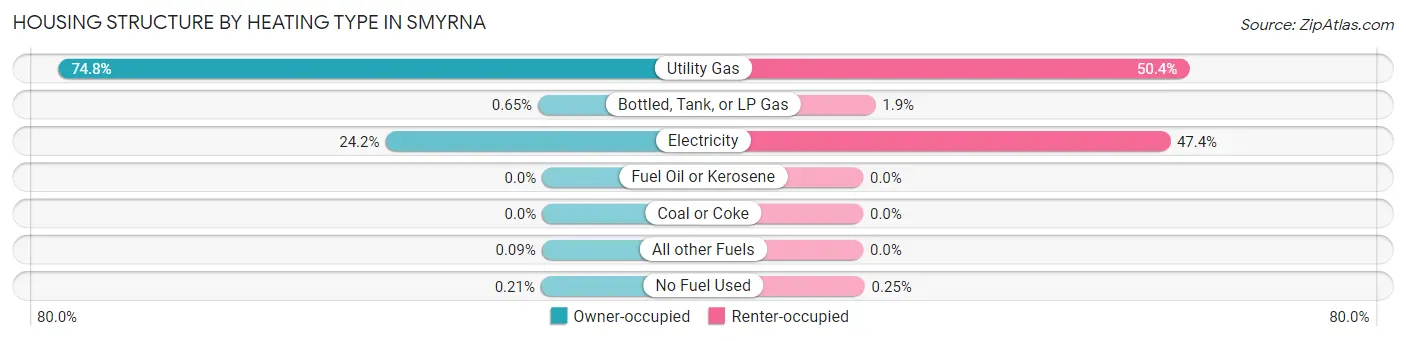
| Heating Type | Owner-occupied | Renter-occupied |
| Utility Gas | 10,570 (74.8%) | 5,325 (50.4%) |
| Bottled, Tank, or LP Gas | 92 (0.6%) | 201 (1.9%) |
| Electricity | 3,426 (24.2%) | 5,011 (47.4%) |
| Fuel Oil or Kerosene | 0 (0.0%) | 0 (0.0%) |
| Coal or Coke | 0 (0.0%) | 0 (0.0%) |
| All other Fuels | 13 (0.1%) | 0 (0.0%) |
| No Fuel Used | 30 (0.2%) | 26 (0.3%) |
| Total | 14,131 (100.0%) | 10,563 (100.0%) |
Household Vehicle Usage in Smyrna
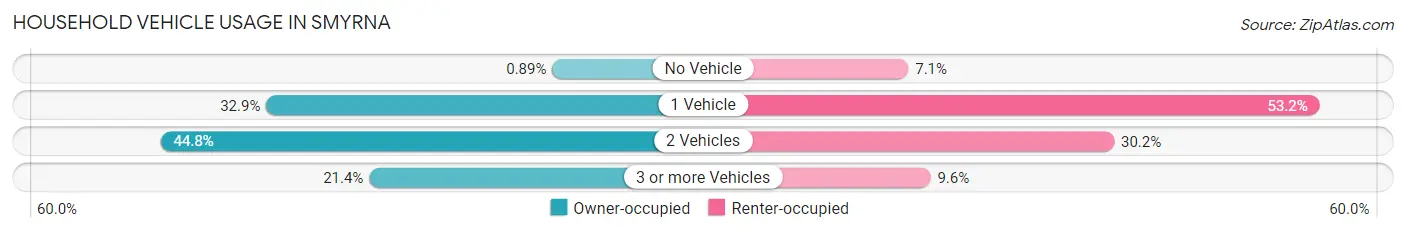
| Vehicles per Household | Owner-occupied | Renter-occupied |
| No Vehicle | 126 (0.9%) | 750 (7.1%) |
| 1 Vehicle | 4,653 (32.9%) | 5,616 (53.2%) |
| 2 Vehicles | 6,328 (44.8%) | 3,185 (30.1%) |
| 3 or more Vehicles | 3,024 (21.4%) | 1,012 (9.6%) |
| Total | 14,131 (100.0%) | 10,563 (100.0%) |
Real Estate & Mortgages in Smyrna
Real Estate and Mortgage Overview in Smyrna
| Characteristic | Without Mortgage | With Mortgage |
| Housing Units | 3,341 | 10,790 |
| Median Property Value | $312,600 | $401,700 |
| Median Household Income | $85,872 | $5,109 |
| Monthly Housing Costs | $522 | $2,397 |
| Real Estate Taxes | $2,085 | $217 |
Property Value by Mortgage Status in Smyrna
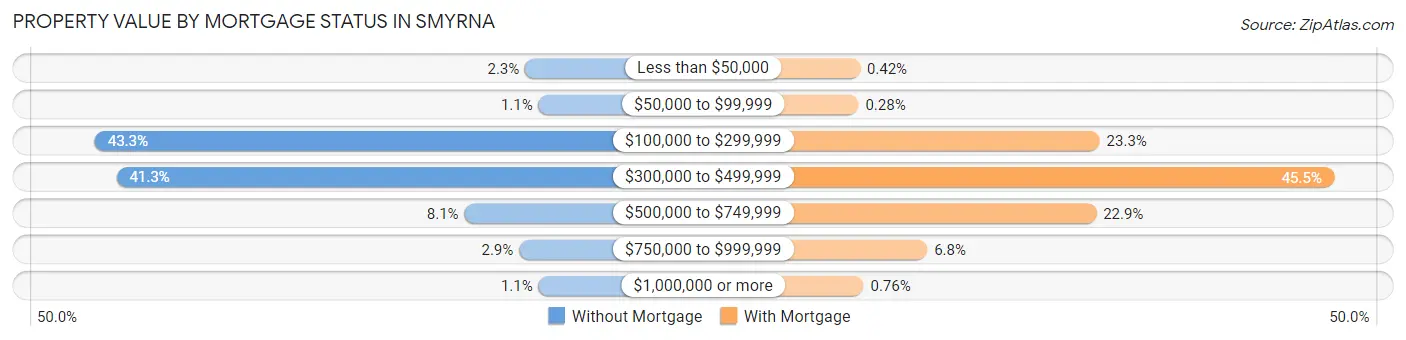
| Property Value | Without Mortgage | With Mortgage |
| Less than $50,000 | 78 (2.3%) | 45 (0.4%) |
| $50,000 to $99,999 | 35 (1.1%) | 30 (0.3%) |
| $100,000 to $299,999 | 1,447 (43.3%) | 2,509 (23.3%) |
| $300,000 to $499,999 | 1,378 (41.2%) | 4,914 (45.5%) |
| $500,000 to $749,999 | 271 (8.1%) | 2,473 (22.9%) |
| $750,000 to $999,999 | 97 (2.9%) | 737 (6.8%) |
| $1,000,000 or more | 35 (1.1%) | 82 (0.8%) |
| Total | 3,341 (100.0%) | 10,790 (100.0%) |
Household Income by Mortgage Status in Smyrna
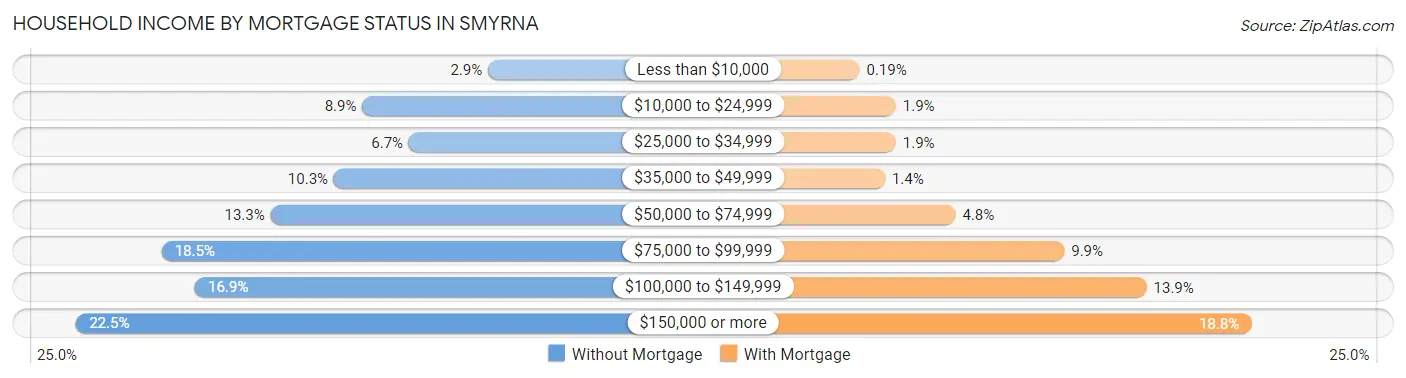
| Household Income | Without Mortgage | With Mortgage |
| Less than $10,000 | 98 (2.9%) | 20 (0.2%) |
| $10,000 to $24,999 | 298 (8.9%) | 207 (1.9%) |
| $25,000 to $34,999 | 224 (6.7%) | 207 (1.9%) |
| $35,000 to $49,999 | 343 (10.3%) | 151 (1.4%) |
| $50,000 to $74,999 | 444 (13.3%) | 514 (4.8%) |
| $75,000 to $99,999 | 617 (18.5%) | 1,073 (9.9%) |
| $100,000 to $149,999 | 564 (16.9%) | 1,496 (13.9%) |
| $150,000 or more | 753 (22.5%) | 2,033 (18.8%) |
| Total | 3,341 (100.0%) | 10,790 (100.0%) |
Property Value to Household Income Ratio in Smyrna
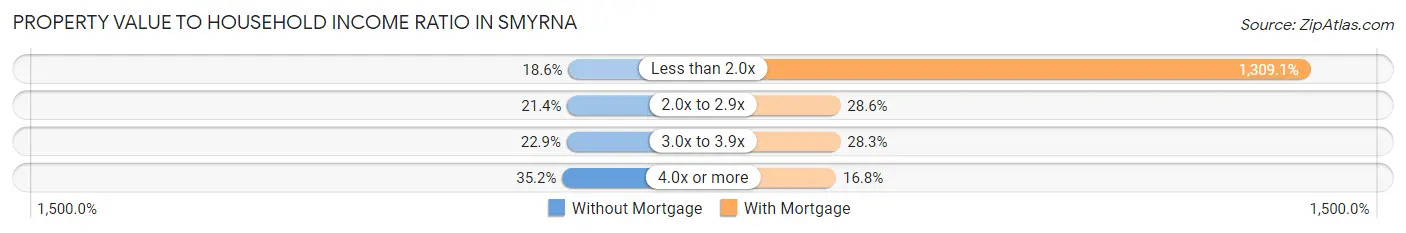
| Value-to-Income Ratio | Without Mortgage | With Mortgage |
| Less than 2.0x | 622 (18.6%) | 141,250 (1,309.1%) |
| 2.0x to 2.9x | 716 (21.4%) | 3,088 (28.6%) |
| 3.0x to 3.9x | 766 (22.9%) | 3,052 (28.3%) |
| 4.0x or more | 1,175 (35.2%) | 1,814 (16.8%) |
| Total | 3,341 (100.0%) | 10,790 (100.0%) |
Real Estate Taxes by Mortgage Status in Smyrna
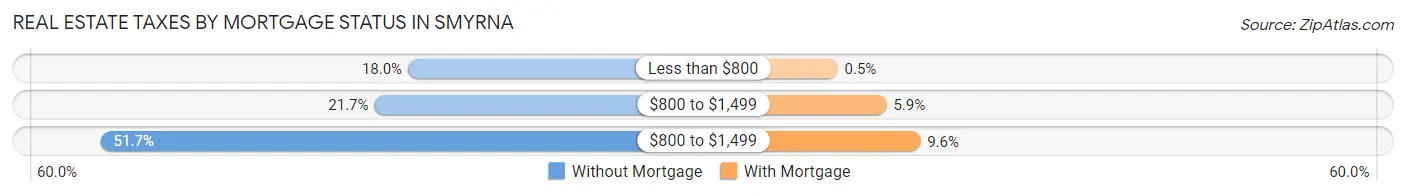
| Property Taxes | Without Mortgage | With Mortgage |
| Less than $800 | 601 (18.0%) | 54 (0.5%) |
| $800 to $1,499 | 724 (21.7%) | 631 (5.9%) |
| $800 to $1,499 | 1,726 (51.7%) | 1,030 (9.6%) |
| Total | 3,341 (100.0%) | 10,790 (100.0%) |
Health & Disability in Smyrna
Health Insurance Coverage by Age in Smyrna
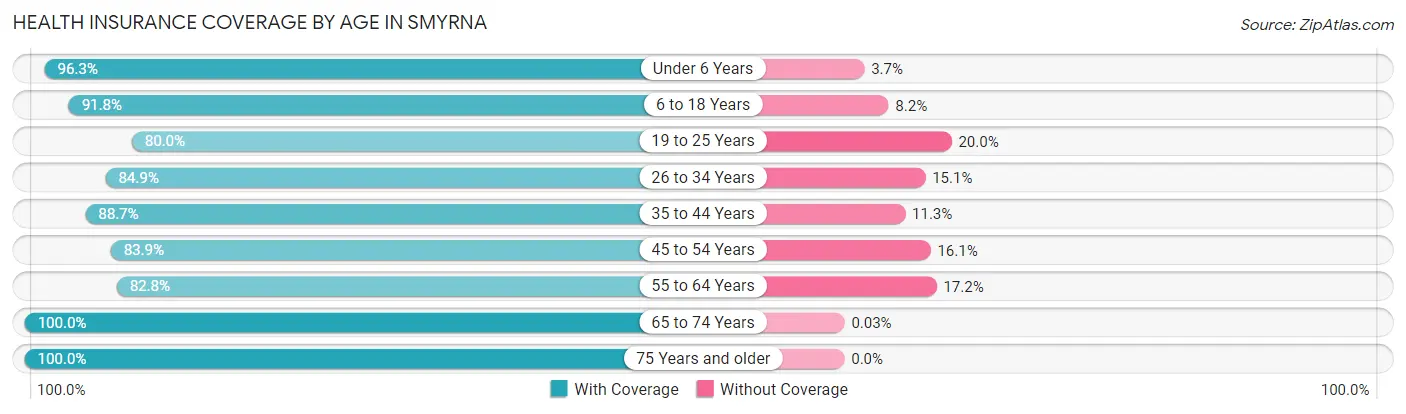
| Age Bracket | With Coverage | Without Coverage |
| Under 6 Years | 4,994 (96.3%) | 193 (3.7%) |
| 6 to 18 Years | 7,032 (91.8%) | 631 (8.2%) |
| 19 to 25 Years | 3,006 (80.0%) | 751 (20.0%) |
| 26 to 34 Years | 8,948 (84.9%) | 1,590 (15.1%) |
| 35 to 44 Years | 8,672 (88.7%) | 1,109 (11.3%) |
| 45 to 54 Years | 6,424 (83.9%) | 1,230 (16.1%) |
| 55 to 64 Years | 4,625 (82.8%) | 960 (17.2%) |
| 65 to 74 Years | 3,227 (100.0%) | 1 (0.0%) |
| 75 Years and older | 2,236 (100.0%) | 0 (0.0%) |
| Total | 49,164 (88.4%) | 6,465 (11.6%) |
Health Insurance Coverage by Citizenship Status in Smyrna
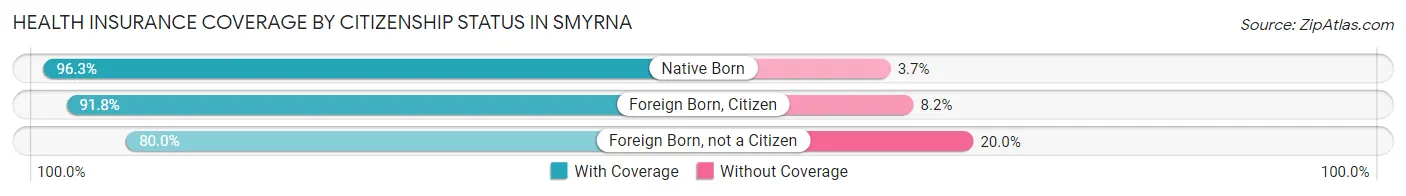
| Citizenship Status | With Coverage | Without Coverage |
| Native Born | 4,994 (96.3%) | 193 (3.7%) |
| Foreign Born, Citizen | 7,032 (91.8%) | 631 (8.2%) |
| Foreign Born, not a Citizen | 3,006 (80.0%) | 751 (20.0%) |
Health Insurance Coverage by Household Income in Smyrna
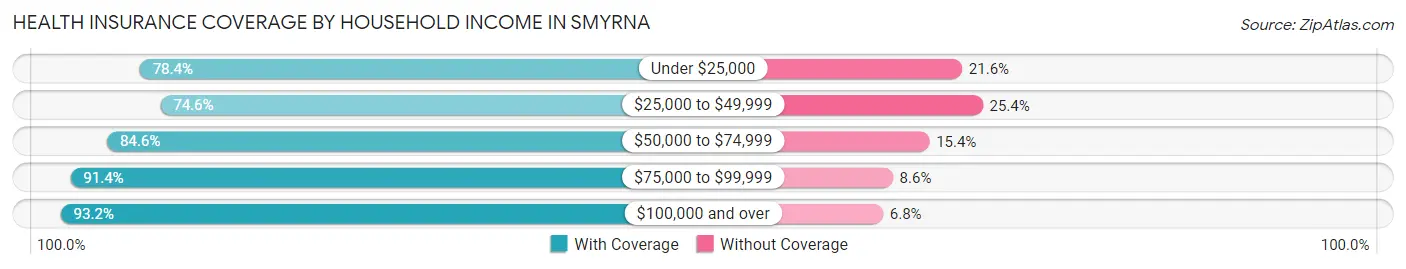
| Household Income | With Coverage | Without Coverage |
| Under $25,000 | 2,713 (78.4%) | 746 (21.6%) |
| $25,000 to $49,999 | 5,242 (74.6%) | 1,788 (25.4%) |
| $50,000 to $74,999 | 7,451 (84.6%) | 1,360 (15.4%) |
| $75,000 to $99,999 | 5,607 (91.4%) | 527 (8.6%) |
| $100,000 and over | 28,143 (93.2%) | 2,042 (6.8%) |
Public vs Private Health Insurance Coverage by Age in Smyrna
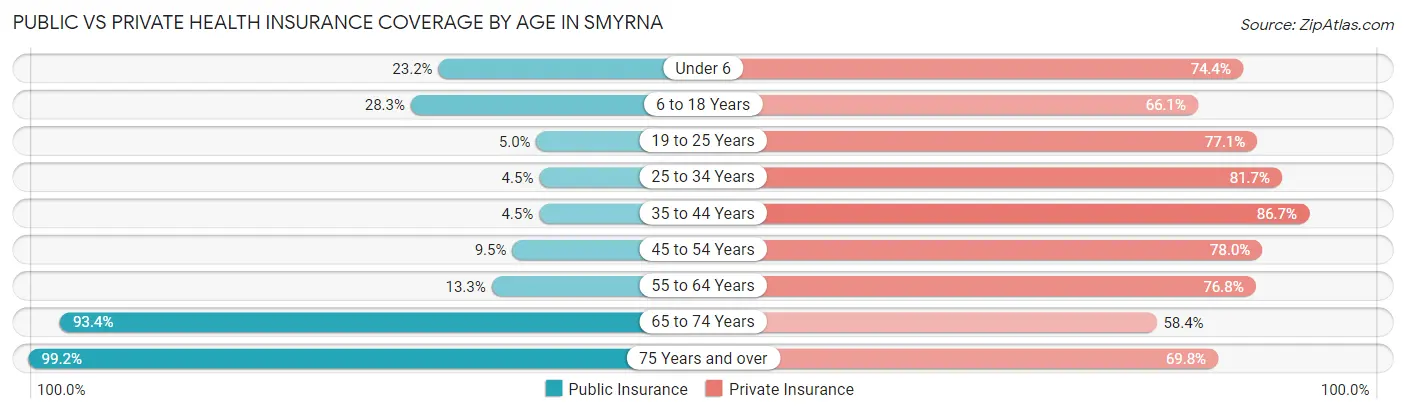
| Age Bracket | Public Insurance | Private Insurance |
| Under 6 | 1,203 (23.2%) | 3,860 (74.4%) |
| 6 to 18 Years | 2,170 (28.3%) | 5,063 (66.1%) |
| 19 to 25 Years | 188 (5.0%) | 2,896 (77.1%) |
| 25 to 34 Years | 472 (4.5%) | 8,605 (81.7%) |
| 35 to 44 Years | 441 (4.5%) | 8,478 (86.7%) |
| 45 to 54 Years | 725 (9.5%) | 5,972 (78.0%) |
| 55 to 64 Years | 744 (13.3%) | 4,288 (76.8%) |
| 65 to 74 Years | 3,016 (93.4%) | 1,885 (58.4%) |
| 75 Years and over | 2,219 (99.2%) | 1,561 (69.8%) |
| Total | 11,178 (20.1%) | 42,608 (76.6%) |
Disability Status by Sex by Age in Smyrna
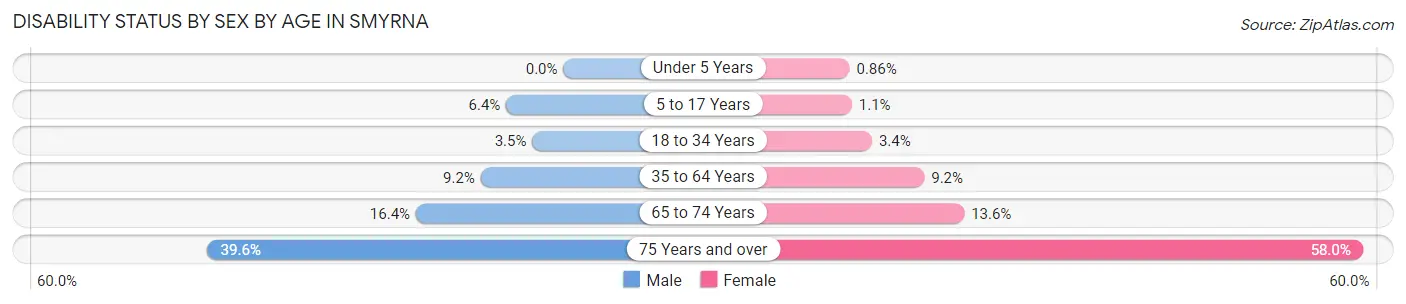
| Age Bracket | Male | Female |
| Under 5 Years | 0 (0.0%) | 15 (0.9%) |
| 5 to 17 Years | 252 (6.4%) | 48 (1.1%) |
| 18 to 34 Years | 243 (3.5%) | 265 (3.4%) |
| 35 to 64 Years | 1,010 (9.2%) | 1,108 (9.2%) |
| 65 to 74 Years | 253 (16.4%) | 230 (13.6%) |
| 75 Years and over | 347 (39.6%) | 789 (58.0%) |
Disability Class by Sex by Age in Smyrna
Disability Class: Hearing Difficulty
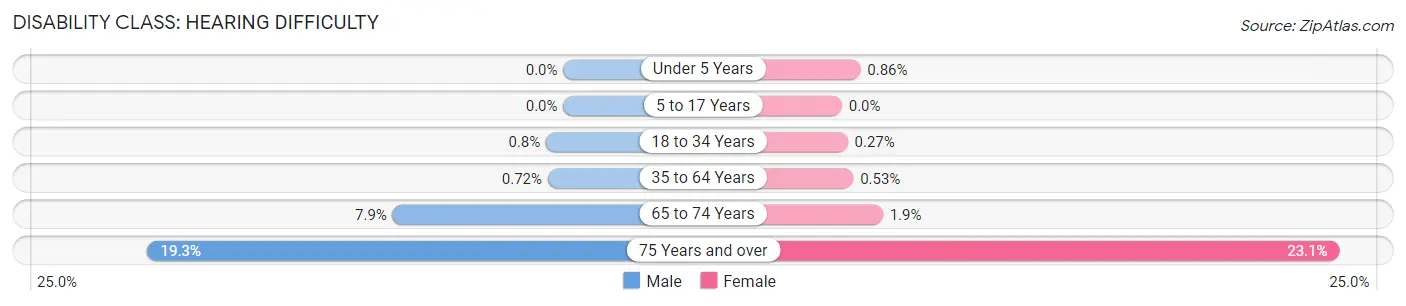
| Age Bracket | Male | Female |
| Under 5 Years | 0 (0.0%) | 15 (0.9%) |
| 5 to 17 Years | 0 (0.0%) | 0 (0.0%) |
| 18 to 34 Years | 56 (0.8%) | 21 (0.3%) |
| 35 to 64 Years | 79 (0.7%) | 64 (0.5%) |
| 65 to 74 Years | 122 (7.9%) | 32 (1.9%) |
| 75 Years and over | 169 (19.3%) | 314 (23.1%) |
Disability Class: Vision Difficulty
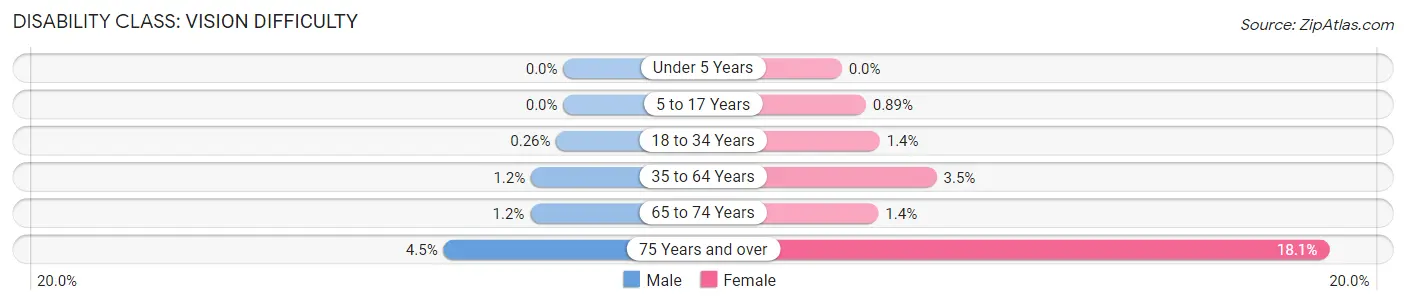
| Age Bracket | Male | Female |
| Under 5 Years | 0 (0.0%) | 0 (0.0%) |
| 5 to 17 Years | 0 (0.0%) | 38 (0.9%) |
| 18 to 34 Years | 18 (0.3%) | 111 (1.4%) |
| 35 to 64 Years | 132 (1.2%) | 424 (3.5%) |
| 65 to 74 Years | 19 (1.2%) | 23 (1.4%) |
| 75 Years and over | 39 (4.4%) | 246 (18.1%) |
Disability Class: Cognitive Difficulty
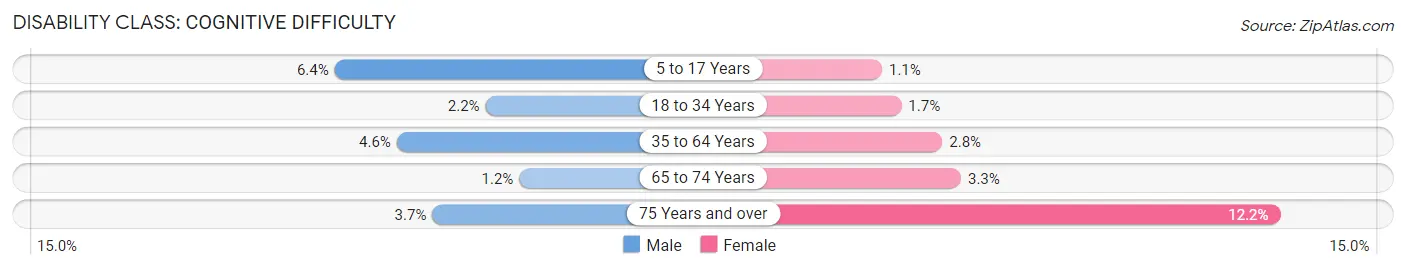
| Age Bracket | Male | Female |
| 5 to 17 Years | 252 (6.4%) | 48 (1.1%) |
| 18 to 34 Years | 152 (2.2%) | 131 (1.7%) |
| 35 to 64 Years | 509 (4.6%) | 338 (2.8%) |
| 65 to 74 Years | 19 (1.2%) | 56 (3.3%) |
| 75 Years and over | 32 (3.6%) | 166 (12.2%) |
Disability Class: Ambulatory Difficulty
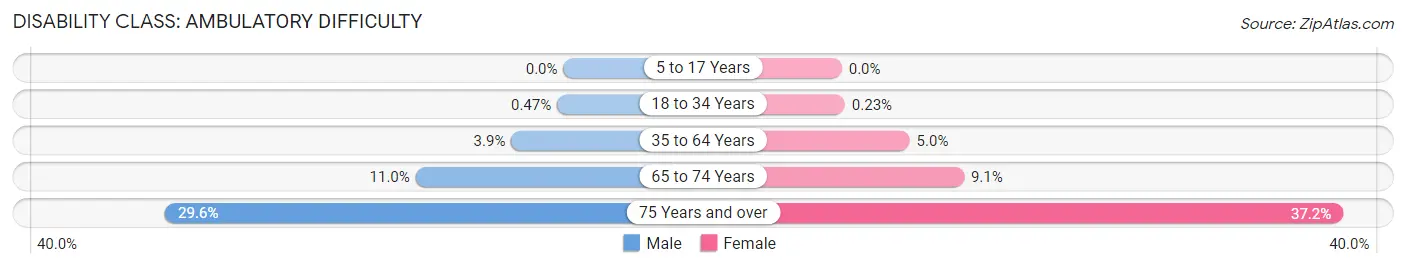
| Age Bracket | Male | Female |
| 5 to 17 Years | 0 (0.0%) | 0 (0.0%) |
| 18 to 34 Years | 33 (0.5%) | 18 (0.2%) |
| 35 to 64 Years | 425 (3.9%) | 607 (5.0%) |
| 65 to 74 Years | 169 (11.0%) | 153 (9.1%) |
| 75 Years and over | 259 (29.6%) | 506 (37.2%) |
Disability Class: Self-Care Difficulty
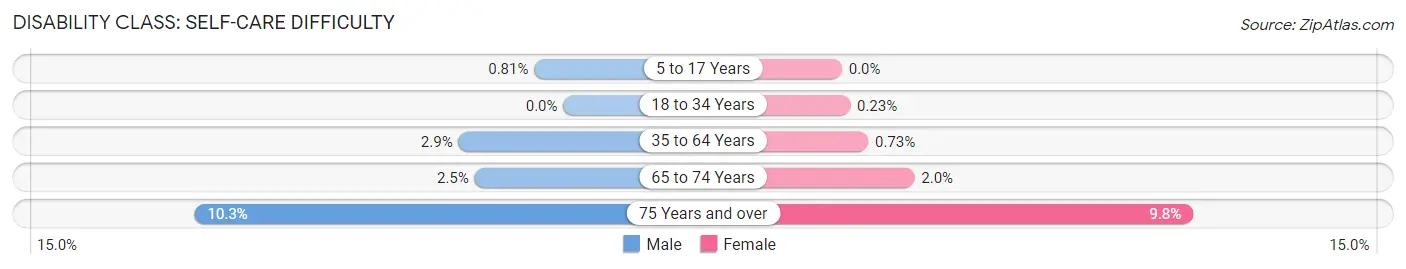
| Age Bracket | Male | Female |
| 5 to 17 Years | 32 (0.8%) | 0 (0.0%) |
| 18 to 34 Years | 0 (0.0%) | 18 (0.2%) |
| 35 to 64 Years | 320 (2.9%) | 88 (0.7%) |
| 65 to 74 Years | 38 (2.5%) | 34 (2.0%) |
| 75 Years and over | 90 (10.3%) | 133 (9.8%) |
Technology Access in Smyrna
Computing Device Access in Smyrna
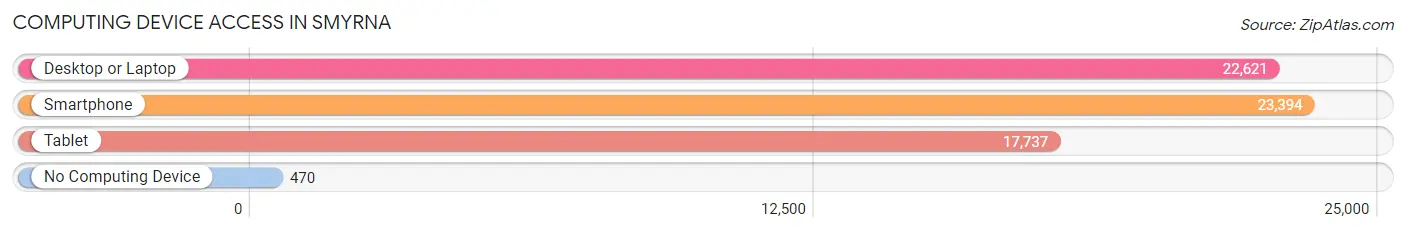
| Device Type | # Households | % Households |
| Desktop or Laptop | 22,621 | 91.6% |
| Smartphone | 23,394 | 94.7% |
| Tablet | 17,737 | 71.8% |
| No Computing Device | 470 | 1.9% |
| Total | 24,694 | 100.0% |
Internet Access in Smyrna
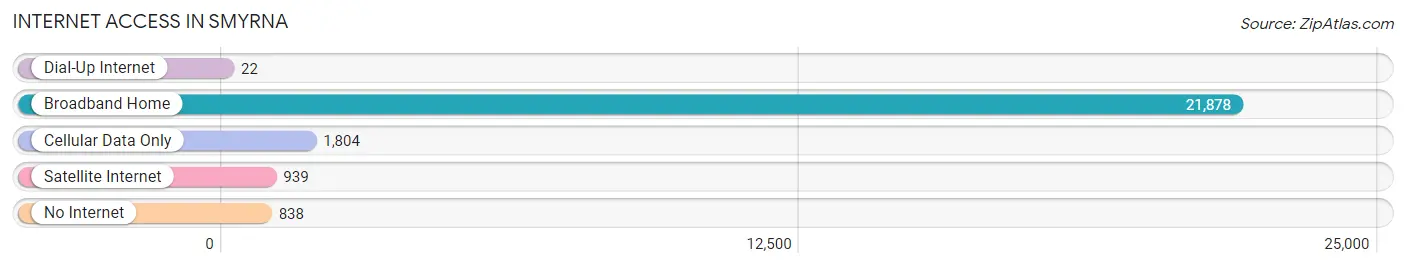
| Internet Type | # Households | % Households |
| Dial-Up Internet | 22 | 0.1% |
| Broadband Home | 21,878 | 88.6% |
| Cellular Data Only | 1,804 | 7.3% |
| Satellite Internet | 939 | 3.8% |
| No Internet | 838 | 3.4% |
| Total | 24,694 | 100.0% |
Smyrna Summary
Smyrna, Georgia is a city located in Cobb County, Georgia, United States. It is located just northwest of Atlanta and is part of the Atlanta metropolitan area. The city has a population of 56,664 as of the 2010 census.
History
Smyrna was founded in 1872 by a group of settlers from the nearby city of Marietta. The city was named after the ancient city of Smyrna in Asia Minor, now known as Izmir, Turkey. The settlers chose the name because of its biblical significance. The city was incorporated in 1872 and was the first city in Cobb County to be incorporated.
In the late 19th century, Smyrna was a rural farming community. The city began to grow in the early 20th century with the arrival of the railroad and the development of the Dixie Highway. The city experienced a period of rapid growth in the 1950s and 1960s as the Atlanta metropolitan area expanded.
Geography
Smyrna is located in the northwestern part of Cobb County, Georgia. It is bordered by the cities of Marietta to the east, Vinings to the south, and Mableton to the west. The city is located approximately 20 miles northwest of downtown Atlanta.
The city has a total area of 10.3 square miles, of which 10.2 square miles is land and 0.1 square miles is water. The city is located in the Piedmont region of Georgia and is characterized by rolling hills and wooded areas.
Economy
Smyrna is a major economic center in the Atlanta metropolitan area. The city is home to several major employers, including Lockheed Martin, Home Depot, and the Cobb County government. The city is also home to several shopping centers, including Cumberland Mall and the Vinings Jubilee.
The city has a diverse economy, with a mix of manufacturing, retail, and service industries. The city is also home to several corporate headquarters, including the headquarters of the Home Depot and the Atlanta Braves.
Demographics
As of the 2010 census, the population of Smyrna was 56,664. The racial makeup of the city was 63.2% White, 24.3% African American, 0.3% Native American, 5.2% Asian, 0.1% Pacific Islander, 4.2% from other races, and 2.7% from two or more races. Hispanic or Latino of any race were 10.2% of the population.
The median income for a household in the city was $50,945, and the median income for a family was $60,945. The per capita income for the city was $27,845. About 8.2% of families and 10.3% of the population were below the poverty line, including 14.2% of those under age 18 and 8.2% of those age 65 or over.
Common Questions
What is the Total Population of Smyrna?
Total Population of Smyrna is 55,863.
What is the Total Male Population of Smyrna?
Total Male Population of Smyrna is 26,731.
What is the Total Female Population of Smyrna?
Total Female Population of Smyrna is 29,132.
What is the Ratio of Males per 100 Females in Smyrna?
There are 91.76 Males per 100 Females in Smyrna.
What is the Ratio of Females per 100 Males in Smyrna?
There are 108.98 Females per 100 Males in Smyrna.
What is the Median Population Age in Smyrna?
Median Population Age in Smyrna is 35.6 Years.
What is the Average Family Size in Smyrna
Average Family Size in Smyrna is 3.0 People.
What is the Average Household Size in Smyrna
Average Household Size in Smyrna is 2.2 People.
What is Per Capita Income in Smyrna?
Per Capita income in Smyrna is $59,851.
What is the Median Family Income in Smyrna?
Median Family Income in Smyrna is $125,741.
What is the Median Household income in Smyrna?
Median Household Income in Smyrna is $92,258.
What is Income or Wage Gap in Smyrna?
Income or Wage Gap in Smyrna is 16.3%.
Women in Smyrna earn 83.7 cents for every dollar earned by a man.
What is Family Income Deficit in Smyrna?
Family Income Deficit in Smyrna is $10,273.
Families that are below poverty line in Smyrna earn $10,273 less on average than the poverty threshold level.
What is Inequality or Gini Index in Smyrna?
Inequality or Gini Index in Smyrna is 0.47.
How Large is the Labor Force in Smyrna?
There are 34,890 People in the Labor Forcein in Smyrna.
What is the Percentage of People in the Labor Force in Smyrna?
78.4% of People are in the Labor Force in Smyrna.
What is the Unemployment Rate in Smyrna?
Unemployment Rate in Smyrna is 4.2%.