Cities with the Highest Percentage of Salvadoran Population in Georgia
RELATED REPORTS & OPTIONS
Salvadoran
Georgia
Compare Cities
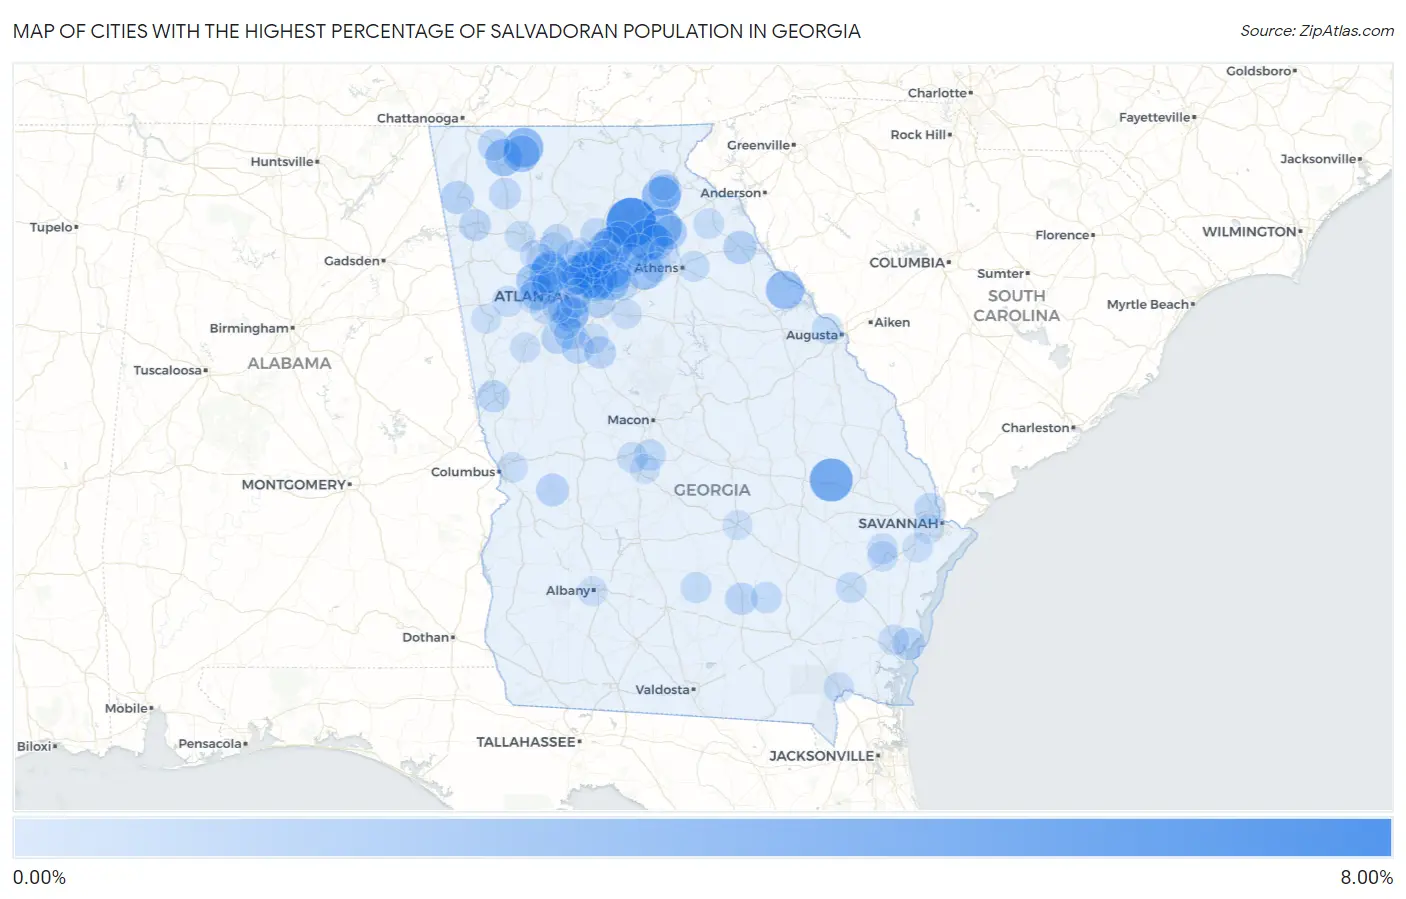
Map of Cities with the Highest Percentage of Salvadoran Population in Georgia
0.00%
8.00%
Cities with the Highest Percentage of Salvadoran Population in Georgia
| City | Salvadoran | vs State | vs National | |
| 1. | Gainesville | 6.57% | 0.44%(+6.13)#1 | 0.72%(+5.85)#252 |
| 2. | Metter | 4.35% | 0.44%(+3.91)#2 | 0.72%(+3.63)#402 |
| 3. | Lilburn | 3.72% | 0.44%(+3.28)#3 | 0.72%(+3.00)#482 |
| 4. | Pendergrass | 3.64% | 0.44%(+3.20)#4 | 0.72%(+2.91)#492 |
| 5. | Fair Oaks | 3.36% | 0.44%(+2.92)#5 | 0.72%(+2.64)#553 |
| 6. | Doraville | 3.29% | 0.44%(+2.85)#6 | 0.72%(+2.57)#561 |
| 7. | Buford | 3.16% | 0.44%(+2.73)#7 | 0.72%(+2.44)#572 |
| 8. | Eton | 3.05% | 0.44%(+2.61)#8 | 0.72%(+2.33)#607 |
| 9. | Lawrenceville | 2.99% | 0.44%(+2.55)#9 | 0.72%(+2.27)#621 |
| 10. | Norcross | 2.98% | 0.44%(+2.54)#10 | 0.72%(+2.26)#624 |
| 11. | Baldwin | 2.93% | 0.44%(+2.49)#11 | 0.72%(+2.21)#630 |
| 12. | Maysville | 2.82% | 0.44%(+2.38)#12 | 0.72%(+2.10)#667 |
| 13. | Lincolnton | 2.72% | 0.44%(+2.28)#13 | 0.72%(+2.00)#693 |
| 14. | Dalton | 2.39% | 0.44%(+1.95)#14 | 0.72%(+1.67)#791 |
| 15. | Bethlehem | 2.34% | 0.44%(+1.90)#15 | 0.72%(+1.62)#805 |
| 16. | Chatsworth | 2.25% | 0.44%(+1.81)#16 | 0.72%(+1.53)#834 |
| 17. | Snellville | 1.94% | 0.44%(+1.50)#17 | 0.72%(+1.22)#937 |
| 18. | Marietta | 1.78% | 0.44%(+1.34)#18 | 0.72%(+1.05)#1,006 |
| 19. | Mountain Park | 1.72% | 0.44%(+1.28)#19 | 0.72%(+0.996)#1,044 |
| 20. | Powder Springs | 1.66% | 0.44%(+1.22)#20 | 0.72%(+0.938)#1,076 |
| 21. | Jefferson | 1.64% | 0.44%(+1.20)#21 | 0.72%(+0.916)#1,092 |
| 22. | Lithia Springs | 1.62% | 0.44%(+1.18)#22 | 0.72%(+0.901)#1,102 |
| 23. | Flowery Branch | 1.54% | 0.44%(+1.10)#23 | 0.72%(+0.814)#1,159 |
| 24. | Forest Park | 1.41% | 0.44%(+0.967)#24 | 0.72%(+0.685)#1,247 |
| 25. | Commerce | 1.33% | 0.44%(+0.887)#25 | 0.72%(+0.604)#1,307 |
| 26. | Hapeville | 1.25% | 0.44%(+0.810)#26 | 0.72%(+0.527)#1,373 |
| 27. | Cornelia | 1.18% | 0.44%(+0.744)#27 | 0.72%(+0.462)#1,419 |
| 28. | Athens-Clarke County Unified Government (Balance) | 1.15% | 0.44%(+0.715)#28 | 0.72%(+0.432)#1,442 |
| 29. | Lithonia | 1.11% | 0.44%(+0.670)#29 | 0.72%(+0.388)#1,480 |
| 30. | Elberton | 1.10% | 0.44%(+0.663)#30 | 0.72%(+0.381)#1,490 |
| 31. | Mableton | 1.08% | 0.44%(+0.636)#31 | 0.72%(+0.354)#1,521 |
| 32. | Summerville | 1.07% | 0.44%(+0.633)#32 | 0.72%(+0.351)#1,524 |
| 33. | Sugar Hill | 0.99% | 0.44%(+0.555)#33 | 0.72%(+0.272)#1,622 |
| 34. | Conley | 0.95% | 0.44%(+0.511)#34 | 0.72%(+0.229)#1,673 |
| 35. | Buena Vista | 0.92% | 0.44%(+0.477)#35 | 0.72%(+0.195)#1,719 |
| 36. | Fayetteville | 0.87% | 0.44%(+0.434)#36 | 0.72%(+0.152)#1,768 |
| 37. | St Simons | 0.84% | 0.44%(+0.405)#37 | 0.72%(+0.123)#1,802 |
| 38. | Auburn | 0.82% | 0.44%(+0.382)#38 | 0.72%(+0.099)#1,832 |
| 39. | Hampton | 0.79% | 0.44%(+0.349)#39 | 0.72%(+0.067)#1,894 |
| 40. | Douglas | 0.79% | 0.44%(+0.347)#40 | 0.72%(+0.065)#1,897 |
| 41. | Peachtree Corners | 0.78% | 0.44%(+0.337)#41 | 0.72%(+0.054)#1,923 |
| 42. | Lagrange | 0.75% | 0.44%(+0.308)#42 | 0.72%(+0.026)#1,969 |
| 43. | Hoschton | 0.74% | 0.44%(+0.303)#43 | 0.72%(+0.020)#1,979 |
| 44. | Tucker | 0.74% | 0.44%(+0.301)#44 | 0.72%(+0.019)#1,981 |
| 45. | Locust Grove | 0.70% | 0.44%(+0.265)#45 | 0.72%(-0.017)#2,048 |
| 46. | Rome | 0.66% | 0.44%(+0.225)#46 | 0.72%(-0.057)#2,113 |
| 47. | Calhoun | 0.65% | 0.44%(+0.207)#47 | 0.72%(-0.076)#2,155 |
| 48. | Johns Creek | 0.60% | 0.44%(+0.165)#48 | 0.72%(-0.117)#2,242 |
| 49. | Irondale | 0.60% | 0.44%(+0.163)#49 | 0.72%(-0.120)#2,251 |
| 50. | Tunnel Hill | 0.60% | 0.44%(+0.160)#50 | 0.72%(-0.122)#2,258 |
| 51. | Holly Springs | 0.58% | 0.44%(+0.136)#51 | 0.72%(-0.146)#2,309 |
| 52. | Port Wentworth | 0.57% | 0.44%(+0.128)#52 | 0.72%(-0.154)#2,329 |
| 53. | Warner Robins | 0.54% | 0.44%(+0.106)#53 | 0.72%(-0.177)#2,378 |
| 54. | Cumming | 0.54% | 0.44%(+0.103)#54 | 0.72%(-0.179)#2,384 |
| 55. | Riverdale | 0.54% | 0.44%(+0.096)#55 | 0.72%(-0.186)#2,405 |
| 56. | Cusseta Chattahoochee County Unified Government | 0.52% | 0.44%(+0.082)#56 | 0.72%(-0.201)#2,439 |
| 57. | Brookhaven | 0.50% | 0.44%(+0.057)#57 | 0.72%(-0.226)#2,488 |
| 58. | Roswell | 0.49% | 0.44%(+0.049)#58 | 0.72%(-0.233)#2,507 |
| 59. | Loganville | 0.47% | 0.44%(+0.030)#59 | 0.72%(-0.253)#2,563 |
| 60. | Arcade | 0.44% | 0.44%(-0.002)#60 | 0.72%(-0.284)#2,645 |
| 61. | Nicholls | 0.42% | 0.44%(-0.015)#61 | 0.72%(-0.297)#2,685 |
| 62. | Chamblee | 0.42% | 0.44%(-0.016)#62 | 0.72%(-0.298)#2,688 |
| 63. | Winterville | 0.37% | 0.44%(-0.070)#63 | 0.72%(-0.352)#2,873 |
| 64. | Jesup | 0.37% | 0.44%(-0.073)#64 | 0.72%(-0.355)#2,881 |
| 65. | Martinez | 0.36% | 0.44%(-0.078)#65 | 0.72%(-0.360)#2,904 |
| 66. | Ocilla | 0.36% | 0.44%(-0.080)#66 | 0.72%(-0.362)#2,911 |
| 67. | Smyrna | 0.36% | 0.44%(-0.081)#67 | 0.72%(-0.364)#2,921 |
| 68. | Douglasville | 0.35% | 0.44%(-0.093)#68 | 0.72%(-0.376)#2,959 |
| 69. | Villa Rica | 0.32% | 0.44%(-0.117)#69 | 0.72%(-0.399)#3,048 |
| 70. | Fort Valley | 0.32% | 0.44%(-0.122)#70 | 0.72%(-0.404)#3,069 |
| 71. | Fort Stewart | 0.29% | 0.44%(-0.150)#71 | 0.72%(-0.432)#3,188 |
| 72. | Franklin Springs | 0.29% | 0.44%(-0.151)#72 | 0.72%(-0.433)#3,193 |
| 73. | Demorest | 0.26% | 0.44%(-0.178)#73 | 0.72%(-0.460)#3,293 |
| 74. | Dock Junction | 0.26% | 0.44%(-0.182)#74 | 0.72%(-0.465)#3,307 |
| 75. | Cartersville | 0.25% | 0.44%(-0.193)#75 | 0.72%(-0.475)#3,363 |
| 76. | Hinesville | 0.24% | 0.44%(-0.195)#76 | 0.72%(-0.477)#3,375 |
| 77. | Folkston | 0.22% | 0.44%(-0.219)#77 | 0.72%(-0.502)#3,496 |
| 78. | Gresham Park | 0.19% | 0.44%(-0.247)#78 | 0.72%(-0.530)#3,640 |
| 79. | Grayson | 0.17% | 0.44%(-0.264)#79 | 0.72%(-0.547)#3,721 |
| 80. | Columbus | 0.17% | 0.44%(-0.267)#80 | 0.72%(-0.550)#3,735 |
| 81. | Duluth | 0.17% | 0.44%(-0.272)#81 | 0.72%(-0.555)#3,758 |
| 82. | South Fulton | 0.16% | 0.44%(-0.282)#82 | 0.72%(-0.564)#3,801 |
| 83. | Sandy Springs | 0.15% | 0.44%(-0.291)#83 | 0.72%(-0.573)#3,832 |
| 84. | Oxford | 0.15% | 0.44%(-0.292)#84 | 0.72%(-0.574)#3,839 |
| 85. | East Point | 0.14% | 0.44%(-0.298)#85 | 0.72%(-0.580)#3,887 |
| 86. | Acworth | 0.14% | 0.44%(-0.300)#86 | 0.72%(-0.583)#3,913 |
| 87. | Newnan | 0.14% | 0.44%(-0.301)#87 | 0.72%(-0.583)#3,921 |
| 88. | Mcdonough | 0.13% | 0.44%(-0.305)#88 | 0.72%(-0.588)#3,945 |
| 89. | Statham | 0.11% | 0.44%(-0.333)#89 | 0.72%(-0.616)#4,127 |
| 90. | Savannah | 0.096% | 0.44%(-0.343)#90 | 0.72%(-0.625)#4,197 |
| 91. | Albany | 0.096% | 0.44%(-0.344)#91 | 0.72%(-0.626)#4,199 |
| 92. | Woodstock | 0.091% | 0.44%(-0.348)#92 | 0.72%(-0.631)#4,225 |
| 93. | Perry | 0.089% | 0.44%(-0.350)#93 | 0.72%(-0.632)#4,238 |
| 94. | Suwanee | 0.085% | 0.44%(-0.355)#94 | 0.72%(-0.637)#4,272 |
| 95. | Kennesaw | 0.084% | 0.44%(-0.355)#95 | 0.72%(-0.638)#4,278 |
| 96. | Decatur | 0.082% | 0.44%(-0.357)#96 | 0.72%(-0.640)#4,293 |
| 97. | Richmond Hill | 0.066% | 0.44%(-0.373)#97 | 0.72%(-0.656)#4,402 |
| 98. | Mcrae Helena | 0.063% | 0.44%(-0.376)#98 | 0.72%(-0.659)#4,425 |
| 99. | Alpharetta | 0.061% | 0.44%(-0.379)#99 | 0.72%(-0.661)#4,458 |
| 100. | Carrollton | 0.060% | 0.44%(-0.379)#100 | 0.72%(-0.662)#4,464 |
Common Questions
What are the Top 10 Cities with the Highest Percentage of Salvadoran Population in Georgia?
Top 10 Cities with the Highest Percentage of Salvadoran Population in Georgia are:
#1
6.57%
#2
4.35%
#3
3.72%
#4
3.64%
#5
3.36%
#6
3.29%
#7
3.16%
#8
3.05%
#9
2.99%
#10
2.98%
What city has the Highest Percentage of Salvadoran Population in Georgia?
Gainesville has the Highest Percentage of Salvadoran Population in Georgia with 6.57%.
What is the Percentage of Salvadoran Population in the State of Georgia?
Percentage of Salvadoran Population in Georgia is 0.44%.
What is the Percentage of Salvadoran Population in the United States?
Percentage of Salvadoran Population in the United States is 0.72%.