Cusseta Chattahoochee County unified government, GA
Cusseta Chattahoochee County unified government Overview
9,402
TOTAL POPULATION
6,090
MALE POPULATION
3,312
FEMALE POPULATION
183.88
MALES / 100 FEMALES
54.38
FEMALES / 100 MALES
23.9
MEDIAN AGE
3.0
AVG FAMILY SIZE
2.7
AVG HOUSEHOLD SIZE
$23,574
PER CAPITA INCOME
$49,909
AVG FAMILY INCOME
$52,943
AVG HOUSEHOLD INCOME
6.6%
WAGE / INCOME GAP [ % ]
93.4¢/ $1
WAGE / INCOME GAP [ $ ]
0.40
INEQUALITY / GINI INDEX
5,973
LABOR FORCE [ PEOPLE ]
80.6%
PERCENT IN LABOR FORCE
8.4%
UNEMPLOYMENT RATE
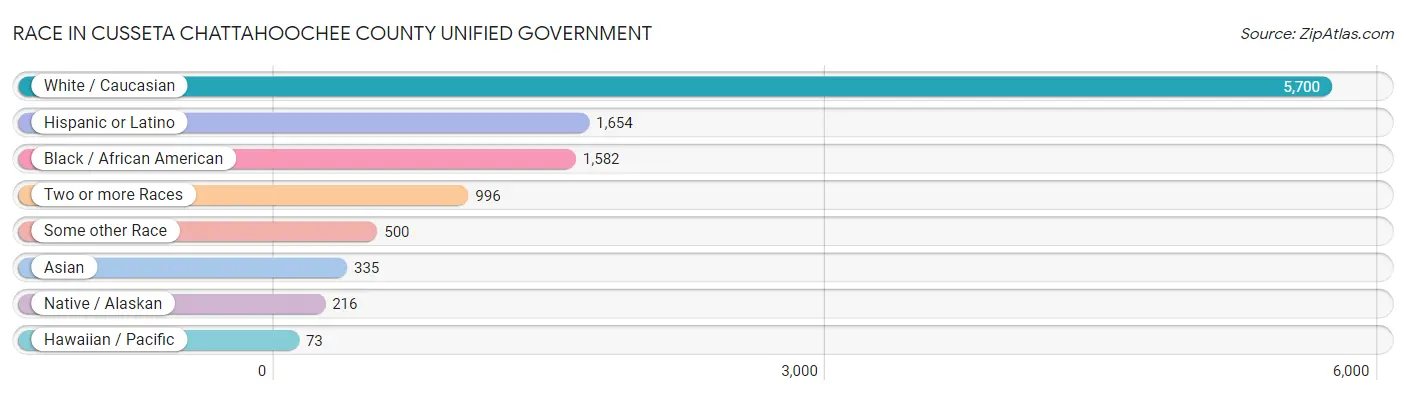
Race in Cusseta Chattahoochee County unified government
The most populous races in Cusseta Chattahoochee County unified government are White / Caucasian (5,700 | 60.6%), Hispanic or Latino (1,654 | 17.6%), and Black / African American (1,582 | 16.8%).
| Race | # Population | % Population |
| Asian | 335 | 3.6% |
| Black / African American | 1,582 | 16.8% |
| Hawaiian / Pacific | 73 | 0.8% |
| Hispanic or Latino | 1,654 | 17.6% |
| Native / Alaskan | 216 | 2.3% |
| White / Caucasian | 5,700 | 60.6% |
| Two or more Races | 996 | 10.6% |
| Some other Race | 500 | 5.3% |
| Total | 9,402 | 100.0% |
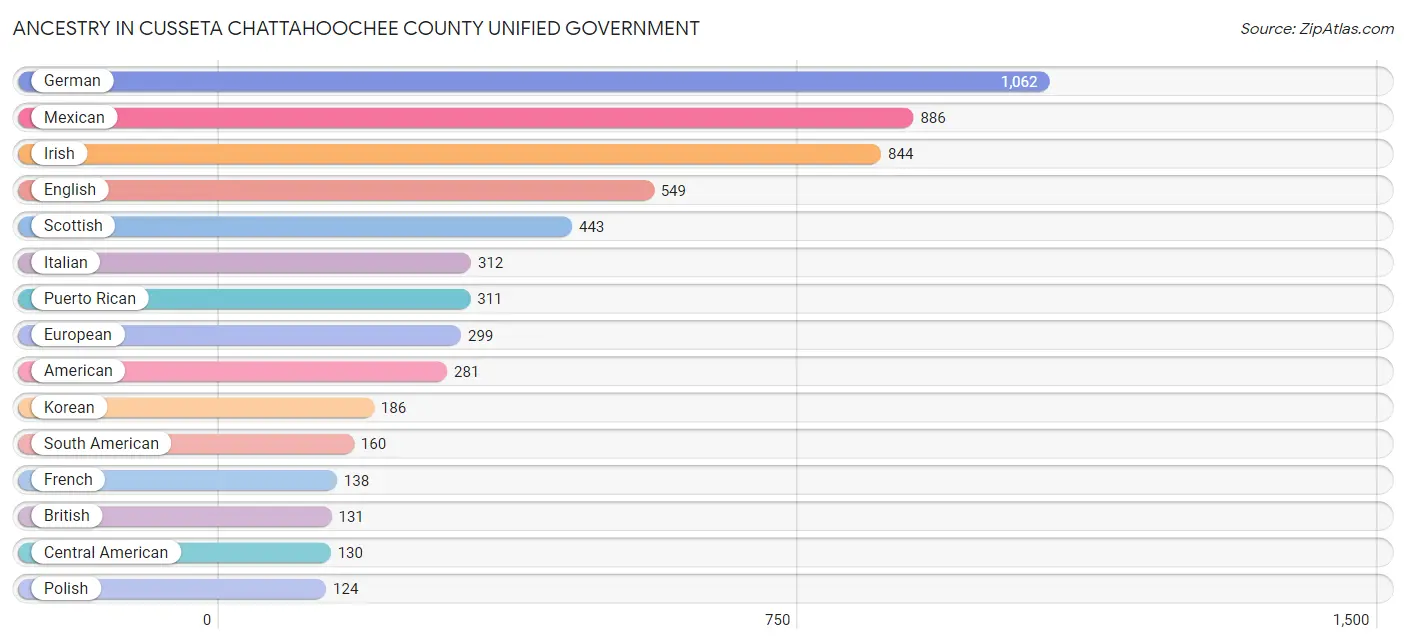
Ancestry in Cusseta Chattahoochee County unified government
The most populous ancestries reported in Cusseta Chattahoochee County unified government are German (1,062 | 11.3%), Mexican (886 | 9.4%), Irish (844 | 9.0%), English (549 | 5.8%), and Scottish (443 | 4.7%), together accounting for 40.2% of all Cusseta Chattahoochee County unified government residents.
| Ancestry | # Population | % Population |
| African | 76 | 0.8% |
| American | 281 | 3.0% |
| Arab | 7 | 0.1% |
| Austrian | 6 | 0.1% |
| Bangladeshi | 32 | 0.3% |
| Barbadian | 27 | 0.3% |
| Bhutanese | 25 | 0.3% |
| British | 131 | 1.4% |
| Burmese | 29 | 0.3% |
| Central American | 130 | 1.4% |
| Cherokee | 5 | 0.1% |
| Cheyenne | 7 | 0.1% |
| Colombian | 53 | 0.6% |
| Costa Rican | 4 | 0.0% |
| Cuban | 53 | 0.6% |
| Czech | 45 | 0.5% |
| Dominican | 61 | 0.6% |
| Dutch | 6 | 0.1% |
| Eastern European | 8 | 0.1% |
| English | 549 | 5.8% |
| European | 299 | 3.2% |
| Filipino | 16 | 0.2% |
| Finnish | 23 | 0.2% |
| French | 138 | 1.5% |
| French Canadian | 8 | 0.1% |
| German | 1,062 | 11.3% |
| Greek | 29 | 0.3% |
| Guamanian / Chamorro | 96 | 1.0% |
| Honduran | 10 | 0.1% |
| Hungarian | 5 | 0.1% |
| Icelander | 27 | 0.3% |
| Indian (Asian) | 67 | 0.7% |
| Irish | 844 | 9.0% |
| Italian | 312 | 3.3% |
| Jamaican | 63 | 0.7% |
| Japanese | 48 | 0.5% |
| Korean | 186 | 2.0% |
| Lebanese | 7 | 0.1% |
| Lithuanian | 27 | 0.3% |
| Mexican | 886 | 9.4% |
| Mexican American Indian | 8 | 0.1% |
| Native Hawaiian | 36 | 0.4% |
| Navajo | 11 | 0.1% |
| Northern European | 10 | 0.1% |
| Norwegian | 26 | 0.3% |
| Osage | 37 | 0.4% |
| Panamanian | 67 | 0.7% |
| Peruvian | 45 | 0.5% |
| Polish | 124 | 1.3% |
| Portuguese | 17 | 0.2% |
| Puerto Rican | 311 | 3.3% |
| Romanian | 21 | 0.2% |
| Russian | 52 | 0.5% |
| Salvadoran | 49 | 0.5% |
| Scotch-Irish | 26 | 0.3% |
| Scottish | 443 | 4.7% |
| Slovak | 2 | 0.0% |
| South American | 160 | 1.7% |
| Spaniard | 41 | 0.4% |
| Subsaharan African | 76 | 0.8% |
| Swedish | 70 | 0.7% |
| Thai | 3 | 0.0% |
| Trinidadian and Tobagonian | 4 | 0.0% |
| Welsh | 3 | 0.0% | View All 64 Rows |
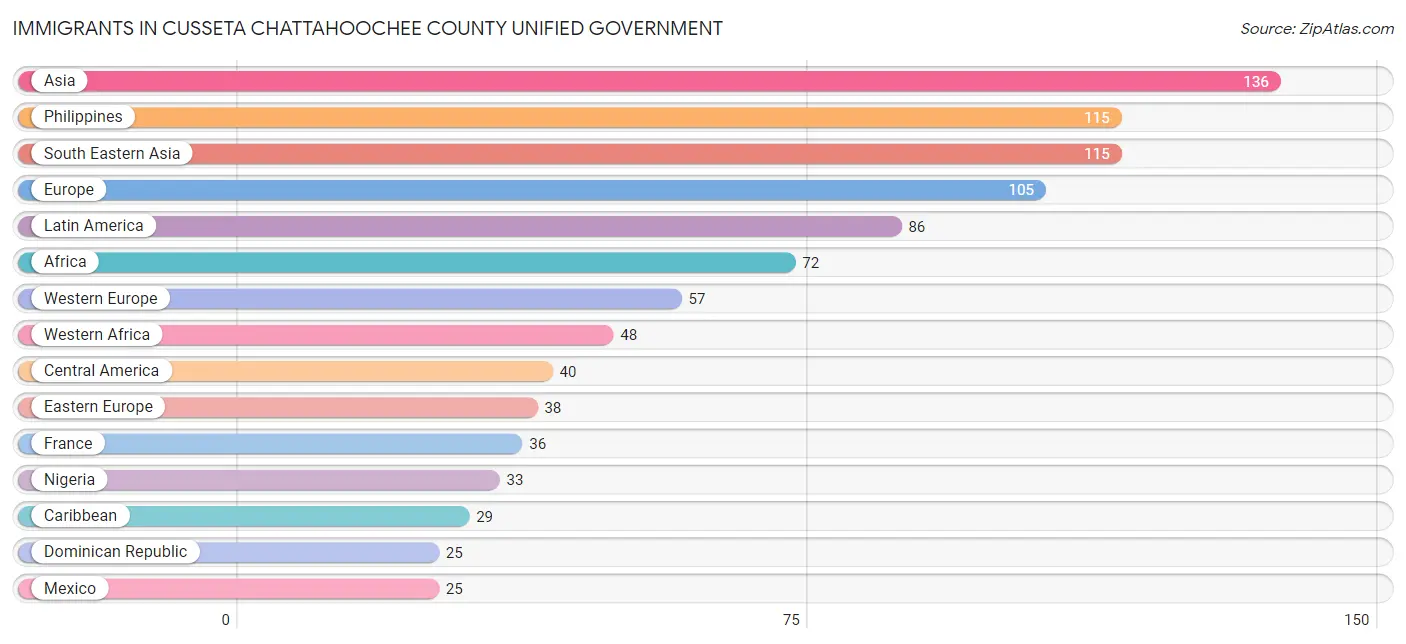
Immigrants in Cusseta Chattahoochee County unified government
The most numerous immigrant groups reported in Cusseta Chattahoochee County unified government came from Asia (136 | 1.5%), Philippines (115 | 1.2%), South Eastern Asia (115 | 1.2%), Europe (105 | 1.1%), and Latin America (86 | 0.9%), together accounting for 5.9% of all Cusseta Chattahoochee County unified government residents.
| Immigration Origin | # Population | % Population |
| Africa | 72 | 0.8% |
| Asia | 136 | 1.5% |
| Canada | 5 | 0.1% |
| Caribbean | 29 | 0.3% |
| Central America | 40 | 0.4% |
| Chile | 11 | 0.1% |
| China | 12 | 0.1% |
| Dominican Republic | 25 | 0.3% |
| Eastern Africa | 24 | 0.3% |
| Eastern Asia | 21 | 0.2% |
| Eastern Europe | 38 | 0.4% |
| El Salvador | 13 | 0.1% |
| Europe | 105 | 1.1% |
| France | 36 | 0.4% |
| Germany | 21 | 0.2% |
| Ghana | 15 | 0.2% |
| Guyana | 2 | 0.0% |
| Honduras | 2 | 0.0% |
| Kenya | 24 | 0.3% |
| Korea | 9 | 0.1% |
| Latin America | 86 | 0.9% |
| Mexico | 25 | 0.3% |
| Nigeria | 33 | 0.4% |
| Northern Europe | 10 | 0.1% |
| Oceania | 6 | 0.1% |
| Peru | 4 | 0.0% |
| Philippines | 115 | 1.2% |
| Romania | 21 | 0.2% |
| Russia | 17 | 0.2% |
| South America | 17 | 0.2% |
| South Eastern Asia | 115 | 1.2% |
| Trinidad and Tobago | 4 | 0.0% |
| Western Africa | 48 | 0.5% |
| Western Europe | 57 | 0.6% | View All 34 Rows |
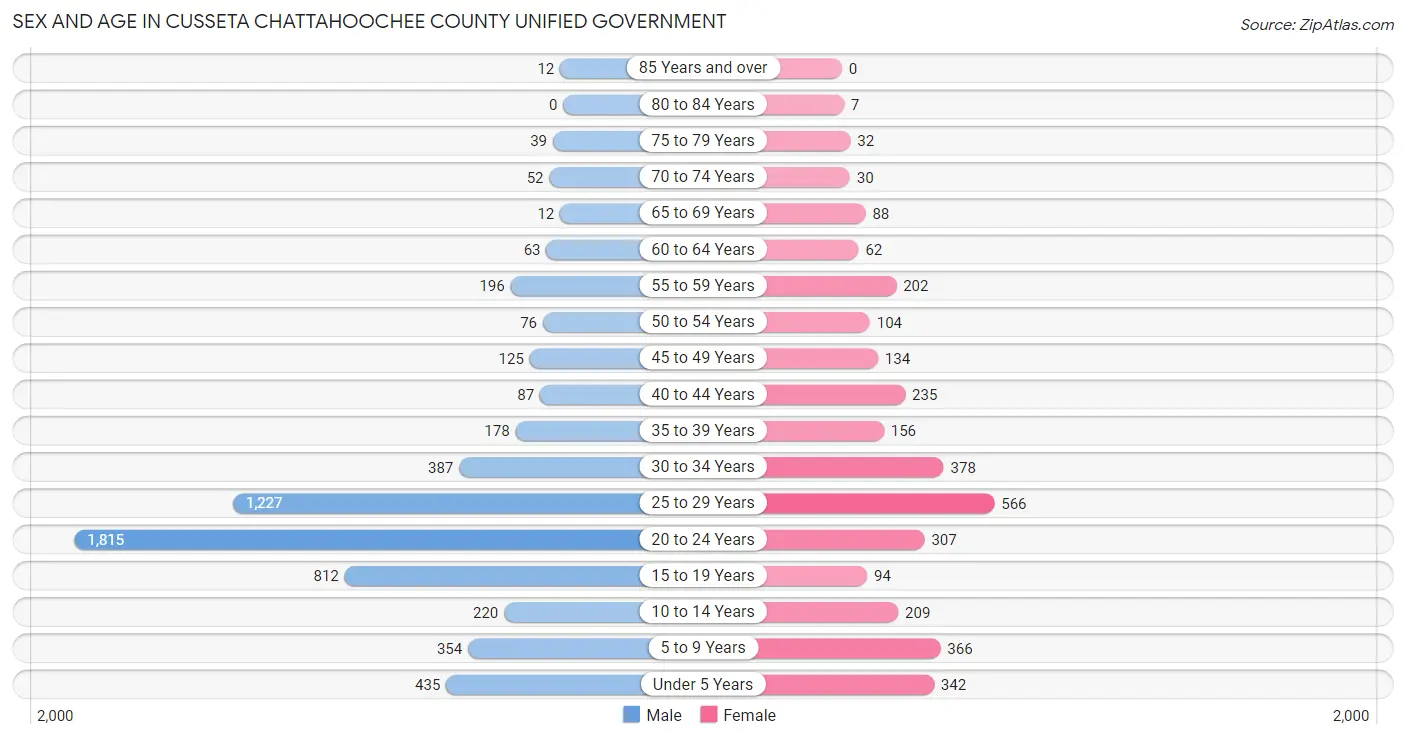
Sex and Age in Cusseta Chattahoochee County unified government
Sex and Age in Cusseta Chattahoochee County unified government
The most populous age groups in Cusseta Chattahoochee County unified government are 20 to 24 Years (1,815 | 29.8%) for men and 25 to 29 Years (566 | 17.1%) for women.
| Age Bracket | Male | Female |
| Under 5 Years | 435 (7.1%) | 342 (10.3%) |
| 5 to 9 Years | 354 (5.8%) | 366 (11.1%) |
| 10 to 14 Years | 220 (3.6%) | 209 (6.3%) |
| 15 to 19 Years | 812 (13.3%) | 94 (2.8%) |
| 20 to 24 Years | 1,815 (29.8%) | 307 (9.3%) |
| 25 to 29 Years | 1,227 (20.2%) | 566 (17.1%) |
| 30 to 34 Years | 387 (6.4%) | 378 (11.4%) |
| 35 to 39 Years | 178 (2.9%) | 156 (4.7%) |
| 40 to 44 Years | 87 (1.4%) | 235 (7.1%) |
| 45 to 49 Years | 125 (2.1%) | 134 (4.1%) |
| 50 to 54 Years | 76 (1.3%) | 104 (3.1%) |
| 55 to 59 Years | 196 (3.2%) | 202 (6.1%) |
| 60 to 64 Years | 63 (1.0%) | 62 (1.9%) |
| 65 to 69 Years | 12 (0.2%) | 88 (2.7%) |
| 70 to 74 Years | 52 (0.9%) | 30 (0.9%) |
| 75 to 79 Years | 39 (0.6%) | 32 (1.0%) |
| 80 to 84 Years | 0 (0.0%) | 7 (0.2%) |
| 85 Years and over | 12 (0.2%) | 0 (0.0%) |
| Total | 6,090 (100.0%) | 3,312 (100.0%) |
Families and Households in Cusseta Chattahoochee County unified government
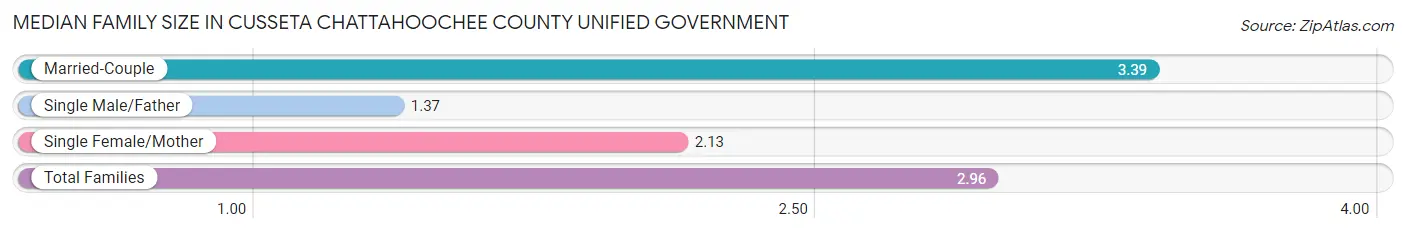
Median Family Size in Cusseta Chattahoochee County unified government
The median family size in Cusseta Chattahoochee County unified government is 2.96 persons per family, with married-couple families (1,142 | 68.4%) accounting for the largest median family size of 3.39 persons per family. On the other hand, single male/father families (67 | 4.0%) represent the smallest median family size with 1.37 persons per family.
| Family Type | # Families | Family Size |
| Married-Couple | 1,142 (68.4%) | 3.39 |
| Single Male/Father | 67 (4.0%) | 1.37 |
| Single Female/Mother | 460 (27.6%) | 2.13 |
| Total Families | 1,669 (100.0%) | 2.96 |
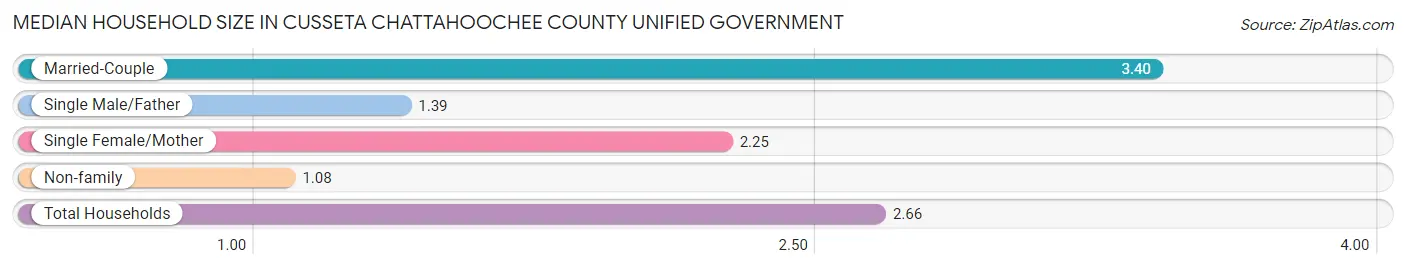
Median Household Size in Cusseta Chattahoochee County unified government
The median household size in Cusseta Chattahoochee County unified government is 2.66 persons per household, with married-couple households (1,142 | 56.2%) accounting for the largest median household size of 3.4 persons per household. non-family households (362 | 17.8%) represent the smallest median household size with 1.08 persons per household.
| Household Type | # Households | Household Size |
| Married-Couple | 1,142 (56.2%) | 3.40 |
| Single Male/Father | 67 (3.3%) | 1.39 |
| Single Female/Mother | 460 (22.7%) | 2.25 |
| Non-family | 362 (17.8%) | 1.08 |
| Total Households | 2,031 (100.0%) | 2.66 |
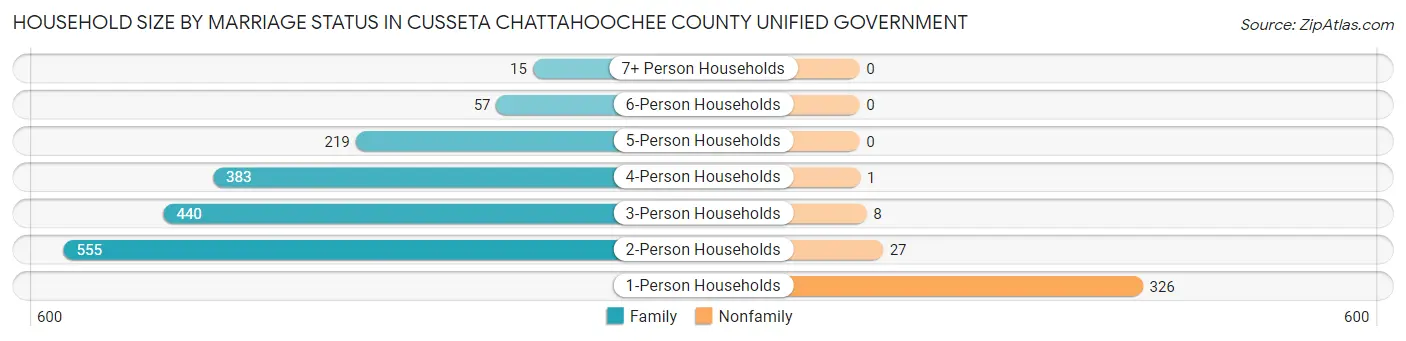
Household Size by Marriage Status in Cusseta Chattahoochee County unified government
Out of a total of 2,031 households in Cusseta Chattahoochee County unified government, 1,669 (82.2%) are family households, while 362 (17.8%) are nonfamily households. The most numerous type of family households are 2-person households, comprising 555, and the most common type of nonfamily households are 1-person households, comprising 326.
| Household Size | Family Households | Nonfamily Households |
| 1-Person Households | - | 326 (16.1%) |
| 2-Person Households | 555 (27.3%) | 27 (1.3%) |
| 3-Person Households | 440 (21.7%) | 8 (0.4%) |
| 4-Person Households | 383 (18.9%) | 1 (0.1%) |
| 5-Person Households | 219 (10.8%) | 0 (0.0%) |
| 6-Person Households | 57 (2.8%) | 0 (0.0%) |
| 7+ Person Households | 15 (0.7%) | 0 (0.0%) |
| Total | 1,669 (82.2%) | 362 (17.8%) |
Female Fertility in Cusseta Chattahoochee County unified government
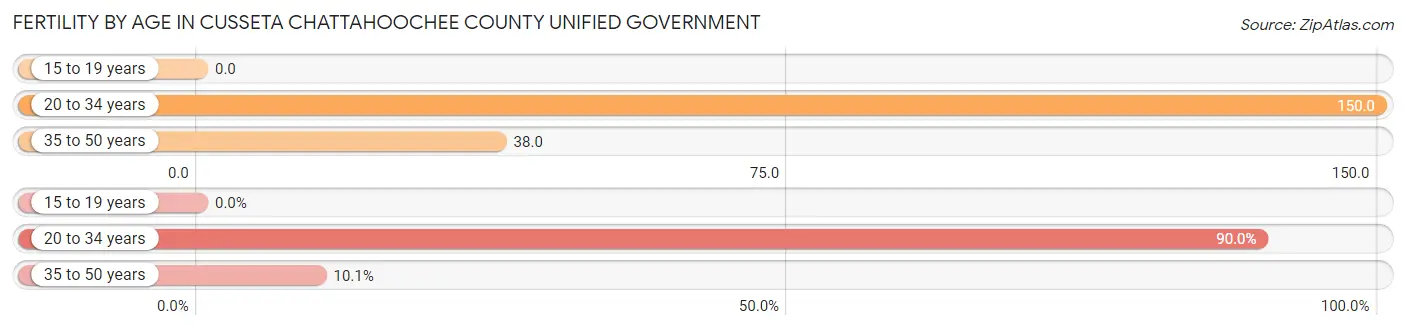
Fertility by Age in Cusseta Chattahoochee County unified government
Average fertility rate in Cusseta Chattahoochee County unified government is 110.0 births per 1,000 women. Women in the age bracket of 20 to 34 years have the highest fertility rate with 150.0 births per 1,000 women. Women in the age bracket of 20 to 34 years acount for 89.9% of all women with births.
| Age Bracket | Women with Births | Births / 1,000 Women |
| 15 to 19 years | 0 (0.0%) | 0.0 |
| 20 to 34 years | 188 (89.9%) | 150.0 |
| 35 to 50 years | 21 (10.1%) | 38.0 |
| Total | 209 (100.0%) | 110.0 |
Fertility by Age by Marriage Status in Cusseta Chattahoochee County unified government
99.5% of women with births (209) in Cusseta Chattahoochee County unified government are married. The highest percentage of unmarried women with births falls into 20 to 34 years age bracket with 0.5% of them unmarried at the time of birth, while the lowest percentage of unmarried women with births belong to 35 to 50 years age bracket with 0.0% of them unmarried.
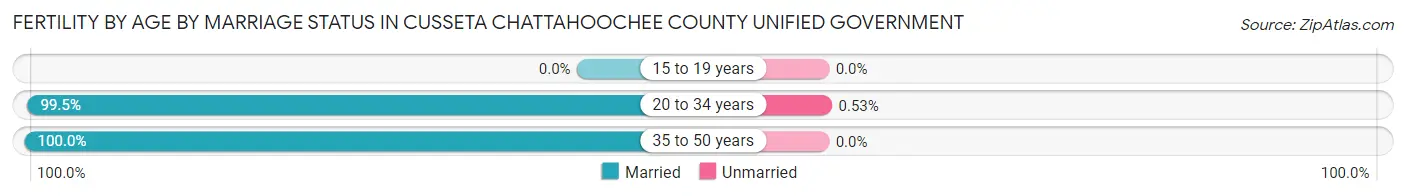
| Age Bracket | Married | Unmarried |
| 15 to 19 years | 0 (0.0%) | 0 (0.0%) |
| 20 to 34 years | 187 (99.5%) | 1 (0.5%) |
| 35 to 50 years | 21 (100.0%) | 0 (0.0%) |
| Total | 208 (99.5%) | 1 (0.5%) |
Fertility by Education in Cusseta Chattahoochee County unified government
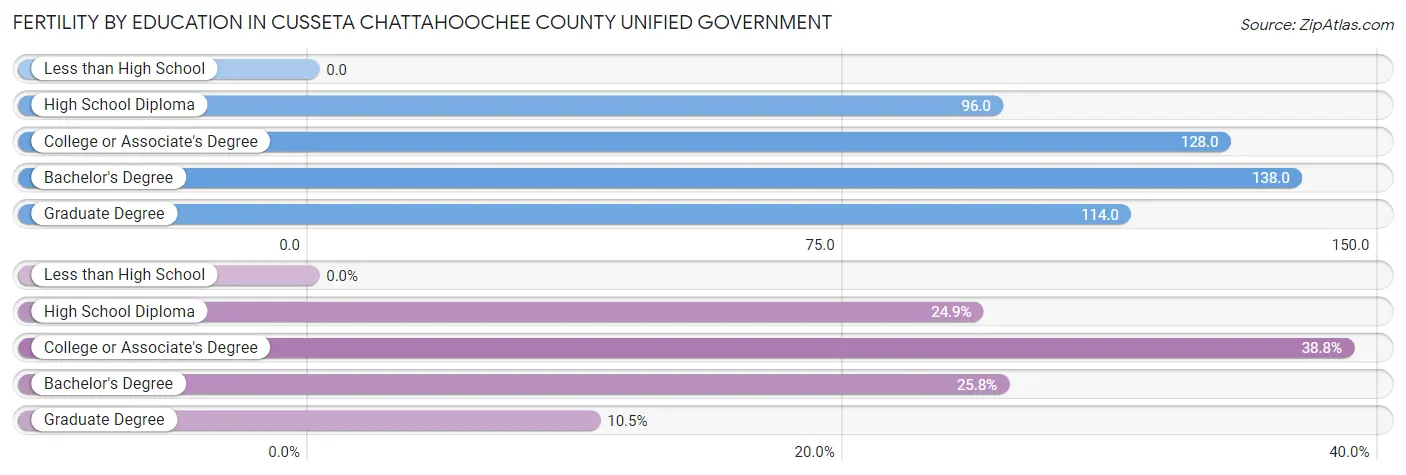
| Educational Attainment | Women with Births | Births / 1,000 Women |
| Less than High School | 0 (0.0%) | 0.0 |
| High School Diploma | 52 (24.9%) | 96.0 |
| College or Associate's Degree | 81 (38.8%) | 128.0 |
| Bachelor's Degree | 54 (25.8%) | 138.0 |
| Graduate Degree | 22 (10.5%) | 114.0 |
| Total | 209 (100.0%) | 110.0 |
Fertility by Education by Marriage Status in Cusseta Chattahoochee County unified government
0.5% of women with births in Cusseta Chattahoochee County unified government are unmarried. Women with the educational attainment of college or associate's degree are most likely to be married with 100.0% of them married at childbirth, while women with the educational attainment of high school diploma are least likely to be married with 1.9% of them unmarried at childbirth.
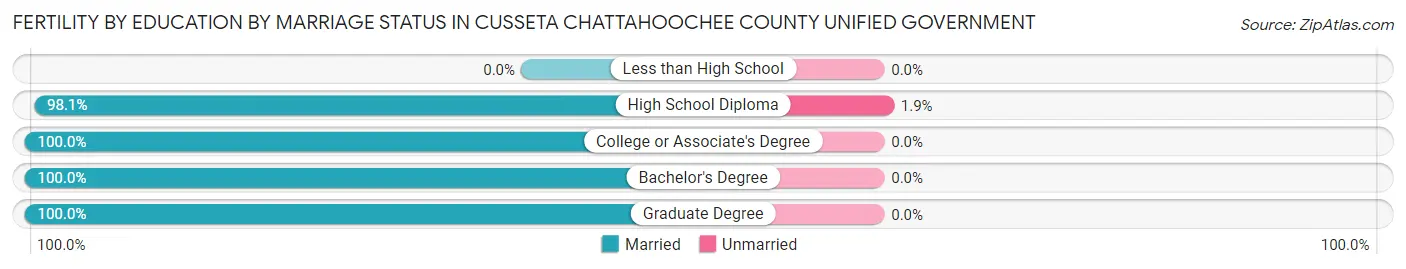
| Educational Attainment | Married | Unmarried |
| Less than High School | 0 (0.0%) | 0 (0.0%) |
| High School Diploma | 51 (98.1%) | 1 (1.9%) |
| College or Associate's Degree | 81 (100.0%) | 0 (0.0%) |
| Bachelor's Degree | 54 (100.0%) | 0 (0.0%) |
| Graduate Degree | 22 (100.0%) | 0 (0.0%) |
| Total | 208 (99.5%) | 1 (0.5%) |
Income in Cusseta Chattahoochee County unified government
Income Overview in Cusseta Chattahoochee County unified government
Per Capita Income in Cusseta Chattahoochee County unified government is $23,574, while median incomes of families and households are $49,909 and $52,943 respectively.
| Characteristic | Number | Measure |
| Per Capita Income | 9,402 | $23,574 |
| Median Family Income | 1,669 | $49,909 |
| Mean Family Income | 1,669 | $63,557 |
| Median Household Income | 2,031 | $52,943 |
| Mean Household Income | 2,031 | $62,041 |
| Income Deficit | 1,669 | $0 |
| Wage / Income Gap (%) | 9,402 | 6.65% |
| Wage / Income Gap ($) | 9,402 | 93.35¢ per $1 |
| Gini / Inequality Index | 9,402 | 0.40 |
Earnings by Sex in Cusseta Chattahoochee County unified government
Average Earnings in Cusseta Chattahoochee County unified government are $27,719, $28,008 for men and $26,146 for women, a difference of 6.7%.
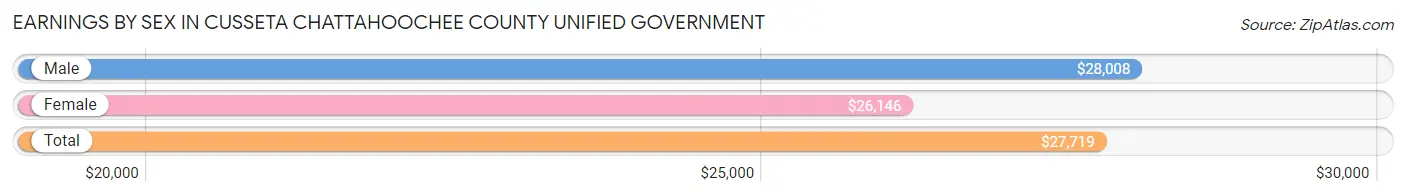
| Sex | Number | Average Earnings |
| Male | 4,585 (76.6%) | $28,008 |
| Female | 1,398 (23.4%) | $26,146 |
| Total | 5,983 (100.0%) | $27,719 |
Earnings by Sex by Income Bracket in Cusseta Chattahoochee County unified government
The most common earnings brackets in Cusseta Chattahoochee County unified government are $25,000 to $29,999 for men (1,382 | 30.1%) and $25,000 to $29,999 for women (206 | 14.7%).
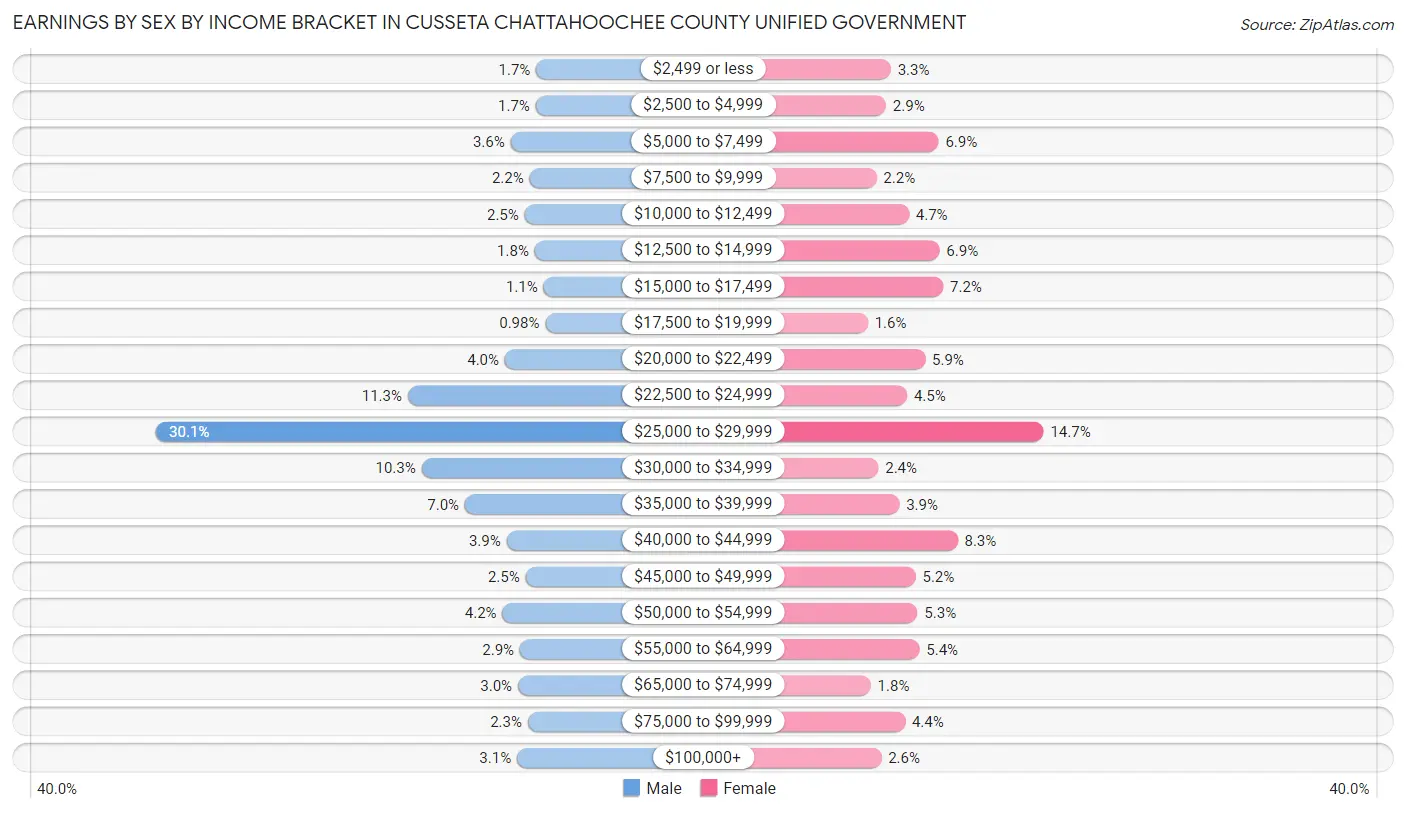
| Income | Male | Female |
| $2,499 or less | 76 (1.7%) | 46 (3.3%) |
| $2,500 to $4,999 | 78 (1.7%) | 41 (2.9%) |
| $5,000 to $7,499 | 164 (3.6%) | 96 (6.9%) |
| $7,500 to $9,999 | 99 (2.2%) | 31 (2.2%) |
| $10,000 to $12,499 | 116 (2.5%) | 65 (4.6%) |
| $12,500 to $14,999 | 81 (1.8%) | 97 (6.9%) |
| $15,000 to $17,499 | 51 (1.1%) | 101 (7.2%) |
| $17,500 to $19,999 | 45 (1.0%) | 22 (1.6%) |
| $20,000 to $22,499 | 184 (4.0%) | 82 (5.9%) |
| $22,500 to $24,999 | 517 (11.3%) | 63 (4.5%) |
| $25,000 to $29,999 | 1,382 (30.1%) | 206 (14.7%) |
| $30,000 to $34,999 | 470 (10.2%) | 33 (2.4%) |
| $35,000 to $39,999 | 321 (7.0%) | 55 (3.9%) |
| $40,000 to $44,999 | 178 (3.9%) | 116 (8.3%) |
| $45,000 to $49,999 | 113 (2.5%) | 72 (5.1%) |
| $50,000 to $54,999 | 192 (4.2%) | 74 (5.3%) |
| $55,000 to $64,999 | 132 (2.9%) | 76 (5.4%) |
| $65,000 to $74,999 | 139 (3.0%) | 25 (1.8%) |
| $75,000 to $99,999 | 105 (2.3%) | 61 (4.4%) |
| $100,000+ | 142 (3.1%) | 36 (2.6%) |
| Total | 4,585 (100.0%) | 1,398 (100.0%) |
Earnings by Sex by Educational Attainment in Cusseta Chattahoochee County unified government
Average earnings in Cusseta Chattahoochee County unified government are $37,010 for men and $28,924 for women, a difference of 21.8%. Men with an educational attainment of less than high school enjoy the highest average annual earnings of $39,028, while those with bachelor's degree education earn the least with $34,757. Women with an educational attainment of graduate degree earn the most with the average annual earnings of $51,510, while those with high school diploma education have the smallest earnings of $17,212.
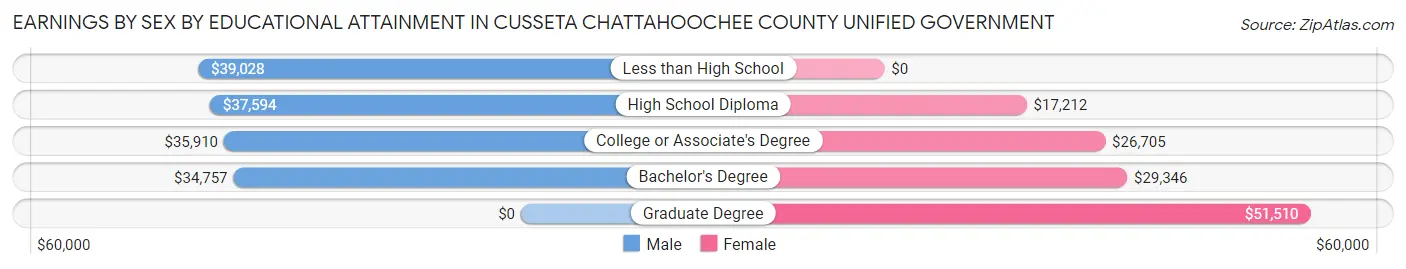
| Educational Attainment | Male Income | Female Income |
| Less than High School | $39,028 | $0 |
| High School Diploma | $37,594 | $17,212 |
| College or Associate's Degree | $35,910 | $26,705 |
| Bachelor's Degree | $34,757 | $29,346 |
| Graduate Degree | - | - |
| Total | $37,010 | $28,924 |
Family Income in Cusseta Chattahoochee County unified government
Family Income Brackets in Cusseta Chattahoochee County unified government
According to the Cusseta Chattahoochee County unified government family income data, there are 359 families falling into the $100,000 to $149,999 income range, which is the most common income bracket and makes up 21.5% of all families. Conversely, the $200,000+ income bracket is the least frequent group with only 23 families (1.4%) belonging to this category.
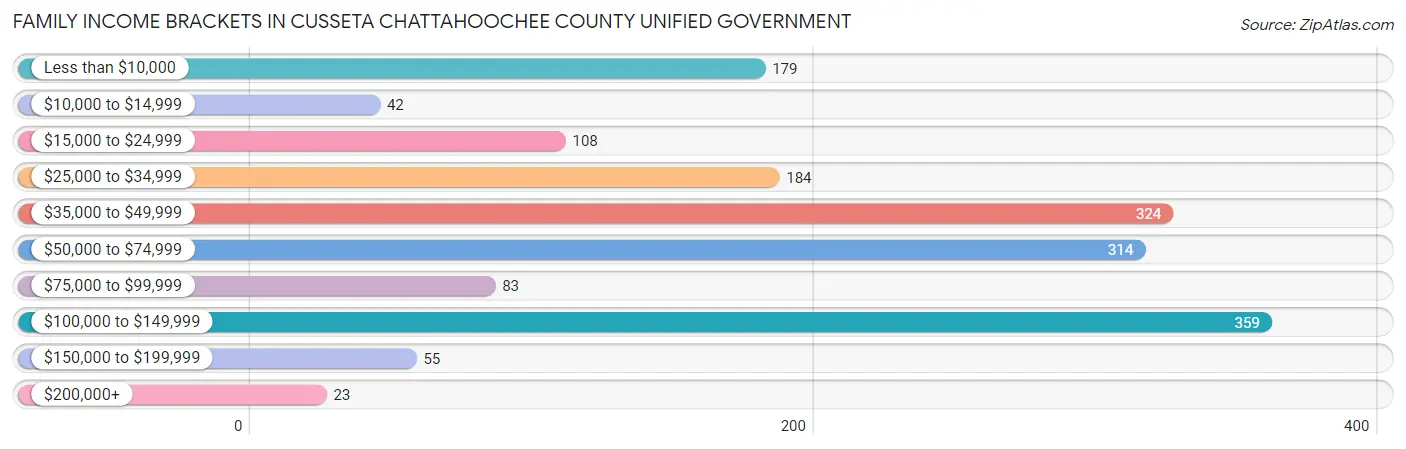
| Income Bracket | # Families | % Families |
| Less than $10,000 | 179 | 10.7% |
| $10,000 to $14,999 | 42 | 2.5% |
| $15,000 to $24,999 | 108 | 6.5% |
| $25,000 to $34,999 | 184 | 11.0% |
| $35,000 to $49,999 | 324 | 19.4% |
| $50,000 to $74,999 | 314 | 18.8% |
| $75,000 to $99,999 | 83 | 5.0% |
| $100,000 to $149,999 | 359 | 21.5% |
| $150,000 to $199,999 | 55 | 3.3% |
| $200,000+ | 23 | 1.4% |
Family Income by Famaliy Size in Cusseta Chattahoochee County unified government
4-person families (315 | 18.9%) account for the highest median family income in Cusseta Chattahoochee County unified government with $60,893 per family, while 2-person families (620 | 37.1%) have the highest median income of $22,298 per family member.
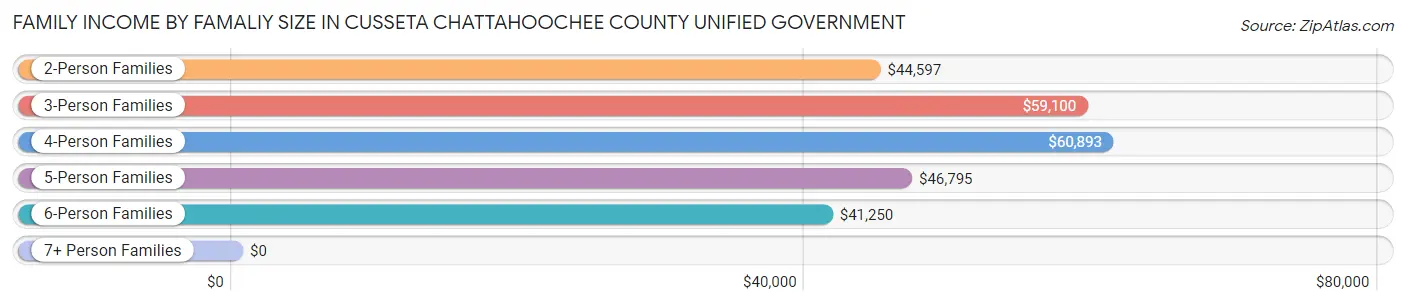
| Income Bracket | # Families | Median Income |
| 2-Person Families | 620 (37.1%) | $44,597 |
| 3-Person Families | 470 (28.2%) | $59,100 |
| 4-Person Families | 315 (18.9%) | $60,893 |
| 5-Person Families | 192 (11.5%) | $46,795 |
| 6-Person Families | 57 (3.4%) | $41,250 |
| 7+ Person Families | 15 (0.9%) | $0 |
| Total | 1,669 (100.0%) | $49,909 |
Family Income by Number of Earners in Cusseta Chattahoochee County unified government
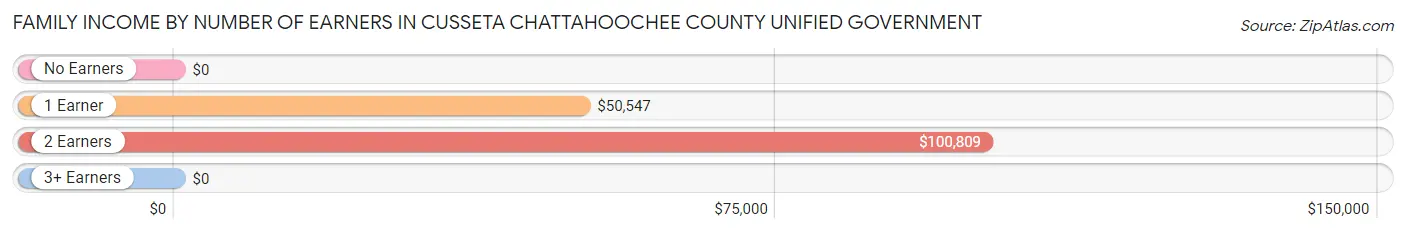
| Number of Earners | # Families | Median Income |
| No Earners | 345 (20.7%) | $0 |
| 1 Earner | 799 (47.9%) | $50,547 |
| 2 Earners | 512 (30.7%) | $100,809 |
| 3+ Earners | 13 (0.8%) | $0 |
| Total | 1,669 (100.0%) | $49,909 |
Household Income in Cusseta Chattahoochee County unified government
Household Income Brackets in Cusseta Chattahoochee County unified government
With 469 households falling in the category, the $50,000 to $74,999 income range is the most frequent in Cusseta Chattahoochee County unified government, accounting for 23.1% of all households. In contrast, only 22 households (1.1%) fall into the $200,000+ income bracket, making it the least populous group.
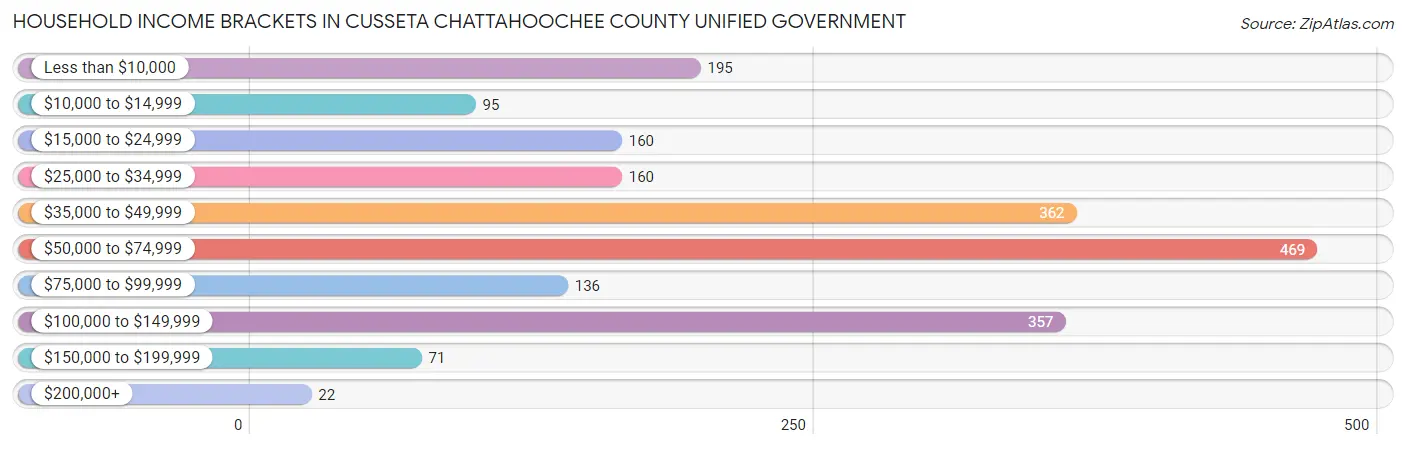
| Income Bracket | # Households | % Households |
| Less than $10,000 | 195 | 9.6% |
| $10,000 to $14,999 | 95 | 4.7% |
| $15,000 to $24,999 | 160 | 7.9% |
| $25,000 to $34,999 | 160 | 7.9% |
| $35,000 to $49,999 | 362 | 17.8% |
| $50,000 to $74,999 | 469 | 23.1% |
| $75,000 to $99,999 | 136 | 6.7% |
| $100,000 to $149,999 | 357 | 17.6% |
| $150,000 to $199,999 | 71 | 3.5% |
| $200,000+ | 22 | 1.1% |
Household Income by Householder Age in Cusseta Chattahoochee County unified government
The median household income in Cusseta Chattahoochee County unified government is $52,943, with the highest median household income of $59,507 found in the 25 to 44 years age bracket for the primary householder. A total of 980 households (48.2%) fall into this category. Meanwhile, the 45 to 64 years age bracket for the primary householder has the lowest median household income of $43,486, with 665 households (32.7%) in this group.
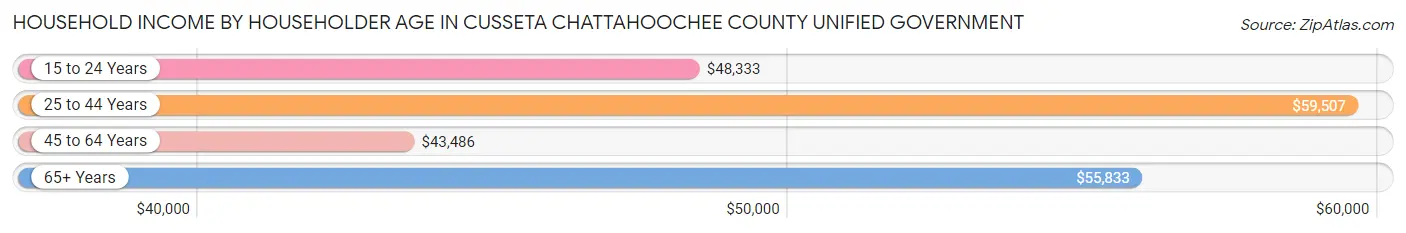
| Income Bracket | # Households | Median Income |
| 15 to 24 Years | 130 (6.4%) | $48,333 |
| 25 to 44 Years | 980 (48.2%) | $59,507 |
| 45 to 64 Years | 665 (32.7%) | $43,486 |
| 65+ Years | 256 (12.6%) | $55,833 |
| Total | 2,031 (100.0%) | $52,943 |
Poverty in Cusseta Chattahoochee County unified government
Income Below Poverty by Sex and Age in Cusseta Chattahoochee County unified government
With 17.1% poverty level for males and 16.7% for females among the residents of Cusseta Chattahoochee County unified government, 55 to 64 year old males and 15 year old females are the most vulnerable to poverty, with 115 males (44.4%) and 11 females (39.3%) in their respective age groups living below the poverty level.
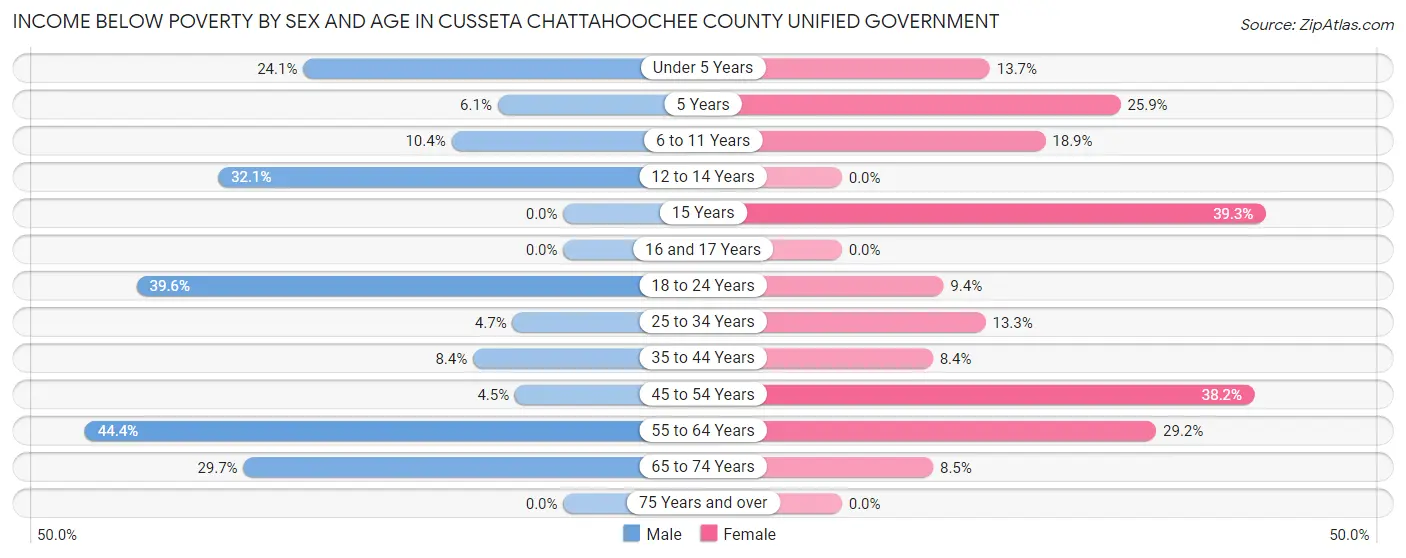
| Age Bracket | Male | Female |
| Under 5 Years | 105 (24.1%) | 47 (13.7%) |
| 5 Years | 7 (6.1%) | 30 (25.9%) |
| 6 to 11 Years | 30 (10.4%) | 75 (18.9%) |
| 12 to 14 Years | 50 (32.1%) | 0 (0.0%) |
| 15 Years | 0 (0.0%) | 11 (39.3%) |
| 16 and 17 Years | 0 (0.0%) | 0 (0.0%) |
| 18 to 24 Years | 40 (39.6%) | 20 (9.4%) |
| 25 to 34 Years | 21 (4.7%) | 103 (13.3%) |
| 35 to 44 Years | 15 (8.4%) | 33 (8.4%) |
| 45 to 54 Years | 9 (4.5%) | 91 (38.2%) |
| 55 to 64 Years | 115 (44.4%) | 77 (29.2%) |
| 65 to 74 Years | 19 (29.7%) | 10 (8.5%) |
| 75 Years and over | 0 (0.0%) | 0 (0.0%) |
| Total | 411 (17.1%) | 497 (16.7%) |
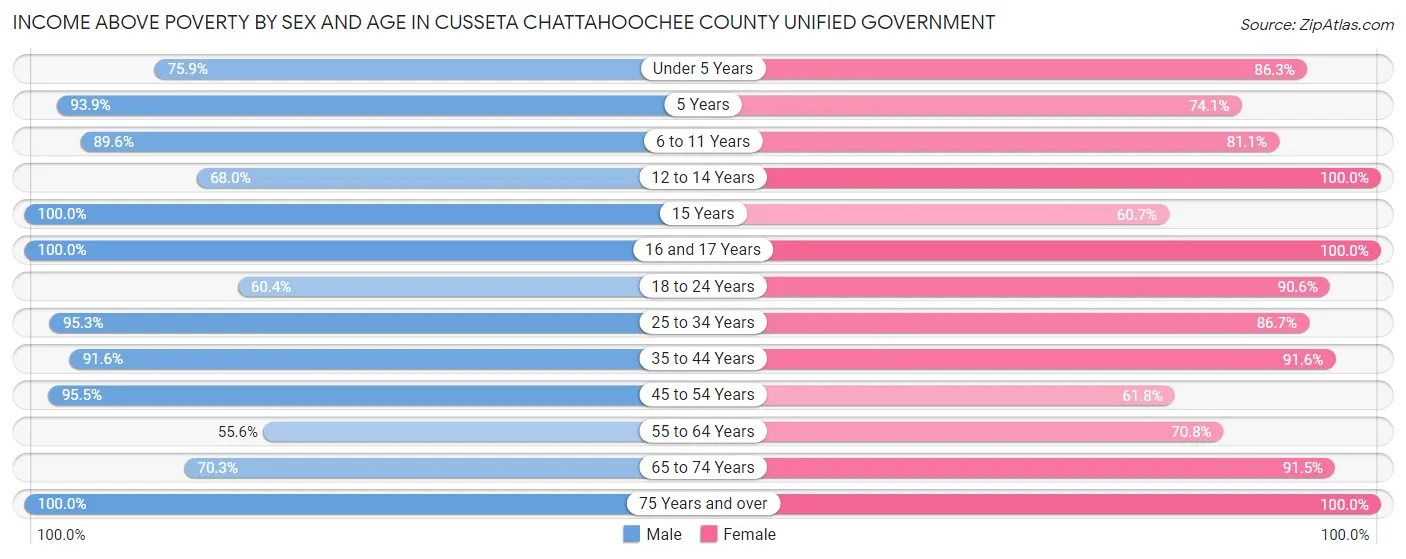
Income Above Poverty by Sex and Age in Cusseta Chattahoochee County unified government
According to the poverty statistics in Cusseta Chattahoochee County unified government, males aged 15 years and females aged 12 to 14 years are the age groups that are most secure financially, with 100.0% of males and 100.0% of females in these age groups living above the poverty line.
| Age Bracket | Male | Female |
| Under 5 Years | 330 (75.9%) | 295 (86.3%) |
| 5 Years | 108 (93.9%) | 86 (74.1%) |
| 6 to 11 Years | 259 (89.6%) | 322 (81.1%) |
| 12 to 14 Years | 106 (67.9%) | 62 (100.0%) |
| 15 Years | 37 (100.0%) | 17 (60.7%) |
| 16 and 17 Years | 70 (100.0%) | 5 (100.0%) |
| 18 to 24 Years | 61 (60.4%) | 192 (90.6%) |
| 25 to 34 Years | 424 (95.3%) | 669 (86.7%) |
| 35 to 44 Years | 164 (91.6%) | 358 (91.6%) |
| 45 to 54 Years | 192 (95.5%) | 147 (61.8%) |
| 55 to 64 Years | 144 (55.6%) | 187 (70.8%) |
| 65 to 74 Years | 45 (70.3%) | 108 (91.5%) |
| 75 Years and over | 51 (100.0%) | 39 (100.0%) |
| Total | 1,991 (82.9%) | 2,487 (83.3%) |
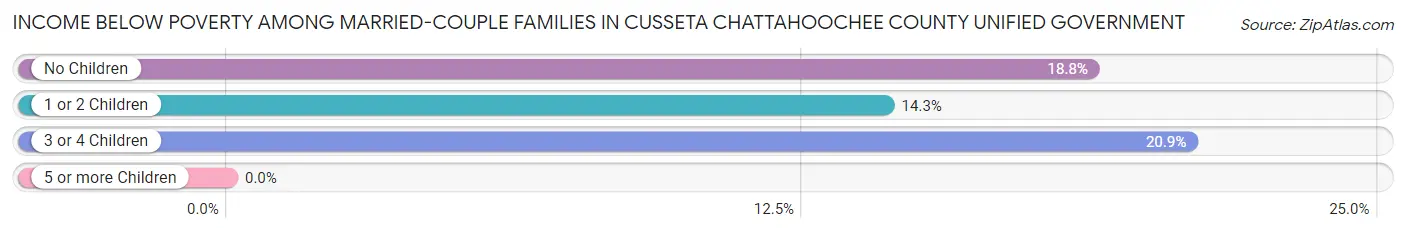
Income Below Poverty Among Married-Couple Families in Cusseta Chattahoochee County unified government
The poverty statistics for married-couple families in Cusseta Chattahoochee County unified government show that 17.3% or 198 of the total 1,142 families live below the poverty line. Families with 3 or 4 children have the highest poverty rate of 20.9%, comprising of 47 families. On the other hand, families with 1 or 2 children have the lowest poverty rate of 14.3%, which includes 67 families.
| Children | Above Poverty | Below Poverty |
| No Children | 364 (81.2%) | 84 (18.8%) |
| 1 or 2 Children | 402 (85.7%) | 67 (14.3%) |
| 3 or 4 Children | 178 (79.1%) | 47 (20.9%) |
| 5 or more Children | 0 (0.0%) | 0 (0.0%) |
| Total | 944 (82.7%) | 198 (17.3%) |
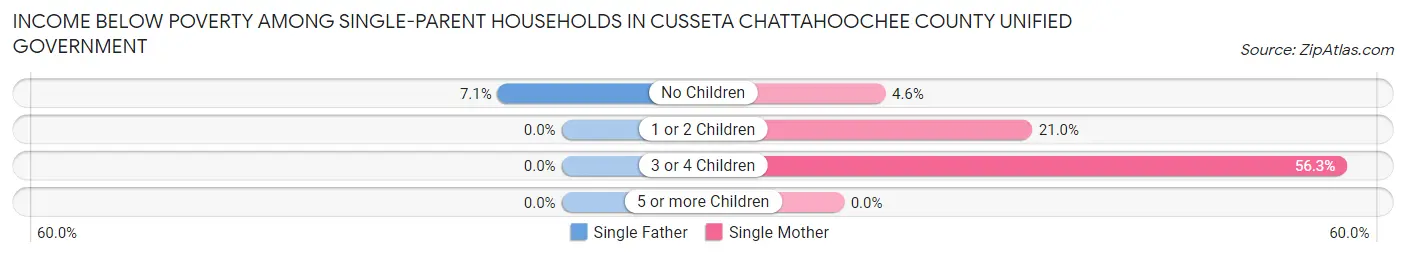
Income Below Poverty Among Single-Parent Households in Cusseta Chattahoochee County unified government
According to the poverty data in Cusseta Chattahoochee County unified government, 6.0% or 4 single-father households and 19.6% or 90 single-mother households are living below the poverty line. Among single-father households, those with no children have the highest poverty rate, with 4 households (7.1%) experiencing poverty. Likewise, among single-mother households, those with 3 or 4 children have the highest poverty rate, with 27 households (56.2%) falling below the poverty line.
| Children | Single Father | Single Mother |
| No Children | 4 (7.1%) | 6 (4.6%) |
| 1 or 2 Children | 0 (0.0%) | 57 (21.0%) |
| 3 or 4 Children | 0 (0.0%) | 27 (56.2%) |
| 5 or more Children | 0 (0.0%) | 0 (0.0%) |
| Total | 4 (6.0%) | 90 (19.6%) |
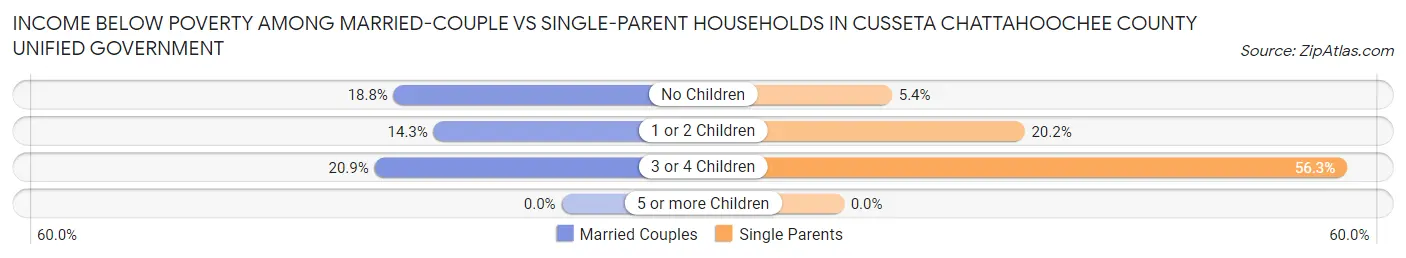
Income Below Poverty Among Married-Couple vs Single-Parent Households in Cusseta Chattahoochee County unified government
The poverty data for Cusseta Chattahoochee County unified government shows that 198 of the married-couple family households (17.3%) and 94 of the single-parent households (17.8%) are living below the poverty level. Within the married-couple family households, those with 3 or 4 children have the highest poverty rate, with 47 households (20.9%) falling below the poverty line. Among the single-parent households, those with 3 or 4 children have the highest poverty rate, with 27 household (56.2%) living below poverty.
| Children | Married-Couple Families | Single-Parent Households |
| No Children | 84 (18.8%) | 10 (5.4%) |
| 1 or 2 Children | 67 (14.3%) | 57 (20.2%) |
| 3 or 4 Children | 47 (20.9%) | 27 (56.2%) |
| 5 or more Children | 0 (0.0%) | 0 (0.0%) |
| Total | 198 (17.3%) | 94 (17.8%) |
Employment Characteristics in Cusseta Chattahoochee County unified government
Employment by Class of Employer in Cusseta Chattahoochee County unified government
Among the 5,719 employed individuals in Cusseta Chattahoochee County unified government, federal government employees (4,402 | 77.0%), private company employees (921 | 16.1%), and local government employees (131 | 2.3%) make up the most common classes of employment.
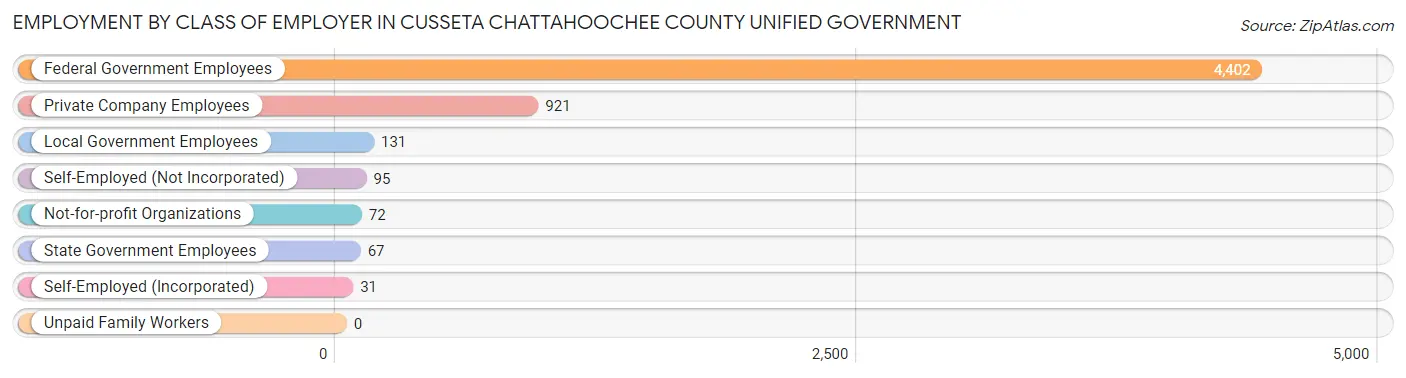
| Employer Class | # Employees | % Employees |
| Private Company Employees | 921 | 16.1% |
| Self-Employed (Incorporated) | 31 | 0.5% |
| Self-Employed (Not Incorporated) | 95 | 1.7% |
| Not-for-profit Organizations | 72 | 1.3% |
| Local Government Employees | 131 | 2.3% |
| State Government Employees | 67 | 1.2% |
| Federal Government Employees | 4,402 | 77.0% |
| Unpaid Family Workers | 0 | 0.0% |
| Total | 5,719 | 100.0% |
Employment Status by Age in Cusseta Chattahoochee County unified government
According to the labor force statistics for Cusseta Chattahoochee County unified government, out of the total population over 16 years of age (7,411), 80.6% or 5,973 individuals are in the labor force, with 8.4% or 502 of them unemployed. The age group with the highest labor force participation rate is 20 to 24 years, with 93.0% or 1,973 individuals in the labor force. Within the labor force, the 60 to 64 years age range has the highest percentage of unemployed individuals, with 43.8% or 7 of them being unemployed.
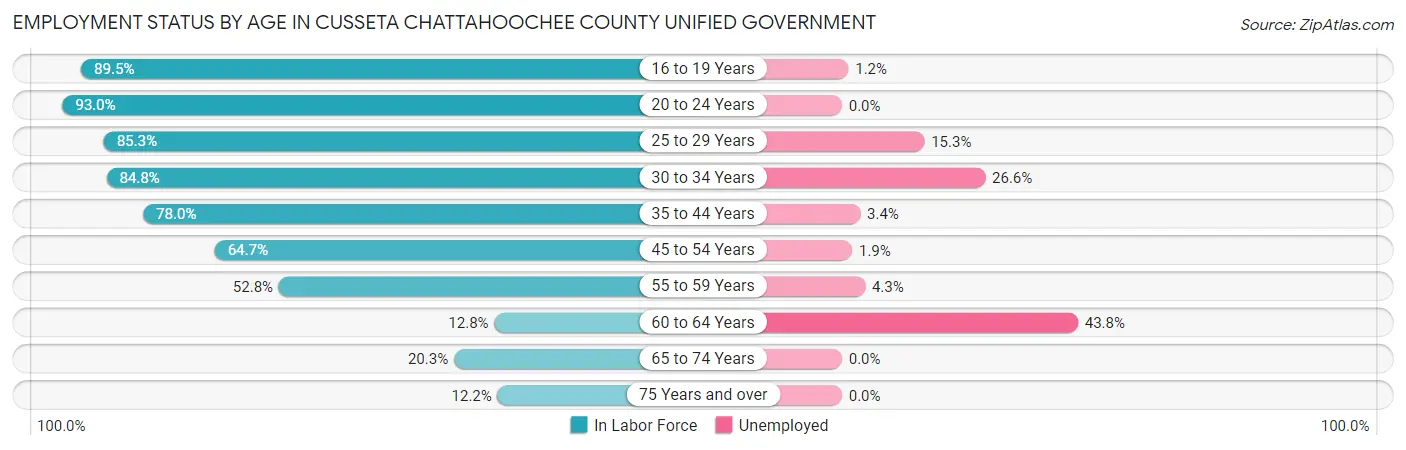
| Age Bracket | In Labor Force | Unemployed |
| 16 to 19 Years | 753 (89.5%) | 9 (1.2%) |
| 20 to 24 Years | 1,973 (93.0%) | 0 (0.0%) |
| 25 to 29 Years | 1,529 (85.3%) | 234 (15.3%) |
| 30 to 34 Years | 649 (84.8%) | 173 (26.6%) |
| 35 to 44 Years | 512 (78.0%) | 17 (3.4%) |
| 45 to 54 Years | 284 (64.7%) | 5 (1.9%) |
| 55 to 59 Years | 210 (52.8%) | 9 (4.3%) |
| 60 to 64 Years | 16 (12.8%) | 7 (43.8%) |
| 65 to 74 Years | 37 (20.3%) | 0 (0.0%) |
| 75 Years and over | 11 (12.2%) | 0 (0.0%) |
| Total | 5,973 (80.6%) | 502 (8.4%) |
Employment Status by Educational Attainment in Cusseta Chattahoochee County unified government
According to labor force statistics for Cusseta Chattahoochee County unified government, 76.7% of individuals (3,203) out of the total population between 25 and 64 years of age (4,176) are in the labor force, with 10.9% or 349 of them being unemployed. The group with the highest labor force participation rate are those with the educational attainment of bachelor's degree or higher, with 87.0% or 1,112 individuals in the labor force. Within the labor force, individuals with college / associate degree education have the highest percentage of unemployment, with 16.6% or 222 of them being unemployed.
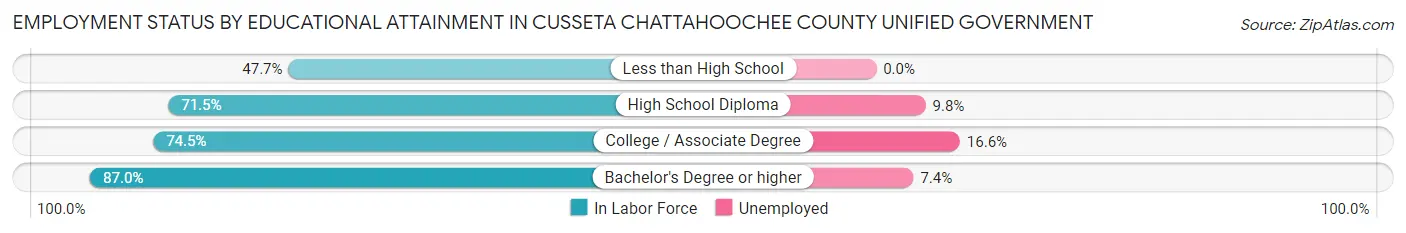
| Educational Attainment | In Labor Force | Unemployed |
| Less than High School | 74 (47.7%) | 0 (0.0%) |
| High School Diploma | 678 (71.5%) | 93 (9.8%) |
| College / Associate Degree | 1,337 (74.5%) | 298 (16.6%) |
| Bachelor's Degree or higher | 1,112 (87.0%) | 95 (7.4%) |
| Total | 3,203 (76.7%) | 455 (10.9%) |
Employment Occupations by Sex in Cusseta Chattahoochee County unified government
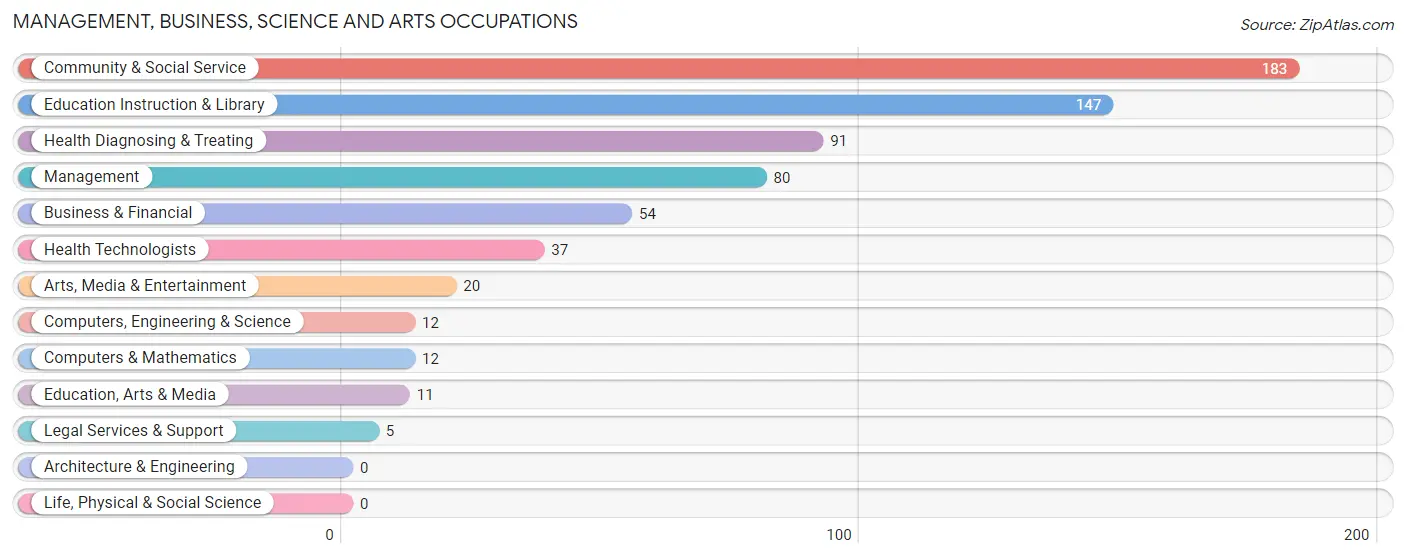
Management, Business, Science and Arts Occupations
The most common Management, Business, Science and Arts occupations in Cusseta Chattahoochee County unified government are Community & Social Service (183 | 12.2%), Education Instruction & Library (147 | 9.8%), Health Diagnosing & Treating (91 | 6.1%), Management (80 | 5.3%), and Business & Financial (54 | 3.6%).
Management, Business, Science and Arts Occupations by Sex
Within the Management, Business, Science and Arts occupations in Cusseta Chattahoochee County unified government, the most male-oriented occupations are Legal Services & Support (100.0%), Computers, Engineering & Science (83.3%), and Computers & Mathematics (83.3%), while the most female-oriented occupations are Education, Arts & Media (100.0%), Education Instruction & Library (100.0%), and Health Technologists (100.0%).
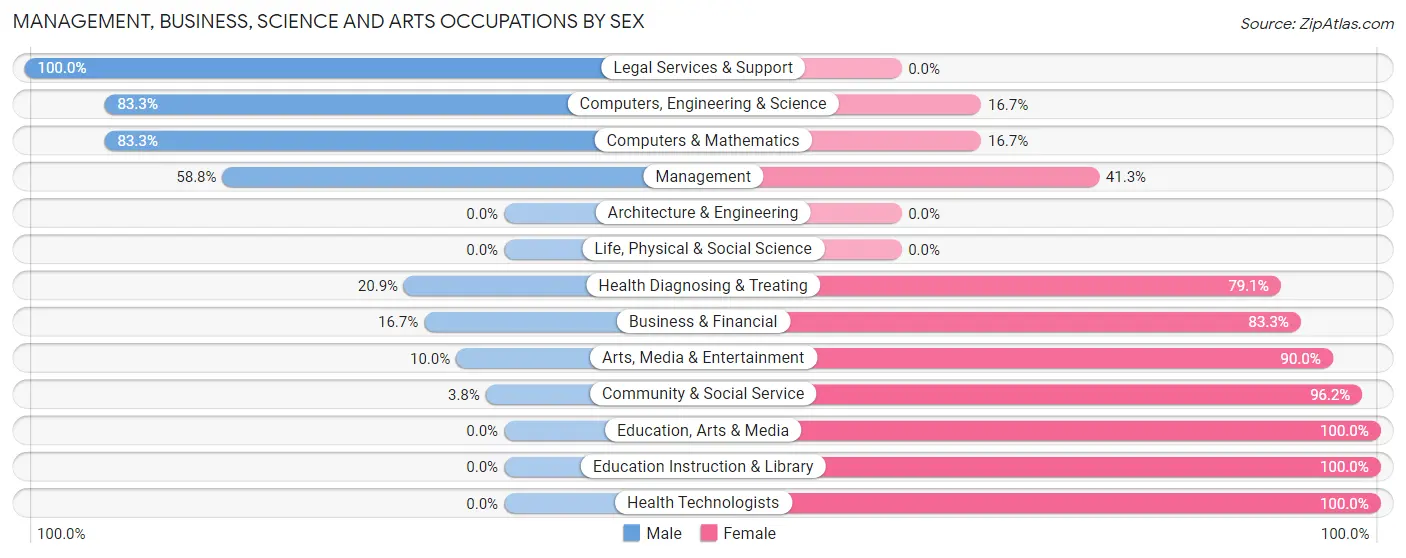
| Occupation | Male | Female |
| Management | 47 (58.8%) | 33 (41.2%) |
| Business & Financial | 9 (16.7%) | 45 (83.3%) |
| Computers, Engineering & Science | 10 (83.3%) | 2 (16.7%) |
| Computers & Mathematics | 10 (83.3%) | 2 (16.7%) |
| Architecture & Engineering | 0 (0.0%) | 0 (0.0%) |
| Life, Physical & Social Science | 0 (0.0%) | 0 (0.0%) |
| Community & Social Service | 7 (3.8%) | 176 (96.2%) |
| Education, Arts & Media | 0 (0.0%) | 11 (100.0%) |
| Legal Services & Support | 5 (100.0%) | 0 (0.0%) |
| Education Instruction & Library | 0 (0.0%) | 147 (100.0%) |
| Arts, Media & Entertainment | 2 (10.0%) | 18 (90.0%) |
| Health Diagnosing & Treating | 19 (20.9%) | 72 (79.1%) |
| Health Technologists | 0 (0.0%) | 37 (100.0%) |
| Total (Category) | 92 (21.9%) | 328 (78.1%) |
| Total (Overall) | 567 (38.0%) | 927 (62.1%) |
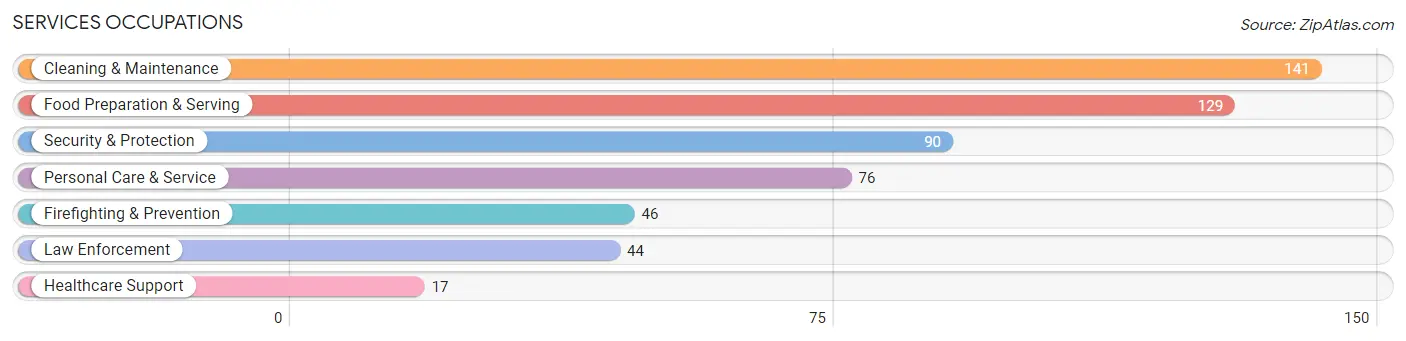
Services Occupations
The most common Services occupations in Cusseta Chattahoochee County unified government are Cleaning & Maintenance (141 | 9.4%), Food Preparation & Serving (129 | 8.6%), Security & Protection (90 | 6.0%), Personal Care & Service (76 | 5.1%), and Firefighting & Prevention (46 | 3.1%).
Services Occupations by Sex
Within the Services occupations in Cusseta Chattahoochee County unified government, the most male-oriented occupations are Cleaning & Maintenance (70.2%), Food Preparation & Serving (62.0%), and Firefighting & Prevention (45.7%), while the most female-oriented occupations are Healthcare Support (100.0%), Law Enforcement (86.4%), and Personal Care & Service (78.9%).
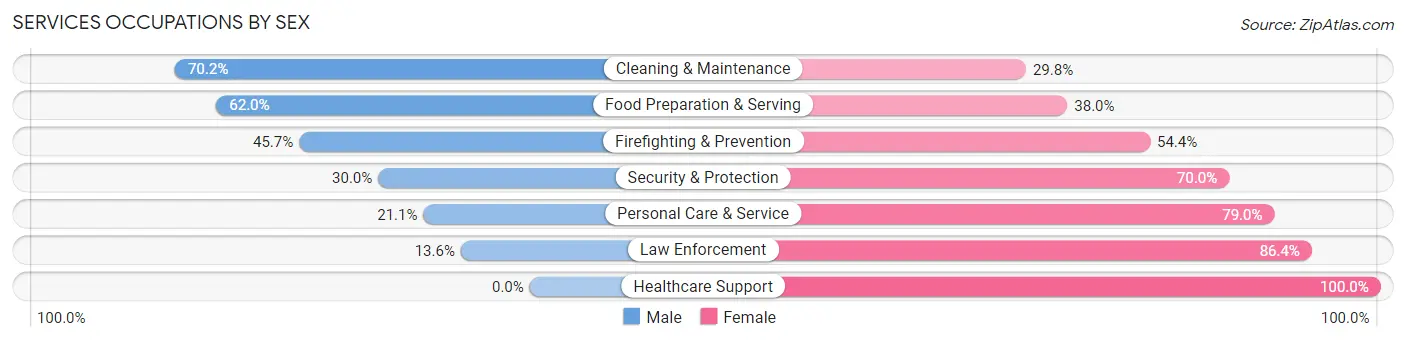
| Occupation | Male | Female |
| Healthcare Support | 0 (0.0%) | 17 (100.0%) |
| Security & Protection | 27 (30.0%) | 63 (70.0%) |
| Firefighting & Prevention | 21 (45.7%) | 25 (54.3%) |
| Law Enforcement | 6 (13.6%) | 38 (86.4%) |
| Food Preparation & Serving | 80 (62.0%) | 49 (38.0%) |
| Cleaning & Maintenance | 99 (70.2%) | 42 (29.8%) |
| Personal Care & Service | 16 (21.0%) | 60 (78.9%) |
| Total (Category) | 222 (49.0%) | 231 (51.0%) |
| Total (Overall) | 567 (38.0%) | 927 (62.1%) |
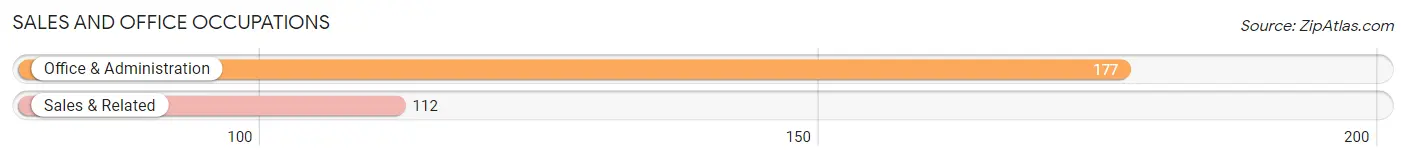
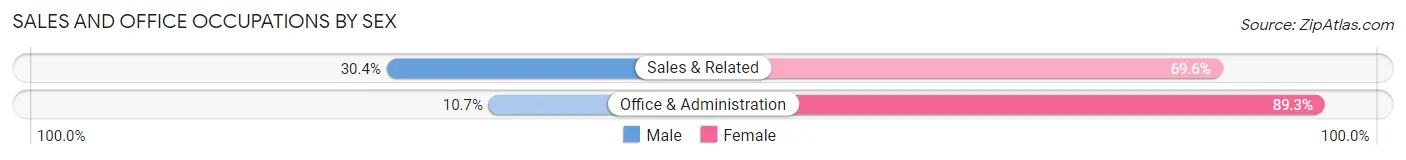
Sales and Office Occupations
The most common Sales and Office occupations in Cusseta Chattahoochee County unified government are Office & Administration (177 | 11.8%), and Sales & Related (112 | 7.5%).
Sales and Office Occupations by Sex
| Occupation | Male | Female |
| Sales & Related | 34 (30.4%) | 78 (69.6%) |
| Office & Administration | 19 (10.7%) | 158 (89.3%) |
| Total (Category) | 53 (18.3%) | 236 (81.7%) |
| Total (Overall) | 567 (38.0%) | 927 (62.1%) |
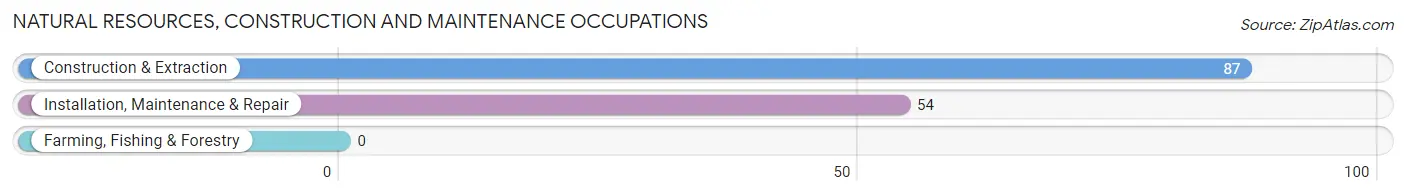
Natural Resources, Construction and Maintenance Occupations
The most common Natural Resources, Construction and Maintenance occupations in Cusseta Chattahoochee County unified government are Construction & Extraction (87 | 5.8%), and Installation, Maintenance & Repair (54 | 3.6%).
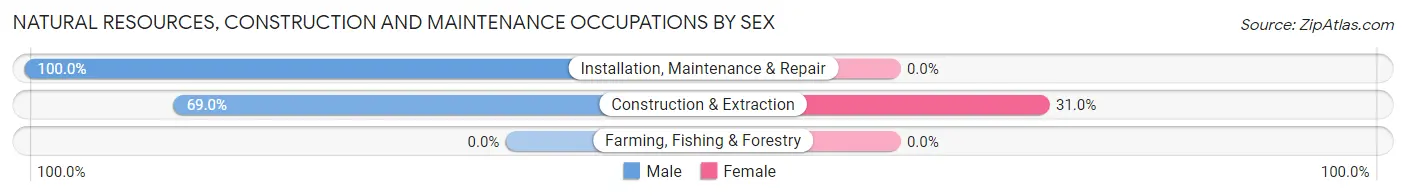
Natural Resources, Construction and Maintenance Occupations by Sex
| Occupation | Male | Female |
| Farming, Fishing & Forestry | 0 (0.0%) | 0 (0.0%) |
| Construction & Extraction | 60 (69.0%) | 27 (31.0%) |
| Installation, Maintenance & Repair | 54 (100.0%) | 0 (0.0%) |
| Total (Category) | 114 (80.8%) | 27 (19.2%) |
| Total (Overall) | 567 (38.0%) | 927 (62.1%) |
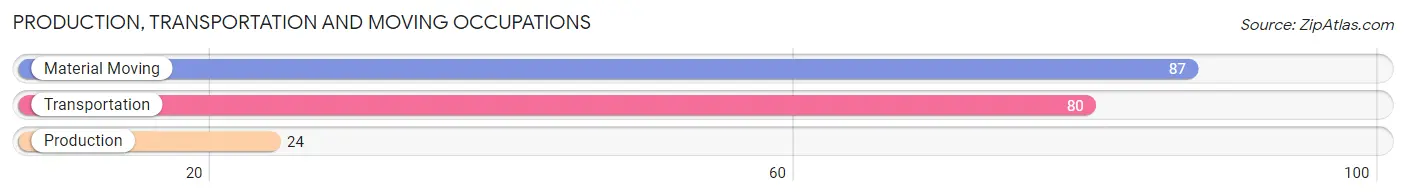
Production, Transportation and Moving Occupations
The most common Production, Transportation and Moving occupations in Cusseta Chattahoochee County unified government are Material Moving (87 | 5.8%), Transportation (80 | 5.3%), and Production (24 | 1.6%).
Production, Transportation and Moving Occupations by Sex
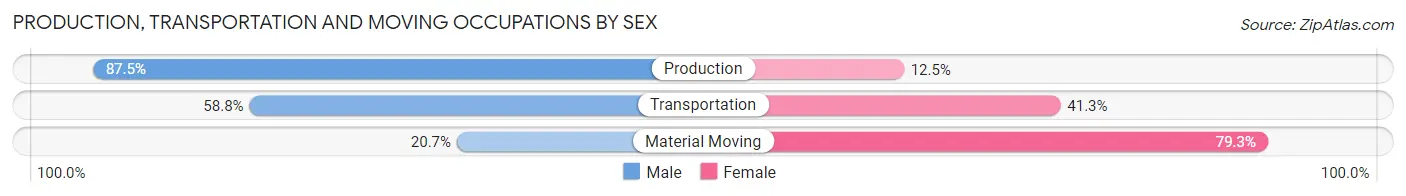
| Occupation | Male | Female |
| Production | 21 (87.5%) | 3 (12.5%) |
| Transportation | 47 (58.8%) | 33 (41.2%) |
| Material Moving | 18 (20.7%) | 69 (79.3%) |
| Total (Category) | 86 (45.0%) | 105 (55.0%) |
| Total (Overall) | 567 (38.0%) | 927 (62.1%) |
Employment Industries by Sex in Cusseta Chattahoochee County unified government
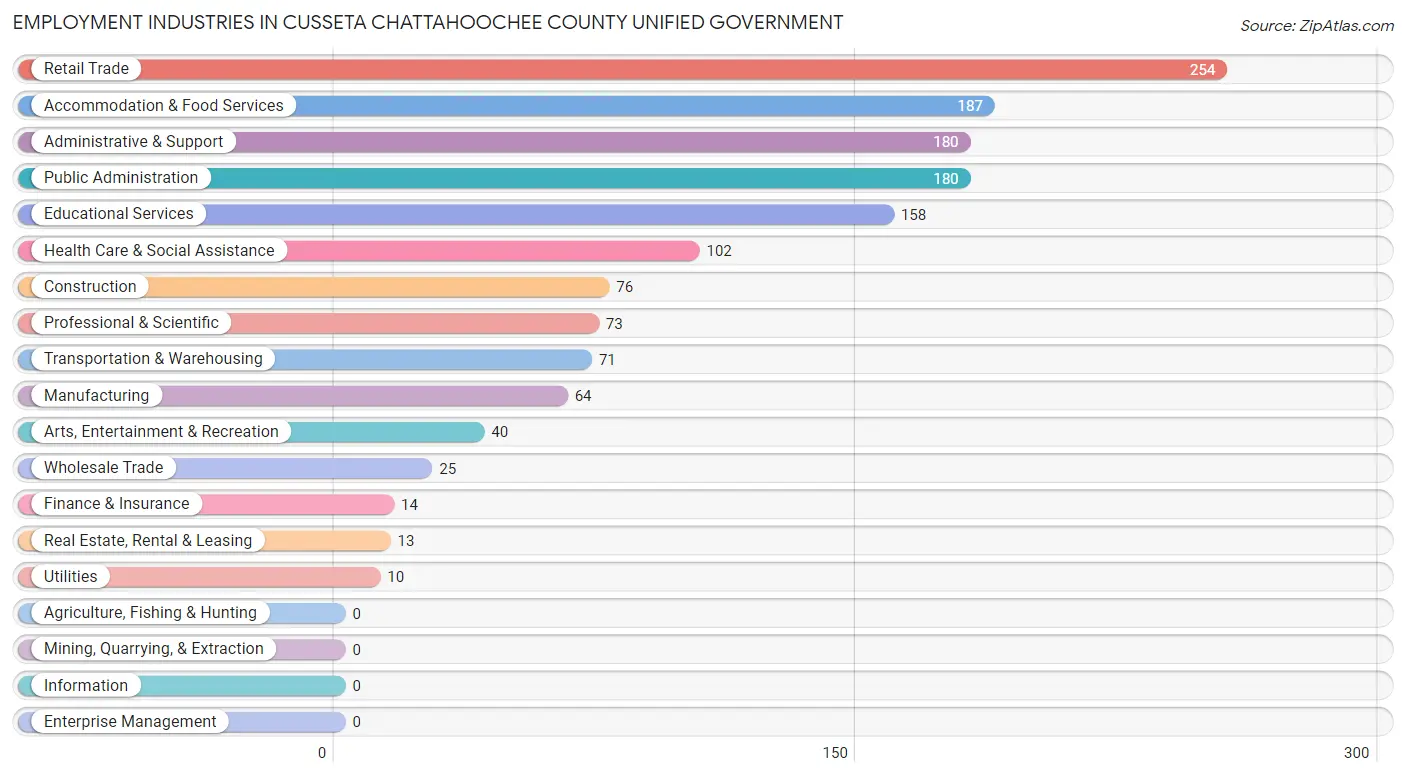
Employment Industries in Cusseta Chattahoochee County unified government
The major employment industries in Cusseta Chattahoochee County unified government include Retail Trade (254 | 17.0%), Accommodation & Food Services (187 | 12.5%), Administrative & Support (180 | 12.0%), Public Administration (180 | 12.0%), and Educational Services (158 | 10.6%).
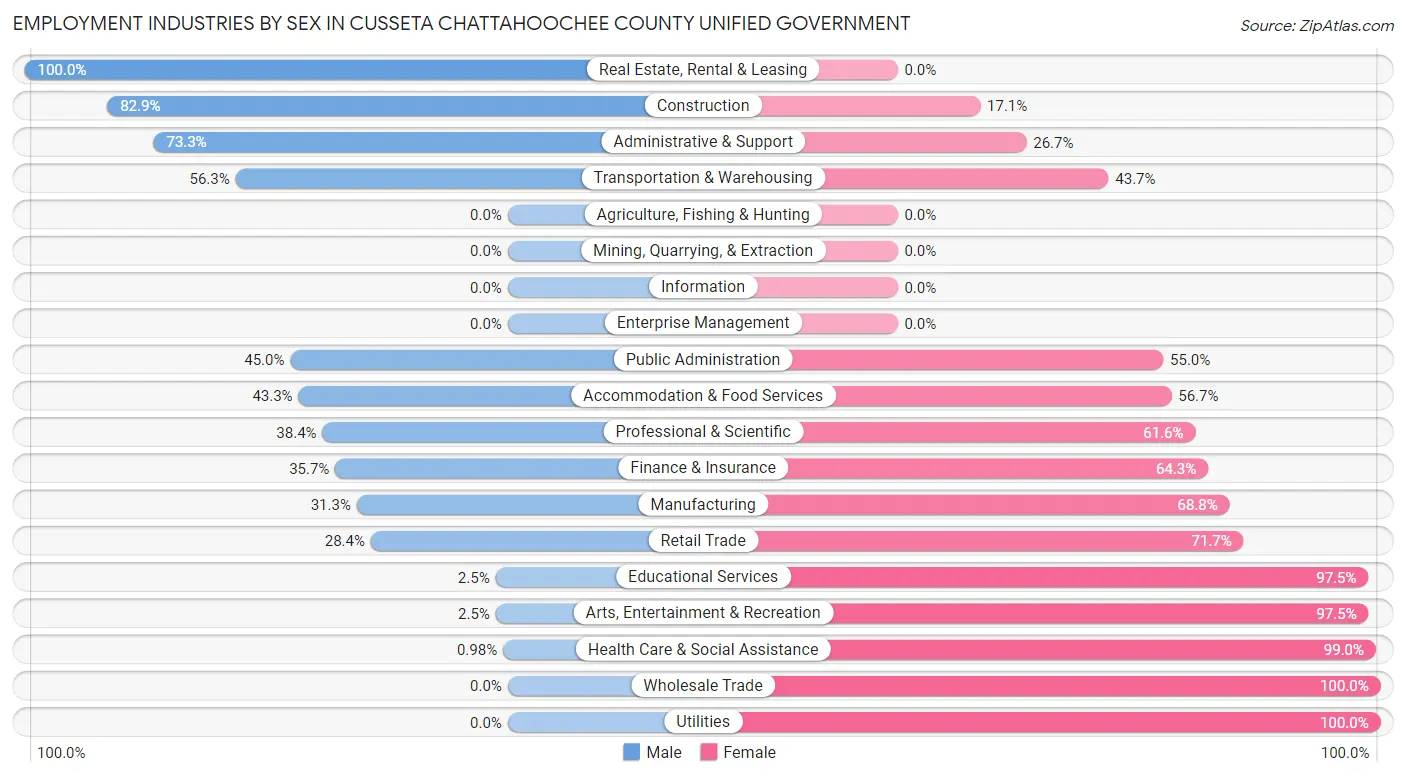
Employment Industries by Sex in Cusseta Chattahoochee County unified government
The Cusseta Chattahoochee County unified government industries that see more men than women are Real Estate, Rental & Leasing (100.0%), Construction (82.9%), and Administrative & Support (73.3%), whereas the industries that tend to have a higher number of women are Wholesale Trade (100.0%), Utilities (100.0%), and Health Care & Social Assistance (99.0%).
| Industry | Male | Female |
| Agriculture, Fishing & Hunting | 0 (0.0%) | 0 (0.0%) |
| Mining, Quarrying, & Extraction | 0 (0.0%) | 0 (0.0%) |
| Construction | 63 (82.9%) | 13 (17.1%) |
| Manufacturing | 20 (31.2%) | 44 (68.8%) |
| Wholesale Trade | 0 (0.0%) | 25 (100.0%) |
| Retail Trade | 72 (28.3%) | 182 (71.7%) |
| Transportation & Warehousing | 40 (56.3%) | 31 (43.7%) |
| Utilities | 0 (0.0%) | 10 (100.0%) |
| Information | 0 (0.0%) | 0 (0.0%) |
| Finance & Insurance | 5 (35.7%) | 9 (64.3%) |
| Real Estate, Rental & Leasing | 13 (100.0%) | 0 (0.0%) |
| Professional & Scientific | 28 (38.4%) | 45 (61.6%) |
| Enterprise Management | 0 (0.0%) | 0 (0.0%) |
| Administrative & Support | 132 (73.3%) | 48 (26.7%) |
| Educational Services | 4 (2.5%) | 154 (97.5%) |
| Health Care & Social Assistance | 1 (1.0%) | 101 (99.0%) |
| Arts, Entertainment & Recreation | 1 (2.5%) | 39 (97.5%) |
| Accommodation & Food Services | 81 (43.3%) | 106 (56.7%) |
| Public Administration | 81 (45.0%) | 99 (55.0%) |
| Total | 567 (38.0%) | 927 (62.1%) |
Education in Cusseta Chattahoochee County unified government
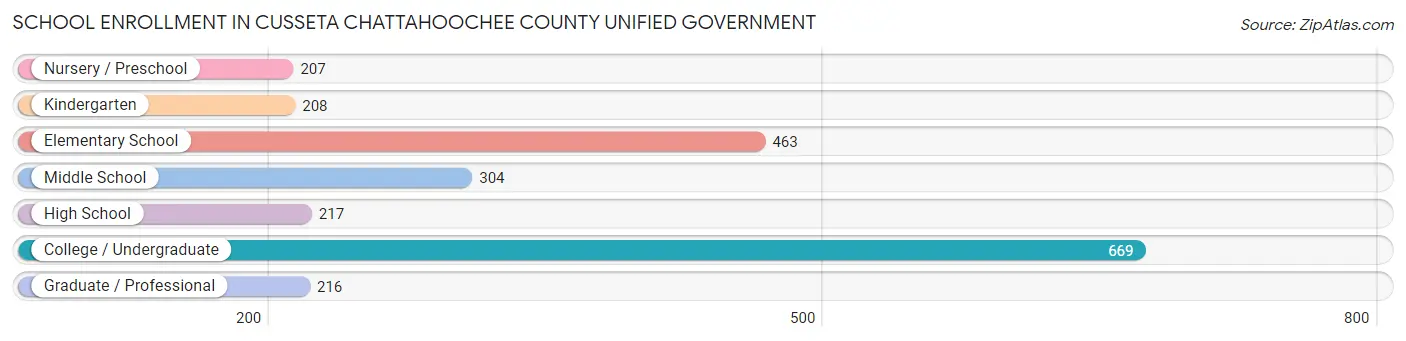
School Enrollment in Cusseta Chattahoochee County unified government
The most common levels of schooling among the 2,284 students in Cusseta Chattahoochee County unified government are college / undergraduate (669 | 29.3%), elementary school (463 | 20.3%), and middle school (304 | 13.3%).
| School Level | # Students | % Students |
| Nursery / Preschool | 207 | 9.1% |
| Kindergarten | 208 | 9.1% |
| Elementary School | 463 | 20.3% |
| Middle School | 304 | 13.3% |
| High School | 217 | 9.5% |
| College / Undergraduate | 669 | 29.3% |
| Graduate / Professional | 216 | 9.5% |
| Total | 2,284 | 100.0% |
School Enrollment by Age by Funding Source in Cusseta Chattahoochee County unified government
Out of a total of 2,284 students who are enrolled in schools in Cusseta Chattahoochee County unified government, 441 (19.3%) attend a private institution, while the remaining 1,843 (80.7%) are enrolled in public schools. The age group of 20 to 24 year olds has the highest likelihood of being enrolled in private schools, with 81 (35.5% in the age bracket) enrolled. Conversely, the age group of 18 to 19 year olds has the lowest likelihood of being enrolled in a private school, with 29 (90.6% in the age bracket) attending a public institution.
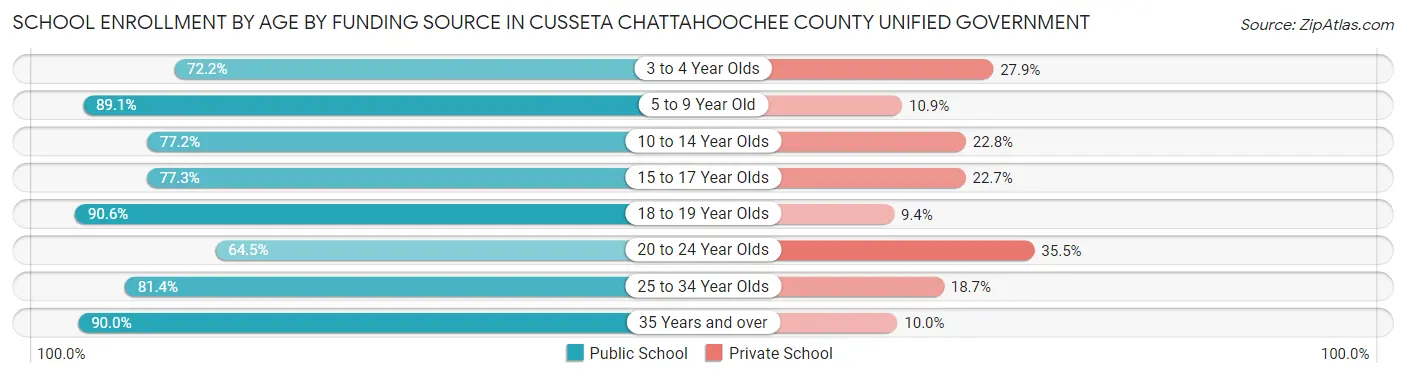
| Age Bracket | Public School | Private School |
| 3 to 4 Year Olds | 114 (72.2%) | 44 (27.9%) |
| 5 to 9 Year Old | 590 (89.1%) | 72 (10.9%) |
| 10 to 14 Year Olds | 312 (77.2%) | 92 (22.8%) |
| 15 to 17 Year Olds | 109 (77.3%) | 32 (22.7%) |
| 18 to 19 Year Olds | 29 (90.6%) | 3 (9.4%) |
| 20 to 24 Year Olds | 147 (64.5%) | 81 (35.5%) |
| 25 to 34 Year Olds | 471 (81.4%) | 108 (18.6%) |
| 35 Years and over | 72 (90.0%) | 8 (10.0%) |
| Total | 1,843 (80.7%) | 441 (19.3%) |
Educational Attainment by Field of Study in Cusseta Chattahoochee County unified government
Arts & humanities (228 | 16.1%), business (200 | 14.1%), education (149 | 10.5%), computers & mathematics (142 | 10.0%), and science & technology (136 | 9.6%) are the most common fields of study among 1,418 individuals in Cusseta Chattahoochee County unified government who have obtained a bachelor's degree or higher.
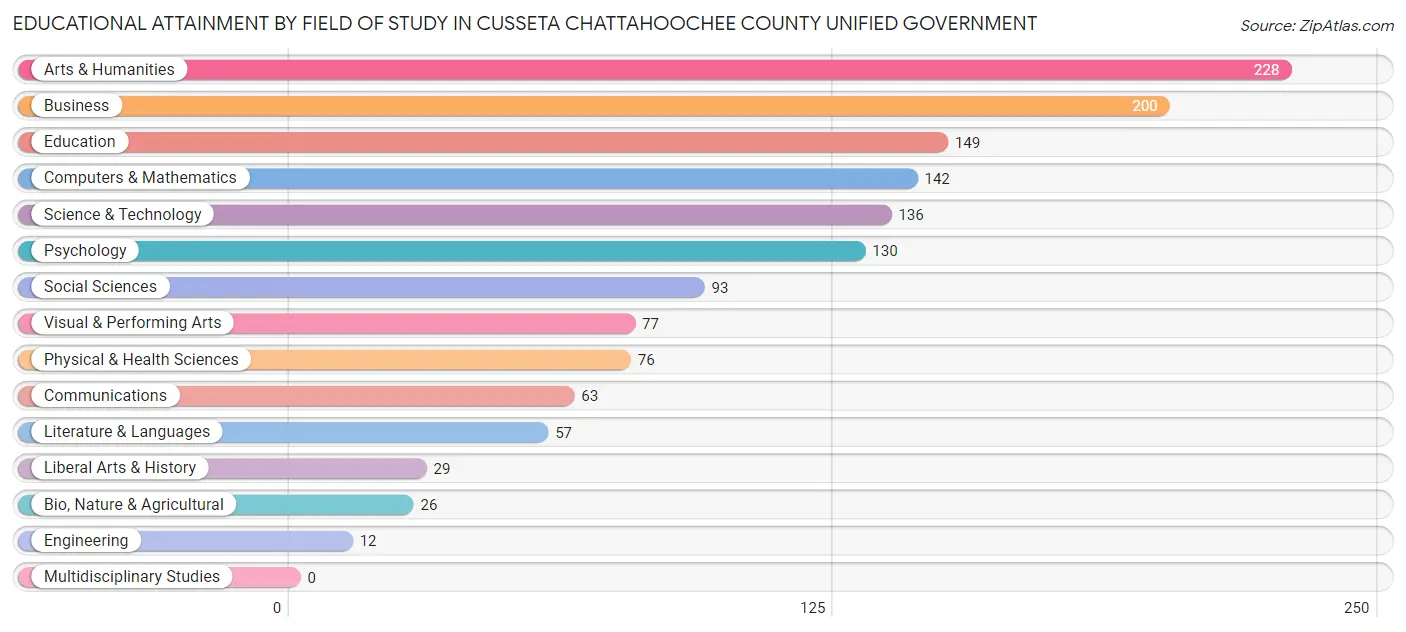
| Field of Study | # Graduates | % Graduates |
| Computers & Mathematics | 142 | 10.0% |
| Bio, Nature & Agricultural | 26 | 1.8% |
| Physical & Health Sciences | 76 | 5.4% |
| Psychology | 130 | 9.2% |
| Social Sciences | 93 | 6.6% |
| Engineering | 12 | 0.9% |
| Multidisciplinary Studies | 0 | 0.0% |
| Science & Technology | 136 | 9.6% |
| Business | 200 | 14.1% |
| Education | 149 | 10.5% |
| Literature & Languages | 57 | 4.0% |
| Liberal Arts & History | 29 | 2.1% |
| Visual & Performing Arts | 77 | 5.4% |
| Communications | 63 | 4.4% |
| Arts & Humanities | 228 | 16.1% |
| Total | 1,418 | 100.0% |
Transportation & Commute in Cusseta Chattahoochee County unified government
Vehicle Availability by Sex in Cusseta Chattahoochee County unified government
The most prevalent vehicle ownership categories in Cusseta Chattahoochee County unified government are males with 2 vehicles (450, accounting for 49.3%) and females with 2 vehicles (519, making up 47.0%).
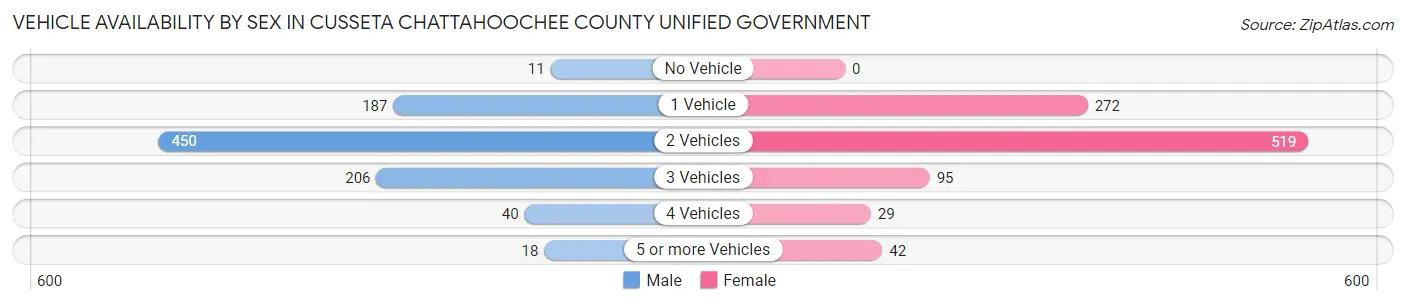
| Vehicles Available | Male | Female |
| No Vehicle | 11 (1.2%) | 0 (0.0%) |
| 1 Vehicle | 187 (20.5%) | 272 (28.4%) |
| 2 Vehicles | 450 (49.3%) | 519 (54.2%) |
| 3 Vehicles | 206 (22.6%) | 95 (9.9%) |
| 4 Vehicles | 40 (4.4%) | 29 (3.0%) |
| 5 or more Vehicles | 18 (2.0%) | 42 (4.4%) |
| Total | 912 (100.0%) | 957 (100.0%) |
Commute Time in Cusseta Chattahoochee County unified government
The most frequently occuring commute durations in Cusseta Chattahoochee County unified government are 5 to 9 minutes (1,810 commuters, 33.8%), less than 5 minutes (1,194 commuters, 22.3%), and 10 to 14 minutes (1,004 commuters, 18.7%).
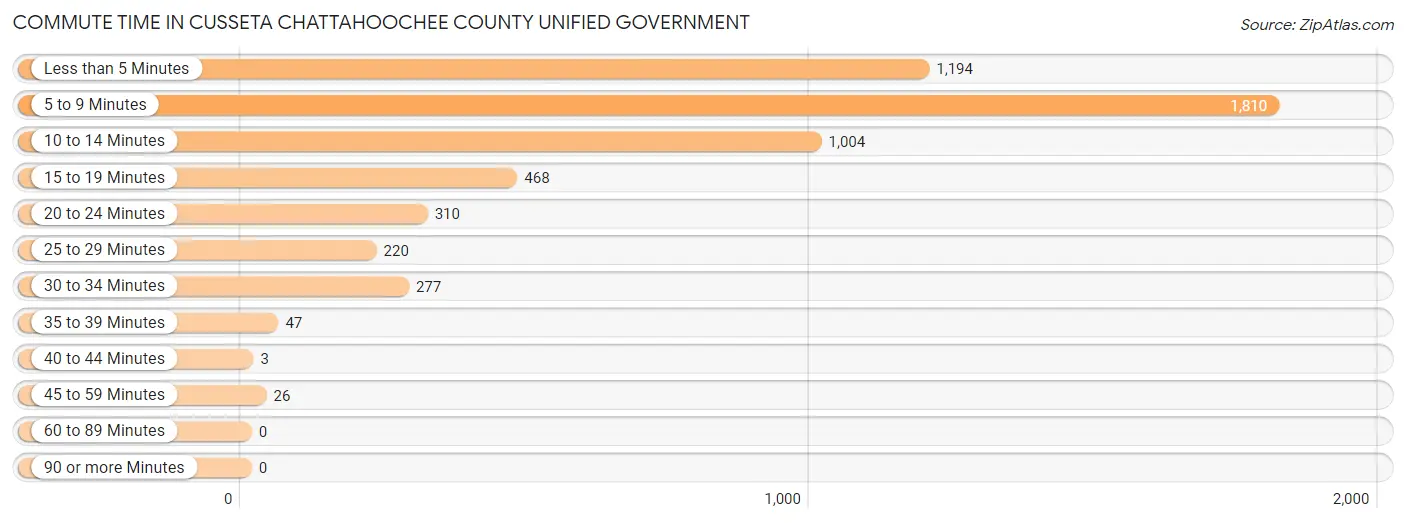
| Commute Time | # Commuters | % Commuters |
| Less than 5 Minutes | 1,194 | 22.3% |
| 5 to 9 Minutes | 1,810 | 33.8% |
| 10 to 14 Minutes | 1,004 | 18.7% |
| 15 to 19 Minutes | 468 | 8.7% |
| 20 to 24 Minutes | 310 | 5.8% |
| 25 to 29 Minutes | 220 | 4.1% |
| 30 to 34 Minutes | 277 | 5.2% |
| 35 to 39 Minutes | 47 | 0.9% |
| 40 to 44 Minutes | 3 | 0.1% |
| 45 to 59 Minutes | 26 | 0.5% |
| 60 to 89 Minutes | 0 | 0.0% |
| 90 or more Minutes | 0 | 0.0% |
Commute Time by Sex in Cusseta Chattahoochee County unified government
The most common commute times in Cusseta Chattahoochee County unified government are 5 to 9 minutes (1,552 commuters, 37.2%) for males and 5 to 9 minutes (258 commuters, 21.7%) for females.
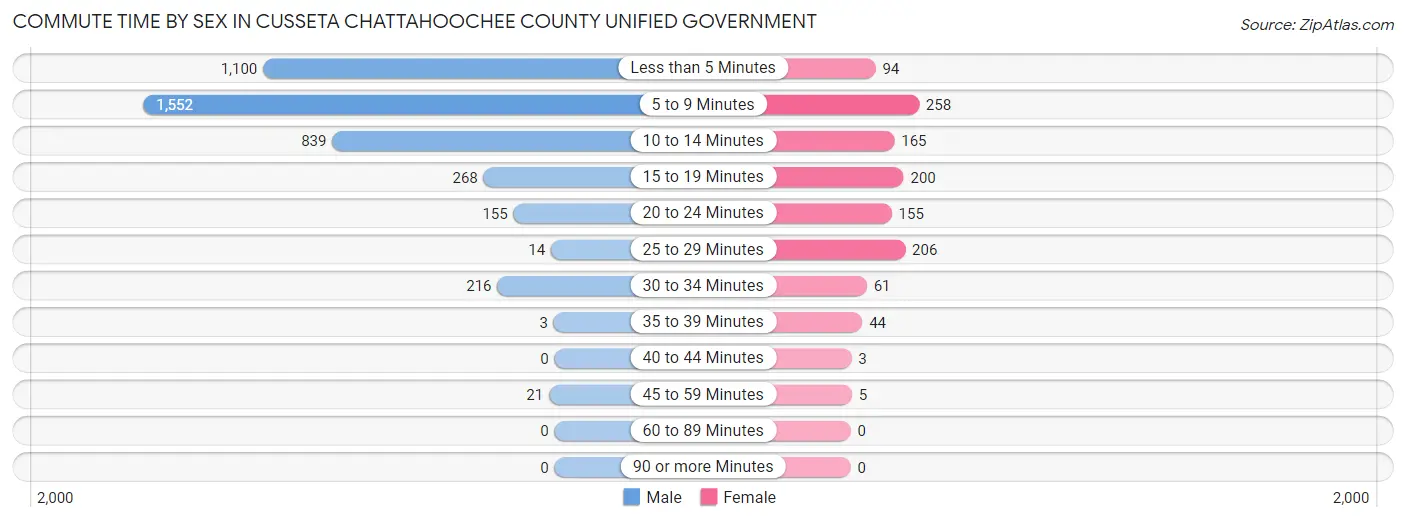
| Commute Time | Male | Female |
| Less than 5 Minutes | 1,100 (26.4%) | 94 (7.9%) |
| 5 to 9 Minutes | 1,552 (37.2%) | 258 (21.7%) |
| 10 to 14 Minutes | 839 (20.1%) | 165 (13.9%) |
| 15 to 19 Minutes | 268 (6.4%) | 200 (16.8%) |
| 20 to 24 Minutes | 155 (3.7%) | 155 (13.0%) |
| 25 to 29 Minutes | 14 (0.3%) | 206 (17.3%) |
| 30 to 34 Minutes | 216 (5.2%) | 61 (5.1%) |
| 35 to 39 Minutes | 3 (0.1%) | 44 (3.7%) |
| 40 to 44 Minutes | 0 (0.0%) | 3 (0.3%) |
| 45 to 59 Minutes | 21 (0.5%) | 5 (0.4%) |
| 60 to 89 Minutes | 0 (0.0%) | 0 (0.0%) |
| 90 or more Minutes | 0 (0.0%) | 0 (0.0%) |
Time of Departure to Work by Sex in Cusseta Chattahoochee County unified government
The most frequent times of departure to work in Cusseta Chattahoochee County unified government are 6:00 AM to 6:29 AM (713, 17.1%) for males and 8:00 AM to 8:29 AM (182, 15.3%) for females.
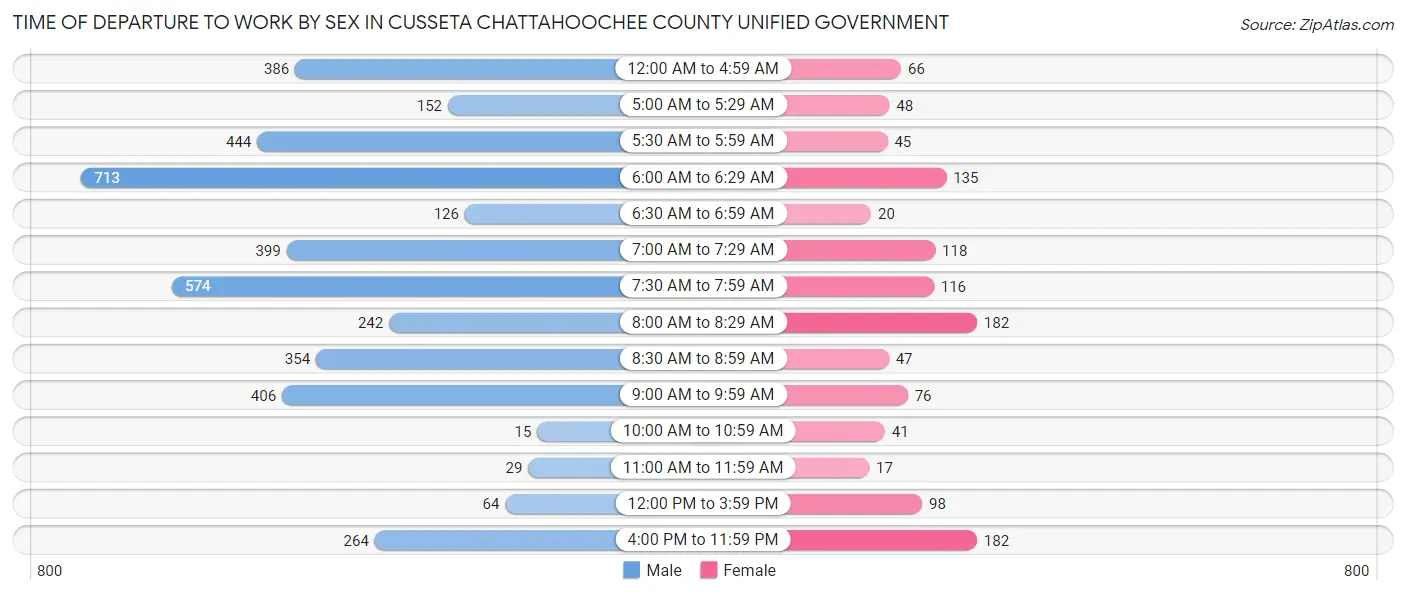
| Time of Departure | Male | Female |
| 12:00 AM to 4:59 AM | 386 (9.3%) | 66 (5.5%) |
| 5:00 AM to 5:29 AM | 152 (3.6%) | 48 (4.0%) |
| 5:30 AM to 5:59 AM | 444 (10.6%) | 45 (3.8%) |
| 6:00 AM to 6:29 AM | 713 (17.1%) | 135 (11.3%) |
| 6:30 AM to 6:59 AM | 126 (3.0%) | 20 (1.7%) |
| 7:00 AM to 7:29 AM | 399 (9.6%) | 118 (9.9%) |
| 7:30 AM to 7:59 AM | 574 (13.8%) | 116 (9.7%) |
| 8:00 AM to 8:29 AM | 242 (5.8%) | 182 (15.3%) |
| 8:30 AM to 8:59 AM | 354 (8.5%) | 47 (4.0%) |
| 9:00 AM to 9:59 AM | 406 (9.7%) | 76 (6.4%) |
| 10:00 AM to 10:59 AM | 15 (0.4%) | 41 (3.4%) |
| 11:00 AM to 11:59 AM | 29 (0.7%) | 17 (1.4%) |
| 12:00 PM to 3:59 PM | 64 (1.5%) | 98 (8.2%) |
| 4:00 PM to 11:59 PM | 264 (6.3%) | 182 (15.3%) |
| Total | 4,168 (100.0%) | 1,191 (100.0%) |
Housing Occupancy in Cusseta Chattahoochee County unified government
Occupancy by Ownership in Cusseta Chattahoochee County unified government
Of the total 2,031 dwellings in Cusseta Chattahoochee County unified government, owner-occupied units account for 634 (31.2%), while renter-occupied units make up 1,397 (68.8%).
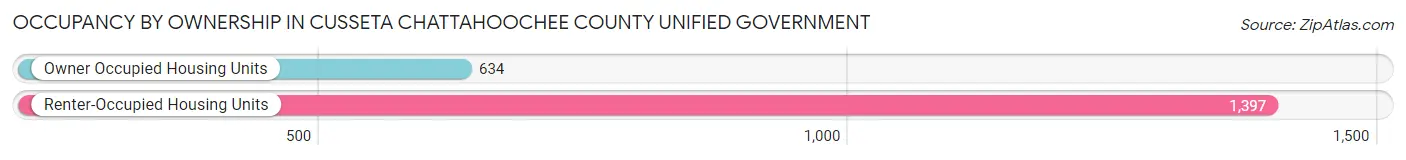
| Occupancy | # Housing Units | % Housing Units |
| Owner Occupied Housing Units | 634 | 31.2% |
| Renter-Occupied Housing Units | 1,397 | 68.8% |
| Total Occupied Housing Units | 2,031 | 100.0% |
Occupancy by Household Size in Cusseta Chattahoochee County unified government
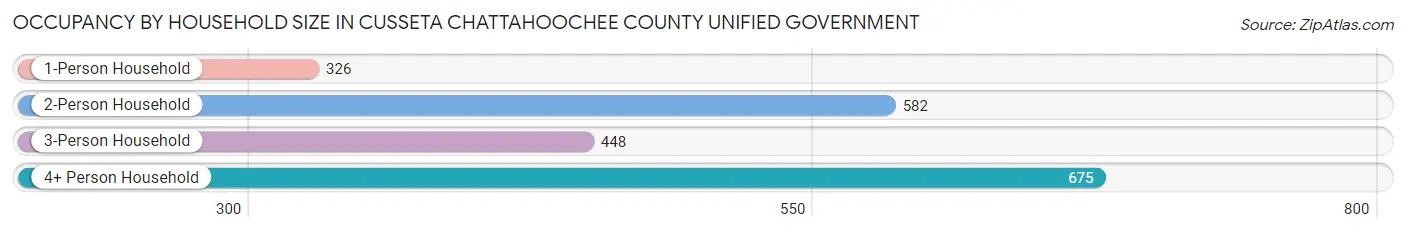
| Household Size | # Housing Units | % Housing Units |
| 1-Person Household | 326 | 16.1% |
| 2-Person Household | 582 | 28.7% |
| 3-Person Household | 448 | 22.1% |
| 4+ Person Household | 675 | 33.2% |
| Total Housing Units | 2,031 | 100.0% |
Occupancy by Ownership by Household Size in Cusseta Chattahoochee County unified government
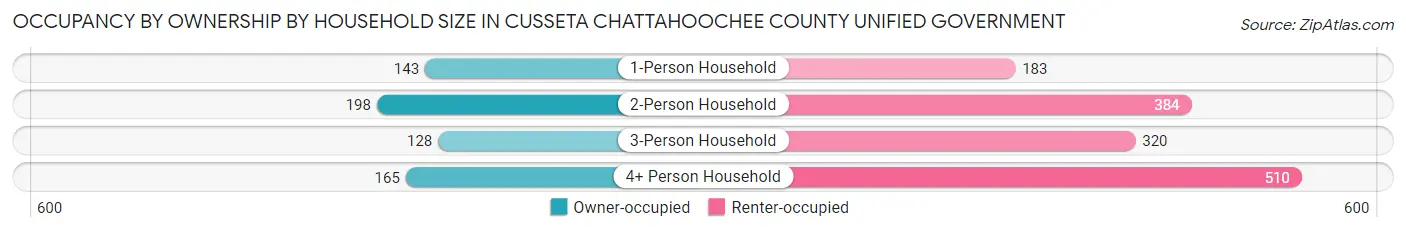
| Household Size | Owner-occupied | Renter-occupied |
| 1-Person Household | 143 (43.9%) | 183 (56.1%) |
| 2-Person Household | 198 (34.0%) | 384 (66.0%) |
| 3-Person Household | 128 (28.6%) | 320 (71.4%) |
| 4+ Person Household | 165 (24.4%) | 510 (75.6%) |
| Total Housing Units | 634 (31.2%) | 1,397 (68.8%) |
Occupancy by Educational Attainment in Cusseta Chattahoochee County unified government
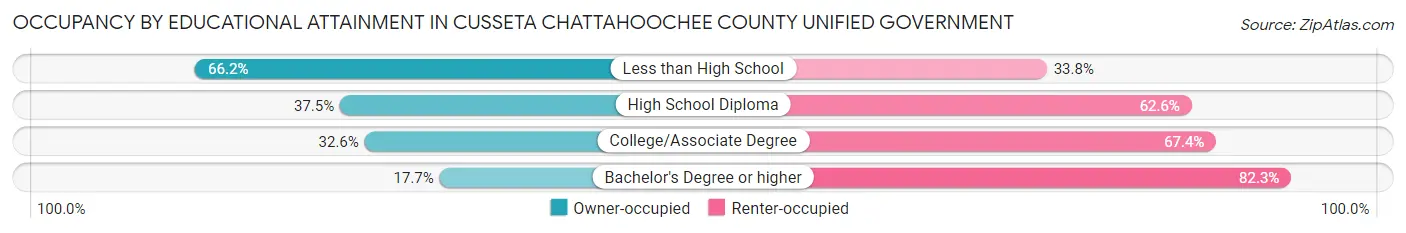
| Household Size | Owner-occupied | Renter-occupied |
| Less than High School | 45 (66.2%) | 23 (33.8%) |
| High School Diploma | 203 (37.4%) | 339 (62.5%) |
| College/Associate Degree | 294 (32.6%) | 608 (67.4%) |
| Bachelor's Degree or higher | 92 (17.7%) | 427 (82.3%) |
Occupancy by Age of Householder in Cusseta Chattahoochee County unified government
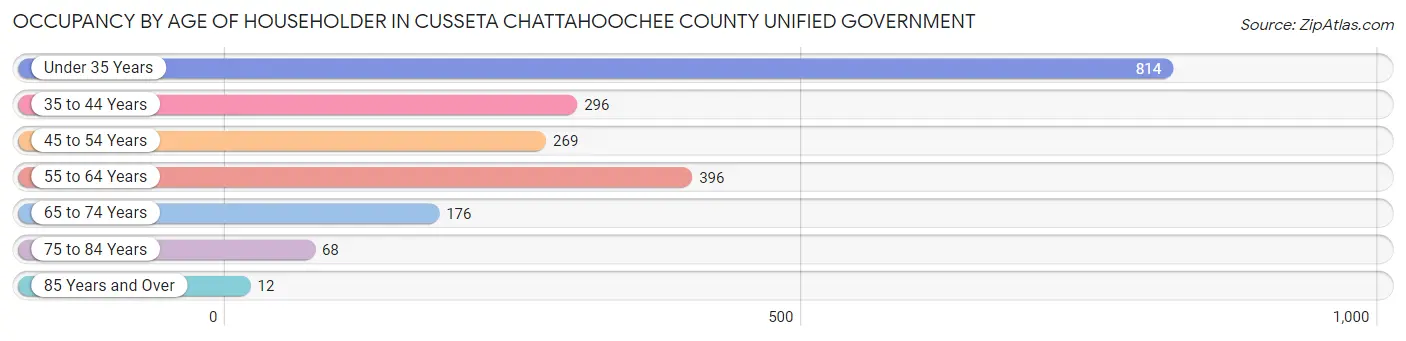
| Age Bracket | # Households | % Households |
| Under 35 Years | 814 | 40.1% |
| 35 to 44 Years | 296 | 14.6% |
| 45 to 54 Years | 269 | 13.2% |
| 55 to 64 Years | 396 | 19.5% |
| 65 to 74 Years | 176 | 8.7% |
| 75 to 84 Years | 68 | 3.4% |
| 85 Years and Over | 12 | 0.6% |
| Total | 2,031 | 100.0% |
Housing Finances in Cusseta Chattahoochee County unified government
Median Income by Occupancy in Cusseta Chattahoochee County unified government
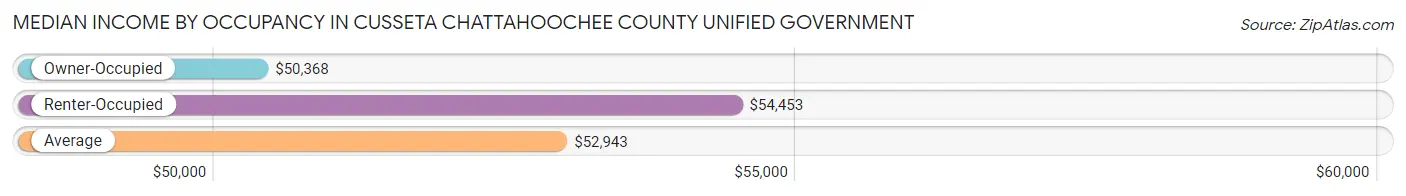
| Occupancy Type | # Households | Median Income |
| Owner-Occupied | 634 (31.2%) | $50,368 |
| Renter-Occupied | 1,397 (68.8%) | $54,453 |
| Average | 2,031 (100.0%) | $52,943 |
Occupancy by Householder Income Bracket in Cusseta Chattahoochee County unified government
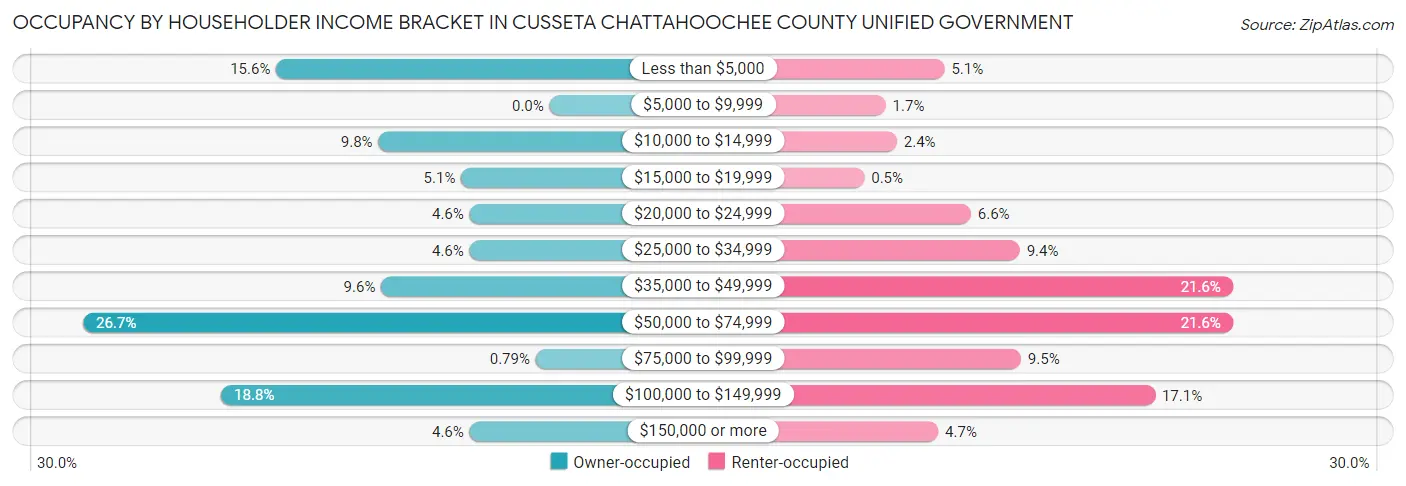
| Income Bracket | Owner-occupied | Renter-occupied |
| Less than $5,000 | 99 (15.6%) | 71 (5.1%) |
| $5,000 to $9,999 | 0 (0.0%) | 24 (1.7%) |
| $10,000 to $14,999 | 62 (9.8%) | 33 (2.4%) |
| $15,000 to $19,999 | 32 (5.1%) | 7 (0.5%) |
| $20,000 to $24,999 | 29 (4.6%) | 92 (6.6%) |
| $25,000 to $34,999 | 29 (4.6%) | 131 (9.4%) |
| $35,000 to $49,999 | 61 (9.6%) | 301 (21.5%) |
| $50,000 to $74,999 | 169 (26.7%) | 301 (21.5%) |
| $75,000 to $99,999 | 5 (0.8%) | 132 (9.5%) |
| $100,000 to $149,999 | 119 (18.8%) | 239 (17.1%) |
| $150,000 or more | 29 (4.6%) | 66 (4.7%) |
| Total | 634 (100.0%) | 1,397 (100.0%) |
Monthly Housing Cost Tiers in Cusseta Chattahoochee County unified government
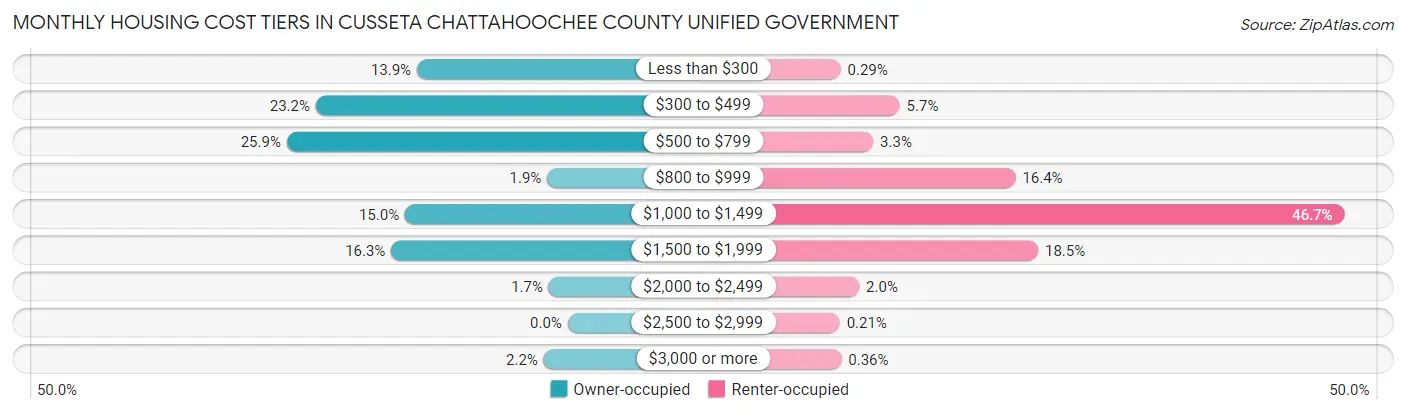
| Monthly Cost | Owner-occupied | Renter-occupied |
| Less than $300 | 88 (13.9%) | 4 (0.3%) |
| $300 to $499 | 147 (23.2%) | 80 (5.7%) |
| $500 to $799 | 164 (25.9%) | 46 (3.3%) |
| $800 to $999 | 12 (1.9%) | 229 (16.4%) |
| $1,000 to $1,499 | 95 (15.0%) | 652 (46.7%) |
| $1,500 to $1,999 | 103 (16.3%) | 258 (18.5%) |
| $2,000 to $2,499 | 11 (1.7%) | 28 (2.0%) |
| $2,500 to $2,999 | 0 (0.0%) | 3 (0.2%) |
| $3,000 or more | 14 (2.2%) | 5 (0.4%) |
| Total | 634 (100.0%) | 1,397 (100.0%) |
Physical Housing Characteristics in Cusseta Chattahoochee County unified government
Housing Structures in Cusseta Chattahoochee County unified government
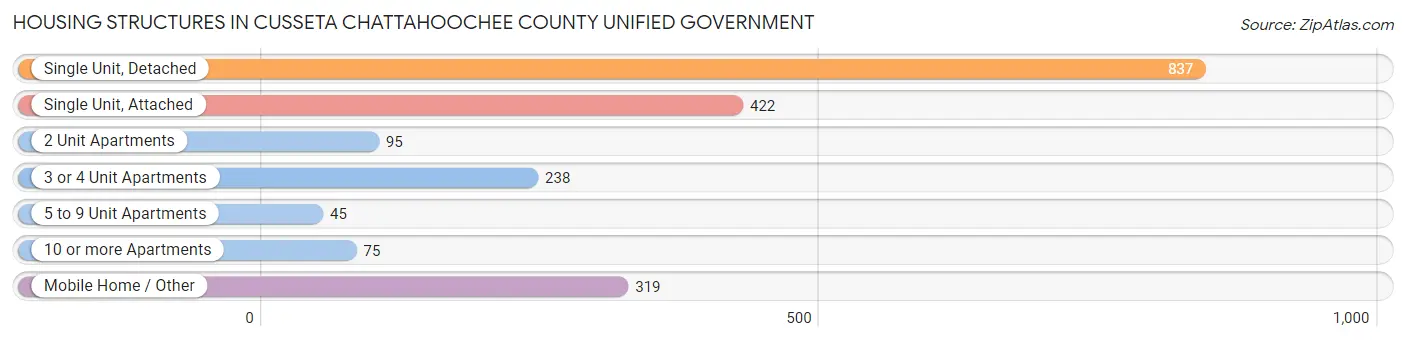
| Structure Type | # Housing Units | % Housing Units |
| Single Unit, Detached | 837 | 41.2% |
| Single Unit, Attached | 422 | 20.8% |
| 2 Unit Apartments | 95 | 4.7% |
| 3 or 4 Unit Apartments | 238 | 11.7% |
| 5 to 9 Unit Apartments | 45 | 2.2% |
| 10 or more Apartments | 75 | 3.7% |
| Mobile Home / Other | 319 | 15.7% |
| Total | 2,031 | 100.0% |
Housing Structures by Occupancy in Cusseta Chattahoochee County unified government
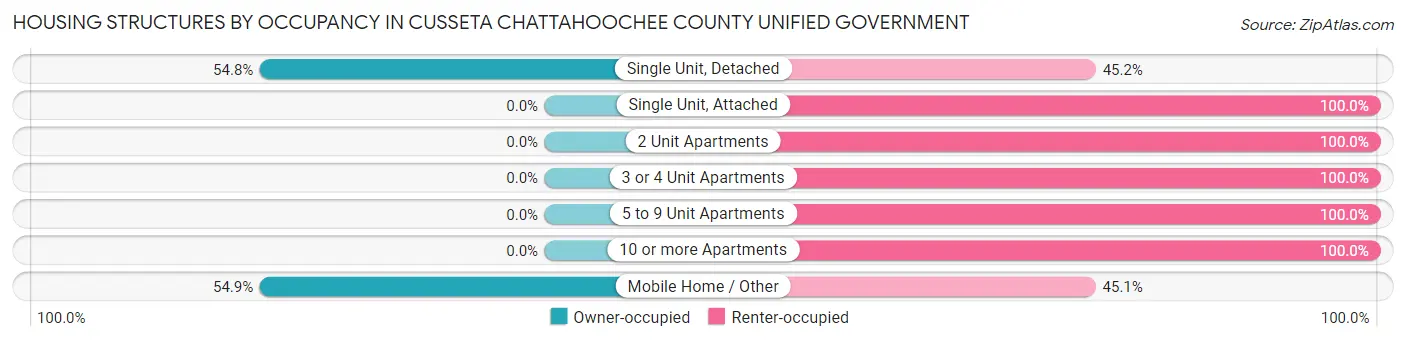
| Structure Type | Owner-occupied | Renter-occupied |
| Single Unit, Detached | 459 (54.8%) | 378 (45.2%) |
| Single Unit, Attached | 0 (0.0%) | 422 (100.0%) |
| 2 Unit Apartments | 0 (0.0%) | 95 (100.0%) |
| 3 or 4 Unit Apartments | 0 (0.0%) | 238 (100.0%) |
| 5 to 9 Unit Apartments | 0 (0.0%) | 45 (100.0%) |
| 10 or more Apartments | 0 (0.0%) | 75 (100.0%) |
| Mobile Home / Other | 175 (54.9%) | 144 (45.1%) |
| Total | 634 (31.2%) | 1,397 (68.8%) |
Housing Structures by Number of Rooms in Cusseta Chattahoochee County unified government
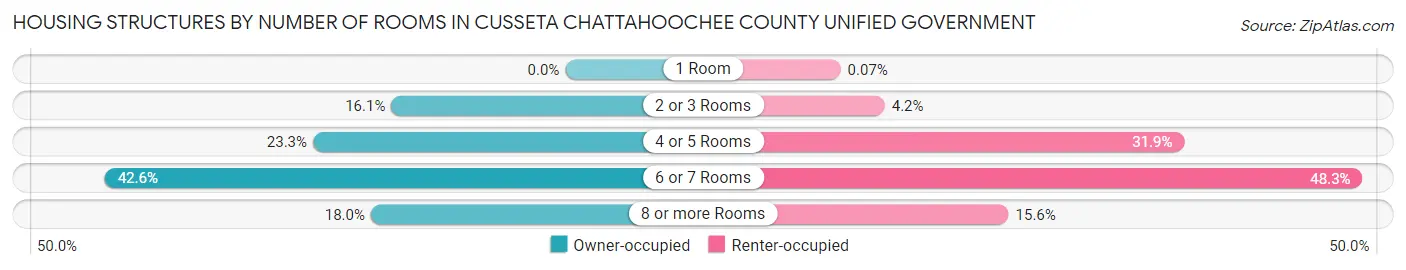
| Number of Rooms | Owner-occupied | Renter-occupied |
| 1 Room | 0 (0.0%) | 1 (0.1%) |
| 2 or 3 Rooms | 102 (16.1%) | 58 (4.2%) |
| 4 or 5 Rooms | 148 (23.3%) | 445 (31.9%) |
| 6 or 7 Rooms | 270 (42.6%) | 675 (48.3%) |
| 8 or more Rooms | 114 (18.0%) | 218 (15.6%) |
| Total | 634 (100.0%) | 1,397 (100.0%) |
Housing Structure by Heating Type in Cusseta Chattahoochee County unified government
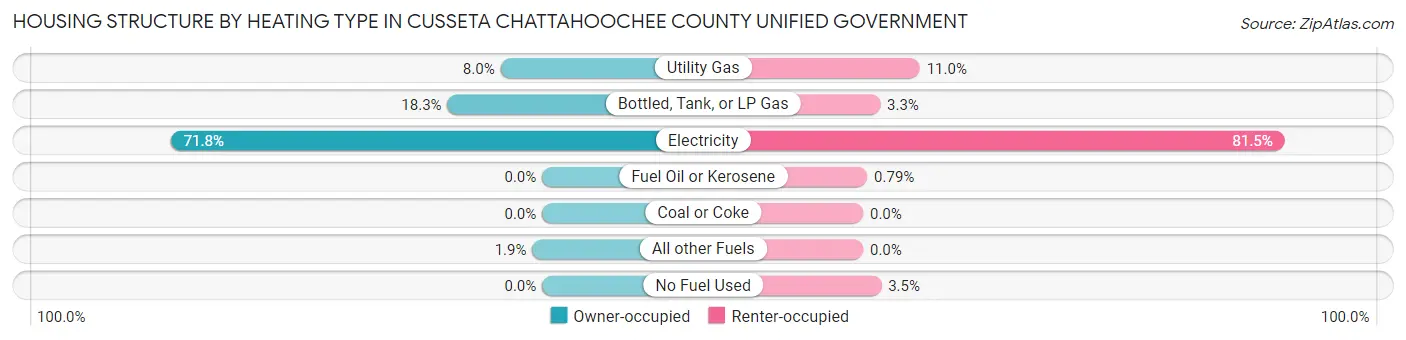
| Heating Type | Owner-occupied | Renter-occupied |
| Utility Gas | 51 (8.0%) | 153 (11.0%) |
| Bottled, Tank, or LP Gas | 116 (18.3%) | 46 (3.3%) |
| Electricity | 455 (71.8%) | 1,138 (81.5%) |
| Fuel Oil or Kerosene | 0 (0.0%) | 11 (0.8%) |
| Coal or Coke | 0 (0.0%) | 0 (0.0%) |
| All other Fuels | 12 (1.9%) | 0 (0.0%) |
| No Fuel Used | 0 (0.0%) | 49 (3.5%) |
| Total | 634 (100.0%) | 1,397 (100.0%) |
Household Vehicle Usage in Cusseta Chattahoochee County unified government
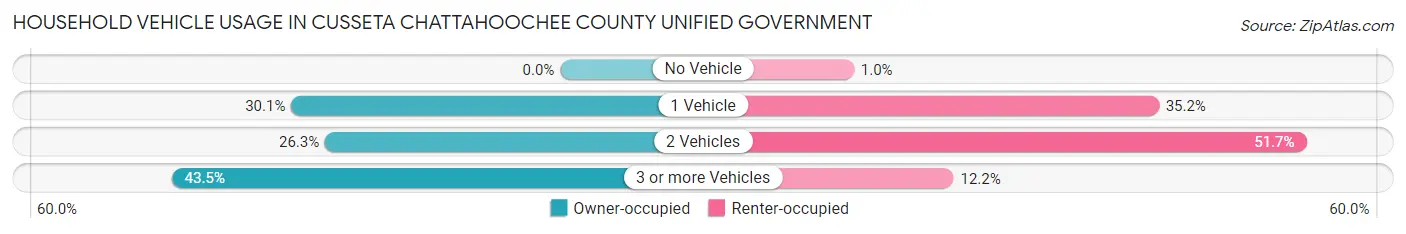
| Vehicles per Household | Owner-occupied | Renter-occupied |
| No Vehicle | 0 (0.0%) | 14 (1.0%) |
| 1 Vehicle | 191 (30.1%) | 491 (35.1%) |
| 2 Vehicles | 167 (26.3%) | 722 (51.7%) |
| 3 or more Vehicles | 276 (43.5%) | 170 (12.2%) |
| Total | 634 (100.0%) | 1,397 (100.0%) |
Real Estate & Mortgages in Cusseta Chattahoochee County unified government
Real Estate and Mortgage Overview in Cusseta Chattahoochee County unified government
| Characteristic | Without Mortgage | With Mortgage |
| Housing Units | 402 | 232 |
| Median Property Value | $72,200 | $302,000 |
| Median Household Income | $45,769 | $19 |
| Monthly Housing Costs | $452 | $14 |
| Real Estate Taxes | $590 | $0 |
Property Value by Mortgage Status in Cusseta Chattahoochee County unified government
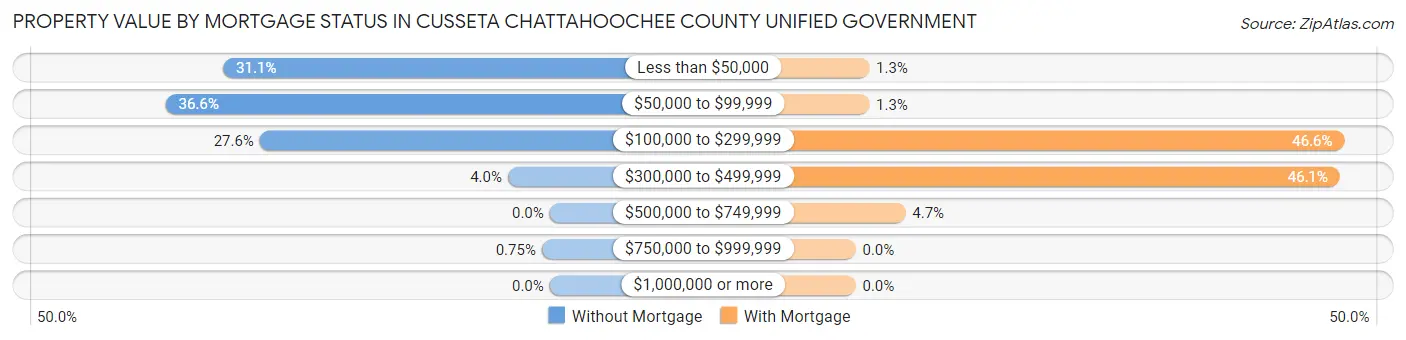
| Property Value | Without Mortgage | With Mortgage |
| Less than $50,000 | 125 (31.1%) | 3 (1.3%) |
| $50,000 to $99,999 | 147 (36.6%) | 3 (1.3%) |
| $100,000 to $299,999 | 111 (27.6%) | 108 (46.6%) |
| $300,000 to $499,999 | 16 (4.0%) | 107 (46.1%) |
| $500,000 to $749,999 | 0 (0.0%) | 11 (4.7%) |
| $750,000 to $999,999 | 3 (0.7%) | 0 (0.0%) |
| $1,000,000 or more | 0 (0.0%) | 0 (0.0%) |
| Total | 402 (100.0%) | 232 (100.0%) |
Household Income by Mortgage Status in Cusseta Chattahoochee County unified government
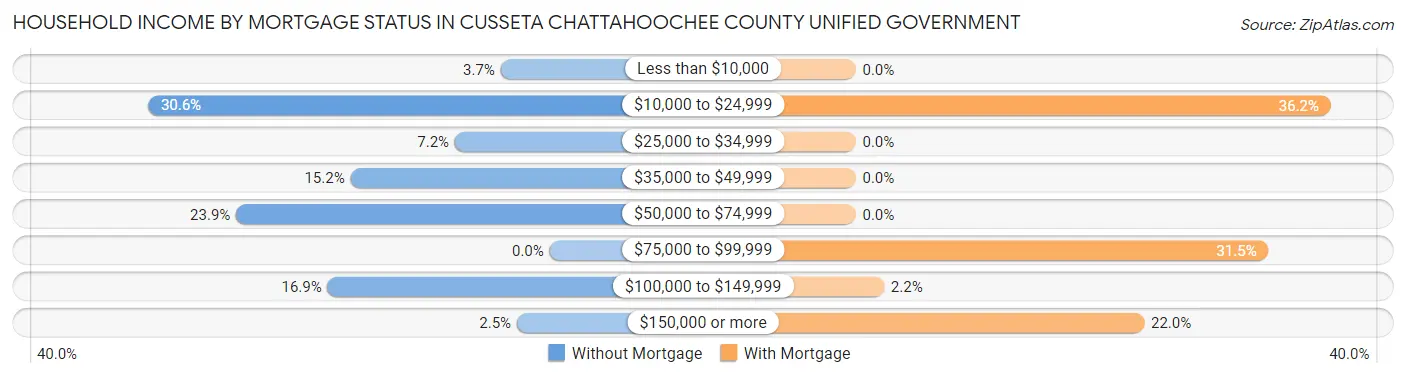
| Household Income | Without Mortgage | With Mortgage |
| Less than $10,000 | 15 (3.7%) | 0 (0.0%) |
| $10,000 to $24,999 | 123 (30.6%) | 84 (36.2%) |
| $25,000 to $34,999 | 29 (7.2%) | 0 (0.0%) |
| $35,000 to $49,999 | 61 (15.2%) | 0 (0.0%) |
| $50,000 to $74,999 | 96 (23.9%) | 0 (0.0%) |
| $75,000 to $99,999 | 0 (0.0%) | 73 (31.5%) |
| $100,000 to $149,999 | 68 (16.9%) | 5 (2.2%) |
| $150,000 or more | 10 (2.5%) | 51 (22.0%) |
| Total | 402 (100.0%) | 232 (100.0%) |
Property Value to Household Income Ratio in Cusseta Chattahoochee County unified government
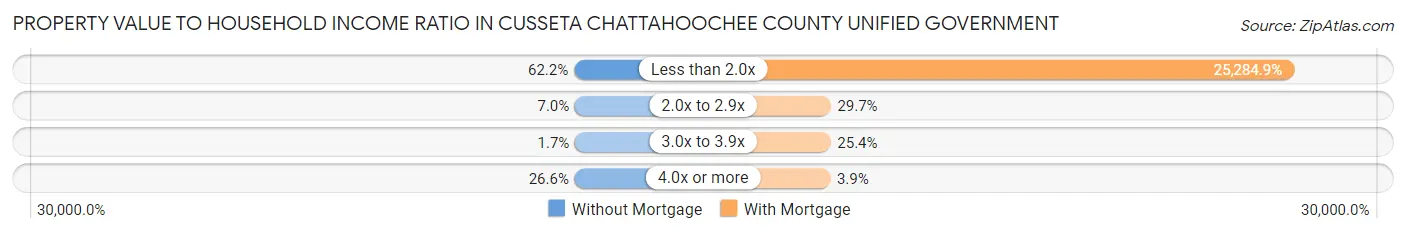
| Value-to-Income Ratio | Without Mortgage | With Mortgage |
| Less than 2.0x | 250 (62.2%) | 58,661 (25,284.9%) |
| 2.0x to 2.9x | 28 (7.0%) | 69 (29.7%) |
| 3.0x to 3.9x | 7 (1.7%) | 59 (25.4%) |
| 4.0x or more | 107 (26.6%) | 9 (3.9%) |
| Total | 402 (100.0%) | 232 (100.0%) |
Real Estate Taxes by Mortgage Status in Cusseta Chattahoochee County unified government
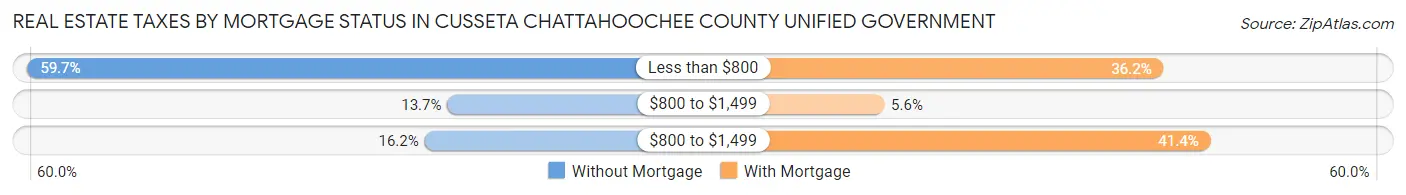
| Property Taxes | Without Mortgage | With Mortgage |
| Less than $800 | 240 (59.7%) | 84 (36.2%) |
| $800 to $1,499 | 55 (13.7%) | 13 (5.6%) |
| $800 to $1,499 | 65 (16.2%) | 96 (41.4%) |
| Total | 402 (100.0%) | 232 (100.0%) |
Health & Disability in Cusseta Chattahoochee County unified government
Health Insurance Coverage by Age in Cusseta Chattahoochee County unified government
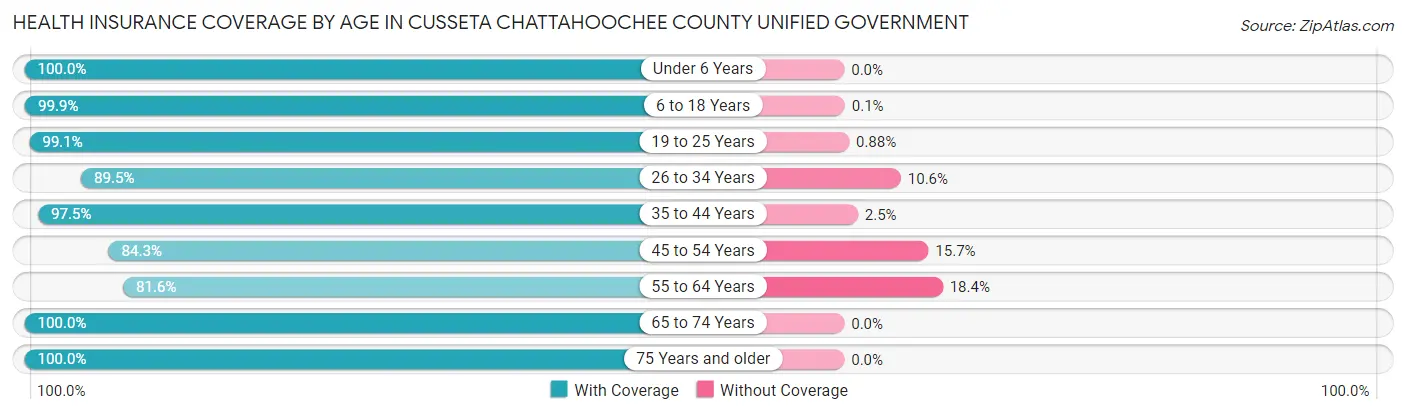
| Age Bracket | With Coverage | Without Coverage |
| Under 6 Years | 1,022 (100.0%) | 0 (0.0%) |
| 6 to 18 Years | 1,048 (99.9%) | 1 (0.1%) |
| 19 to 25 Years | 448 (99.1%) | 4 (0.9%) |
| 26 to 34 Years | 568 (89.4%) | 67 (10.5%) |
| 35 to 44 Years | 424 (97.5%) | 11 (2.5%) |
| 45 to 54 Years | 312 (84.3%) | 58 (15.7%) |
| 55 to 64 Years | 427 (81.6%) | 96 (18.4%) |
| 65 to 74 Years | 182 (100.0%) | 0 (0.0%) |
| 75 Years and older | 90 (100.0%) | 0 (0.0%) |
| Total | 4,521 (95.0%) | 237 (5.0%) |
Health Insurance Coverage by Citizenship Status in Cusseta Chattahoochee County unified government
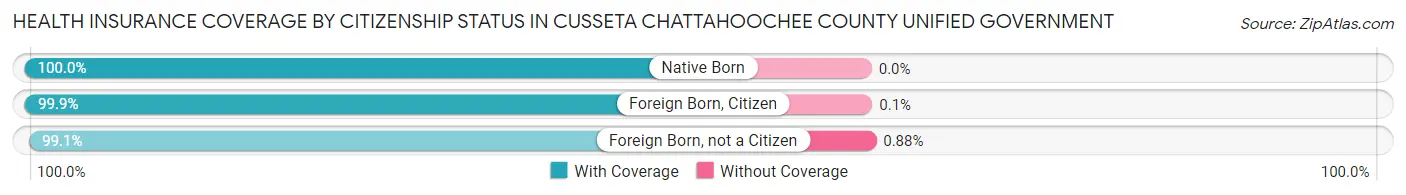
| Citizenship Status | With Coverage | Without Coverage |
| Native Born | 1,022 (100.0%) | 0 (0.0%) |
| Foreign Born, Citizen | 1,048 (99.9%) | 1 (0.1%) |
| Foreign Born, not a Citizen | 448 (99.1%) | 4 (0.9%) |
Health Insurance Coverage by Household Income in Cusseta Chattahoochee County unified government
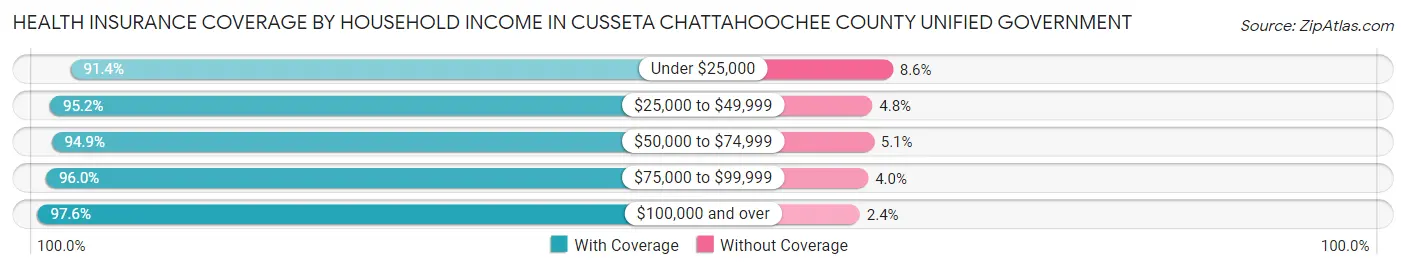
| Household Income | With Coverage | Without Coverage |
| Under $25,000 | 838 (91.4%) | 79 (8.6%) |
| $25,000 to $49,999 | 1,335 (95.2%) | 67 (4.8%) |
| $50,000 to $74,999 | 957 (94.9%) | 51 (5.1%) |
| $75,000 to $99,999 | 311 (96.0%) | 13 (4.0%) |
| $100,000 and over | 1,080 (97.6%) | 27 (2.4%) |
Public vs Private Health Insurance Coverage by Age in Cusseta Chattahoochee County unified government
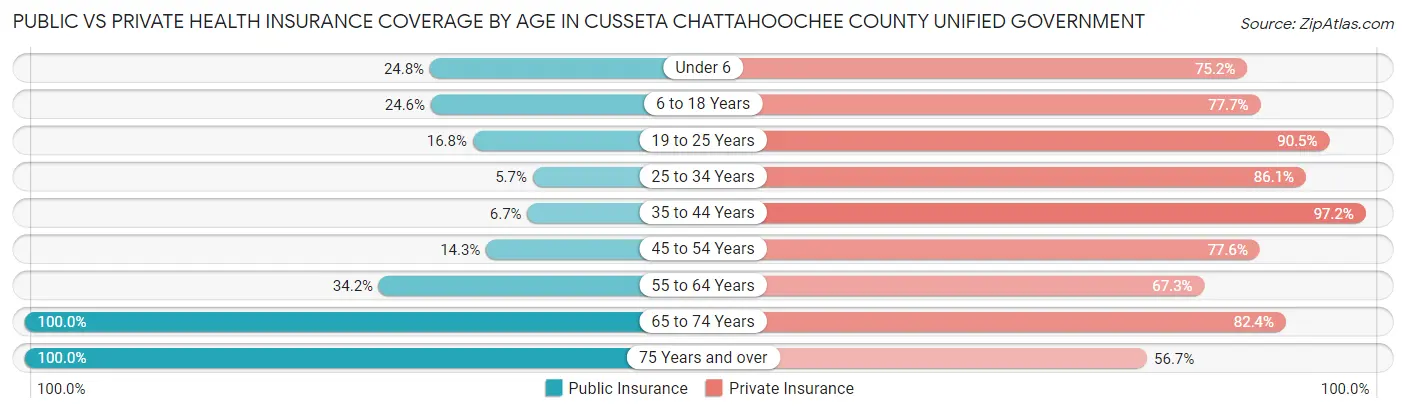
| Age Bracket | Public Insurance | Private Insurance |
| Under 6 | 253 (24.8%) | 769 (75.2%) |
| 6 to 18 Years | 258 (24.6%) | 815 (77.7%) |
| 19 to 25 Years | 76 (16.8%) | 409 (90.5%) |
| 25 to 34 Years | 36 (5.7%) | 547 (86.1%) |
| 35 to 44 Years | 29 (6.7%) | 423 (97.2%) |
| 45 to 54 Years | 53 (14.3%) | 287 (77.6%) |
| 55 to 64 Years | 179 (34.2%) | 352 (67.3%) |
| 65 to 74 Years | 182 (100.0%) | 150 (82.4%) |
| 75 Years and over | 90 (100.0%) | 51 (56.7%) |
| Total | 1,156 (24.3%) | 3,803 (79.9%) |
Disability Status by Sex by Age in Cusseta Chattahoochee County unified government
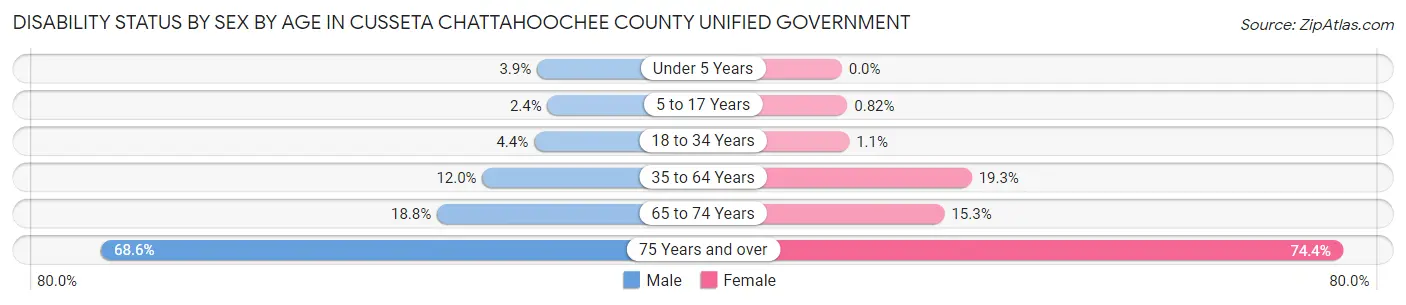
| Age Bracket | Male | Female |
| Under 5 Years | 17 (3.9%) | 0 (0.0%) |
| 5 to 17 Years | 16 (2.4%) | 5 (0.8%) |
| 18 to 34 Years | 8 (4.3%) | 10 (1.1%) |
| 35 to 64 Years | 58 (12.0%) | 163 (19.3%) |
| 65 to 74 Years | 12 (18.8%) | 18 (15.2%) |
| 75 Years and over | 35 (68.6%) | 29 (74.4%) |
Disability Class by Sex by Age in Cusseta Chattahoochee County unified government
Disability Class: Hearing Difficulty
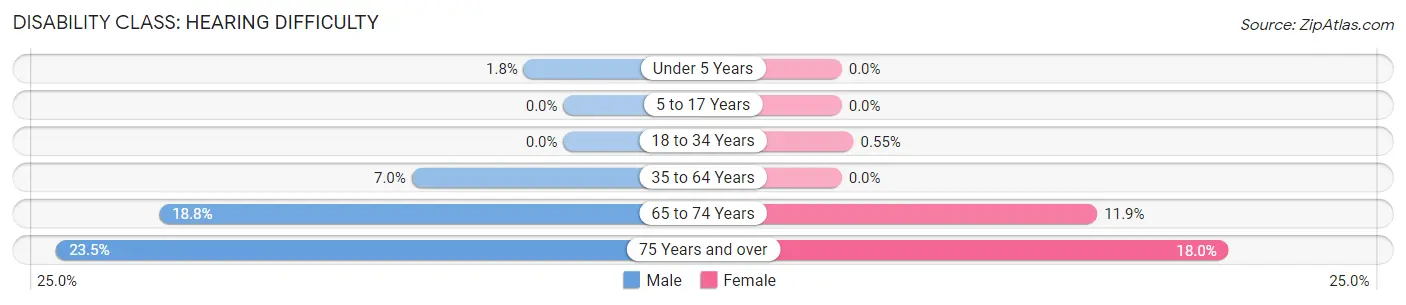
| Age Bracket | Male | Female |
| Under 5 Years | 8 (1.8%) | 0 (0.0%) |
| 5 to 17 Years | 0 (0.0%) | 0 (0.0%) |
| 18 to 34 Years | 0 (0.0%) | 5 (0.5%) |
| 35 to 64 Years | 34 (7.0%) | 0 (0.0%) |
| 65 to 74 Years | 12 (18.8%) | 14 (11.9%) |
| 75 Years and over | 12 (23.5%) | 7 (17.9%) |
Disability Class: Vision Difficulty
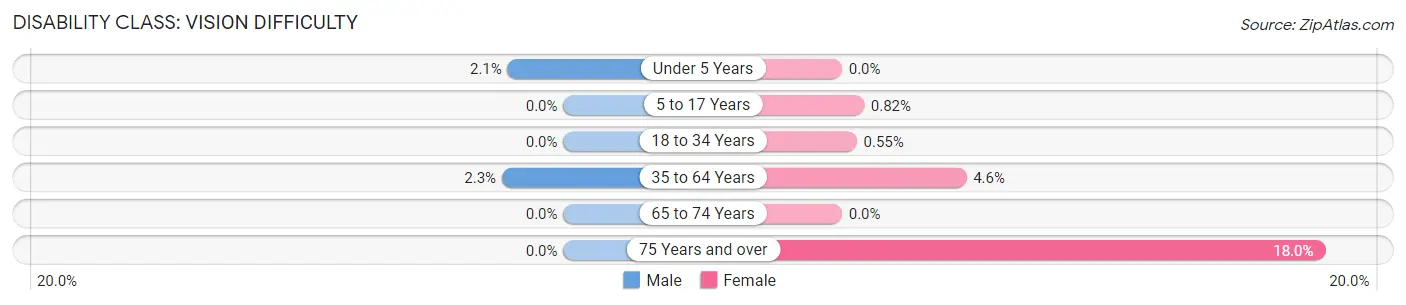
| Age Bracket | Male | Female |
| Under 5 Years | 9 (2.1%) | 0 (0.0%) |
| 5 to 17 Years | 0 (0.0%) | 5 (0.8%) |
| 18 to 34 Years | 0 (0.0%) | 5 (0.5%) |
| 35 to 64 Years | 11 (2.3%) | 39 (4.6%) |
| 65 to 74 Years | 0 (0.0%) | 0 (0.0%) |
| 75 Years and over | 0 (0.0%) | 7 (17.9%) |
Disability Class: Cognitive Difficulty
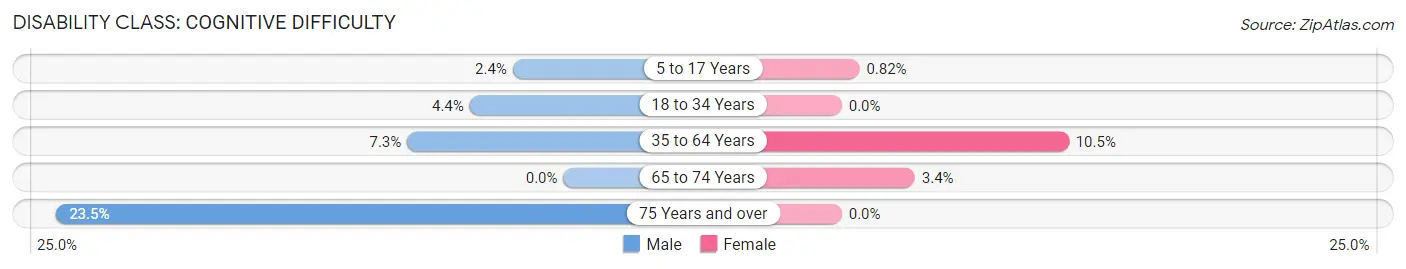
| Age Bracket | Male | Female |
| 5 to 17 Years | 16 (2.4%) | 5 (0.8%) |
| 18 to 34 Years | 8 (4.3%) | 0 (0.0%) |
| 35 to 64 Years | 35 (7.2%) | 89 (10.5%) |
| 65 to 74 Years | 0 (0.0%) | 4 (3.4%) |
| 75 Years and over | 12 (23.5%) | 0 (0.0%) |
Disability Class: Ambulatory Difficulty
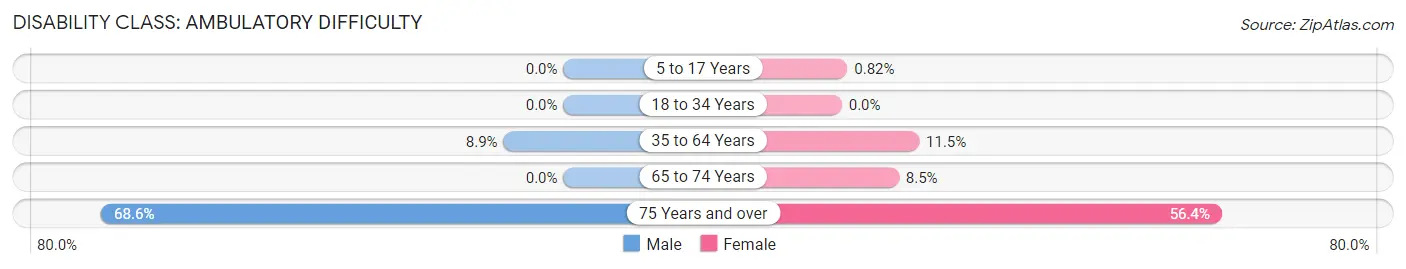
| Age Bracket | Male | Female |
| 5 to 17 Years | 0 (0.0%) | 5 (0.8%) |
| 18 to 34 Years | 0 (0.0%) | 0 (0.0%) |
| 35 to 64 Years | 43 (8.9%) | 97 (11.5%) |
| 65 to 74 Years | 0 (0.0%) | 10 (8.5%) |
| 75 Years and over | 35 (68.6%) | 22 (56.4%) |
Disability Class: Self-Care Difficulty
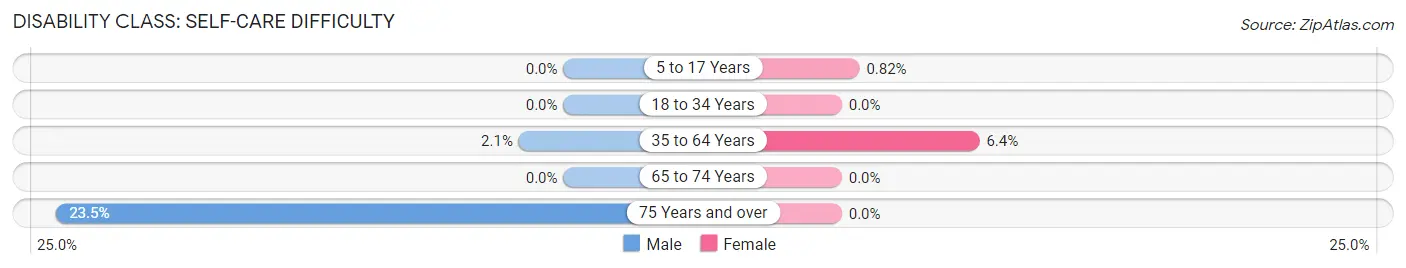
| Age Bracket | Male | Female |
| 5 to 17 Years | 0 (0.0%) | 5 (0.8%) |
| 18 to 34 Years | 0 (0.0%) | 0 (0.0%) |
| 35 to 64 Years | 10 (2.1%) | 54 (6.4%) |
| 65 to 74 Years | 0 (0.0%) | 0 (0.0%) |
| 75 Years and over | 12 (23.5%) | 0 (0.0%) |
Technology Access in Cusseta Chattahoochee County unified government
Computing Device Access in Cusseta Chattahoochee County unified government
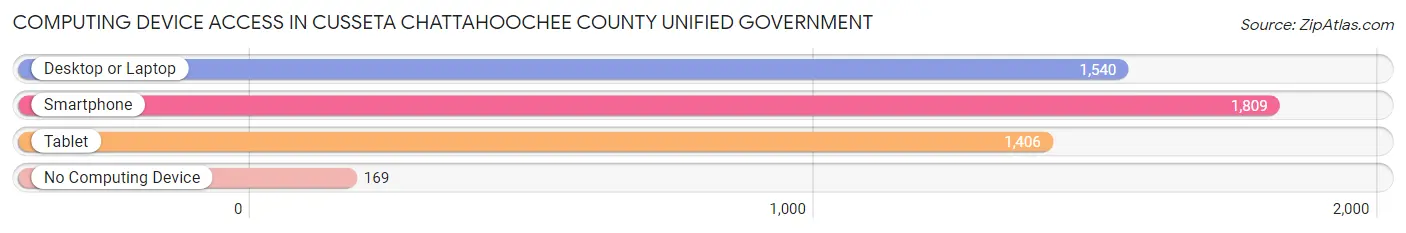
| Device Type | # Households | % Households |
| Desktop or Laptop | 1,540 | 75.8% |
| Smartphone | 1,809 | 89.1% |
| Tablet | 1,406 | 69.2% |
| No Computing Device | 169 | 8.3% |
| Total | 2,031 | 100.0% |
Internet Access in Cusseta Chattahoochee County unified government
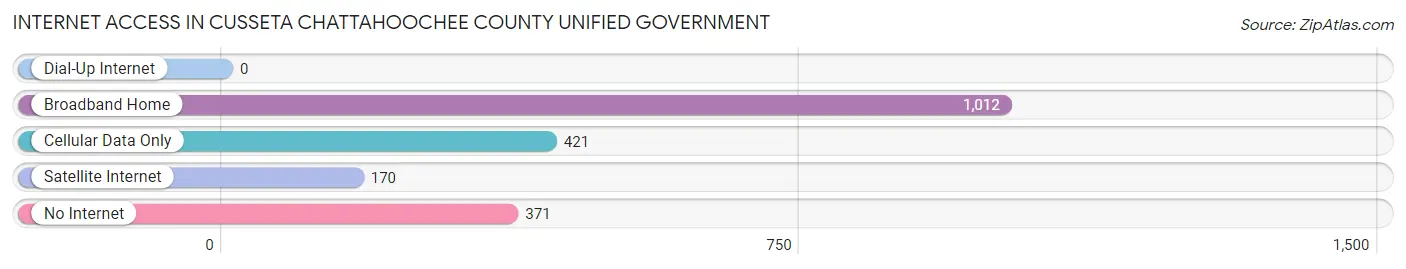
| Internet Type | # Households | % Households |
| Dial-Up Internet | 0 | 0.0% |
| Broadband Home | 1,012 | 49.8% |
| Cellular Data Only | 421 | 20.7% |
| Satellite Internet | 170 | 8.4% |
| No Internet | 371 | 18.3% |
| Total | 2,031 | 100.0% |
Cusseta Chattahoochee County unified government Summary
Cusseta Chattahoochee County Unified Government, Georgia is a county located in the west-central part of the state. It is bordered by the Chattahoochee River to the north, the Flint River to the east, and the Georgia-Alabama state line to the south. The county seat is Cusseta, and the largest city is Columbus. The population of the county was estimated to be 149,945 in 2019.
History
The area that is now Cusseta Chattahoochee County was originally part of Muscogee County, which was created in 1826. In 1854, the county was divided into two parts, with the western portion becoming Chattahoochee County. The county was named after the Chattahoochee River, which runs through the county.
The county was home to several Native American tribes, including the Creek, Cherokee, and Choctaw. The Creek were the first to settle in the area, and they established several villages along the Chattahoochee River. The Cherokee and Choctaw followed shortly after, and the three tribes lived peacefully together until the Indian Removal Act of 1830. This act forced the Native Americans to relocate to Oklahoma, and the area was opened up for white settlement.
The first white settlers arrived in the area in the 1830s, and the county was officially established in 1854. The county seat was originally located in Cusseta, but it was moved to Columbus in 1871.
Geography
Cusseta Chattahoochee County is located in the west-central part of the state of Georgia. It is bordered by the Chattahoochee River to the north, the Flint River to the east, and the Georgia-Alabama state line to the south. The county covers an area of 545 square miles, and it is the second-largest county in the state.
The terrain of the county is mostly flat, with some rolling hills in the northern and eastern parts of the county. The county is home to several rivers and streams, including the Chattahoochee, Flint, and Ocmulgee Rivers. The county also contains several lakes, including Lake Harding, Lake Oliver, and Lake Blackshear.
Economy
The economy of Cusseta Chattahoochee County is largely based on agriculture and manufacturing. The county is home to several large farms, which produce a variety of crops, including cotton, corn, soybeans, and peanuts. The county is also home to several manufacturing plants, which produce a variety of products, including furniture, textiles, and automotive parts.
The county is also home to several military bases, including Fort Benning and Fort Gillem. These bases provide a significant economic boost to the county, as they employ thousands of people and generate millions of dollars in revenue.
Demographics
As of the 2019 census, the population of Cusseta Chattahoochee County was estimated to be 149,945. The population is made up of a diverse mix of races and ethnicities, including White (63.3%), African American (30.2%), Hispanic or Latino (3.7%), and Asian (1.7%).
The median household income in the county is $45,945, and the median home value is $133,400. The unemployment rate in the county is 4.2%, which is lower than the national average.
Conclusion
Cusseta Chattahoochee County is a county located in the west-central part of the state of Georgia. It is bordered by the Chattahoochee River to the north, the Flint River to the east, and the Georgia-Alabama state line to the south. The county was originally part of Muscogee County, and it was established in 1854. The county is home to several Native American tribes, and it is now home to a diverse mix of races and ethnicities. The economy of the county is largely based on agriculture and manufacturing, and it is home to several military bases. The population of the county was estimated to be 149,945 in 2019.
Common Questions
What is the Total Population of Cusseta Chattahoochee County unified government?
Total Population of Cusseta Chattahoochee County unified government is 9,402.
What is the Total Male Population of Cusseta Chattahoochee County unified government?
Total Male Population of Cusseta Chattahoochee County unified government is 6,090.
What is the Total Female Population of Cusseta Chattahoochee County unified government?
Total Female Population of Cusseta Chattahoochee County unified government is 3,312.
What is the Ratio of Males per 100 Females in Cusseta Chattahoochee County unified government?
There are 183.88 Males per 100 Females in Cusseta Chattahoochee County unified government.
What is the Ratio of Females per 100 Males in Cusseta Chattahoochee County unified government?
There are 54.38 Females per 100 Males in Cusseta Chattahoochee County unified government.
What is the Median Population Age in Cusseta Chattahoochee County unified government?
Median Population Age in Cusseta Chattahoochee County unified government is 23.9 Years.
What is the Average Family Size in Cusseta Chattahoochee County unified government
Average Family Size in Cusseta Chattahoochee County unified government is 3.0 People.
What is the Average Household Size in Cusseta Chattahoochee County unified government
Average Household Size in Cusseta Chattahoochee County unified government is 2.7 People.
What is Per Capita Income in Cusseta Chattahoochee County unified government?
Per Capita income in Cusseta Chattahoochee County unified government is $23,574.
What is the Median Family Income in Cusseta Chattahoochee County unified government?
Median Family Income in Cusseta Chattahoochee County unified government is $49,909.
What is the Median Household income in Cusseta Chattahoochee County unified government?
Median Household Income in Cusseta Chattahoochee County unified government is $52,943.
What is Income or Wage Gap in Cusseta Chattahoochee County unified government?
Income or Wage Gap in Cusseta Chattahoochee County unified government is 6.6%.
Women in Cusseta Chattahoochee County unified government earn 93.4 cents for every dollar earned by a man.
What is Inequality or Gini Index in Cusseta Chattahoochee County unified government?
Inequality or Gini Index in Cusseta Chattahoochee County unified government is 0.40.
How Large is the Labor Force in Cusseta Chattahoochee County unified government?
There are 5,973 People in the Labor Forcein in Cusseta Chattahoochee County unified government.
What is the Percentage of People in the Labor Force in Cusseta Chattahoochee County unified government?
80.6% of People are in the Labor Force in Cusseta Chattahoochee County unified government.
What is the Unemployment Rate in Cusseta Chattahoochee County unified government?
Unemployment Rate in Cusseta Chattahoochee County unified government is 8.4%.