Country Club Estates, GA
Country Club Estates Map
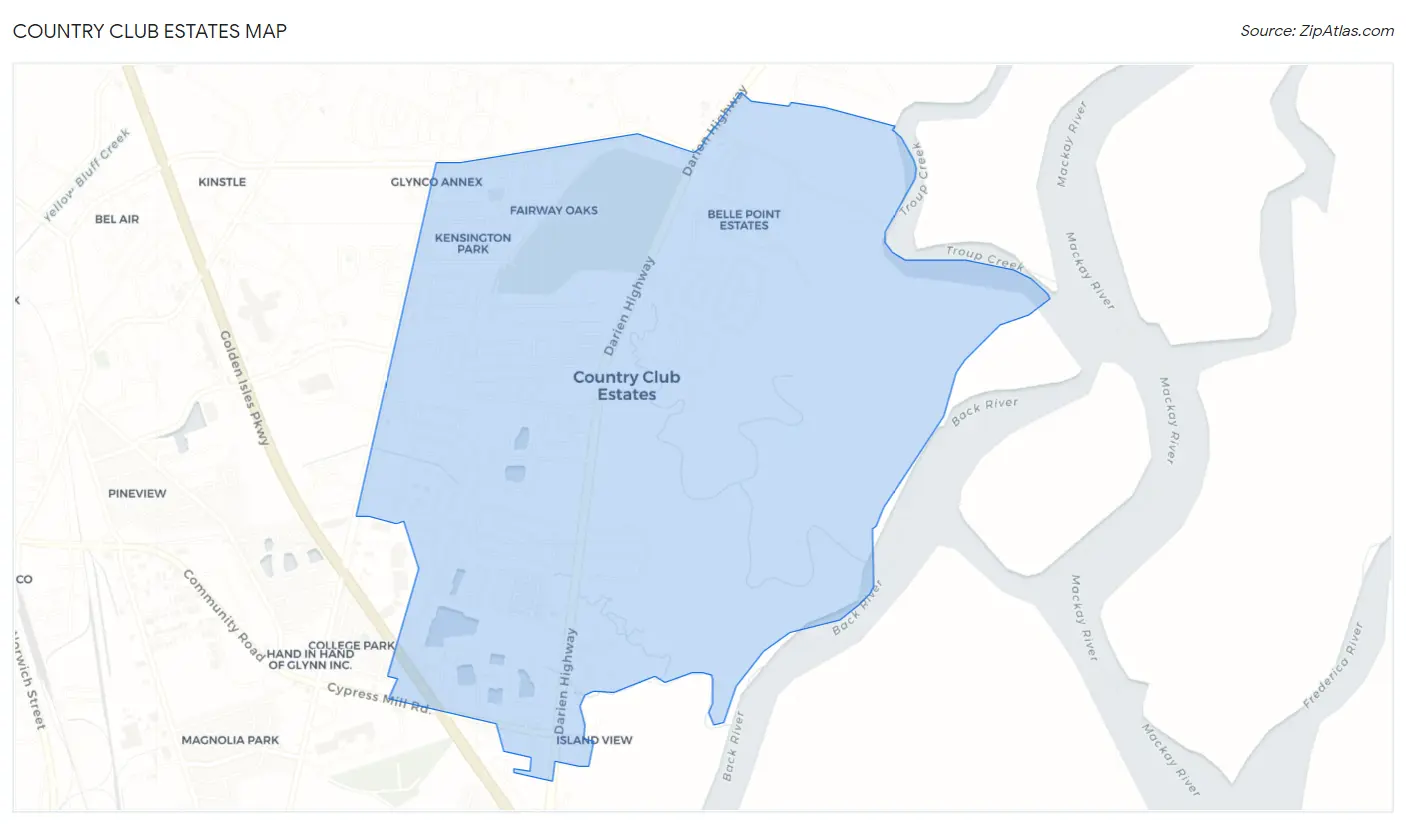
Country Club Estates Overview
9,057
TOTAL POPULATION
3,944
MALE POPULATION
5,113
FEMALE POPULATION
77.14
MALES / 100 FEMALES
129.64
FEMALES / 100 MALES
31.3
MEDIAN AGE
3.2
AVG FAMILY SIZE
2.5
AVG HOUSEHOLD SIZE
$27,018
PER CAPITA INCOME
$63,125
AVG FAMILY INCOME
$57,816
AVG HOUSEHOLD INCOME
45.8%
WAGE / INCOME GAP [ % ]
54.2¢/ $1
WAGE / INCOME GAP [ $ ]
0.42
INEQUALITY / GINI INDEX
5,011
LABOR FORCE [ PEOPLE ]
69.0%
PERCENT IN LABOR FORCE
4.9%
UNEMPLOYMENT RATE
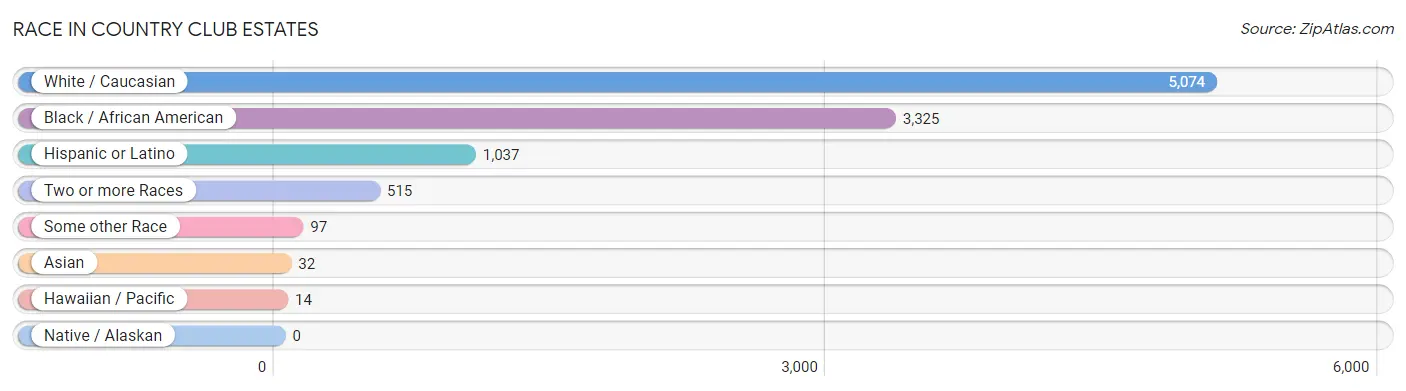
Race in Country Club Estates
The most populous races in Country Club Estates are White / Caucasian (5,074 | 56.0%), Black / African American (3,325 | 36.7%), and Hispanic or Latino (1,037 | 11.5%).
| Race | # Population | % Population |
| Asian | 32 | 0.4% |
| Black / African American | 3,325 | 36.7% |
| Hawaiian / Pacific | 14 | 0.2% |
| Hispanic or Latino | 1,037 | 11.5% |
| Native / Alaskan | 0 | 0.0% |
| White / Caucasian | 5,074 | 56.0% |
| Two or more Races | 515 | 5.7% |
| Some other Race | 97 | 1.1% |
| Total | 9,057 | 100.0% |
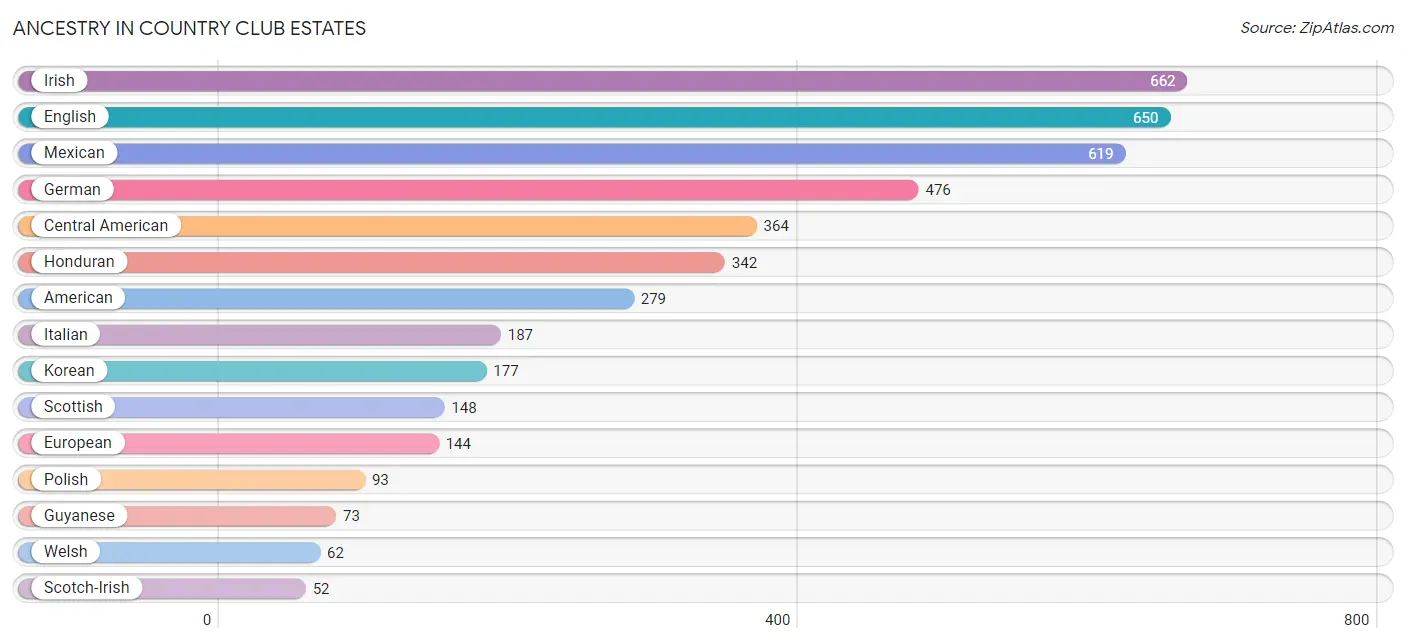
Ancestry in Country Club Estates
The most populous ancestries reported in Country Club Estates are Irish (662 | 7.3%), English (650 | 7.2%), Mexican (619 | 6.8%), German (476 | 5.3%), and Central American (364 | 4.0%), together accounting for 30.6% of all Country Club Estates residents.
| Ancestry | # Population | % Population |
| African | 5 | 0.1% |
| American | 279 | 3.1% |
| British | 33 | 0.4% |
| Canadian | 21 | 0.2% |
| Central American | 364 | 4.0% |
| Cherokee | 47 | 0.5% |
| Choctaw | 1 | 0.0% |
| Colombian | 10 | 0.1% |
| Czechoslovakian | 19 | 0.2% |
| Dutch | 22 | 0.2% |
| English | 650 | 7.2% |
| European | 144 | 1.6% |
| French | 26 | 0.3% |
| German | 476 | 5.3% |
| Greek | 32 | 0.4% |
| Guyanese | 73 | 0.8% |
| Honduran | 342 | 3.8% |
| Hungarian | 15 | 0.2% |
| Irish | 662 | 7.3% |
| Italian | 187 | 2.1% |
| Jamaican | 14 | 0.2% |
| Korean | 177 | 1.9% |
| Mexican | 619 | 6.8% |
| Native Hawaiian | 14 | 0.2% |
| Norwegian | 13 | 0.1% |
| Panamanian | 22 | 0.2% |
| Pennsylvania German | 9 | 0.1% |
| Polish | 93 | 1.0% |
| Portuguese | 7 | 0.1% |
| Puerto Rican | 26 | 0.3% |
| Russian | 20 | 0.2% |
| Scandinavian | 33 | 0.4% |
| Scotch-Irish | 52 | 0.6% |
| Scottish | 148 | 1.6% |
| South American | 10 | 0.1% |
| Subsaharan African | 5 | 0.1% |
| Swedish | 32 | 0.4% |
| Swiss | 9 | 0.1% |
| Thai | 14 | 0.2% |
| Welsh | 62 | 0.7% |
| West Indian | 22 | 0.2% | View All 41 Rows |
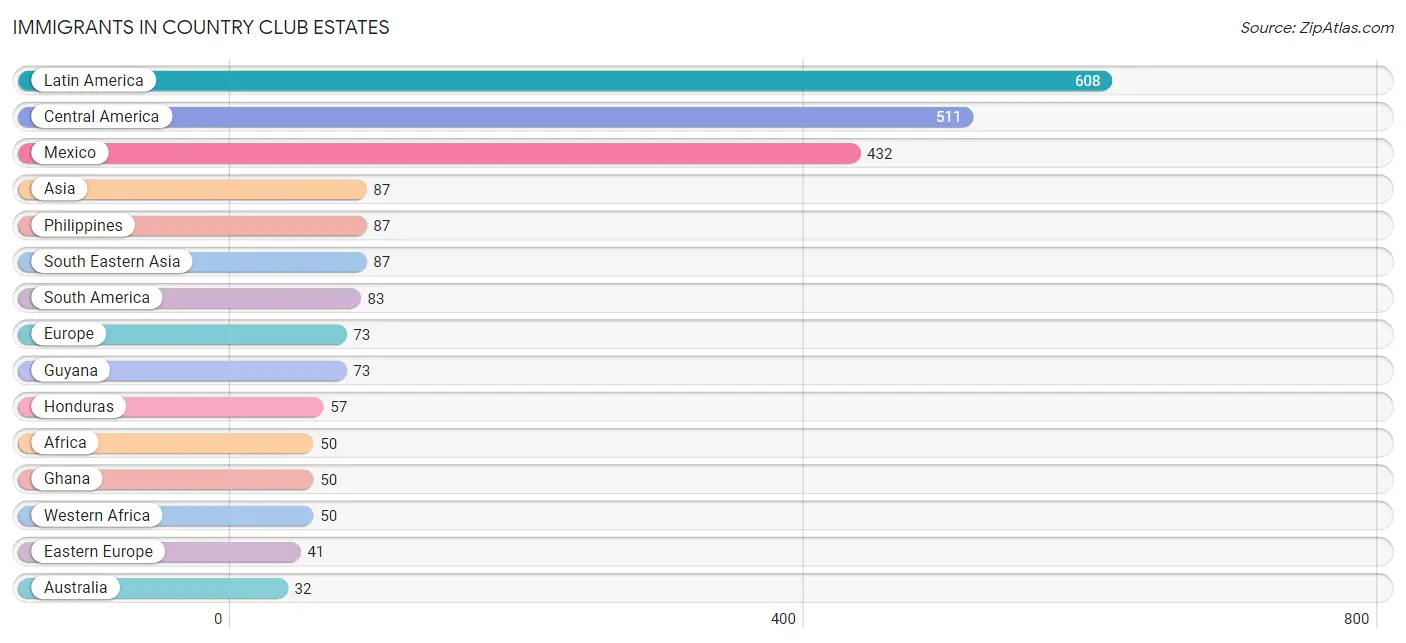
Immigrants in Country Club Estates
The most numerous immigrant groups reported in Country Club Estates came from Latin America (608 | 6.7%), Central America (511 | 5.6%), Mexico (432 | 4.8%), Asia (87 | 1.0%), and Philippines (87 | 1.0%), together accounting for 19.0% of all Country Club Estates residents.
| Immigration Origin | # Population | % Population |
| Africa | 50 | 0.5% |
| Asia | 87 | 1.0% |
| Australia | 32 | 0.4% |
| Canada | 21 | 0.2% |
| Caribbean | 14 | 0.2% |
| Central America | 511 | 5.6% |
| Colombia | 10 | 0.1% |
| Eastern Europe | 41 | 0.4% |
| Europe | 73 | 0.8% |
| Ghana | 50 | 0.5% |
| Guyana | 73 | 0.8% |
| Honduras | 57 | 0.6% |
| Hungary | 15 | 0.2% |
| Jamaica | 14 | 0.2% |
| Latin America | 608 | 6.7% |
| Mexico | 432 | 4.8% |
| Netherlands | 24 | 0.3% |
| Northern Europe | 8 | 0.1% |
| Oceania | 32 | 0.4% |
| Panama | 22 | 0.2% |
| Philippines | 87 | 1.0% |
| Poland | 26 | 0.3% |
| Scotland | 8 | 0.1% |
| South America | 83 | 0.9% |
| South Eastern Asia | 87 | 1.0% |
| Western Africa | 50 | 0.5% |
| Western Europe | 24 | 0.3% | View All 27 Rows |
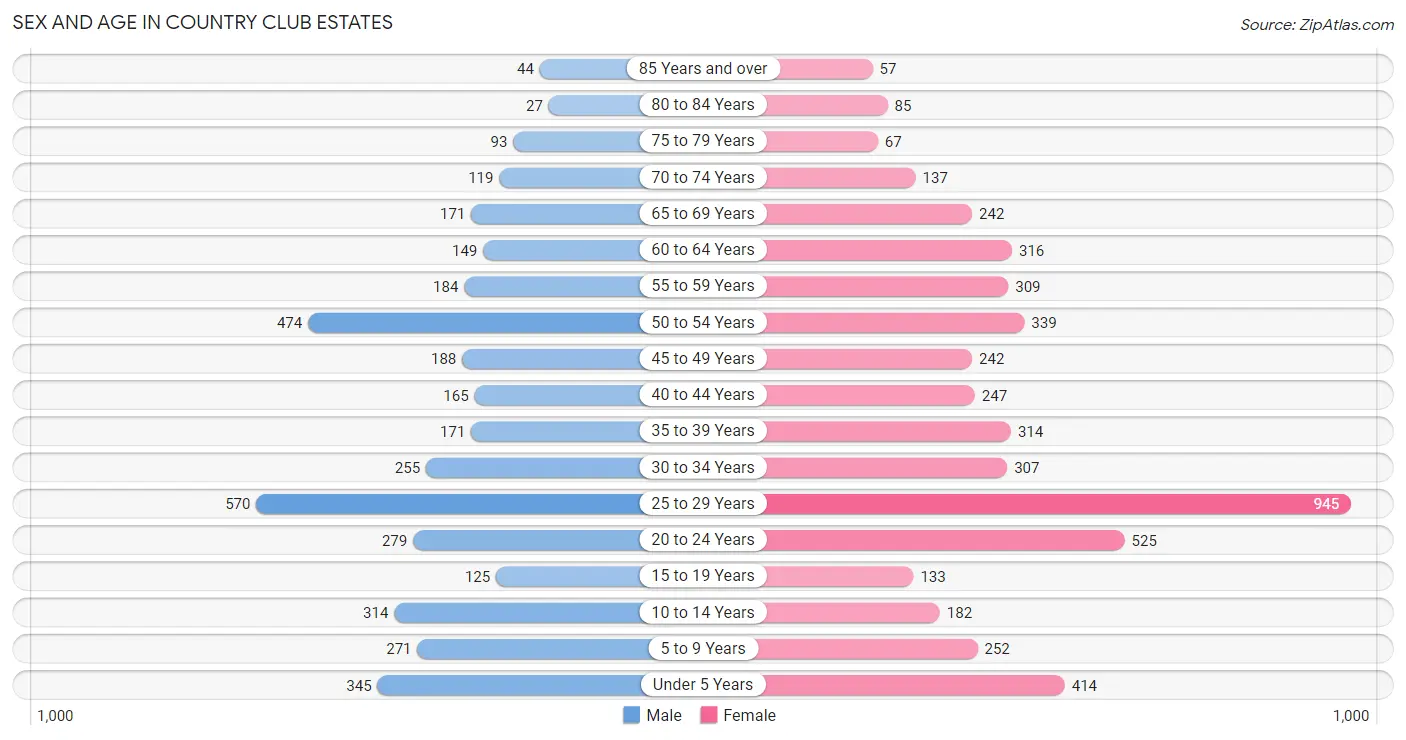
Sex and Age in Country Club Estates
Sex and Age in Country Club Estates
The most populous age groups in Country Club Estates are 25 to 29 Years (570 | 14.4%) for men and 25 to 29 Years (945 | 18.5%) for women.
| Age Bracket | Male | Female |
| Under 5 Years | 345 (8.7%) | 414 (8.1%) |
| 5 to 9 Years | 271 (6.9%) | 252 (4.9%) |
| 10 to 14 Years | 314 (8.0%) | 182 (3.6%) |
| 15 to 19 Years | 125 (3.2%) | 133 (2.6%) |
| 20 to 24 Years | 279 (7.1%) | 525 (10.3%) |
| 25 to 29 Years | 570 (14.4%) | 945 (18.5%) |
| 30 to 34 Years | 255 (6.5%) | 307 (6.0%) |
| 35 to 39 Years | 171 (4.3%) | 314 (6.1%) |
| 40 to 44 Years | 165 (4.2%) | 247 (4.8%) |
| 45 to 49 Years | 188 (4.8%) | 242 (4.7%) |
| 50 to 54 Years | 474 (12.0%) | 339 (6.6%) |
| 55 to 59 Years | 184 (4.7%) | 309 (6.0%) |
| 60 to 64 Years | 149 (3.8%) | 316 (6.2%) |
| 65 to 69 Years | 171 (4.3%) | 242 (4.7%) |
| 70 to 74 Years | 119 (3.0%) | 137 (2.7%) |
| 75 to 79 Years | 93 (2.4%) | 67 (1.3%) |
| 80 to 84 Years | 27 (0.7%) | 85 (1.7%) |
| 85 Years and over | 44 (1.1%) | 57 (1.1%) |
| Total | 3,944 (100.0%) | 5,113 (100.0%) |
Families and Households in Country Club Estates
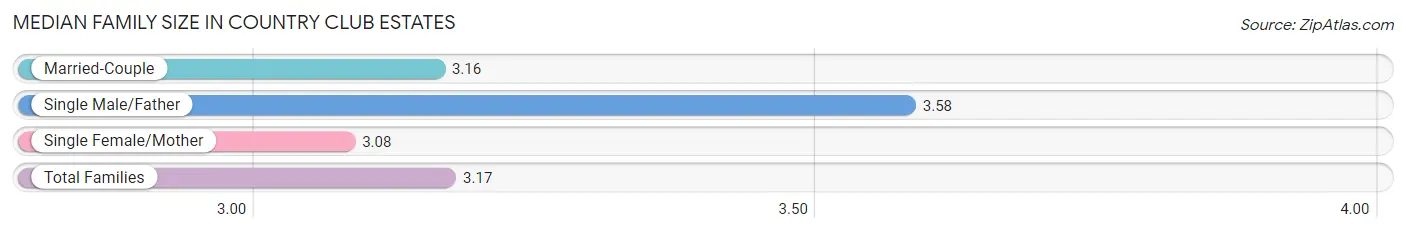
Median Family Size in Country Club Estates
The median family size in Country Club Estates is 3.17 persons per family, with single male/father families (149 | 7.3%) accounting for the largest median family size of 3.58 persons per family. On the other hand, single female/mother families (612 | 29.9%) represent the smallest median family size with 3.08 persons per family.
| Family Type | # Families | Family Size |
| Married-Couple | 1,283 (62.8%) | 3.16 |
| Single Male/Father | 149 (7.3%) | 3.58 |
| Single Female/Mother | 612 (29.9%) | 3.08 |
| Total Families | 2,044 (100.0%) | 3.17 |
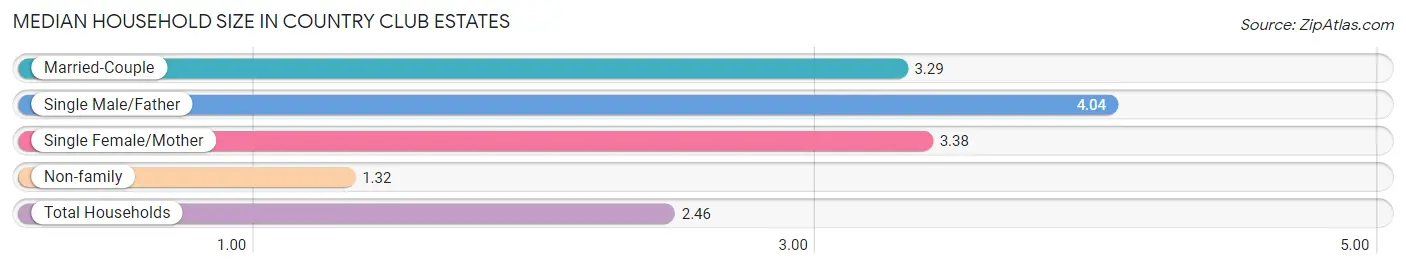
Median Household Size in Country Club Estates
The median household size in Country Club Estates is 2.46 persons per household, with single male/father households (149 | 4.1%) accounting for the largest median household size of 4.04 persons per household. non-family households (1,630 | 44.4%) represent the smallest median household size with 1.32 persons per household.
| Household Type | # Households | Household Size |
| Married-Couple | 1,283 (34.9%) | 3.29 |
| Single Male/Father | 149 (4.1%) | 4.04 |
| Single Female/Mother | 612 (16.7%) | 3.38 |
| Non-family | 1,630 (44.4%) | 1.32 |
| Total Households | 3,674 (100.0%) | 2.46 |
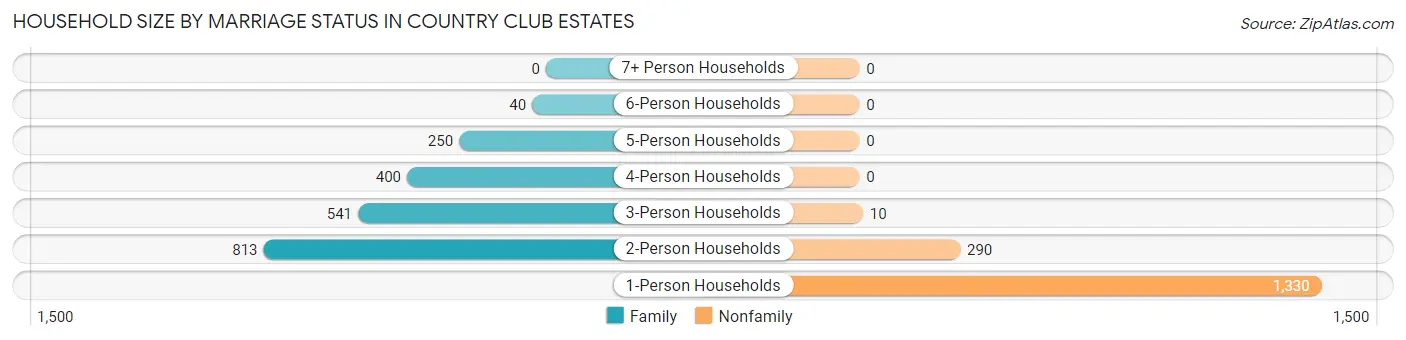
Household Size by Marriage Status in Country Club Estates
Out of a total of 3,674 households in Country Club Estates, 2,044 (55.6%) are family households, while 1,630 (44.4%) are nonfamily households. The most numerous type of family households are 2-person households, comprising 813, and the most common type of nonfamily households are 1-person households, comprising 1,330.
| Household Size | Family Households | Nonfamily Households |
| 1-Person Households | - | 1,330 (36.2%) |
| 2-Person Households | 813 (22.1%) | 290 (7.9%) |
| 3-Person Households | 541 (14.7%) | 10 (0.3%) |
| 4-Person Households | 400 (10.9%) | 0 (0.0%) |
| 5-Person Households | 250 (6.8%) | 0 (0.0%) |
| 6-Person Households | 40 (1.1%) | 0 (0.0%) |
| 7+ Person Households | 0 (0.0%) | 0 (0.0%) |
| Total | 2,044 (55.6%) | 1,630 (44.4%) |
Female Fertility in Country Club Estates
Fertility by Age in Country Club Estates
Average fertility rate in Country Club Estates is 27.0 births per 1,000 women. Women in the age bracket of 35 to 50 years have the highest fertility rate with 75.0 births per 1,000 women. Women in the age bracket of 35 to 50 years acount for 89.2% of all women with births.
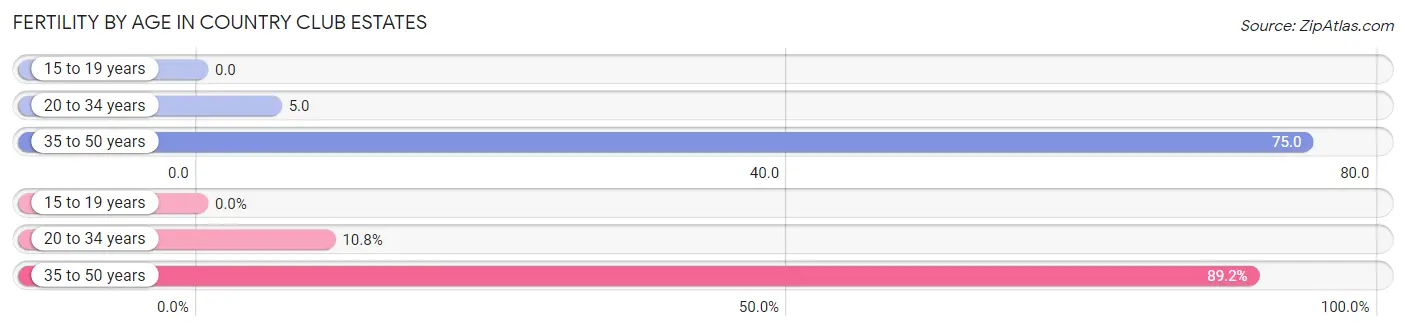
| Age Bracket | Women with Births | Births / 1,000 Women |
| 15 to 19 years | 0 (0.0%) | 0.0 |
| 20 to 34 years | 8 (10.8%) | 5.0 |
| 35 to 50 years | 66 (89.2%) | 75.0 |
| Total | 74 (100.0%) | 27.0 |
Fertility by Age by Marriage Status in Country Club Estates
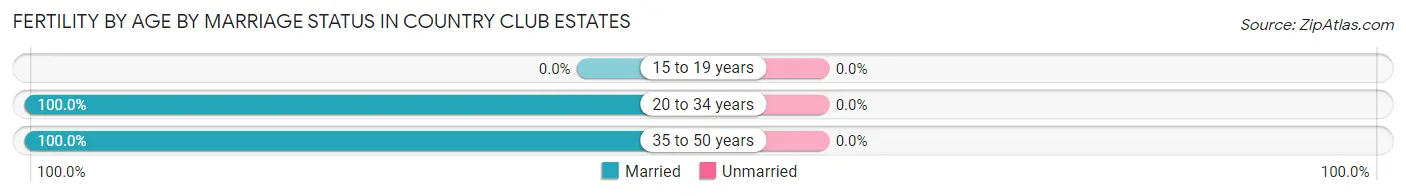
| Age Bracket | Married | Unmarried |
| 15 to 19 years | 0 (0.0%) | 0 (0.0%) |
| 20 to 34 years | 8 (100.0%) | 0 (0.0%) |
| 35 to 50 years | 66 (100.0%) | 0 (0.0%) |
| Total | 74 (100.0%) | 0 (0.0%) |
Fertility by Education in Country Club Estates
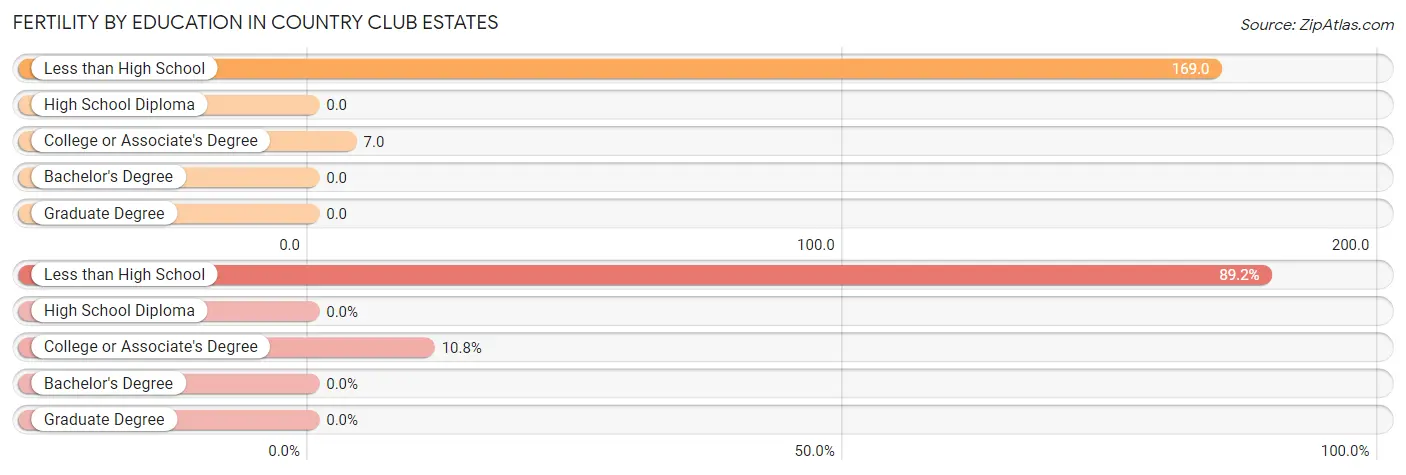
| Educational Attainment | Women with Births | Births / 1,000 Women |
| Less than High School | 66 (89.2%) | 169.0 |
| High School Diploma | 0 (0.0%) | 0.0 |
| College or Associate's Degree | 8 (10.8%) | 7.0 |
| Bachelor's Degree | 0 (0.0%) | 0.0 |
| Graduate Degree | 0 (0.0%) | 0.0 |
| Total | 74 (100.0%) | 27.0 |
Fertility by Education by Marriage Status in Country Club Estates
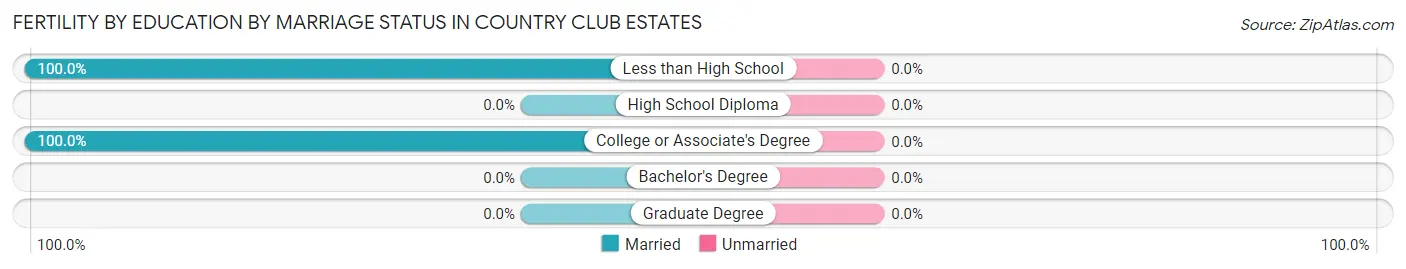
| Educational Attainment | Married | Unmarried |
| Less than High School | 66 (100.0%) | 0 (0.0%) |
| High School Diploma | 0 (0.0%) | 0 (0.0%) |
| College or Associate's Degree | 8 (100.0%) | 0 (0.0%) |
| Bachelor's Degree | 0 (0.0%) | 0 (0.0%) |
| Graduate Degree | 0 (0.0%) | 0 (0.0%) |
| Total | 74 (100.0%) | 0 (0.0%) |
Income in Country Club Estates
Income Overview in Country Club Estates
Per Capita Income in Country Club Estates is $27,018, while median incomes of families and households are $63,125 and $57,816 respectively.
| Characteristic | Number | Measure |
| Per Capita Income | 9,057 | $27,018 |
| Median Family Income | 2,044 | $63,125 |
| Mean Family Income | 2,044 | $71,185 |
| Median Household Income | 3,674 | $57,816 |
| Mean Household Income | 3,674 | $64,823 |
| Income Deficit | 2,044 | $0 |
| Wage / Income Gap (%) | 9,057 | 45.85% |
| Wage / Income Gap ($) | 9,057 | 54.15¢ per $1 |
| Gini / Inequality Index | 9,057 | 0.42 |
Earnings by Sex in Country Club Estates
Average Earnings in Country Club Estates are $28,750, $42,618 for men and $23,078 for women, a difference of 45.9%.
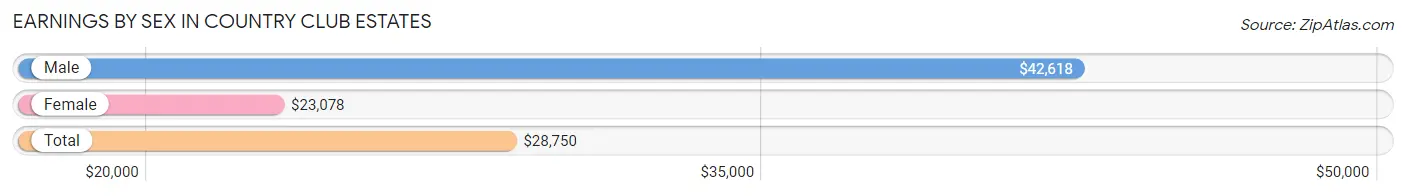
| Sex | Number | Average Earnings |
| Male | 2,443 (46.4%) | $42,618 |
| Female | 2,827 (53.6%) | $23,078 |
| Total | 5,270 (100.0%) | $28,750 |
Earnings by Sex by Income Bracket in Country Club Estates
The most common earnings brackets in Country Club Estates are $55,000 to $64,999 for men (353 | 14.4%) and $5,000 to $7,499 for women (387 | 13.7%).
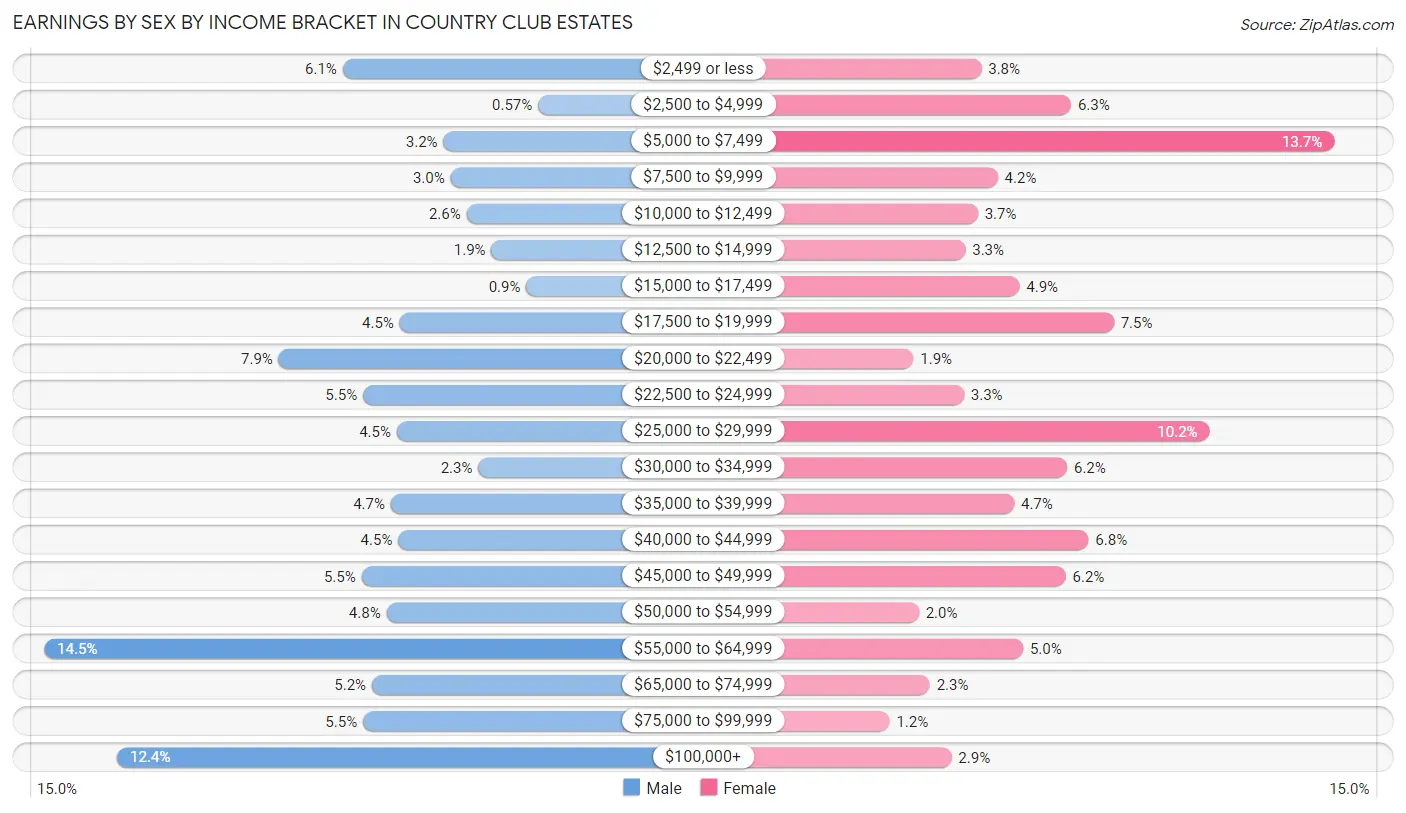
| Income | Male | Female |
| $2,499 or less | 148 (6.1%) | 107 (3.8%) |
| $2,500 to $4,999 | 14 (0.6%) | 178 (6.3%) |
| $5,000 to $7,499 | 79 (3.2%) | 387 (13.7%) |
| $7,500 to $9,999 | 74 (3.0%) | 120 (4.2%) |
| $10,000 to $12,499 | 63 (2.6%) | 104 (3.7%) |
| $12,500 to $14,999 | 46 (1.9%) | 94 (3.3%) |
| $15,000 to $17,499 | 22 (0.9%) | 137 (4.9%) |
| $17,500 to $19,999 | 109 (4.5%) | 212 (7.5%) |
| $20,000 to $22,499 | 192 (7.9%) | 53 (1.9%) |
| $22,500 to $24,999 | 134 (5.5%) | 93 (3.3%) |
| $25,000 to $29,999 | 111 (4.5%) | 288 (10.2%) |
| $30,000 to $34,999 | 55 (2.2%) | 175 (6.2%) |
| $35,000 to $39,999 | 115 (4.7%) | 133 (4.7%) |
| $40,000 to $44,999 | 110 (4.5%) | 192 (6.8%) |
| $45,000 to $49,999 | 135 (5.5%) | 174 (6.1%) |
| $50,000 to $54,999 | 118 (4.8%) | 57 (2.0%) |
| $55,000 to $64,999 | 353 (14.4%) | 140 (5.0%) |
| $65,000 to $74,999 | 128 (5.2%) | 66 (2.3%) |
| $75,000 to $99,999 | 134 (5.5%) | 34 (1.2%) |
| $100,000+ | 303 (12.4%) | 83 (2.9%) |
| Total | 2,443 (100.0%) | 2,827 (100.0%) |
Earnings by Sex by Educational Attainment in Country Club Estates
Average earnings in Country Club Estates are $46,101 for men and $28,050 for women, a difference of 39.2%. Men with an educational attainment of graduate degree enjoy the highest average annual earnings of $103,472, while those with high school diploma education earn the least with $29,712. Women with an educational attainment of bachelor's degree earn the most with the average annual earnings of $44,009, while those with less than high school education have the smallest earnings of $16,088.
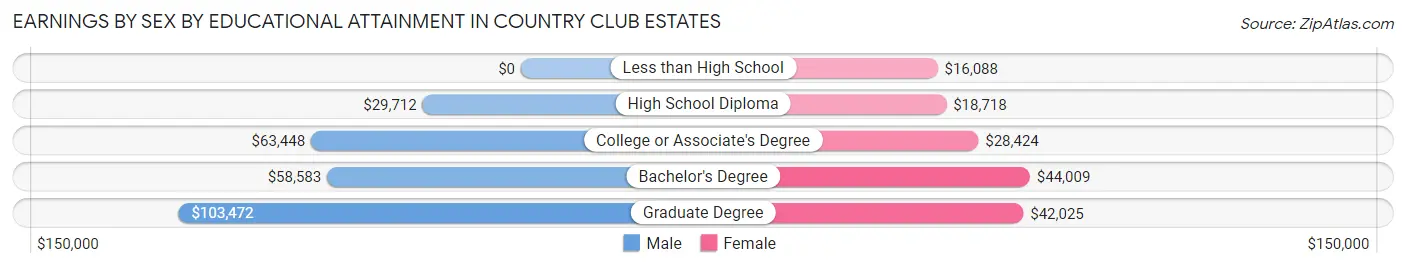
| Educational Attainment | Male Income | Female Income |
| Less than High School | - | - |
| High School Diploma | $29,712 | $18,718 |
| College or Associate's Degree | $63,448 | $28,424 |
| Bachelor's Degree | $58,583 | $44,009 |
| Graduate Degree | $103,472 | $42,025 |
| Total | $46,101 | $28,050 |
Family Income in Country Club Estates
Family Income Brackets in Country Club Estates
According to the Country Club Estates family income data, there are 484 families falling into the $50,000 to $74,999 income range, which is the most common income bracket and makes up 23.7% of all families.
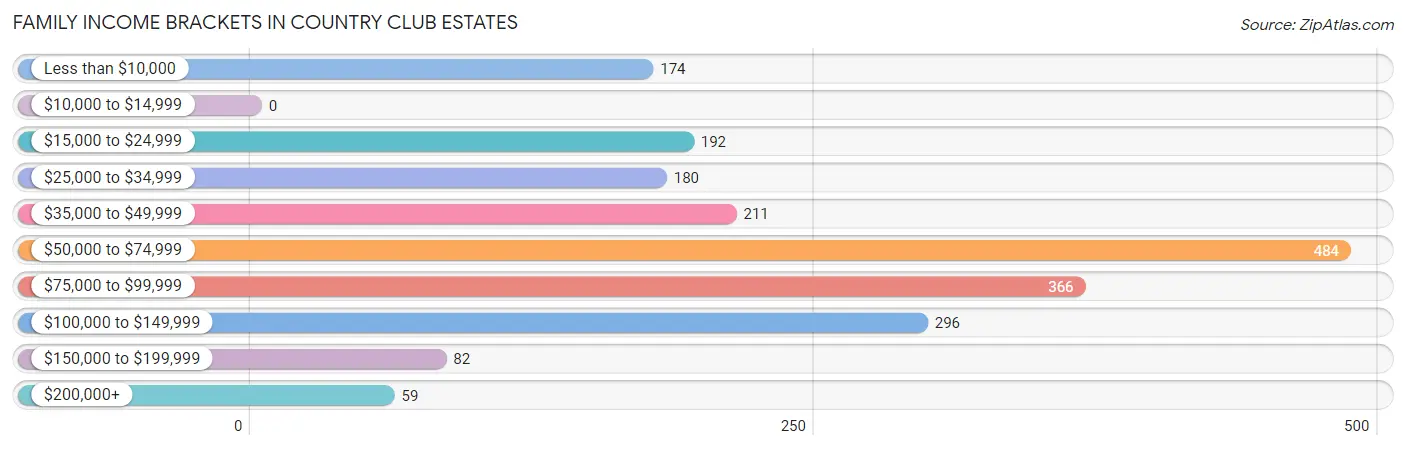
| Income Bracket | # Families | % Families |
| Less than $10,000 | 174 | 8.5% |
| $10,000 to $14,999 | 0 | 0.0% |
| $15,000 to $24,999 | 192 | 9.4% |
| $25,000 to $34,999 | 180 | 8.8% |
| $35,000 to $49,999 | 211 | 10.3% |
| $50,000 to $74,999 | 484 | 23.7% |
| $75,000 to $99,999 | 366 | 17.9% |
| $100,000 to $149,999 | 296 | 14.5% |
| $150,000 to $199,999 | 82 | 4.0% |
| $200,000+ | 59 | 2.9% |
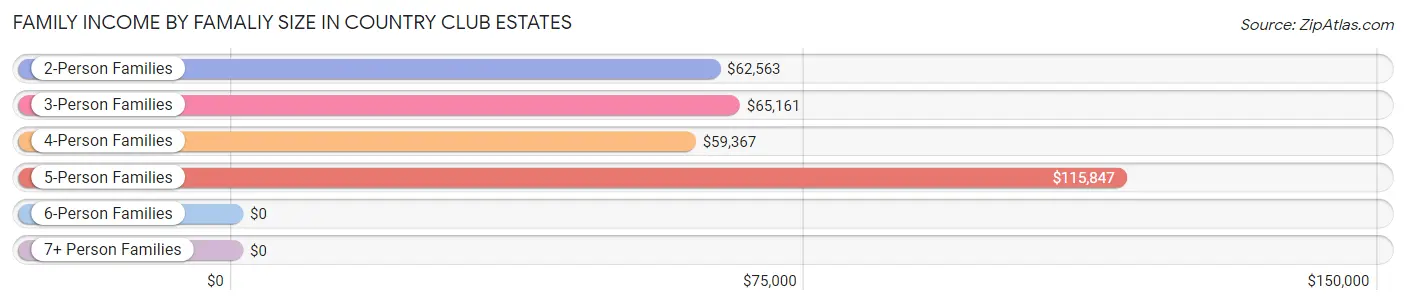
Family Income by Famaliy Size in Country Club Estates
5-person families (63 | 3.1%) account for the highest median family income in Country Club Estates with $115,847 per family, while 2-person families (853 | 41.7%) have the highest median income of $31,282 per family member.
| Income Bracket | # Families | Median Income |
| 2-Person Families | 853 (41.7%) | $62,563 |
| 3-Person Families | 628 (30.7%) | $65,161 |
| 4-Person Families | 460 (22.5%) | $59,367 |
| 5-Person Families | 63 (3.1%) | $115,847 |
| 6-Person Families | 40 (2.0%) | $0 |
| 7+ Person Families | 0 (0.0%) | $0 |
| Total | 2,044 (100.0%) | $63,125 |
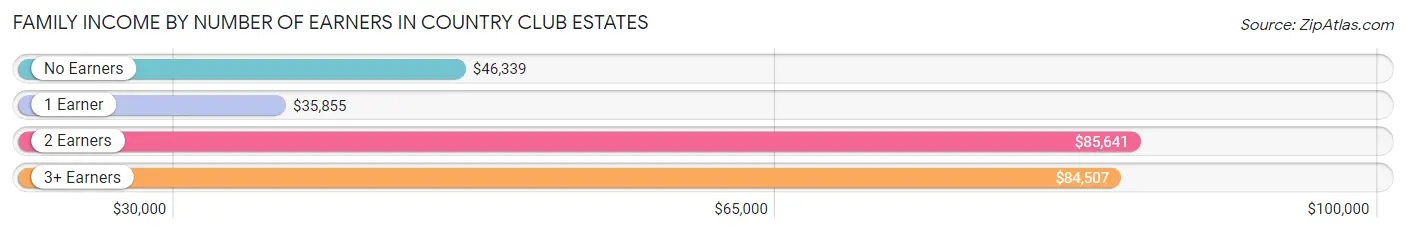
Family Income by Number of Earners in Country Club Estates
The median family income in Country Club Estates is $63,125, with families comprising 2 earners (784) having the highest median family income of $85,641, while families with 1 earner (745) have the lowest median family income of $35,855, accounting for 38.4% and 36.4% of families, respectively.
| Number of Earners | # Families | Median Income |
| No Earners | 233 (11.4%) | $46,339 |
| 1 Earner | 745 (36.4%) | $35,855 |
| 2 Earners | 784 (38.4%) | $85,641 |
| 3+ Earners | 282 (13.8%) | $84,507 |
| Total | 2,044 (100.0%) | $63,125 |
Household Income in Country Club Estates
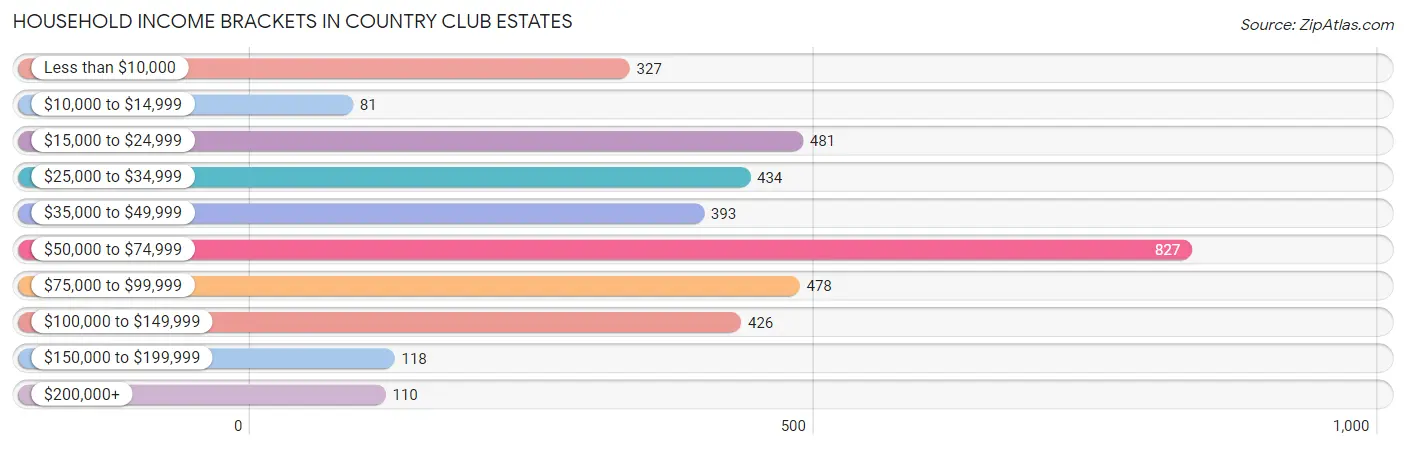
Household Income Brackets in Country Club Estates
With 827 households falling in the category, the $50,000 to $74,999 income range is the most frequent in Country Club Estates, accounting for 22.5% of all households. In contrast, only 81 households (2.2%) fall into the $10,000 to $14,999 income bracket, making it the least populous group.
| Income Bracket | # Households | % Households |
| Less than $10,000 | 327 | 8.9% |
| $10,000 to $14,999 | 81 | 2.2% |
| $15,000 to $24,999 | 481 | 13.1% |
| $25,000 to $34,999 | 434 | 11.8% |
| $35,000 to $49,999 | 393 | 10.7% |
| $50,000 to $74,999 | 827 | 22.5% |
| $75,000 to $99,999 | 478 | 13.0% |
| $100,000 to $149,999 | 426 | 11.6% |
| $150,000 to $199,999 | 118 | 3.2% |
| $200,000+ | 110 | 3.0% |
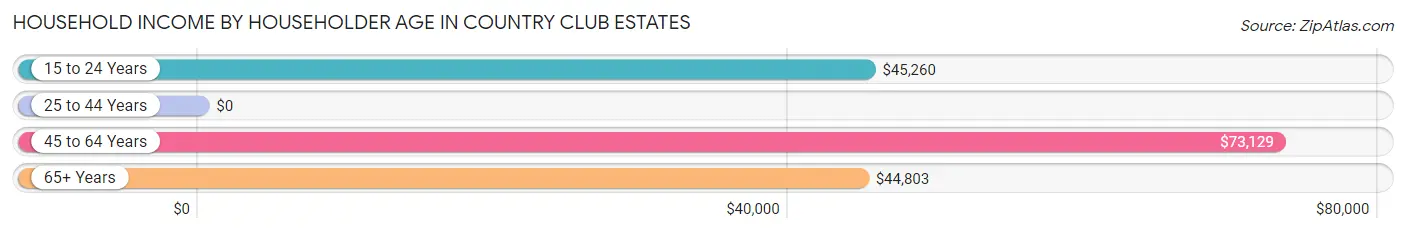
Household Income by Householder Age in Country Club Estates
The median household income in Country Club Estates is $57,816, with the highest median household income of $73,129 found in the 45 to 64 years age bracket for the primary householder. A total of 1,374 households (37.4%) fall into this category. Meanwhile, the 25 to 44 years age bracket for the primary householder has the lowest median household income of $0, with 1,386 households (37.7%) in this group.
| Income Bracket | # Households | Median Income |
| 15 to 24 Years | 131 (3.6%) | $45,260 |
| 25 to 44 Years | 1,386 (37.7%) | $0 |
| 45 to 64 Years | 1,374 (37.4%) | $73,129 |
| 65+ Years | 783 (21.3%) | $44,803 |
| Total | 3,674 (100.0%) | $57,816 |
Poverty in Country Club Estates
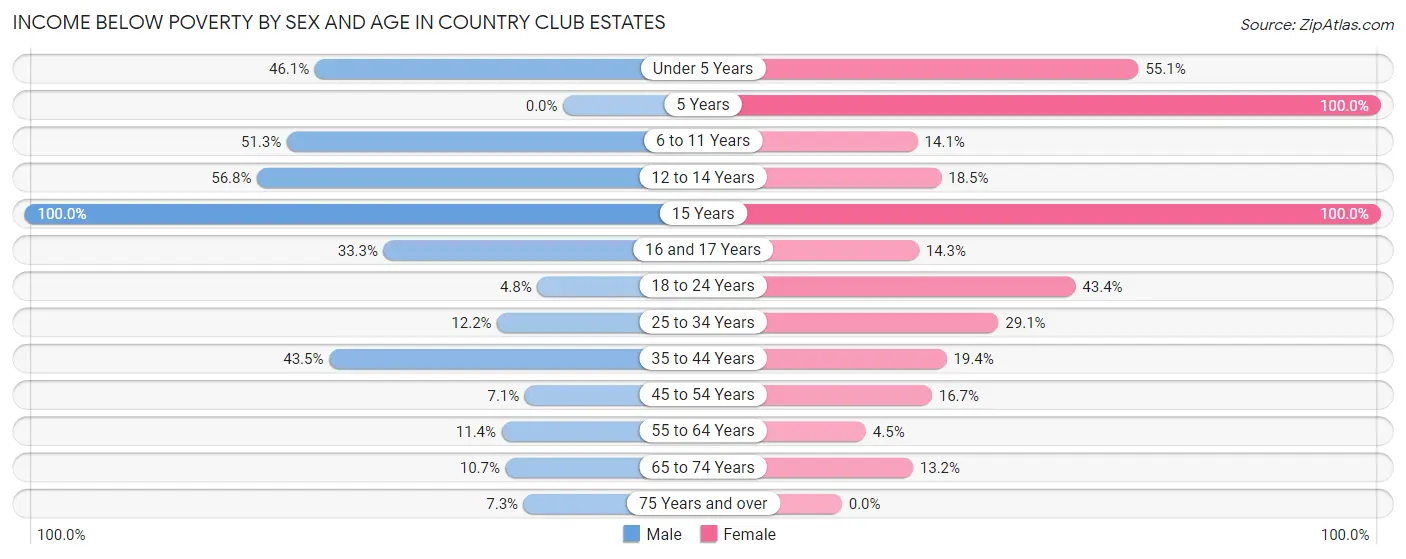
Income Below Poverty by Sex and Age in Country Club Estates
With 21.9% poverty level for males and 24.1% for females among the residents of Country Club Estates, 15 year old males and 5 year old females are the most vulnerable to poverty, with 10 males (100.0%) and 14 females (100.0%) in their respective age groups living below the poverty level.
| Age Bracket | Male | Female |
| Under 5 Years | 159 (46.1%) | 228 (55.1%) |
| 5 Years | 0 (0.0%) | 14 (100.0%) |
| 6 to 11 Years | 119 (51.3%) | 30 (14.1%) |
| 12 to 14 Years | 171 (56.8%) | 29 (18.5%) |
| 15 Years | 10 (100.0%) | 7 (100.0%) |
| 16 and 17 Years | 13 (33.3%) | 8 (14.3%) |
| 18 to 24 Years | 17 (4.8%) | 258 (43.4%) |
| 25 to 34 Years | 101 (12.2%) | 364 (29.1%) |
| 35 to 44 Years | 146 (43.4%) | 109 (19.4%) |
| 45 to 54 Years | 47 (7.1%) | 97 (16.7%) |
| 55 to 64 Years | 38 (11.4%) | 28 (4.5%) |
| 65 to 74 Years | 31 (10.7%) | 50 (13.2%) |
| 75 Years and over | 12 (7.3%) | 0 (0.0%) |
| Total | 864 (21.9%) | 1,222 (24.1%) |
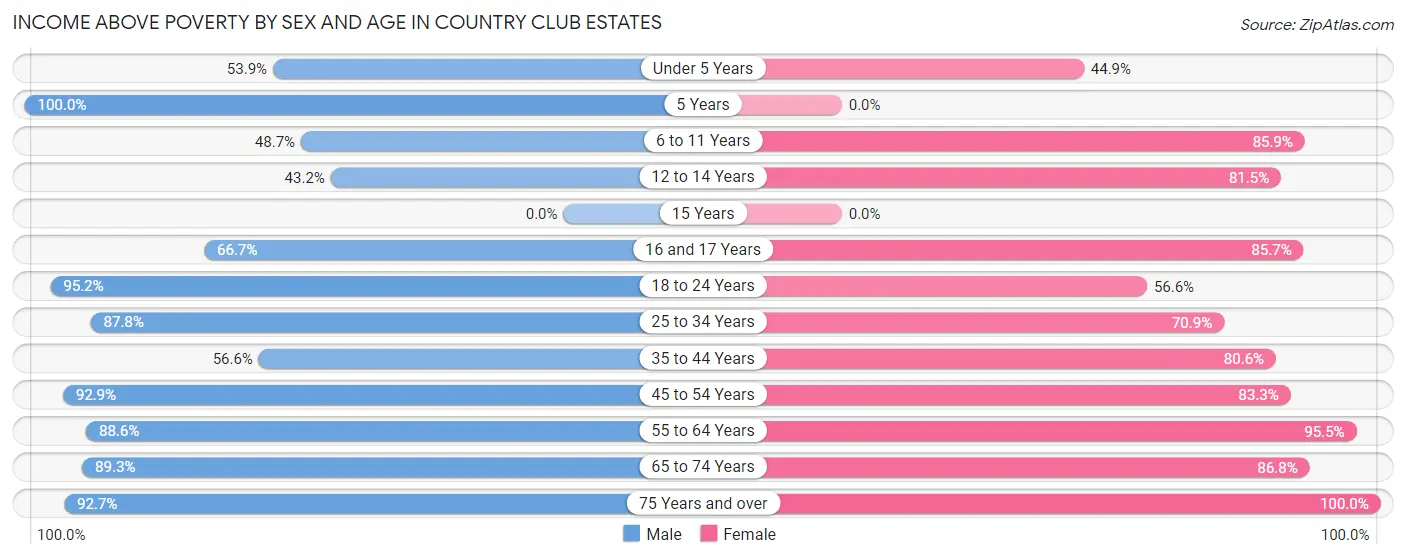
Income Above Poverty by Sex and Age in Country Club Estates
According to the poverty statistics in Country Club Estates, males aged 5 years and females aged 75 years and over are the age groups that are most secure financially, with 100.0% of males and 100.0% of females in these age groups living above the poverty line.
| Age Bracket | Male | Female |
| Under 5 Years | 186 (53.9%) | 186 (44.9%) |
| 5 Years | 52 (100.0%) | 0 (0.0%) |
| 6 to 11 Years | 113 (48.7%) | 183 (85.9%) |
| 12 to 14 Years | 130 (43.2%) | 128 (81.5%) |
| 15 Years | 0 (0.0%) | 0 (0.0%) |
| 16 and 17 Years | 26 (66.7%) | 48 (85.7%) |
| 18 to 24 Years | 338 (95.2%) | 337 (56.6%) |
| 25 to 34 Years | 724 (87.8%) | 888 (70.9%) |
| 35 to 44 Years | 190 (56.6%) | 452 (80.6%) |
| 45 to 54 Years | 615 (92.9%) | 484 (83.3%) |
| 55 to 64 Years | 295 (88.6%) | 597 (95.5%) |
| 65 to 74 Years | 259 (89.3%) | 329 (86.8%) |
| 75 Years and over | 152 (92.7%) | 209 (100.0%) |
| Total | 3,080 (78.1%) | 3,841 (75.9%) |
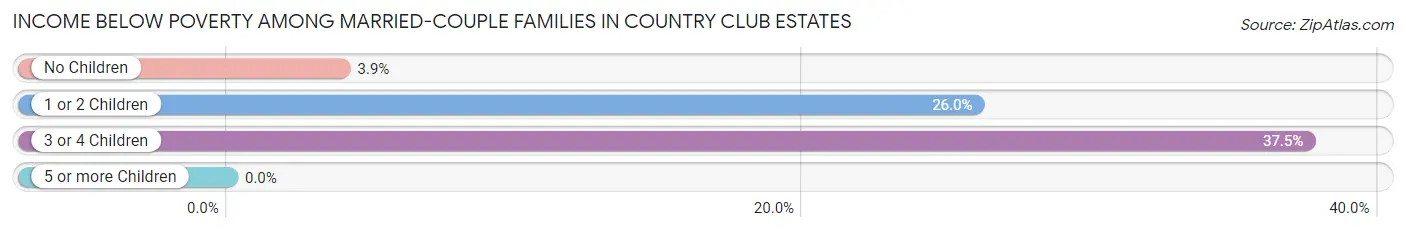
Income Below Poverty Among Married-Couple Families in Country Club Estates
The poverty statistics for married-couple families in Country Club Estates show that 14.2% or 182 of the total 1,283 families live below the poverty line. Families with 3 or 4 children have the highest poverty rate of 37.5%, comprising of 21 families. On the other hand, families with no children have the lowest poverty rate of 3.9%, which includes 28 families.
| Children | Above Poverty | Below Poverty |
| No Children | 687 (96.1%) | 28 (3.9%) |
| 1 or 2 Children | 379 (74.0%) | 133 (26.0%) |
| 3 or 4 Children | 35 (62.5%) | 21 (37.5%) |
| 5 or more Children | 0 (0.0%) | 0 (0.0%) |
| Total | 1,101 (85.8%) | 182 (14.2%) |
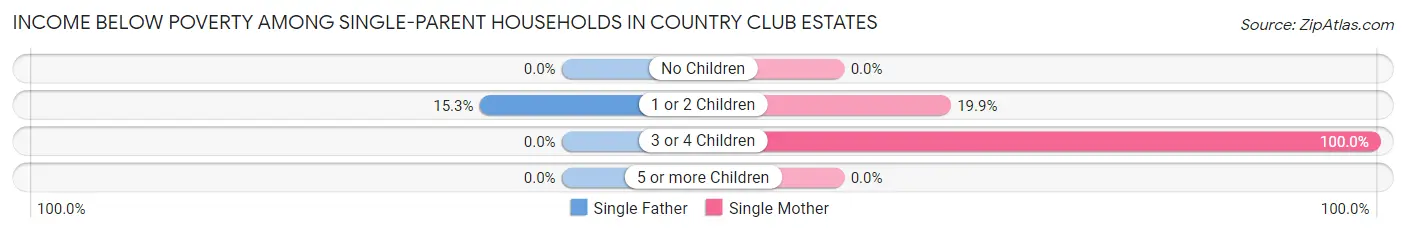
Income Below Poverty Among Single-Parent Households in Country Club Estates
According to the poverty data in Country Club Estates, 10.1% or 15 single-father households and 23.7% or 145 single-mother households are living below the poverty line. Among single-father households, those with 1 or 2 children have the highest poverty rate, with 15 households (15.3%) experiencing poverty. Likewise, among single-mother households, those with 3 or 4 children have the highest poverty rate, with 91 households (100.0%) falling below the poverty line.
| Children | Single Father | Single Mother |
| No Children | 0 (0.0%) | 0 (0.0%) |
| 1 or 2 Children | 15 (15.3%) | 54 (19.9%) |
| 3 or 4 Children | 0 (0.0%) | 91 (100.0%) |
| 5 or more Children | 0 (0.0%) | 0 (0.0%) |
| Total | 15 (10.1%) | 145 (23.7%) |
Income Below Poverty Among Married-Couple vs Single-Parent Households in Country Club Estates
The poverty data for Country Club Estates shows that 182 of the married-couple family households (14.2%) and 160 of the single-parent households (21.0%) are living below the poverty level. Within the married-couple family households, those with 3 or 4 children have the highest poverty rate, with 21 households (37.5%) falling below the poverty line. Among the single-parent households, those with 3 or 4 children have the highest poverty rate, with 91 household (100.0%) living below poverty.
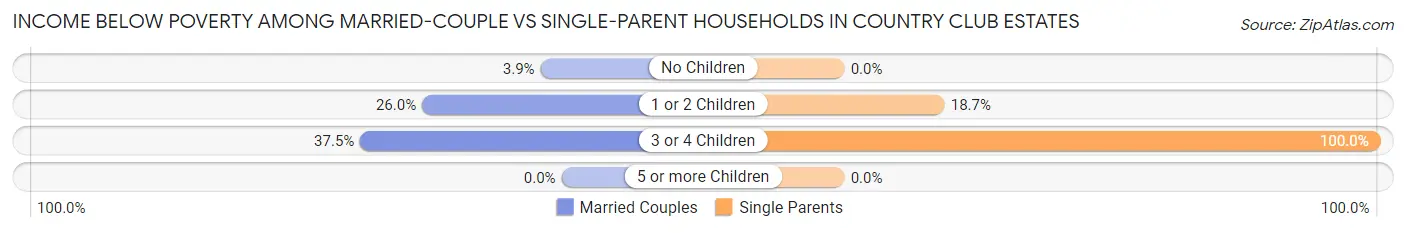
| Children | Married-Couple Families | Single-Parent Households |
| No Children | 28 (3.9%) | 0 (0.0%) |
| 1 or 2 Children | 133 (26.0%) | 69 (18.6%) |
| 3 or 4 Children | 21 (37.5%) | 91 (100.0%) |
| 5 or more Children | 0 (0.0%) | 0 (0.0%) |
| Total | 182 (14.2%) | 160 (21.0%) |
Employment Characteristics in Country Club Estates
Employment by Class of Employer in Country Club Estates
Among the 4,681 employed individuals in Country Club Estates, private company employees (3,460 | 73.9%), self-employed (not incorporated) (512 | 10.9%), and not-for-profit organizations (179 | 3.8%) make up the most common classes of employment.
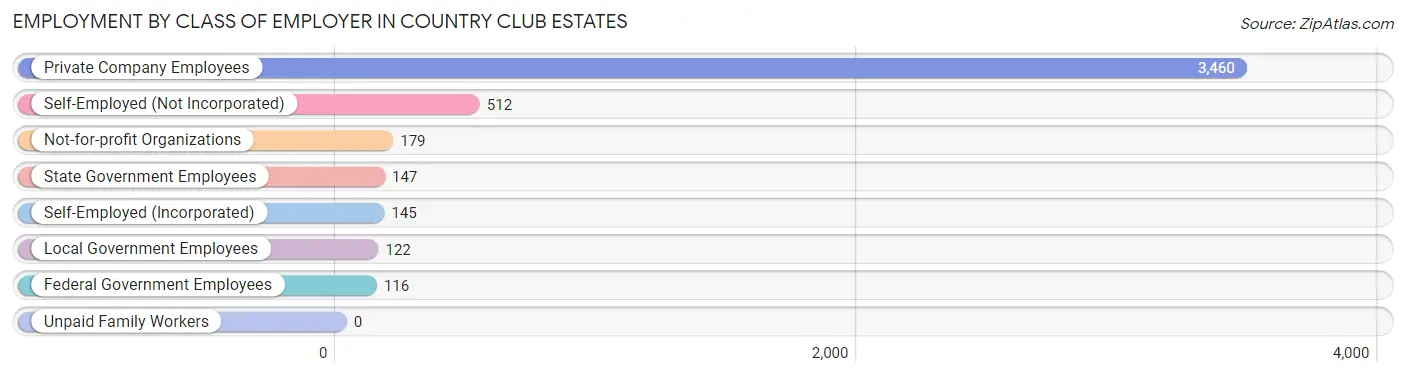
| Employer Class | # Employees | % Employees |
| Private Company Employees | 3,460 | 73.9% |
| Self-Employed (Incorporated) | 145 | 3.1% |
| Self-Employed (Not Incorporated) | 512 | 10.9% |
| Not-for-profit Organizations | 179 | 3.8% |
| Local Government Employees | 122 | 2.6% |
| State Government Employees | 147 | 3.1% |
| Federal Government Employees | 116 | 2.5% |
| Unpaid Family Workers | 0 | 0.0% |
| Total | 4,681 | 100.0% |
Employment Status by Age in Country Club Estates
According to the labor force statistics for Country Club Estates, out of the total population over 16 years of age (7,262), 69.0% or 5,011 individuals are in the labor force, with 4.9% or 246 of them unemployed. The age group with the highest labor force participation rate is 35 to 44 years, with 91.3% or 819 individuals in the labor force. Within the labor force, the 30 to 34 years age range has the highest percentage of unemployed individuals, with 15.1% or 67 of them being unemployed.
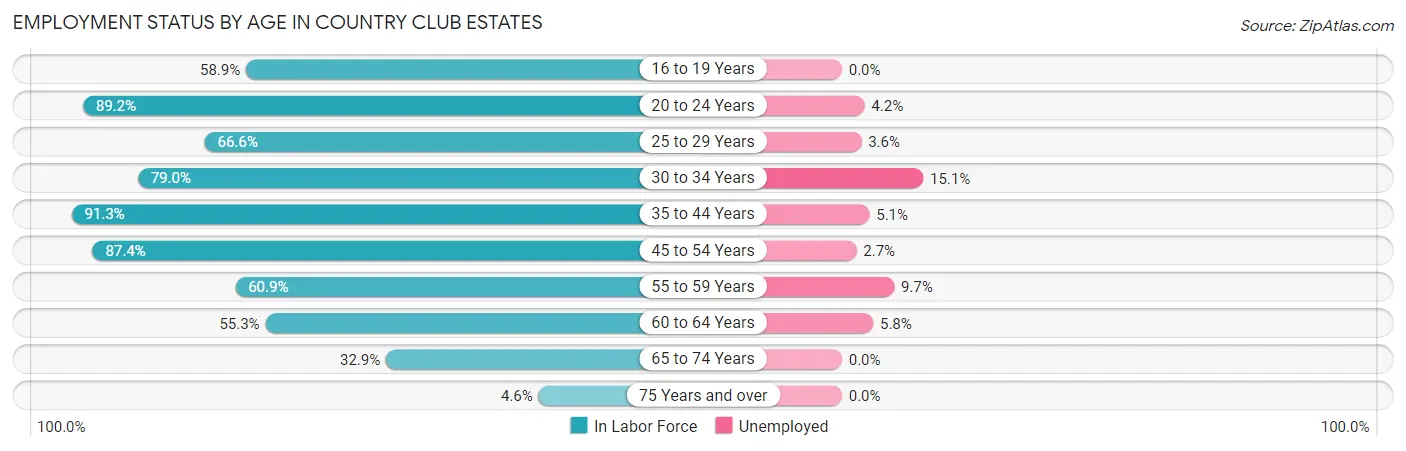
| Age Bracket | In Labor Force | Unemployed |
| 16 to 19 Years | 142 (58.9%) | 0 (0.0%) |
| 20 to 24 Years | 717 (89.2%) | 30 (4.2%) |
| 25 to 29 Years | 1,009 (66.6%) | 36 (3.6%) |
| 30 to 34 Years | 444 (79.0%) | 67 (15.1%) |
| 35 to 44 Years | 819 (91.3%) | 42 (5.1%) |
| 45 to 54 Years | 1,086 (87.4%) | 29 (2.7%) |
| 55 to 59 Years | 300 (60.9%) | 29 (9.7%) |
| 60 to 64 Years | 257 (55.3%) | 15 (5.8%) |
| 65 to 74 Years | 220 (32.9%) | 0 (0.0%) |
| 75 Years and over | 17 (4.6%) | 0 (0.0%) |
| Total | 5,011 (69.0%) | 246 (4.9%) |
Employment Status by Educational Attainment in Country Club Estates
According to labor force statistics for Country Club Estates, 75.7% of individuals (3,917) out of the total population between 25 and 64 years of age (5,175) are in the labor force, with 5.6% or 219 of them being unemployed. The group with the highest labor force participation rate are those with the educational attainment of bachelor's degree or higher, with 91.4% or 672 individuals in the labor force. Within the labor force, individuals with bachelor's degree or higher education have the highest percentage of unemployment, with 14.1% or 95 of them being unemployed.
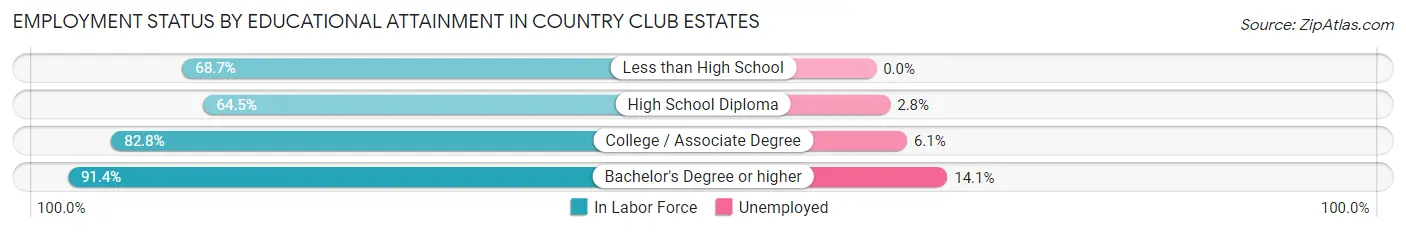
| Educational Attainment | In Labor Force | Unemployed |
| Less than High School | 688 (68.7%) | 0 (0.0%) |
| High School Diploma | 1,024 (64.5%) | 44 (2.8%) |
| College / Associate Degree | 1,532 (82.8%) | 113 (6.1%) |
| Bachelor's Degree or higher | 672 (91.4%) | 104 (14.1%) |
| Total | 3,917 (75.7%) | 290 (5.6%) |
Employment Occupations by Sex in Country Club Estates
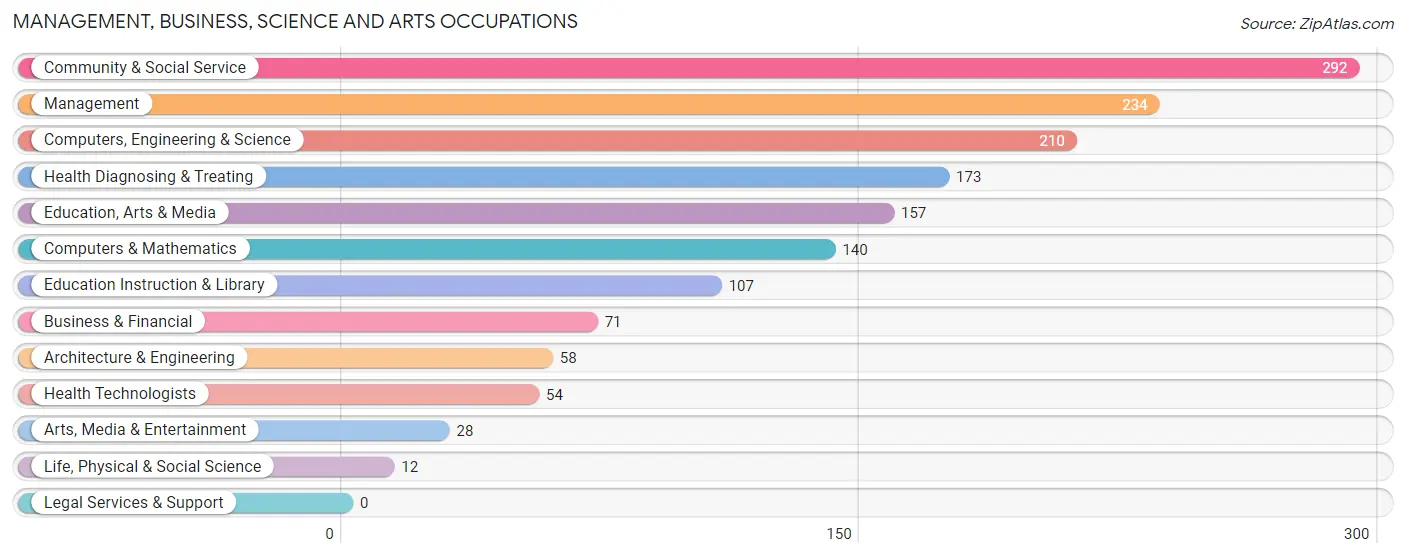
Management, Business, Science and Arts Occupations
The most common Management, Business, Science and Arts occupations in Country Club Estates are Community & Social Service (292 | 6.1%), Management (234 | 4.9%), Computers, Engineering & Science (210 | 4.4%), Health Diagnosing & Treating (173 | 3.6%), and Education, Arts & Media (157 | 3.3%).
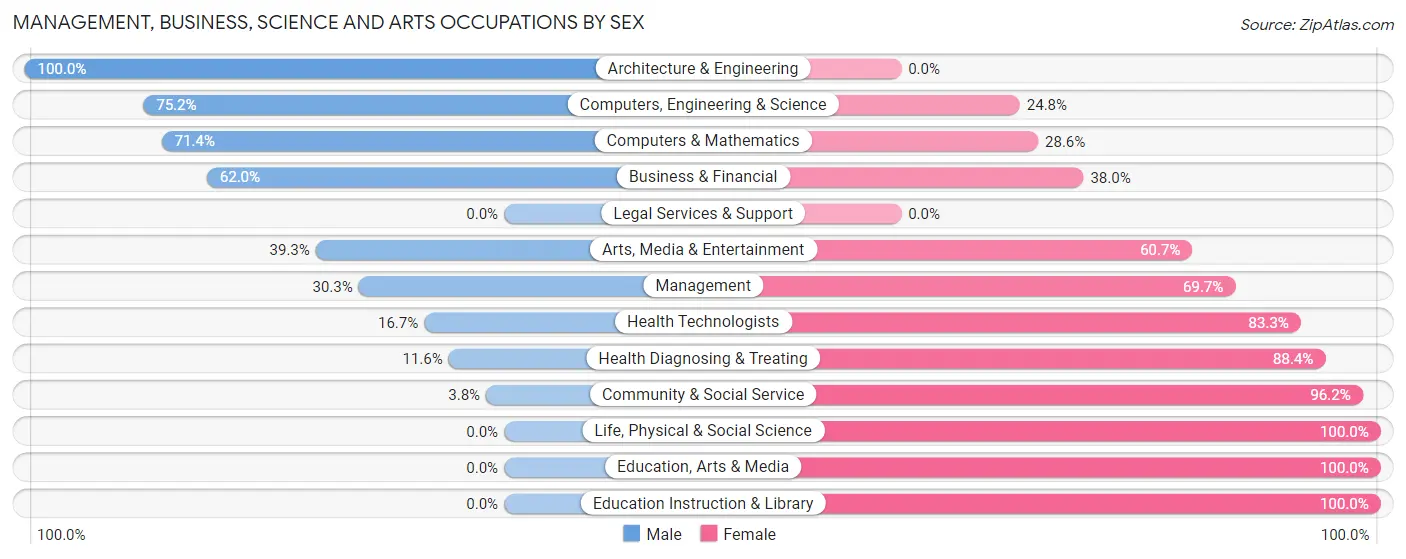
Management, Business, Science and Arts Occupations by Sex
Within the Management, Business, Science and Arts occupations in Country Club Estates, the most male-oriented occupations are Architecture & Engineering (100.0%), Computers, Engineering & Science (75.2%), and Computers & Mathematics (71.4%), while the most female-oriented occupations are Life, Physical & Social Science (100.0%), Education, Arts & Media (100.0%), and Education Instruction & Library (100.0%).
| Occupation | Male | Female |
| Management | 71 (30.3%) | 163 (69.7%) |
| Business & Financial | 44 (62.0%) | 27 (38.0%) |
| Computers, Engineering & Science | 158 (75.2%) | 52 (24.8%) |
| Computers & Mathematics | 100 (71.4%) | 40 (28.6%) |
| Architecture & Engineering | 58 (100.0%) | 0 (0.0%) |
| Life, Physical & Social Science | 0 (0.0%) | 12 (100.0%) |
| Community & Social Service | 11 (3.8%) | 281 (96.2%) |
| Education, Arts & Media | 0 (0.0%) | 157 (100.0%) |
| Legal Services & Support | 0 (0.0%) | 0 (0.0%) |
| Education Instruction & Library | 0 (0.0%) | 107 (100.0%) |
| Arts, Media & Entertainment | 11 (39.3%) | 17 (60.7%) |
| Health Diagnosing & Treating | 20 (11.6%) | 153 (88.4%) |
| Health Technologists | 9 (16.7%) | 45 (83.3%) |
| Total (Category) | 304 (31.0%) | 676 (69.0%) |
| Total (Overall) | 2,359 (49.5%) | 2,405 (50.5%) |
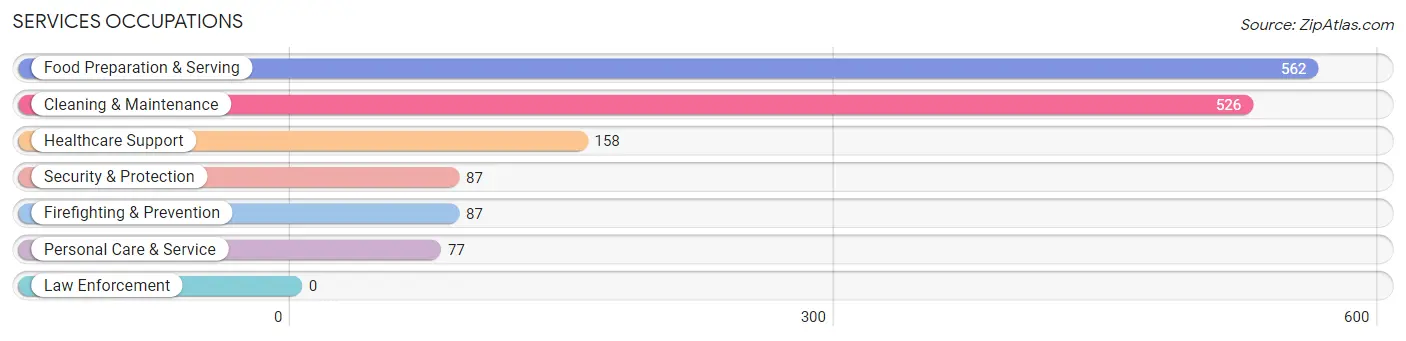
Services Occupations
The most common Services occupations in Country Club Estates are Food Preparation & Serving (562 | 11.8%), Cleaning & Maintenance (526 | 11.0%), Healthcare Support (158 | 3.3%), Security & Protection (87 | 1.8%), and Firefighting & Prevention (87 | 1.8%).
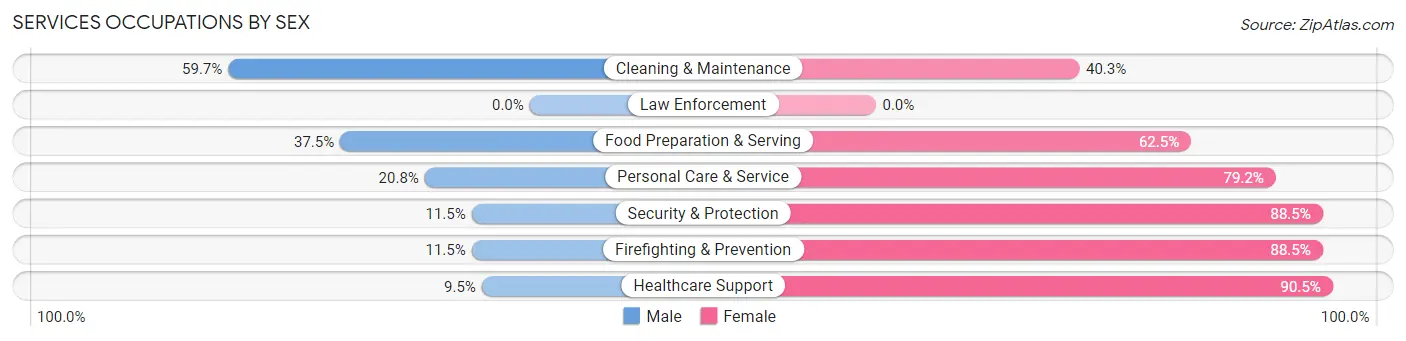
Services Occupations by Sex
Within the Services occupations in Country Club Estates, the most male-oriented occupations are Cleaning & Maintenance (59.7%), Food Preparation & Serving (37.5%), and Personal Care & Service (20.8%), while the most female-oriented occupations are Healthcare Support (90.5%), Security & Protection (88.5%), and Firefighting & Prevention (88.5%).
| Occupation | Male | Female |
| Healthcare Support | 15 (9.5%) | 143 (90.5%) |
| Security & Protection | 10 (11.5%) | 77 (88.5%) |
| Firefighting & Prevention | 10 (11.5%) | 77 (88.5%) |
| Law Enforcement | 0 (0.0%) | 0 (0.0%) |
| Food Preparation & Serving | 211 (37.5%) | 351 (62.5%) |
| Cleaning & Maintenance | 314 (59.7%) | 212 (40.3%) |
| Personal Care & Service | 16 (20.8%) | 61 (79.2%) |
| Total (Category) | 566 (40.1%) | 844 (59.9%) |
| Total (Overall) | 2,359 (49.5%) | 2,405 (50.5%) |
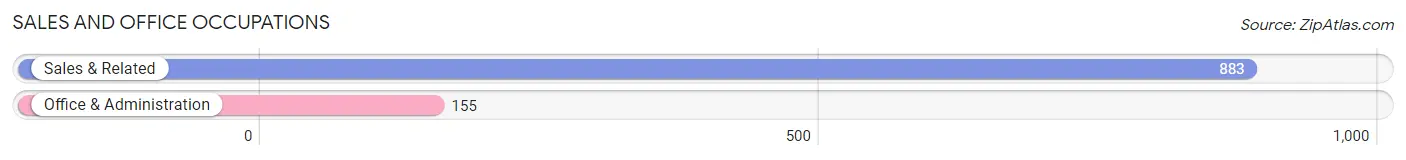
Sales and Office Occupations
The most common Sales and Office occupations in Country Club Estates are Sales & Related (883 | 18.5%), and Office & Administration (155 | 3.3%).
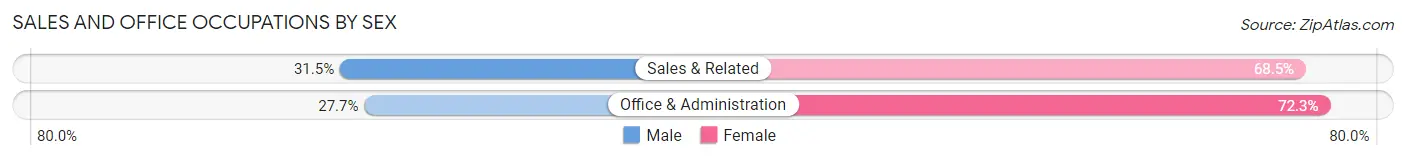
Sales and Office Occupations by Sex
| Occupation | Male | Female |
| Sales & Related | 278 (31.5%) | 605 (68.5%) |
| Office & Administration | 43 (27.7%) | 112 (72.3%) |
| Total (Category) | 321 (30.9%) | 717 (69.1%) |
| Total (Overall) | 2,359 (49.5%) | 2,405 (50.5%) |
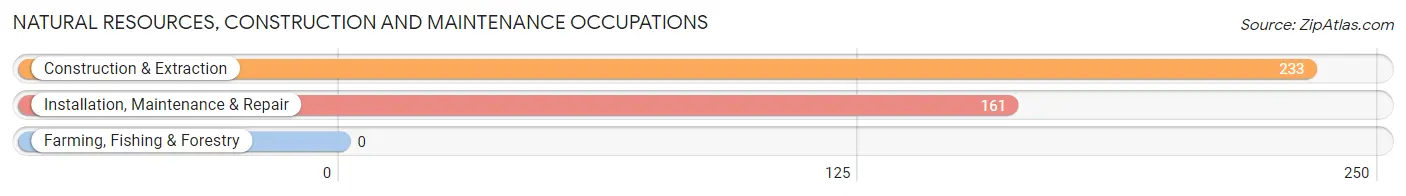
Natural Resources, Construction and Maintenance Occupations
The most common Natural Resources, Construction and Maintenance occupations in Country Club Estates are Construction & Extraction (233 | 4.9%), and Installation, Maintenance & Repair (161 | 3.4%).
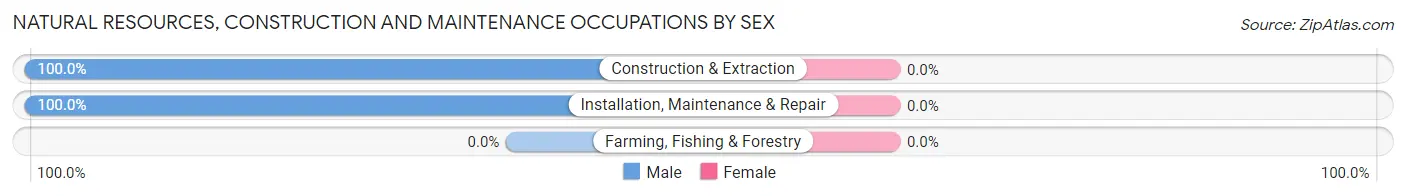
Natural Resources, Construction and Maintenance Occupations by Sex
| Occupation | Male | Female |
| Farming, Fishing & Forestry | 0 (0.0%) | 0 (0.0%) |
| Construction & Extraction | 233 (100.0%) | 0 (0.0%) |
| Installation, Maintenance & Repair | 161 (100.0%) | 0 (0.0%) |
| Total (Category) | 394 (100.0%) | 0 (0.0%) |
| Total (Overall) | 2,359 (49.5%) | 2,405 (50.5%) |
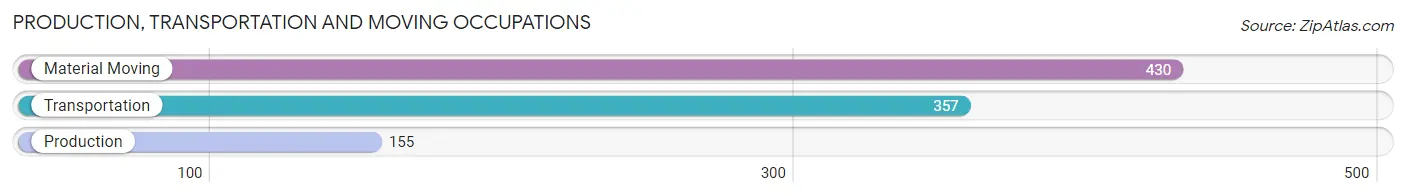
Production, Transportation and Moving Occupations
The most common Production, Transportation and Moving occupations in Country Club Estates are Material Moving (430 | 9.0%), Transportation (357 | 7.5%), and Production (155 | 3.3%).
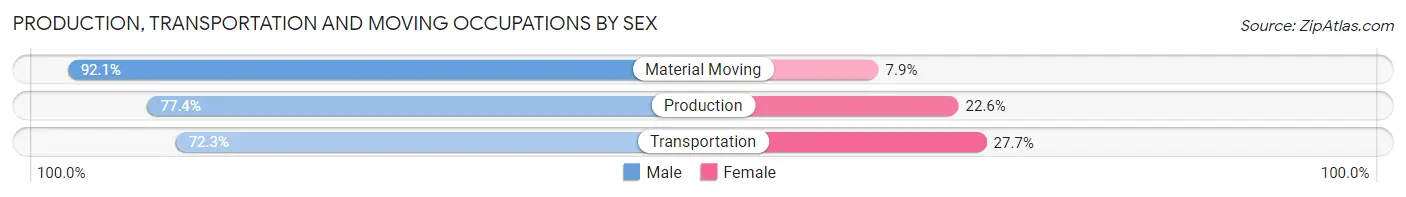
Production, Transportation and Moving Occupations by Sex
| Occupation | Male | Female |
| Production | 120 (77.4%) | 35 (22.6%) |
| Transportation | 258 (72.3%) | 99 (27.7%) |
| Material Moving | 396 (92.1%) | 34 (7.9%) |
| Total (Category) | 774 (82.2%) | 168 (17.8%) |
| Total (Overall) | 2,359 (49.5%) | 2,405 (50.5%) |
Employment Industries by Sex in Country Club Estates
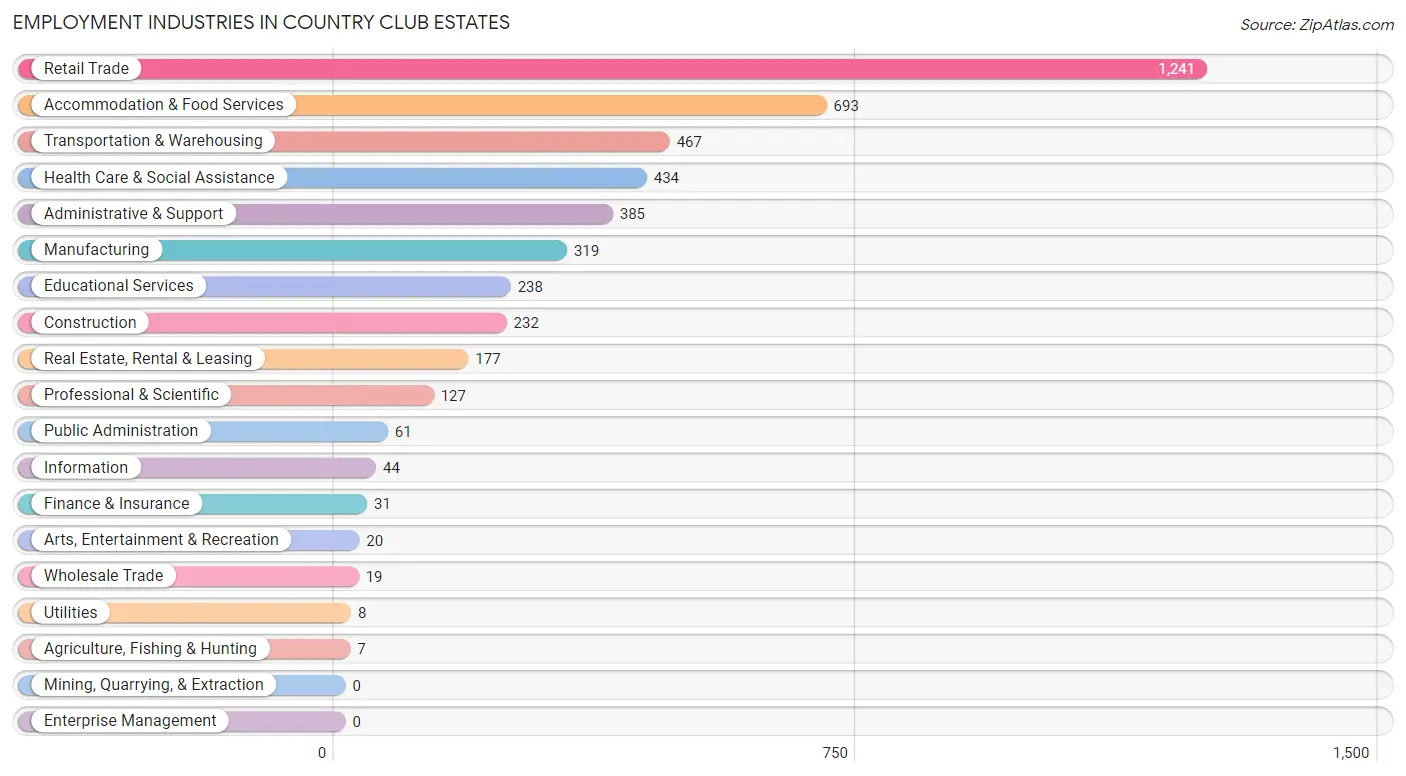
Employment Industries in Country Club Estates
The major employment industries in Country Club Estates include Retail Trade (1,241 | 26.1%), Accommodation & Food Services (693 | 14.5%), Transportation & Warehousing (467 | 9.8%), Health Care & Social Assistance (434 | 9.1%), and Administrative & Support (385 | 8.1%).
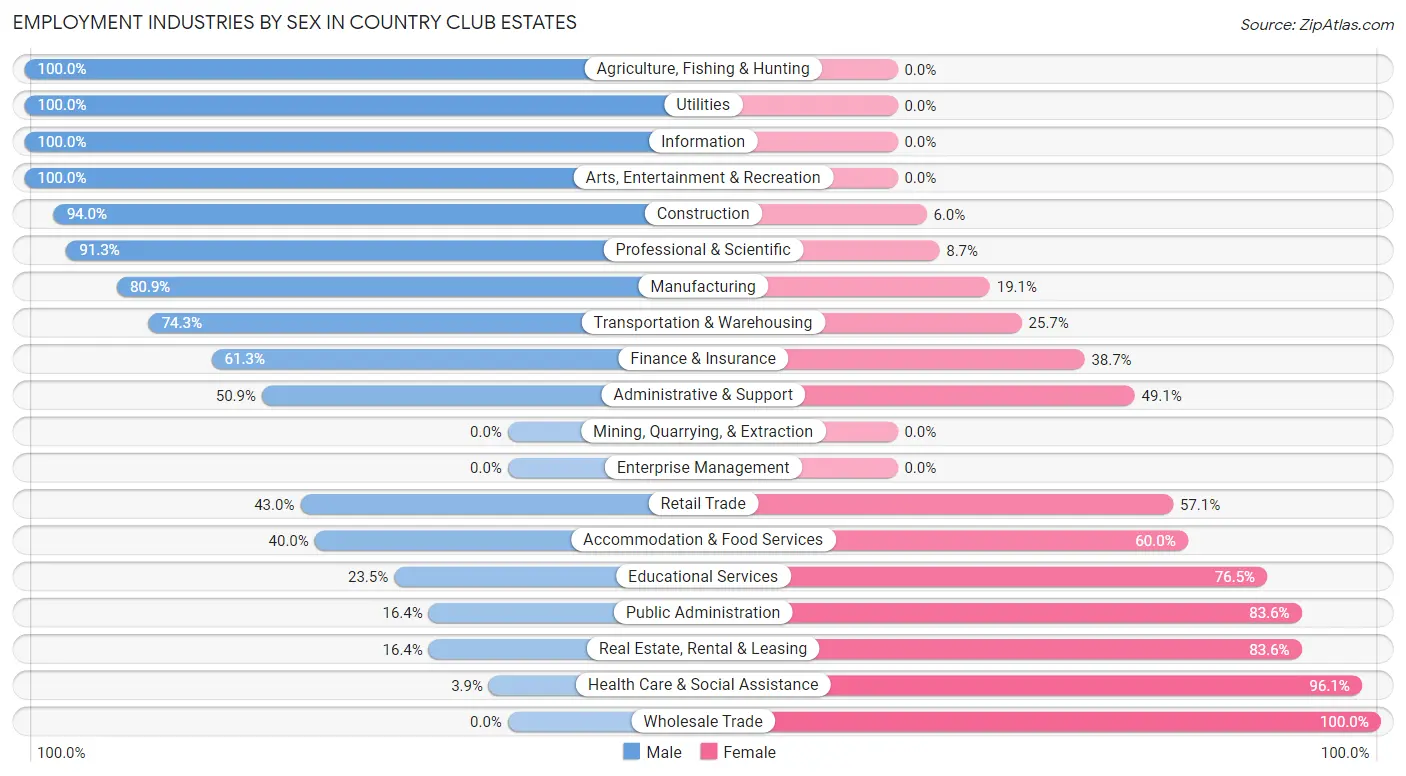
Employment Industries by Sex in Country Club Estates
The Country Club Estates industries that see more men than women are Agriculture, Fishing & Hunting (100.0%), Utilities (100.0%), and Information (100.0%), whereas the industries that tend to have a higher number of women are Wholesale Trade (100.0%), Health Care & Social Assistance (96.1%), and Real Estate, Rental & Leasing (83.6%).
| Industry | Male | Female |
| Agriculture, Fishing & Hunting | 7 (100.0%) | 0 (0.0%) |
| Mining, Quarrying, & Extraction | 0 (0.0%) | 0 (0.0%) |
| Construction | 218 (94.0%) | 14 (6.0%) |
| Manufacturing | 258 (80.9%) | 61 (19.1%) |
| Wholesale Trade | 0 (0.0%) | 19 (100.0%) |
| Retail Trade | 533 (42.9%) | 708 (57.1%) |
| Transportation & Warehousing | 347 (74.3%) | 120 (25.7%) |
| Utilities | 8 (100.0%) | 0 (0.0%) |
| Information | 44 (100.0%) | 0 (0.0%) |
| Finance & Insurance | 19 (61.3%) | 12 (38.7%) |
| Real Estate, Rental & Leasing | 29 (16.4%) | 148 (83.6%) |
| Professional & Scientific | 116 (91.3%) | 11 (8.7%) |
| Enterprise Management | 0 (0.0%) | 0 (0.0%) |
| Administrative & Support | 196 (50.9%) | 189 (49.1%) |
| Educational Services | 56 (23.5%) | 182 (76.5%) |
| Health Care & Social Assistance | 17 (3.9%) | 417 (96.1%) |
| Arts, Entertainment & Recreation | 20 (100.0%) | 0 (0.0%) |
| Accommodation & Food Services | 277 (40.0%) | 416 (60.0%) |
| Public Administration | 10 (16.4%) | 51 (83.6%) |
| Total | 2,359 (49.5%) | 2,405 (50.5%) |
Education in Country Club Estates
School Enrollment in Country Club Estates
The most common levels of schooling among the 1,907 students in Country Club Estates are college / undergraduate (504 | 26.4%), elementary school (482 | 25.3%), and middle school (307 | 16.1%).
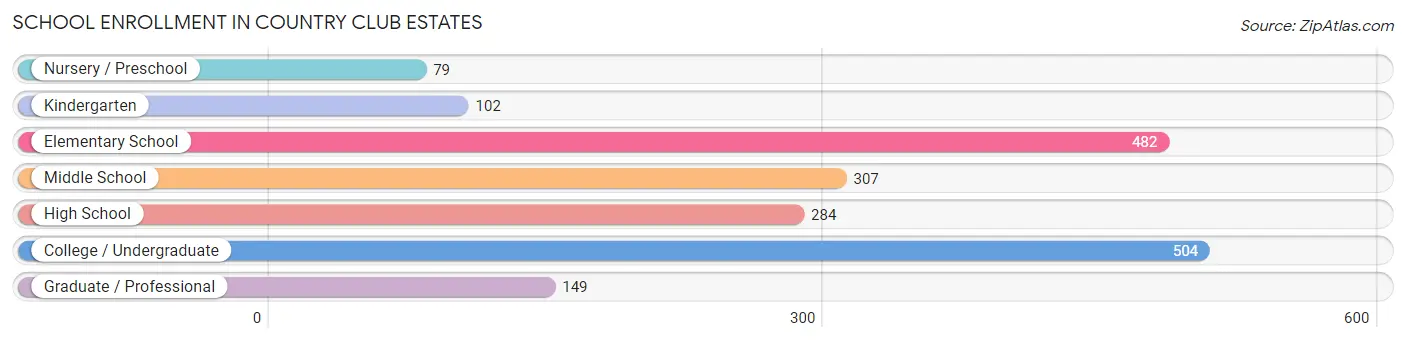
| School Level | # Students | % Students |
| Nursery / Preschool | 79 | 4.1% |
| Kindergarten | 102 | 5.3% |
| Elementary School | 482 | 25.3% |
| Middle School | 307 | 16.1% |
| High School | 284 | 14.9% |
| College / Undergraduate | 504 | 26.4% |
| Graduate / Professional | 149 | 7.8% |
| Total | 1,907 | 100.0% |
School Enrollment by Age by Funding Source in Country Club Estates
Out of a total of 1,907 students who are enrolled in schools in Country Club Estates, 84 (4.4%) attend a private institution, while the remaining 1,823 (95.6%) are enrolled in public schools. The age group of 18 to 19 year olds has the highest likelihood of being enrolled in private schools, with 24 (54.5% in the age bracket) enrolled. Conversely, the age group of 5 to 9 year old has the lowest likelihood of being enrolled in a private school, with 523 (100.0% in the age bracket) attending a public institution.
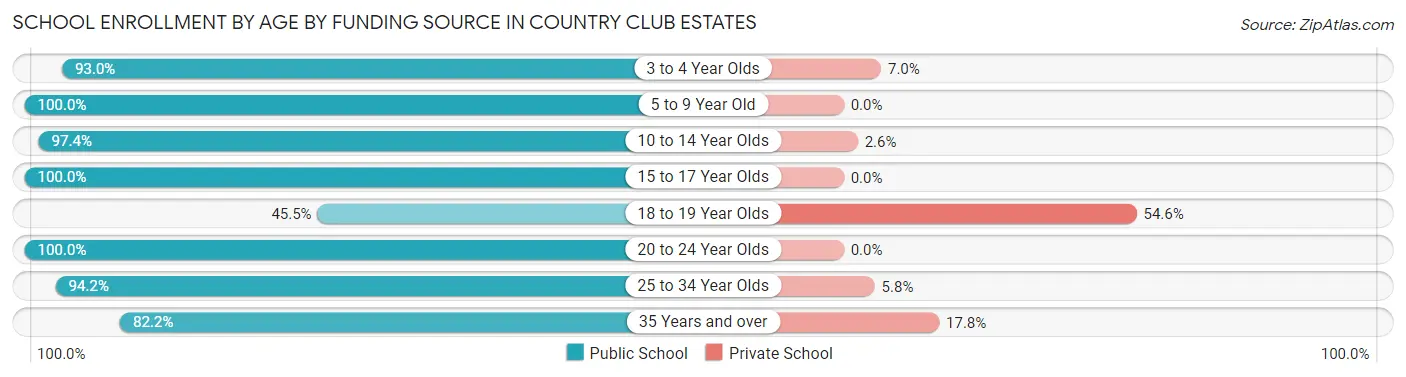
| Age Bracket | Public School | Private School |
| 3 to 4 Year Olds | 107 (93.0%) | 8 (7.0%) |
| 5 to 9 Year Old | 523 (100.0%) | 0 (0.0%) |
| 10 to 14 Year Olds | 483 (97.4%) | 13 (2.6%) |
| 15 to 17 Year Olds | 112 (100.0%) | 0 (0.0%) |
| 18 to 19 Year Olds | 20 (45.5%) | 24 (54.5%) |
| 20 to 24 Year Olds | 222 (100.0%) | 0 (0.0%) |
| 25 to 34 Year Olds | 245 (94.2%) | 15 (5.8%) |
| 35 Years and over | 111 (82.2%) | 24 (17.8%) |
| Total | 1,823 (95.6%) | 84 (4.4%) |
Educational Attainment by Field of Study in Country Club Estates
Business (336 | 32.6%), communications (91 | 8.8%), education (81 | 7.9%), liberal arts & history (81 | 7.9%), and bio, nature & agricultural (80 | 7.8%) are the most common fields of study among 1,031 individuals in Country Club Estates who have obtained a bachelor's degree or higher.
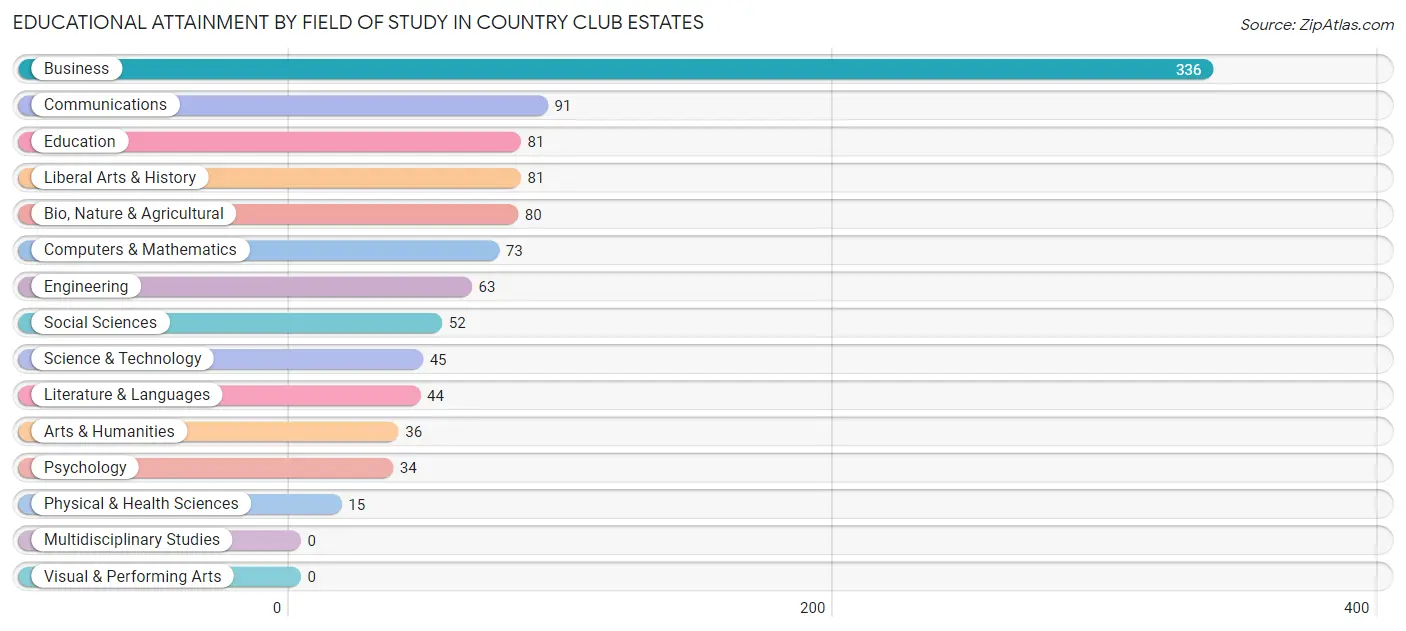
| Field of Study | # Graduates | % Graduates |
| Computers & Mathematics | 73 | 7.1% |
| Bio, Nature & Agricultural | 80 | 7.8% |
| Physical & Health Sciences | 15 | 1.5% |
| Psychology | 34 | 3.3% |
| Social Sciences | 52 | 5.0% |
| Engineering | 63 | 6.1% |
| Multidisciplinary Studies | 0 | 0.0% |
| Science & Technology | 45 | 4.4% |
| Business | 336 | 32.6% |
| Education | 81 | 7.9% |
| Literature & Languages | 44 | 4.3% |
| Liberal Arts & History | 81 | 7.9% |
| Visual & Performing Arts | 0 | 0.0% |
| Communications | 91 | 8.8% |
| Arts & Humanities | 36 | 3.5% |
| Total | 1,031 | 100.0% |
Transportation & Commute in Country Club Estates
Vehicle Availability by Sex in Country Club Estates
The most prevalent vehicle ownership categories in Country Club Estates are males with 1 vehicle (997, accounting for 43.4%) and females with 1 vehicle (873, making up 42.1%).
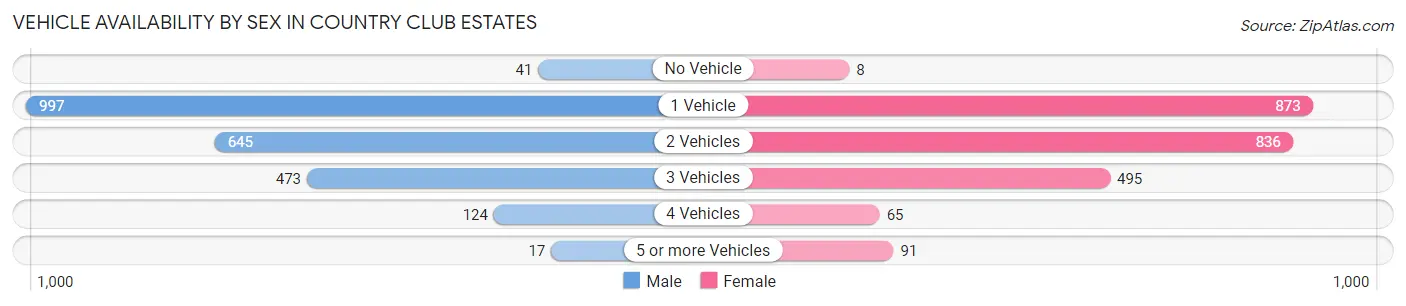
| Vehicles Available | Male | Female |
| No Vehicle | 41 (1.8%) | 8 (0.3%) |
| 1 Vehicle | 997 (43.4%) | 873 (36.9%) |
| 2 Vehicles | 645 (28.1%) | 836 (35.3%) |
| 3 Vehicles | 473 (20.6%) | 495 (20.9%) |
| 4 Vehicles | 124 (5.4%) | 65 (2.7%) |
| 5 or more Vehicles | 17 (0.7%) | 91 (3.8%) |
| Total | 2,297 (100.0%) | 2,368 (100.0%) |
Commute Time in Country Club Estates
The most frequently occuring commute durations in Country Club Estates are 10 to 14 minutes (1,229 commuters, 27.2%), 5 to 9 minutes (873 commuters, 19.3%), and 20 to 24 minutes (872 commuters, 19.3%).
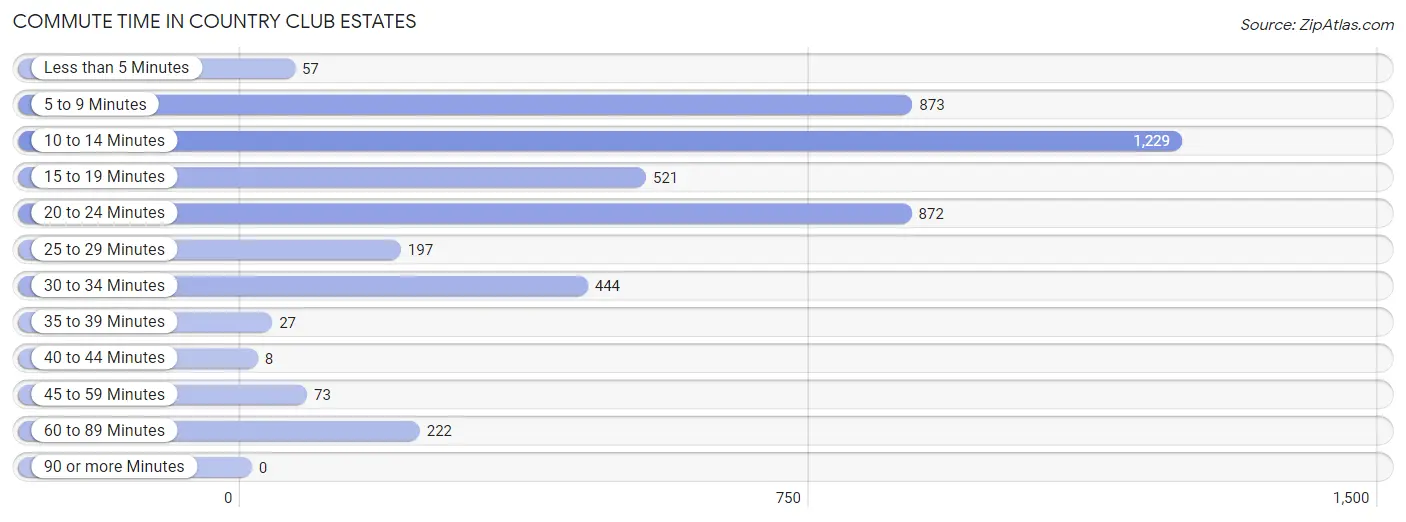
| Commute Time | # Commuters | % Commuters |
| Less than 5 Minutes | 57 | 1.3% |
| 5 to 9 Minutes | 873 | 19.3% |
| 10 to 14 Minutes | 1,229 | 27.2% |
| 15 to 19 Minutes | 521 | 11.5% |
| 20 to 24 Minutes | 872 | 19.3% |
| 25 to 29 Minutes | 197 | 4.4% |
| 30 to 34 Minutes | 444 | 9.8% |
| 35 to 39 Minutes | 27 | 0.6% |
| 40 to 44 Minutes | 8 | 0.2% |
| 45 to 59 Minutes | 73 | 1.6% |
| 60 to 89 Minutes | 222 | 4.9% |
| 90 or more Minutes | 0 | 0.0% |
Commute Time by Sex in Country Club Estates
The most common commute times in Country Club Estates are 20 to 24 minutes (461 commuters, 21.0%) for males and 10 to 14 minutes (777 commuters, 33.4%) for females.
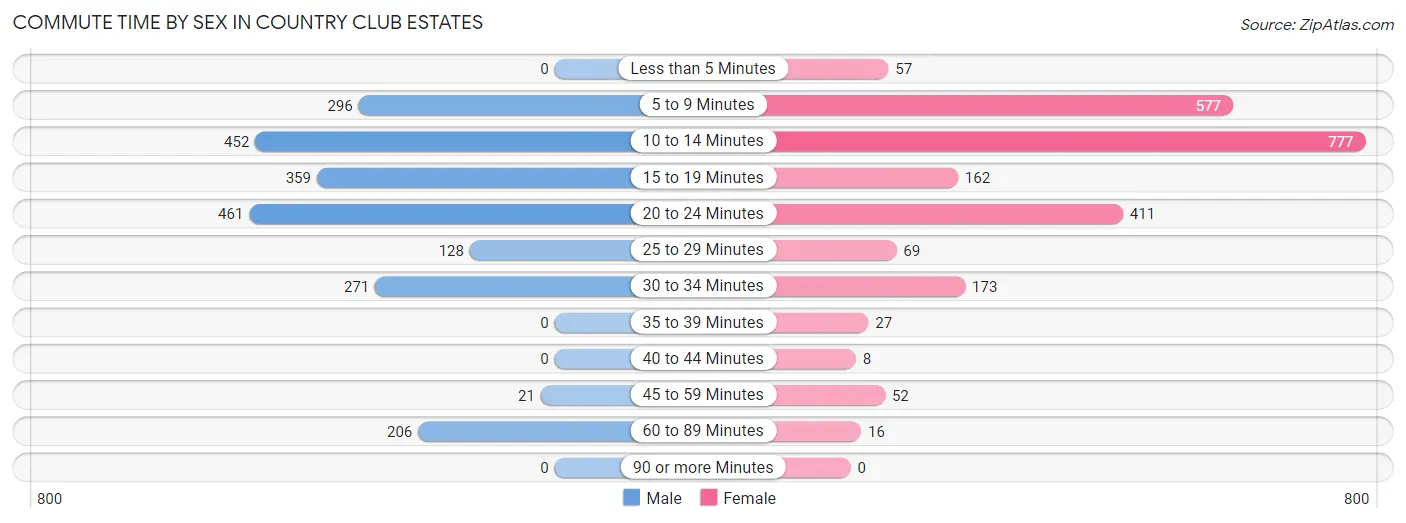
| Commute Time | Male | Female |
| Less than 5 Minutes | 0 (0.0%) | 57 (2.5%) |
| 5 to 9 Minutes | 296 (13.5%) | 577 (24.8%) |
| 10 to 14 Minutes | 452 (20.6%) | 777 (33.4%) |
| 15 to 19 Minutes | 359 (16.4%) | 162 (7.0%) |
| 20 to 24 Minutes | 461 (21.0%) | 411 (17.6%) |
| 25 to 29 Minutes | 128 (5.8%) | 69 (3.0%) |
| 30 to 34 Minutes | 271 (12.3%) | 173 (7.4%) |
| 35 to 39 Minutes | 0 (0.0%) | 27 (1.2%) |
| 40 to 44 Minutes | 0 (0.0%) | 8 (0.3%) |
| 45 to 59 Minutes | 21 (1.0%) | 52 (2.2%) |
| 60 to 89 Minutes | 206 (9.4%) | 16 (0.7%) |
| 90 or more Minutes | 0 (0.0%) | 0 (0.0%) |
Time of Departure to Work by Sex in Country Club Estates
The most frequent times of departure to work in Country Club Estates are 8:00 AM to 8:29 AM (356, 16.2%) for males and 8:00 AM to 8:29 AM (482, 20.7%) for females.
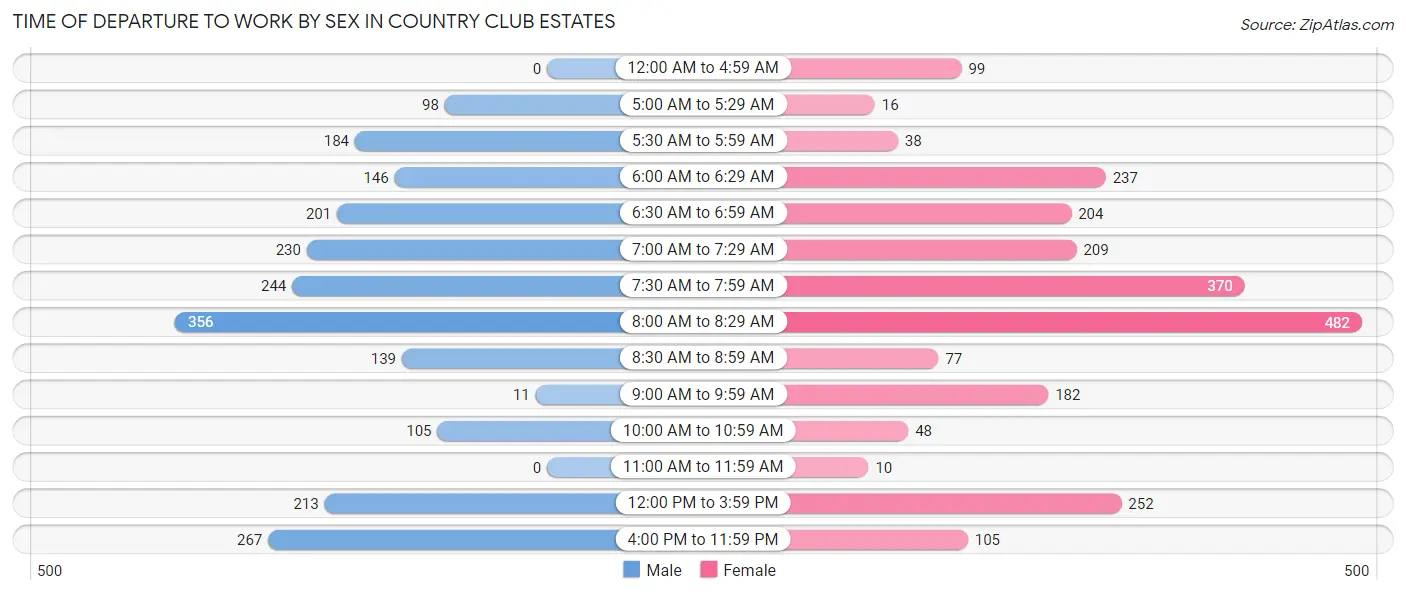
| Time of Departure | Male | Female |
| 12:00 AM to 4:59 AM | 0 (0.0%) | 99 (4.3%) |
| 5:00 AM to 5:29 AM | 98 (4.5%) | 16 (0.7%) |
| 5:30 AM to 5:59 AM | 184 (8.4%) | 38 (1.6%) |
| 6:00 AM to 6:29 AM | 146 (6.7%) | 237 (10.2%) |
| 6:30 AM to 6:59 AM | 201 (9.2%) | 204 (8.8%) |
| 7:00 AM to 7:29 AM | 230 (10.5%) | 209 (9.0%) |
| 7:30 AM to 7:59 AM | 244 (11.1%) | 370 (15.9%) |
| 8:00 AM to 8:29 AM | 356 (16.2%) | 482 (20.7%) |
| 8:30 AM to 8:59 AM | 139 (6.3%) | 77 (3.3%) |
| 9:00 AM to 9:59 AM | 11 (0.5%) | 182 (7.8%) |
| 10:00 AM to 10:59 AM | 105 (4.8%) | 48 (2.1%) |
| 11:00 AM to 11:59 AM | 0 (0.0%) | 10 (0.4%) |
| 12:00 PM to 3:59 PM | 213 (9.7%) | 252 (10.8%) |
| 4:00 PM to 11:59 PM | 267 (12.2%) | 105 (4.5%) |
| Total | 2,194 (100.0%) | 2,329 (100.0%) |
Housing Occupancy in Country Club Estates
Occupancy by Ownership in Country Club Estates
Of the total 3,674 dwellings in Country Club Estates, owner-occupied units account for 1,647 (44.8%), while renter-occupied units make up 2,027 (55.2%).
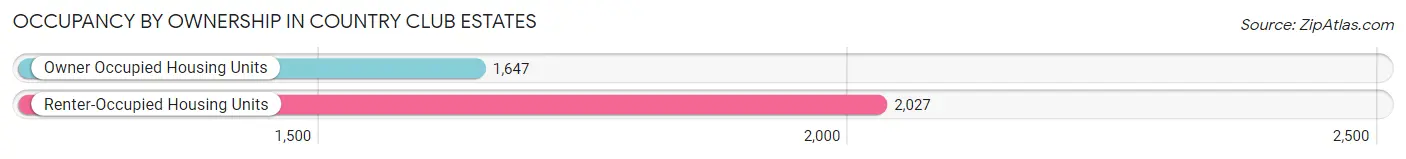
| Occupancy | # Housing Units | % Housing Units |
| Owner Occupied Housing Units | 1,647 | 44.8% |
| Renter-Occupied Housing Units | 2,027 | 55.2% |
| Total Occupied Housing Units | 3,674 | 100.0% |
Occupancy by Household Size in Country Club Estates
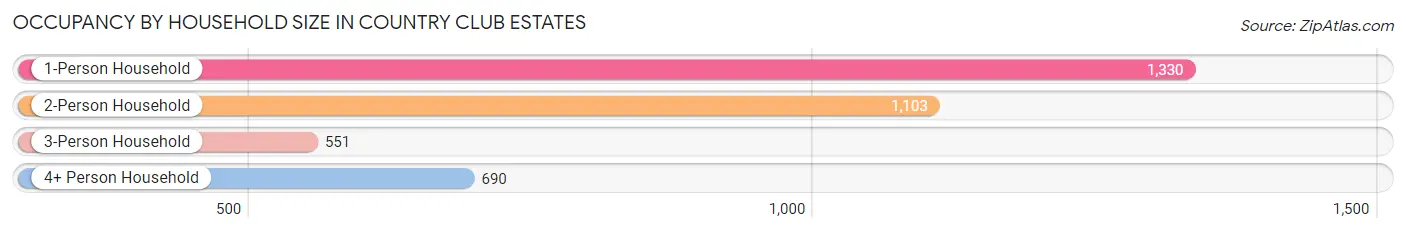
| Household Size | # Housing Units | % Housing Units |
| 1-Person Household | 1,330 | 36.2% |
| 2-Person Household | 1,103 | 30.0% |
| 3-Person Household | 551 | 15.0% |
| 4+ Person Household | 690 | 18.8% |
| Total Housing Units | 3,674 | 100.0% |
Occupancy by Ownership by Household Size in Country Club Estates
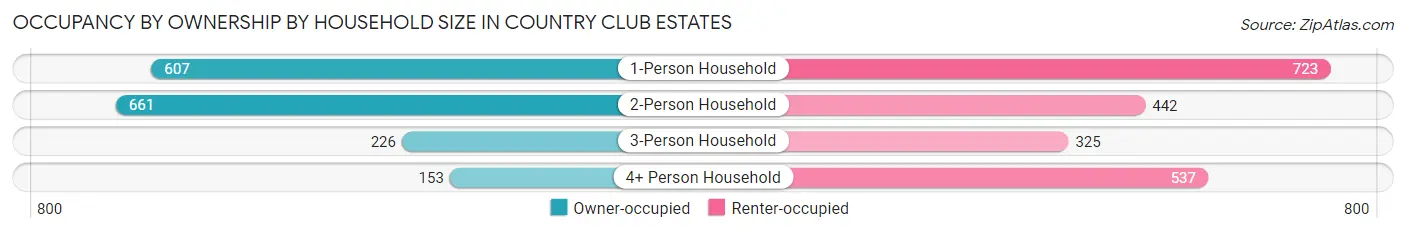
| Household Size | Owner-occupied | Renter-occupied |
| 1-Person Household | 607 (45.6%) | 723 (54.4%) |
| 2-Person Household | 661 (59.9%) | 442 (40.1%) |
| 3-Person Household | 226 (41.0%) | 325 (59.0%) |
| 4+ Person Household | 153 (22.2%) | 537 (77.8%) |
| Total Housing Units | 1,647 (44.8%) | 2,027 (55.2%) |
Occupancy by Educational Attainment in Country Club Estates
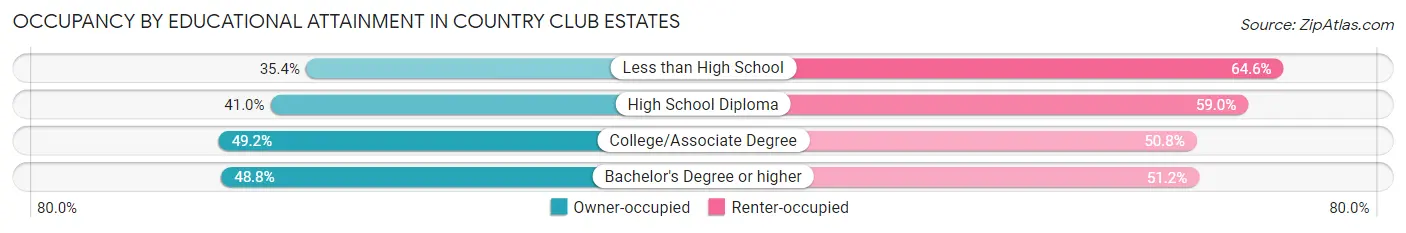
| Household Size | Owner-occupied | Renter-occupied |
| Less than High School | 182 (35.4%) | 332 (64.6%) |
| High School Diploma | 436 (41.0%) | 627 (59.0%) |
| College/Associate Degree | 705 (49.2%) | 728 (50.8%) |
| Bachelor's Degree or higher | 324 (48.8%) | 340 (51.2%) |
Occupancy by Age of Householder in Country Club Estates
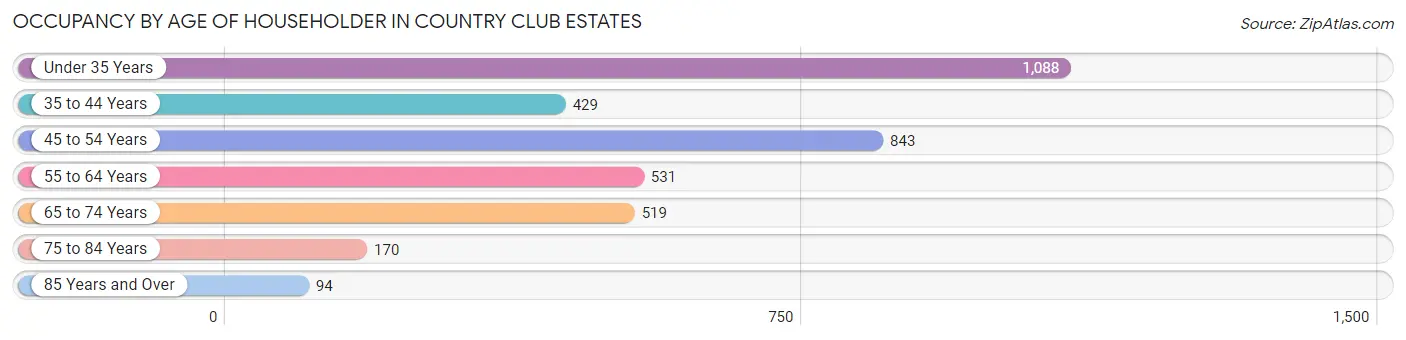
| Age Bracket | # Households | % Households |
| Under 35 Years | 1,088 | 29.6% |
| 35 to 44 Years | 429 | 11.7% |
| 45 to 54 Years | 843 | 23.0% |
| 55 to 64 Years | 531 | 14.4% |
| 65 to 74 Years | 519 | 14.1% |
| 75 to 84 Years | 170 | 4.6% |
| 85 Years and Over | 94 | 2.6% |
| Total | 3,674 | 100.0% |
Housing Finances in Country Club Estates
Median Income by Occupancy in Country Club Estates
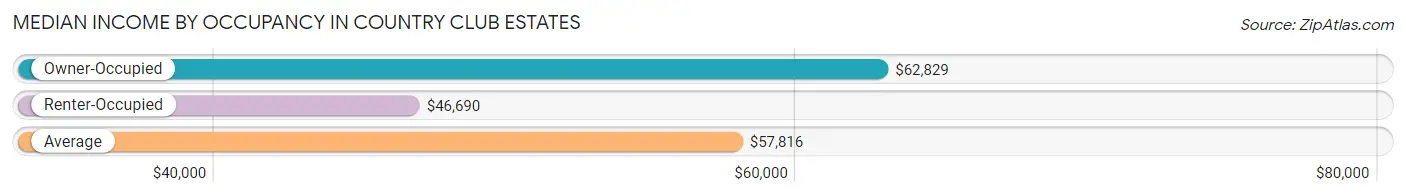
| Occupancy Type | # Households | Median Income |
| Owner-Occupied | 1,647 (44.8%) | $62,829 |
| Renter-Occupied | 2,027 (55.2%) | $46,690 |
| Average | 3,674 (100.0%) | $57,816 |
Occupancy by Householder Income Bracket in Country Club Estates
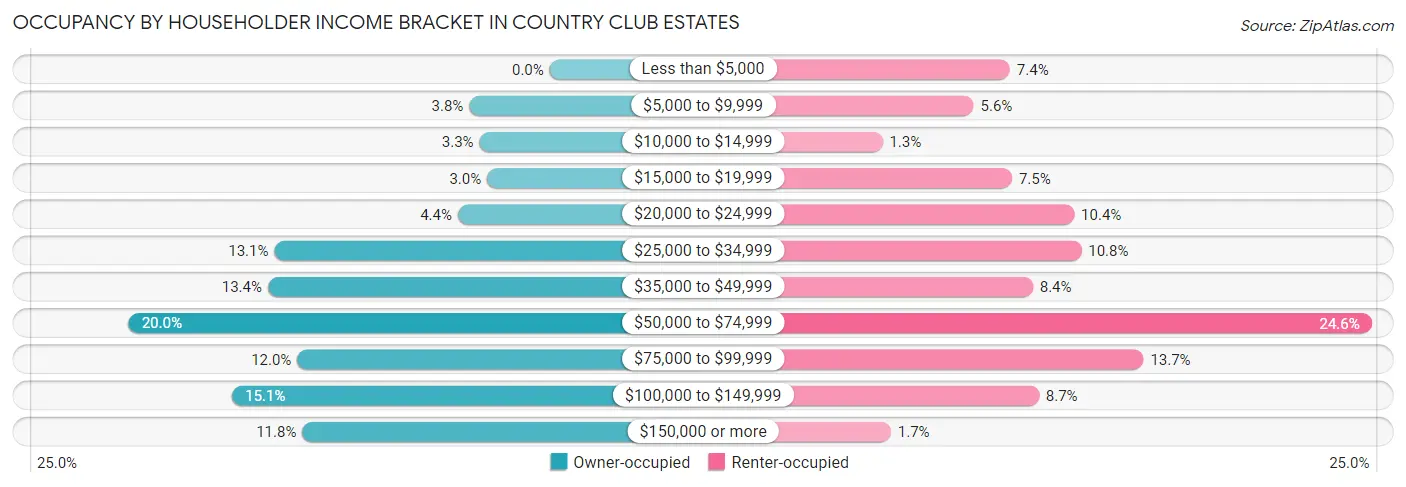
| Income Bracket | Owner-occupied | Renter-occupied |
| Less than $5,000 | 0 (0.0%) | 149 (7.3%) |
| $5,000 to $9,999 | 63 (3.8%) | 114 (5.6%) |
| $10,000 to $14,999 | 55 (3.3%) | 26 (1.3%) |
| $15,000 to $19,999 | 49 (3.0%) | 151 (7.4%) |
| $20,000 to $24,999 | 72 (4.4%) | 211 (10.4%) |
| $25,000 to $34,999 | 216 (13.1%) | 218 (10.7%) |
| $35,000 to $49,999 | 221 (13.4%) | 171 (8.4%) |
| $50,000 to $74,999 | 330 (20.0%) | 498 (24.6%) |
| $75,000 to $99,999 | 198 (12.0%) | 278 (13.7%) |
| $100,000 to $149,999 | 249 (15.1%) | 177 (8.7%) |
| $150,000 or more | 194 (11.8%) | 34 (1.7%) |
| Total | 1,647 (100.0%) | 2,027 (100.0%) |
Monthly Housing Cost Tiers in Country Club Estates
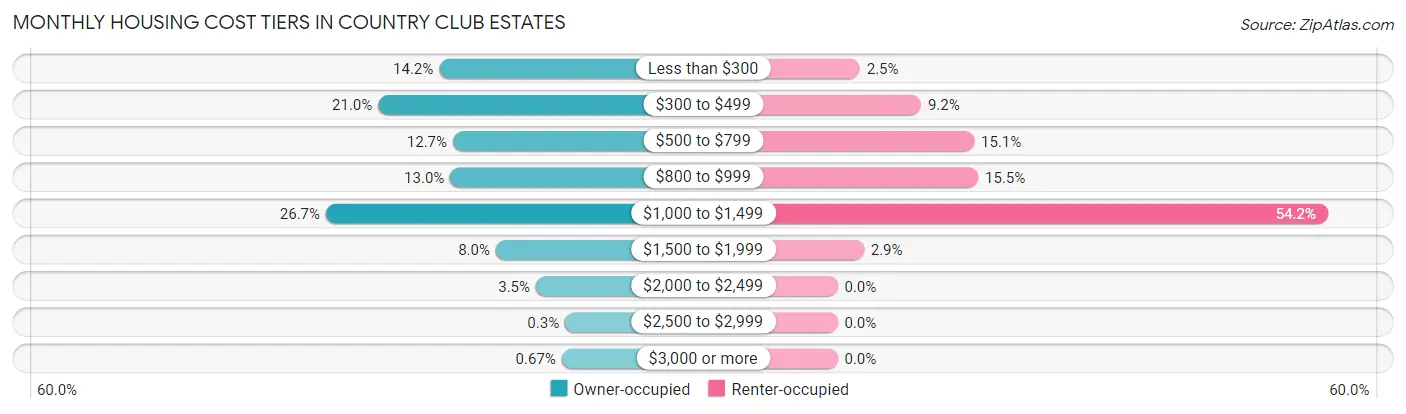
| Monthly Cost | Owner-occupied | Renter-occupied |
| Less than $300 | 234 (14.2%) | 50 (2.5%) |
| $300 to $499 | 345 (20.9%) | 187 (9.2%) |
| $500 to $799 | 209 (12.7%) | 306 (15.1%) |
| $800 to $999 | 214 (13.0%) | 315 (15.5%) |
| $1,000 to $1,499 | 440 (26.7%) | 1,098 (54.2%) |
| $1,500 to $1,999 | 131 (8.0%) | 59 (2.9%) |
| $2,000 to $2,499 | 58 (3.5%) | 0 (0.0%) |
| $2,500 to $2,999 | 5 (0.3%) | 0 (0.0%) |
| $3,000 or more | 11 (0.7%) | 0 (0.0%) |
| Total | 1,647 (100.0%) | 2,027 (100.0%) |
Physical Housing Characteristics in Country Club Estates
Housing Structures in Country Club Estates
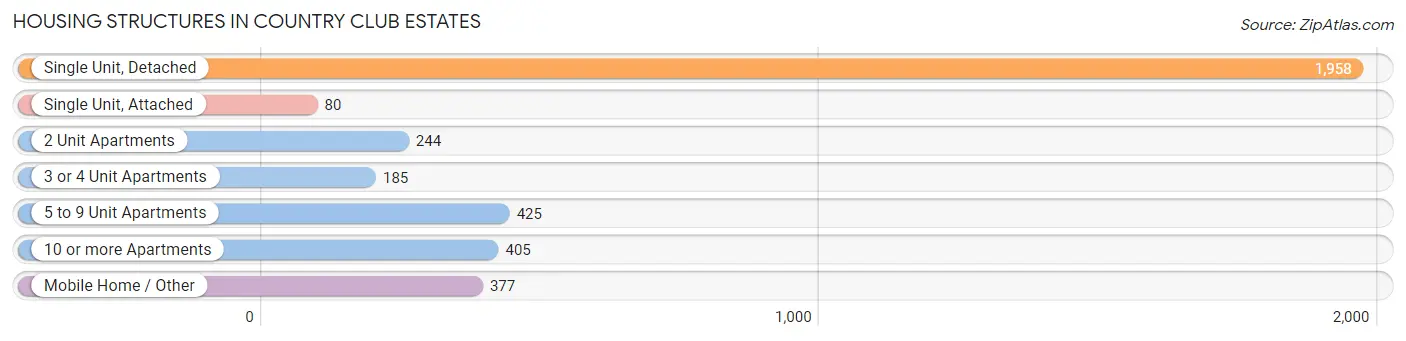
| Structure Type | # Housing Units | % Housing Units |
| Single Unit, Detached | 1,958 | 53.3% |
| Single Unit, Attached | 80 | 2.2% |
| 2 Unit Apartments | 244 | 6.6% |
| 3 or 4 Unit Apartments | 185 | 5.0% |
| 5 to 9 Unit Apartments | 425 | 11.6% |
| 10 or more Apartments | 405 | 11.0% |
| Mobile Home / Other | 377 | 10.3% |
| Total | 3,674 | 100.0% |
Housing Structures by Occupancy in Country Club Estates
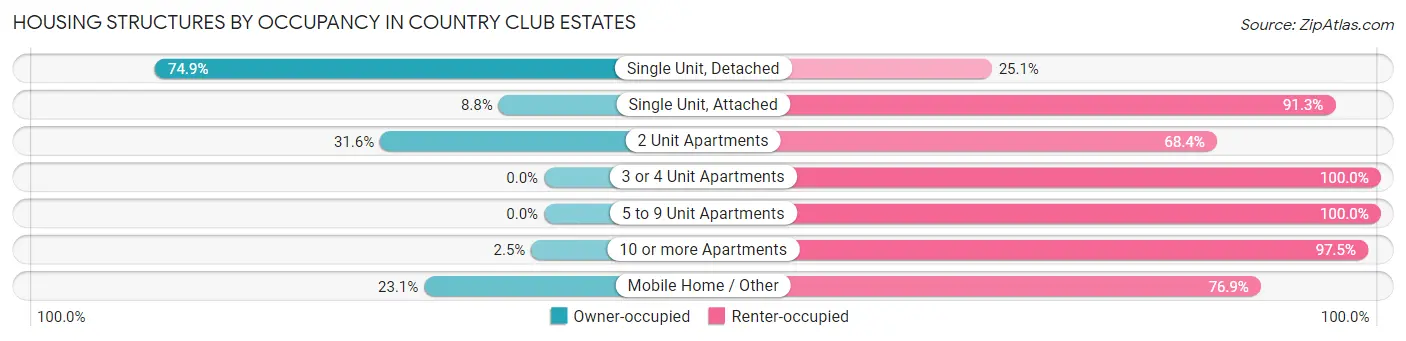
| Structure Type | Owner-occupied | Renter-occupied |
| Single Unit, Detached | 1,466 (74.9%) | 492 (25.1%) |
| Single Unit, Attached | 7 (8.7%) | 73 (91.2%) |
| 2 Unit Apartments | 77 (31.6%) | 167 (68.4%) |
| 3 or 4 Unit Apartments | 0 (0.0%) | 185 (100.0%) |
| 5 to 9 Unit Apartments | 0 (0.0%) | 425 (100.0%) |
| 10 or more Apartments | 10 (2.5%) | 395 (97.5%) |
| Mobile Home / Other | 87 (23.1%) | 290 (76.9%) |
| Total | 1,647 (44.8%) | 2,027 (55.2%) |
Housing Structures by Number of Rooms in Country Club Estates
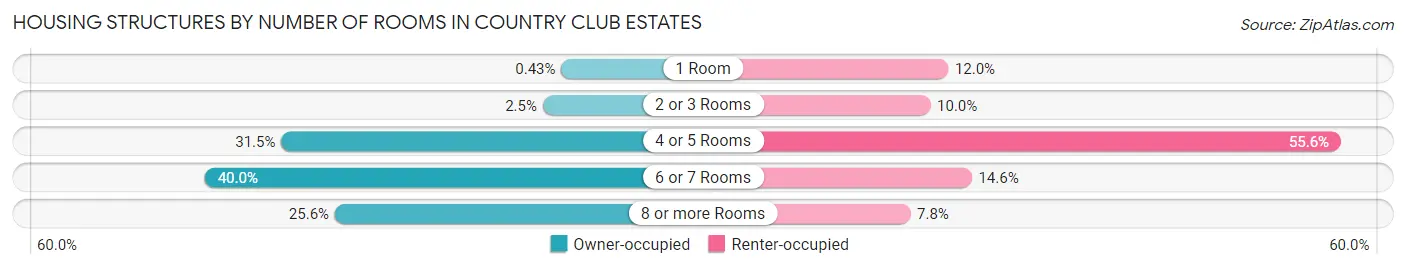
| Number of Rooms | Owner-occupied | Renter-occupied |
| 1 Room | 7 (0.4%) | 243 (12.0%) |
| 2 or 3 Rooms | 41 (2.5%) | 203 (10.0%) |
| 4 or 5 Rooms | 519 (31.5%) | 1,127 (55.6%) |
| 6 or 7 Rooms | 659 (40.0%) | 296 (14.6%) |
| 8 or more Rooms | 421 (25.6%) | 158 (7.8%) |
| Total | 1,647 (100.0%) | 2,027 (100.0%) |
Housing Structure by Heating Type in Country Club Estates
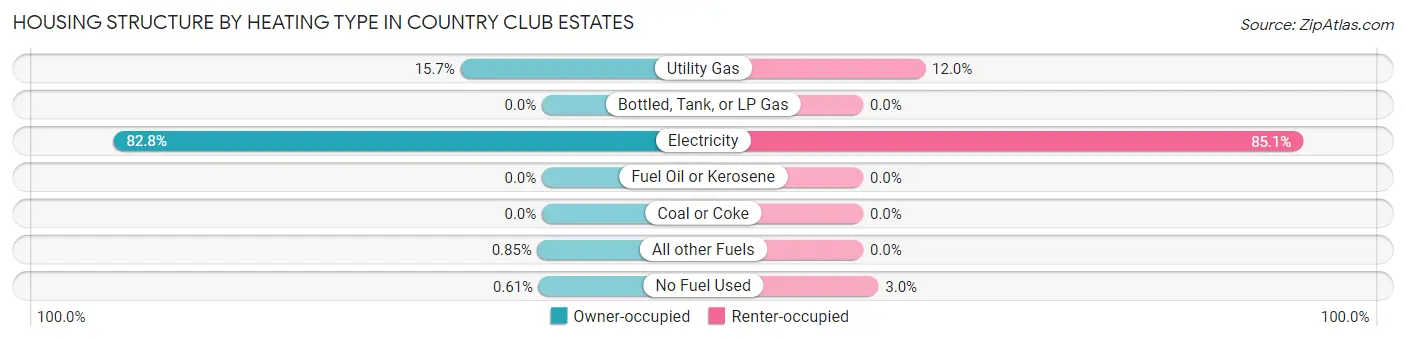
| Heating Type | Owner-occupied | Renter-occupied |
| Utility Gas | 259 (15.7%) | 243 (12.0%) |
| Bottled, Tank, or LP Gas | 0 (0.0%) | 0 (0.0%) |
| Electricity | 1,364 (82.8%) | 1,724 (85.1%) |
| Fuel Oil or Kerosene | 0 (0.0%) | 0 (0.0%) |
| Coal or Coke | 0 (0.0%) | 0 (0.0%) |
| All other Fuels | 14 (0.9%) | 0 (0.0%) |
| No Fuel Used | 10 (0.6%) | 60 (3.0%) |
| Total | 1,647 (100.0%) | 2,027 (100.0%) |
Household Vehicle Usage in Country Club Estates
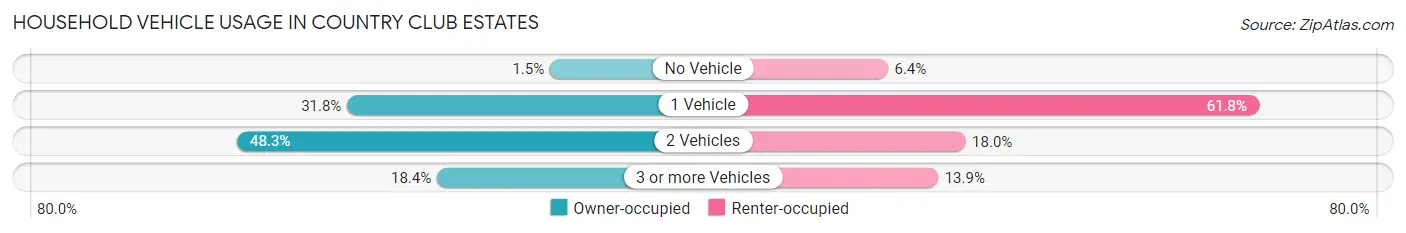
| Vehicles per Household | Owner-occupied | Renter-occupied |
| No Vehicle | 25 (1.5%) | 129 (6.4%) |
| 1 Vehicle | 524 (31.8%) | 1,253 (61.8%) |
| 2 Vehicles | 795 (48.3%) | 364 (18.0%) |
| 3 or more Vehicles | 303 (18.4%) | 281 (13.9%) |
| Total | 1,647 (100.0%) | 2,027 (100.0%) |
Real Estate & Mortgages in Country Club Estates
Real Estate and Mortgage Overview in Country Club Estates
| Characteristic | Without Mortgage | With Mortgage |
| Housing Units | 745 | 902 |
| Median Property Value | $116,800 | $161,000 |
| Median Household Income | $55,324 | $68 |
| Monthly Housing Costs | $426 | $0 |
| Real Estate Taxes | $706 | $66 |
Property Value by Mortgage Status in Country Club Estates
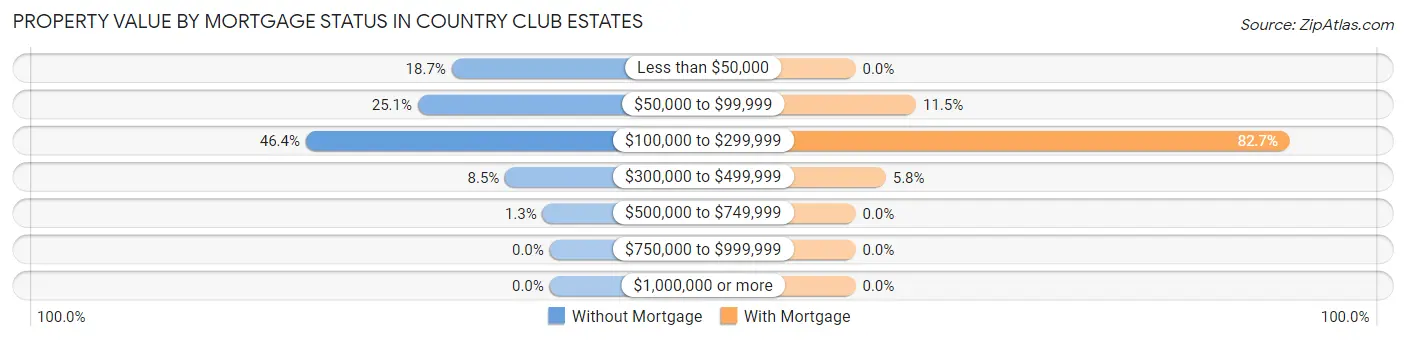
| Property Value | Without Mortgage | With Mortgage |
| Less than $50,000 | 139 (18.7%) | 0 (0.0%) |
| $50,000 to $99,999 | 187 (25.1%) | 104 (11.5%) |
| $100,000 to $299,999 | 346 (46.4%) | 746 (82.7%) |
| $300,000 to $499,999 | 63 (8.5%) | 52 (5.8%) |
| $500,000 to $749,999 | 10 (1.3%) | 0 (0.0%) |
| $750,000 to $999,999 | 0 (0.0%) | 0 (0.0%) |
| $1,000,000 or more | 0 (0.0%) | 0 (0.0%) |
| Total | 745 (100.0%) | 902 (100.0%) |
Household Income by Mortgage Status in Country Club Estates
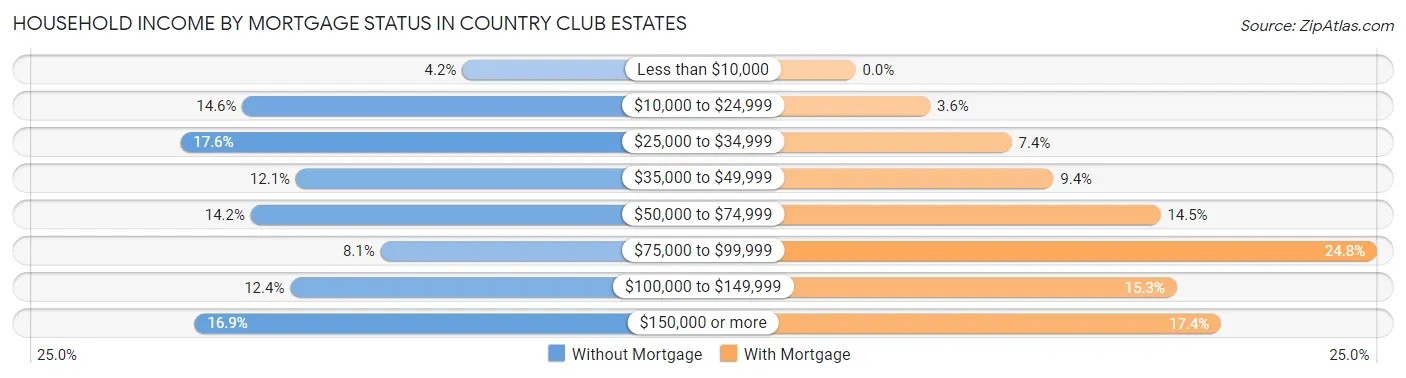
| Household Income | Without Mortgage | With Mortgage |
| Less than $10,000 | 31 (4.2%) | 0 (0.0%) |
| $10,000 to $24,999 | 109 (14.6%) | 32 (3.5%) |
| $25,000 to $34,999 | 131 (17.6%) | 67 (7.4%) |
| $35,000 to $49,999 | 90 (12.1%) | 85 (9.4%) |
| $50,000 to $74,999 | 106 (14.2%) | 131 (14.5%) |
| $75,000 to $99,999 | 60 (8.1%) | 224 (24.8%) |
| $100,000 to $149,999 | 92 (12.3%) | 138 (15.3%) |
| $150,000 or more | 126 (16.9%) | 157 (17.4%) |
| Total | 745 (100.0%) | 902 (100.0%) |
Property Value to Household Income Ratio in Country Club Estates
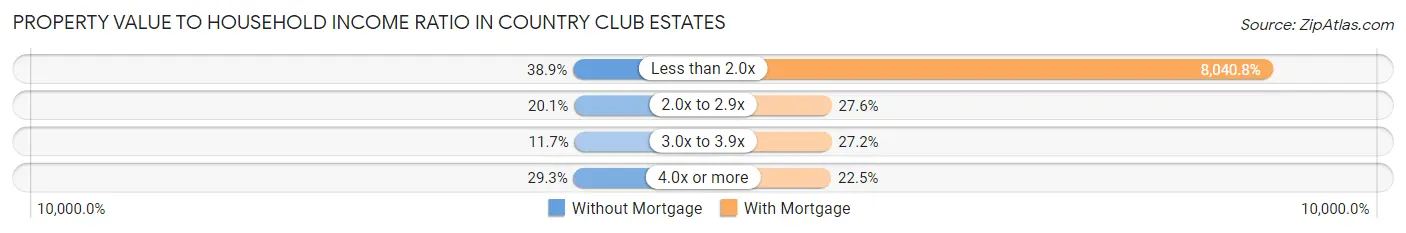
| Value-to-Income Ratio | Without Mortgage | With Mortgage |
| Less than 2.0x | 290 (38.9%) | 72,528 (8,040.8%) |
| 2.0x to 2.9x | 150 (20.1%) | 249 (27.6%) |
| 3.0x to 3.9x | 87 (11.7%) | 245 (27.2%) |
| 4.0x or more | 218 (29.3%) | 203 (22.5%) |
| Total | 745 (100.0%) | 902 (100.0%) |
Real Estate Taxes by Mortgage Status in Country Club Estates
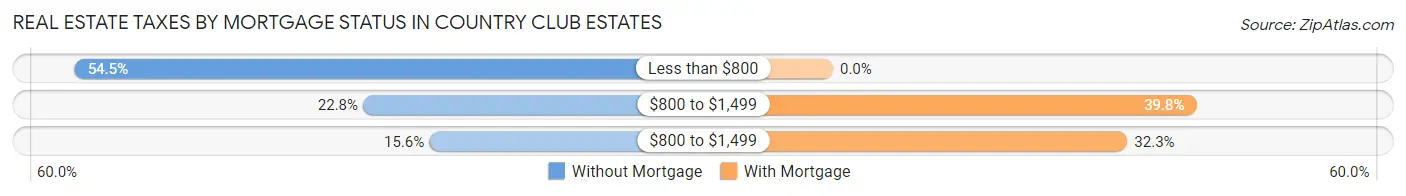
| Property Taxes | Without Mortgage | With Mortgage |
| Less than $800 | 406 (54.5%) | 0 (0.0%) |
| $800 to $1,499 | 170 (22.8%) | 359 (39.8%) |
| $800 to $1,499 | 116 (15.6%) | 291 (32.3%) |
| Total | 745 (100.0%) | 902 (100.0%) |
Health & Disability in Country Club Estates
Health Insurance Coverage by Age in Country Club Estates
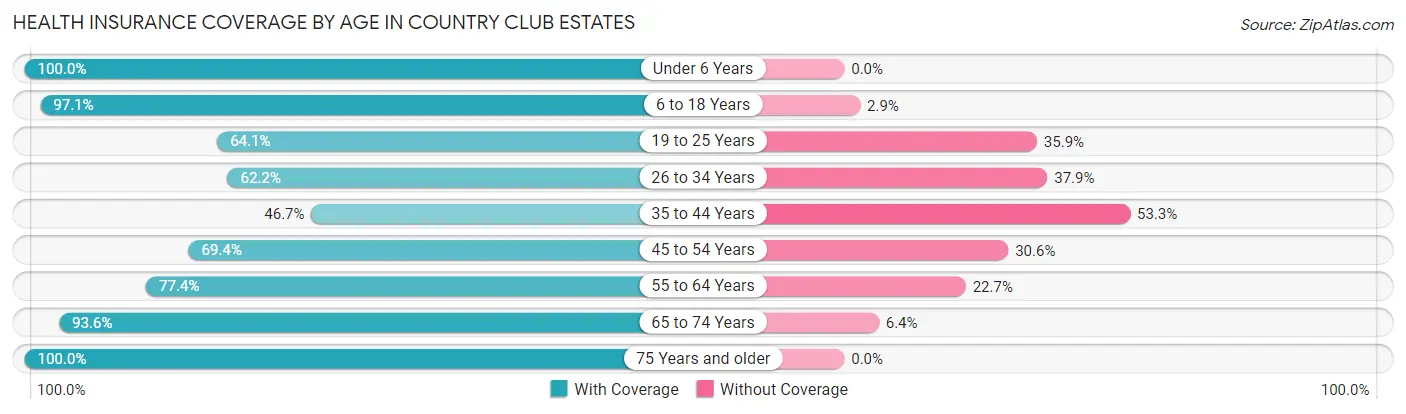
| Age Bracket | With Coverage | Without Coverage |
| Under 6 Years | 825 (100.0%) | 0 (0.0%) |
| 6 to 18 Years | 1,091 (97.1%) | 33 (2.9%) |
| 19 to 25 Years | 842 (64.1%) | 472 (35.9%) |
| 26 to 34 Years | 1,028 (62.2%) | 626 (37.9%) |
| 35 to 44 Years | 419 (46.7%) | 478 (53.3%) |
| 45 to 54 Years | 863 (69.4%) | 380 (30.6%) |
| 55 to 64 Years | 741 (77.3%) | 217 (22.7%) |
| 65 to 74 Years | 626 (93.6%) | 43 (6.4%) |
| 75 Years and older | 373 (100.0%) | 0 (0.0%) |
| Total | 6,808 (75.2%) | 2,249 (24.8%) |
Health Insurance Coverage by Citizenship Status in Country Club Estates
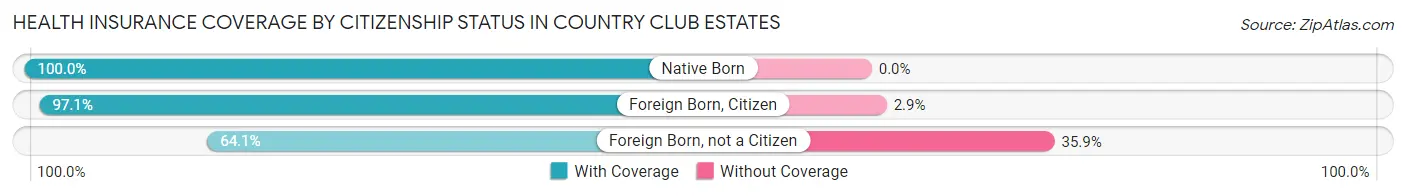
| Citizenship Status | With Coverage | Without Coverage |
| Native Born | 825 (100.0%) | 0 (0.0%) |
| Foreign Born, Citizen | 1,091 (97.1%) | 33 (2.9%) |
| Foreign Born, not a Citizen | 842 (64.1%) | 472 (35.9%) |
Health Insurance Coverage by Household Income in Country Club Estates
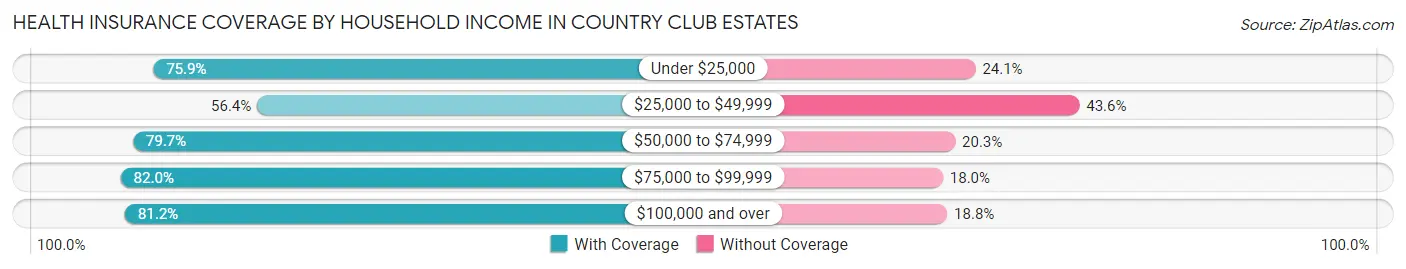
| Household Income | With Coverage | Without Coverage |
| Under $25,000 | 1,468 (75.9%) | 466 (24.1%) |
| $25,000 to $49,999 | 981 (56.4%) | 757 (43.6%) |
| $50,000 to $74,999 | 1,540 (79.7%) | 392 (20.3%) |
| $75,000 to $99,999 | 1,189 (82.0%) | 261 (18.0%) |
| $100,000 and over | 1,611 (81.2%) | 373 (18.8%) |
Public vs Private Health Insurance Coverage by Age in Country Club Estates
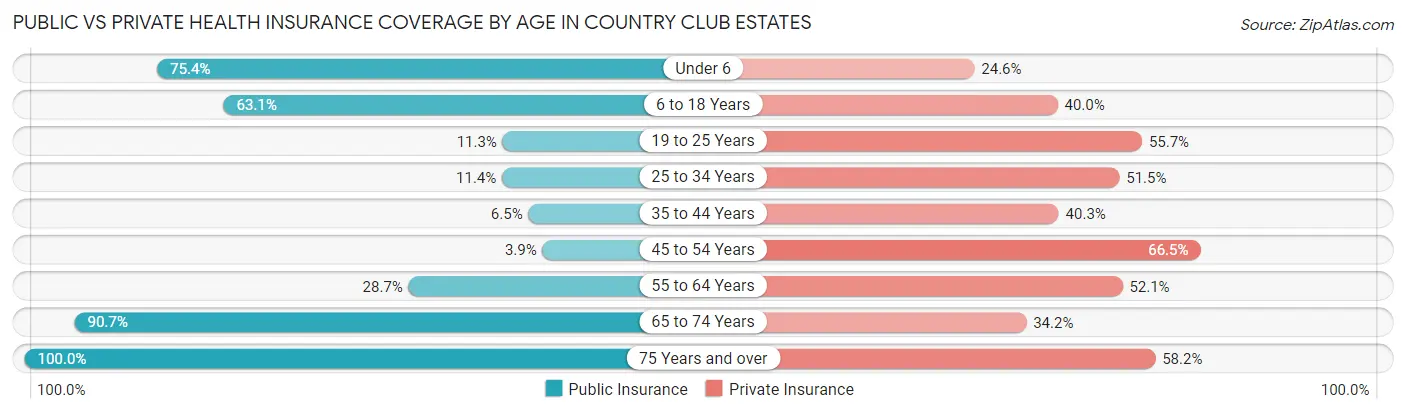
| Age Bracket | Public Insurance | Private Insurance |
| Under 6 | 622 (75.4%) | 203 (24.6%) |
| 6 to 18 Years | 709 (63.1%) | 450 (40.0%) |
| 19 to 25 Years | 148 (11.3%) | 732 (55.7%) |
| 25 to 34 Years | 188 (11.4%) | 852 (51.5%) |
| 35 to 44 Years | 58 (6.5%) | 361 (40.3%) |
| 45 to 54 Years | 48 (3.9%) | 827 (66.5%) |
| 55 to 64 Years | 275 (28.7%) | 499 (52.1%) |
| 65 to 74 Years | 607 (90.7%) | 229 (34.2%) |
| 75 Years and over | 373 (100.0%) | 217 (58.2%) |
| Total | 3,028 (33.4%) | 4,370 (48.2%) |
Disability Status by Sex by Age in Country Club Estates
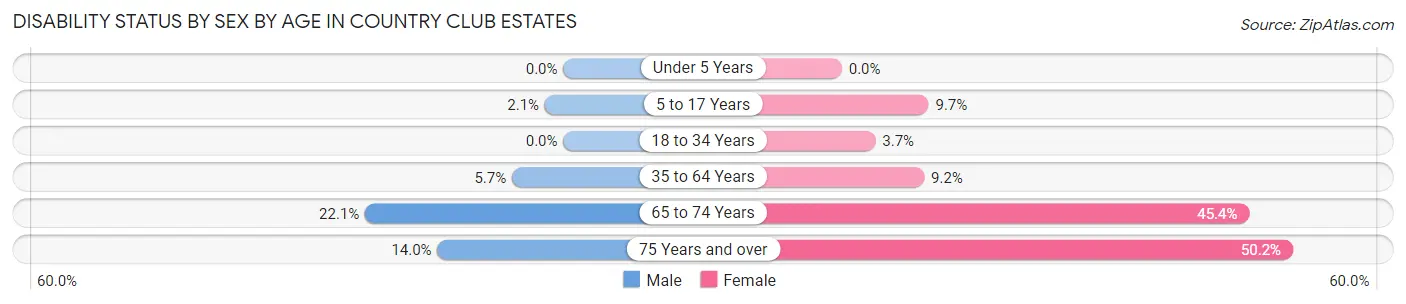
| Age Bracket | Male | Female |
| Under 5 Years | 0 (0.0%) | 0 (0.0%) |
| 5 to 17 Years | 13 (2.1%) | 48 (9.7%) |
| 18 to 34 Years | 0 (0.0%) | 69 (3.7%) |
| 35 to 64 Years | 76 (5.7%) | 162 (9.2%) |
| 65 to 74 Years | 64 (22.1%) | 172 (45.4%) |
| 75 Years and over | 23 (14.0%) | 105 (50.2%) |
Disability Class by Sex by Age in Country Club Estates
Disability Class: Hearing Difficulty
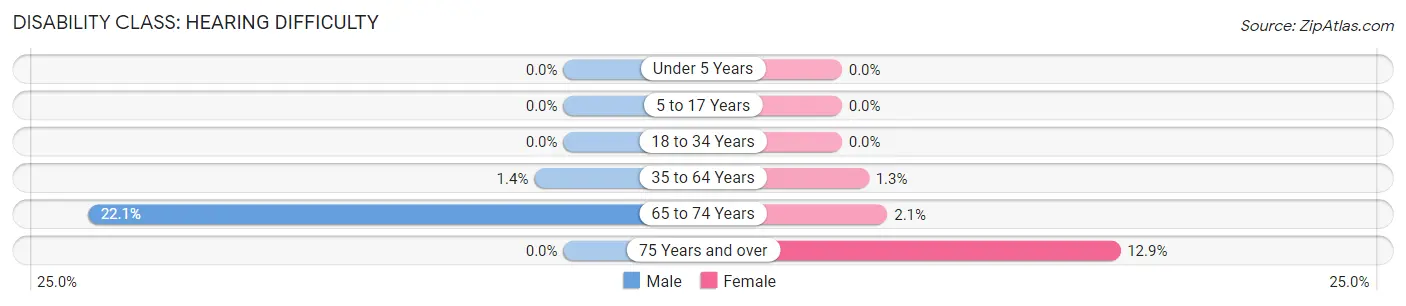
| Age Bracket | Male | Female |
| Under 5 Years | 0 (0.0%) | 0 (0.0%) |
| 5 to 17 Years | 0 (0.0%) | 0 (0.0%) |
| 18 to 34 Years | 0 (0.0%) | 0 (0.0%) |
| 35 to 64 Years | 18 (1.3%) | 22 (1.3%) |
| 65 to 74 Years | 64 (22.1%) | 8 (2.1%) |
| 75 Years and over | 0 (0.0%) | 27 (12.9%) |
Disability Class: Vision Difficulty
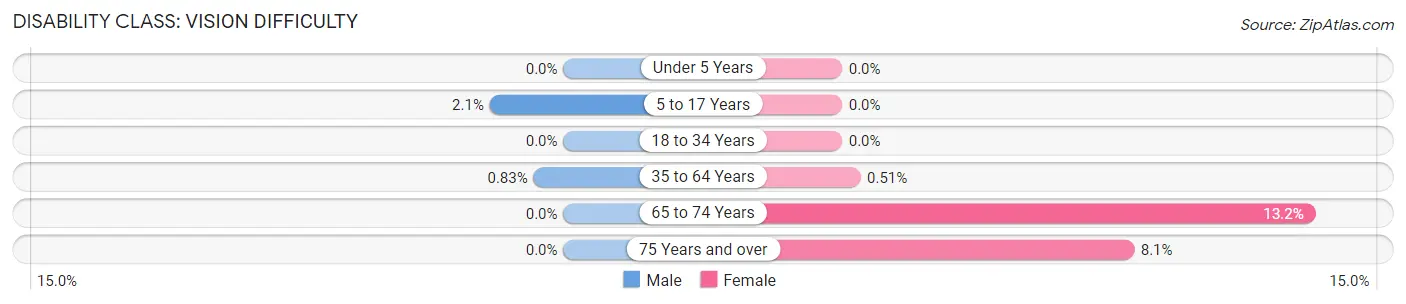
| Age Bracket | Male | Female |
| Under 5 Years | 0 (0.0%) | 0 (0.0%) |
| 5 to 17 Years | 13 (2.1%) | 0 (0.0%) |
| 18 to 34 Years | 0 (0.0%) | 0 (0.0%) |
| 35 to 64 Years | 11 (0.8%) | 9 (0.5%) |
| 65 to 74 Years | 0 (0.0%) | 50 (13.2%) |
| 75 Years and over | 0 (0.0%) | 17 (8.1%) |
Disability Class: Cognitive Difficulty
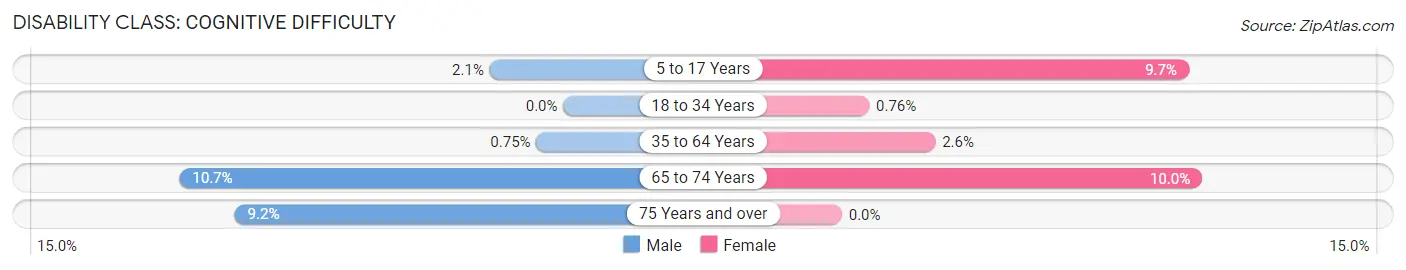
| Age Bracket | Male | Female |
| 5 to 17 Years | 13 (2.1%) | 48 (9.7%) |
| 18 to 34 Years | 0 (0.0%) | 14 (0.8%) |
| 35 to 64 Years | 10 (0.7%) | 46 (2.6%) |
| 65 to 74 Years | 31 (10.7%) | 38 (10.0%) |
| 75 Years and over | 15 (9.1%) | 0 (0.0%) |
Disability Class: Ambulatory Difficulty
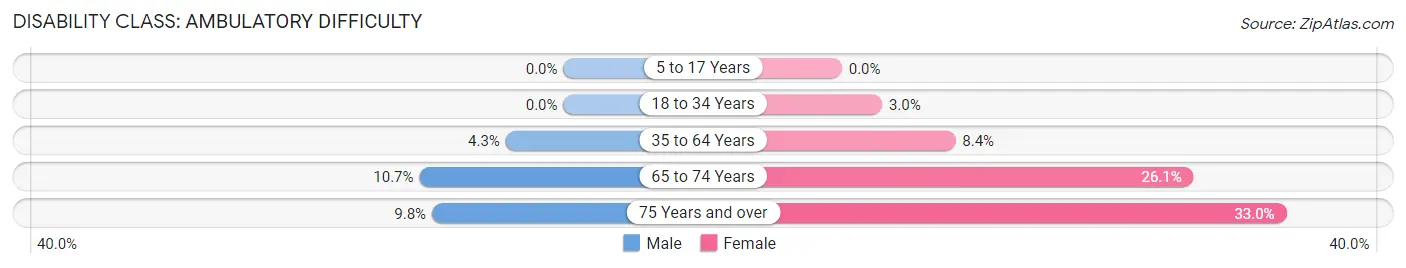
| Age Bracket | Male | Female |
| 5 to 17 Years | 0 (0.0%) | 0 (0.0%) |
| 18 to 34 Years | 0 (0.0%) | 55 (3.0%) |
| 35 to 64 Years | 57 (4.3%) | 149 (8.4%) |
| 65 to 74 Years | 31 (10.7%) | 99 (26.1%) |
| 75 Years and over | 16 (9.8%) | 69 (33.0%) |
Disability Class: Self-Care Difficulty
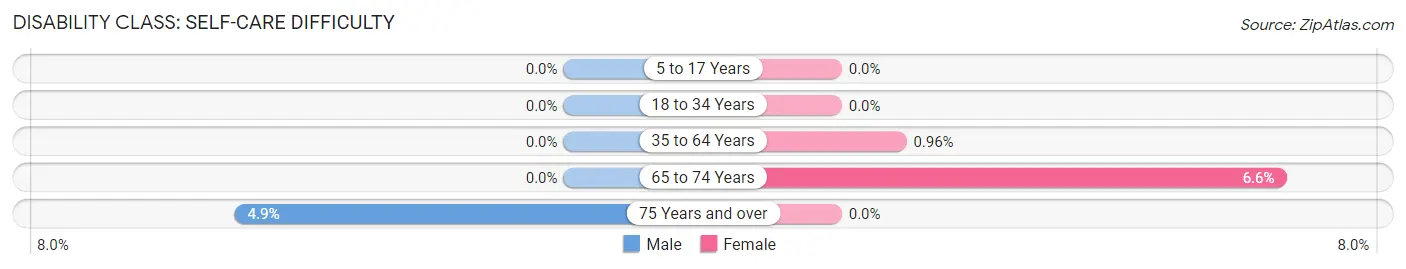
| Age Bracket | Male | Female |
| 5 to 17 Years | 0 (0.0%) | 0 (0.0%) |
| 18 to 34 Years | 0 (0.0%) | 0 (0.0%) |
| 35 to 64 Years | 0 (0.0%) | 17 (1.0%) |
| 65 to 74 Years | 0 (0.0%) | 25 (6.6%) |
| 75 Years and over | 8 (4.9%) | 0 (0.0%) |
Technology Access in Country Club Estates
Computing Device Access in Country Club Estates
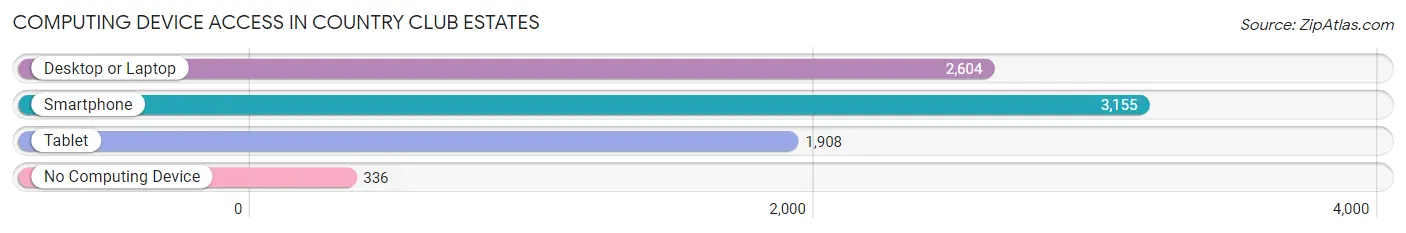
| Device Type | # Households | % Households |
| Desktop or Laptop | 2,604 | 70.9% |
| Smartphone | 3,155 | 85.9% |
| Tablet | 1,908 | 51.9% |
| No Computing Device | 336 | 9.1% |
| Total | 3,674 | 100.0% |
Internet Access in Country Club Estates
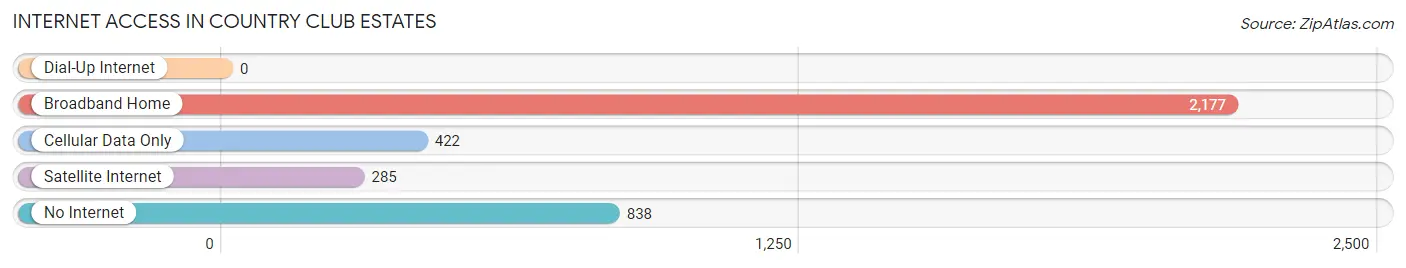
| Internet Type | # Households | % Households |
| Dial-Up Internet | 0 | 0.0% |
| Broadband Home | 2,177 | 59.3% |
| Cellular Data Only | 422 | 11.5% |
| Satellite Internet | 285 | 7.8% |
| No Internet | 838 | 22.8% |
| Total | 3,674 | 100.0% |
Country Club Estates Summary
Club Estates, Georgia is a small unincorporated community located in the northern part of Fulton County, Georgia. It is situated just south of the Chattahoochee River and is bordered by the cities of Sandy Springs and Roswell. The community is home to approximately 1,000 people and is known for its quiet, rural atmosphere.
History
Club Estates was founded in the late 1950s by a group of local businessmen who wanted to create a community that was both rural and upscale. The original plan was to build a golf course and a few homes, but the project quickly grew to include a variety of amenities, including a clubhouse, tennis courts, and a swimming pool. The community was officially incorporated in 1960 and has remained largely unchanged since then.
Geography
Club Estates is located in the northern part of Fulton County, Georgia, just south of the Chattahoochee River. It is bordered by the cities of Sandy Springs and Roswell. The community is situated on a plateau, with the highest elevation being around 1,000 feet above sea level. The area is mostly wooded, with a few open fields and meadows.
Economy
Club Estates is primarily a residential community, with most of its residents employed in the nearby cities of Sandy Springs and Roswell. The community does not have any major businesses or industries, but there are a few small shops and restaurants in the area.
Demographics
As of the 2010 census, Club Estates had a population of 1,000 people. The racial makeup of the community was 94.2% White, 2.2% African American, 0.7% Asian, 0.3% Native American, and 2.6% from other races. The median household income was $75,000, and the median home value was $400,000.
Conclusion
Club Estates, Georgia is a small, unincorporated community located in the northern part of Fulton County. It is known for its quiet, rural atmosphere and is home to approximately 1,000 people. The community was founded in the late 1950s and has remained largely unchanged since then. The economy is primarily residential, with most of its residents employed in the nearby cities of Sandy Springs and Roswell. The racial makeup of the community is mostly White, with a few other races represented. The median household income is $75,000 and the median home value is $400,000.
Common Questions
What is the Total Population of Country Club Estates?
Total Population of Country Club Estates is 9,057.
What is the Total Male Population of Country Club Estates?
Total Male Population of Country Club Estates is 3,944.
What is the Total Female Population of Country Club Estates?
Total Female Population of Country Club Estates is 5,113.
What is the Ratio of Males per 100 Females in Country Club Estates?
There are 77.14 Males per 100 Females in Country Club Estates.
What is the Ratio of Females per 100 Males in Country Club Estates?
There are 129.64 Females per 100 Males in Country Club Estates.
What is the Median Population Age in Country Club Estates?
Median Population Age in Country Club Estates is 31.3 Years.
What is the Average Family Size in Country Club Estates
Average Family Size in Country Club Estates is 3.2 People.
What is the Average Household Size in Country Club Estates
Average Household Size in Country Club Estates is 2.5 People.
What is Per Capita Income in Country Club Estates?
Per Capita income in Country Club Estates is $27,018.
What is the Median Family Income in Country Club Estates?
Median Family Income in Country Club Estates is $63,125.
What is the Median Household income in Country Club Estates?
Median Household Income in Country Club Estates is $57,816.
What is Income or Wage Gap in Country Club Estates?
Income or Wage Gap in Country Club Estates is 45.8%.
Women in Country Club Estates earn 54.2 cents for every dollar earned by a man.
What is Inequality or Gini Index in Country Club Estates?
Inequality or Gini Index in Country Club Estates is 0.42.
How Large is the Labor Force in Country Club Estates?
There are 5,011 People in the Labor Forcein in Country Club Estates.
What is the Percentage of People in the Labor Force in Country Club Estates?
69.0% of People are in the Labor Force in Country Club Estates.
What is the Unemployment Rate in Country Club Estates?
Unemployment Rate in Country Club Estates is 4.9%.