Cities with the Highest Poverty Level Among Married Couples in Georgia
RELATED REPORTS & OPTIONS
Highest Poverty | Married Couple
Georgia
Compare Cities
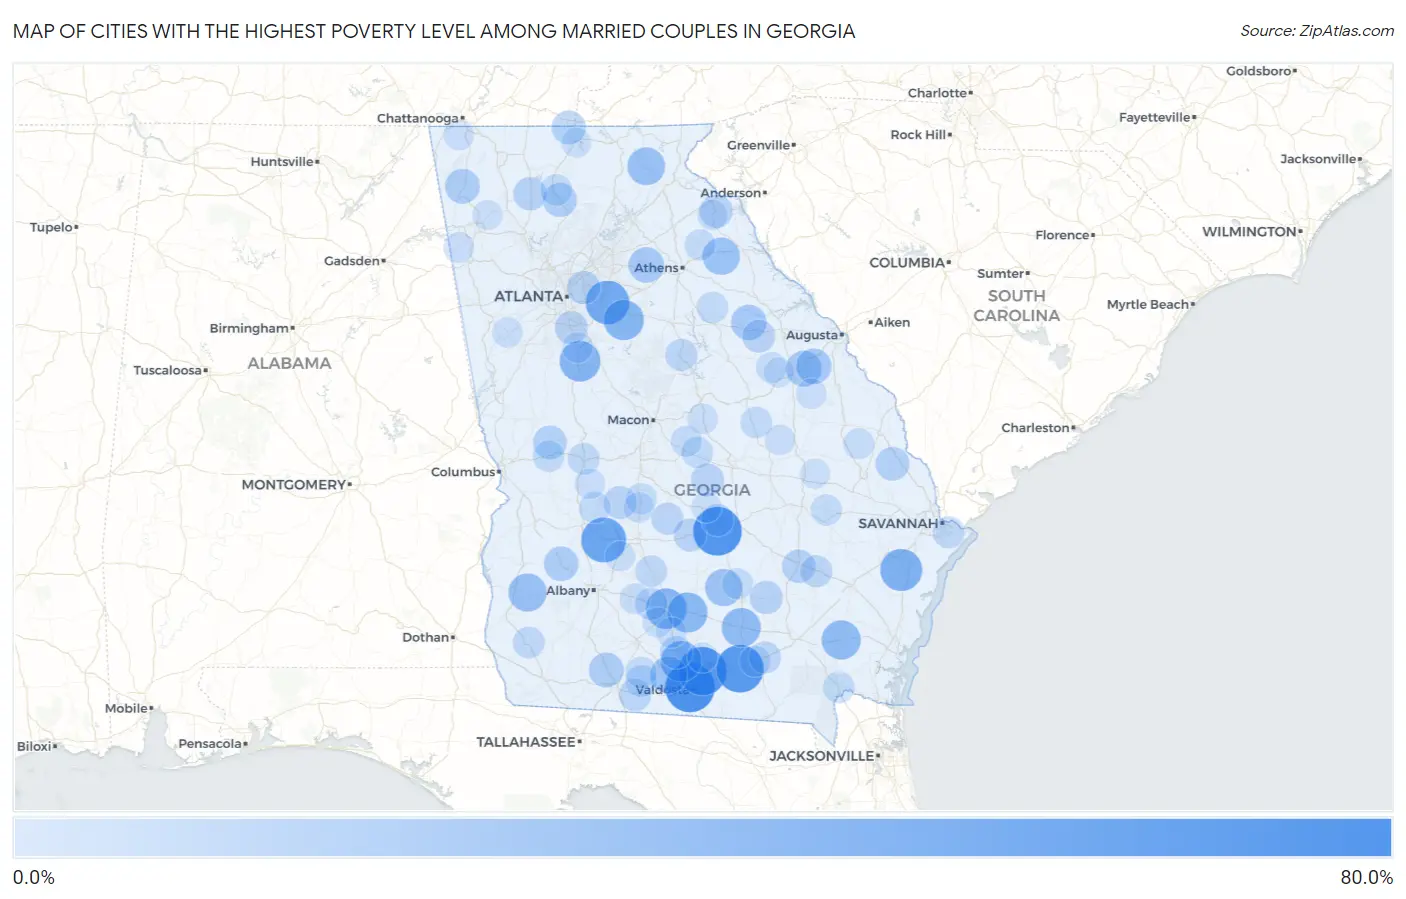
Map of Cities with the Highest Poverty Level Among Married Couples in Georgia
0.0%
80.0%
Cities with the Highest Poverty Level Among Married Couples in Georgia
| City | Married Couples Poverty | vs State | vs National | |
| 1. | Remerton | 66.1% | 4.8%(+61.3)#1 | 4.5%(+61.6)#202 |
| 2. | Juliette | 64.3% | 4.8%(+59.5)#2 | 4.5%(+59.8)#212 |
| 3. | Milan | 63.6% | 4.8%(+58.9)#3 | 4.5%(+59.2)#218 |
| 4. | Moody Afb | 62.6% | 4.8%(+57.9)#4 | 4.5%(+58.2)#227 |
| 5. | Du Pont | 60.7% | 4.8%(+55.9)#5 | 4.5%(+56.3)#254 |
| 6. | Hickox | 60.2% | 4.8%(+55.4)#6 | 4.5%(+55.7)#263 |
| 7. | De Soto | 53.3% | 4.8%(+48.6)#7 | 4.5%(+48.9)#345 |
| 8. | Lakeview Estates | 50.3% | 4.8%(+45.5)#8 | 4.5%(+45.8)#372 |
| 9. | Riceboro | 45.7% | 4.8%(+40.9)#9 | 4.5%(+41.2)#480 |
| 10. | Experiment | 42.6% | 4.8%(+37.9)#10 | 4.5%(+38.2)#553 |
| 11. | Cecil | 42.2% | 4.8%(+37.5)#11 | 4.5%(+37.8)#562 |
| 12. | Phillipsburg | 42.2% | 4.8%(+37.4)#12 | 4.5%(+37.7)#564 |
| 13. | Porterdale | 41.1% | 4.8%(+36.3)#13 | 4.5%(+36.6)#594 |
| 14. | Enigma | 40.8% | 4.8%(+36.1)#14 | 4.5%(+36.4)#601 |
| 15. | Nahunta | 38.3% | 4.8%(+33.5)#15 | 4.5%(+33.8)#696 |
| 16. | Pearson | 38.2% | 4.8%(+33.4)#16 | 4.5%(+33.7)#699 |
| 17. | Piney Grove | 35.6% | 4.8%(+30.8)#17 | 4.5%(+31.1)#784 |
| 18. | Edison | 35.5% | 4.8%(+30.7)#18 | 4.5%(+31.0)#787 |
| 19. | Sautee Nacoochee | 34.3% | 4.8%(+29.5)#19 | 4.5%(+29.8)#836 |
| 20. | Carlton | 33.8% | 4.8%(+29.1)#20 | 4.5%(+29.4)#851 |
| 21. | Ambrose | 33.3% | 4.8%(+28.6)#21 | 4.5%(+28.9)#879 |
| 22. | Morven | 32.8% | 4.8%(+28.0)#22 | 4.5%(+28.3)#910 |
| 23. | Matthews | 29.8% | 4.8%(+25.0)#23 | 4.5%(+25.3)#1,045 |
| 24. | Russell | 28.9% | 4.8%(+24.1)#24 | 4.5%(+24.4)#1,086 |
| 25. | Keysville | 28.6% | 4.8%(+23.8)#25 | 4.5%(+24.1)#1,109 |
| 26. | Sharon | 28.6% | 4.8%(+23.8)#26 | 4.5%(+24.1)#1,121 |
| 27. | Faceville | 28.0% | 4.8%(+23.2)#27 | 4.5%(+23.5)#1,170 |
| 28. | Trion | 27.0% | 4.8%(+22.2)#28 | 4.5%(+22.5)#1,249 |
| 29. | Ochlocknee | 26.8% | 4.8%(+22.1)#29 | 4.5%(+22.4)#1,260 |
| 30. | Dawson | 26.6% | 4.8%(+21.8)#30 | 4.5%(+22.1)#1,281 |
| 31. | Sterling | 26.0% | 4.8%(+21.2)#31 | 4.5%(+21.5)#1,331 |
| 32. | Jasper | 25.1% | 4.8%(+20.3)#32 | 4.5%(+20.6)#1,397 |
| 33. | Wildwood | 25.0% | 4.8%(+20.2)#33 | 4.5%(+20.5)#1,407 |
| 34. | Mccaysville | 24.9% | 4.8%(+20.1)#34 | 4.5%(+20.4)#1,466 |
| 35. | Talbotton | 24.4% | 4.8%(+19.7)#35 | 4.5%(+20.0)#1,496 |
| 36. | Oliver | 24.4% | 4.8%(+19.6)#36 | 4.5%(+19.9)#1,505 |
| 37. | Baxley | 23.5% | 4.8%(+18.7)#37 | 4.5%(+19.0)#1,616 |
| 38. | Ranger | 23.1% | 4.8%(+18.3)#38 | 4.5%(+18.6)#1,657 |
| 39. | Clarkston | 22.9% | 4.8%(+18.1)#39 | 4.5%(+18.4)#1,675 |
| 40. | Nicholls | 22.8% | 4.8%(+18.0)#40 | 4.5%(+18.3)#1,690 |
| 41. | Bristol | 22.7% | 4.8%(+18.0)#41 | 4.5%(+18.3)#1,701 |
| 42. | Abbeville | 22.2% | 4.8%(+17.5)#42 | 4.5%(+17.8)#1,741 |
| 43. | Chester | 22.2% | 4.8%(+17.5)#43 | 4.5%(+17.8)#1,742 |
| 44. | Bowersville | 22.2% | 4.8%(+17.5)#44 | 4.5%(+17.8)#1,747 |
| 45. | Dooling | 22.2% | 4.8%(+17.5)#45 | 4.5%(+17.8)#1,775 |
| 46. | Jonesboro | 22.1% | 4.8%(+17.3)#46 | 4.5%(+17.6)#1,786 |
| 47. | Norwood | 21.6% | 4.8%(+16.9)#47 | 4.5%(+17.2)#1,842 |
| 48. | Adel | 21.4% | 4.8%(+16.6)#48 | 4.5%(+16.9)#1,872 |
| 49. | Boston | 20.9% | 4.8%(+16.1)#49 | 4.5%(+16.4)#1,915 |
| 50. | Chauncey | 20.6% | 4.8%(+15.8)#50 | 4.5%(+16.1)#1,966 |
| 51. | Ty Ty | 20.5% | 4.8%(+15.8)#51 | 4.5%(+16.1)#1,976 |
| 52. | Eatonton | 20.5% | 4.8%(+15.7)#52 | 4.5%(+16.0)#1,986 |
| 53. | Pineview | 20.3% | 4.8%(+15.5)#53 | 4.5%(+15.8)#2,008 |
| 54. | Argyle | 20.0% | 4.8%(+15.2)#54 | 4.5%(+15.5)#2,036 |
| 55. | Surrency | 20.0% | 4.8%(+15.2)#55 | 4.5%(+15.5)#2,049 |
| 56. | Ashburn | 19.5% | 4.8%(+14.8)#56 | 4.5%(+15.1)#2,132 |
| 57. | Colquitt | 19.3% | 4.8%(+14.5)#57 | 4.5%(+14.8)#2,170 |
| 58. | Dutch Island | 19.3% | 4.8%(+14.5)#58 | 4.5%(+14.8)#2,171 |
| 59. | Butler | 19.1% | 4.8%(+14.3)#59 | 4.5%(+14.6)#2,195 |
| 60. | Barwick | 18.9% | 4.8%(+14.2)#60 | 4.5%(+14.5)#2,229 |
| 61. | Harrison | 18.8% | 4.8%(+14.0)#61 | 4.5%(+14.3)#2,253 |
| 62. | Woodville | 18.8% | 4.8%(+14.0)#62 | 4.5%(+14.3)#2,256 |
| 63. | Geneva | 18.8% | 4.8%(+14.0)#63 | 4.5%(+14.3)#2,261 |
| 64. | Talking Rock | 18.8% | 4.8%(+14.0)#64 | 4.5%(+14.3)#2,263 |
| 65. | Folkston | 18.6% | 4.8%(+13.8)#65 | 4.5%(+14.1)#2,288 |
| 66. | Andersonville | 18.5% | 4.8%(+13.7)#66 | 4.5%(+14.1)#2,300 |
| 67. | Pavo | 18.3% | 4.8%(+13.5)#67 | 4.5%(+13.8)#2,345 |
| 68. | Danville | 18.2% | 4.8%(+13.4)#68 | 4.5%(+13.7)#2,364 |
| 69. | Collins | 17.9% | 4.8%(+13.1)#69 | 4.5%(+13.4)#2,437 |
| 70. | Homerville | 17.8% | 4.8%(+13.0)#70 | 4.5%(+13.3)#2,457 |
| 71. | Jeffersonville | 17.8% | 4.8%(+13.0)#71 | 4.5%(+13.3)#2,465 |
| 72. | Danielsville | 17.6% | 4.8%(+12.8)#72 | 4.5%(+13.1)#2,495 |
| 73. | Unadilla | 17.5% | 4.8%(+12.7)#73 | 4.5%(+13.0)#2,518 |
| 74. | Cusseta Chattahoochee County Unified Government | 17.3% | 4.8%(+12.6)#74 | 4.5%(+12.9)#2,548 |
| 75. | Broxton | 17.3% | 4.8%(+12.5)#75 | 4.5%(+12.9)#2,553 |
| 76. | Rocky Ford | 17.2% | 4.8%(+12.5)#76 | 4.5%(+12.8)#2,564 |
| 77. | Hampton | 17.1% | 4.8%(+12.4)#77 | 4.5%(+12.7)#2,591 |
| 78. | Gibson | 17.1% | 4.8%(+12.3)#78 | 4.5%(+12.6)#2,600 |
| 79. | Poulan | 16.5% | 4.8%(+11.7)#79 | 4.5%(+12.0)#2,733 |
| 80. | Webster County Unified Government | 16.4% | 4.8%(+11.7)#80 | 4.5%(+12.0)#2,736 |
| 81. | Mcintyre | 16.4% | 4.8%(+11.7)#81 | 4.5%(+12.0)#2,737 |
| 82. | Dixie | 16.3% | 4.8%(+11.6)#82 | 4.5%(+11.9)#2,769 |
| 83. | Whitesburg | 16.3% | 4.8%(+11.5)#83 | 4.5%(+11.8)#2,774 |
| 84. | Lenox | 16.3% | 4.8%(+11.5)#84 | 4.5%(+11.8)#2,779 |
| 85. | Pinehurst | 16.2% | 4.8%(+11.4)#85 | 4.5%(+11.8)#2,787 |
| 86. | Cave Spring | 16.2% | 4.8%(+11.4)#86 | 4.5%(+11.7)#2,797 |
| 87. | Canon | 16.0% | 4.8%(+11.2)#87 | 4.5%(+11.5)#2,831 |
| 88. | Ideal | 16.0% | 4.8%(+11.2)#88 | 4.5%(+11.5)#2,835 |
| 89. | Box Springs | 16.0% | 4.8%(+11.2)#89 | 4.5%(+11.5)#2,842 |
| 90. | Chattanooga Valley | 16.0% | 4.8%(+11.2)#90 | 4.5%(+11.5)#2,855 |
| 91. | Kite | 15.8% | 4.8%(+11.0)#91 | 4.5%(+11.3)#2,896 |
| 92. | Vidette | 15.8% | 4.8%(+11.0)#92 | 4.5%(+11.3)#2,898 |
| 93. | Shannon | 15.6% | 4.8%(+10.8)#93 | 4.5%(+11.1)#2,947 |
| 94. | Blue Ridge | 15.6% | 4.8%(+10.8)#94 | 4.5%(+11.1)#2,953 |
| 95. | Warwick | 15.5% | 4.8%(+10.8)#95 | 4.5%(+11.1)#2,962 |
| 96. | Eastman | 15.4% | 4.8%(+10.6)#96 | 4.5%(+10.9)#2,986 |
| 97. | Ray City | 15.4% | 4.8%(+10.6)#97 | 4.5%(+10.9)#2,993 |
| 98. | Stillmore | 15.4% | 4.8%(+10.6)#98 | 4.5%(+10.9)#2,995 |
| 99. | Avera | 15.3% | 4.8%(+10.5)#99 | 4.5%(+10.8)#3,026 |
| 100. | Omega | 15.2% | 4.8%(+10.4)#100 | 4.5%(+10.7)#3,041 |
Common Questions
What are the Top 10 Cities with the Highest Poverty Level Among Married Couples in Georgia?
Top 10 Cities with the Highest Poverty Level Among Married Couples in Georgia are:
#1
66.1%
#2
63.6%
#3
62.6%
#4
60.7%
#5
53.3%
#6
50.3%
#7
45.7%
#8
42.6%
#9
42.2%
#10
42.2%
What city has the Highest Poverty Level Among Married Couples in Georgia?
Remerton has the Highest Poverty Level Among Married Couples in Georgia with 66.1%.
What is the Poverty Level Among Married Couples in the State of Georgia?
Poverty Level Among Married Couples in Georgia is 4.8%.
What is the Poverty Level Among Married Couples in the United States?
Poverty Level Among Married Couples in the United States is 4.5%.