Hallwood, VA
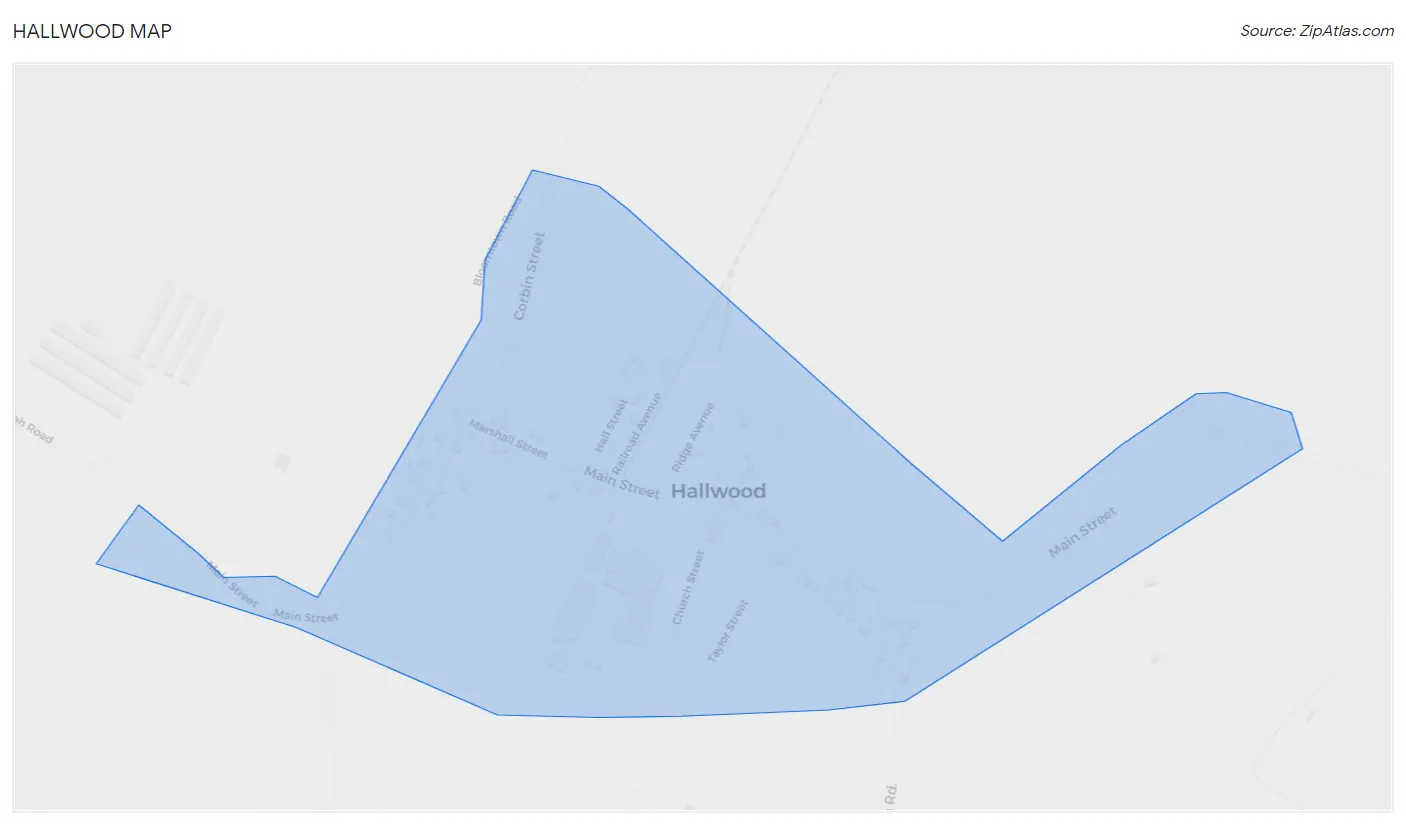
Hallwood Map
Hallwood Overview
172
TOTAL POPULATION
70
MALE POPULATION
102
FEMALE POPULATION
68.63
MALES / 100 FEMALES
145.71
FEMALES / 100 MALES
40.3
MEDIAN AGE
4.1
AVG FAMILY SIZE
2.4
AVG HOUSEHOLD SIZE
$23,399
PER CAPITA INCOME
$68,750
AVG FAMILY INCOME
$39,107
AVG HOUSEHOLD INCOME
42.1%
WAGE / INCOME GAP [ % ]
57.9¢/ $1
WAGE / INCOME GAP [ $ ]
0.36
INEQUALITY / GINI INDEX
76
LABOR FORCE [ PEOPLE ]
54.3%
PERCENT IN LABOR FORCE
2.6%
UNEMPLOYMENT RATE
Hallwood Zip Codes
Hallwood Area Codes
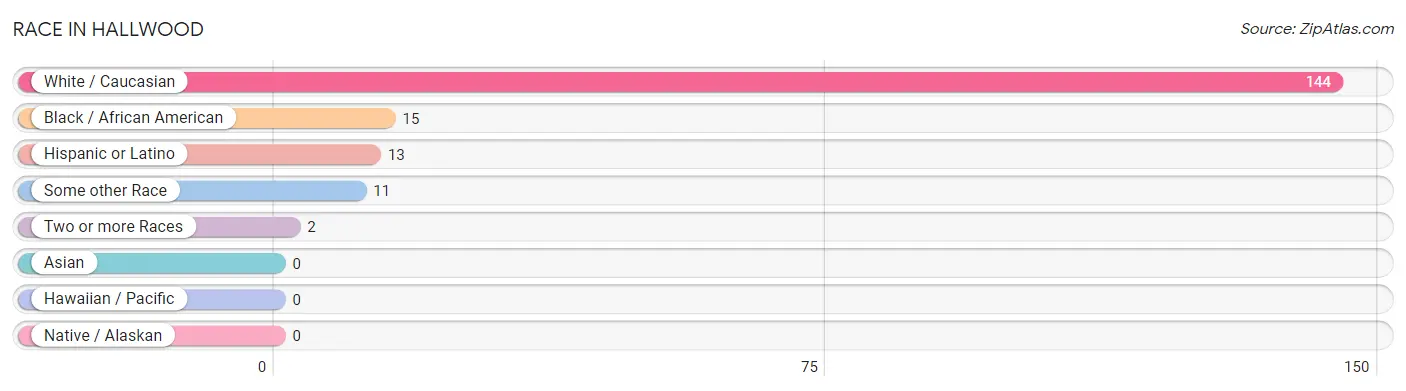
Race in Hallwood
The most populous races in Hallwood are White / Caucasian (144 | 83.7%), Black / African American (15 | 8.7%), and Hispanic or Latino (13 | 7.6%).
| Race | # Population | % Population |
| Asian | 0 | 0.0% |
| Black / African American | 15 | 8.7% |
| Hawaiian / Pacific | 0 | 0.0% |
| Hispanic or Latino | 13 | 7.6% |
| Native / Alaskan | 0 | 0.0% |
| White / Caucasian | 144 | 83.7% |
| Two or more Races | 2 | 1.2% |
| Some other Race | 11 | 6.4% |
| Total | 172 | 100.0% |
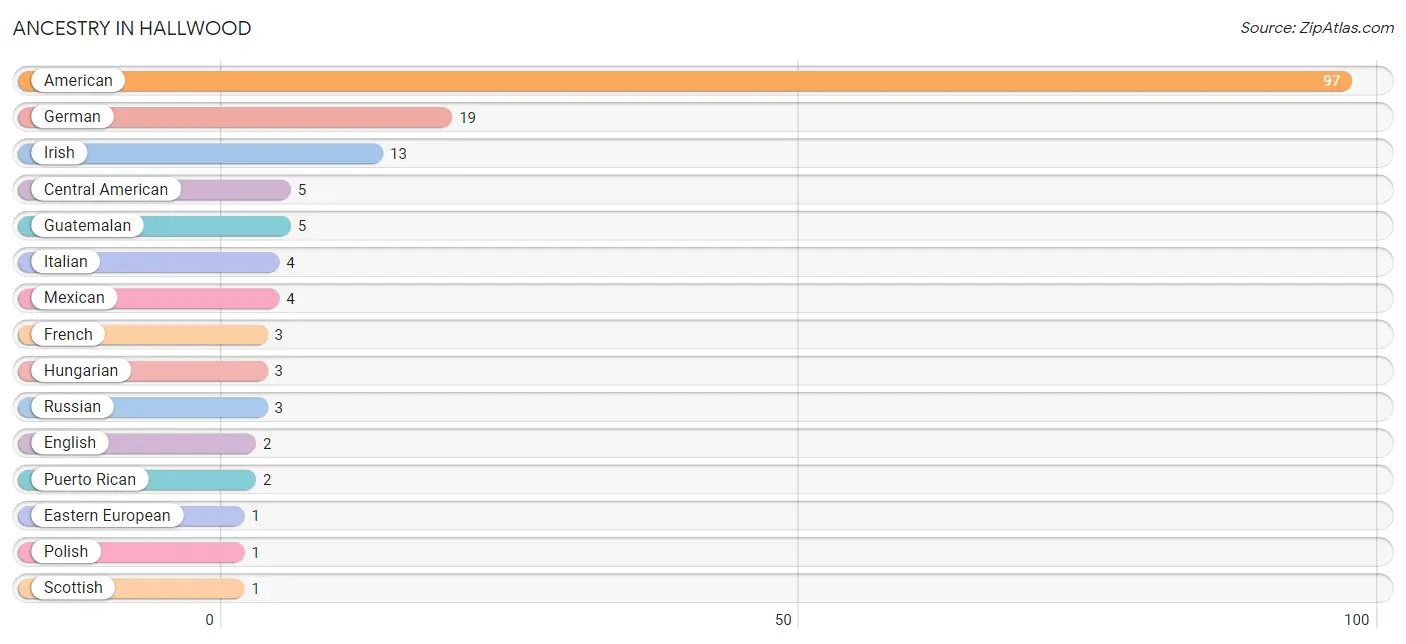
Ancestry in Hallwood
The most populous ancestries reported in Hallwood are American (97 | 56.4%), German (19 | 11.1%), Irish (13 | 7.6%), Central American (5 | 2.9%), and Guatemalan (5 | 2.9%), together accounting for 80.8% of all Hallwood residents.
| Ancestry | # Population | % Population |
| American | 97 | 56.4% |
| Central American | 5 | 2.9% |
| Eastern European | 1 | 0.6% |
| English | 2 | 1.2% |
| French | 3 | 1.7% |
| German | 19 | 11.1% |
| Guatemalan | 5 | 2.9% |
| Hungarian | 3 | 1.7% |
| Irish | 13 | 7.6% |
| Italian | 4 | 2.3% |
| Mexican | 4 | 2.3% |
| Polish | 1 | 0.6% |
| Puerto Rican | 2 | 1.2% |
| Russian | 3 | 1.7% |
| Scottish | 1 | 0.6% | View All 15 Rows |
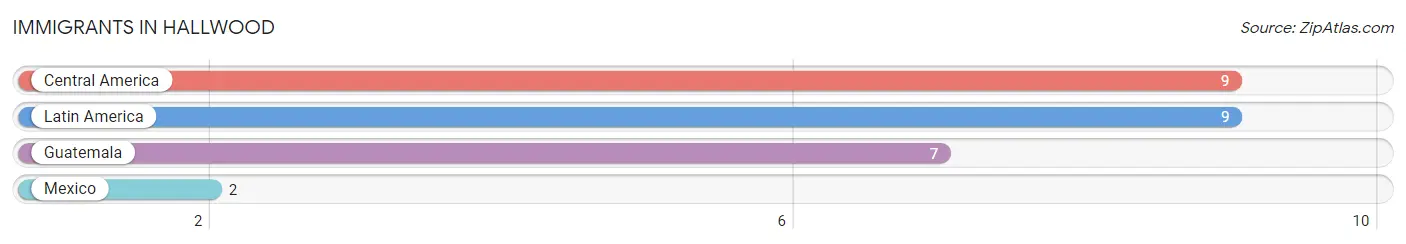
Immigrants in Hallwood
The most numerous immigrant groups reported in Hallwood came from Central America (9 | 5.2%), Latin America (9 | 5.2%), Guatemala (7 | 4.1%), and Mexico (2 | 1.2%), together accounting for 15.7% of all Hallwood residents.
| Immigration Origin | # Population | % Population |
| Central America | 9 | 5.2% |
| Guatemala | 7 | 4.1% |
| Latin America | 9 | 5.2% |
| Mexico | 2 | 1.2% | View All 4 Rows |
Sex and Age in Hallwood
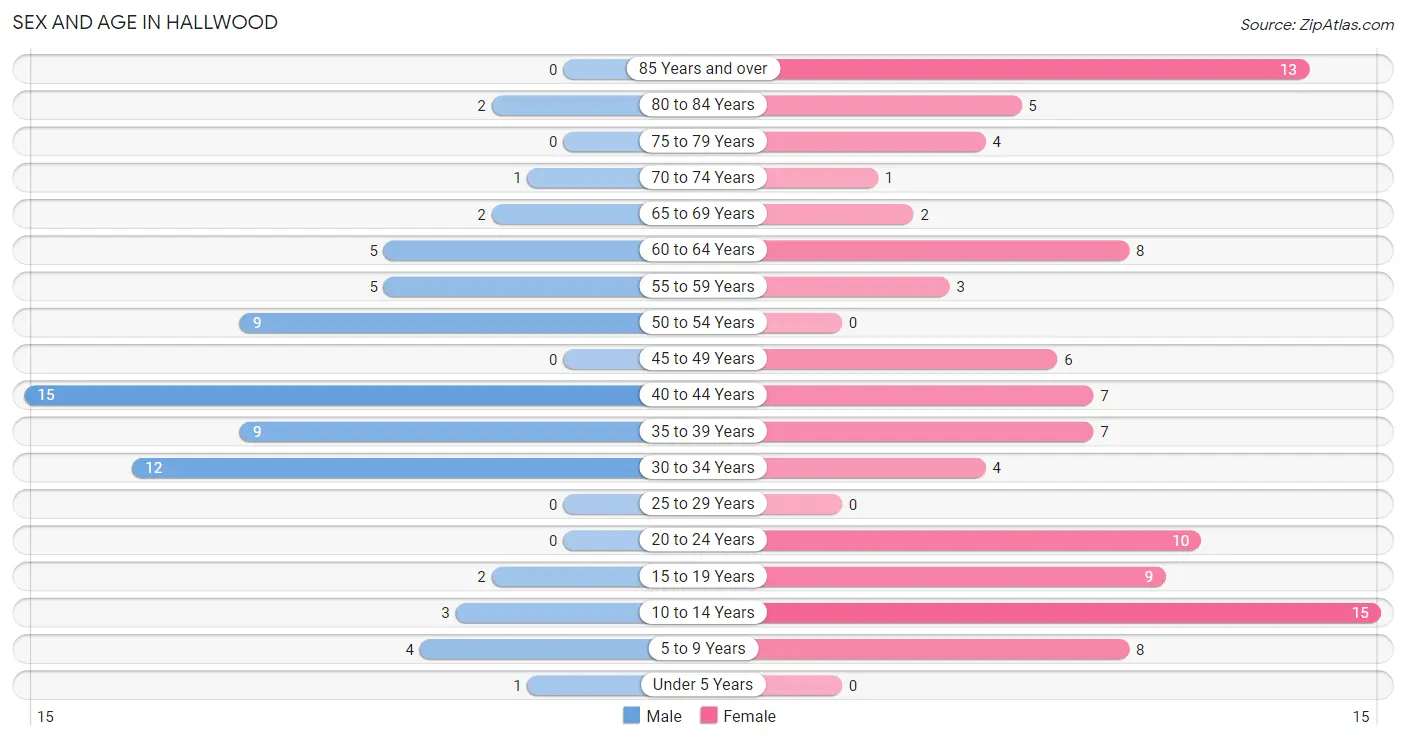
Sex and Age in Hallwood
The most populous age groups in Hallwood are 40 to 44 Years (15 | 21.4%) for men and 10 to 14 Years (15 | 14.7%) for women.
| Age Bracket | Male | Female |
| Under 5 Years | 1 (1.4%) | 0 (0.0%) |
| 5 to 9 Years | 4 (5.7%) | 8 (7.8%) |
| 10 to 14 Years | 3 (4.3%) | 15 (14.7%) |
| 15 to 19 Years | 2 (2.9%) | 9 (8.8%) |
| 20 to 24 Years | 0 (0.0%) | 10 (9.8%) |
| 25 to 29 Years | 0 (0.0%) | 0 (0.0%) |
| 30 to 34 Years | 12 (17.1%) | 4 (3.9%) |
| 35 to 39 Years | 9 (12.9%) | 7 (6.9%) |
| 40 to 44 Years | 15 (21.4%) | 7 (6.9%) |
| 45 to 49 Years | 0 (0.0%) | 6 (5.9%) |
| 50 to 54 Years | 9 (12.9%) | 0 (0.0%) |
| 55 to 59 Years | 5 (7.1%) | 3 (2.9%) |
| 60 to 64 Years | 5 (7.1%) | 8 (7.8%) |
| 65 to 69 Years | 2 (2.9%) | 2 (2.0%) |
| 70 to 74 Years | 1 (1.4%) | 1 (1.0%) |
| 75 to 79 Years | 0 (0.0%) | 4 (3.9%) |
| 80 to 84 Years | 2 (2.9%) | 5 (4.9%) |
| 85 Years and over | 0 (0.0%) | 13 (12.8%) |
| Total | 70 (100.0%) | 102 (100.0%) |
Families and Households in Hallwood
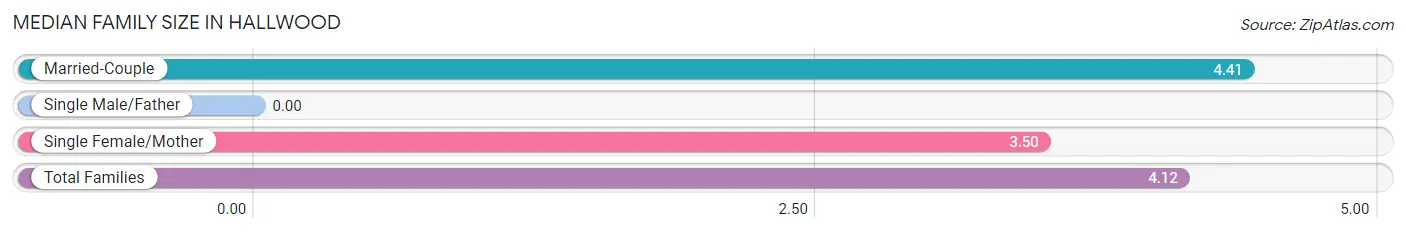
Median Family Size in Hallwood
| Family Type | # Families | Family Size |
| Married-Couple | 17 (68.0%) | 4.41 |
| Single Male/Father | 0 (0.0%) | - |
| Single Female/Mother | 8 (32.0%) | 3.50 |
| Total Families | 25 (100.0%) | 4.12 |
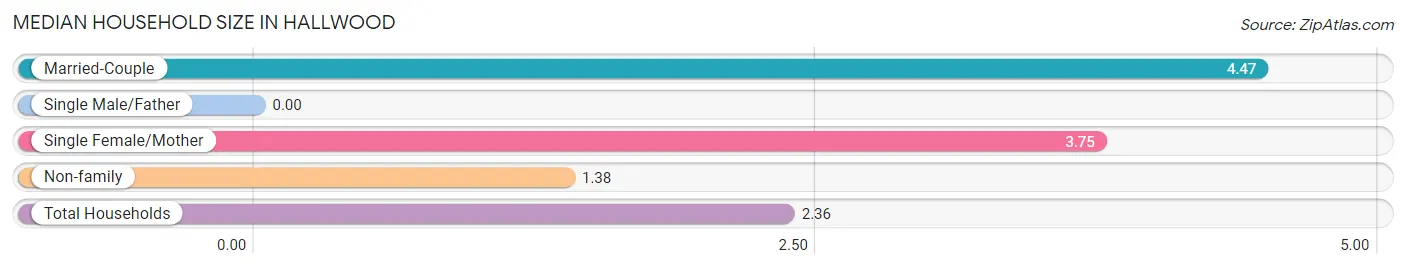
Median Household Size in Hallwood
| Household Type | # Households | Household Size |
| Married-Couple | 17 (23.3%) | 4.47 |
| Single Male/Father | 0 (0.0%) | - |
| Single Female/Mother | 8 (11.0%) | 3.75 |
| Non-family | 48 (65.7%) | 1.38 |
| Total Households | 73 (100.0%) | 2.36 |
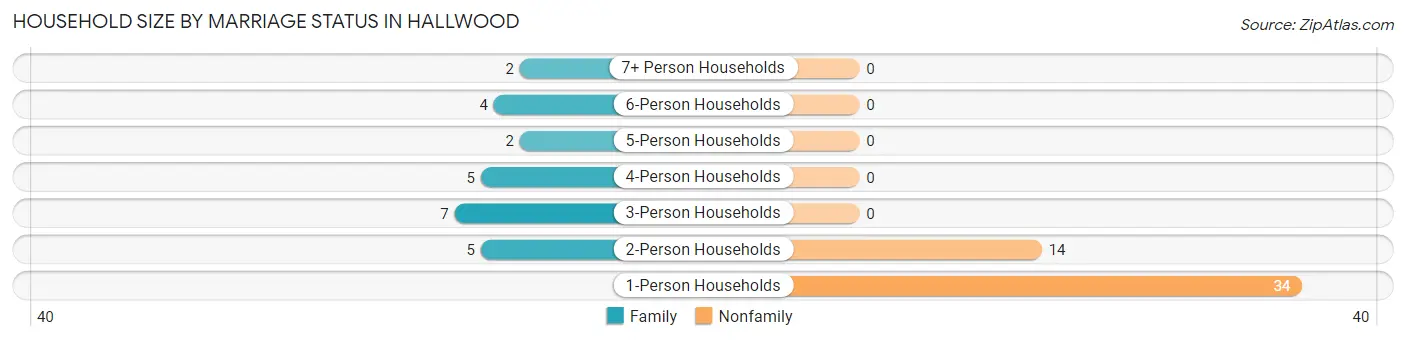
Household Size by Marriage Status in Hallwood
Out of a total of 73 households in Hallwood, 25 (34.3%) are family households, while 48 (65.7%) are nonfamily households. The most numerous type of family households are 3-person households, comprising 7, and the most common type of nonfamily households are 1-person households, comprising 34.
| Household Size | Family Households | Nonfamily Households |
| 1-Person Households | - | 34 (46.6%) |
| 2-Person Households | 5 (6.9%) | 14 (19.2%) |
| 3-Person Households | 7 (9.6%) | 0 (0.0%) |
| 4-Person Households | 5 (6.9%) | 0 (0.0%) |
| 5-Person Households | 2 (2.7%) | 0 (0.0%) |
| 6-Person Households | 4 (5.5%) | 0 (0.0%) |
| 7+ Person Households | 2 (2.7%) | 0 (0.0%) |
| Total | 25 (34.3%) | 48 (65.7%) |
Female Fertility in Hallwood
Fertility by Age in Hallwood
| Age Bracket | Women with Births | Births / 1,000 Women |
| 15 to 19 years | 0 (0.0%) | 0.0 |
| 20 to 34 years | 0 (0.0%) | 0.0 |
| 35 to 50 years | 0 (0.0%) | 0.0 |
| Total | 0 (0.0%) | 0.0 |
Fertility by Age by Marriage Status in Hallwood
| Age Bracket | Married | Unmarried |
| 15 to 19 years | 0 (0.0%) | 0 (0.0%) |
| 20 to 34 years | 0 (0.0%) | 0 (0.0%) |
| 35 to 50 years | 0 (0.0%) | 0 (0.0%) |
| Total | 0 (0.0%) | 0 (0.0%) |
Fertility by Education in Hallwood
| Educational Attainment | Women with Births | Births / 1,000 Women |
| Less than High School | 0 (0.0%) | 0.0 |
| High School Diploma | 0 (0.0%) | 0.0 |
| College or Associate's Degree | 0 (0.0%) | 0.0 |
| Bachelor's Degree | 0 (0.0%) | 0.0 |
| Graduate Degree | 0 (0.0%) | 0.0 |
| Total | 0 (0.0%) | 0.0 |
Fertility by Education by Marriage Status in Hallwood
| Educational Attainment | Married | Unmarried |
| Less than High School | 0 (0.0%) | 0 (0.0%) |
| High School Diploma | 0 (0.0%) | 0 (0.0%) |
| College or Associate's Degree | 0 (0.0%) | 0 (0.0%) |
| Bachelor's Degree | 0 (0.0%) | 0 (0.0%) |
| Graduate Degree | 0 (0.0%) | 0 (0.0%) |
| Total | 0 (0.0%) | 0 (0.0%) |
Income in Hallwood
Income Overview in Hallwood
Per Capita Income in Hallwood is $23,399, while median incomes of families and households are $68,750 and $39,107 respectively.
| Characteristic | Number | Measure |
| Per Capita Income | 172 | $23,399 |
| Median Family Income | 25 | $68,750 |
| Mean Family Income | 25 | $73,360 |
| Median Household Income | 73 | $39,107 |
| Mean Household Income | 73 | $51,230 |
| Income Deficit | 25 | $0 |
| Wage / Income Gap (%) | 172 | 42.07% |
| Wage / Income Gap ($) | 172 | 57.93¢ per $1 |
| Gini / Inequality Index | 172 | 0.36 |
Earnings by Sex in Hallwood
Average Earnings in Hallwood are $29,605, $45,313 for men and $26,250 for women, a difference of 42.1%.
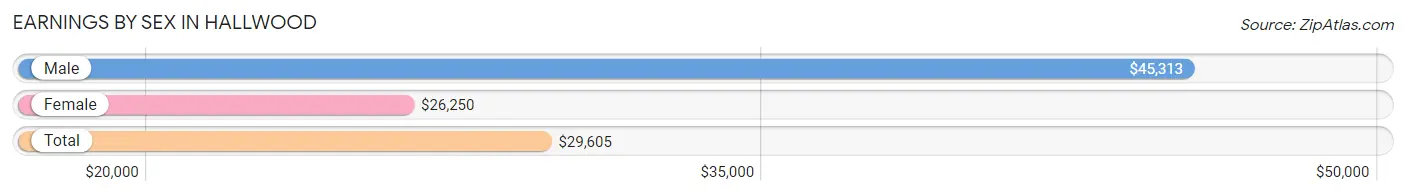
| Sex | Number | Average Earnings |
| Male | 51 (59.3%) | $45,313 |
| Female | 35 (40.7%) | $26,250 |
| Total | 86 (100.0%) | $29,605 |
Earnings by Sex by Income Bracket in Hallwood
The most common earnings brackets in Hallwood are $25,000 to $29,999 for men (19 | 37.2%) and $7,500 to $9,999 for women (9 | 25.7%).
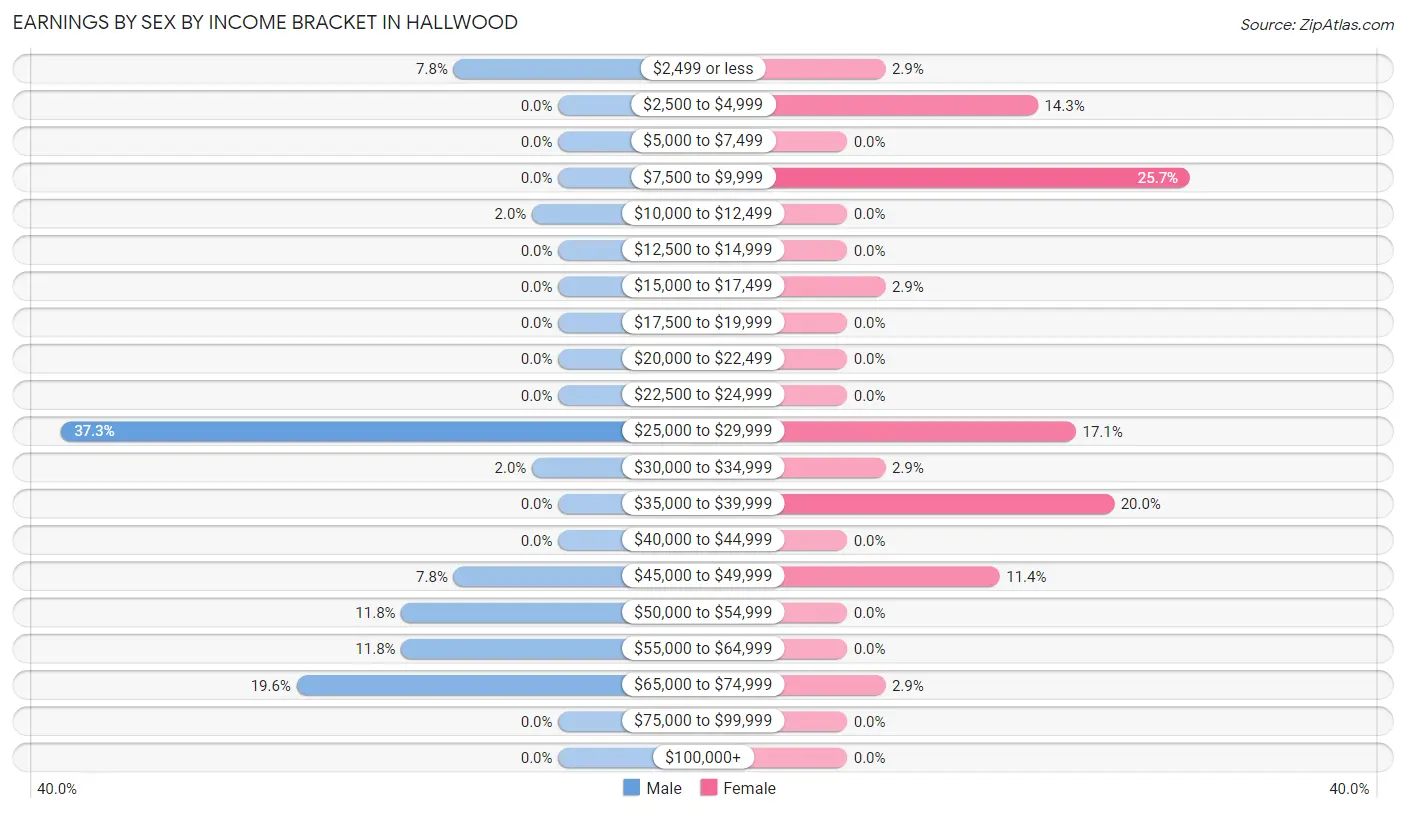
| Income | Male | Female |
| $2,499 or less | 4 (7.8%) | 1 (2.9%) |
| $2,500 to $4,999 | 0 (0.0%) | 5 (14.3%) |
| $5,000 to $7,499 | 0 (0.0%) | 0 (0.0%) |
| $7,500 to $9,999 | 0 (0.0%) | 9 (25.7%) |
| $10,000 to $12,499 | 1 (2.0%) | 0 (0.0%) |
| $12,500 to $14,999 | 0 (0.0%) | 0 (0.0%) |
| $15,000 to $17,499 | 0 (0.0%) | 1 (2.9%) |
| $17,500 to $19,999 | 0 (0.0%) | 0 (0.0%) |
| $20,000 to $22,499 | 0 (0.0%) | 0 (0.0%) |
| $22,500 to $24,999 | 0 (0.0%) | 0 (0.0%) |
| $25,000 to $29,999 | 19 (37.2%) | 6 (17.1%) |
| $30,000 to $34,999 | 1 (2.0%) | 1 (2.9%) |
| $35,000 to $39,999 | 0 (0.0%) | 7 (20.0%) |
| $40,000 to $44,999 | 0 (0.0%) | 0 (0.0%) |
| $45,000 to $49,999 | 4 (7.8%) | 4 (11.4%) |
| $50,000 to $54,999 | 6 (11.8%) | 0 (0.0%) |
| $55,000 to $64,999 | 6 (11.8%) | 0 (0.0%) |
| $65,000 to $74,999 | 10 (19.6%) | 1 (2.9%) |
| $75,000 to $99,999 | 0 (0.0%) | 0 (0.0%) |
| $100,000+ | 0 (0.0%) | 0 (0.0%) |
| Total | 51 (100.0%) | 35 (100.0%) |
Earnings by Sex by Educational Attainment in Hallwood
Average earnings in Hallwood are $45,313 for men and $31,250 for women, a difference of 31.0%. Men with an educational attainment of bachelor's degree enjoy the highest average annual earnings of $63,750, while those with high school diploma education earn the least with $29,609. Women with an educational attainment of college or associate's degree earn the most with the average annual earnings of $38,333, while those with less than high school education have the smallest earnings of $28,125.
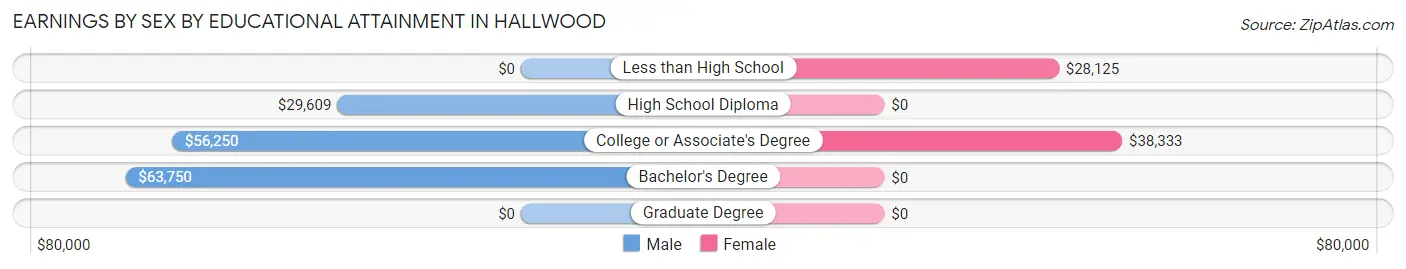
| Educational Attainment | Male Income | Female Income |
| Less than High School | - | - |
| High School Diploma | $29,609 | $0 |
| College or Associate's Degree | $56,250 | $38,333 |
| Bachelor's Degree | $63,750 | $0 |
| Graduate Degree | - | - |
| Total | $45,313 | $31,250 |
Family Income in Hallwood
Family Income Brackets in Hallwood
According to the Hallwood family income data, there are 8 families falling into the $75,000 to $99,999 income range, which is the most common income bracket and makes up 32.0% of all families.
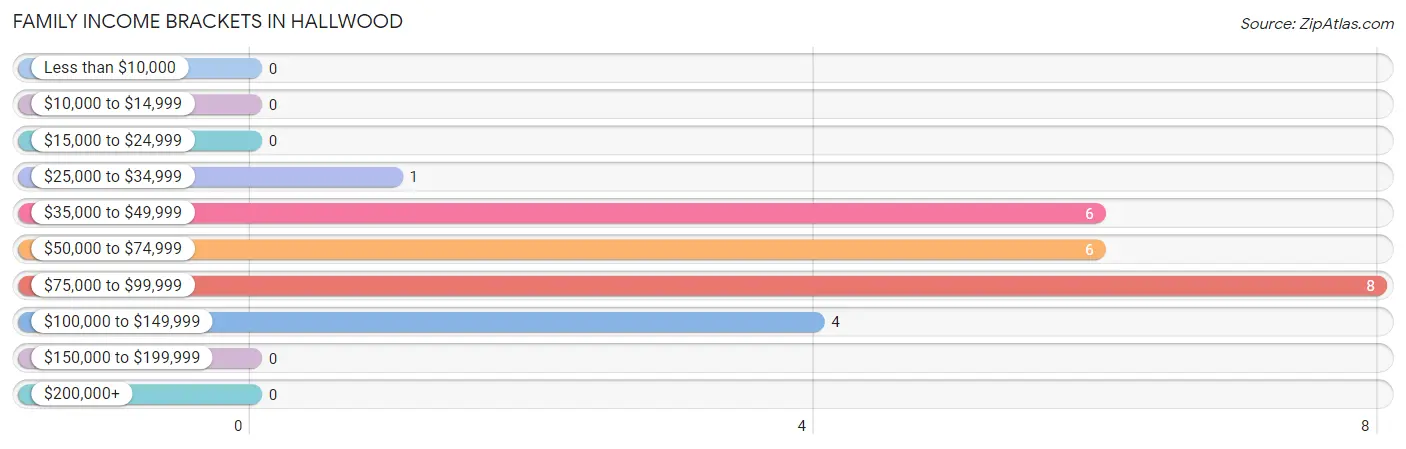
| Income Bracket | # Families | % Families |
| Less than $10,000 | 0 | 0.0% |
| $10,000 to $14,999 | 0 | 0.0% |
| $15,000 to $24,999 | 0 | 0.0% |
| $25,000 to $34,999 | 1 | 4.0% |
| $35,000 to $49,999 | 6 | 24.0% |
| $50,000 to $74,999 | 6 | 24.0% |
| $75,000 to $99,999 | 8 | 32.0% |
| $100,000 to $149,999 | 4 | 16.0% |
| $150,000 to $199,999 | 0 | 0.0% |
| $200,000+ | 0 | 0.0% |
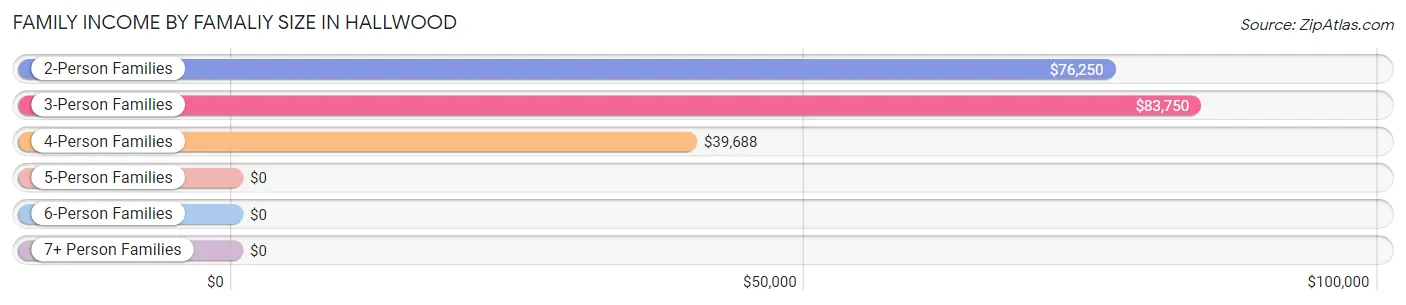
Family Income by Famaliy Size in Hallwood
3-person families (7 | 28.0%) account for the highest median family income in Hallwood with $83,750 per family, while 2-person families (5 | 20.0%) have the highest median income of $38,125 per family member.
| Income Bracket | # Families | Median Income |
| 2-Person Families | 5 (20.0%) | $76,250 |
| 3-Person Families | 7 (28.0%) | $83,750 |
| 4-Person Families | 7 (28.0%) | $39,688 |
| 5-Person Families | 0 (0.0%) | $0 |
| 6-Person Families | 5 (20.0%) | $0 |
| 7+ Person Families | 1 (4.0%) | $0 |
| Total | 25 (100.0%) | $68,750 |
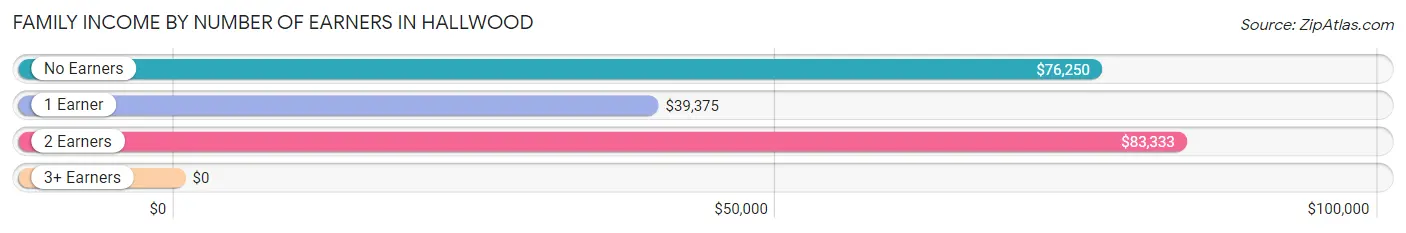
Family Income by Number of Earners in Hallwood
| Number of Earners | # Families | Median Income |
| No Earners | 5 (20.0%) | $76,250 |
| 1 Earner | 8 (32.0%) | $39,375 |
| 2 Earners | 8 (32.0%) | $83,333 |
| 3+ Earners | 4 (16.0%) | $0 |
| Total | 25 (100.0%) | $68,750 |
Household Income in Hallwood
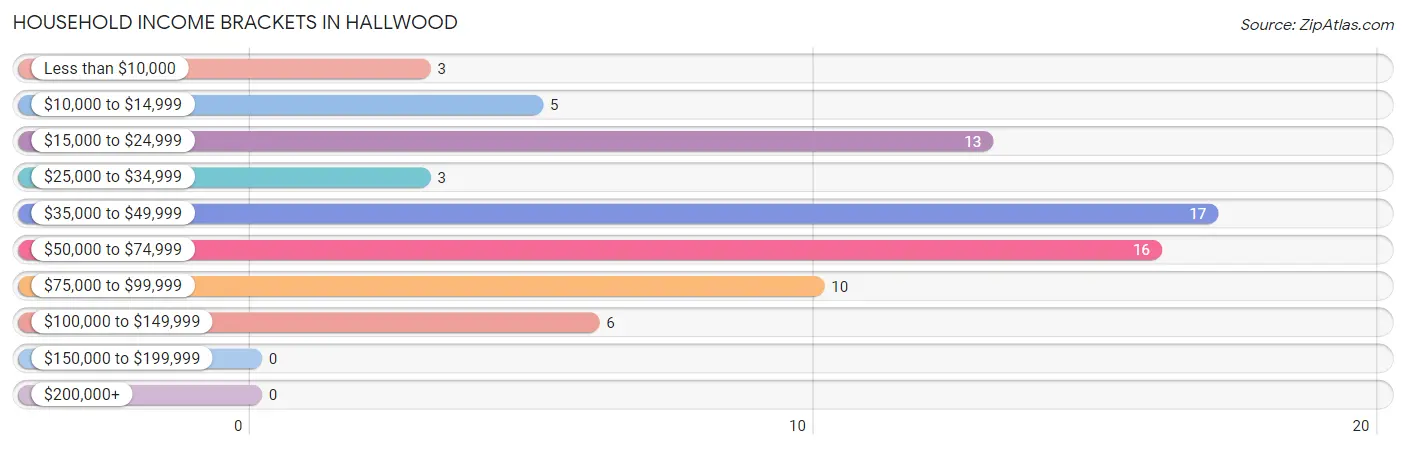
Household Income Brackets in Hallwood
With 17 households falling in the category, the $35,000 to $49,999 income range is the most frequent in Hallwood, accounting for 23.3% of all households.
| Income Bracket | # Households | % Households |
| Less than $10,000 | 3 | 4.1% |
| $10,000 to $14,999 | 5 | 6.8% |
| $15,000 to $24,999 | 13 | 17.8% |
| $25,000 to $34,999 | 3 | 4.1% |
| $35,000 to $49,999 | 17 | 23.3% |
| $50,000 to $74,999 | 16 | 21.9% |
| $75,000 to $99,999 | 10 | 13.7% |
| $100,000 to $149,999 | 6 | 8.2% |
| $150,000 to $199,999 | 0 | 0.0% |
| $200,000+ | 0 | 0.0% |
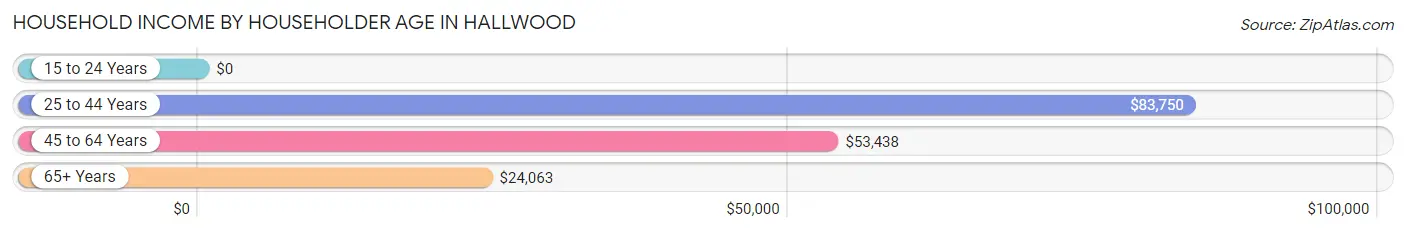
Household Income by Householder Age in Hallwood
The median household income in Hallwood is $39,107, with the highest median household income of $83,750 found in the 25 to 44 years age bracket for the primary householder. A total of 23 households (31.5%) fall into this category.
| Income Bracket | # Households | Median Income |
| 15 to 24 Years | 0 (0.0%) | $0 |
| 25 to 44 Years | 23 (31.5%) | $83,750 |
| 45 to 64 Years | 25 (34.3%) | $53,438 |
| 65+ Years | 25 (34.3%) | $24,063 |
| Total | 73 (100.0%) | $39,107 |
Poverty in Hallwood
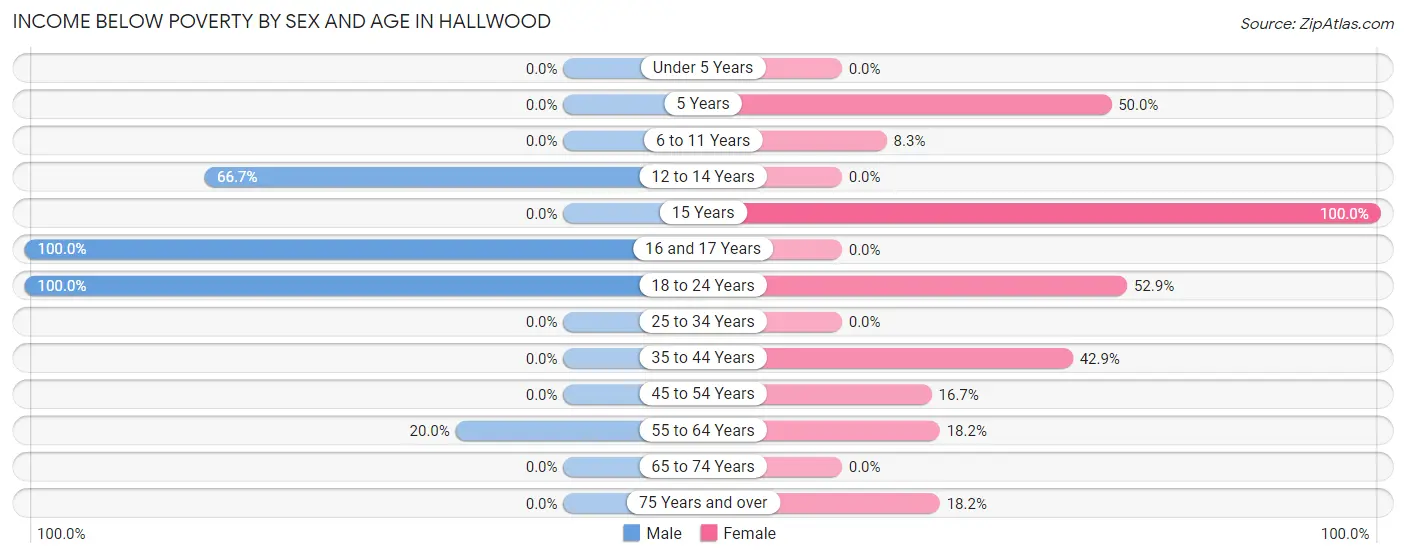
Income Below Poverty by Sex and Age in Hallwood
With 8.6% poverty level for males and 24.5% for females among the residents of Hallwood, 16 and 17 year old males and 15 year old females are the most vulnerable to poverty, with 1 males (100.0%) and 1 females (100.0%) in their respective age groups living below the poverty level.
| Age Bracket | Male | Female |
| Under 5 Years | 0 (0.0%) | 0 (0.0%) |
| 5 Years | 0 (0.0%) | 1 (50.0%) |
| 6 to 11 Years | 0 (0.0%) | 1 (8.3%) |
| 12 to 14 Years | 2 (66.7%) | 0 (0.0%) |
| 15 Years | 0 (0.0%) | 1 (100.0%) |
| 16 and 17 Years | 1 (100.0%) | 0 (0.0%) |
| 18 to 24 Years | 1 (100.0%) | 9 (52.9%) |
| 25 to 34 Years | 0 (0.0%) | 0 (0.0%) |
| 35 to 44 Years | 0 (0.0%) | 6 (42.9%) |
| 45 to 54 Years | 0 (0.0%) | 1 (16.7%) |
| 55 to 64 Years | 2 (20.0%) | 2 (18.2%) |
| 65 to 74 Years | 0 (0.0%) | 0 (0.0%) |
| 75 Years and over | 0 (0.0%) | 4 (18.2%) |
| Total | 6 (8.6%) | 25 (24.5%) |
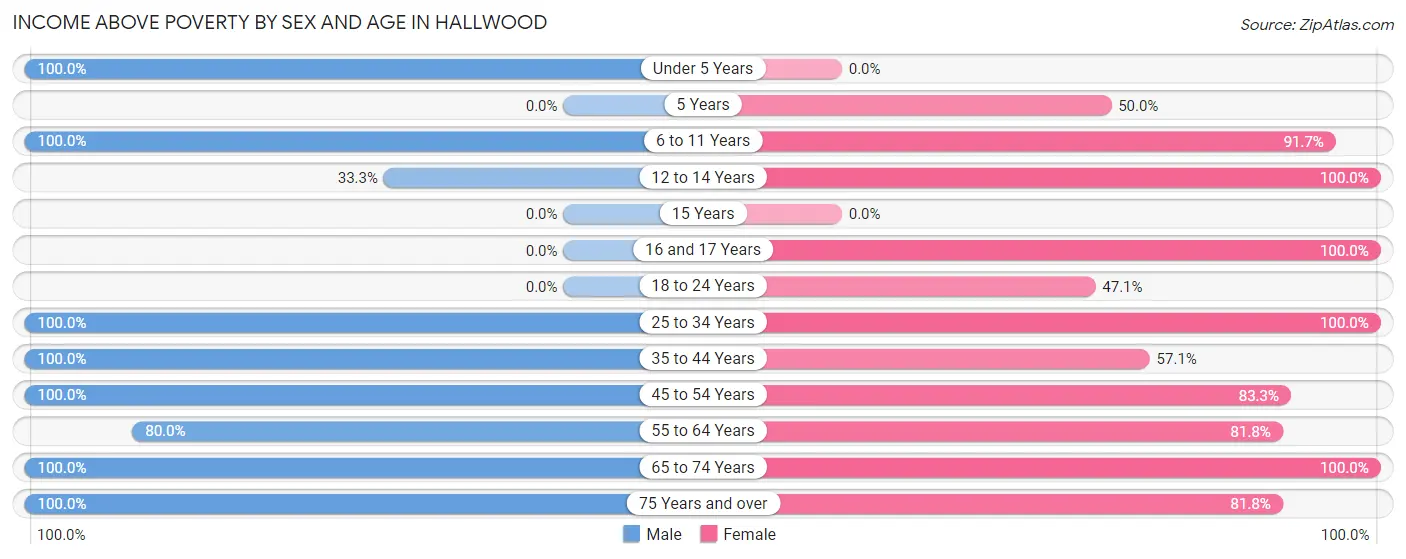
Income Above Poverty by Sex and Age in Hallwood
According to the poverty statistics in Hallwood, males aged under 5 years and females aged 12 to 14 years are the age groups that are most secure financially, with 100.0% of males and 100.0% of females in these age groups living above the poverty line.
| Age Bracket | Male | Female |
| Under 5 Years | 1 (100.0%) | 0 (0.0%) |
| 5 Years | 0 (0.0%) | 1 (50.0%) |
| 6 to 11 Years | 4 (100.0%) | 11 (91.7%) |
| 12 to 14 Years | 1 (33.3%) | 9 (100.0%) |
| 15 Years | 0 (0.0%) | 0 (0.0%) |
| 16 and 17 Years | 0 (0.0%) | 1 (100.0%) |
| 18 to 24 Years | 0 (0.0%) | 8 (47.1%) |
| 25 to 34 Years | 12 (100.0%) | 4 (100.0%) |
| 35 to 44 Years | 24 (100.0%) | 8 (57.1%) |
| 45 to 54 Years | 9 (100.0%) | 5 (83.3%) |
| 55 to 64 Years | 8 (80.0%) | 9 (81.8%) |
| 65 to 74 Years | 3 (100.0%) | 3 (100.0%) |
| 75 Years and over | 2 (100.0%) | 18 (81.8%) |
| Total | 64 (91.4%) | 77 (75.5%) |
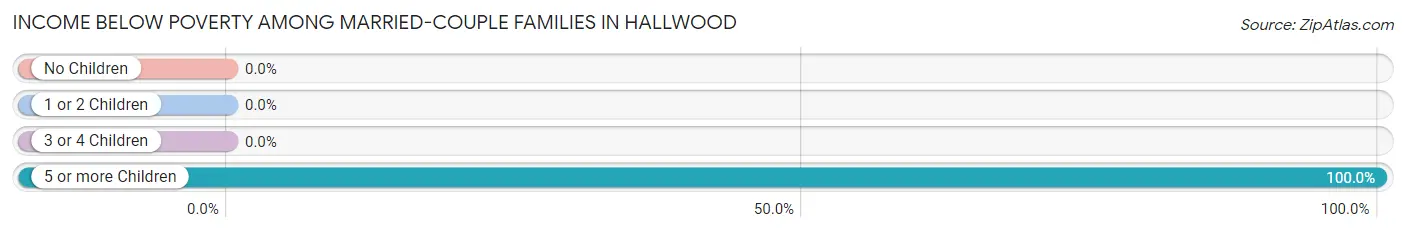
Income Below Poverty Among Married-Couple Families in Hallwood
The poverty statistics for married-couple families in Hallwood show that 5.9% or 1 of the total 17 families live below the poverty line. Families with 5 or more children have the highest poverty rate of 100.0%, comprising of 1 families. On the other hand, families with no children have the lowest poverty rate of 0.0%, which includes 0 families.
| Children | Above Poverty | Below Poverty |
| No Children | 4 (100.0%) | 0 (0.0%) |
| 1 or 2 Children | 7 (100.0%) | 0 (0.0%) |
| 3 or 4 Children | 5 (100.0%) | 0 (0.0%) |
| 5 or more Children | 0 (0.0%) | 1 (100.0%) |
| Total | 16 (94.1%) | 1 (5.9%) |
Income Below Poverty Among Single-Parent Households in Hallwood
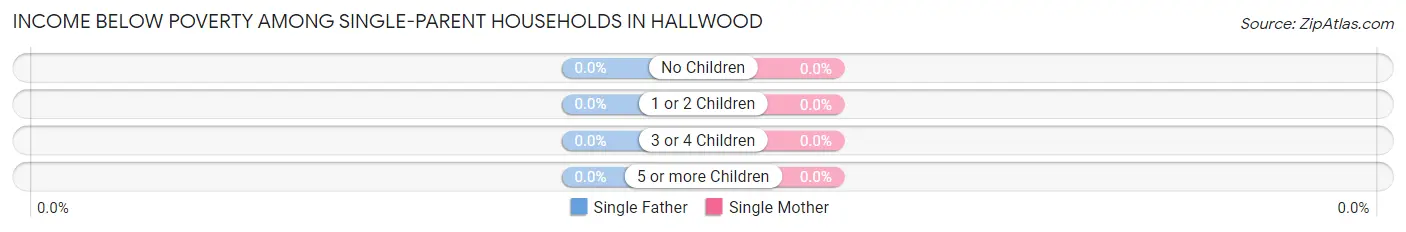
| Children | Single Father | Single Mother |
| No Children | 0 (0.0%) | 0 (0.0%) |
| 1 or 2 Children | 0 (0.0%) | 0 (0.0%) |
| 3 or 4 Children | 0 (0.0%) | 0 (0.0%) |
| 5 or more Children | 0 (0.0%) | 0 (0.0%) |
| Total | 0 (0.0%) | 0 (0.0%) |
Income Below Poverty Among Married-Couple vs Single-Parent Households in Hallwood
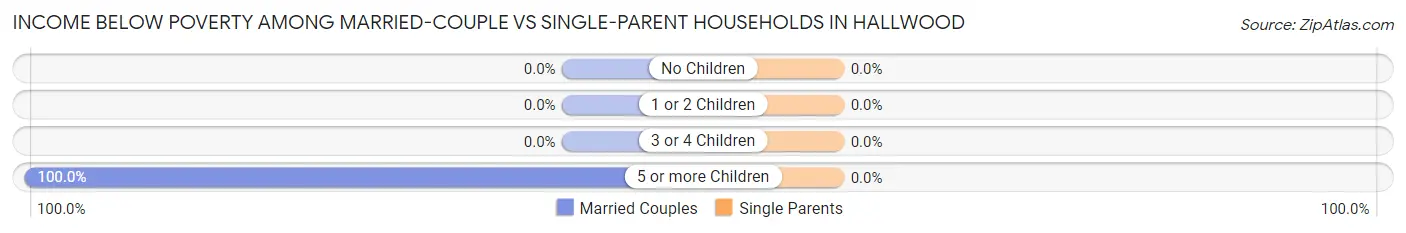
| Children | Married-Couple Families | Single-Parent Households |
| No Children | 0 (0.0%) | 0 (0.0%) |
| 1 or 2 Children | 0 (0.0%) | 0 (0.0%) |
| 3 or 4 Children | 0 (0.0%) | 0 (0.0%) |
| 5 or more Children | 1 (100.0%) | 0 (0.0%) |
| Total | 1 (5.9%) | 0 (0.0%) |
Employment Characteristics in Hallwood
Employment by Class of Employer in Hallwood
Among the 64 employed individuals in Hallwood, private company employees (41 | 64.1%), local government employees (10 | 15.6%), and self-employed (not incorporated) (8 | 12.5%) make up the most common classes of employment.
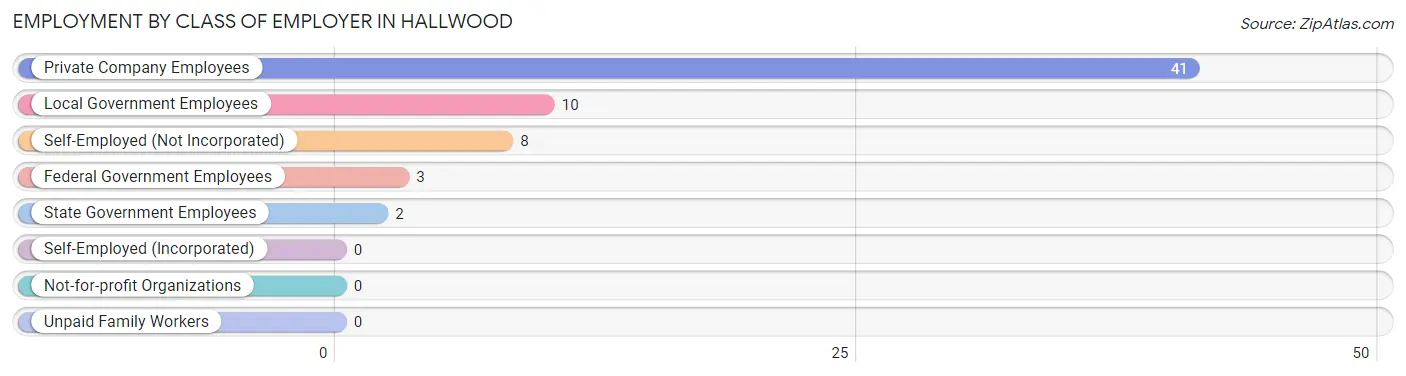
| Employer Class | # Employees | % Employees |
| Private Company Employees | 41 | 64.1% |
| Self-Employed (Incorporated) | 0 | 0.0% |
| Self-Employed (Not Incorporated) | 8 | 12.5% |
| Not-for-profit Organizations | 0 | 0.0% |
| Local Government Employees | 10 | 15.6% |
| State Government Employees | 2 | 3.1% |
| Federal Government Employees | 3 | 4.7% |
| Unpaid Family Workers | 0 | 0.0% |
| Total | 64 | 100.0% |
Employment Status by Age in Hallwood
According to the labor force statistics for Hallwood, out of the total population over 16 years of age (140), 54.3% or 76 individuals are in the labor force, with 2.6% or 2 of them unemployed. The age group with the highest labor force participation rate is 20 to 24 years, with 100.0% or 10 individuals in the labor force. Within the labor force, the 45 to 54 years age range has the highest percentage of unemployed individuals, with 20.0% or 1 of them being unemployed.
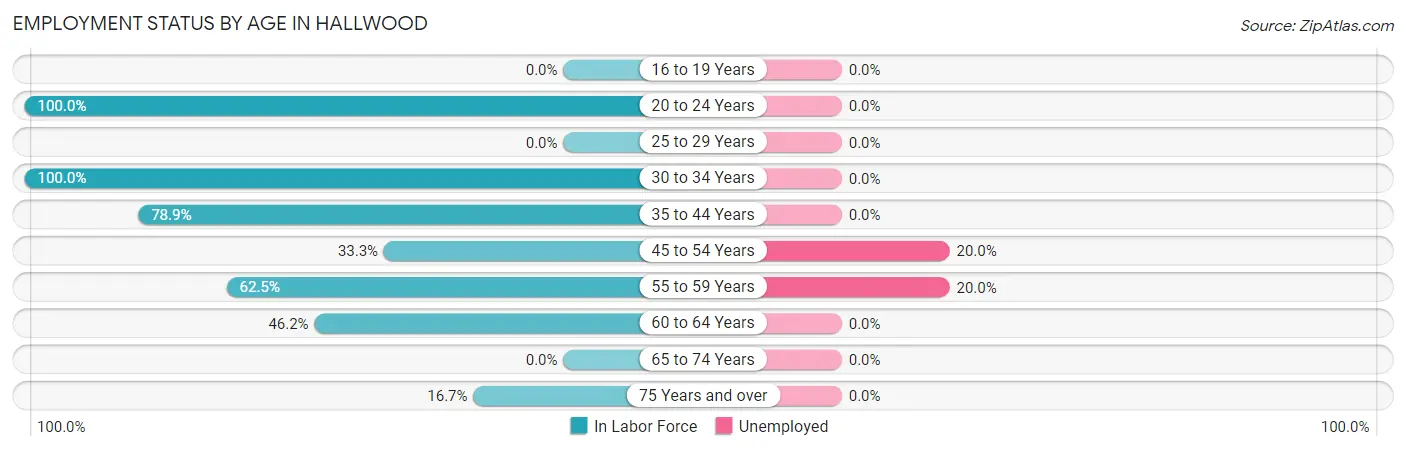
| Age Bracket | In Labor Force | Unemployed |
| 16 to 19 Years | 0 (0.0%) | 0 (0.0%) |
| 20 to 24 Years | 10 (100.0%) | 0 (0.0%) |
| 25 to 29 Years | 0 (0.0%) | 0 (0.0%) |
| 30 to 34 Years | 16 (100.0%) | 0 (0.0%) |
| 35 to 44 Years | 30 (78.9%) | 0 (0.0%) |
| 45 to 54 Years | 5 (33.3%) | 1 (20.0%) |
| 55 to 59 Years | 5 (62.5%) | 1 (20.0%) |
| 60 to 64 Years | 6 (46.2%) | 0 (0.0%) |
| 65 to 74 Years | 0 (0.0%) | 0 (0.0%) |
| 75 Years and over | 4 (16.7%) | 0 (0.0%) |
| Total | 76 (54.3%) | 2 (2.6%) |
Employment Status by Educational Attainment in Hallwood
According to labor force statistics for Hallwood, 68.9% of individuals (62) out of the total population between 25 and 64 years of age (90) are in the labor force, with 3.2% or 2 of them being unemployed. The group with the highest labor force participation rate are those with the educational attainment of bachelor's degree or higher, with 100.0% or 8 individuals in the labor force. Within the labor force, individuals with college / associate degree education have the highest percentage of unemployment, with 5.9% or 1 of them being unemployed.
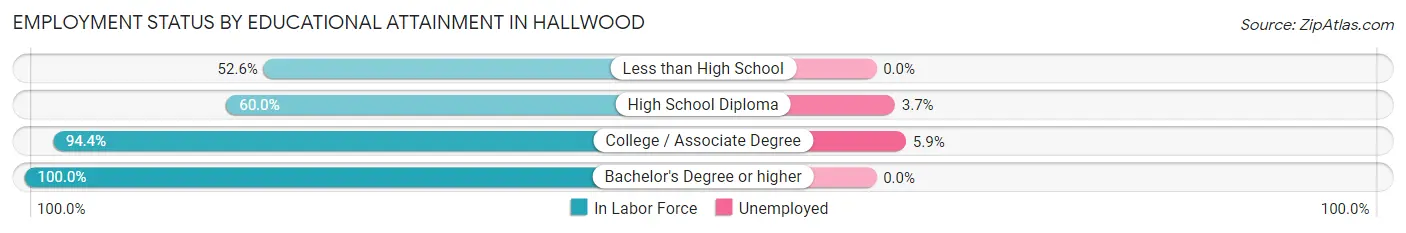
| Educational Attainment | In Labor Force | Unemployed |
| Less than High School | 10 (52.6%) | 0 (0.0%) |
| High School Diploma | 27 (60.0%) | 2 (3.7%) |
| College / Associate Degree | 17 (94.4%) | 1 (5.9%) |
| Bachelor's Degree or higher | 8 (100.0%) | 0 (0.0%) |
| Total | 62 (68.9%) | 3 (3.2%) |
Employment Occupations by Sex in Hallwood
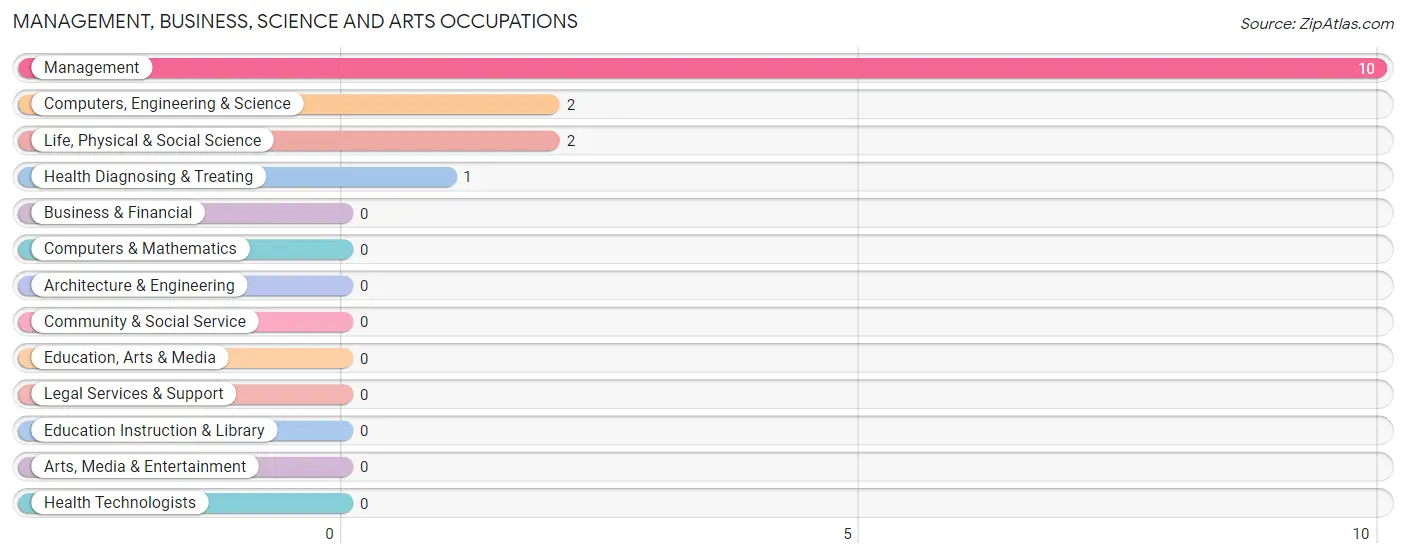
Management, Business, Science and Arts Occupations
The most common Management, Business, Science and Arts occupations in Hallwood are Management (10 | 13.5%), Computers, Engineering & Science (2 | 2.7%), Life, Physical & Social Science (2 | 2.7%), and Health Diagnosing & Treating (1 | 1.3%).
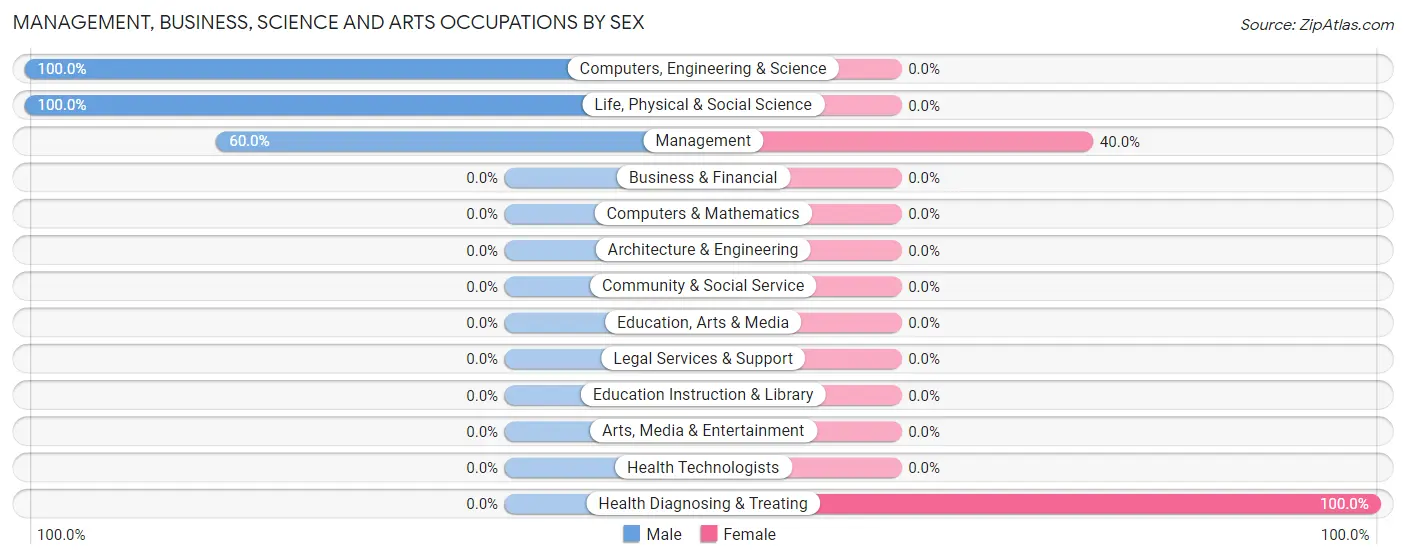
Management, Business, Science and Arts Occupations by Sex
Within the Management, Business, Science and Arts occupations in Hallwood, the most male-oriented occupations are Computers, Engineering & Science (100.0%), Life, Physical & Social Science (100.0%), and Management (60.0%), while the most female-oriented occupations are Health Diagnosing & Treating (100.0%), and Management (40.0%).
| Occupation | Male | Female |
| Management | 6 (60.0%) | 4 (40.0%) |
| Business & Financial | 0 (0.0%) | 0 (0.0%) |
| Computers, Engineering & Science | 2 (100.0%) | 0 (0.0%) |
| Computers & Mathematics | 0 (0.0%) | 0 (0.0%) |
| Architecture & Engineering | 0 (0.0%) | 0 (0.0%) |
| Life, Physical & Social Science | 2 (100.0%) | 0 (0.0%) |
| Community & Social Service | 0 (0.0%) | 0 (0.0%) |
| Education, Arts & Media | 0 (0.0%) | 0 (0.0%) |
| Legal Services & Support | 0 (0.0%) | 0 (0.0%) |
| Education Instruction & Library | 0 (0.0%) | 0 (0.0%) |
| Arts, Media & Entertainment | 0 (0.0%) | 0 (0.0%) |
| Health Diagnosing & Treating | 0 (0.0%) | 1 (100.0%) |
| Health Technologists | 0 (0.0%) | 0 (0.0%) |
| Total (Category) | 8 (61.5%) | 5 (38.5%) |
| Total (Overall) | 41 (55.4%) | 33 (44.6%) |
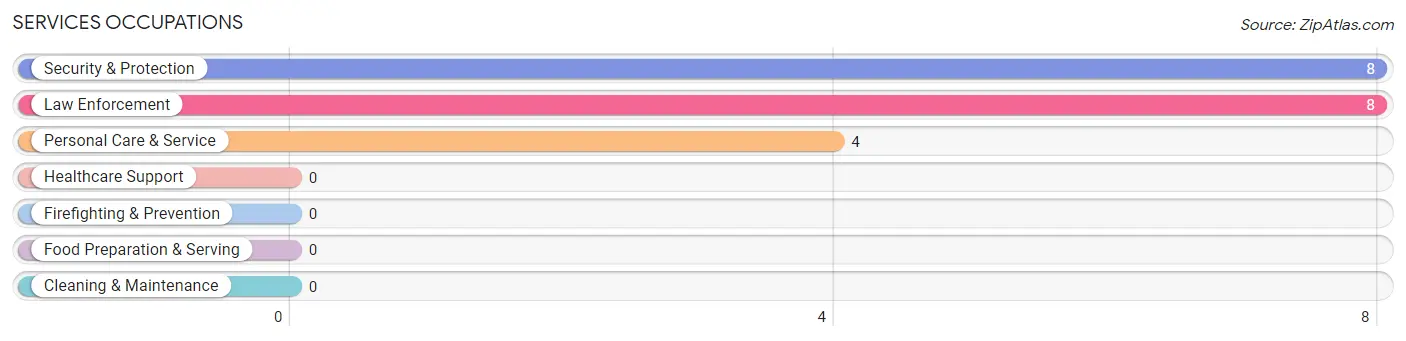
Services Occupations
The most common Services occupations in Hallwood are Security & Protection (8 | 10.8%), Law Enforcement (8 | 10.8%), and Personal Care & Service (4 | 5.4%).
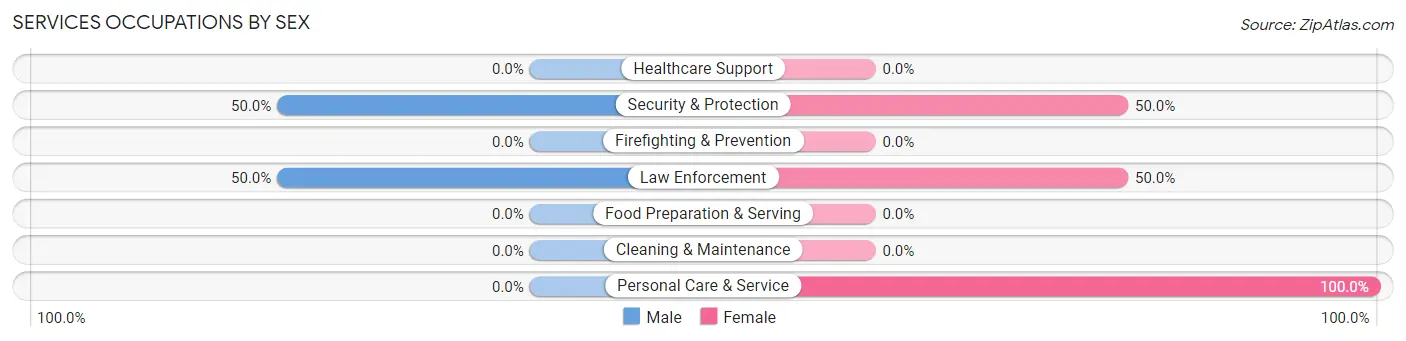
Services Occupations by Sex
Within the Services occupations in Hallwood, the most male-oriented occupations are Security & Protection (50.0%), and Law Enforcement (50.0%), while the most female-oriented occupations are Personal Care & Service (100.0%), Security & Protection (50.0%), and Law Enforcement (50.0%).
| Occupation | Male | Female |
| Healthcare Support | 0 (0.0%) | 0 (0.0%) |
| Security & Protection | 4 (50.0%) | 4 (50.0%) |
| Firefighting & Prevention | 0 (0.0%) | 0 (0.0%) |
| Law Enforcement | 4 (50.0%) | 4 (50.0%) |
| Food Preparation & Serving | 0 (0.0%) | 0 (0.0%) |
| Cleaning & Maintenance | 0 (0.0%) | 0 (0.0%) |
| Personal Care & Service | 0 (0.0%) | 4 (100.0%) |
| Total (Category) | 4 (33.3%) | 8 (66.7%) |
| Total (Overall) | 41 (55.4%) | 33 (44.6%) |
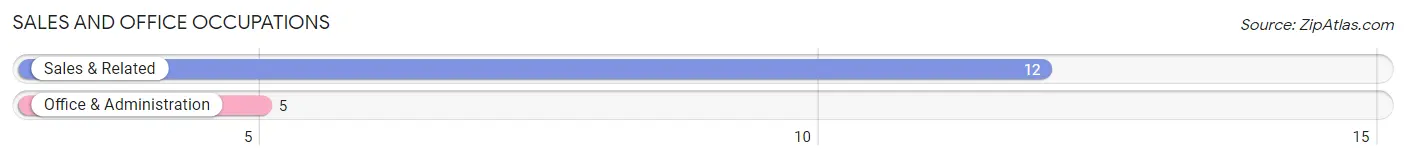
Sales and Office Occupations
The most common Sales and Office occupations in Hallwood are Sales & Related (12 | 16.2%), and Office & Administration (5 | 6.8%).
Sales and Office Occupations by Sex
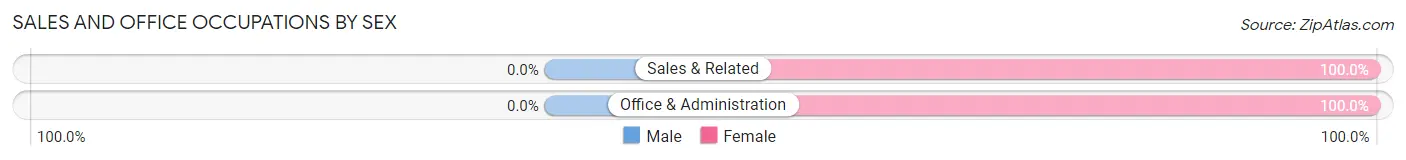
| Occupation | Male | Female |
| Sales & Related | 0 (0.0%) | 12 (100.0%) |
| Office & Administration | 0 (0.0%) | 5 (100.0%) |
| Total (Category) | 0 (0.0%) | 17 (100.0%) |
| Total (Overall) | 41 (55.4%) | 33 (44.6%) |
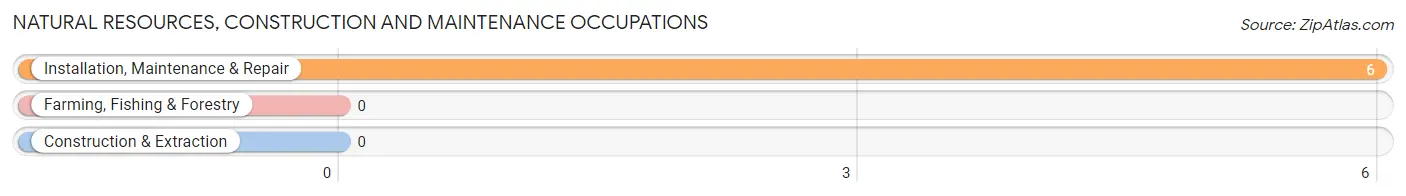
Natural Resources, Construction and Maintenance Occupations
The most common Natural Resources, Construction and Maintenance occupations in Hallwood are , and Installation, Maintenance & Repair (6 | 8.1%).
Natural Resources, Construction and Maintenance Occupations by Sex
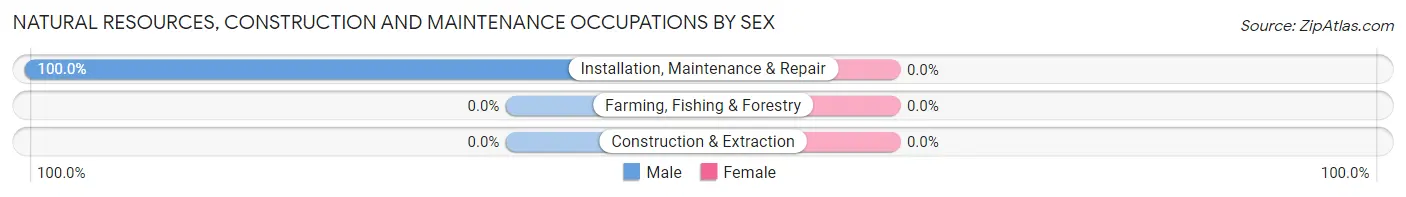
| Occupation | Male | Female |
| Farming, Fishing & Forestry | 0 (0.0%) | 0 (0.0%) |
| Construction & Extraction | 0 (0.0%) | 0 (0.0%) |
| Installation, Maintenance & Repair | 6 (100.0%) | 0 (0.0%) |
| Total (Category) | 6 (100.0%) | 0 (0.0%) |
| Total (Overall) | 41 (55.4%) | 33 (44.6%) |
Production, Transportation and Moving Occupations
The most common Production, Transportation and Moving occupations in Hallwood are Production (23 | 31.1%), and Material Moving (3 | 4.1%).
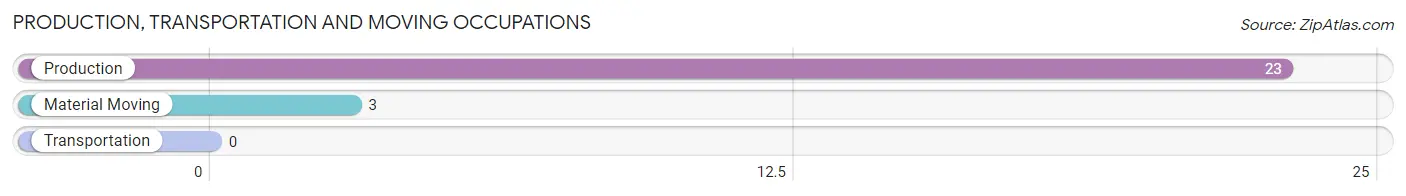
Production, Transportation and Moving Occupations by Sex
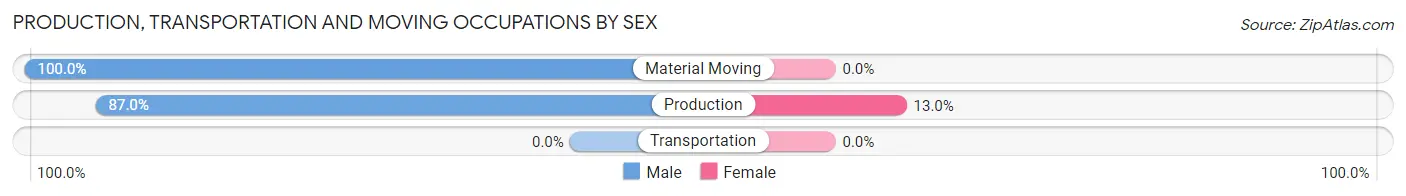
| Occupation | Male | Female |
| Production | 20 (87.0%) | 3 (13.0%) |
| Transportation | 0 (0.0%) | 0 (0.0%) |
| Material Moving | 3 (100.0%) | 0 (0.0%) |
| Total (Category) | 23 (88.5%) | 3 (11.5%) |
| Total (Overall) | 41 (55.4%) | 33 (44.6%) |
Employment Industries by Sex in Hallwood
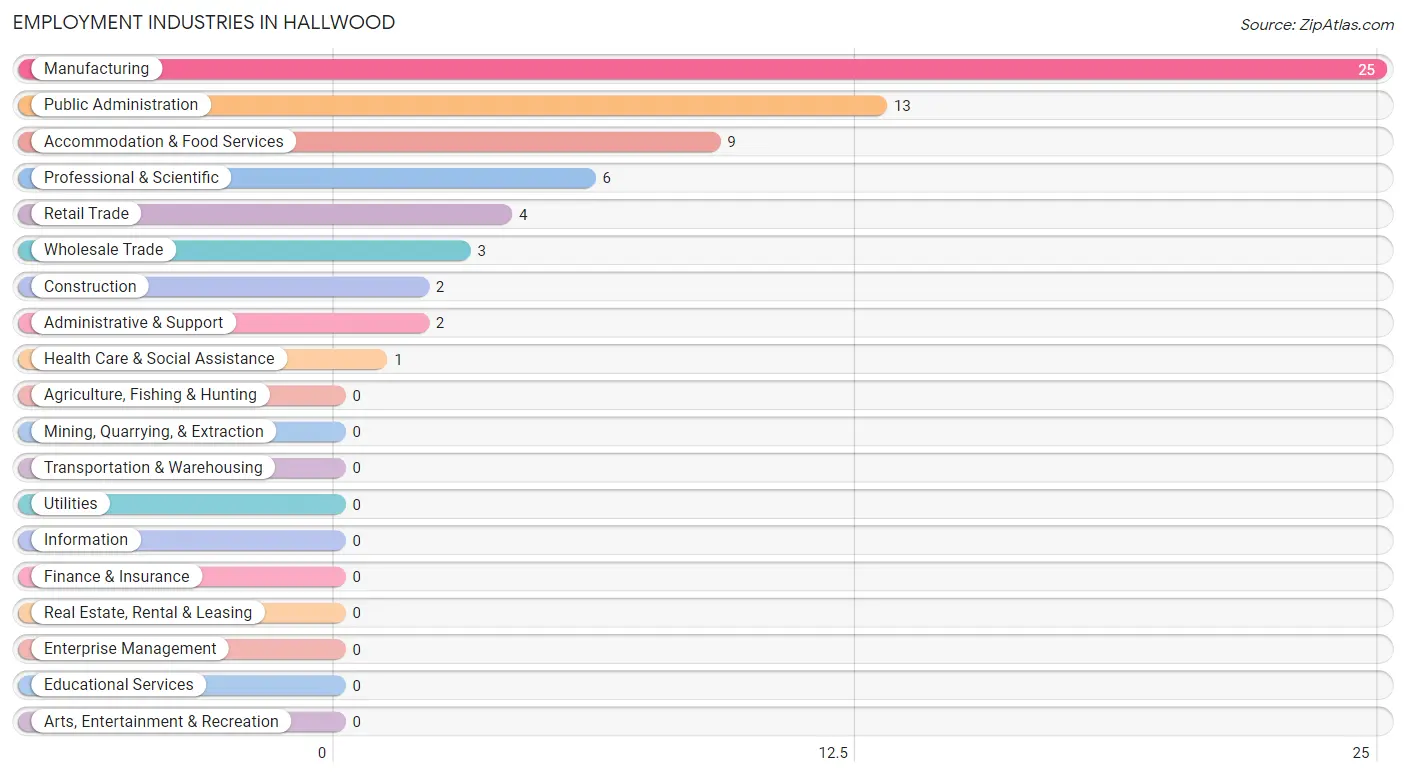
Employment Industries in Hallwood
The major employment industries in Hallwood include Manufacturing (25 | 33.8%), Public Administration (13 | 17.6%), Accommodation & Food Services (9 | 12.2%), Professional & Scientific (6 | 8.1%), and Retail Trade (4 | 5.4%).
Employment Industries by Sex in Hallwood
The Hallwood industries that see more men than women are Construction (100.0%), Wholesale Trade (100.0%), and Professional & Scientific (100.0%), whereas the industries that tend to have a higher number of women are Retail Trade (100.0%), Health Care & Social Assistance (100.0%), and Accommodation & Food Services (100.0%).
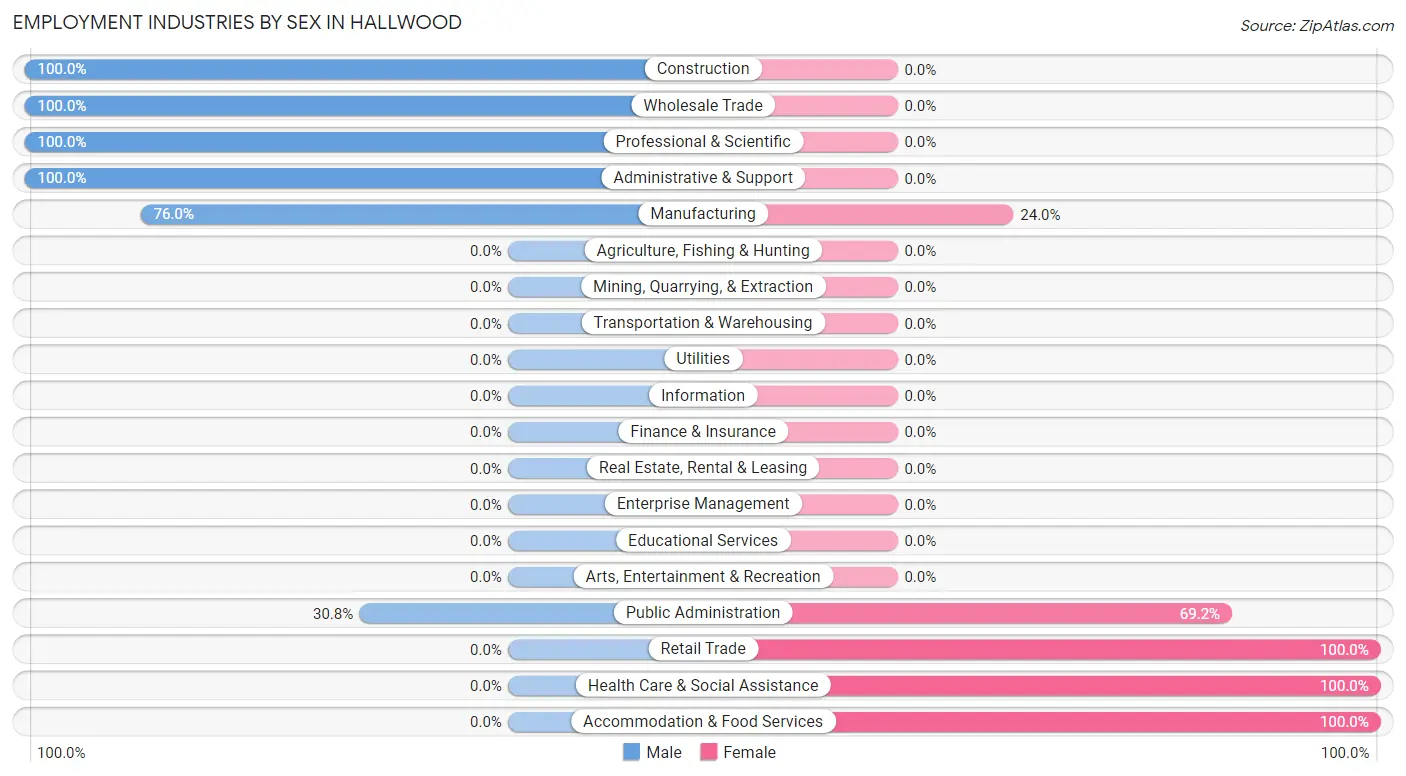
| Industry | Male | Female |
| Agriculture, Fishing & Hunting | 0 (0.0%) | 0 (0.0%) |
| Mining, Quarrying, & Extraction | 0 (0.0%) | 0 (0.0%) |
| Construction | 2 (100.0%) | 0 (0.0%) |
| Manufacturing | 19 (76.0%) | 6 (24.0%) |
| Wholesale Trade | 3 (100.0%) | 0 (0.0%) |
| Retail Trade | 0 (0.0%) | 4 (100.0%) |
| Transportation & Warehousing | 0 (0.0%) | 0 (0.0%) |
| Utilities | 0 (0.0%) | 0 (0.0%) |
| Information | 0 (0.0%) | 0 (0.0%) |
| Finance & Insurance | 0 (0.0%) | 0 (0.0%) |
| Real Estate, Rental & Leasing | 0 (0.0%) | 0 (0.0%) |
| Professional & Scientific | 6 (100.0%) | 0 (0.0%) |
| Enterprise Management | 0 (0.0%) | 0 (0.0%) |
| Administrative & Support | 2 (100.0%) | 0 (0.0%) |
| Educational Services | 0 (0.0%) | 0 (0.0%) |
| Health Care & Social Assistance | 0 (0.0%) | 1 (100.0%) |
| Arts, Entertainment & Recreation | 0 (0.0%) | 0 (0.0%) |
| Accommodation & Food Services | 0 (0.0%) | 9 (100.0%) |
| Public Administration | 4 (30.8%) | 9 (69.2%) |
| Total | 41 (55.4%) | 33 (44.6%) |
Education in Hallwood
School Enrollment in Hallwood
The most common levels of schooling among the 45 students in Hallwood are high school (17 | 37.8%), middle school (11 | 24.4%), and elementary school (10 | 22.2%).
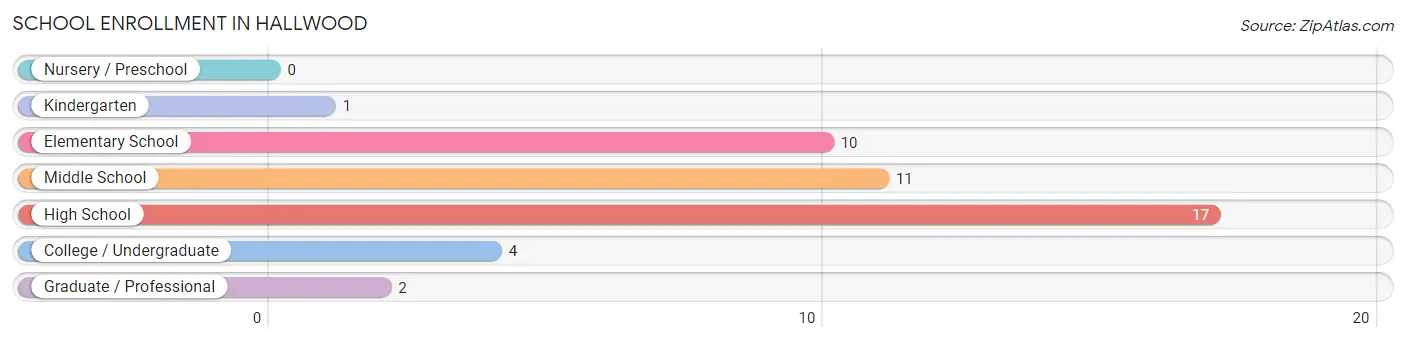
| School Level | # Students | % Students |
| Nursery / Preschool | 0 | 0.0% |
| Kindergarten | 1 | 2.2% |
| Elementary School | 10 | 22.2% |
| Middle School | 11 | 24.4% |
| High School | 17 | 37.8% |
| College / Undergraduate | 4 | 8.9% |
| Graduate / Professional | 2 | 4.4% |
| Total | 45 | 100.0% |
School Enrollment by Age by Funding Source in Hallwood
Out of a total of 45 students who are enrolled in schools in Hallwood, 2 (4.4%) attend a private institution, while the remaining 43 (95.6%) are enrolled in public schools. The age group of 15 to 17 year olds has the highest likelihood of being enrolled in private schools, with 2 (66.7% in the age bracket) enrolled. Conversely, the age group of 5 to 9 year old has the lowest likelihood of being enrolled in a private school, with 11 (100.0% in the age bracket) attending a public institution.
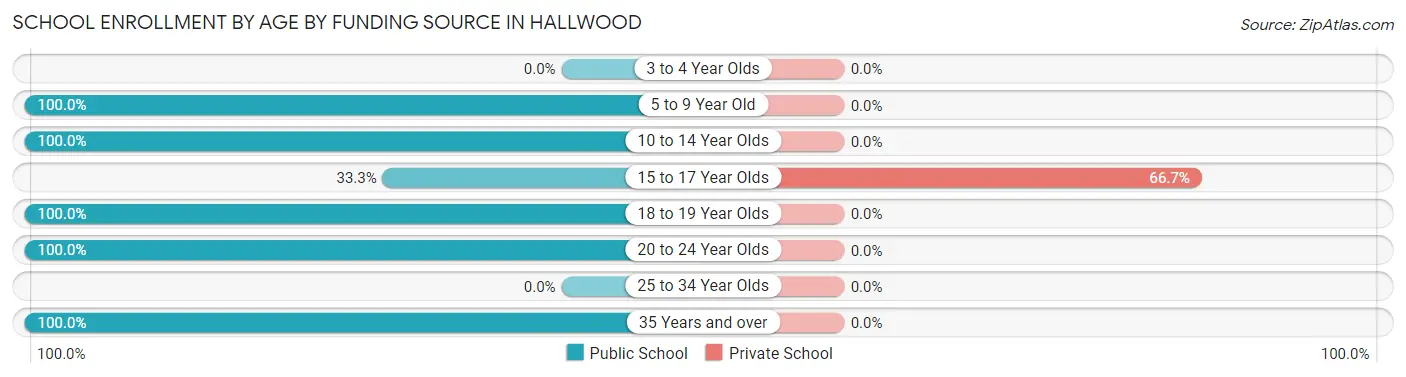
| Age Bracket | Public School | Private School |
| 3 to 4 Year Olds | 0 (0.0%) | 0 (0.0%) |
| 5 to 9 Year Old | 11 (100.0%) | 0 (0.0%) |
| 10 to 14 Year Olds | 18 (100.0%) | 0 (0.0%) |
| 15 to 17 Year Olds | 1 (33.3%) | 2 (66.7%) |
| 18 to 19 Year Olds | 7 (100.0%) | 0 (0.0%) |
| 20 to 24 Year Olds | 1 (100.0%) | 0 (0.0%) |
| 25 to 34 Year Olds | 0 (0.0%) | 0 (0.0%) |
| 35 Years and over | 5 (100.0%) | 0 (0.0%) |
| Total | 43 (95.6%) | 2 (4.4%) |
Educational Attainment by Field of Study in Hallwood
Physical & health sciences (7 | 77.8%), and business (2 | 22.2%) are the most common fields of study among 9 individuals in Hallwood who have obtained a bachelor's degree or higher.
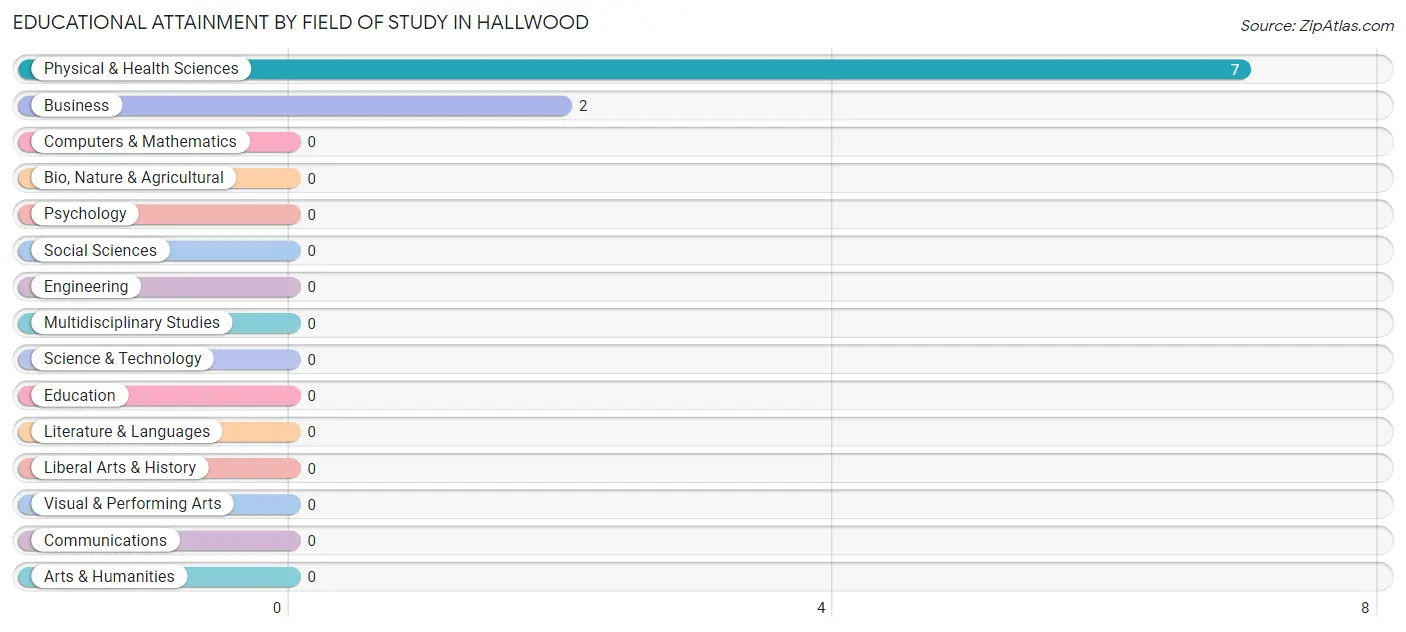
| Field of Study | # Graduates | % Graduates |
| Computers & Mathematics | 0 | 0.0% |
| Bio, Nature & Agricultural | 0 | 0.0% |
| Physical & Health Sciences | 7 | 77.8% |
| Psychology | 0 | 0.0% |
| Social Sciences | 0 | 0.0% |
| Engineering | 0 | 0.0% |
| Multidisciplinary Studies | 0 | 0.0% |
| Science & Technology | 0 | 0.0% |
| Business | 2 | 22.2% |
| Education | 0 | 0.0% |
| Literature & Languages | 0 | 0.0% |
| Liberal Arts & History | 0 | 0.0% |
| Visual & Performing Arts | 0 | 0.0% |
| Communications | 0 | 0.0% |
| Arts & Humanities | 0 | 0.0% |
| Total | 9 | 100.0% |
Transportation & Commute in Hallwood
Vehicle Availability by Sex in Hallwood
The most prevalent vehicle ownership categories in Hallwood are males with 4 vehicles (17, accounting for 41.5%) and females with 4 vehicles (6, making up 73.9%).
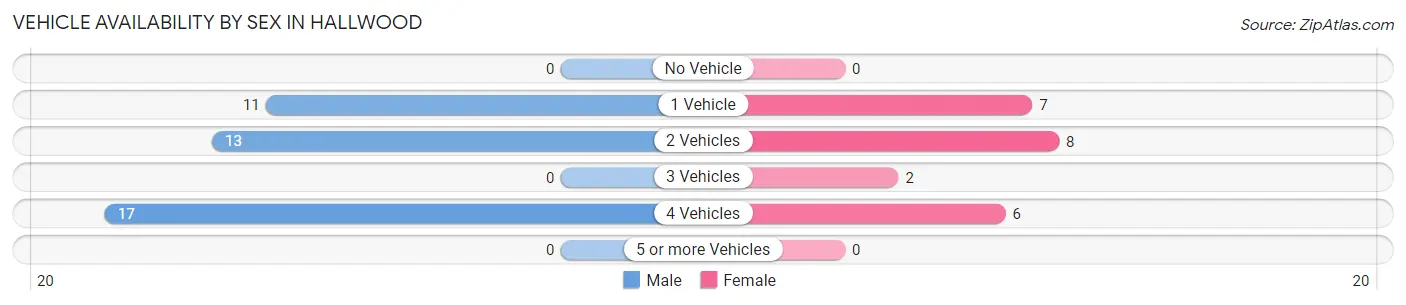
| Vehicles Available | Male | Female |
| No Vehicle | 0 (0.0%) | 0 (0.0%) |
| 1 Vehicle | 11 (26.8%) | 7 (30.4%) |
| 2 Vehicles | 13 (31.7%) | 8 (34.8%) |
| 3 Vehicles | 0 (0.0%) | 2 (8.7%) |
| 4 Vehicles | 17 (41.5%) | 6 (26.1%) |
| 5 or more Vehicles | 0 (0.0%) | 0 (0.0%) |
| Total | 41 (100.0%) | 23 (100.0%) |
Commute Time in Hallwood
The most frequently occuring commute durations in Hallwood are 15 to 19 minutes (24 commuters, 37.5%), 10 to 14 minutes (12 commuters, 18.8%), and 20 to 24 minutes (8 commuters, 12.5%).
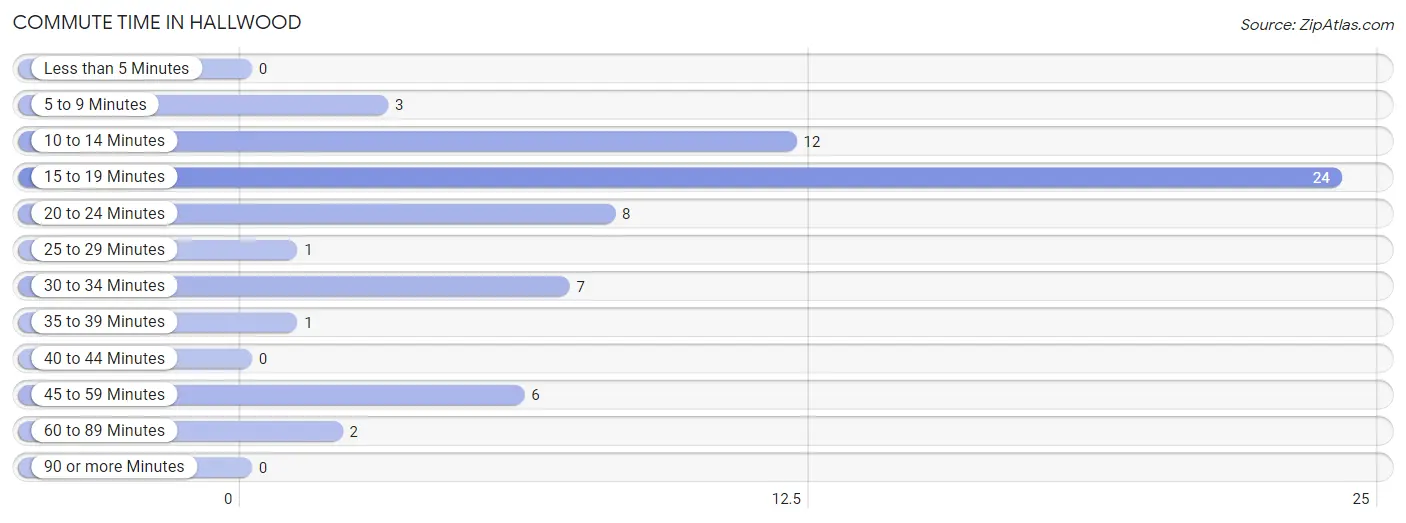
| Commute Time | # Commuters | % Commuters |
| Less than 5 Minutes | 0 | 0.0% |
| 5 to 9 Minutes | 3 | 4.7% |
| 10 to 14 Minutes | 12 | 18.8% |
| 15 to 19 Minutes | 24 | 37.5% |
| 20 to 24 Minutes | 8 | 12.5% |
| 25 to 29 Minutes | 1 | 1.6% |
| 30 to 34 Minutes | 7 | 10.9% |
| 35 to 39 Minutes | 1 | 1.6% |
| 40 to 44 Minutes | 0 | 0.0% |
| 45 to 59 Minutes | 6 | 9.4% |
| 60 to 89 Minutes | 2 | 3.1% |
| 90 or more Minutes | 0 | 0.0% |
Commute Time by Sex in Hallwood
The most common commute times in Hallwood are 15 to 19 minutes (18 commuters, 43.9%) for males and 10 to 14 minutes (6 commuters, 26.1%) for females.
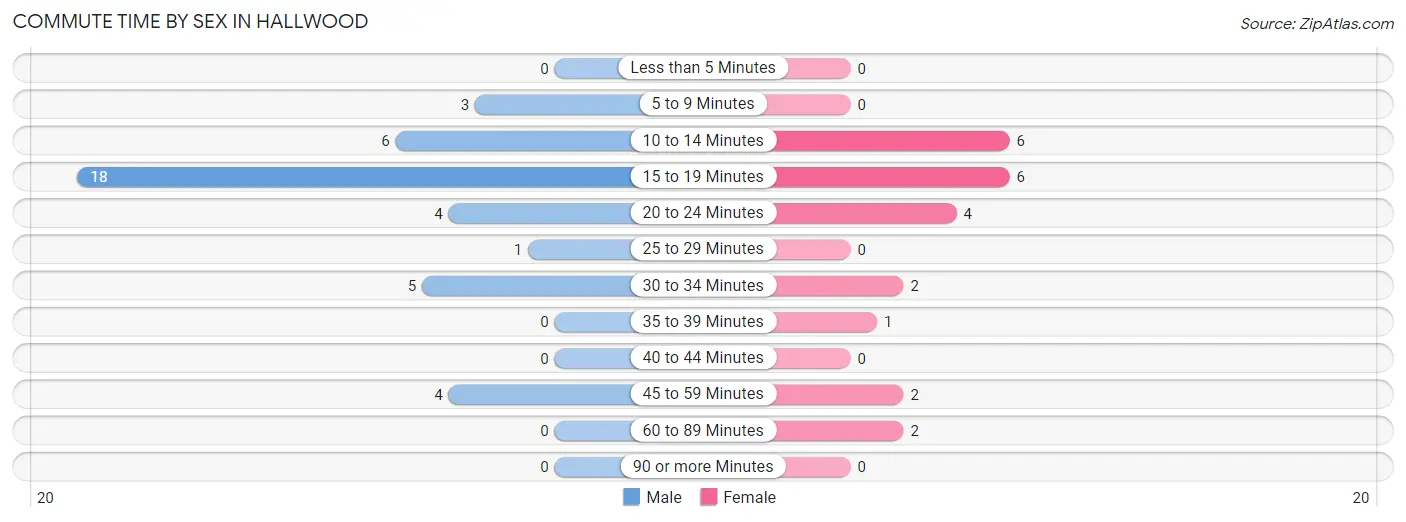
| Commute Time | Male | Female |
| Less than 5 Minutes | 0 (0.0%) | 0 (0.0%) |
| 5 to 9 Minutes | 3 (7.3%) | 0 (0.0%) |
| 10 to 14 Minutes | 6 (14.6%) | 6 (26.1%) |
| 15 to 19 Minutes | 18 (43.9%) | 6 (26.1%) |
| 20 to 24 Minutes | 4 (9.8%) | 4 (17.4%) |
| 25 to 29 Minutes | 1 (2.4%) | 0 (0.0%) |
| 30 to 34 Minutes | 5 (12.2%) | 2 (8.7%) |
| 35 to 39 Minutes | 0 (0.0%) | 1 (4.3%) |
| 40 to 44 Minutes | 0 (0.0%) | 0 (0.0%) |
| 45 to 59 Minutes | 4 (9.8%) | 2 (8.7%) |
| 60 to 89 Minutes | 0 (0.0%) | 2 (8.7%) |
| 90 or more Minutes | 0 (0.0%) | 0 (0.0%) |
Time of Departure to Work by Sex in Hallwood
The most frequent times of departure to work in Hallwood are 12:00 AM to 4:59 AM (10, 24.4%) for males and 5:30 AM to 5:59 AM (10, 43.5%) for females.
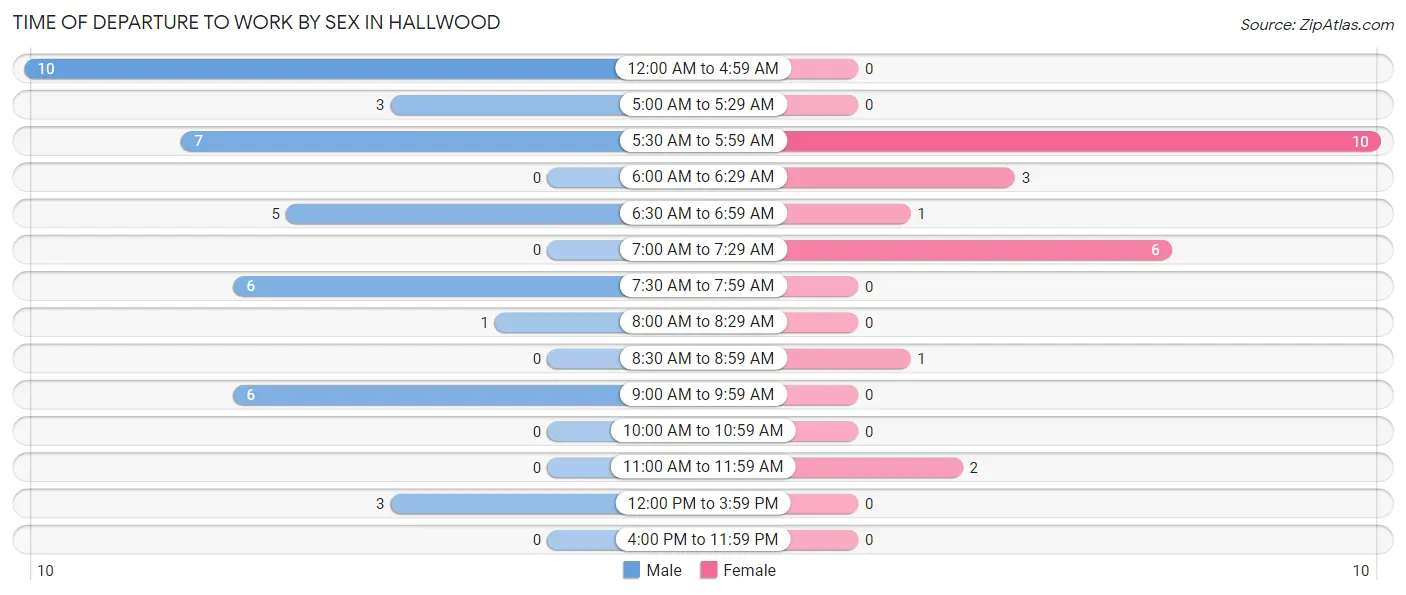
| Time of Departure | Male | Female |
| 12:00 AM to 4:59 AM | 10 (24.4%) | 0 (0.0%) |
| 5:00 AM to 5:29 AM | 3 (7.3%) | 0 (0.0%) |
| 5:30 AM to 5:59 AM | 7 (17.1%) | 10 (43.5%) |
| 6:00 AM to 6:29 AM | 0 (0.0%) | 3 (13.0%) |
| 6:30 AM to 6:59 AM | 5 (12.2%) | 1 (4.3%) |
| 7:00 AM to 7:29 AM | 0 (0.0%) | 6 (26.1%) |
| 7:30 AM to 7:59 AM | 6 (14.6%) | 0 (0.0%) |
| 8:00 AM to 8:29 AM | 1 (2.4%) | 0 (0.0%) |
| 8:30 AM to 8:59 AM | 0 (0.0%) | 1 (4.3%) |
| 9:00 AM to 9:59 AM | 6 (14.6%) | 0 (0.0%) |
| 10:00 AM to 10:59 AM | 0 (0.0%) | 0 (0.0%) |
| 11:00 AM to 11:59 AM | 0 (0.0%) | 2 (8.7%) |
| 12:00 PM to 3:59 PM | 3 (7.3%) | 0 (0.0%) |
| 4:00 PM to 11:59 PM | 0 (0.0%) | 0 (0.0%) |
| Total | 41 (100.0%) | 23 (100.0%) |
Housing Occupancy in Hallwood
Occupancy by Ownership in Hallwood
Of the total 73 dwellings in Hallwood, owner-occupied units account for 58 (79.4%), while renter-occupied units make up 15 (20.5%).
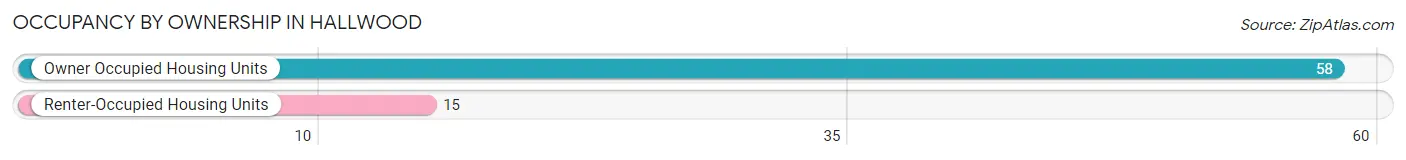
| Occupancy | # Housing Units | % Housing Units |
| Owner Occupied Housing Units | 58 | 79.4% |
| Renter-Occupied Housing Units | 15 | 20.5% |
| Total Occupied Housing Units | 73 | 100.0% |
Occupancy by Household Size in Hallwood
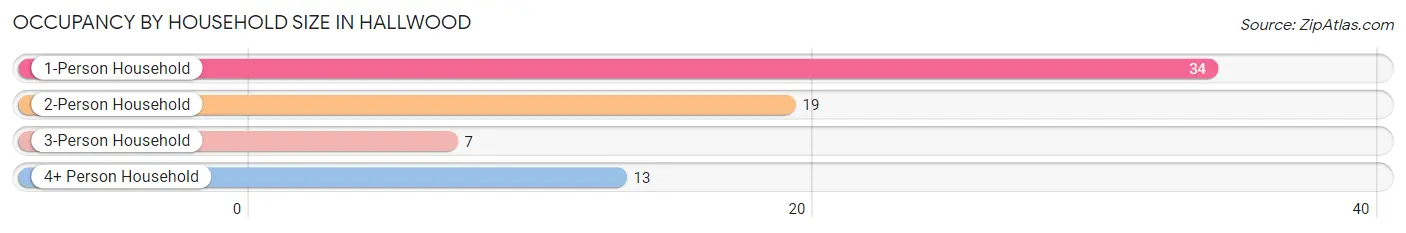
| Household Size | # Housing Units | % Housing Units |
| 1-Person Household | 34 | 46.6% |
| 2-Person Household | 19 | 26.0% |
| 3-Person Household | 7 | 9.6% |
| 4+ Person Household | 13 | 17.8% |
| Total Housing Units | 73 | 100.0% |
Occupancy by Ownership by Household Size in Hallwood
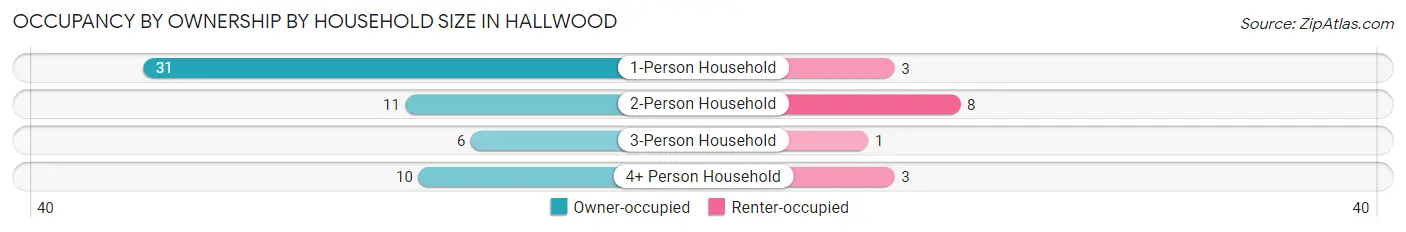
| Household Size | Owner-occupied | Renter-occupied |
| 1-Person Household | 31 (91.2%) | 3 (8.8%) |
| 2-Person Household | 11 (57.9%) | 8 (42.1%) |
| 3-Person Household | 6 (85.7%) | 1 (14.3%) |
| 4+ Person Household | 10 (76.9%) | 3 (23.1%) |
| Total Housing Units | 58 (79.4%) | 15 (20.5%) |
Occupancy by Educational Attainment in Hallwood
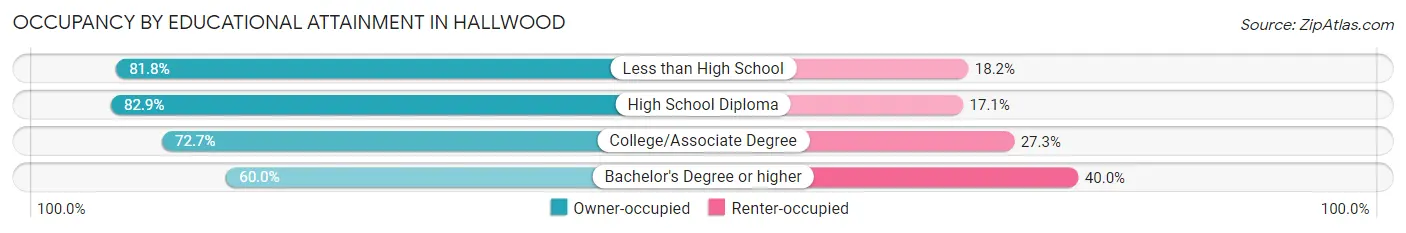
| Household Size | Owner-occupied | Renter-occupied |
| Less than High School | 18 (81.8%) | 4 (18.2%) |
| High School Diploma | 29 (82.9%) | 6 (17.1%) |
| College/Associate Degree | 8 (72.7%) | 3 (27.3%) |
| Bachelor's Degree or higher | 3 (60.0%) | 2 (40.0%) |
Occupancy by Age of Householder in Hallwood
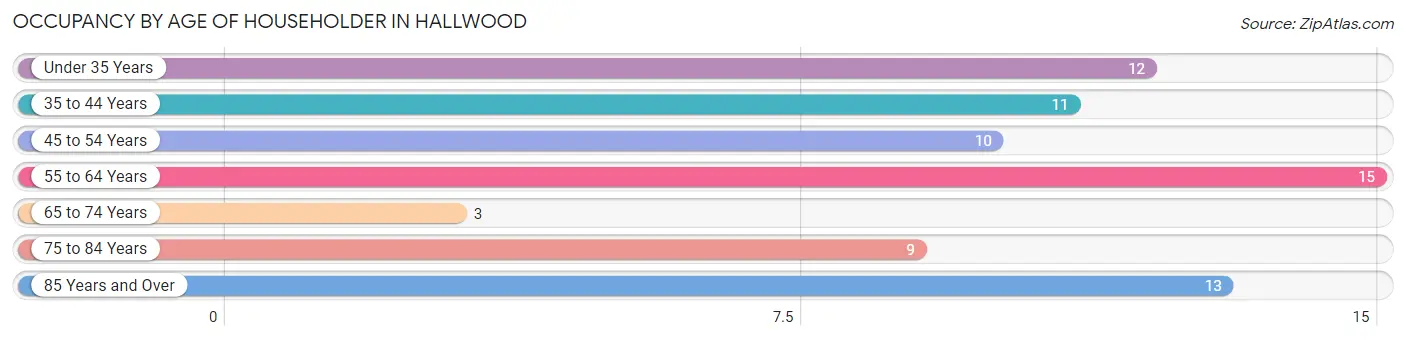
| Age Bracket | # Households | % Households |
| Under 35 Years | 12 | 16.4% |
| 35 to 44 Years | 11 | 15.1% |
| 45 to 54 Years | 10 | 13.7% |
| 55 to 64 Years | 15 | 20.5% |
| 65 to 74 Years | 3 | 4.1% |
| 75 to 84 Years | 9 | 12.3% |
| 85 Years and Over | 13 | 17.8% |
| Total | 73 | 100.0% |
Housing Finances in Hallwood
Median Income by Occupancy in Hallwood
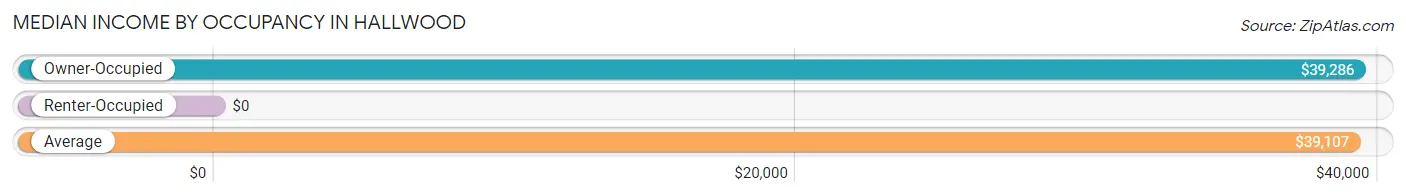
| Occupancy Type | # Households | Median Income |
| Owner-Occupied | 58 (79.4%) | $39,286 |
| Renter-Occupied | 15 (20.5%) | $0 |
| Average | 73 (100.0%) | $39,107 |
Occupancy by Householder Income Bracket in Hallwood
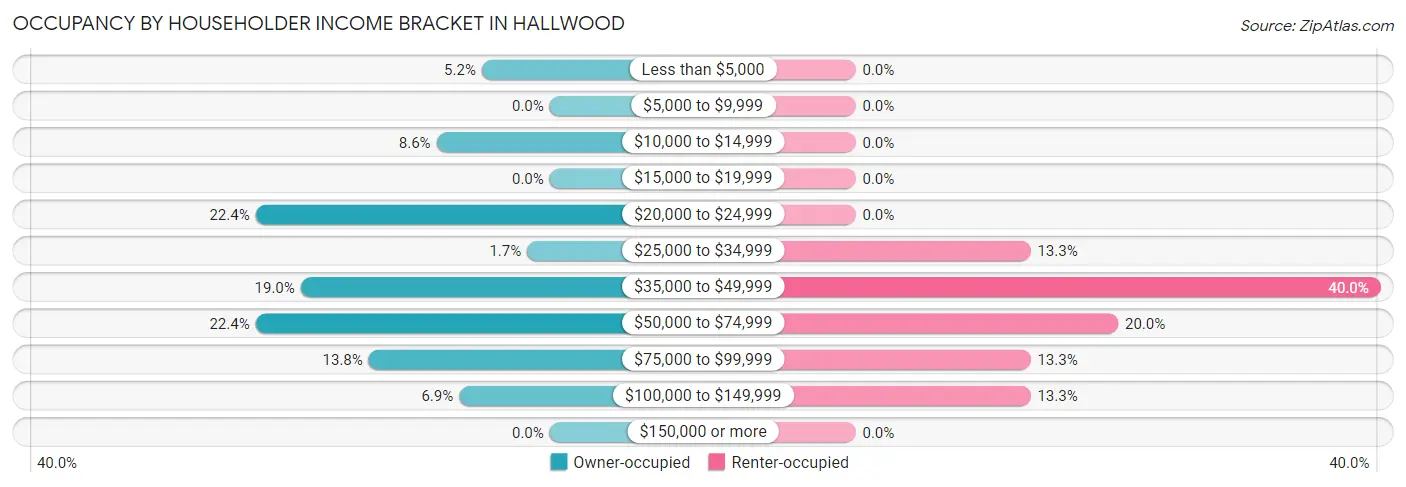
| Income Bracket | Owner-occupied | Renter-occupied |
| Less than $5,000 | 3 (5.2%) | 0 (0.0%) |
| $5,000 to $9,999 | 0 (0.0%) | 0 (0.0%) |
| $10,000 to $14,999 | 5 (8.6%) | 0 (0.0%) |
| $15,000 to $19,999 | 0 (0.0%) | 0 (0.0%) |
| $20,000 to $24,999 | 13 (22.4%) | 0 (0.0%) |
| $25,000 to $34,999 | 1 (1.7%) | 2 (13.3%) |
| $35,000 to $49,999 | 11 (19.0%) | 6 (40.0%) |
| $50,000 to $74,999 | 13 (22.4%) | 3 (20.0%) |
| $75,000 to $99,999 | 8 (13.8%) | 2 (13.3%) |
| $100,000 to $149,999 | 4 (6.9%) | 2 (13.3%) |
| $150,000 or more | 0 (0.0%) | 0 (0.0%) |
| Total | 58 (100.0%) | 15 (100.0%) |
Monthly Housing Cost Tiers in Hallwood
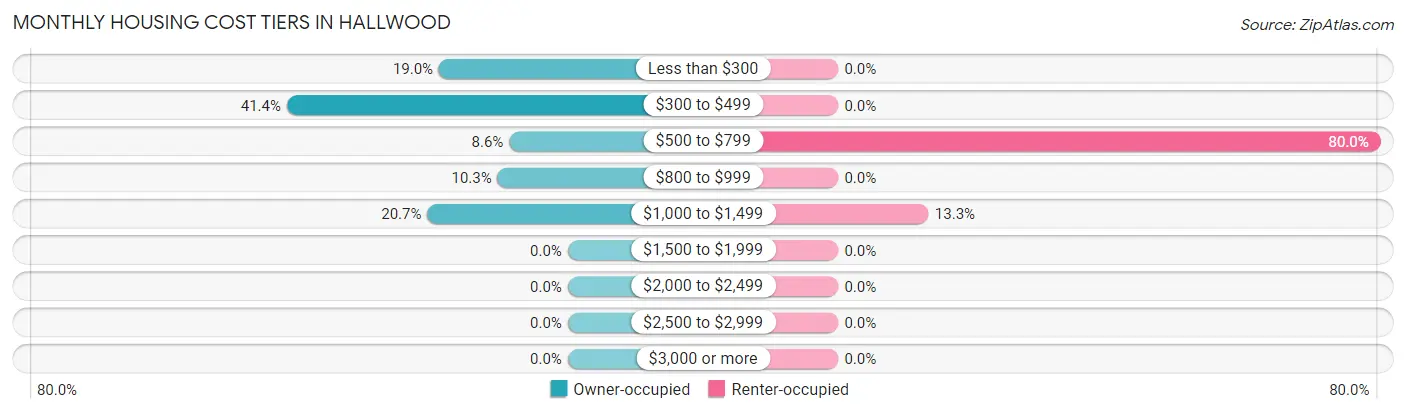
| Monthly Cost | Owner-occupied | Renter-occupied |
| Less than $300 | 11 (19.0%) | 0 (0.0%) |
| $300 to $499 | 24 (41.4%) | 0 (0.0%) |
| $500 to $799 | 5 (8.6%) | 12 (80.0%) |
| $800 to $999 | 6 (10.3%) | 0 (0.0%) |
| $1,000 to $1,499 | 12 (20.7%) | 2 (13.3%) |
| $1,500 to $1,999 | 0 (0.0%) | 0 (0.0%) |
| $2,000 to $2,499 | 0 (0.0%) | 0 (0.0%) |
| $2,500 to $2,999 | 0 (0.0%) | 0 (0.0%) |
| $3,000 or more | 0 (0.0%) | 0 (0.0%) |
| Total | 58 (100.0%) | 15 (100.0%) |
Physical Housing Characteristics in Hallwood
Housing Structures in Hallwood
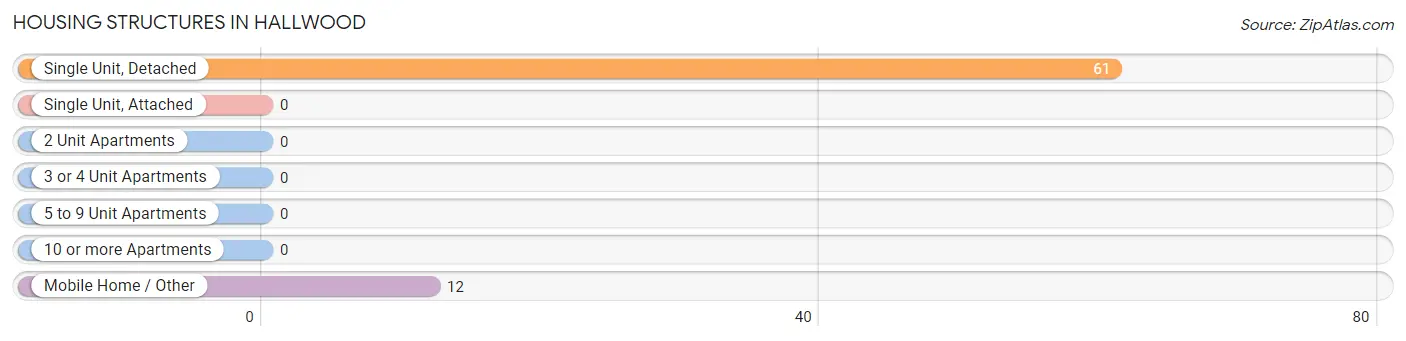
| Structure Type | # Housing Units | % Housing Units |
| Single Unit, Detached | 61 | 83.6% |
| Single Unit, Attached | 0 | 0.0% |
| 2 Unit Apartments | 0 | 0.0% |
| 3 or 4 Unit Apartments | 0 | 0.0% |
| 5 to 9 Unit Apartments | 0 | 0.0% |
| 10 or more Apartments | 0 | 0.0% |
| Mobile Home / Other | 12 | 16.4% |
| Total | 73 | 100.0% |
Housing Structures by Occupancy in Hallwood
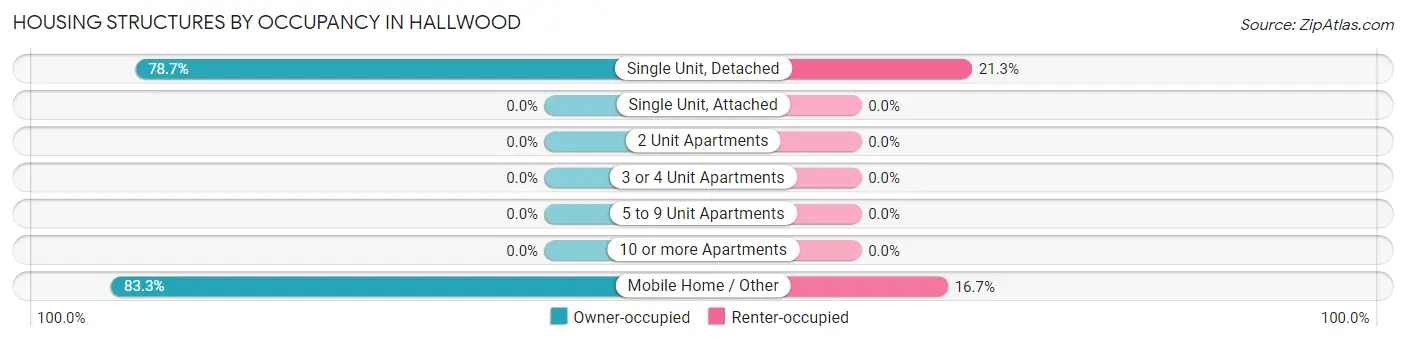
| Structure Type | Owner-occupied | Renter-occupied |
| Single Unit, Detached | 48 (78.7%) | 13 (21.3%) |
| Single Unit, Attached | 0 (0.0%) | 0 (0.0%) |
| 2 Unit Apartments | 0 (0.0%) | 0 (0.0%) |
| 3 or 4 Unit Apartments | 0 (0.0%) | 0 (0.0%) |
| 5 to 9 Unit Apartments | 0 (0.0%) | 0 (0.0%) |
| 10 or more Apartments | 0 (0.0%) | 0 (0.0%) |
| Mobile Home / Other | 10 (83.3%) | 2 (16.7%) |
| Total | 58 (79.4%) | 15 (20.5%) |
Housing Structures by Number of Rooms in Hallwood
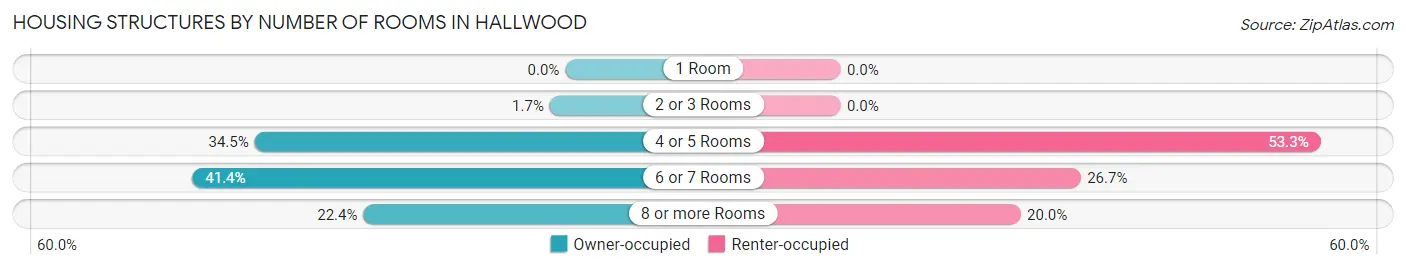
| Number of Rooms | Owner-occupied | Renter-occupied |
| 1 Room | 0 (0.0%) | 0 (0.0%) |
| 2 or 3 Rooms | 1 (1.7%) | 0 (0.0%) |
| 4 or 5 Rooms | 20 (34.5%) | 8 (53.3%) |
| 6 or 7 Rooms | 24 (41.4%) | 4 (26.7%) |
| 8 or more Rooms | 13 (22.4%) | 3 (20.0%) |
| Total | 58 (100.0%) | 15 (100.0%) |
Housing Structure by Heating Type in Hallwood
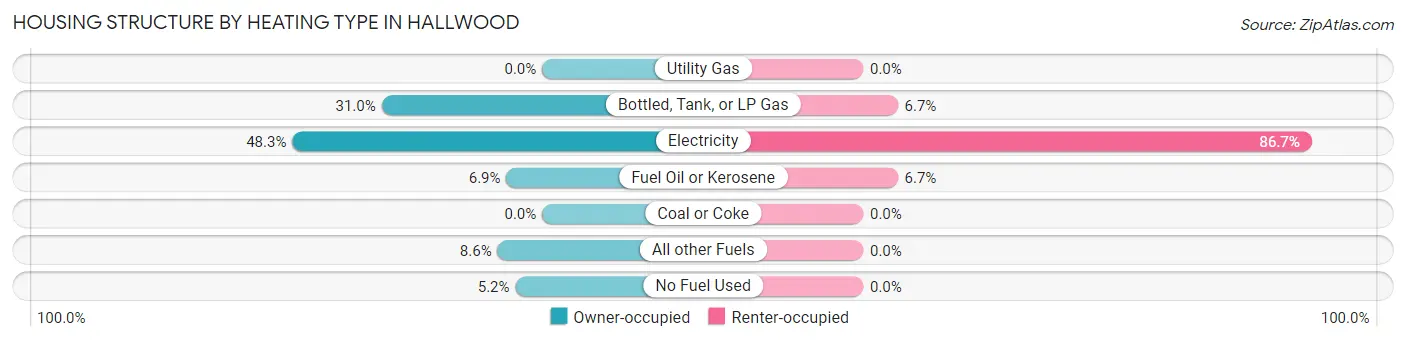
| Heating Type | Owner-occupied | Renter-occupied |
| Utility Gas | 0 (0.0%) | 0 (0.0%) |
| Bottled, Tank, or LP Gas | 18 (31.0%) | 1 (6.7%) |
| Electricity | 28 (48.3%) | 13 (86.7%) |
| Fuel Oil or Kerosene | 4 (6.9%) | 1 (6.7%) |
| Coal or Coke | 0 (0.0%) | 0 (0.0%) |
| All other Fuels | 5 (8.6%) | 0 (0.0%) |
| No Fuel Used | 3 (5.2%) | 0 (0.0%) |
| Total | 58 (100.0%) | 15 (100.0%) |
Household Vehicle Usage in Hallwood
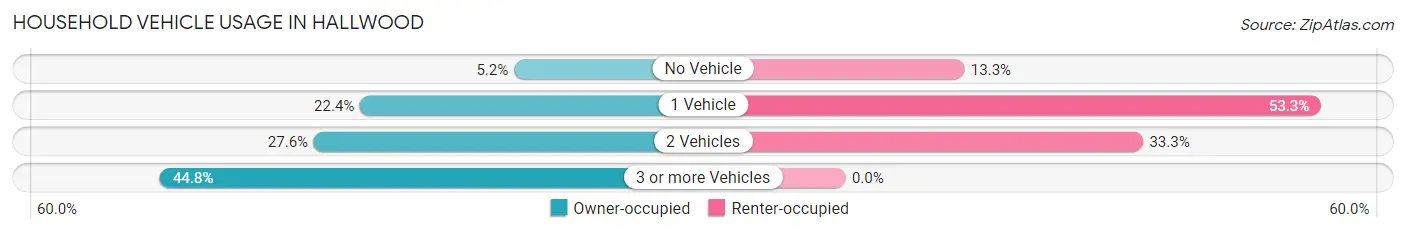
| Vehicles per Household | Owner-occupied | Renter-occupied |
| No Vehicle | 3 (5.2%) | 2 (13.3%) |
| 1 Vehicle | 13 (22.4%) | 8 (53.3%) |
| 2 Vehicles | 16 (27.6%) | 5 (33.3%) |
| 3 or more Vehicles | 26 (44.8%) | 0 (0.0%) |
| Total | 58 (100.0%) | 15 (100.0%) |
Real Estate & Mortgages in Hallwood
Real Estate and Mortgage Overview in Hallwood
| Characteristic | Without Mortgage | With Mortgage |
| Housing Units | 41 | 17 |
| Median Property Value | $96,500 | $134,400 |
| Median Household Income | $38,036 | $0 |
| Monthly Housing Costs | $367 | $0 |
| Real Estate Taxes | $475 | $2 |
Property Value by Mortgage Status in Hallwood
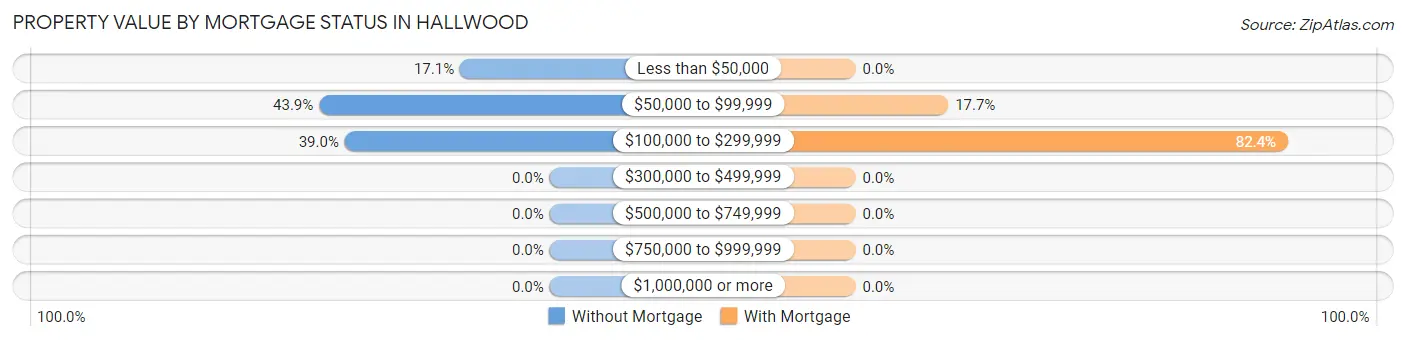
| Property Value | Without Mortgage | With Mortgage |
| Less than $50,000 | 7 (17.1%) | 0 (0.0%) |
| $50,000 to $99,999 | 18 (43.9%) | 3 (17.6%) |
| $100,000 to $299,999 | 16 (39.0%) | 14 (82.4%) |
| $300,000 to $499,999 | 0 (0.0%) | 0 (0.0%) |
| $500,000 to $749,999 | 0 (0.0%) | 0 (0.0%) |
| $750,000 to $999,999 | 0 (0.0%) | 0 (0.0%) |
| $1,000,000 or more | 0 (0.0%) | 0 (0.0%) |
| Total | 41 (100.0%) | 17 (100.0%) |
Household Income by Mortgage Status in Hallwood
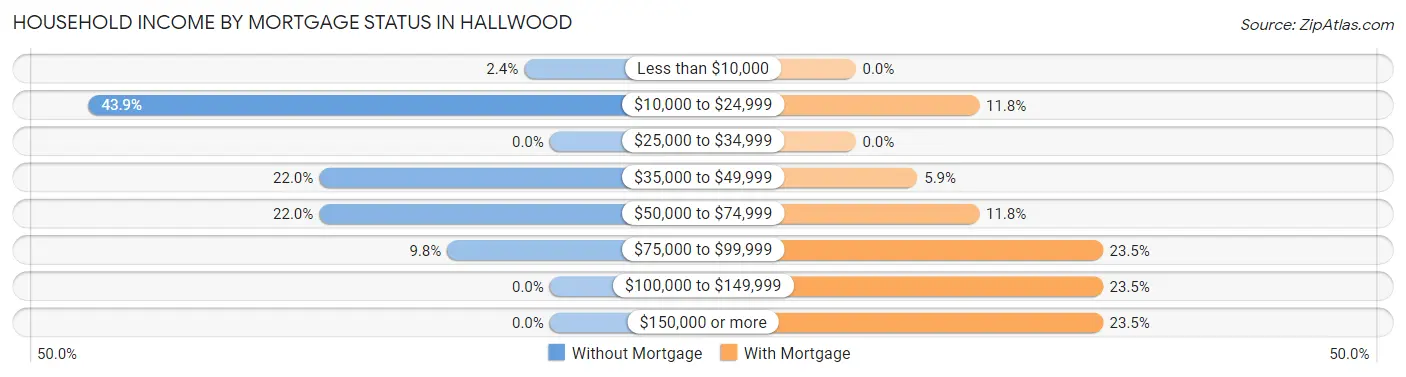
| Household Income | Without Mortgage | With Mortgage |
| Less than $10,000 | 1 (2.4%) | 0 (0.0%) |
| $10,000 to $24,999 | 18 (43.9%) | 2 (11.8%) |
| $25,000 to $34,999 | 0 (0.0%) | 0 (0.0%) |
| $35,000 to $49,999 | 9 (22.0%) | 1 (5.9%) |
| $50,000 to $74,999 | 9 (22.0%) | 2 (11.8%) |
| $75,000 to $99,999 | 4 (9.8%) | 4 (23.5%) |
| $100,000 to $149,999 | 0 (0.0%) | 4 (23.5%) |
| $150,000 or more | 0 (0.0%) | 4 (23.5%) |
| Total | 41 (100.0%) | 17 (100.0%) |
Property Value to Household Income Ratio in Hallwood
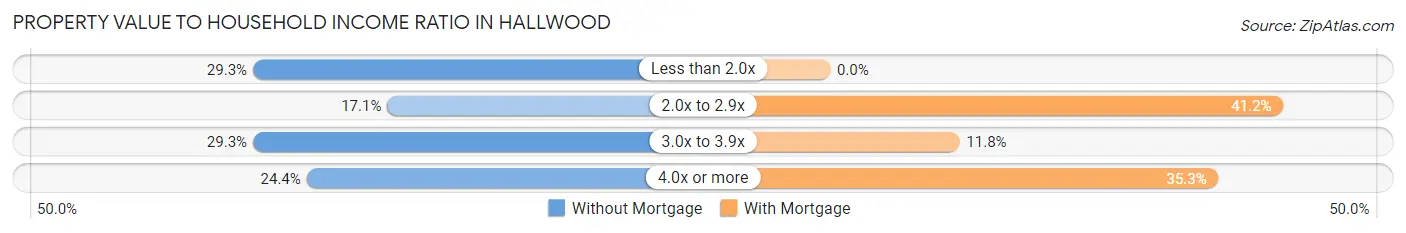
| Value-to-Income Ratio | Without Mortgage | With Mortgage |
| Less than 2.0x | 12 (29.3%) | 0 (0.0%) |
| 2.0x to 2.9x | 7 (17.1%) | 7 (41.2%) |
| 3.0x to 3.9x | 12 (29.3%) | 2 (11.8%) |
| 4.0x or more | 10 (24.4%) | 6 (35.3%) |
| Total | 41 (100.0%) | 17 (100.0%) |
Real Estate Taxes by Mortgage Status in Hallwood
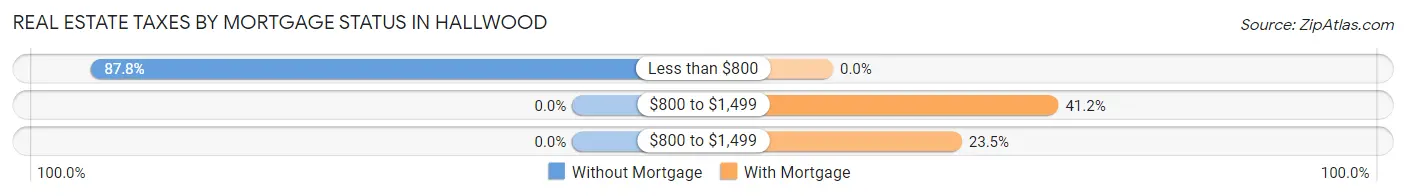
| Property Taxes | Without Mortgage | With Mortgage |
| Less than $800 | 36 (87.8%) | 0 (0.0%) |
| $800 to $1,499 | 0 (0.0%) | 7 (41.2%) |
| $800 to $1,499 | 0 (0.0%) | 4 (23.5%) |
| Total | 41 (100.0%) | 17 (100.0%) |
Health & Disability in Hallwood
Health Insurance Coverage by Age in Hallwood
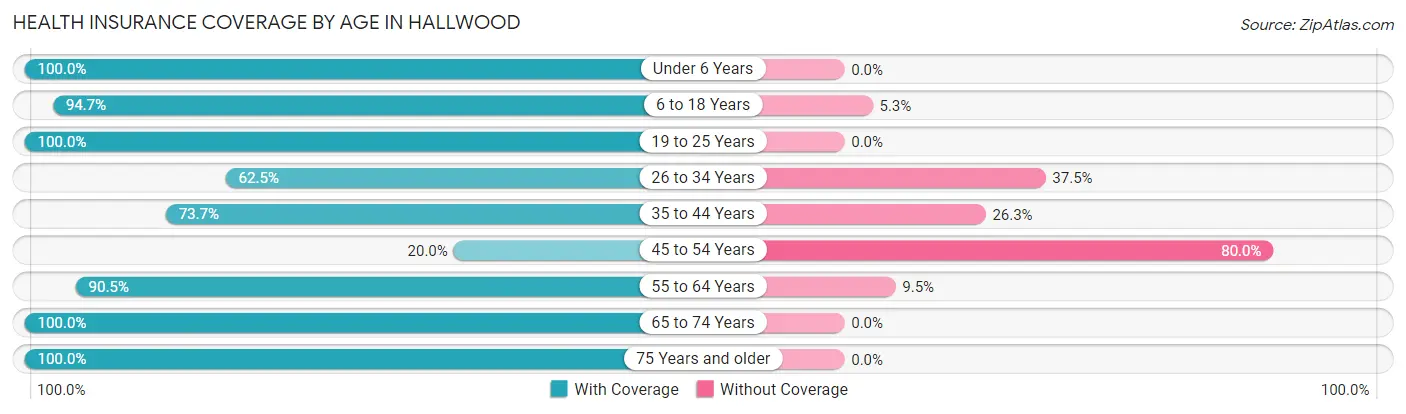
| Age Bracket | With Coverage | Without Coverage |
| Under 6 Years | 3 (100.0%) | 0 (0.0%) |
| 6 to 18 Years | 36 (94.7%) | 2 (5.3%) |
| 19 to 25 Years | 11 (100.0%) | 0 (0.0%) |
| 26 to 34 Years | 10 (62.5%) | 6 (37.5%) |
| 35 to 44 Years | 28 (73.7%) | 10 (26.3%) |
| 45 to 54 Years | 3 (20.0%) | 12 (80.0%) |
| 55 to 64 Years | 19 (90.5%) | 2 (9.5%) |
| 65 to 74 Years | 6 (100.0%) | 0 (0.0%) |
| 75 Years and older | 24 (100.0%) | 0 (0.0%) |
| Total | 140 (81.4%) | 32 (18.6%) |
Health Insurance Coverage by Citizenship Status in Hallwood
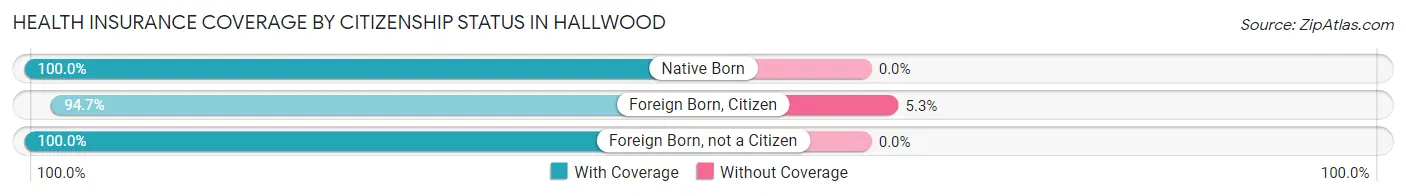
| Citizenship Status | With Coverage | Without Coverage |
| Native Born | 3 (100.0%) | 0 (0.0%) |
| Foreign Born, Citizen | 36 (94.7%) | 2 (5.3%) |
| Foreign Born, not a Citizen | 11 (100.0%) | 0 (0.0%) |
Health Insurance Coverage by Household Income in Hallwood
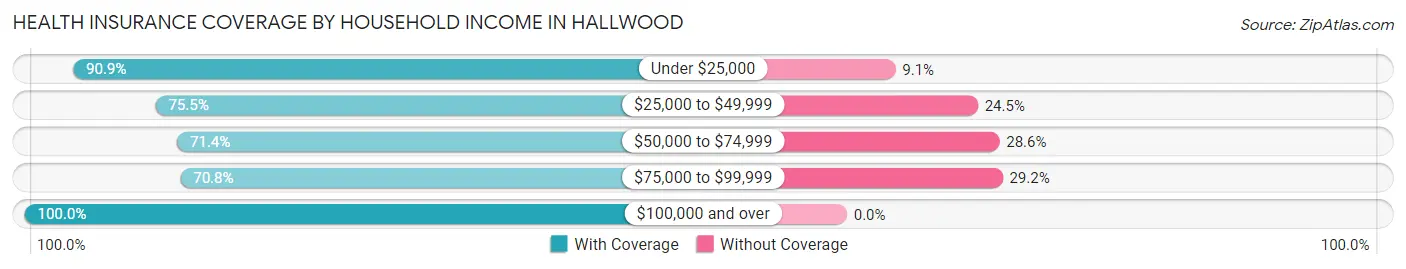
| Household Income | With Coverage | Without Coverage |
| Under $25,000 | 20 (90.9%) | 2 (9.1%) |
| $25,000 to $49,999 | 40 (75.5%) | 13 (24.5%) |
| $50,000 to $74,999 | 25 (71.4%) | 10 (28.6%) |
| $75,000 to $99,999 | 17 (70.8%) | 7 (29.2%) |
| $100,000 and over | 38 (100.0%) | 0 (0.0%) |
Public vs Private Health Insurance Coverage by Age in Hallwood
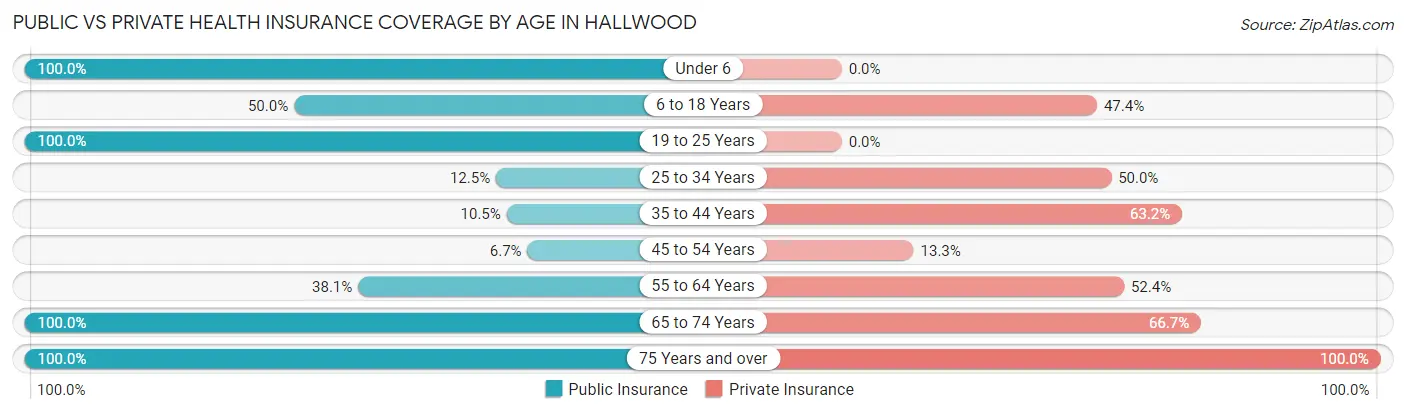
| Age Bracket | Public Insurance | Private Insurance |
| Under 6 | 3 (100.0%) | 0 (0.0%) |
| 6 to 18 Years | 19 (50.0%) | 18 (47.4%) |
| 19 to 25 Years | 11 (100.0%) | 0 (0.0%) |
| 25 to 34 Years | 2 (12.5%) | 8 (50.0%) |
| 35 to 44 Years | 4 (10.5%) | 24 (63.2%) |
| 45 to 54 Years | 1 (6.7%) | 2 (13.3%) |
| 55 to 64 Years | 8 (38.1%) | 11 (52.4%) |
| 65 to 74 Years | 6 (100.0%) | 4 (66.7%) |
| 75 Years and over | 24 (100.0%) | 24 (100.0%) |
| Total | 78 (45.4%) | 91 (52.9%) |
Disability Status by Sex by Age in Hallwood
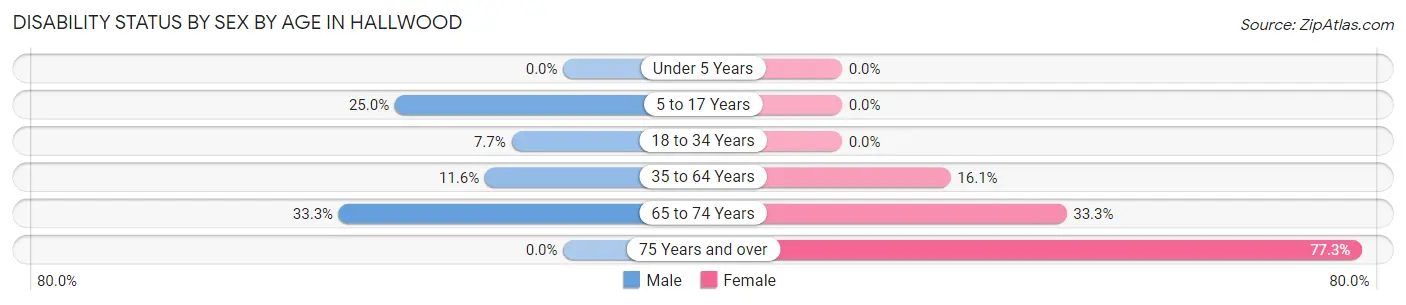
| Age Bracket | Male | Female |
| Under 5 Years | 0 (0.0%) | 0 (0.0%) |
| 5 to 17 Years | 2 (25.0%) | 0 (0.0%) |
| 18 to 34 Years | 1 (7.7%) | 0 (0.0%) |
| 35 to 64 Years | 5 (11.6%) | 5 (16.1%) |
| 65 to 74 Years | 1 (33.3%) | 1 (33.3%) |
| 75 Years and over | 0 (0.0%) | 17 (77.3%) |
Disability Class by Sex by Age in Hallwood
Disability Class: Hearing Difficulty
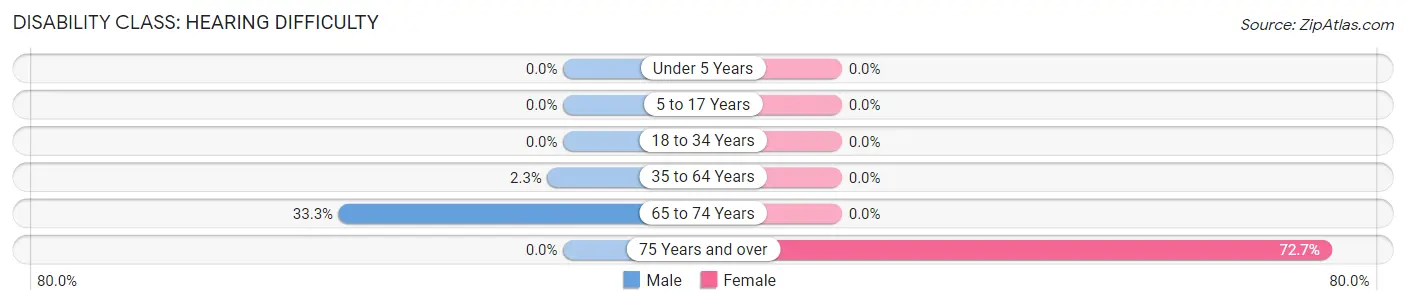
| Age Bracket | Male | Female |
| Under 5 Years | 0 (0.0%) | 0 (0.0%) |
| 5 to 17 Years | 0 (0.0%) | 0 (0.0%) |
| 18 to 34 Years | 0 (0.0%) | 0 (0.0%) |
| 35 to 64 Years | 1 (2.3%) | 0 (0.0%) |
| 65 to 74 Years | 1 (33.3%) | 0 (0.0%) |
| 75 Years and over | 0 (0.0%) | 16 (72.7%) |
Disability Class: Vision Difficulty
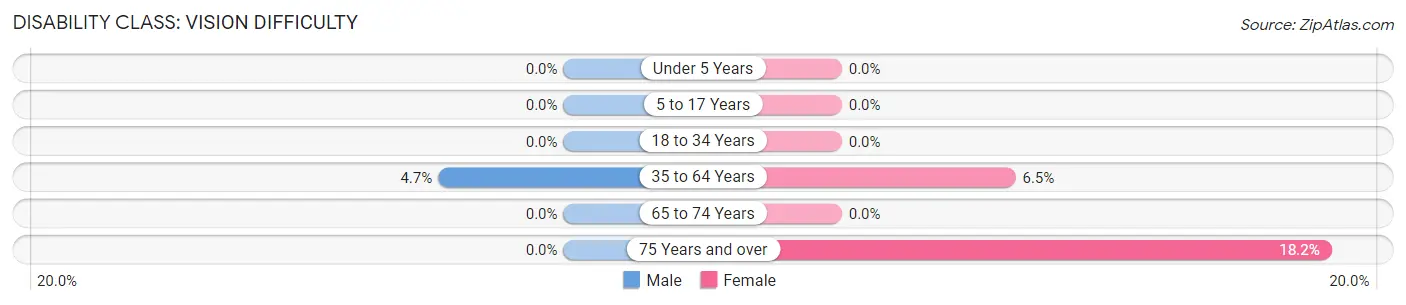
| Age Bracket | Male | Female |
| Under 5 Years | 0 (0.0%) | 0 (0.0%) |
| 5 to 17 Years | 0 (0.0%) | 0 (0.0%) |
| 18 to 34 Years | 0 (0.0%) | 0 (0.0%) |
| 35 to 64 Years | 2 (4.6%) | 2 (6.5%) |
| 65 to 74 Years | 0 (0.0%) | 0 (0.0%) |
| 75 Years and over | 0 (0.0%) | 4 (18.2%) |
Disability Class: Cognitive Difficulty
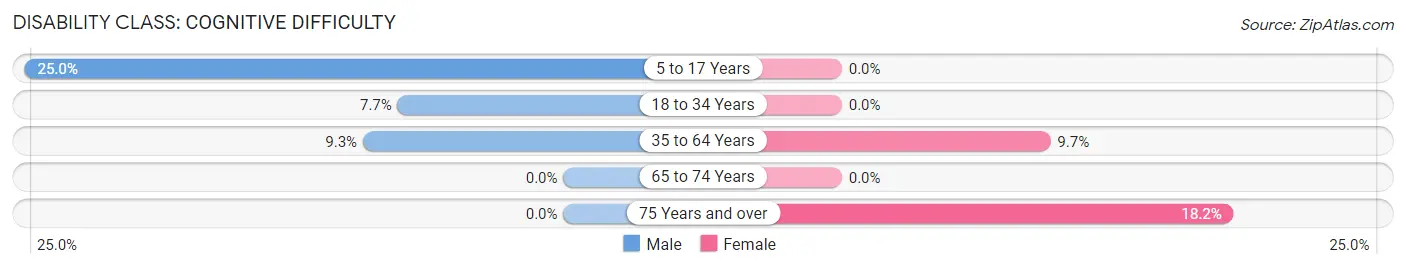
| Age Bracket | Male | Female |
| 5 to 17 Years | 2 (25.0%) | 0 (0.0%) |
| 18 to 34 Years | 1 (7.7%) | 0 (0.0%) |
| 35 to 64 Years | 4 (9.3%) | 3 (9.7%) |
| 65 to 74 Years | 0 (0.0%) | 0 (0.0%) |
| 75 Years and over | 0 (0.0%) | 4 (18.2%) |
Disability Class: Ambulatory Difficulty
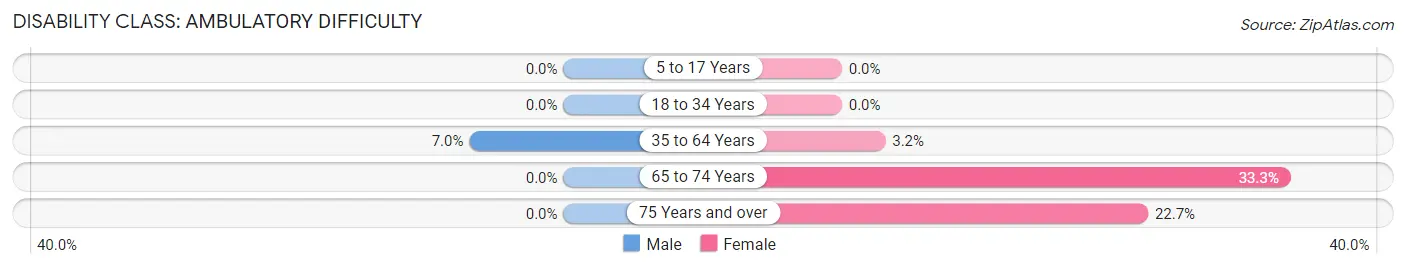
| Age Bracket | Male | Female |
| 5 to 17 Years | 0 (0.0%) | 0 (0.0%) |
| 18 to 34 Years | 0 (0.0%) | 0 (0.0%) |
| 35 to 64 Years | 3 (7.0%) | 1 (3.2%) |
| 65 to 74 Years | 0 (0.0%) | 1 (33.3%) |
| 75 Years and over | 0 (0.0%) | 5 (22.7%) |
Disability Class: Self-Care Difficulty
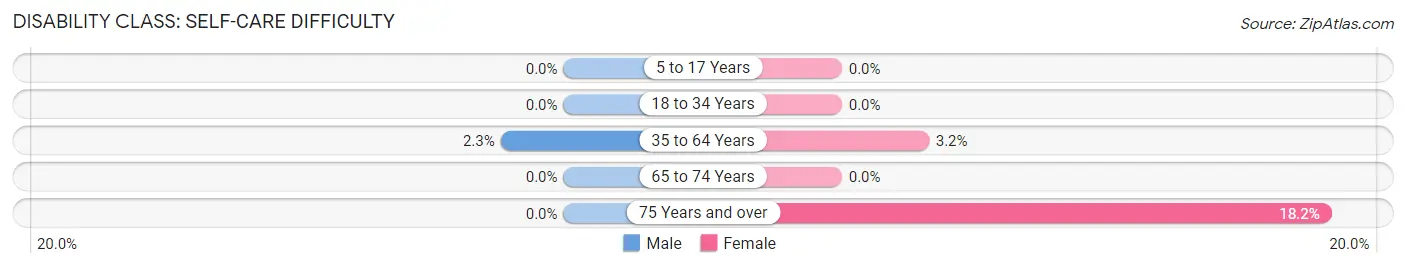
| Age Bracket | Male | Female |
| 5 to 17 Years | 0 (0.0%) | 0 (0.0%) |
| 18 to 34 Years | 0 (0.0%) | 0 (0.0%) |
| 35 to 64 Years | 1 (2.3%) | 1 (3.2%) |
| 65 to 74 Years | 0 (0.0%) | 0 (0.0%) |
| 75 Years and over | 0 (0.0%) | 4 (18.2%) |
Technology Access in Hallwood
Computing Device Access in Hallwood
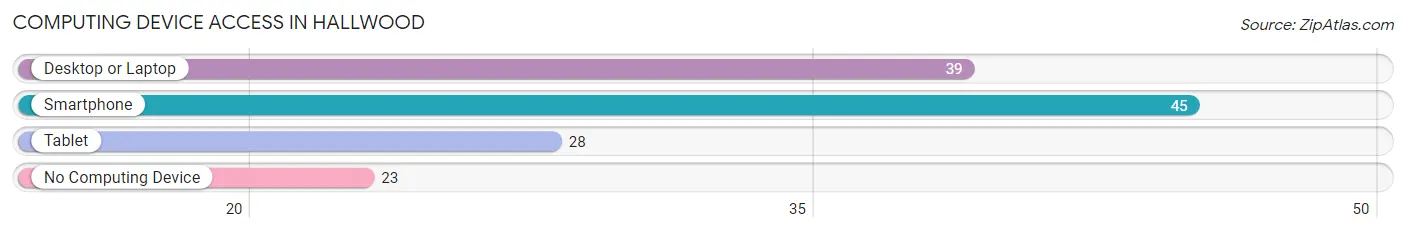
| Device Type | # Households | % Households |
| Desktop or Laptop | 39 | 53.4% |
| Smartphone | 45 | 61.6% |
| Tablet | 28 | 38.4% |
| No Computing Device | 23 | 31.5% |
| Total | 73 | 100.0% |
Internet Access in Hallwood
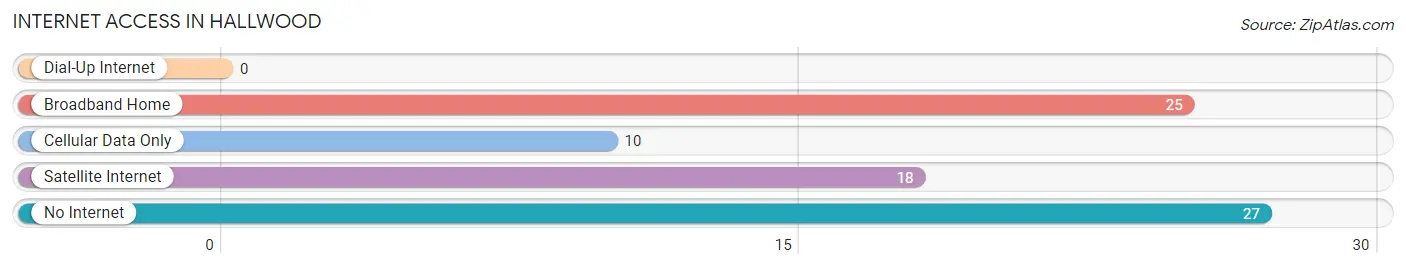
| Internet Type | # Households | % Households |
| Dial-Up Internet | 0 | 0.0% |
| Broadband Home | 25 | 34.3% |
| Cellular Data Only | 10 | 13.7% |
| Satellite Internet | 18 | 24.7% |
| No Internet | 27 | 37.0% |
| Total | 73 | 100.0% |
Hallwood Summary
Hallwood is a small town located in Accomack County, Virginia. It is situated on the Eastern Shore of the Chesapeake Bay, approximately 30 miles south of the state capital of Richmond. The town has a population of just over 500 people, and is part of the larger Hampton Roads metropolitan area.
History
Hallwood was first settled in the early 1700s by English colonists. The town was originally known as “Hall’s Woods”, named after the family who owned the land. The town was officially incorporated in 1883, and was named after the Hall family.
In the late 1800s, Hallwood was a thriving agricultural community. The town was home to several large farms, and was known for its production of corn, wheat, and other crops. The town also had a thriving oyster industry, and was home to several oyster packing houses.
In the early 1900s, Hallwood began to experience a decline in its agricultural industry. This was due to the introduction of new farming techniques and the development of larger farms in other parts of the state. As a result, many of the town’s residents began to look for other sources of income.
In the mid-1900s, Hallwood began to experience a resurgence in its economy. This was due to the development of the nearby Chincoteague National Wildlife Refuge, which brought in a large number of tourists to the area. The town also began to attract retirees from other parts of the country, who were looking for a quiet place to live.
Today, Hallwood is a small, rural town. The town is home to several small businesses, including a grocery store, a hardware store, and a few restaurants. The town is also home to a number of historic sites, including the Hallwood Historic District, which is listed on the National Register of Historic Places.
Geography
Hallwood is located in Accomack County, Virginia. The town is situated on the Eastern Shore of the Chesapeake Bay, approximately 30 miles south of the state capital of Richmond. The town is bordered by the towns of Chincoteague, Wallops Island, and Onancock.
The town is located in a flat, coastal plain. The town is surrounded by wetlands, and is home to several small creeks and streams. The town is also home to a number of small lakes, including Lake Hallwood.
Economy
Hallwood’s economy is largely based on tourism and retirement. The town is home to several small businesses, including a grocery store, a hardware store, and a few restaurants. The town is also home to a number of historic sites, including the Hallwood Historic District, which is listed on the National Register of Historic Places.
The town is also home to a number of small farms, which produce corn, wheat, and other crops. The town also has a thriving oyster industry, and is home to several oyster packing houses.
Demographics
As of the 2010 census, Hallwood had a population of 514 people. The town has a median household income of $37,500, and a median home value of $150,000. The town is predominantly white, with a small African American population. The town also has a small Hispanic population.
Common Questions
What is the Total Population of Hallwood?
Total Population of Hallwood is 172.
What is the Total Male Population of Hallwood?
Total Male Population of Hallwood is 70.
What is the Total Female Population of Hallwood?
Total Female Population of Hallwood is 102.
What is the Ratio of Males per 100 Females in Hallwood?
There are 68.63 Males per 100 Females in Hallwood.
What is the Ratio of Females per 100 Males in Hallwood?
There are 145.71 Females per 100 Males in Hallwood.
What is the Median Population Age in Hallwood?
Median Population Age in Hallwood is 40.3 Years.
What is the Average Family Size in Hallwood
Average Family Size in Hallwood is 4.1 People.
What is the Average Household Size in Hallwood
Average Household Size in Hallwood is 2.4 People.
What is Per Capita Income in Hallwood?
Per Capita income in Hallwood is $23,399.
What is the Median Family Income in Hallwood?
Median Family Income in Hallwood is $68,750.
What is the Median Household income in Hallwood?
Median Household Income in Hallwood is $39,107.
What is Income or Wage Gap in Hallwood?
Income or Wage Gap in Hallwood is 42.1%.
Women in Hallwood earn 57.9 cents for every dollar earned by a man.
What is Inequality or Gini Index in Hallwood?
Inequality or Gini Index in Hallwood is 0.36.
How Large is the Labor Force in Hallwood?
There are 76 People in the Labor Forcein in Hallwood.
What is the Percentage of People in the Labor Force in Hallwood?
54.3% of People are in the Labor Force in Hallwood.
What is the Unemployment Rate in Hallwood?
Unemployment Rate in Hallwood is 2.6%.