Spofford, TX
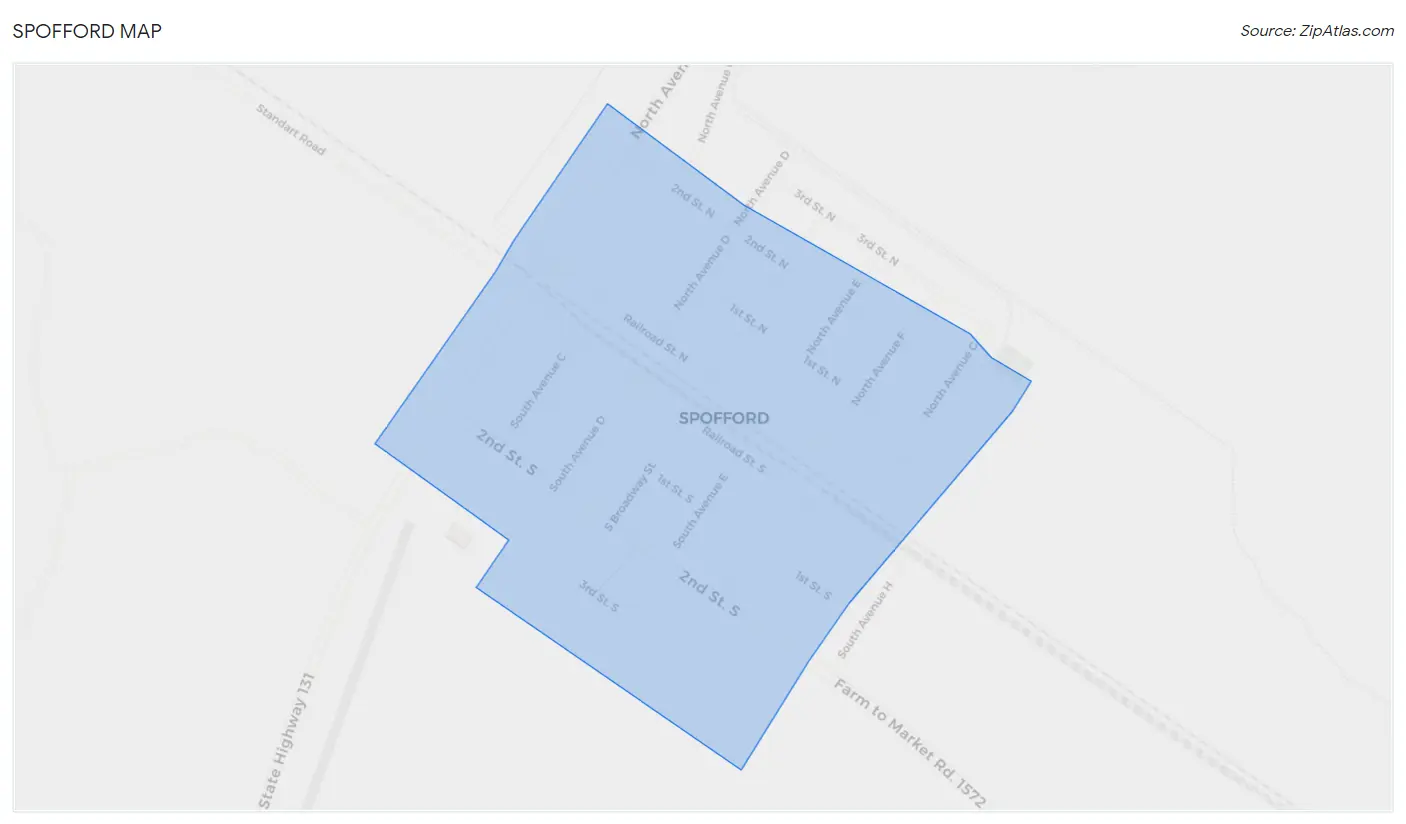
Spofford Map
Spofford Overview
103
TOTAL POPULATION
30
MALE POPULATION
73
FEMALE POPULATION
41.10
MALES / 100 FEMALES
243.33
FEMALES / 100 MALES
65.5
MEDIAN AGE
2.9
AVG FAMILY SIZE
2.9
AVG HOUSEHOLD SIZE
$42,286
PER CAPITA INCOME
$70,000
AVG FAMILY INCOME
$70,000
AVG HOUSEHOLD INCOME
0.15
INEQUALITY / GINI INDEX
68
LABOR FORCE [ PEOPLE ]
66.0%
PERCENT IN LABOR FORCE
Spofford Area Codes
Race in Spofford
The most populous races in Spofford are White / Caucasian (103 | 100.0%), and Hispanic or Latino (65 | 63.1%).
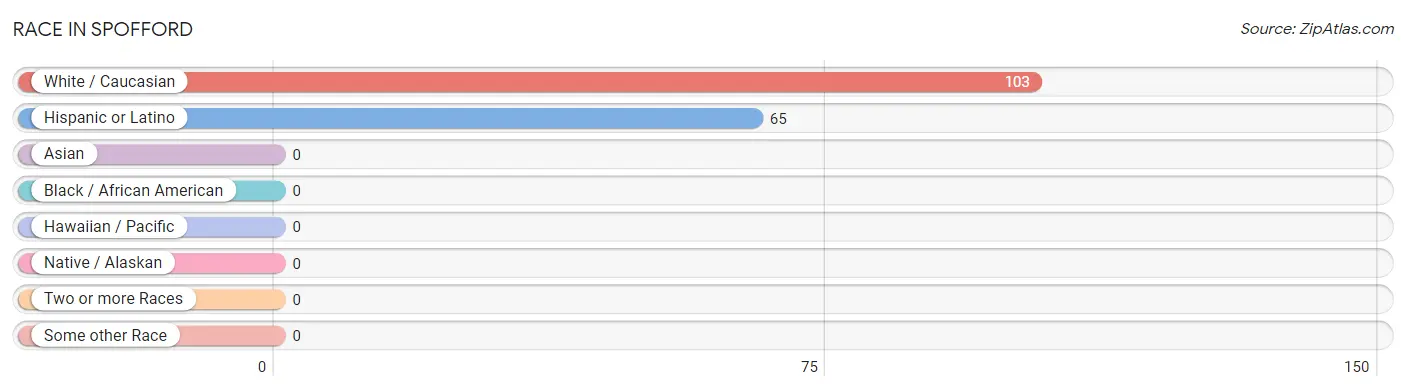
| Race | # Population | % Population |
| Asian | 0 | 0.0% |
| Black / African American | 0 | 0.0% |
| Hawaiian / Pacific | 0 | 0.0% |
| Hispanic or Latino | 65 | 63.1% |
| Native / Alaskan | 0 | 0.0% |
| White / Caucasian | 103 | 100.0% |
| Two or more Races | 0 | 0.0% |
| Some other Race | 0 | 0.0% |
| Total | 103 | 100.0% |
Ancestry in Spofford
The most populous ancestries reported in Spofford are Mexican (65 | 63.1%), English (5 | 4.9%), and Welsh (5 | 4.9%), together accounting for 72.8% of all Spofford residents.
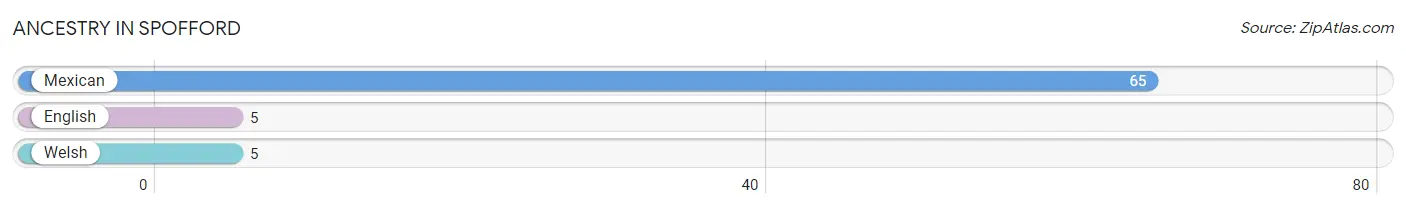
| Ancestry | # Population | % Population |
| English | 5 | 4.9% |
| Mexican | 65 | 63.1% |
| Welsh | 5 | 4.9% | View All 3 Rows |
Immigrants in Spofford

| Immigration Origin | # Population | % Population | View All 0 Rows |
Sex and Age in Spofford
Sex and Age in Spofford
The most populous age groups in Spofford are 65 to 69 Years (16 | 53.3%) for men and 45 to 49 Years (44 | 60.3%) for women.
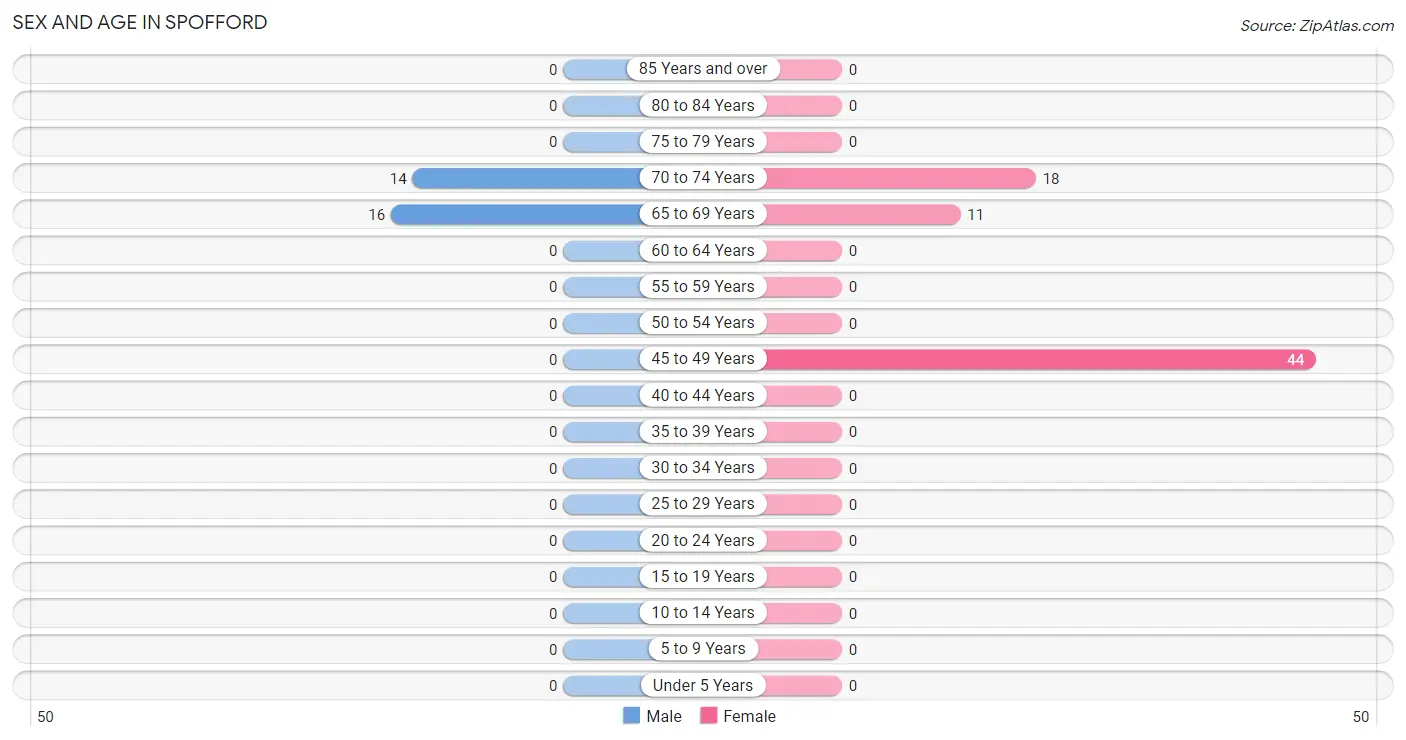
| Age Bracket | Male | Female |
| Under 5 Years | 0 (0.0%) | 0 (0.0%) |
| 5 to 9 Years | 0 (0.0%) | 0 (0.0%) |
| 10 to 14 Years | 0 (0.0%) | 0 (0.0%) |
| 15 to 19 Years | 0 (0.0%) | 0 (0.0%) |
| 20 to 24 Years | 0 (0.0%) | 0 (0.0%) |
| 25 to 29 Years | 0 (0.0%) | 0 (0.0%) |
| 30 to 34 Years | 0 (0.0%) | 0 (0.0%) |
| 35 to 39 Years | 0 (0.0%) | 0 (0.0%) |
| 40 to 44 Years | 0 (0.0%) | 0 (0.0%) |
| 45 to 49 Years | 0 (0.0%) | 44 (60.3%) |
| 50 to 54 Years | 0 (0.0%) | 0 (0.0%) |
| 55 to 59 Years | 0 (0.0%) | 0 (0.0%) |
| 60 to 64 Years | 0 (0.0%) | 0 (0.0%) |
| 65 to 69 Years | 16 (53.3%) | 11 (15.1%) |
| 70 to 74 Years | 14 (46.7%) | 18 (24.7%) |
| 75 to 79 Years | 0 (0.0%) | 0 (0.0%) |
| 80 to 84 Years | 0 (0.0%) | 0 (0.0%) |
| 85 Years and over | 0 (0.0%) | 0 (0.0%) |
| Total | 30 (100.0%) | 73 (100.0%) |
Families and Households in Spofford
Median Family Size in Spofford
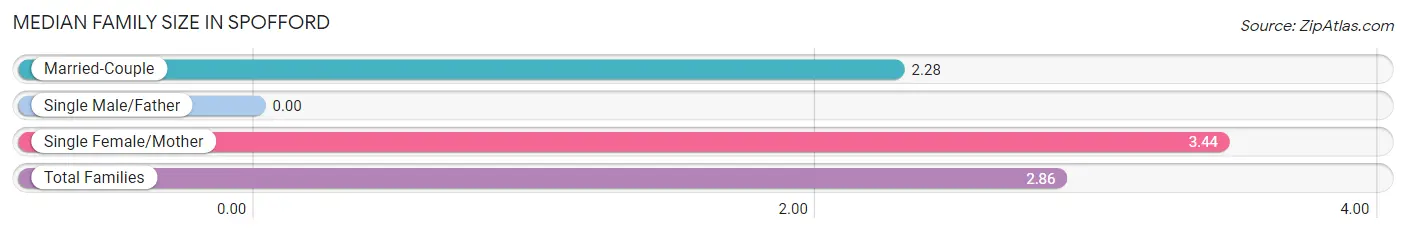
| Family Type | # Families | Family Size |
| Married-Couple | 18 (50.0%) | 2.28 |
| Single Male/Father | 0 (0.0%) | - |
| Single Female/Mother | 18 (50.0%) | 3.44 |
| Total Families | 36 (100.0%) | 2.86 |
Median Household Size in Spofford
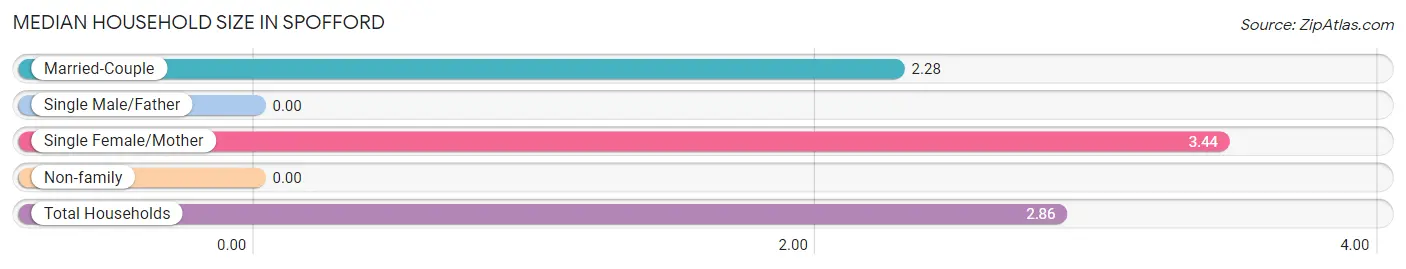
| Household Type | # Households | Household Size |
| Married-Couple | 18 (50.0%) | 2.28 |
| Single Male/Father | 0 (0.0%) | - |
| Single Female/Mother | 18 (50.0%) | 3.44 |
| Non-family | 0 (0.0%) | - |
| Total Households | 36 (100.0%) | 2.86 |
Household Size by Marriage Status in Spofford
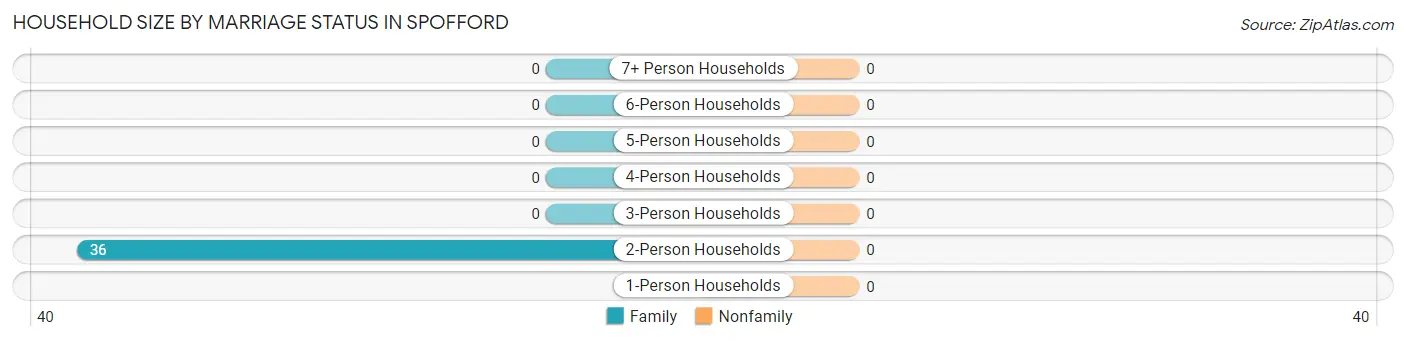
| Household Size | Family Households | Nonfamily Households |
| 1-Person Households | - | 0 (0.0%) |
| 2-Person Households | 36 (100.0%) | 0 (0.0%) |
| 3-Person Households | 0 (0.0%) | 0 (0.0%) |
| 4-Person Households | 0 (0.0%) | 0 (0.0%) |
| 5-Person Households | 0 (0.0%) | 0 (0.0%) |
| 6-Person Households | 0 (0.0%) | 0 (0.0%) |
| 7+ Person Households | 0 (0.0%) | 0 (0.0%) |
| Total | 36 (100.0%) | 0 (0.0%) |
Female Fertility in Spofford
Fertility by Age in Spofford
| Age Bracket | Women with Births | Births / 1,000 Women |
| 15 to 19 years | 0 (0.0%) | 0.0 |
| 20 to 34 years | 0 (0.0%) | 0.0 |
| 35 to 50 years | 0 (0.0%) | 0.0 |
| Total | 0 (0.0%) | 0.0 |
Fertility by Age by Marriage Status in Spofford
| Age Bracket | Married | Unmarried |
| 15 to 19 years | 0 (0.0%) | 0 (0.0%) |
| 20 to 34 years | 0 (0.0%) | 0 (0.0%) |
| 35 to 50 years | 0 (0.0%) | 0 (0.0%) |
| Total | 0 (0.0%) | 0 (0.0%) |
Fertility by Education in Spofford
| Educational Attainment | Women with Births | Births / 1,000 Women |
| Less than High School | 0 (0.0%) | 0.0 |
| High School Diploma | 0 (0.0%) | 0.0 |
| College or Associate's Degree | 0 (0.0%) | 0.0 |
| Bachelor's Degree | 0 (0.0%) | 0.0 |
| Graduate Degree | 0 (0.0%) | 0.0 |
| Total | 0 (0.0%) | 0.0 |
Fertility by Education by Marriage Status in Spofford
| Educational Attainment | Married | Unmarried |
| Less than High School | 0 (0.0%) | 0 (0.0%) |
| High School Diploma | 0 (0.0%) | 0 (0.0%) |
| College or Associate's Degree | 0 (0.0%) | 0 (0.0%) |
| Bachelor's Degree | 0 (0.0%) | 0 (0.0%) |
| Graduate Degree | 0 (0.0%) | 0 (0.0%) |
| Total | 0 (0.0%) | 0 (0.0%) |
Income in Spofford
Income Overview in Spofford
Per Capita Income in Spofford is $42,286, while median incomes of families and households are $70,000 and $70,000 respectively.
| Characteristic | Number | Measure |
| Per Capita Income | 103 | $42,286 |
| Median Family Income | 36 | $70,000 |
| Mean Family Income | 36 | $77,694 |
| Median Household Income | 36 | $70,000 |
| Mean Household Income | 36 | $77,694 |
| Income Deficit | 36 | $0 |
| Wage / Income Gap (%) | 103 | 0.00% |
| Wage / Income Gap ($) | 103 | 100.00¢ per $1 |
| Gini / Inequality Index | 103 | 0.15 |
Earnings by Sex in Spofford
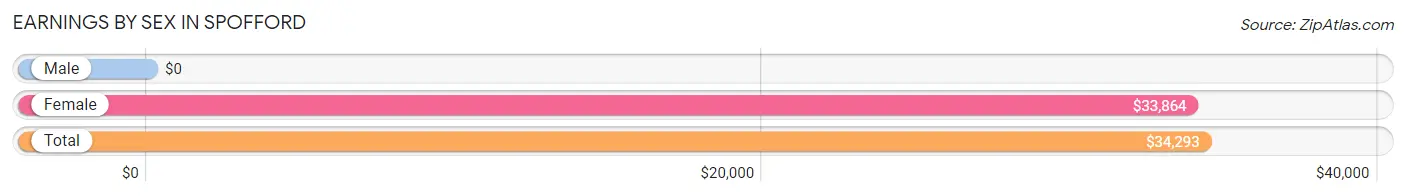
| Sex | Number | Average Earnings |
| Male | 18 (26.5%) | $0 |
| Female | 50 (73.5%) | $33,864 |
| Total | 68 (100.0%) | $34,293 |
Earnings by Sex by Income Bracket in Spofford
The most common earnings brackets in Spofford are $50,000 to $54,999 for men (16 | 88.9%) and $30,000 to $34,999 for women (44 | 88.0%).
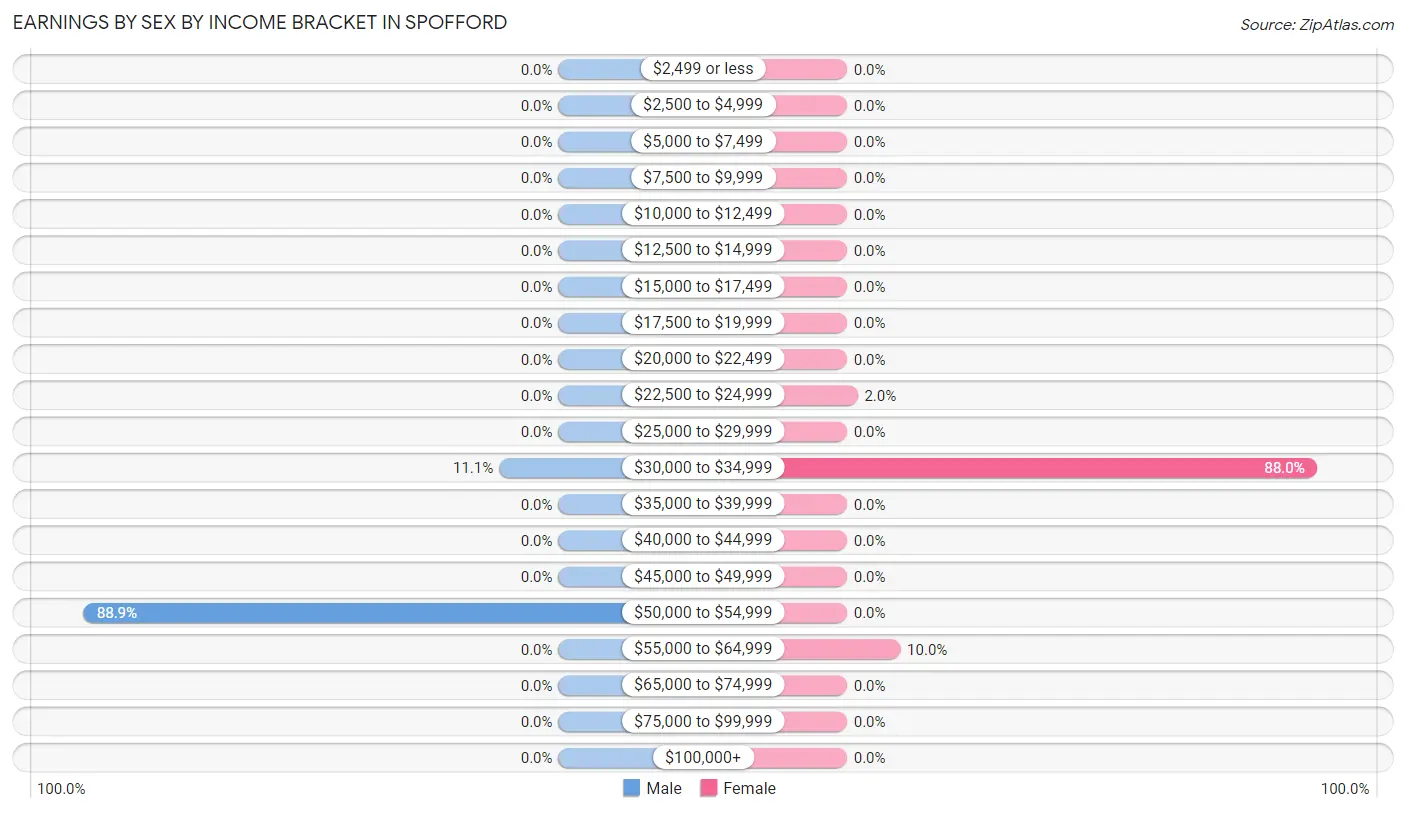
| Income | Male | Female |
| $2,499 or less | 0 (0.0%) | 0 (0.0%) |
| $2,500 to $4,999 | 0 (0.0%) | 0 (0.0%) |
| $5,000 to $7,499 | 0 (0.0%) | 0 (0.0%) |
| $7,500 to $9,999 | 0 (0.0%) | 0 (0.0%) |
| $10,000 to $12,499 | 0 (0.0%) | 0 (0.0%) |
| $12,500 to $14,999 | 0 (0.0%) | 0 (0.0%) |
| $15,000 to $17,499 | 0 (0.0%) | 0 (0.0%) |
| $17,500 to $19,999 | 0 (0.0%) | 0 (0.0%) |
| $20,000 to $22,499 | 0 (0.0%) | 0 (0.0%) |
| $22,500 to $24,999 | 0 (0.0%) | 1 (2.0%) |
| $25,000 to $29,999 | 0 (0.0%) | 0 (0.0%) |
| $30,000 to $34,999 | 2 (11.1%) | 44 (88.0%) |
| $35,000 to $39,999 | 0 (0.0%) | 0 (0.0%) |
| $40,000 to $44,999 | 0 (0.0%) | 0 (0.0%) |
| $45,000 to $49,999 | 0 (0.0%) | 0 (0.0%) |
| $50,000 to $54,999 | 16 (88.9%) | 0 (0.0%) |
| $55,000 to $64,999 | 0 (0.0%) | 5 (10.0%) |
| $65,000 to $74,999 | 0 (0.0%) | 0 (0.0%) |
| $75,000 to $99,999 | 0 (0.0%) | 0 (0.0%) |
| $100,000+ | 0 (0.0%) | 0 (0.0%) |
| Total | 18 (100.0%) | 50 (100.0%) |
Earnings by Sex by Educational Attainment in Spofford
| Educational Attainment | Male Income | Female Income |
| Less than High School | - | - |
| High School Diploma | - | - |
| College or Associate's Degree | - | - |
| Bachelor's Degree | - | - |
| Graduate Degree | - | - |
| Total | - | - |
Family Income in Spofford
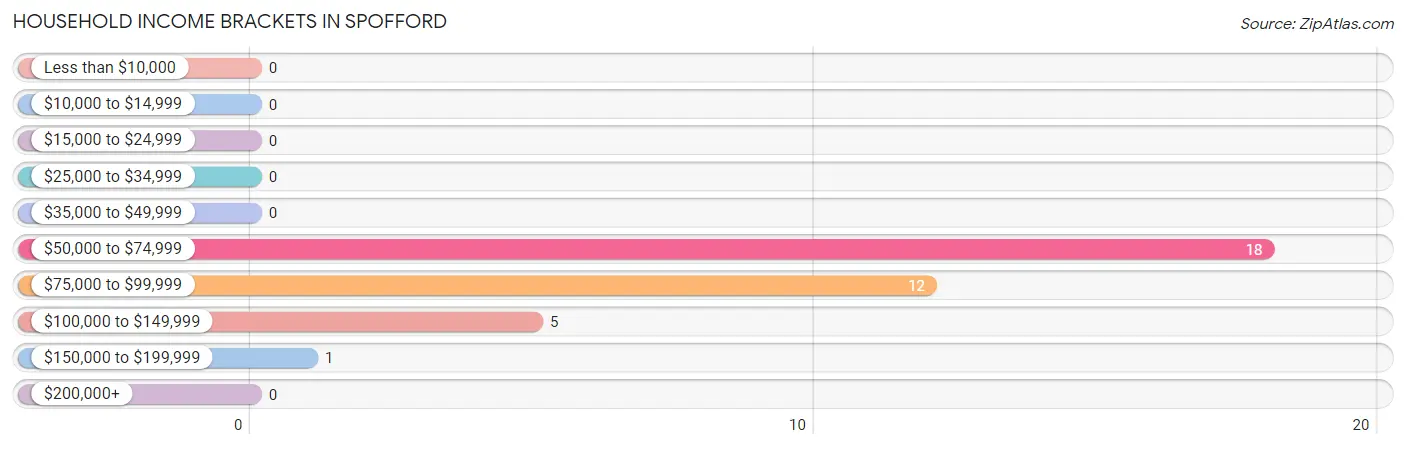
Family Income Brackets in Spofford
According to the Spofford family income data, there are 18 families falling into the $50,000 to $74,999 income range, which is the most common income bracket and makes up 50.0% of all families.
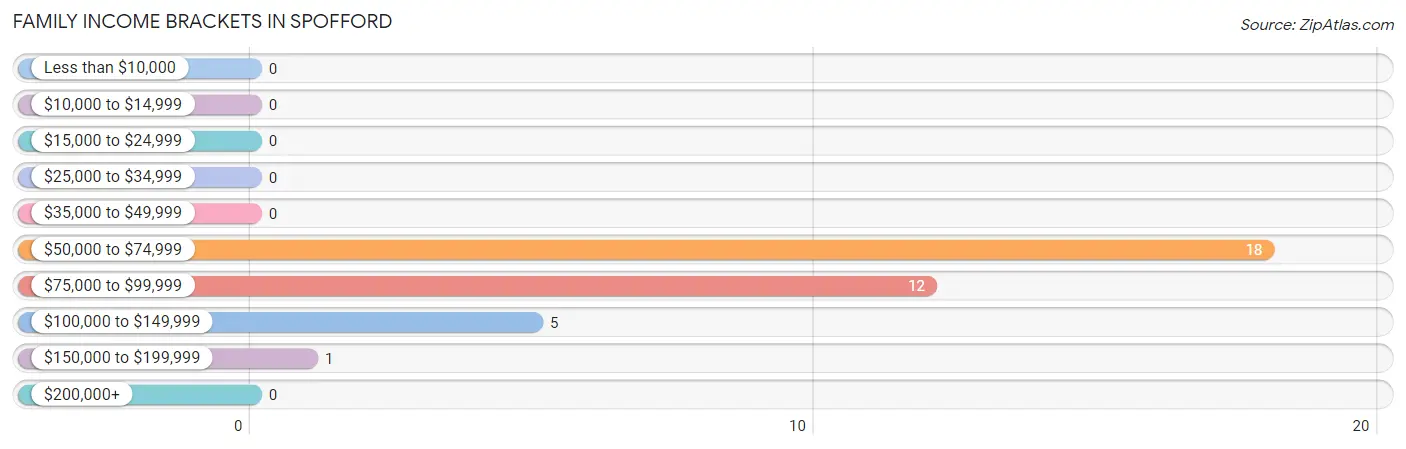
| Income Bracket | # Families | % Families |
| Less than $10,000 | 0 | 0.0% |
| $10,000 to $14,999 | 0 | 0.0% |
| $15,000 to $24,999 | 0 | 0.0% |
| $25,000 to $34,999 | 0 | 0.0% |
| $35,000 to $49,999 | 0 | 0.0% |
| $50,000 to $74,999 | 18 | 50.0% |
| $75,000 to $99,999 | 12 | 33.3% |
| $100,000 to $149,999 | 5 | 13.9% |
| $150,000 to $199,999 | 1 | 2.8% |
| $200,000+ | 0 | 0.0% |
Family Income by Famaliy Size in Spofford
2-person families (36 | 100.0%) account for the highest median family income in Spofford with $70,000 per family, while 2-person families (36 | 100.0%) have the highest median income of $35,000 per family member.
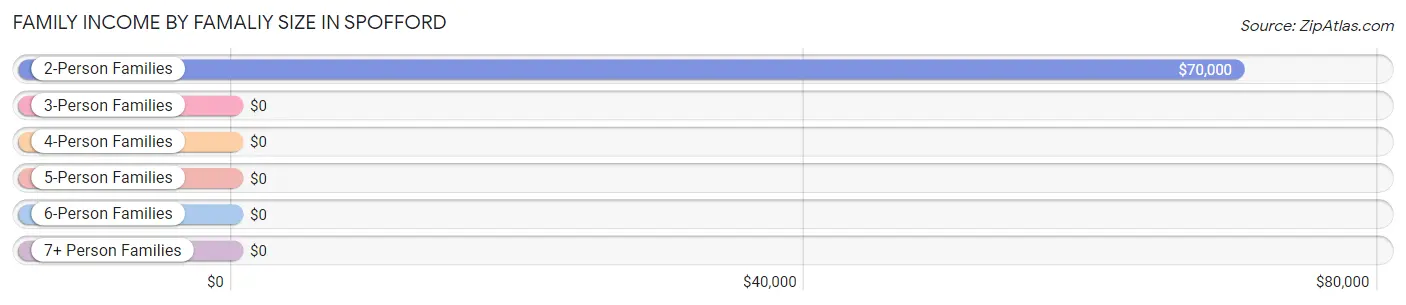
| Income Bracket | # Families | Median Income |
| 2-Person Families | 36 (100.0%) | $70,000 |
| 3-Person Families | 0 (0.0%) | $0 |
| 4-Person Families | 0 (0.0%) | $0 |
| 5-Person Families | 0 (0.0%) | $0 |
| 6-Person Families | 0 (0.0%) | $0 |
| 7+ Person Families | 0 (0.0%) | $0 |
| Total | 36 (100.0%) | $70,000 |
Family Income by Number of Earners in Spofford
| Number of Earners | # Families | Median Income |
| No Earners | 12 (33.3%) | $0 |
| 1 Earner | 18 (50.0%) | $0 |
| 2 Earners | 6 (16.7%) | $0 |
| 3+ Earners | 0 (0.0%) | $0 |
| Total | 36 (100.0%) | $70,000 |
Household Income in Spofford
Household Income Brackets in Spofford
With 18 households falling in the category, the $50,000 to $74,999 income range is the most frequent in Spofford, accounting for 50.0% of all households.
| Income Bracket | # Households | % Households |
| Less than $10,000 | 0 | 0.0% |
| $10,000 to $14,999 | 0 | 0.0% |
| $15,000 to $24,999 | 0 | 0.0% |
| $25,000 to $34,999 | 0 | 0.0% |
| $35,000 to $49,999 | 0 | 0.0% |
| $50,000 to $74,999 | 18 | 50.0% |
| $75,000 to $99,999 | 12 | 33.3% |
| $100,000 to $149,999 | 5 | 13.9% |
| $150,000 to $199,999 | 1 | 2.8% |
| $200,000+ | 0 | 0.0% |
Household Income by Householder Age in Spofford
The median household income in Spofford is $70,000, with the highest median household income of $70,000 found in the 65+ years age bracket for the primary householder. A total of 36 households (100.0%) fall into this category.
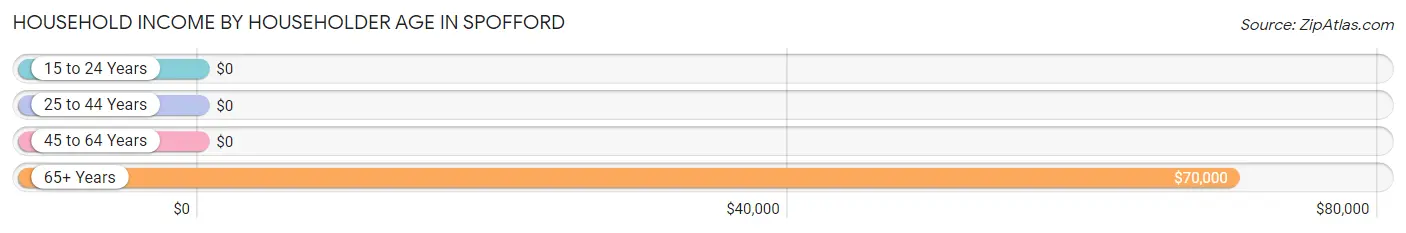
| Income Bracket | # Households | Median Income |
| 15 to 24 Years | 0 (0.0%) | $0 |
| 25 to 44 Years | 0 (0.0%) | $0 |
| 45 to 64 Years | 0 (0.0%) | $0 |
| 65+ Years | 36 (100.0%) | $70,000 |
| Total | 36 (100.0%) | $70,000 |
Poverty in Spofford
Income Below Poverty by Sex and Age in Spofford
| Age Bracket | Male | Female |
| Under 5 Years | 0 (0.0%) | 0 (0.0%) |
| 5 Years | 0 (0.0%) | 0 (0.0%) |
| 6 to 11 Years | 0 (0.0%) | 0 (0.0%) |
| 12 to 14 Years | 0 (0.0%) | 0 (0.0%) |
| 15 Years | 0 (0.0%) | 0 (0.0%) |
| 16 and 17 Years | 0 (0.0%) | 0 (0.0%) |
| 18 to 24 Years | 0 (0.0%) | 0 (0.0%) |
| 25 to 34 Years | 0 (0.0%) | 0 (0.0%) |
| 35 to 44 Years | 0 (0.0%) | 0 (0.0%) |
| 45 to 54 Years | 0 (0.0%) | 0 (0.0%) |
| 55 to 64 Years | 0 (0.0%) | 0 (0.0%) |
| 65 to 74 Years | 0 (0.0%) | 0 (0.0%) |
| 75 Years and over | 0 (0.0%) | 0 (0.0%) |
| Total | 0 (0.0%) | 0 (0.0%) |
Income Above Poverty by Sex and Age in Spofford
According to the poverty statistics in Spofford, males aged 65 to 74 years and females aged 45 to 54 years are the age groups that are most secure financially, with 100.0% of males and 100.0% of females in these age groups living above the poverty line.
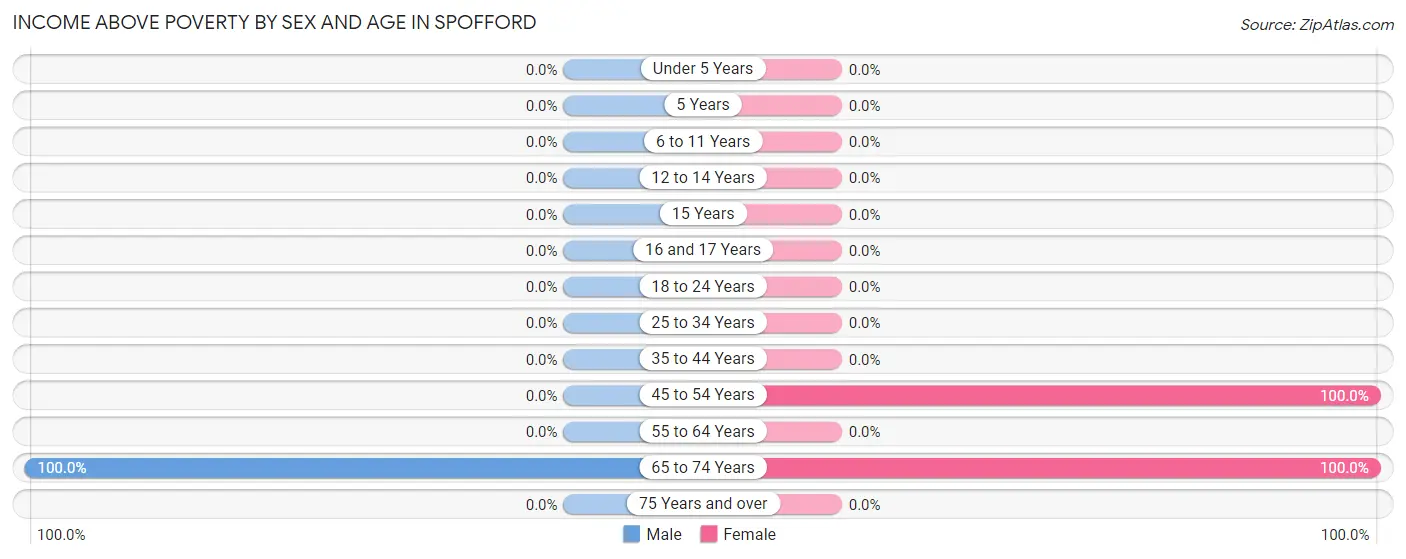
| Age Bracket | Male | Female |
| Under 5 Years | 0 (0.0%) | 0 (0.0%) |
| 5 Years | 0 (0.0%) | 0 (0.0%) |
| 6 to 11 Years | 0 (0.0%) | 0 (0.0%) |
| 12 to 14 Years | 0 (0.0%) | 0 (0.0%) |
| 15 Years | 0 (0.0%) | 0 (0.0%) |
| 16 and 17 Years | 0 (0.0%) | 0 (0.0%) |
| 18 to 24 Years | 0 (0.0%) | 0 (0.0%) |
| 25 to 34 Years | 0 (0.0%) | 0 (0.0%) |
| 35 to 44 Years | 0 (0.0%) | 0 (0.0%) |
| 45 to 54 Years | 0 (0.0%) | 44 (100.0%) |
| 55 to 64 Years | 0 (0.0%) | 0 (0.0%) |
| 65 to 74 Years | 30 (100.0%) | 29 (100.0%) |
| 75 Years and over | 0 (0.0%) | 0 (0.0%) |
| Total | 30 (100.0%) | 73 (100.0%) |
Income Below Poverty Among Married-Couple Families in Spofford
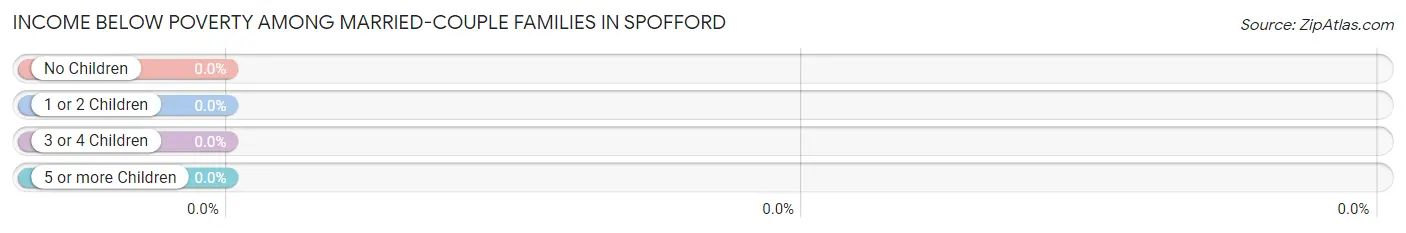
| Children | Above Poverty | Below Poverty |
| No Children | 18 (100.0%) | 0 (0.0%) |
| 1 or 2 Children | 0 (0.0%) | 0 (0.0%) |
| 3 or 4 Children | 0 (0.0%) | 0 (0.0%) |
| 5 or more Children | 0 (0.0%) | 0 (0.0%) |
| Total | 18 (100.0%) | 0 (0.0%) |
Income Below Poverty Among Single-Parent Households in Spofford
| Children | Single Father | Single Mother |
| No Children | 0 (0.0%) | 0 (0.0%) |
| 1 or 2 Children | 0 (0.0%) | 0 (0.0%) |
| 3 or 4 Children | 0 (0.0%) | 0 (0.0%) |
| 5 or more Children | 0 (0.0%) | 0 (0.0%) |
| Total | 0 (0.0%) | 0 (0.0%) |
Income Below Poverty Among Married-Couple vs Single-Parent Households in Spofford
| Children | Married-Couple Families | Single-Parent Households |
| No Children | 0 (0.0%) | 0 (0.0%) |
| 1 or 2 Children | 0 (0.0%) | 0 (0.0%) |
| 3 or 4 Children | 0 (0.0%) | 0 (0.0%) |
| 5 or more Children | 0 (0.0%) | 0 (0.0%) |
| Total | 0 (0.0%) | 0 (0.0%) |
Employment Characteristics in Spofford
Employment by Class of Employer in Spofford
Among the 68 employed individuals in Spofford, private company employees (65 | 95.6%), state government employees (2 | 2.9%), and local government employees (1 | 1.5%) make up the most common classes of employment.
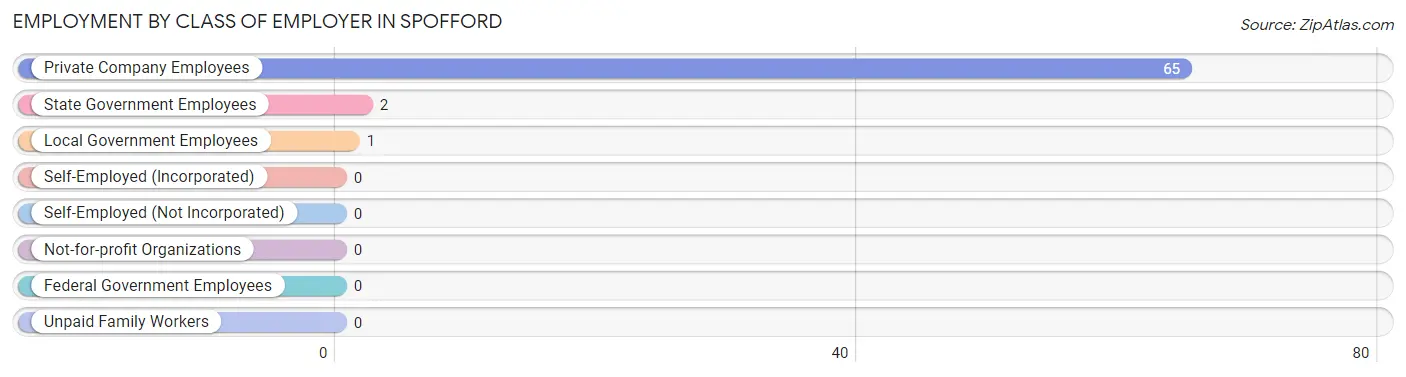
| Employer Class | # Employees | % Employees |
| Private Company Employees | 65 | 95.6% |
| Self-Employed (Incorporated) | 0 | 0.0% |
| Self-Employed (Not Incorporated) | 0 | 0.0% |
| Not-for-profit Organizations | 0 | 0.0% |
| Local Government Employees | 1 | 1.5% |
| State Government Employees | 2 | 2.9% |
| Federal Government Employees | 0 | 0.0% |
| Unpaid Family Workers | 0 | 0.0% |
| Total | 68 | 100.0% |
Employment Status by Age in Spofford
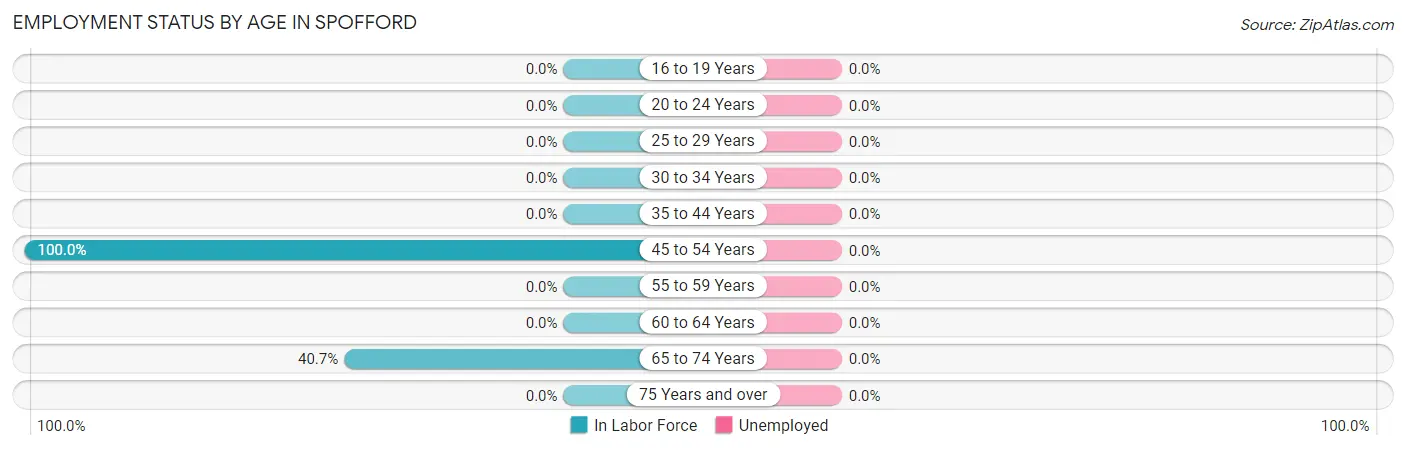
| Age Bracket | In Labor Force | Unemployed |
| 16 to 19 Years | 0 (0.0%) | 0 (0.0%) |
| 20 to 24 Years | 0 (0.0%) | 0 (0.0%) |
| 25 to 29 Years | 0 (0.0%) | 0 (0.0%) |
| 30 to 34 Years | 0 (0.0%) | 0 (0.0%) |
| 35 to 44 Years | 0 (0.0%) | 0 (0.0%) |
| 45 to 54 Years | 44 (100.0%) | 0 (0.0%) |
| 55 to 59 Years | 0 (0.0%) | 0 (0.0%) |
| 60 to 64 Years | 0 (0.0%) | 0 (0.0%) |
| 65 to 74 Years | 24 (40.7%) | 0 (0.0%) |
| 75 Years and over | 0 (0.0%) | 0 (0.0%) |
| Total | 68 (66.0%) | 0 (0.0%) |
Employment Status by Educational Attainment in Spofford
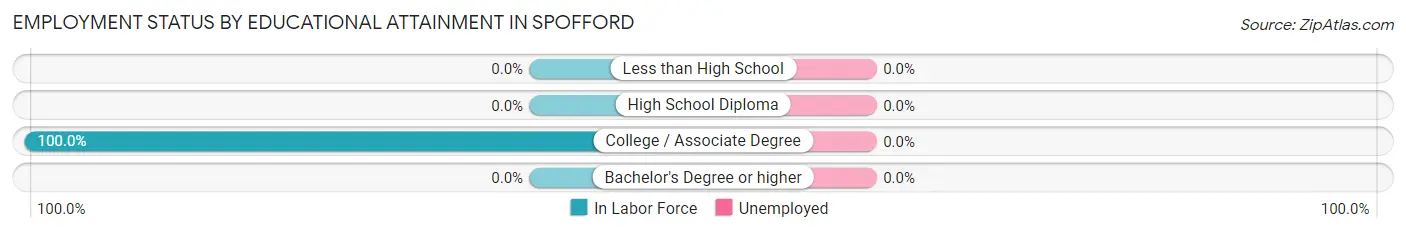
| Educational Attainment | In Labor Force | Unemployed |
| Less than High School | 0 (0.0%) | 0 (0.0%) |
| High School Diploma | 0 (0.0%) | 0 (0.0%) |
| College / Associate Degree | 44 (100.0%) | 0 (0.0%) |
| Bachelor's Degree or higher | 0 (0.0%) | 0 (0.0%) |
| Total | 44 (100.0%) | 0 (0.0%) |
Employment Occupations by Sex in Spofford
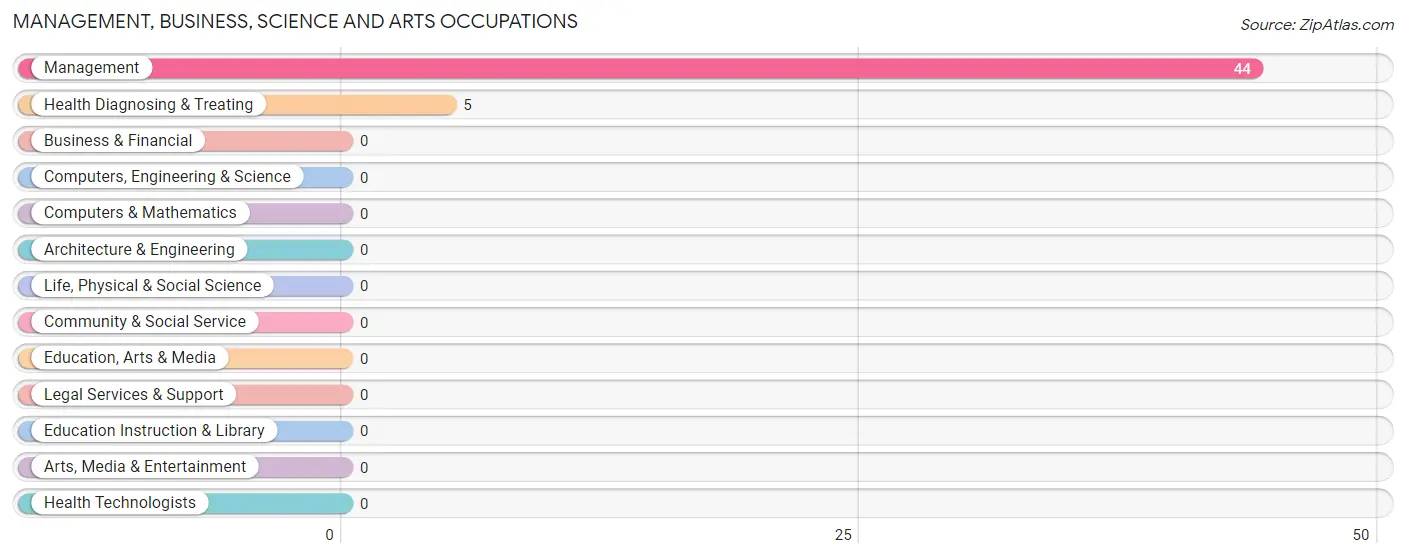
Management, Business, Science and Arts Occupations
The most common Management, Business, Science and Arts occupations in Spofford are Management (44 | 64.7%), and Health Diagnosing & Treating (5 | 7.3%).
Management, Business, Science and Arts Occupations by Sex
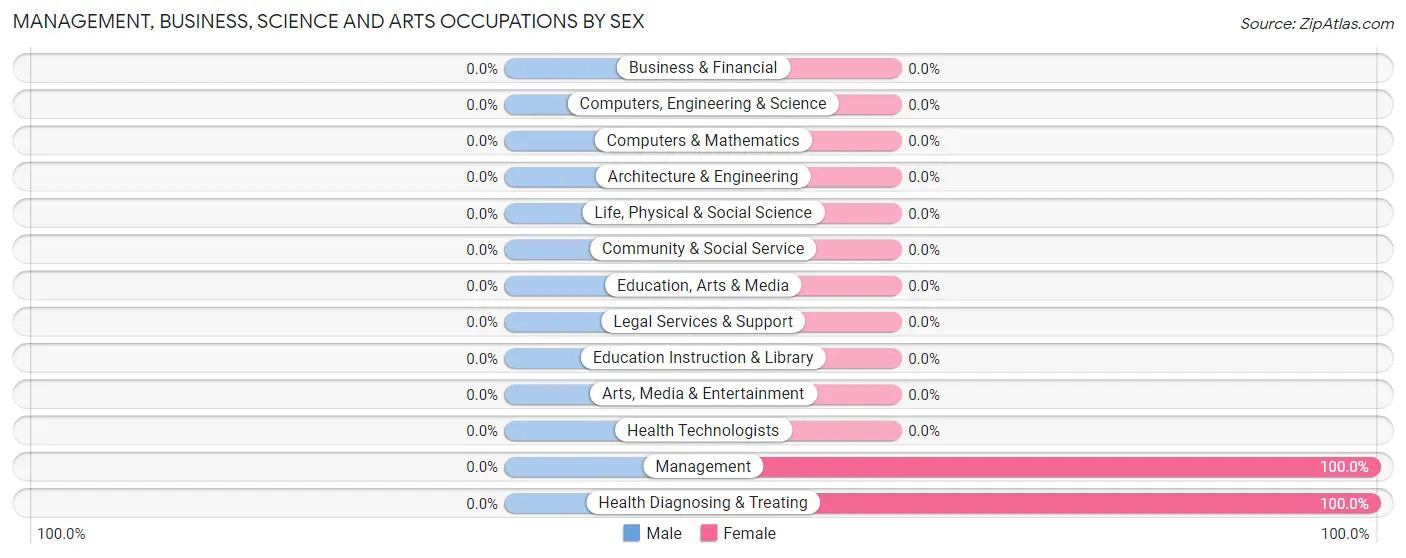
| Occupation | Male | Female |
| Management | 0 (0.0%) | 44 (100.0%) |
| Business & Financial | 0 (0.0%) | 0 (0.0%) |
| Computers, Engineering & Science | 0 (0.0%) | 0 (0.0%) |
| Computers & Mathematics | 0 (0.0%) | 0 (0.0%) |
| Architecture & Engineering | 0 (0.0%) | 0 (0.0%) |
| Life, Physical & Social Science | 0 (0.0%) | 0 (0.0%) |
| Community & Social Service | 0 (0.0%) | 0 (0.0%) |
| Education, Arts & Media | 0 (0.0%) | 0 (0.0%) |
| Legal Services & Support | 0 (0.0%) | 0 (0.0%) |
| Education Instruction & Library | 0 (0.0%) | 0 (0.0%) |
| Arts, Media & Entertainment | 0 (0.0%) | 0 (0.0%) |
| Health Diagnosing & Treating | 0 (0.0%) | 5 (100.0%) |
| Health Technologists | 0 (0.0%) | 0 (0.0%) |
| Total (Category) | 0 (0.0%) | 49 (100.0%) |
| Total (Overall) | 18 (26.5%) | 50 (73.5%) |
Services Occupations
The most common Services occupations in Spofford are Security & Protection (2 | 2.9%), Law Enforcement (2 | 2.9%), and Food Preparation & Serving (1 | 1.5%).
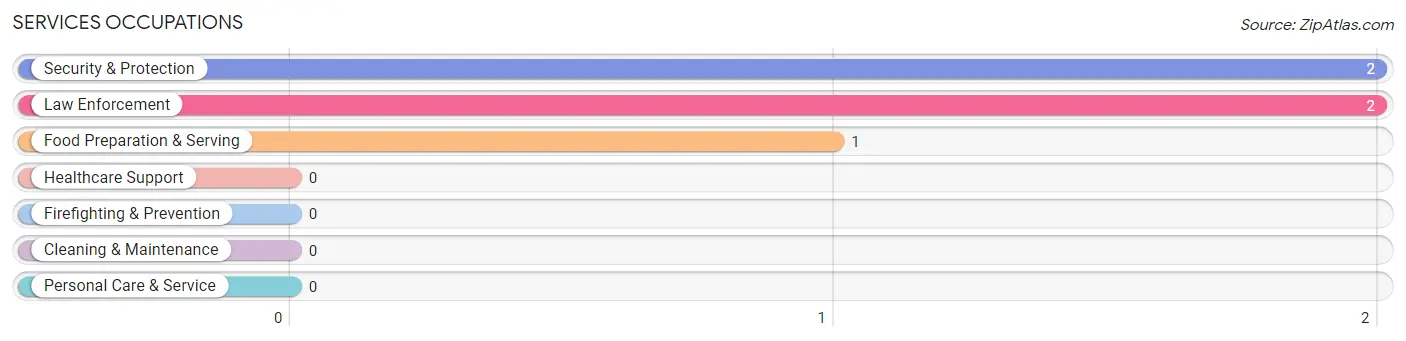
Services Occupations by Sex
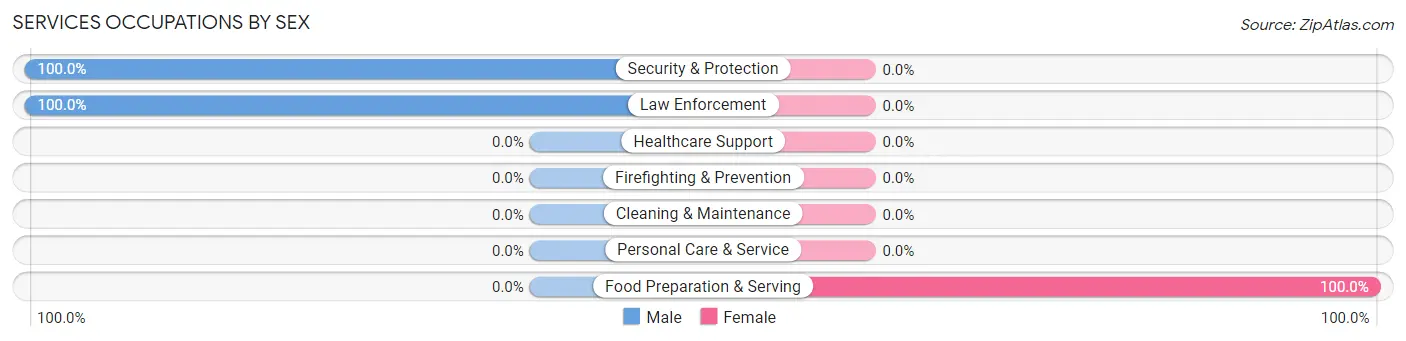
| Occupation | Male | Female |
| Healthcare Support | 0 (0.0%) | 0 (0.0%) |
| Security & Protection | 2 (100.0%) | 0 (0.0%) |
| Firefighting & Prevention | 0 (0.0%) | 0 (0.0%) |
| Law Enforcement | 2 (100.0%) | 0 (0.0%) |
| Food Preparation & Serving | 0 (0.0%) | 1 (100.0%) |
| Cleaning & Maintenance | 0 (0.0%) | 0 (0.0%) |
| Personal Care & Service | 0 (0.0%) | 0 (0.0%) |
| Total (Category) | 2 (66.7%) | 1 (33.3%) |
| Total (Overall) | 18 (26.5%) | 50 (73.5%) |
Sales and Office Occupations
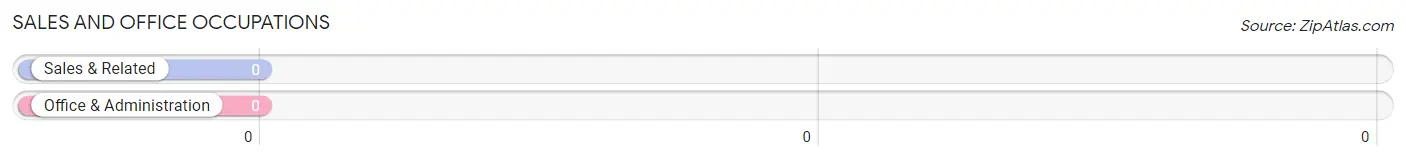
Sales and Office Occupations by Sex
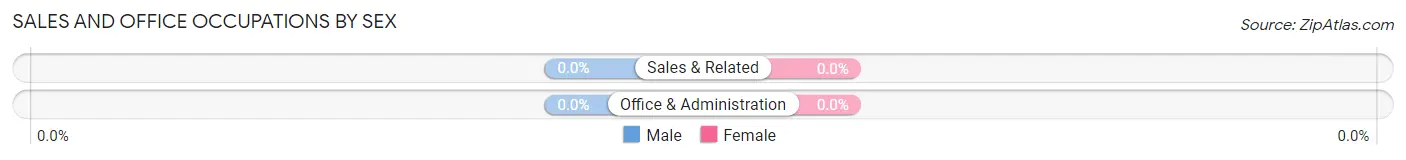
| Occupation | Male | Female |
| Sales & Related | 0 (0.0%) | 0 (0.0%) |
| Office & Administration | 0 (0.0%) | 0 (0.0%) |
| Total (Category) | 0 (0.0%) | 0 (0.0%) |
| Total (Overall) | 18 (26.5%) | 50 (73.5%) |
Natural Resources, Construction and Maintenance Occupations
The most common Natural Resources, Construction and Maintenance occupations in Spofford are , and Farming, Fishing & Forestry (16 | 23.5%).
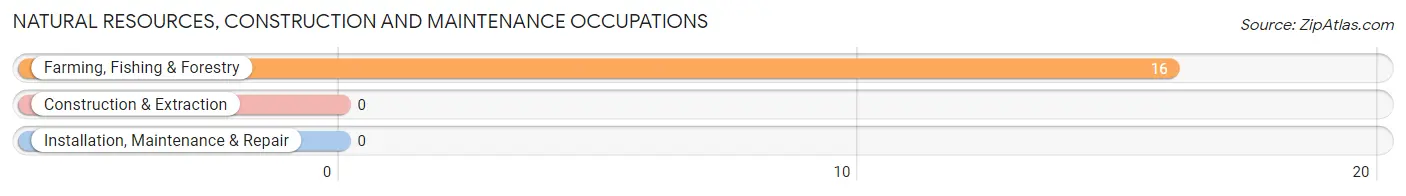
Natural Resources, Construction and Maintenance Occupations by Sex
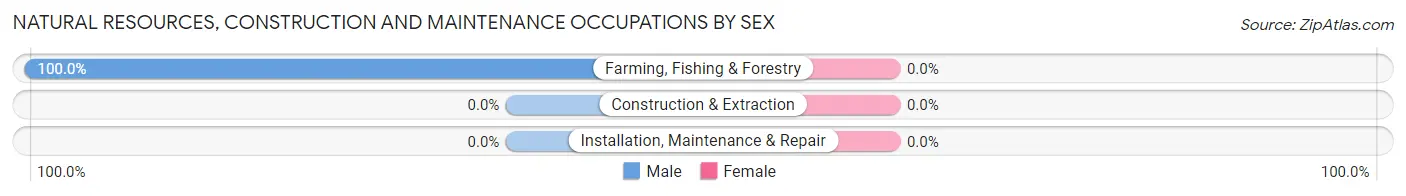
| Occupation | Male | Female |
| Farming, Fishing & Forestry | 16 (100.0%) | 0 (0.0%) |
| Construction & Extraction | 0 (0.0%) | 0 (0.0%) |
| Installation, Maintenance & Repair | 0 (0.0%) | 0 (0.0%) |
| Total (Category) | 16 (100.0%) | 0 (0.0%) |
| Total (Overall) | 18 (26.5%) | 50 (73.5%) |
Production, Transportation and Moving Occupations
Production, Transportation and Moving Occupations by Sex
| Occupation | Male | Female |
| Production | 0 (0.0%) | 0 (0.0%) |
| Transportation | 0 (0.0%) | 0 (0.0%) |
| Material Moving | 0 (0.0%) | 0 (0.0%) |
| Total (Category) | 0 (0.0%) | 0 (0.0%) |
| Total (Overall) | 18 (26.5%) | 50 (73.5%) |
Employment Industries by Sex in Spofford
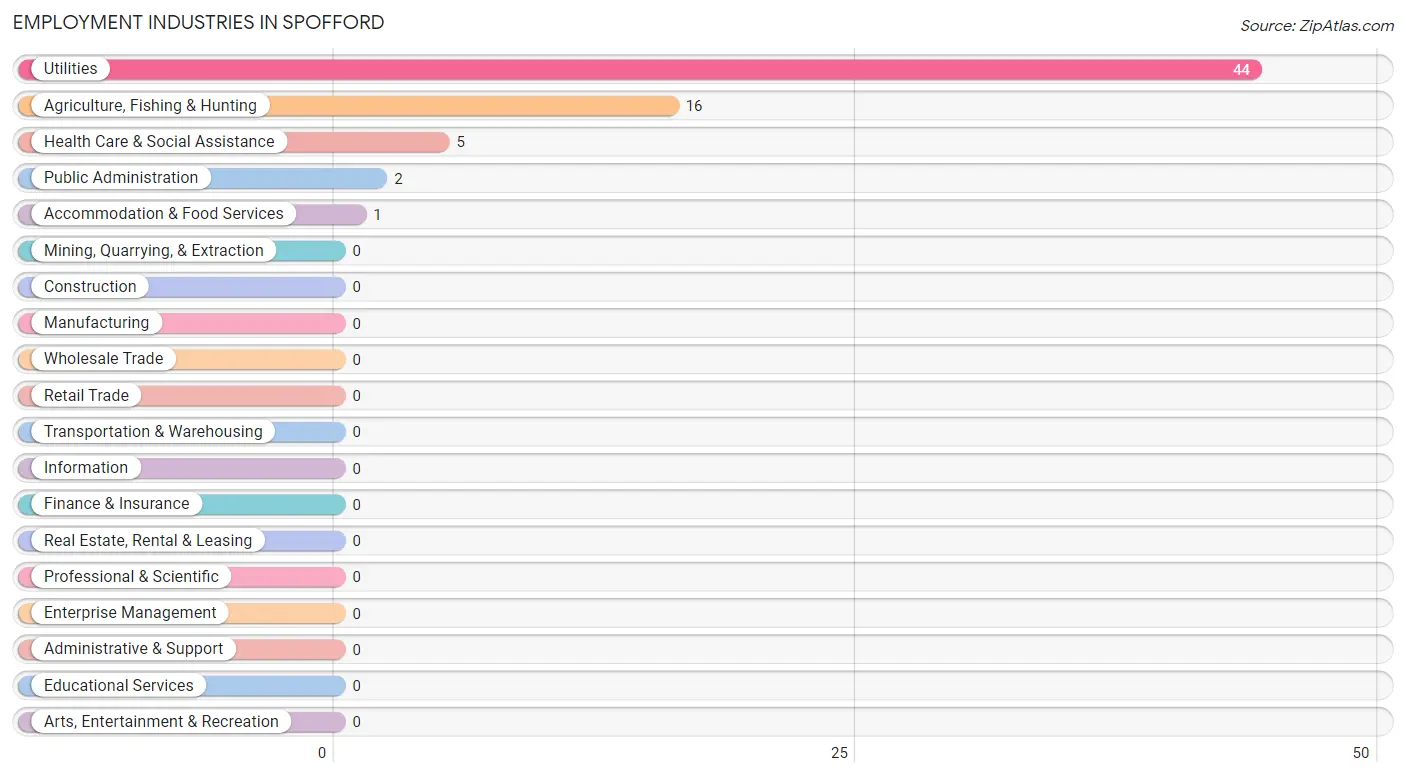
Employment Industries in Spofford
The major employment industries in Spofford include Utilities (44 | 64.7%), Agriculture, Fishing & Hunting (16 | 23.5%), Health Care & Social Assistance (5 | 7.3%), Public Administration (2 | 2.9%), and Accommodation & Food Services (1 | 1.5%).
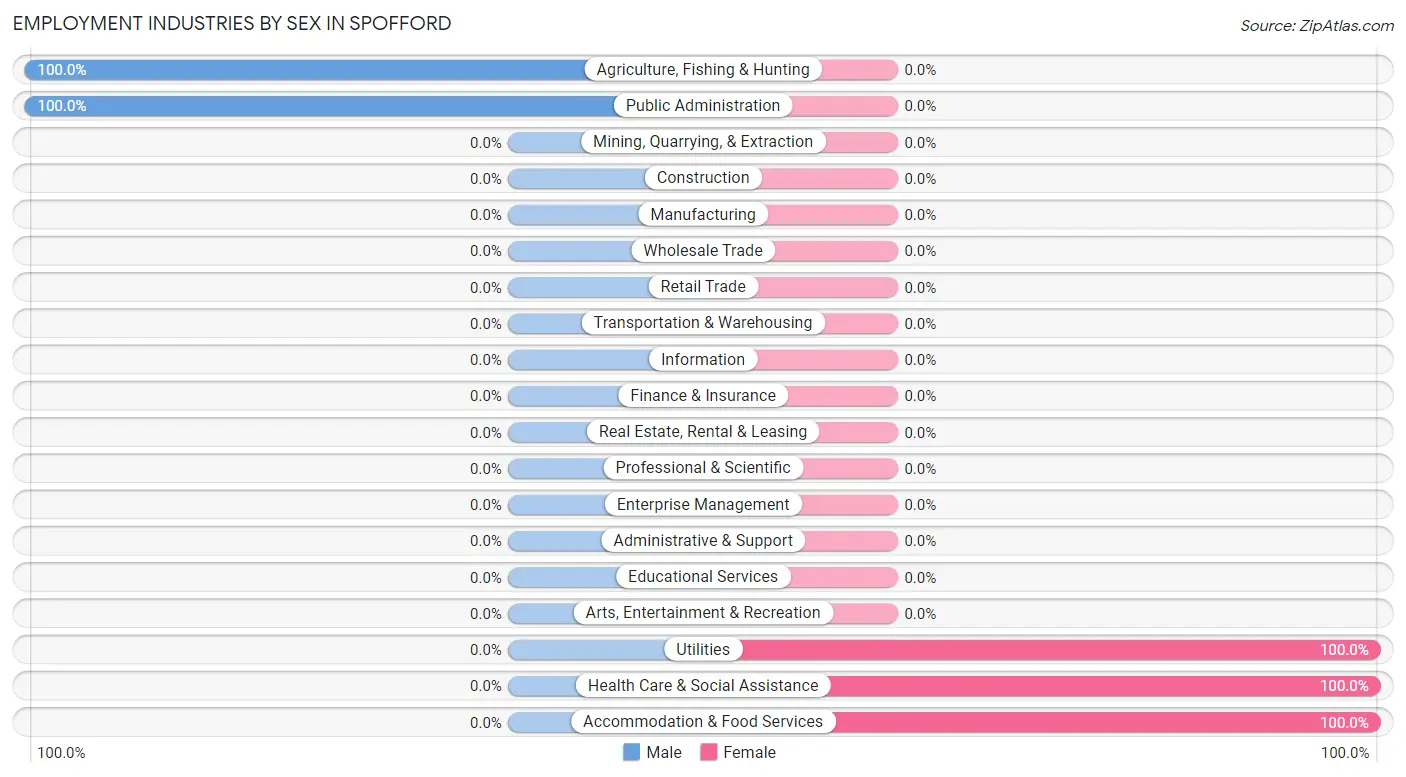
Employment Industries by Sex in Spofford
The Spofford industries that see more men than women are Agriculture, Fishing & Hunting (100.0%), and Public Administration (100.0%), whereas the industries that tend to have a higher number of women are Utilities (100.0%), Health Care & Social Assistance (100.0%), and Accommodation & Food Services (100.0%).
| Industry | Male | Female |
| Agriculture, Fishing & Hunting | 16 (100.0%) | 0 (0.0%) |
| Mining, Quarrying, & Extraction | 0 (0.0%) | 0 (0.0%) |
| Construction | 0 (0.0%) | 0 (0.0%) |
| Manufacturing | 0 (0.0%) | 0 (0.0%) |
| Wholesale Trade | 0 (0.0%) | 0 (0.0%) |
| Retail Trade | 0 (0.0%) | 0 (0.0%) |
| Transportation & Warehousing | 0 (0.0%) | 0 (0.0%) |
| Utilities | 0 (0.0%) | 44 (100.0%) |
| Information | 0 (0.0%) | 0 (0.0%) |
| Finance & Insurance | 0 (0.0%) | 0 (0.0%) |
| Real Estate, Rental & Leasing | 0 (0.0%) | 0 (0.0%) |
| Professional & Scientific | 0 (0.0%) | 0 (0.0%) |
| Enterprise Management | 0 (0.0%) | 0 (0.0%) |
| Administrative & Support | 0 (0.0%) | 0 (0.0%) |
| Educational Services | 0 (0.0%) | 0 (0.0%) |
| Health Care & Social Assistance | 0 (0.0%) | 5 (100.0%) |
| Arts, Entertainment & Recreation | 0 (0.0%) | 0 (0.0%) |
| Accommodation & Food Services | 0 (0.0%) | 1 (100.0%) |
| Public Administration | 2 (100.0%) | 0 (0.0%) |
| Total | 18 (26.5%) | 50 (73.5%) |
Education in Spofford
School Enrollment in Spofford
| School Level | # Students | % Students |
| Nursery / Preschool | 0 | 0.0% |
| Kindergarten | 0 | 0.0% |
| Elementary School | 0 | 0.0% |
| Middle School | 0 | 0.0% |
| High School | 0 | 0.0% |
| College / Undergraduate | 0 | 0.0% |
| Graduate / Professional | 0 | 0.0% |
| Total | 0 | 0.0% |
School Enrollment by Age by Funding Source in Spofford
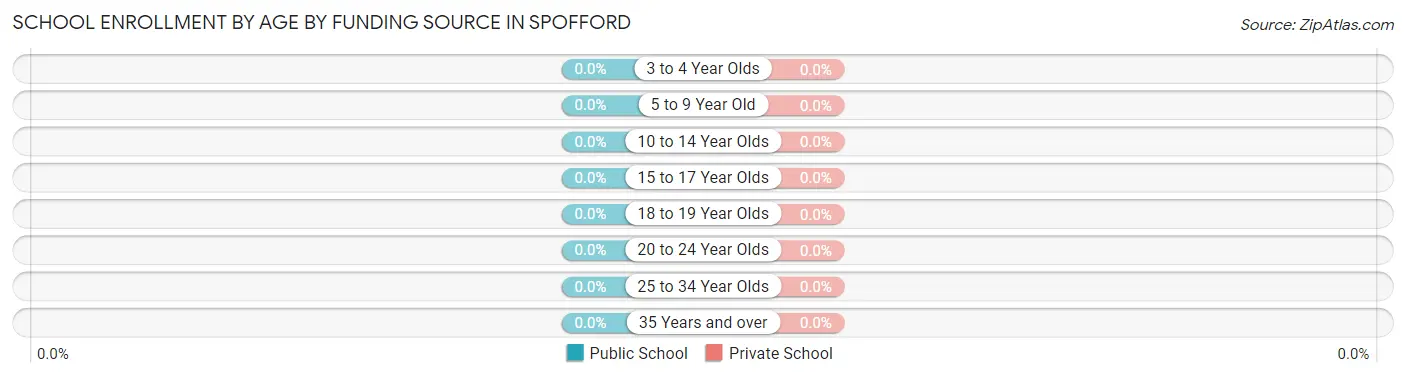
| Age Bracket | Public School | Private School |
| 3 to 4 Year Olds | 0 (0.0%) | 0 (0.0%) |
| 5 to 9 Year Old | 0 (0.0%) | 0 (0.0%) |
| 10 to 14 Year Olds | 0 (0.0%) | 0 (0.0%) |
| 15 to 17 Year Olds | 0 (0.0%) | 0 (0.0%) |
| 18 to 19 Year Olds | 0 (0.0%) | 0 (0.0%) |
| 20 to 24 Year Olds | 0 (0.0%) | 0 (0.0%) |
| 25 to 34 Year Olds | 0 (0.0%) | 0 (0.0%) |
| 35 Years and over | 0 (0.0%) | 0 (0.0%) |
| Total | 0 (0.0%) | 0 (0.0%) |
Educational Attainment by Field of Study in Spofford
| Field of Study | # Graduates | % Graduates |
| Computers & Mathematics | 0 | 0.0% |
| Bio, Nature & Agricultural | 0 | 0.0% |
| Physical & Health Sciences | 0 | 0.0% |
| Psychology | 0 | 0.0% |
| Social Sciences | 0 | 0.0% |
| Engineering | 0 | 0.0% |
| Multidisciplinary Studies | 0 | 0.0% |
| Science & Technology | 0 | 0.0% |
| Business | 0 | 0.0% |
| Education | 0 | 0.0% |
| Literature & Languages | 0 | 0.0% |
| Liberal Arts & History | 0 | 0.0% |
| Visual & Performing Arts | 0 | 0.0% |
| Communications | 0 | 0.0% |
| Arts & Humanities | 0 | 0.0% |
| Total | 0 | 0.0% |
Transportation & Commute in Spofford
Vehicle Availability by Sex in Spofford
The most prevalent vehicle ownership categories in Spofford are males with 2 vehicles (18, accounting for 100.0%) and females with 2 vehicles (50, making up 36.0%).
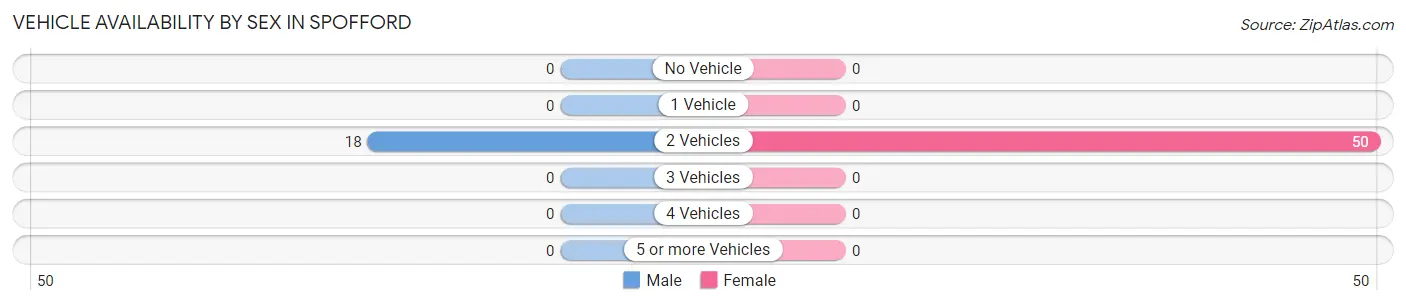
| Vehicles Available | Male | Female |
| No Vehicle | 0 (0.0%) | 0 (0.0%) |
| 1 Vehicle | 0 (0.0%) | 0 (0.0%) |
| 2 Vehicles | 18 (100.0%) | 50 (100.0%) |
| 3 Vehicles | 0 (0.0%) | 0 (0.0%) |
| 4 Vehicles | 0 (0.0%) | 0 (0.0%) |
| 5 or more Vehicles | 0 (0.0%) | 0 (0.0%) |
| Total | 18 (100.0%) | 50 (100.0%) |
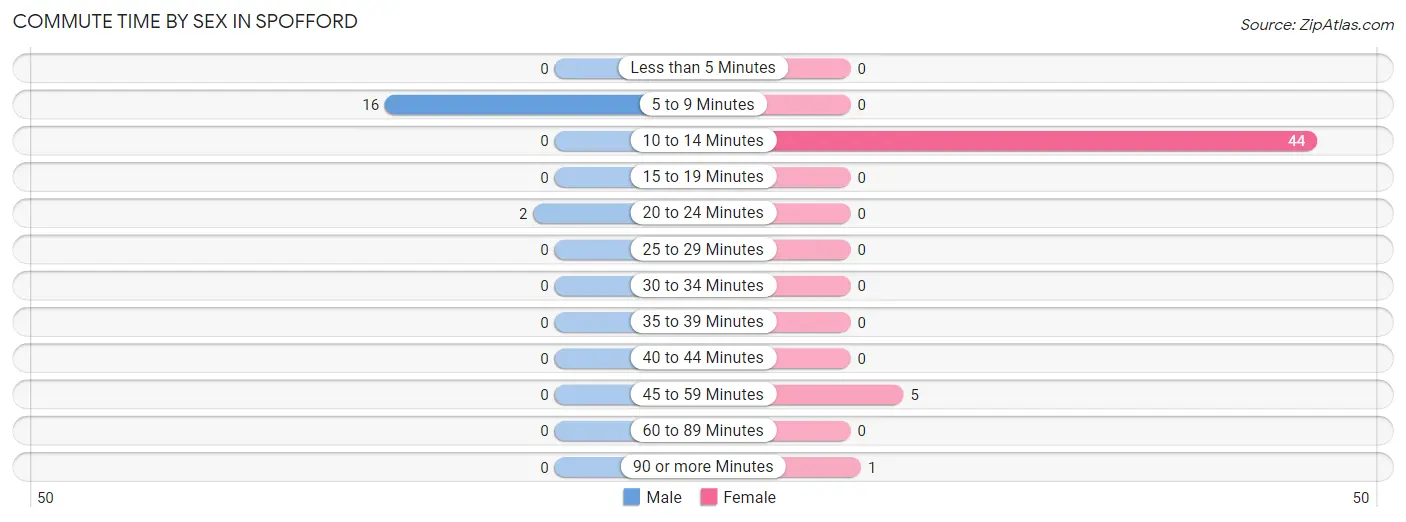
Commute Time in Spofford
The most frequently occuring commute durations in Spofford are 10 to 14 minutes (44 commuters, 64.7%), 5 to 9 minutes (16 commuters, 23.5%), and 45 to 59 minutes (5 commuters, 7.3%).
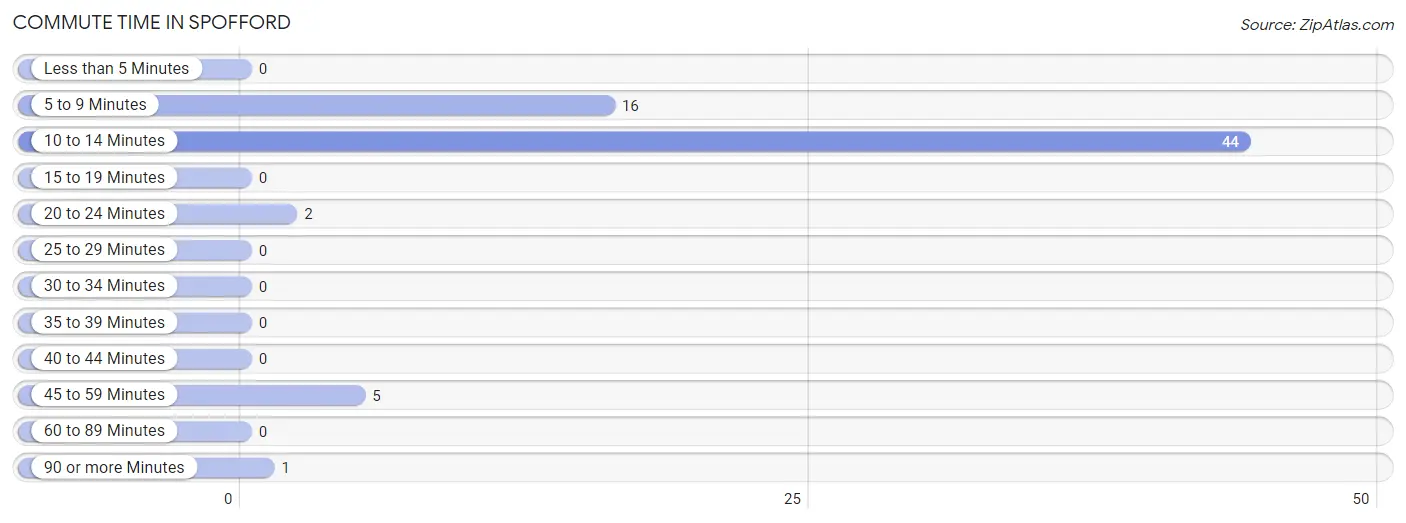
| Commute Time | # Commuters | % Commuters |
| Less than 5 Minutes | 0 | 0.0% |
| 5 to 9 Minutes | 16 | 23.5% |
| 10 to 14 Minutes | 44 | 64.7% |
| 15 to 19 Minutes | 0 | 0.0% |
| 20 to 24 Minutes | 2 | 2.9% |
| 25 to 29 Minutes | 0 | 0.0% |
| 30 to 34 Minutes | 0 | 0.0% |
| 35 to 39 Minutes | 0 | 0.0% |
| 40 to 44 Minutes | 0 | 0.0% |
| 45 to 59 Minutes | 5 | 7.3% |
| 60 to 89 Minutes | 0 | 0.0% |
| 90 or more Minutes | 1 | 1.5% |
Commute Time by Sex in Spofford
The most common commute times in Spofford are 5 to 9 minutes (16 commuters, 88.9%) for males and 10 to 14 minutes (44 commuters, 88.0%) for females.
| Commute Time | Male | Female |
| Less than 5 Minutes | 0 (0.0%) | 0 (0.0%) |
| 5 to 9 Minutes | 16 (88.9%) | 0 (0.0%) |
| 10 to 14 Minutes | 0 (0.0%) | 44 (88.0%) |
| 15 to 19 Minutes | 0 (0.0%) | 0 (0.0%) |
| 20 to 24 Minutes | 2 (11.1%) | 0 (0.0%) |
| 25 to 29 Minutes | 0 (0.0%) | 0 (0.0%) |
| 30 to 34 Minutes | 0 (0.0%) | 0 (0.0%) |
| 35 to 39 Minutes | 0 (0.0%) | 0 (0.0%) |
| 40 to 44 Minutes | 0 (0.0%) | 0 (0.0%) |
| 45 to 59 Minutes | 0 (0.0%) | 5 (10.0%) |
| 60 to 89 Minutes | 0 (0.0%) | 0 (0.0%) |
| 90 or more Minutes | 0 (0.0%) | 1 (2.0%) |
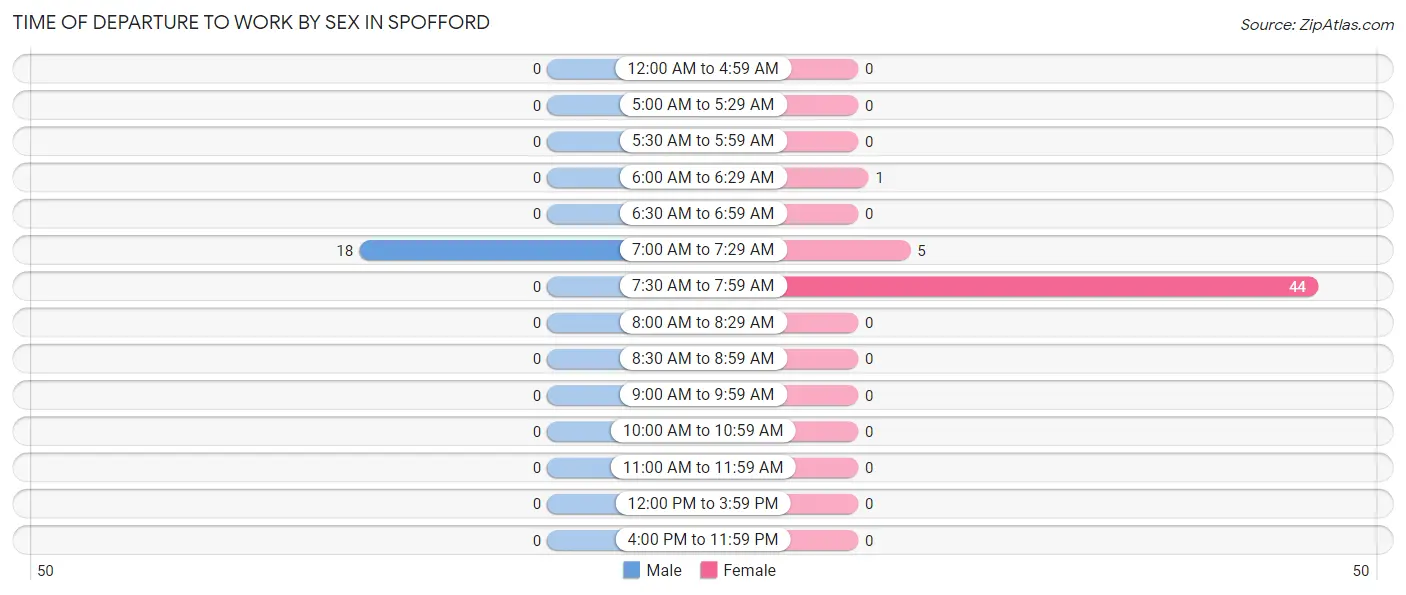
Time of Departure to Work by Sex in Spofford
The most frequent times of departure to work in Spofford are 7:00 AM to 7:29 AM (18, 100.0%) for males and 7:30 AM to 7:59 AM (44, 88.0%) for females.
| Time of Departure | Male | Female |
| 12:00 AM to 4:59 AM | 0 (0.0%) | 0 (0.0%) |
| 5:00 AM to 5:29 AM | 0 (0.0%) | 0 (0.0%) |
| 5:30 AM to 5:59 AM | 0 (0.0%) | 0 (0.0%) |
| 6:00 AM to 6:29 AM | 0 (0.0%) | 1 (2.0%) |
| 6:30 AM to 6:59 AM | 0 (0.0%) | 0 (0.0%) |
| 7:00 AM to 7:29 AM | 18 (100.0%) | 5 (10.0%) |
| 7:30 AM to 7:59 AM | 0 (0.0%) | 44 (88.0%) |
| 8:00 AM to 8:29 AM | 0 (0.0%) | 0 (0.0%) |
| 8:30 AM to 8:59 AM | 0 (0.0%) | 0 (0.0%) |
| 9:00 AM to 9:59 AM | 0 (0.0%) | 0 (0.0%) |
| 10:00 AM to 10:59 AM | 0 (0.0%) | 0 (0.0%) |
| 11:00 AM to 11:59 AM | 0 (0.0%) | 0 (0.0%) |
| 12:00 PM to 3:59 PM | 0 (0.0%) | 0 (0.0%) |
| 4:00 PM to 11:59 PM | 0 (0.0%) | 0 (0.0%) |
| Total | 18 (100.0%) | 50 (100.0%) |
Housing Occupancy in Spofford
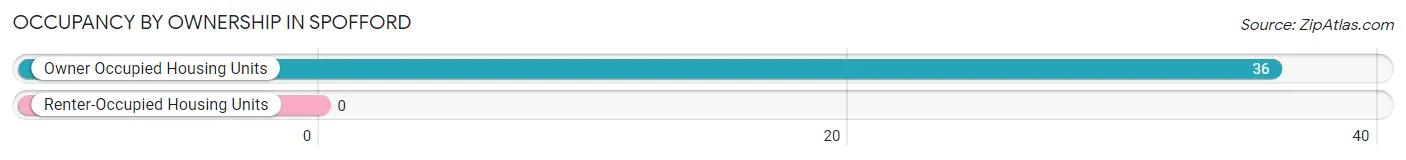
Occupancy by Ownership in Spofford
Of the total 36 dwellings in Spofford, owner-occupied units account for 36 (100.0%), while renter-occupied units make up 0 (0.0%).
| Occupancy | # Housing Units | % Housing Units |
| Owner Occupied Housing Units | 36 | 100.0% |
| Renter-Occupied Housing Units | 0 | 0.0% |
| Total Occupied Housing Units | 36 | 100.0% |
Occupancy by Household Size in Spofford
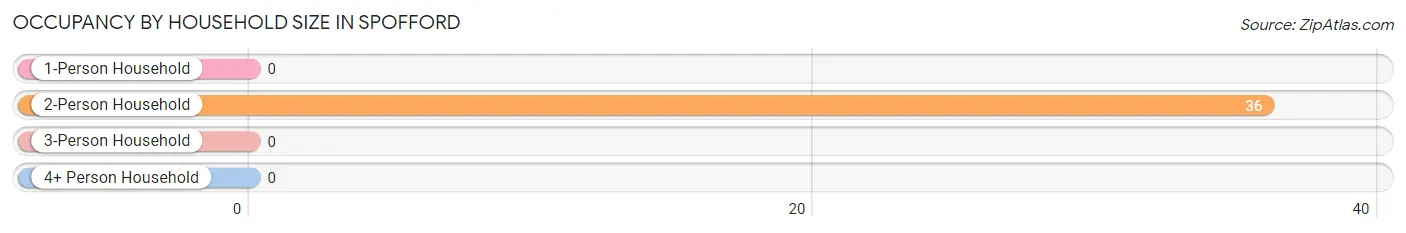
| Household Size | # Housing Units | % Housing Units |
| 1-Person Household | 0 | 0.0% |
| 2-Person Household | 36 | 100.0% |
| 3-Person Household | 0 | 0.0% |
| 4+ Person Household | 0 | 0.0% |
| Total Housing Units | 36 | 100.0% |
Occupancy by Ownership by Household Size in Spofford
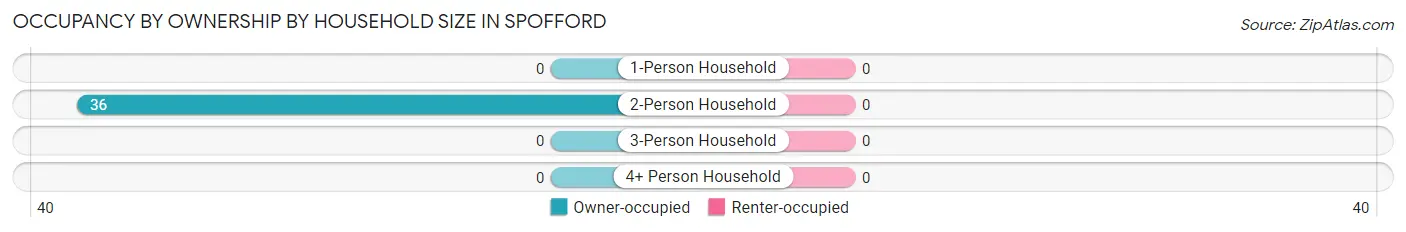
| Household Size | Owner-occupied | Renter-occupied |
| 1-Person Household | 0 (0.0%) | 0 (0.0%) |
| 2-Person Household | 36 (100.0%) | 0 (0.0%) |
| 3-Person Household | 0 (0.0%) | 0 (0.0%) |
| 4+ Person Household | 0 (0.0%) | 0 (0.0%) |
| Total Housing Units | 36 (100.0%) | 0 (0.0%) |
Occupancy by Educational Attainment in Spofford
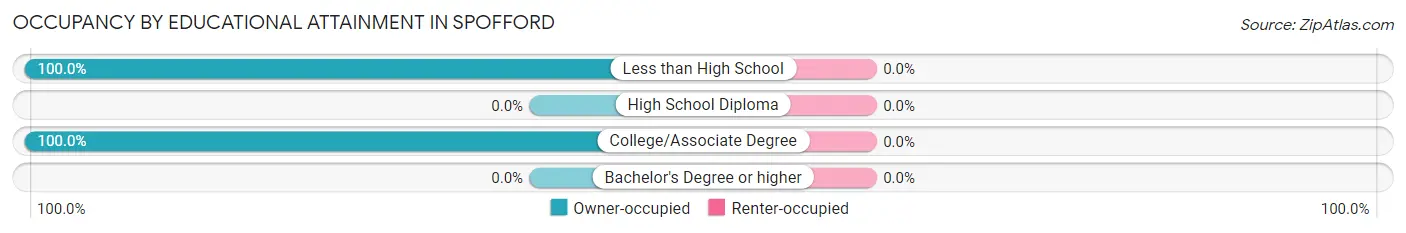
| Household Size | Owner-occupied | Renter-occupied |
| Less than High School | 19 (100.0%) | 0 (0.0%) |
| High School Diploma | 0 (0.0%) | 0 (0.0%) |
| College/Associate Degree | 17 (100.0%) | 0 (0.0%) |
| Bachelor's Degree or higher | 0 (0.0%) | 0 (0.0%) |
Occupancy by Age of Householder in Spofford
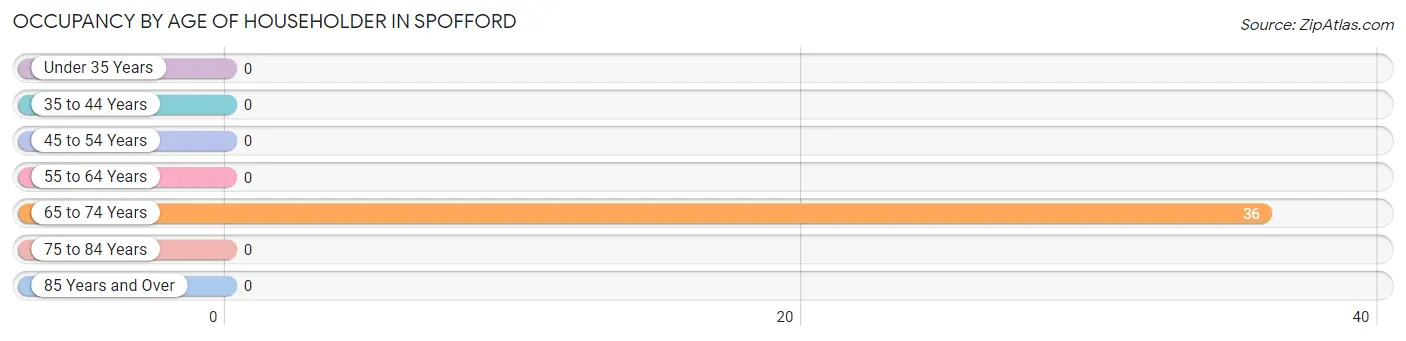
| Age Bracket | # Households | % Households |
| Under 35 Years | 0 | 0.0% |
| 35 to 44 Years | 0 | 0.0% |
| 45 to 54 Years | 0 | 0.0% |
| 55 to 64 Years | 0 | 0.0% |
| 65 to 74 Years | 36 | 100.0% |
| 75 to 84 Years | 0 | 0.0% |
| 85 Years and Over | 0 | 0.0% |
| Total | 36 | 100.0% |
Housing Finances in Spofford
Median Income by Occupancy in Spofford
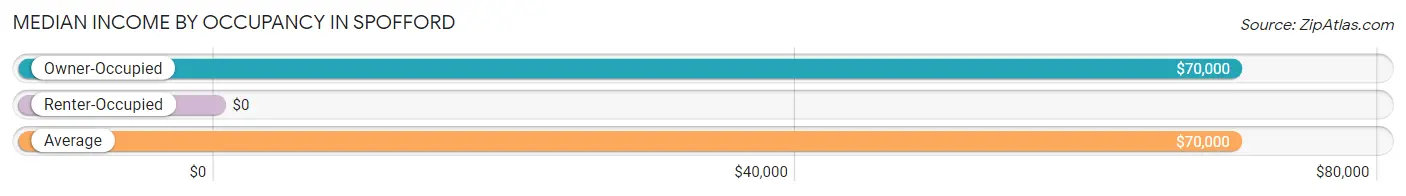
| Occupancy Type | # Households | Median Income |
| Owner-Occupied | 36 (100.0%) | $70,000 |
| Renter-Occupied | 0 (0.0%) | $0 |
| Average | 36 (100.0%) | $70,000 |
Occupancy by Householder Income Bracket in Spofford
| Income Bracket | Owner-occupied | Renter-occupied |
| Less than $5,000 | 0 (0.0%) | 0 (0.0%) |
| $5,000 to $9,999 | 0 (0.0%) | 0 (0.0%) |
| $10,000 to $14,999 | 0 (0.0%) | 0 (0.0%) |
| $15,000 to $19,999 | 0 (0.0%) | 0 (0.0%) |
| $20,000 to $24,999 | 0 (0.0%) | 0 (0.0%) |
| $25,000 to $34,999 | 0 (0.0%) | 0 (0.0%) |
| $35,000 to $49,999 | 0 (0.0%) | 0 (0.0%) |
| $50,000 to $74,999 | 18 (50.0%) | 0 (0.0%) |
| $75,000 to $99,999 | 12 (33.3%) | 0 (0.0%) |
| $100,000 to $149,999 | 5 (13.9%) | 0 (0.0%) |
| $150,000 or more | 1 (2.8%) | 0 (0.0%) |
| Total | 36 (100.0%) | 0 (0.0%) |
Monthly Housing Cost Tiers in Spofford
| Monthly Cost | Owner-occupied | Renter-occupied |
| Less than $300 | 0 (0.0%) | 0 (0.0%) |
| $300 to $499 | 31 (86.1%) | 0 (0.0%) |
| $500 to $799 | 0 (0.0%) | 0 (0.0%) |
| $800 to $999 | 0 (0.0%) | 0 (0.0%) |
| $1,000 to $1,499 | 5 (13.9%) | 0 (0.0%) |
| $1,500 to $1,999 | 0 (0.0%) | 0 (0.0%) |
| $2,000 to $2,499 | 0 (0.0%) | 0 (0.0%) |
| $2,500 to $2,999 | 0 (0.0%) | 0 (0.0%) |
| $3,000 or more | 0 (0.0%) | 0 (0.0%) |
| Total | 36 (100.0%) | 0 (0.0%) |
Physical Housing Characteristics in Spofford
Housing Structures in Spofford
| Structure Type | # Housing Units | % Housing Units |
| Single Unit, Detached | 36 | 100.0% |
| Single Unit, Attached | 0 | 0.0% |
| 2 Unit Apartments | 0 | 0.0% |
| 3 or 4 Unit Apartments | 0 | 0.0% |
| 5 to 9 Unit Apartments | 0 | 0.0% |
| 10 or more Apartments | 0 | 0.0% |
| Mobile Home / Other | 0 | 0.0% |
| Total | 36 | 100.0% |
Housing Structures by Occupancy in Spofford
| Structure Type | Owner-occupied | Renter-occupied |
| Single Unit, Detached | 36 (100.0%) | 0 (0.0%) |
| Single Unit, Attached | 0 (0.0%) | 0 (0.0%) |
| 2 Unit Apartments | 0 (0.0%) | 0 (0.0%) |
| 3 or 4 Unit Apartments | 0 (0.0%) | 0 (0.0%) |
| 5 to 9 Unit Apartments | 0 (0.0%) | 0 (0.0%) |
| 10 or more Apartments | 0 (0.0%) | 0 (0.0%) |
| Mobile Home / Other | 0 (0.0%) | 0 (0.0%) |
| Total | 36 (100.0%) | 0 (0.0%) |
Housing Structures by Number of Rooms in Spofford
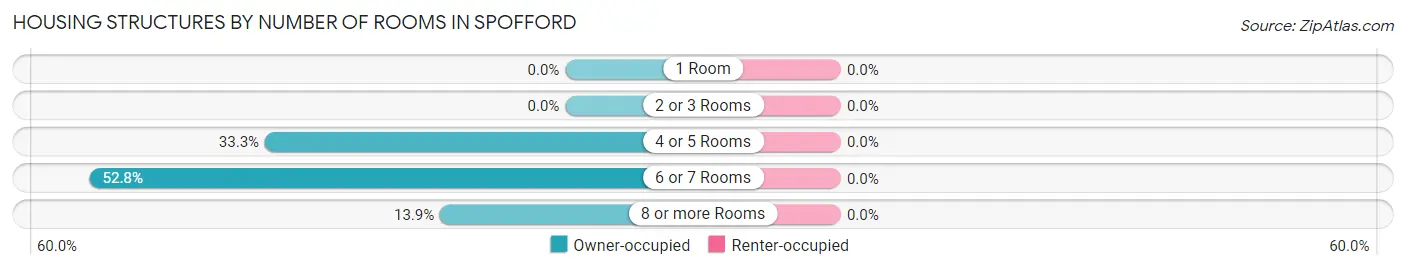
| Number of Rooms | Owner-occupied | Renter-occupied |
| 1 Room | 0 (0.0%) | 0 (0.0%) |
| 2 or 3 Rooms | 0 (0.0%) | 0 (0.0%) |
| 4 or 5 Rooms | 12 (33.3%) | 0 (0.0%) |
| 6 or 7 Rooms | 19 (52.8%) | 0 (0.0%) |
| 8 or more Rooms | 5 (13.9%) | 0 (0.0%) |
| Total | 36 (100.0%) | 0 (0.0%) |
Housing Structure by Heating Type in Spofford
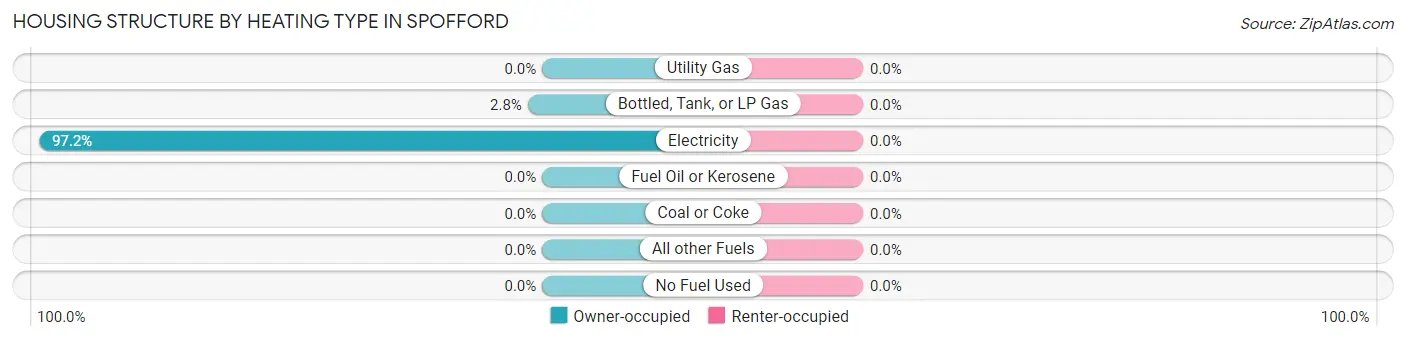
| Heating Type | Owner-occupied | Renter-occupied |
| Utility Gas | 0 (0.0%) | 0 (0.0%) |
| Bottled, Tank, or LP Gas | 1 (2.8%) | 0 (0.0%) |
| Electricity | 35 (97.2%) | 0 (0.0%) |
| Fuel Oil or Kerosene | 0 (0.0%) | 0 (0.0%) |
| Coal or Coke | 0 (0.0%) | 0 (0.0%) |
| All other Fuels | 0 (0.0%) | 0 (0.0%) |
| No Fuel Used | 0 (0.0%) | 0 (0.0%) |
| Total | 36 (100.0%) | 0 (0.0%) |
Household Vehicle Usage in Spofford
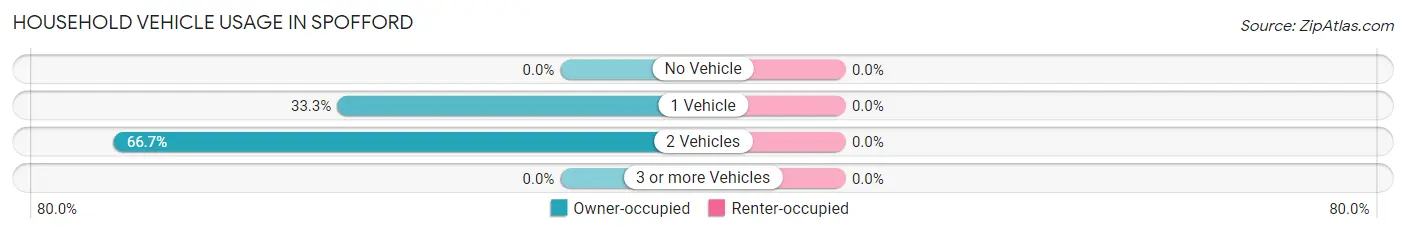
| Vehicles per Household | Owner-occupied | Renter-occupied |
| No Vehicle | 0 (0.0%) | 0 (0.0%) |
| 1 Vehicle | 12 (33.3%) | 0 (0.0%) |
| 2 Vehicles | 24 (66.7%) | 0 (0.0%) |
| 3 or more Vehicles | 0 (0.0%) | 0 (0.0%) |
| Total | 36 (100.0%) | 0 (0.0%) |
Real Estate & Mortgages in Spofford
Real Estate and Mortgage Overview in Spofford
| Characteristic | Without Mortgage | With Mortgage |
| Housing Units | 31 | 5 |
| Median Property Value | - | - |
| Median Household Income | $59,653 | $0 |
| Monthly Housing Costs | $414 | $0 |
| Real Estate Taxes | - | - |
Property Value by Mortgage Status in Spofford
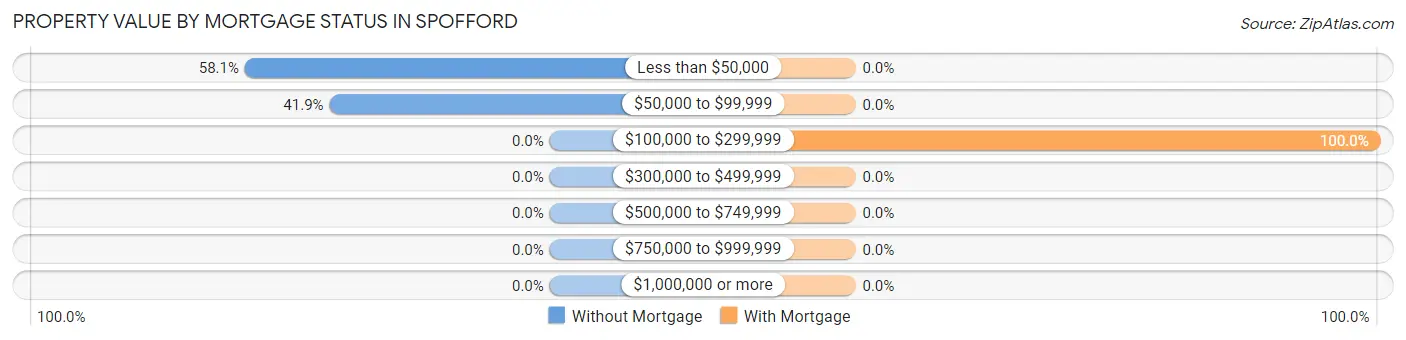
| Property Value | Without Mortgage | With Mortgage |
| Less than $50,000 | 18 (58.1%) | 0 (0.0%) |
| $50,000 to $99,999 | 13 (41.9%) | 0 (0.0%) |
| $100,000 to $299,999 | 0 (0.0%) | 5 (100.0%) |
| $300,000 to $499,999 | 0 (0.0%) | 0 (0.0%) |
| $500,000 to $749,999 | 0 (0.0%) | 0 (0.0%) |
| $750,000 to $999,999 | 0 (0.0%) | 0 (0.0%) |
| $1,000,000 or more | 0 (0.0%) | 0 (0.0%) |
| Total | 31 (100.0%) | 5 (100.0%) |
Household Income by Mortgage Status in Spofford
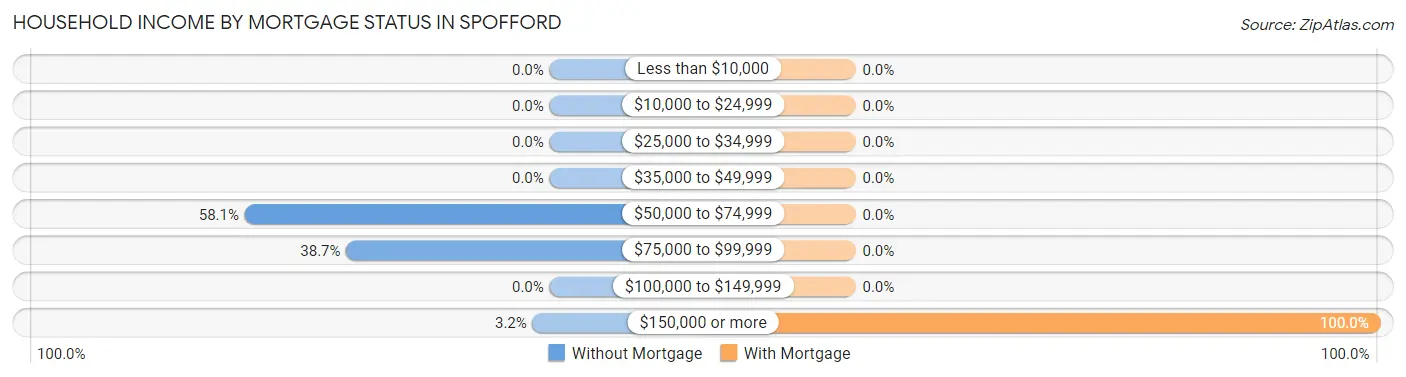
| Household Income | Without Mortgage | With Mortgage |
| Less than $10,000 | 0 (0.0%) | 0 (0.0%) |
| $10,000 to $24,999 | 0 (0.0%) | 0 (0.0%) |
| $25,000 to $34,999 | 0 (0.0%) | 0 (0.0%) |
| $35,000 to $49,999 | 0 (0.0%) | 0 (0.0%) |
| $50,000 to $74,999 | 18 (58.1%) | 0 (0.0%) |
| $75,000 to $99,999 | 12 (38.7%) | 0 (0.0%) |
| $100,000 to $149,999 | 0 (0.0%) | 0 (0.0%) |
| $150,000 or more | 1 (3.2%) | 5 (100.0%) |
| Total | 31 (100.0%) | 5 (100.0%) |
Property Value to Household Income Ratio in Spofford
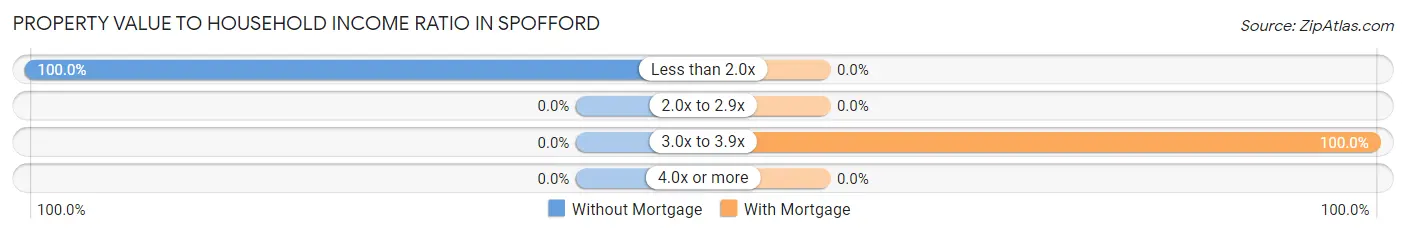
| Value-to-Income Ratio | Without Mortgage | With Mortgage |
| Less than 2.0x | 31 (100.0%) | 0 (0.0%) |
| 2.0x to 2.9x | 0 (0.0%) | 0 (0.0%) |
| 3.0x to 3.9x | 0 (0.0%) | 5 (100.0%) |
| 4.0x or more | 0 (0.0%) | 0 (0.0%) |
| Total | 31 (100.0%) | 5 (100.0%) |
Real Estate Taxes by Mortgage Status in Spofford
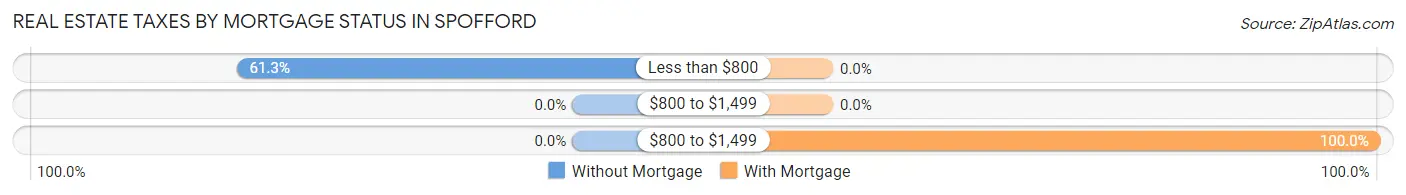
| Property Taxes | Without Mortgage | With Mortgage |
| Less than $800 | 19 (61.3%) | 0 (0.0%) |
| $800 to $1,499 | 0 (0.0%) | 0 (0.0%) |
| $800 to $1,499 | 0 (0.0%) | 5 (100.0%) |
| Total | 31 (100.0%) | 5 (100.0%) |
Health & Disability in Spofford
Health Insurance Coverage by Age in Spofford
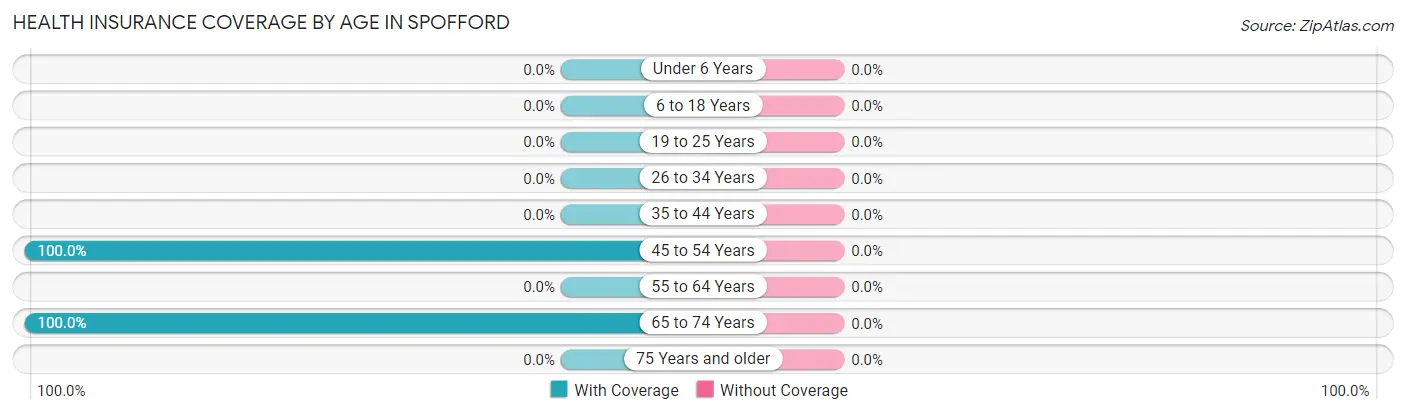
| Age Bracket | With Coverage | Without Coverage |
| Under 6 Years | 0 (0.0%) | 0 (0.0%) |
| 6 to 18 Years | 0 (0.0%) | 0 (0.0%) |
| 19 to 25 Years | 0 (0.0%) | 0 (0.0%) |
| 26 to 34 Years | 0 (0.0%) | 0 (0.0%) |
| 35 to 44 Years | 0 (0.0%) | 0 (0.0%) |
| 45 to 54 Years | 44 (100.0%) | 0 (0.0%) |
| 55 to 64 Years | 0 (0.0%) | 0 (0.0%) |
| 65 to 74 Years | 59 (100.0%) | 0 (0.0%) |
| 75 Years and older | 0 (0.0%) | 0 (0.0%) |
| Total | 103 (100.0%) | 0 (0.0%) |
Health Insurance Coverage by Citizenship Status in Spofford
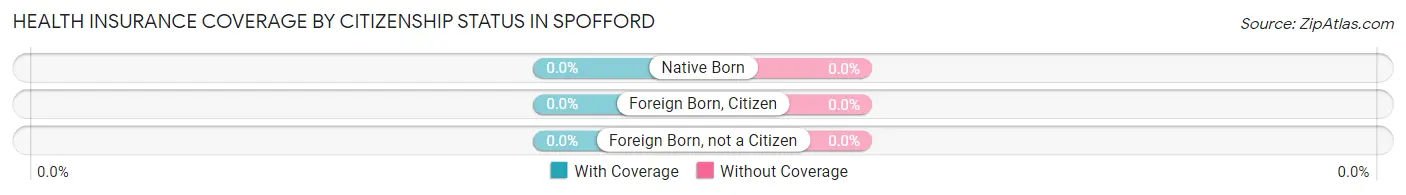
| Citizenship Status | With Coverage | Without Coverage |
| Native Born | 0 (0.0%) | 0 (0.0%) |
| Foreign Born, Citizen | 0 (0.0%) | 0 (0.0%) |
| Foreign Born, not a Citizen | 0 (0.0%) | 0 (0.0%) |
Health Insurance Coverage by Household Income in Spofford
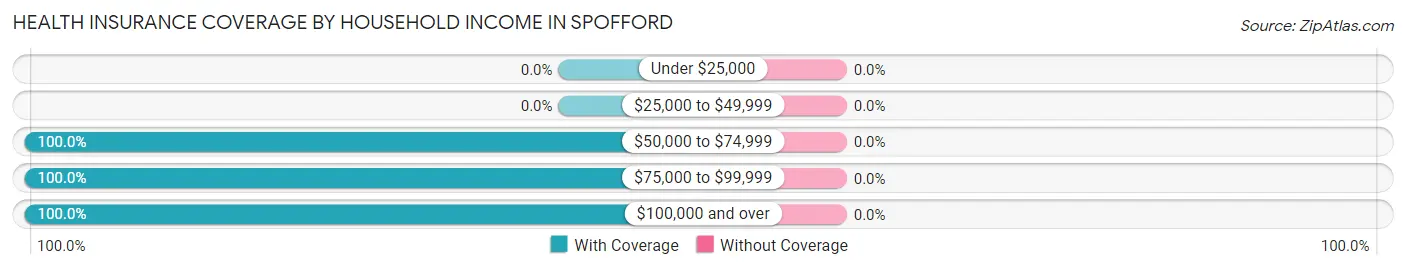
| Household Income | With Coverage | Without Coverage |
| Under $25,000 | 0 (0.0%) | 0 (0.0%) |
| $25,000 to $49,999 | 0 (0.0%) | 0 (0.0%) |
| $50,000 to $74,999 | 62 (100.0%) | 0 (0.0%) |
| $75,000 to $99,999 | 17 (100.0%) | 0 (0.0%) |
| $100,000 and over | 24 (100.0%) | 0 (0.0%) |
Public vs Private Health Insurance Coverage by Age in Spofford
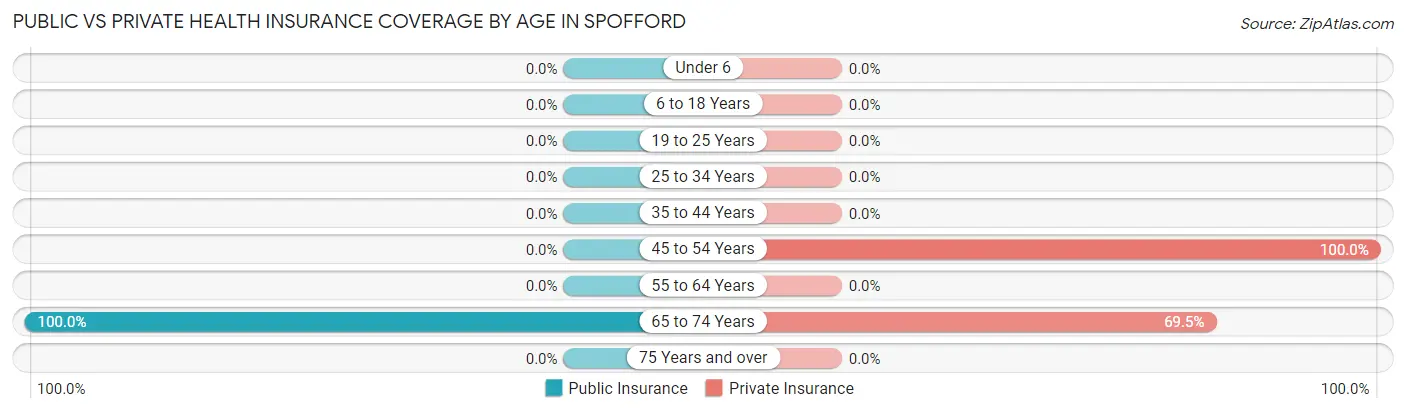
| Age Bracket | Public Insurance | Private Insurance |
| Under 6 | 0 (0.0%) | 0 (0.0%) |
| 6 to 18 Years | 0 (0.0%) | 0 (0.0%) |
| 19 to 25 Years | 0 (0.0%) | 0 (0.0%) |
| 25 to 34 Years | 0 (0.0%) | 0 (0.0%) |
| 35 to 44 Years | 0 (0.0%) | 0 (0.0%) |
| 45 to 54 Years | 0 (0.0%) | 44 (100.0%) |
| 55 to 64 Years | 0 (0.0%) | 0 (0.0%) |
| 65 to 74 Years | 59 (100.0%) | 41 (69.5%) |
| 75 Years and over | 0 (0.0%) | 0 (0.0%) |
| Total | 59 (57.3%) | 85 (82.5%) |
Disability Status by Sex by Age in Spofford
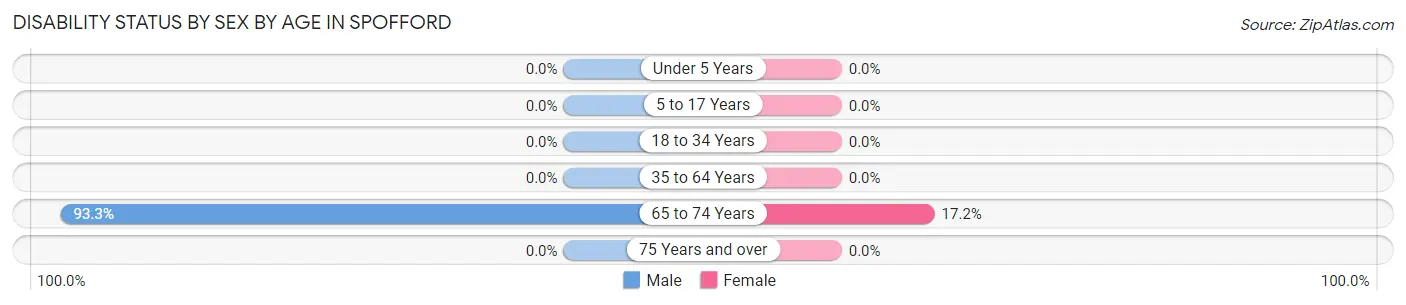
| Age Bracket | Male | Female |
| Under 5 Years | 0 (0.0%) | 0 (0.0%) |
| 5 to 17 Years | 0 (0.0%) | 0 (0.0%) |
| 18 to 34 Years | 0 (0.0%) | 0 (0.0%) |
| 35 to 64 Years | 0 (0.0%) | 0 (0.0%) |
| 65 to 74 Years | 28 (93.3%) | 5 (17.2%) |
| 75 Years and over | 0 (0.0%) | 0 (0.0%) |
Disability Class by Sex by Age in Spofford
Disability Class: Hearing Difficulty
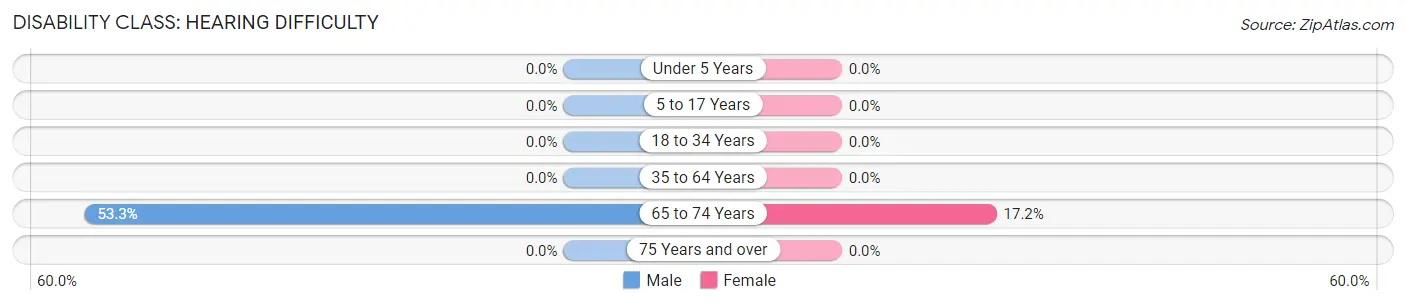
| Age Bracket | Male | Female |
| Under 5 Years | 0 (0.0%) | 0 (0.0%) |
| 5 to 17 Years | 0 (0.0%) | 0 (0.0%) |
| 18 to 34 Years | 0 (0.0%) | 0 (0.0%) |
| 35 to 64 Years | 0 (0.0%) | 0 (0.0%) |
| 65 to 74 Years | 16 (53.3%) | 5 (17.2%) |
| 75 Years and over | 0 (0.0%) | 0 (0.0%) |
Disability Class: Vision Difficulty
| Age Bracket | Male | Female |
| Under 5 Years | 0 (0.0%) | 0 (0.0%) |
| 5 to 17 Years | 0 (0.0%) | 0 (0.0%) |
| 18 to 34 Years | 0 (0.0%) | 0 (0.0%) |
| 35 to 64 Years | 0 (0.0%) | 0 (0.0%) |
| 65 to 74 Years | 0 (0.0%) | 0 (0.0%) |
| 75 Years and over | 0 (0.0%) | 0 (0.0%) |
Disability Class: Cognitive Difficulty
| Age Bracket | Male | Female |
| 5 to 17 Years | 0 (0.0%) | 0 (0.0%) |
| 18 to 34 Years | 0 (0.0%) | 0 (0.0%) |
| 35 to 64 Years | 0 (0.0%) | 0 (0.0%) |
| 65 to 74 Years | 0 (0.0%) | 0 (0.0%) |
| 75 Years and over | 0 (0.0%) | 0 (0.0%) |
Disability Class: Ambulatory Difficulty
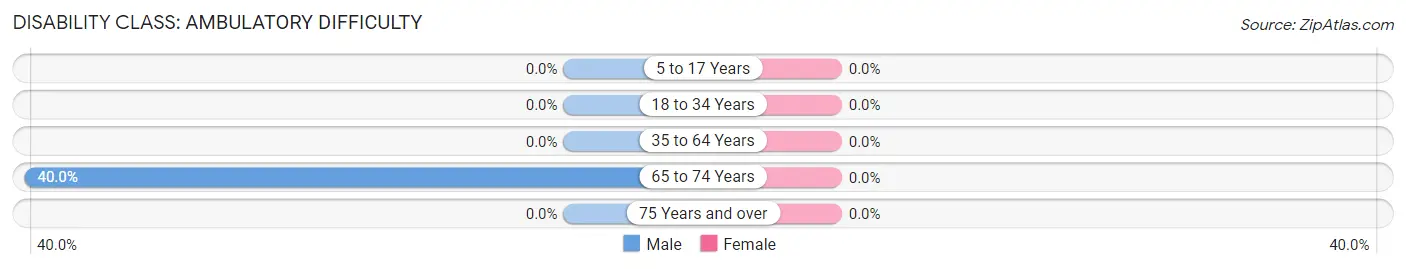
| Age Bracket | Male | Female |
| 5 to 17 Years | 0 (0.0%) | 0 (0.0%) |
| 18 to 34 Years | 0 (0.0%) | 0 (0.0%) |
| 35 to 64 Years | 0 (0.0%) | 0 (0.0%) |
| 65 to 74 Years | 12 (40.0%) | 0 (0.0%) |
| 75 Years and over | 0 (0.0%) | 0 (0.0%) |
Disability Class: Self-Care Difficulty
| Age Bracket | Male | Female |
| 5 to 17 Years | 0 (0.0%) | 0 (0.0%) |
| 18 to 34 Years | 0 (0.0%) | 0 (0.0%) |
| 35 to 64 Years | 0 (0.0%) | 0 (0.0%) |
| 65 to 74 Years | 0 (0.0%) | 0 (0.0%) |
| 75 Years and over | 0 (0.0%) | 0 (0.0%) |
Technology Access in Spofford
Computing Device Access in Spofford
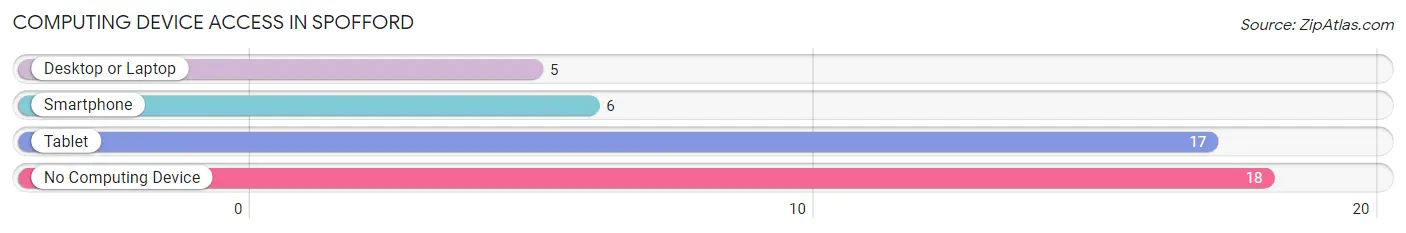
| Device Type | # Households | % Households |
| Desktop or Laptop | 5 | 13.9% |
| Smartphone | 6 | 16.7% |
| Tablet | 17 | 47.2% |
| No Computing Device | 18 | 50.0% |
| Total | 36 | 100.0% |
Internet Access in Spofford
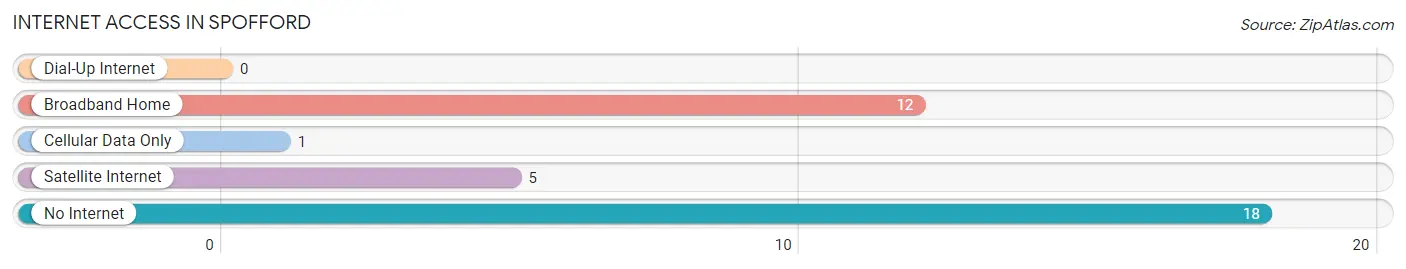
| Internet Type | # Households | % Households |
| Dial-Up Internet | 0 | 0.0% |
| Broadband Home | 12 | 33.3% |
| Cellular Data Only | 1 | 2.8% |
| Satellite Internet | 5 | 13.9% |
| No Internet | 18 | 50.0% |
| Total | 36 | 100.0% |
Spofford Summary
Spofford is a small unincorporated community located in the southwestern corner of Texas, in the county of Kinney. It is situated on the banks of the Rio Grande, just north of the Mexican border. The population of Spofford was estimated to be around 200 people in 2020.
History
Spofford was founded in 1881 by a group of settlers from the nearby town of Brackettville. The settlers named the town after a local rancher, John Spofford. The town was originally a farming community, but it soon became a trading post for the surrounding area. In the early 1900s, the town was home to a number of businesses, including a general store, a blacksmith shop, and a saloon.
In the 1920s, the town began to decline as the local economy shifted away from agriculture. The Great Depression further weakened the town, and by the 1940s, most of the businesses had closed. In the 1950s, the town was revitalized by the construction of a bridge across the Rio Grande, which allowed for increased trade with Mexico.
Geography
Spofford is located in the southwestern corner of Texas, in the county of Kinney. It is situated on the banks of the Rio Grande, just north of the Mexican border. The town is surrounded by a number of small towns and villages, including Brackettville, Del Rio, and Eagle Pass. The terrain around Spofford is mostly flat, with some rolling hills. The climate is semi-arid, with hot summers and mild winters.
Economy
The economy of Spofford is largely based on agriculture and tourism. The town is home to a number of small farms, which produce a variety of crops, including cotton, corn, and wheat. The town also has a number of tourist attractions, including the historic Spofford Hotel, the Spofford Museum, and the Spofford Wildlife Refuge.
Demographics
The population of Spofford was estimated to be around 200 people in 2020. The town is predominantly Hispanic, with a large percentage of Mexican-American residents. The median household income in Spofford is around $30,000, and the median home value is around $90,000. The town has a high rate of poverty, with around 40% of the population living below the poverty line.
Conclusion
Spofford is a small unincorporated community located in the southwestern corner of Texas, in the county of Kinney. It is situated on the banks of the Rio Grande, just north of the Mexican border. The town has a long history, and its economy is largely based on agriculture and tourism. The population of Spofford is predominantly Hispanic, with a large percentage of Mexican-American residents. The town has a high rate of poverty, with around 40% of the population living below the poverty line.
Common Questions
What is the Total Population of Spofford?
Total Population of Spofford is 103.
What is the Total Male Population of Spofford?
Total Male Population of Spofford is 30.
What is the Total Female Population of Spofford?
Total Female Population of Spofford is 73.
What is the Ratio of Males per 100 Females in Spofford?
There are 41.10 Males per 100 Females in Spofford.
What is the Ratio of Females per 100 Males in Spofford?
There are 243.33 Females per 100 Males in Spofford.
What is the Median Population Age in Spofford?
Median Population Age in Spofford is 65.5 Years.
What is the Average Family Size in Spofford
Average Family Size in Spofford is 2.9 People.
What is the Average Household Size in Spofford
Average Household Size in Spofford is 2.9 People.
What is Per Capita Income in Spofford?
Per Capita income in Spofford is $42,286.
What is the Median Family Income in Spofford?
Median Family Income in Spofford is $70,000.
What is the Median Household income in Spofford?
Median Household Income in Spofford is $70,000.
What is Inequality or Gini Index in Spofford?
Inequality or Gini Index in Spofford is 0.15.
How Large is the Labor Force in Spofford?
There are 68 People in the Labor Forcein in Spofford.
What is the Percentage of People in the Labor Force in Spofford?
66.0% of People are in the Labor Force in Spofford.