Sour Lake, TX
Sour Lake Map
Sour Lake Overview
2,083
TOTAL POPULATION
1,005
MALE POPULATION
1,078
FEMALE POPULATION
93.23
MALES / 100 FEMALES
107.26
FEMALES / 100 MALES
30.3
MEDIAN AGE
3.3
AVG FAMILY SIZE
3.0
AVG HOUSEHOLD SIZE
$27,882
PER CAPITA INCOME
$71,439
AVG FAMILY INCOME
$65,515
AVG HOUSEHOLD INCOME
39.8%
WAGE / INCOME GAP [ % ]
60.2¢/ $1
WAGE / INCOME GAP [ $ ]
0.45
INEQUALITY / GINI INDEX
863
LABOR FORCE [ PEOPLE ]
62.9%
PERCENT IN LABOR FORCE
4.9%
UNEMPLOYMENT RATE
Sour Lake Zip Codes
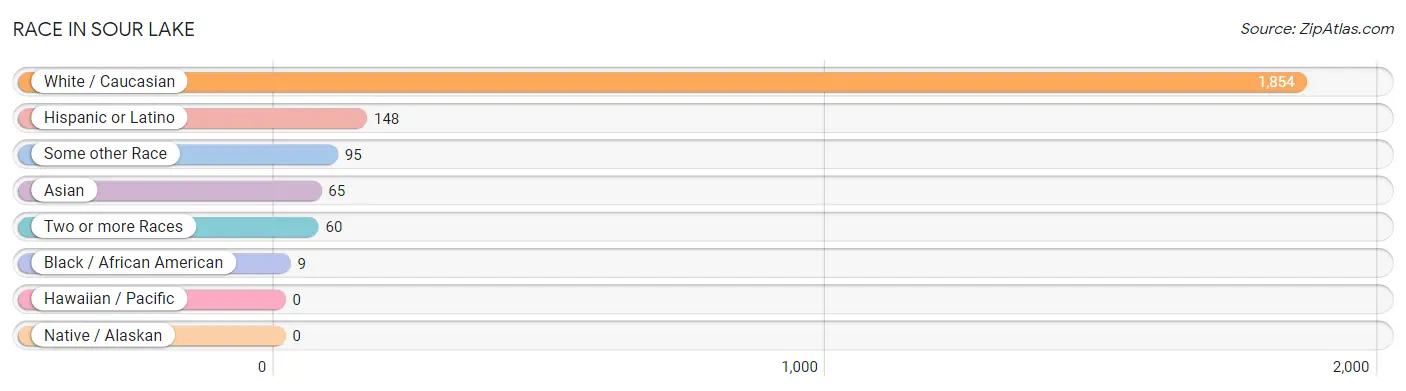
Race in Sour Lake
The most populous races in Sour Lake are White / Caucasian (1,854 | 89.0%), Hispanic or Latino (148 | 7.1%), and Some other Race (95 | 4.6%).
| Race | # Population | % Population |
| Asian | 65 | 3.1% |
| Black / African American | 9 | 0.4% |
| Hawaiian / Pacific | 0 | 0.0% |
| Hispanic or Latino | 148 | 7.1% |
| Native / Alaskan | 0 | 0.0% |
| White / Caucasian | 1,854 | 89.0% |
| Two or more Races | 60 | 2.9% |
| Some other Race | 95 | 4.6% |
| Total | 2,083 | 100.0% |
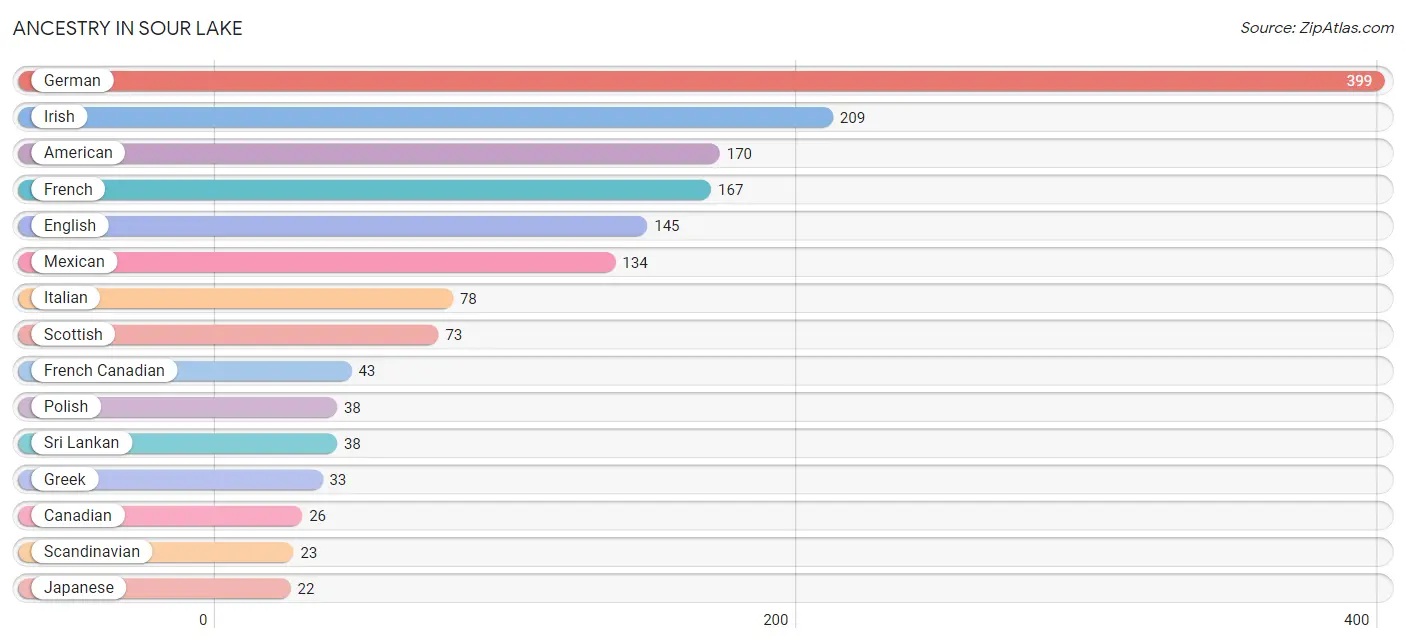
Ancestry in Sour Lake
The most populous ancestries reported in Sour Lake are German (399 | 19.2%), Irish (209 | 10.0%), American (170 | 8.2%), French (167 | 8.0%), and English (145 | 7.0%), together accounting for 52.3% of all Sour Lake residents.
| Ancestry | # Population | % Population |
| American | 170 | 8.2% |
| Canadian | 26 | 1.3% |
| Central American | 11 | 0.5% |
| Cherokee | 14 | 0.7% |
| Choctaw | 14 | 0.7% |
| Costa Rican | 11 | 0.5% |
| Dutch | 4 | 0.2% |
| English | 145 | 7.0% |
| European | 12 | 0.6% |
| French | 167 | 8.0% |
| French Canadian | 43 | 2.1% |
| German | 399 | 19.2% |
| Greek | 33 | 1.6% |
| Hungarian | 4 | 0.2% |
| Icelander | 3 | 0.1% |
| Indian (Asian) | 3 | 0.1% |
| Irish | 209 | 10.0% |
| Italian | 78 | 3.7% |
| Japanese | 22 | 1.1% |
| Korean | 9 | 0.4% |
| Mexican | 134 | 6.4% |
| Norwegian | 3 | 0.1% |
| Polish | 38 | 1.8% |
| Scandinavian | 23 | 1.1% |
| Scotch-Irish | 6 | 0.3% |
| Scottish | 73 | 3.5% |
| Sri Lankan | 38 | 1.8% |
| Swedish | 4 | 0.2% | View All 28 Rows |
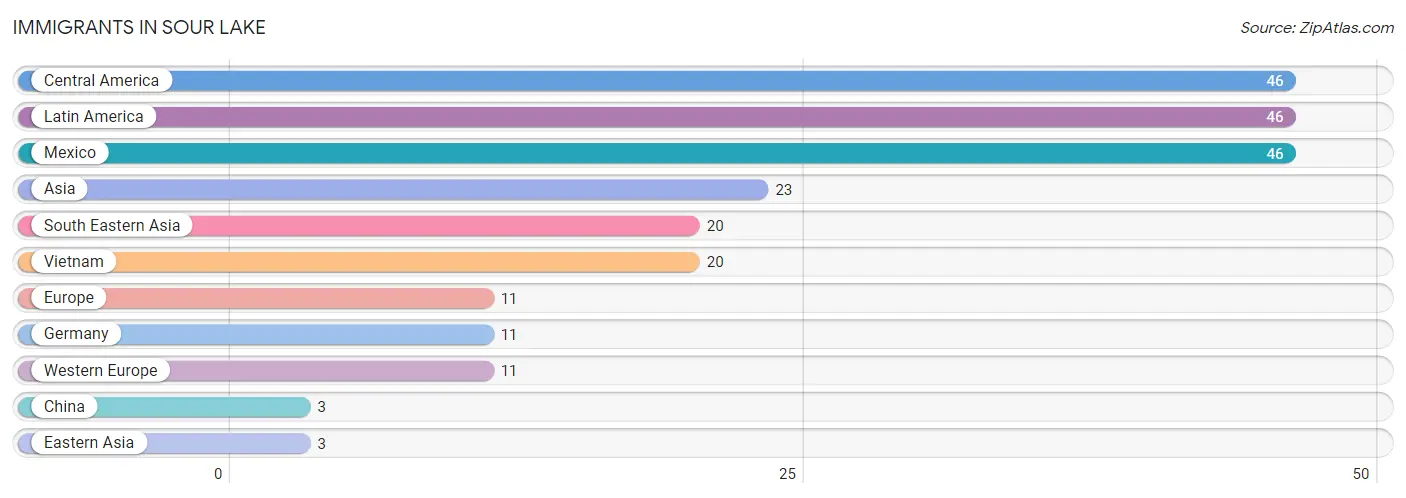
Immigrants in Sour Lake
The most numerous immigrant groups reported in Sour Lake came from Central America (46 | 2.2%), Latin America (46 | 2.2%), Mexico (46 | 2.2%), Asia (23 | 1.1%), and South Eastern Asia (20 | 1.0%), together accounting for 8.7% of all Sour Lake residents.
| Immigration Origin | # Population | % Population |
| Asia | 23 | 1.1% |
| Central America | 46 | 2.2% |
| China | 3 | 0.1% |
| Eastern Asia | 3 | 0.1% |
| Europe | 11 | 0.5% |
| Germany | 11 | 0.5% |
| Latin America | 46 | 2.2% |
| Mexico | 46 | 2.2% |
| South Eastern Asia | 20 | 1.0% |
| Vietnam | 20 | 1.0% |
| Western Europe | 11 | 0.5% | View All 11 Rows |
Sex and Age in Sour Lake
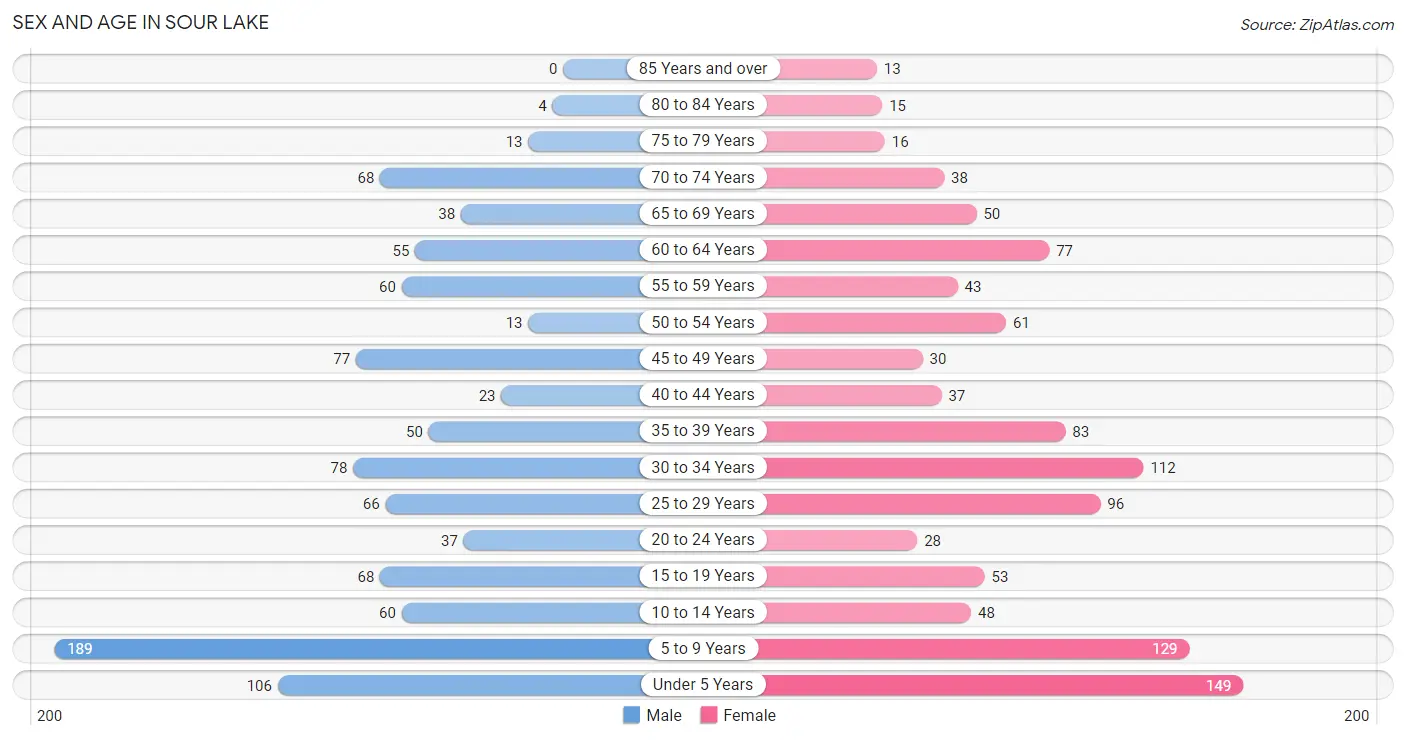
Sex and Age in Sour Lake
The most populous age groups in Sour Lake are 5 to 9 Years (189 | 18.8%) for men and Under 5 Years (149 | 13.8%) for women.
| Age Bracket | Male | Female |
| Under 5 Years | 106 (10.5%) | 149 (13.8%) |
| 5 to 9 Years | 189 (18.8%) | 129 (12.0%) |
| 10 to 14 Years | 60 (6.0%) | 48 (4.4%) |
| 15 to 19 Years | 68 (6.8%) | 53 (4.9%) |
| 20 to 24 Years | 37 (3.7%) | 28 (2.6%) |
| 25 to 29 Years | 66 (6.6%) | 96 (8.9%) |
| 30 to 34 Years | 78 (7.8%) | 112 (10.4%) |
| 35 to 39 Years | 50 (5.0%) | 83 (7.7%) |
| 40 to 44 Years | 23 (2.3%) | 37 (3.4%) |
| 45 to 49 Years | 77 (7.7%) | 30 (2.8%) |
| 50 to 54 Years | 13 (1.3%) | 61 (5.7%) |
| 55 to 59 Years | 60 (6.0%) | 43 (4.0%) |
| 60 to 64 Years | 55 (5.5%) | 77 (7.1%) |
| 65 to 69 Years | 38 (3.8%) | 50 (4.6%) |
| 70 to 74 Years | 68 (6.8%) | 38 (3.5%) |
| 75 to 79 Years | 13 (1.3%) | 16 (1.5%) |
| 80 to 84 Years | 4 (0.4%) | 15 (1.4%) |
| 85 Years and over | 0 (0.0%) | 13 (1.2%) |
| Total | 1,005 (100.0%) | 1,078 (100.0%) |
Families and Households in Sour Lake
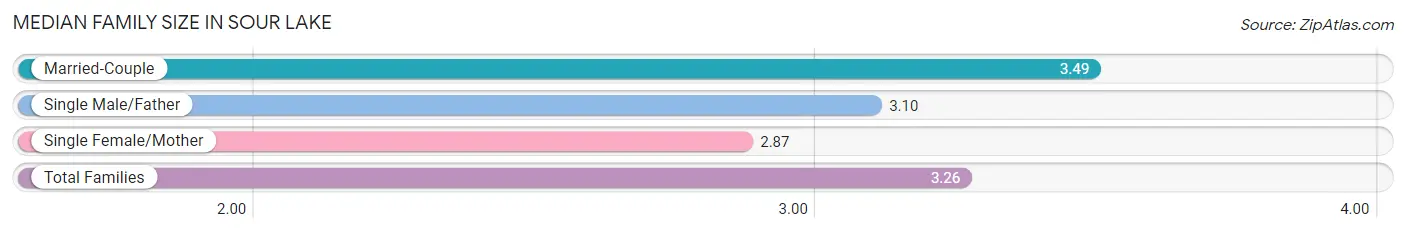
Median Family Size in Sour Lake
The median family size in Sour Lake is 3.26 persons per family, with married-couple families (294 | 56.1%) accounting for the largest median family size of 3.49 persons per family. On the other hand, single female/mother families (141 | 26.9%) represent the smallest median family size with 2.87 persons per family.
| Family Type | # Families | Family Size |
| Married-Couple | 294 (56.1%) | 3.49 |
| Single Male/Father | 89 (17.0%) | 3.10 |
| Single Female/Mother | 141 (26.9%) | 2.87 |
| Total Families | 524 (100.0%) | 3.26 |
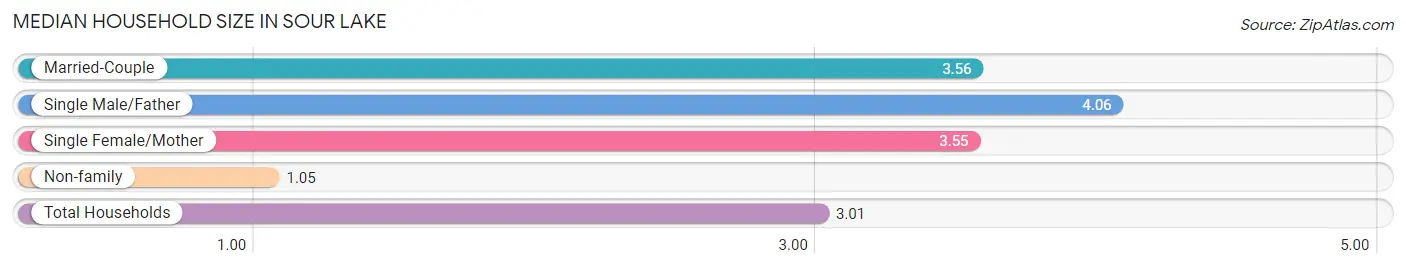
Median Household Size in Sour Lake
The median household size in Sour Lake is 3.01 persons per household, with single male/father households (89 | 12.9%) accounting for the largest median household size of 4.06 persons per household. non-family households (167 | 24.2%) represent the smallest median household size with 1.05 persons per household.
| Household Type | # Households | Household Size |
| Married-Couple | 294 (42.5%) | 3.56 |
| Single Male/Father | 89 (12.9%) | 4.06 |
| Single Female/Mother | 141 (20.4%) | 3.55 |
| Non-family | 167 (24.2%) | 1.05 |
| Total Households | 691 (100.0%) | 3.01 |
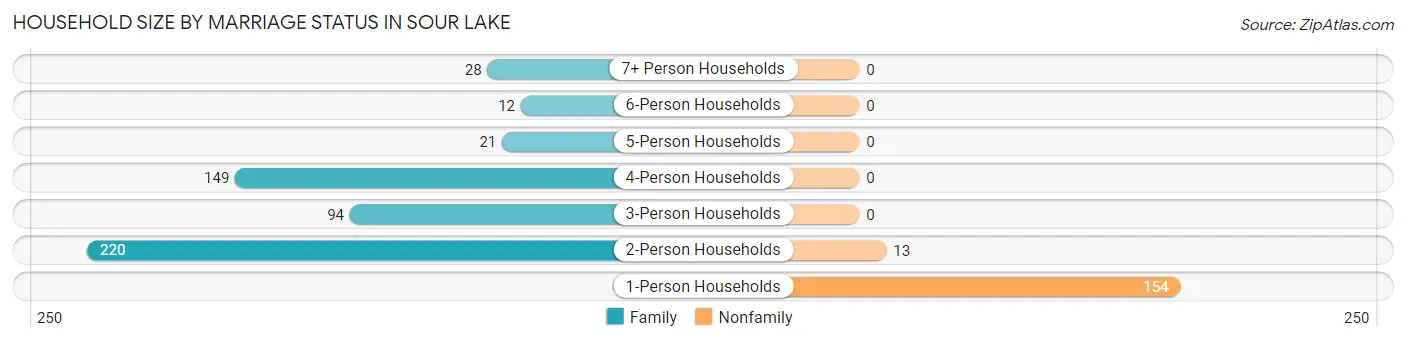
Household Size by Marriage Status in Sour Lake
Out of a total of 691 households in Sour Lake, 524 (75.8%) are family households, while 167 (24.2%) are nonfamily households. The most numerous type of family households are 2-person households, comprising 220, and the most common type of nonfamily households are 1-person households, comprising 154.
| Household Size | Family Households | Nonfamily Households |
| 1-Person Households | - | 154 (22.3%) |
| 2-Person Households | 220 (31.8%) | 13 (1.9%) |
| 3-Person Households | 94 (13.6%) | 0 (0.0%) |
| 4-Person Households | 149 (21.6%) | 0 (0.0%) |
| 5-Person Households | 21 (3.0%) | 0 (0.0%) |
| 6-Person Households | 12 (1.7%) | 0 (0.0%) |
| 7+ Person Households | 28 (4.1%) | 0 (0.0%) |
| Total | 524 (75.8%) | 167 (24.2%) |
Female Fertility in Sour Lake
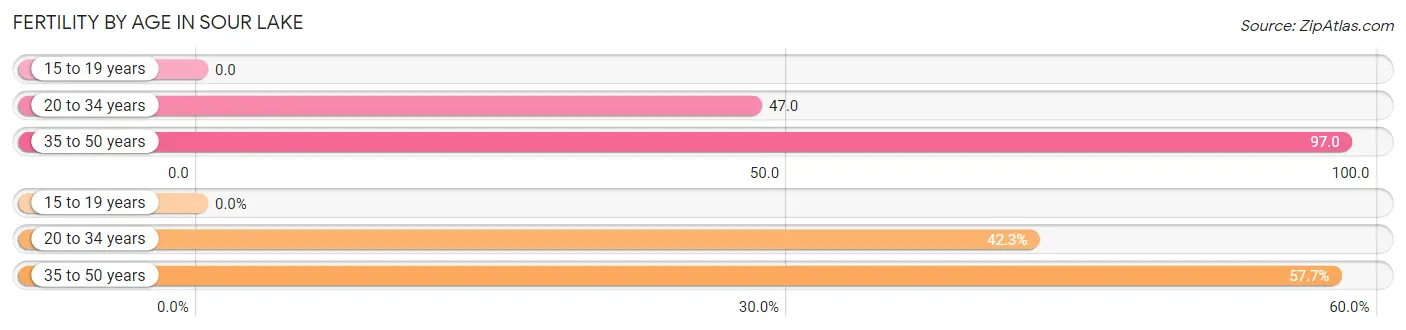
Fertility by Age in Sour Lake
Average fertility rate in Sour Lake is 59.0 births per 1,000 women. Women in the age bracket of 35 to 50 years have the highest fertility rate with 97.0 births per 1,000 women. Women in the age bracket of 35 to 50 years acount for 57.7% of all women with births.
| Age Bracket | Women with Births | Births / 1,000 Women |
| 15 to 19 years | 0 (0.0%) | 0.0 |
| 20 to 34 years | 11 (42.3%) | 47.0 |
| 35 to 50 years | 15 (57.7%) | 97.0 |
| Total | 26 (100.0%) | 59.0 |
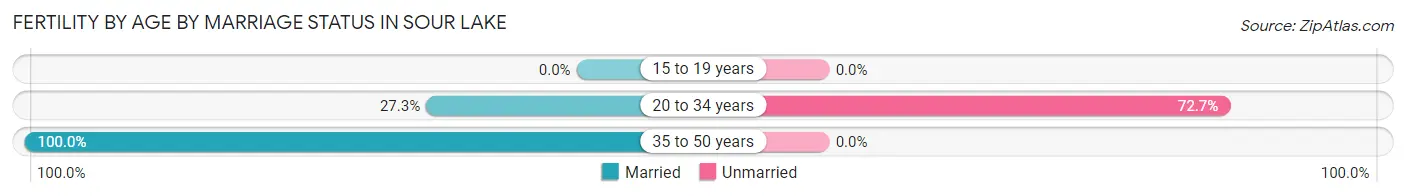
Fertility by Age by Marriage Status in Sour Lake
69.2% of women with births (26) in Sour Lake are married. The highest percentage of unmarried women with births falls into 20 to 34 years age bracket with 72.7% of them unmarried at the time of birth, while the lowest percentage of unmarried women with births belong to 35 to 50 years age bracket with 0.0% of them unmarried.
| Age Bracket | Married | Unmarried |
| 15 to 19 years | 0 (0.0%) | 0 (0.0%) |
| 20 to 34 years | 3 (27.3%) | 8 (72.7%) |
| 35 to 50 years | 15 (100.0%) | 0 (0.0%) |
| Total | 18 (69.2%) | 8 (30.8%) |
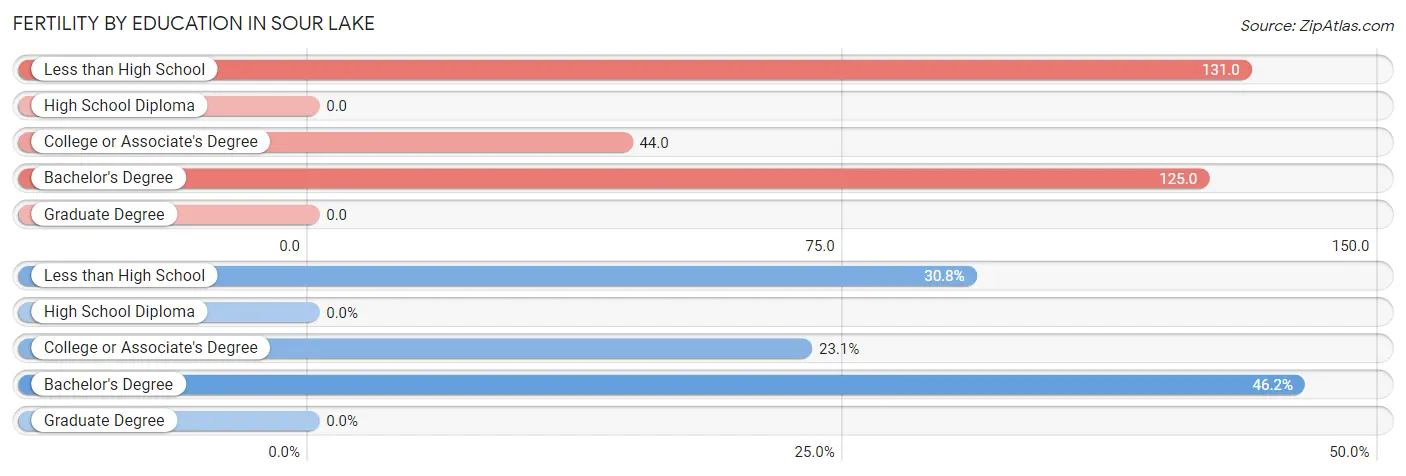
Fertility by Education in Sour Lake
| Educational Attainment | Women with Births | Births / 1,000 Women |
| Less than High School | 8 (30.8%) | 131.0 |
| High School Diploma | 0 (0.0%) | 0.0 |
| College or Associate's Degree | 6 (23.1%) | 44.0 |
| Bachelor's Degree | 12 (46.2%) | 125.0 |
| Graduate Degree | 0 (0.0%) | 0.0 |
| Total | 26 (100.0%) | 59.0 |
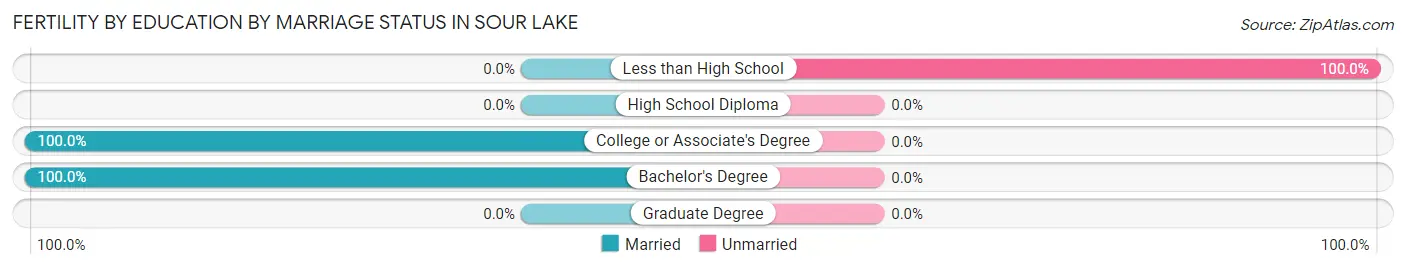
Fertility by Education by Marriage Status in Sour Lake
30.8% of women with births in Sour Lake are unmarried. Women with the educational attainment of college or associate's degree are most likely to be married with 100.0% of them married at childbirth, while women with the educational attainment of less than high school are least likely to be married with 100.0% of them unmarried at childbirth.
| Educational Attainment | Married | Unmarried |
| Less than High School | 0 (0.0%) | 8 (100.0%) |
| High School Diploma | 0 (0.0%) | 0 (0.0%) |
| College or Associate's Degree | 6 (100.0%) | 0 (0.0%) |
| Bachelor's Degree | 12 (100.0%) | 0 (0.0%) |
| Graduate Degree | 0 (0.0%) | 0 (0.0%) |
| Total | 18 (69.2%) | 8 (30.8%) |
Income in Sour Lake
Income Overview in Sour Lake
Per Capita Income in Sour Lake is $27,882, while median incomes of families and households are $71,439 and $65,515 respectively.
| Characteristic | Number | Measure |
| Per Capita Income | 2,083 | $27,882 |
| Median Family Income | 524 | $71,439 |
| Mean Family Income | 524 | $82,843 |
| Median Household Income | 691 | $65,515 |
| Mean Household Income | 691 | $81,518 |
| Income Deficit | 524 | $0 |
| Wage / Income Gap (%) | 2,083 | 39.81% |
| Wage / Income Gap ($) | 2,083 | 60.19¢ per $1 |
| Gini / Inequality Index | 2,083 | 0.45 |
Earnings by Sex in Sour Lake
Average Earnings in Sour Lake are $37,083, $50,938 for men and $30,662 for women, a difference of 39.8%.
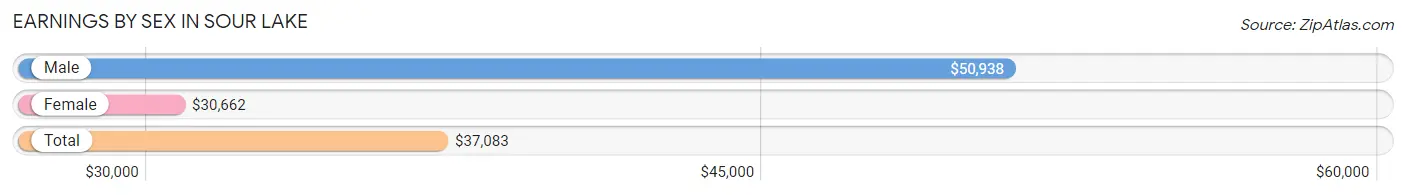
| Sex | Number | Average Earnings |
| Male | 467 (53.5%) | $50,938 |
| Female | 406 (46.5%) | $30,662 |
| Total | 873 (100.0%) | $37,083 |
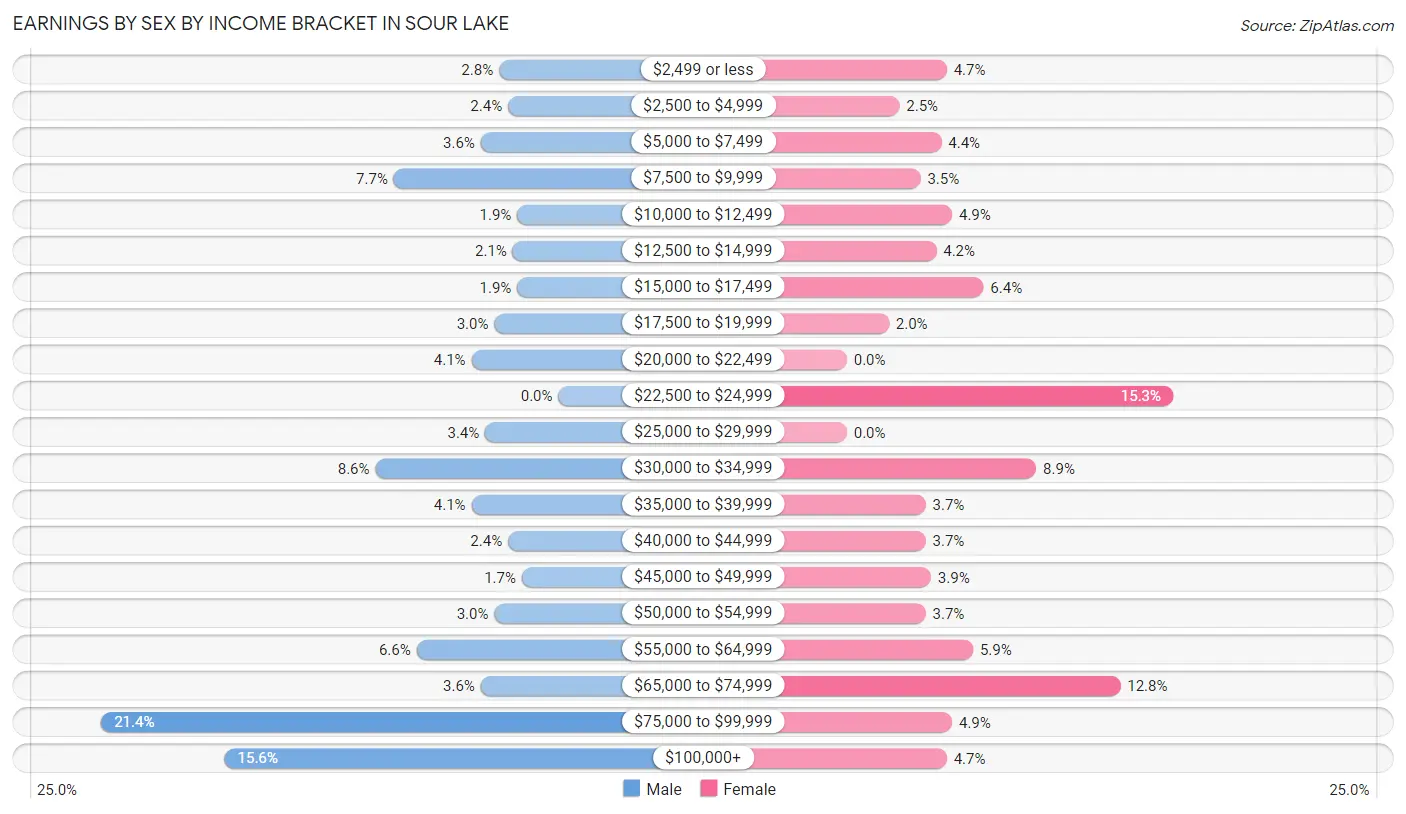
Earnings by Sex by Income Bracket in Sour Lake
The most common earnings brackets in Sour Lake are $75,000 to $99,999 for men (100 | 21.4%) and $22,500 to $24,999 for women (62 | 15.3%).
| Income | Male | Female |
| $2,499 or less | 13 (2.8%) | 19 (4.7%) |
| $2,500 to $4,999 | 11 (2.4%) | 10 (2.5%) |
| $5,000 to $7,499 | 17 (3.6%) | 18 (4.4%) |
| $7,500 to $9,999 | 36 (7.7%) | 14 (3.5%) |
| $10,000 to $12,499 | 9 (1.9%) | 20 (4.9%) |
| $12,500 to $14,999 | 10 (2.1%) | 17 (4.2%) |
| $15,000 to $17,499 | 9 (1.9%) | 26 (6.4%) |
| $17,500 to $19,999 | 14 (3.0%) | 8 (2.0%) |
| $20,000 to $22,499 | 19 (4.1%) | 0 (0.0%) |
| $22,500 to $24,999 | 0 (0.0%) | 62 (15.3%) |
| $25,000 to $29,999 | 16 (3.4%) | 0 (0.0%) |
| $30,000 to $34,999 | 40 (8.6%) | 36 (8.9%) |
| $35,000 to $39,999 | 19 (4.1%) | 15 (3.7%) |
| $40,000 to $44,999 | 11 (2.4%) | 15 (3.7%) |
| $45,000 to $49,999 | 8 (1.7%) | 16 (3.9%) |
| $50,000 to $54,999 | 14 (3.0%) | 15 (3.7%) |
| $55,000 to $64,999 | 31 (6.6%) | 24 (5.9%) |
| $65,000 to $74,999 | 17 (3.6%) | 52 (12.8%) |
| $75,000 to $99,999 | 100 (21.4%) | 20 (4.9%) |
| $100,000+ | 73 (15.6%) | 19 (4.7%) |
| Total | 467 (100.0%) | 406 (100.0%) |
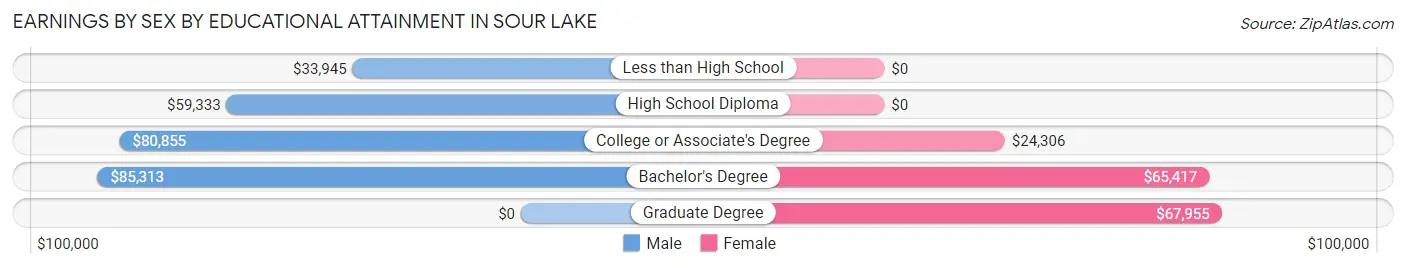
Earnings by Sex by Educational Attainment in Sour Lake
Average earnings in Sour Lake are $58,816 for men and $33,125 for women, a difference of 43.7%. Men with an educational attainment of bachelor's degree enjoy the highest average annual earnings of $85,313, while those with less than high school education earn the least with $33,945. Women with an educational attainment of graduate degree earn the most with the average annual earnings of $67,955, while those with college or associate's degree education have the smallest earnings of $24,306.
| Educational Attainment | Male Income | Female Income |
| Less than High School | $33,945 | $0 |
| High School Diploma | $59,333 | $0 |
| College or Associate's Degree | $80,855 | $24,306 |
| Bachelor's Degree | $85,313 | $65,417 |
| Graduate Degree | - | - |
| Total | $58,816 | $33,125 |
Family Income in Sour Lake
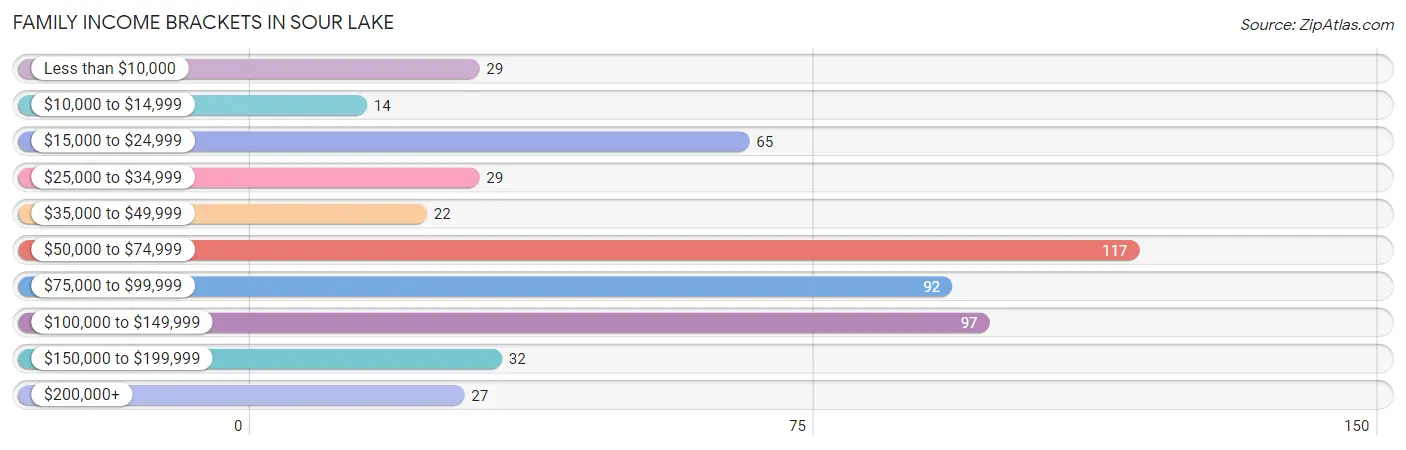
Family Income Brackets in Sour Lake
According to the Sour Lake family income data, there are 117 families falling into the $50,000 to $74,999 income range, which is the most common income bracket and makes up 22.3% of all families. Conversely, the $10,000 to $14,999 income bracket is the least frequent group with only 14 families (2.7%) belonging to this category.
| Income Bracket | # Families | % Families |
| Less than $10,000 | 29 | 5.5% |
| $10,000 to $14,999 | 14 | 2.7% |
| $15,000 to $24,999 | 65 | 12.4% |
| $25,000 to $34,999 | 29 | 5.5% |
| $35,000 to $49,999 | 22 | 4.2% |
| $50,000 to $74,999 | 117 | 22.3% |
| $75,000 to $99,999 | 92 | 17.6% |
| $100,000 to $149,999 | 97 | 18.5% |
| $150,000 to $199,999 | 32 | 6.1% |
| $200,000+ | 27 | 5.2% |
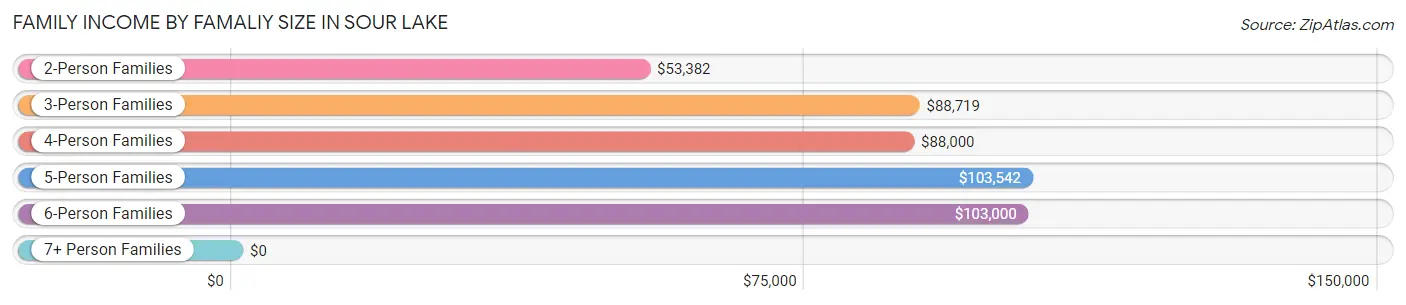
Family Income by Famaliy Size in Sour Lake
5-person families (31 | 5.9%) account for the highest median family income in Sour Lake with $103,542 per family, while 3-person families (137 | 26.2%) have the highest median income of $29,573 per family member.
| Income Bracket | # Families | Median Income |
| 2-Person Families | 242 (46.2%) | $53,382 |
| 3-Person Families | 137 (26.2%) | $88,719 |
| 4-Person Families | 92 (17.6%) | $88,000 |
| 5-Person Families | 31 (5.9%) | $103,542 |
| 6-Person Families | 22 (4.2%) | $103,000 |
| 7+ Person Families | 0 (0.0%) | $0 |
| Total | 524 (100.0%) | $71,439 |
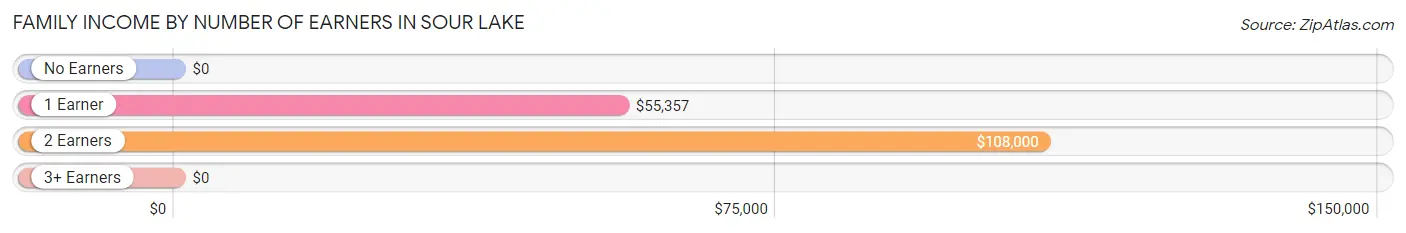
Family Income by Number of Earners in Sour Lake
| Number of Earners | # Families | Median Income |
| No Earners | 76 (14.5%) | $0 |
| 1 Earner | 252 (48.1%) | $55,357 |
| 2 Earners | 170 (32.4%) | $108,000 |
| 3+ Earners | 26 (5.0%) | $0 |
| Total | 524 (100.0%) | $71,439 |
Household Income in Sour Lake
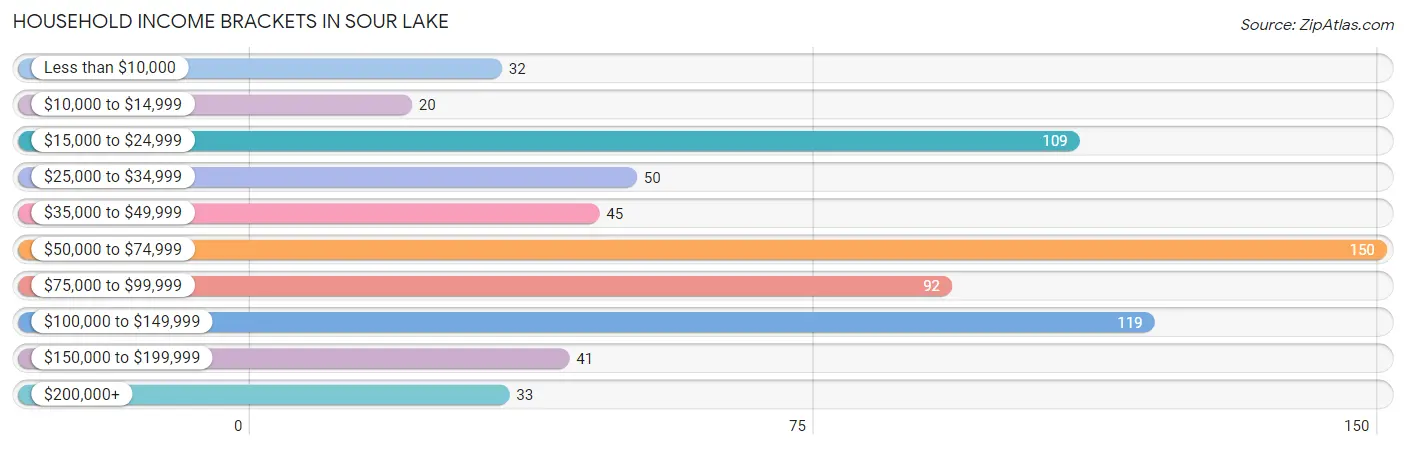
Household Income Brackets in Sour Lake
With 150 households falling in the category, the $50,000 to $74,999 income range is the most frequent in Sour Lake, accounting for 21.7% of all households. In contrast, only 20 households (2.9%) fall into the $10,000 to $14,999 income bracket, making it the least populous group.
| Income Bracket | # Households | % Households |
| Less than $10,000 | 32 | 4.6% |
| $10,000 to $14,999 | 20 | 2.9% |
| $15,000 to $24,999 | 109 | 15.8% |
| $25,000 to $34,999 | 50 | 7.2% |
| $35,000 to $49,999 | 45 | 6.5% |
| $50,000 to $74,999 | 150 | 21.7% |
| $75,000 to $99,999 | 92 | 13.3% |
| $100,000 to $149,999 | 119 | 17.2% |
| $150,000 to $199,999 | 41 | 5.9% |
| $200,000+ | 33 | 4.8% |
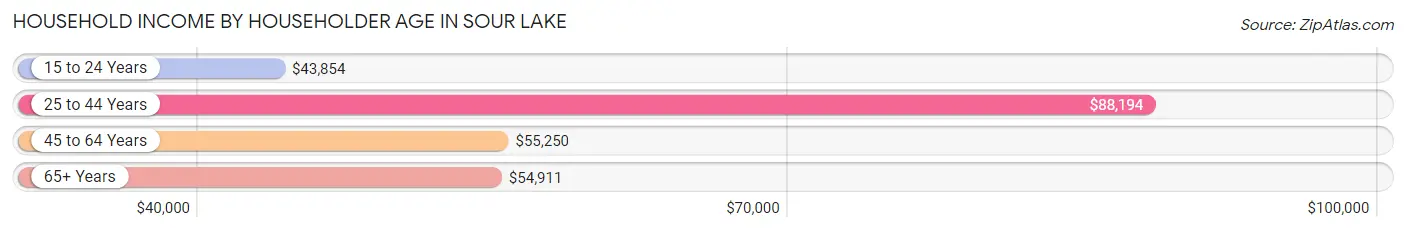
Household Income by Householder Age in Sour Lake
The median household income in Sour Lake is $65,515, with the highest median household income of $88,194 found in the 25 to 44 years age bracket for the primary householder. A total of 291 households (42.1%) fall into this category. Meanwhile, the 15 to 24 years age bracket for the primary householder has the lowest median household income of $43,854, with 25 households (3.6%) in this group.
| Income Bracket | # Households | Median Income |
| 15 to 24 Years | 25 (3.6%) | $43,854 |
| 25 to 44 Years | 291 (42.1%) | $88,194 |
| 45 to 64 Years | 230 (33.3%) | $55,250 |
| 65+ Years | 145 (21.0%) | $54,911 |
| Total | 691 (100.0%) | $65,515 |
Poverty in Sour Lake
Income Below Poverty by Sex and Age in Sour Lake
With 14.7% poverty level for males and 16.6% for females among the residents of Sour Lake, 15 year old males and 15 year old females are the most vulnerable to poverty, with 20 males (100.0%) and 10 females (100.0%) in their respective age groups living below the poverty level.
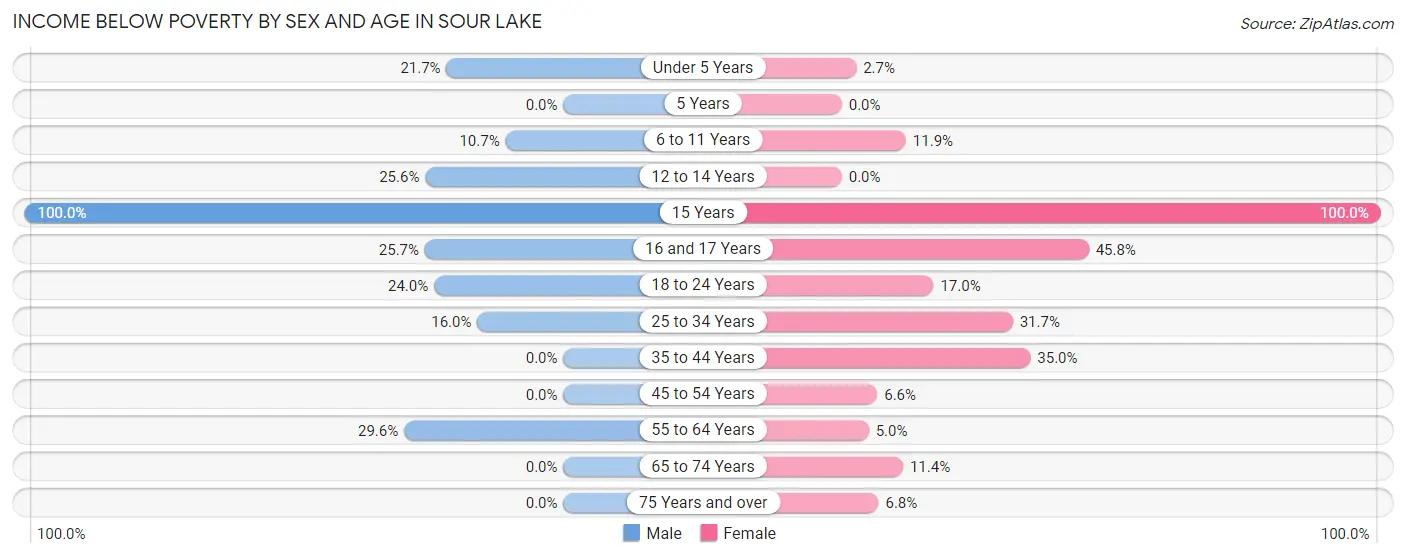
| Age Bracket | Male | Female |
| Under 5 Years | 23 (21.7%) | 4 (2.7%) |
| 5 Years | 0 (0.0%) | 0 (0.0%) |
| 6 to 11 Years | 13 (10.7%) | 10 (11.9%) |
| 12 to 14 Years | 10 (25.6%) | 0 (0.0%) |
| 15 Years | 20 (100.0%) | 10 (100.0%) |
| 16 and 17 Years | 9 (25.7%) | 11 (45.8%) |
| 18 to 24 Years | 12 (24.0%) | 8 (17.0%) |
| 25 to 34 Years | 23 (16.0%) | 66 (31.7%) |
| 35 to 44 Years | 0 (0.0%) | 42 (35.0%) |
| 45 to 54 Years | 0 (0.0%) | 6 (6.6%) |
| 55 to 64 Years | 34 (29.6%) | 6 (5.0%) |
| 65 to 74 Years | 0 (0.0%) | 10 (11.4%) |
| 75 Years and over | 0 (0.0%) | 3 (6.8%) |
| Total | 144 (14.7%) | 176 (16.6%) |
Income Above Poverty by Sex and Age in Sour Lake
According to the poverty statistics in Sour Lake, males aged 5 years and females aged 5 years are the age groups that are most secure financially, with 100.0% of males and 100.0% of females in these age groups living above the poverty line.
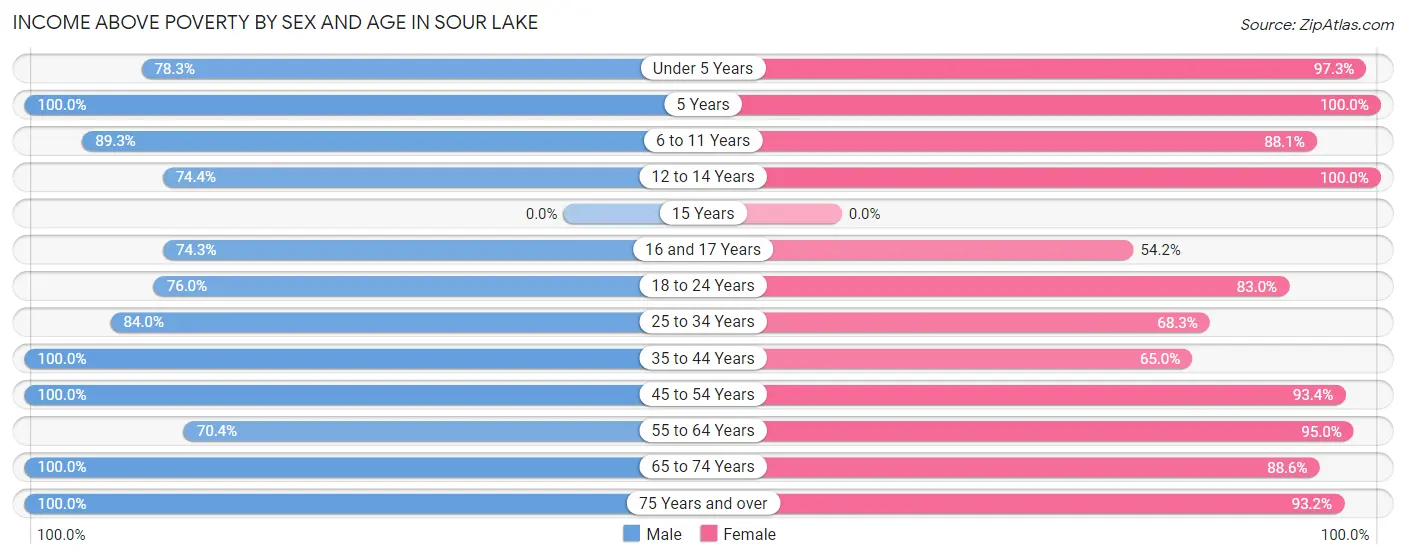
| Age Bracket | Male | Female |
| Under 5 Years | 83 (78.3%) | 145 (97.3%) |
| 5 Years | 63 (100.0%) | 51 (100.0%) |
| 6 to 11 Years | 108 (89.3%) | 74 (88.1%) |
| 12 to 14 Years | 29 (74.4%) | 22 (100.0%) |
| 15 Years | 0 (0.0%) | 0 (0.0%) |
| 16 and 17 Years | 26 (74.3%) | 13 (54.2%) |
| 18 to 24 Years | 38 (76.0%) | 39 (83.0%) |
| 25 to 34 Years | 121 (84.0%) | 142 (68.3%) |
| 35 to 44 Years | 73 (100.0%) | 78 (65.0%) |
| 45 to 54 Years | 90 (100.0%) | 85 (93.4%) |
| 55 to 64 Years | 81 (70.4%) | 114 (95.0%) |
| 65 to 74 Years | 106 (100.0%) | 78 (88.6%) |
| 75 Years and over | 17 (100.0%) | 41 (93.2%) |
| Total | 835 (85.3%) | 882 (83.4%) |
Income Below Poverty Among Married-Couple Families in Sour Lake
The poverty statistics for married-couple families in Sour Lake show that 0.7% or 2 of the total 294 families live below the poverty line. Families with 1 or 2 children have the highest poverty rate of 1.4%, comprising of 2 families. On the other hand, families with no children have the lowest poverty rate of 0.0%, which includes 0 families.
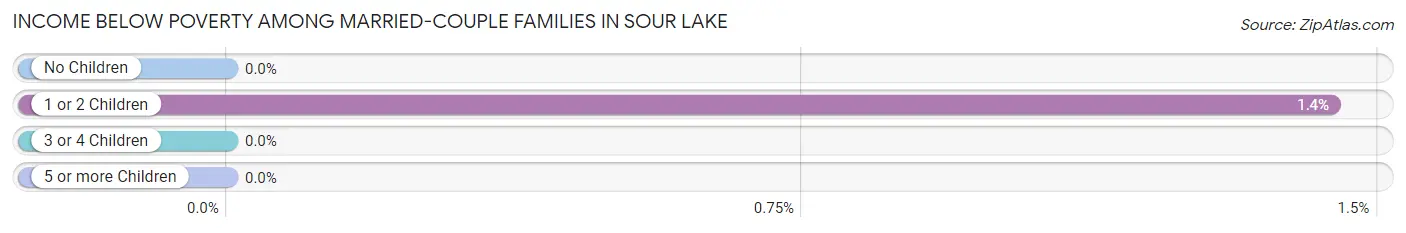
| Children | Above Poverty | Below Poverty |
| No Children | 123 (100.0%) | 0 (0.0%) |
| 1 or 2 Children | 137 (98.6%) | 2 (1.4%) |
| 3 or 4 Children | 32 (100.0%) | 0 (0.0%) |
| 5 or more Children | 0 (0.0%) | 0 (0.0%) |
| Total | 292 (99.3%) | 2 (0.7%) |
Income Below Poverty Among Single-Parent Households in Sour Lake
According to the poverty data in Sour Lake, 25.8% or 23 single-father households and 23.4% or 33 single-mother households are living below the poverty line. Among single-father households, those with no children have the highest poverty rate, with 17 households (80.9%) experiencing poverty. Likewise, among single-mother households, those with 3 or 4 children have the highest poverty rate, with 12 households (40.0%) falling below the poverty line.
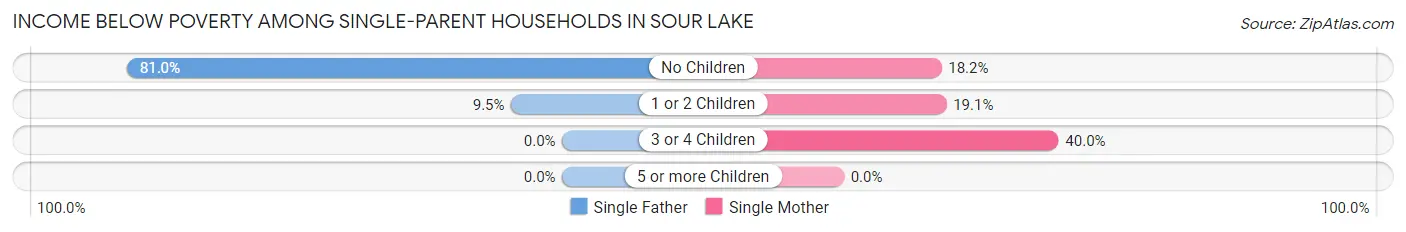
| Children | Single Father | Single Mother |
| No Children | 17 (80.9%) | 4 (18.2%) |
| 1 or 2 Children | 6 (9.5%) | 17 (19.1%) |
| 3 or 4 Children | 0 (0.0%) | 12 (40.0%) |
| 5 or more Children | 0 (0.0%) | 0 (0.0%) |
| Total | 23 (25.8%) | 33 (23.4%) |
Income Below Poverty Among Married-Couple vs Single-Parent Households in Sour Lake
The poverty data for Sour Lake shows that 2 of the married-couple family households (0.7%) and 56 of the single-parent households (24.3%) are living below the poverty level. Within the married-couple family households, those with 1 or 2 children have the highest poverty rate, with 2 households (1.4%) falling below the poverty line. Among the single-parent households, those with no children have the highest poverty rate, with 21 household (48.8%) living below poverty.
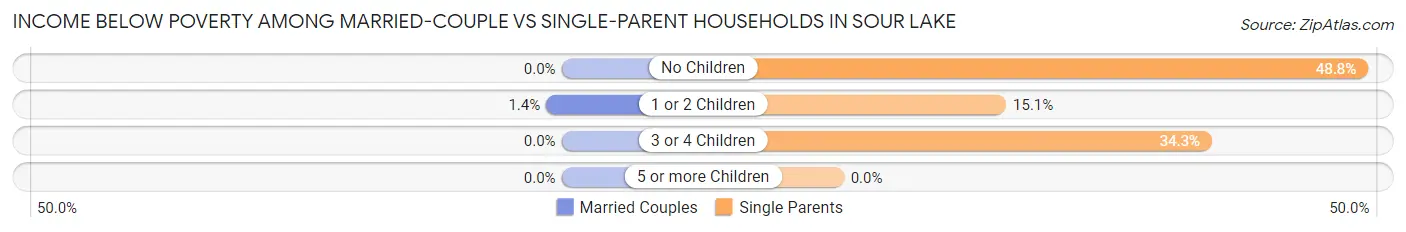
| Children | Married-Couple Families | Single-Parent Households |
| No Children | 0 (0.0%) | 21 (48.8%) |
| 1 or 2 Children | 2 (1.4%) | 23 (15.1%) |
| 3 or 4 Children | 0 (0.0%) | 12 (34.3%) |
| 5 or more Children | 0 (0.0%) | 0 (0.0%) |
| Total | 2 (0.7%) | 56 (24.3%) |
Employment Characteristics in Sour Lake
Employment by Class of Employer in Sour Lake
Among the 803 employed individuals in Sour Lake, private company employees (542 | 67.5%), state government employees (70 | 8.7%), and self-employed (not incorporated) (67 | 8.3%) make up the most common classes of employment.
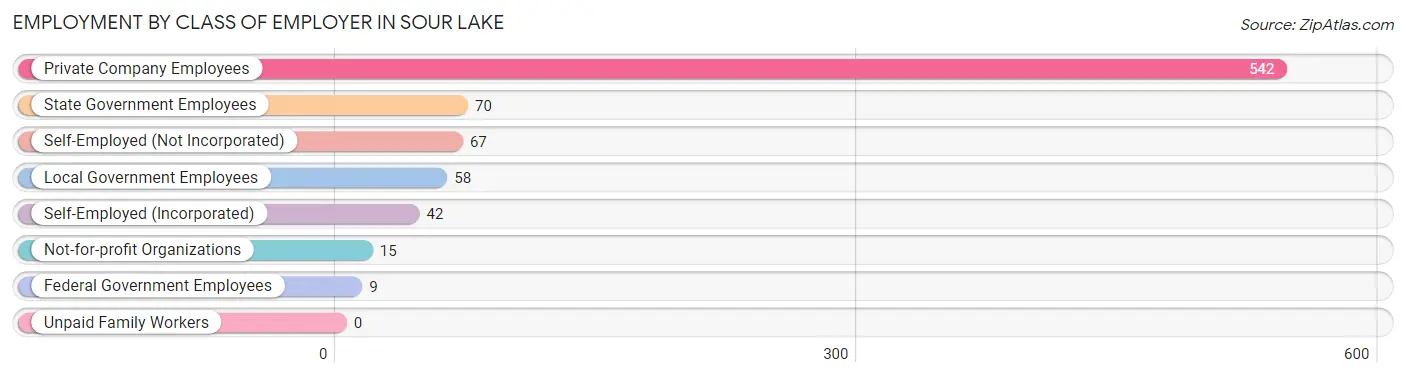
| Employer Class | # Employees | % Employees |
| Private Company Employees | 542 | 67.5% |
| Self-Employed (Incorporated) | 42 | 5.2% |
| Self-Employed (Not Incorporated) | 67 | 8.3% |
| Not-for-profit Organizations | 15 | 1.9% |
| Local Government Employees | 58 | 7.2% |
| State Government Employees | 70 | 8.7% |
| Federal Government Employees | 9 | 1.1% |
| Unpaid Family Workers | 0 | 0.0% |
| Total | 803 | 100.0% |
Employment Status by Age in Sour Lake
According to the labor force statistics for Sour Lake, out of the total population over 16 years of age (1,372), 62.9% or 863 individuals are in the labor force, with 4.9% or 42 of them unemployed. The age group with the highest labor force participation rate is 45 to 54 years, with 96.7% or 175 individuals in the labor force. Within the labor force, the 16 to 19 years age range has the highest percentage of unemployed individuals, with 26.0% or 13 of them being unemployed.
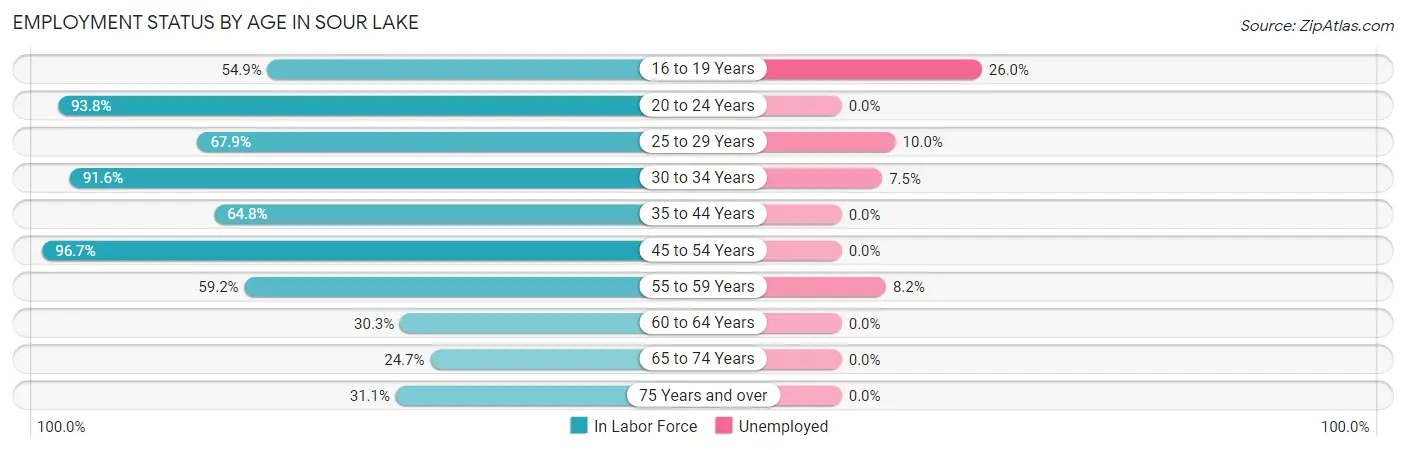
| Age Bracket | In Labor Force | Unemployed |
| 16 to 19 Years | 50 (54.9%) | 13 (26.0%) |
| 20 to 24 Years | 61 (93.8%) | 0 (0.0%) |
| 25 to 29 Years | 110 (67.9%) | 11 (10.0%) |
| 30 to 34 Years | 174 (91.6%) | 13 (7.5%) |
| 35 to 44 Years | 125 (64.8%) | 0 (0.0%) |
| 45 to 54 Years | 175 (96.7%) | 0 (0.0%) |
| 55 to 59 Years | 61 (59.2%) | 5 (8.2%) |
| 60 to 64 Years | 40 (30.3%) | 0 (0.0%) |
| 65 to 74 Years | 48 (24.7%) | 0 (0.0%) |
| 75 Years and over | 19 (31.1%) | 0 (0.0%) |
| Total | 863 (62.9%) | 42 (4.9%) |
Employment Status by Educational Attainment in Sour Lake
According to labor force statistics for Sour Lake, 71.3% of individuals (685) out of the total population between 25 and 64 years of age (961) are in the labor force, with 4.2% or 29 of them being unemployed. The group with the highest labor force participation rate are those with the educational attainment of bachelor's degree or higher, with 88.9% or 160 individuals in the labor force. Within the labor force, individuals with less than high school education have the highest percentage of unemployment, with 18.3% or 13 of them being unemployed.
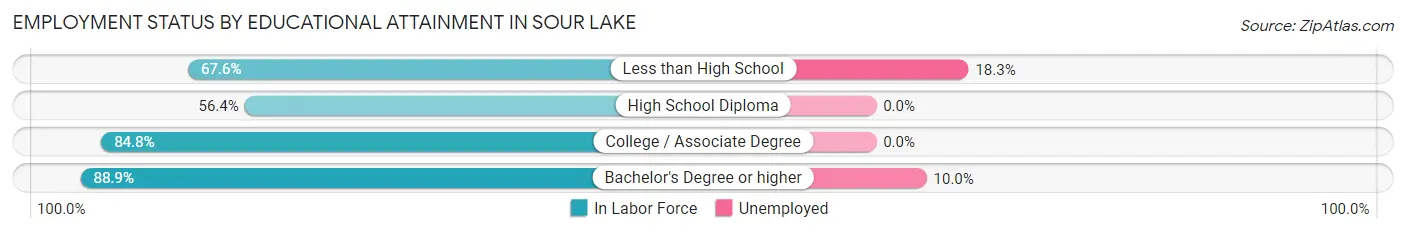
| Educational Attainment | In Labor Force | Unemployed |
| Less than High School | 71 (67.6%) | 19 (18.3%) |
| High School Diploma | 237 (56.4%) | 0 (0.0%) |
| College / Associate Degree | 217 (84.8%) | 0 (0.0%) |
| Bachelor's Degree or higher | 160 (88.9%) | 18 (10.0%) |
| Total | 685 (71.3%) | 40 (4.2%) |
Employment Occupations by Sex in Sour Lake
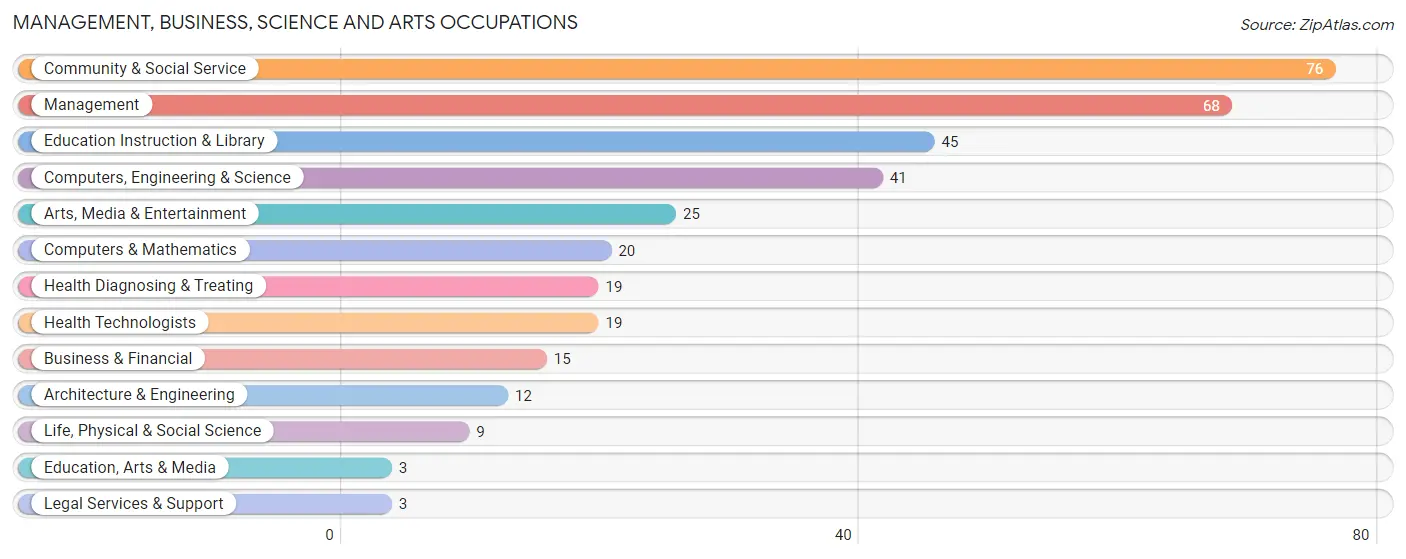
Management, Business, Science and Arts Occupations
The most common Management, Business, Science and Arts occupations in Sour Lake are Community & Social Service (76 | 9.3%), Management (68 | 8.3%), Education Instruction & Library (45 | 5.5%), Computers, Engineering & Science (41 | 5.0%), and Arts, Media & Entertainment (25 | 3.0%).
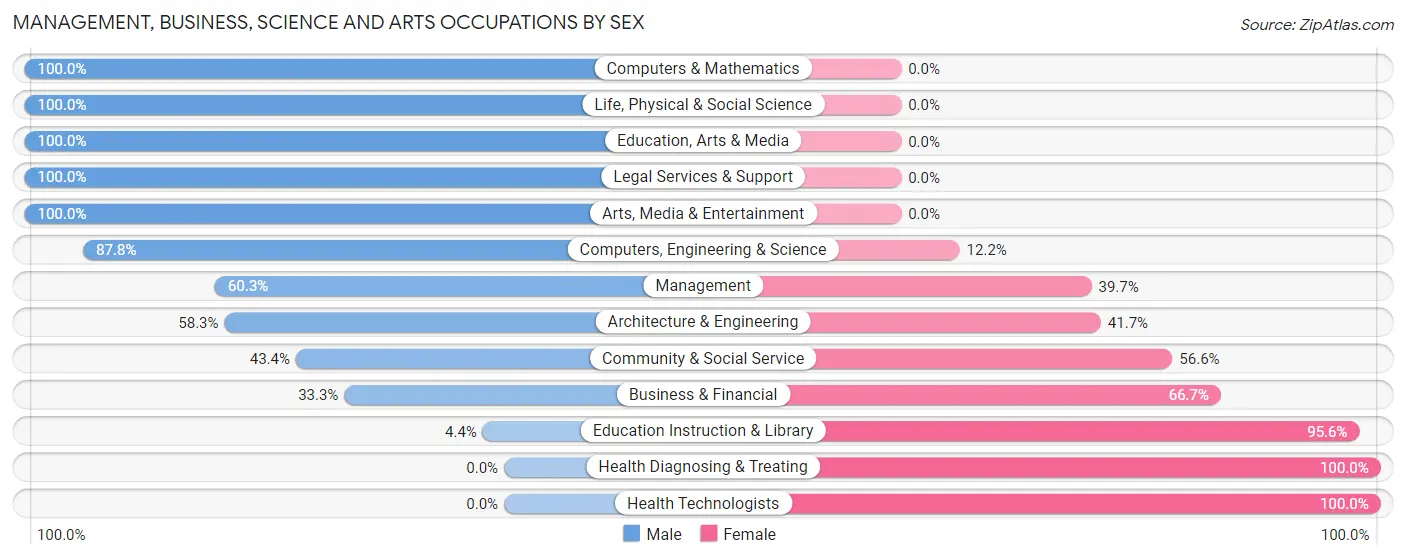
Management, Business, Science and Arts Occupations by Sex
Within the Management, Business, Science and Arts occupations in Sour Lake, the most male-oriented occupations are Computers & Mathematics (100.0%), Life, Physical & Social Science (100.0%), and Education, Arts & Media (100.0%), while the most female-oriented occupations are Health Diagnosing & Treating (100.0%), Health Technologists (100.0%), and Education Instruction & Library (95.6%).
| Occupation | Male | Female |
| Management | 41 (60.3%) | 27 (39.7%) |
| Business & Financial | 5 (33.3%) | 10 (66.7%) |
| Computers, Engineering & Science | 36 (87.8%) | 5 (12.2%) |
| Computers & Mathematics | 20 (100.0%) | 0 (0.0%) |
| Architecture & Engineering | 7 (58.3%) | 5 (41.7%) |
| Life, Physical & Social Science | 9 (100.0%) | 0 (0.0%) |
| Community & Social Service | 33 (43.4%) | 43 (56.6%) |
| Education, Arts & Media | 3 (100.0%) | 0 (0.0%) |
| Legal Services & Support | 3 (100.0%) | 0 (0.0%) |
| Education Instruction & Library | 2 (4.4%) | 43 (95.6%) |
| Arts, Media & Entertainment | 25 (100.0%) | 0 (0.0%) |
| Health Diagnosing & Treating | 0 (0.0%) | 19 (100.0%) |
| Health Technologists | 0 (0.0%) | 19 (100.0%) |
| Total (Category) | 115 (52.5%) | 104 (47.5%) |
| Total (Overall) | 440 (53.6%) | 381 (46.4%) |
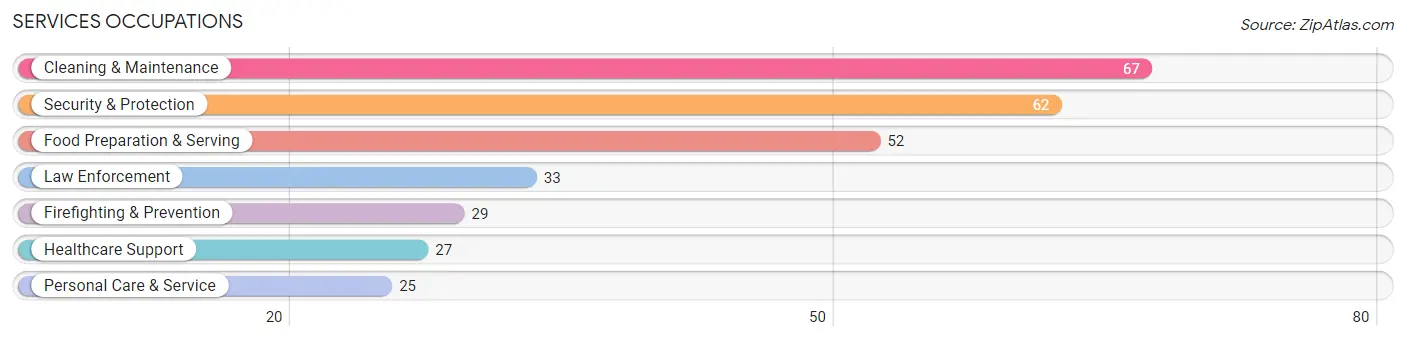
Services Occupations
The most common Services occupations in Sour Lake are Cleaning & Maintenance (67 | 8.2%), Security & Protection (62 | 7.5%), Food Preparation & Serving (52 | 6.3%), Law Enforcement (33 | 4.0%), and Firefighting & Prevention (29 | 3.5%).
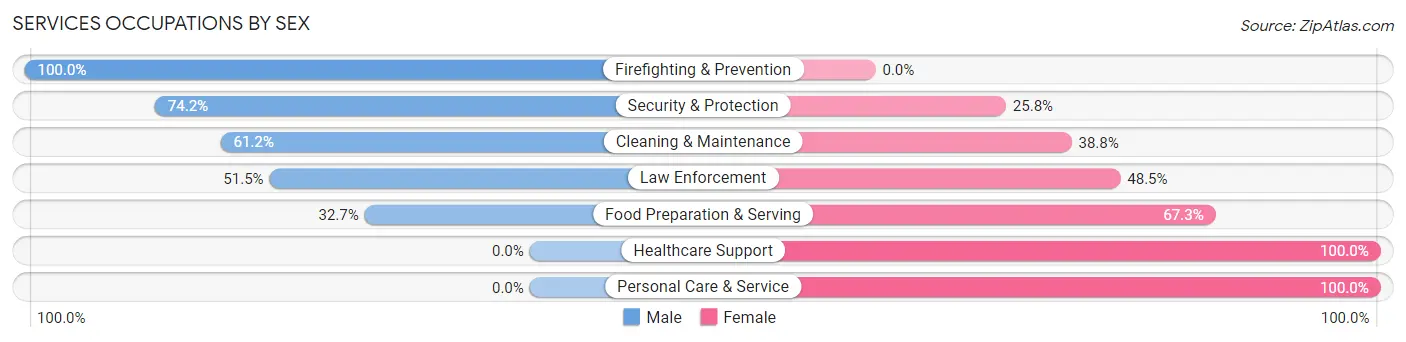
Services Occupations by Sex
Within the Services occupations in Sour Lake, the most male-oriented occupations are Firefighting & Prevention (100.0%), Security & Protection (74.2%), and Cleaning & Maintenance (61.2%), while the most female-oriented occupations are Healthcare Support (100.0%), Personal Care & Service (100.0%), and Food Preparation & Serving (67.3%).
| Occupation | Male | Female |
| Healthcare Support | 0 (0.0%) | 27 (100.0%) |
| Security & Protection | 46 (74.2%) | 16 (25.8%) |
| Firefighting & Prevention | 29 (100.0%) | 0 (0.0%) |
| Law Enforcement | 17 (51.5%) | 16 (48.5%) |
| Food Preparation & Serving | 17 (32.7%) | 35 (67.3%) |
| Cleaning & Maintenance | 41 (61.2%) | 26 (38.8%) |
| Personal Care & Service | 0 (0.0%) | 25 (100.0%) |
| Total (Category) | 104 (44.6%) | 129 (55.4%) |
| Total (Overall) | 440 (53.6%) | 381 (46.4%) |
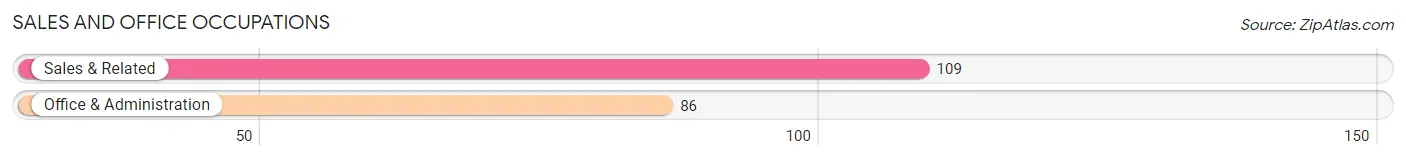
Sales and Office Occupations
The most common Sales and Office occupations in Sour Lake are Sales & Related (109 | 13.3%), and Office & Administration (86 | 10.5%).
Sales and Office Occupations by Sex
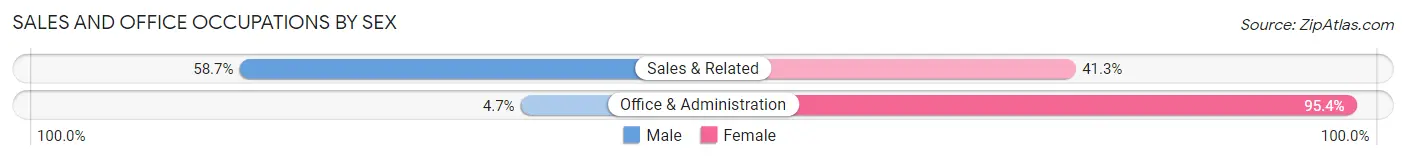
| Occupation | Male | Female |
| Sales & Related | 64 (58.7%) | 45 (41.3%) |
| Office & Administration | 4 (4.6%) | 82 (95.4%) |
| Total (Category) | 68 (34.9%) | 127 (65.1%) |
| Total (Overall) | 440 (53.6%) | 381 (46.4%) |
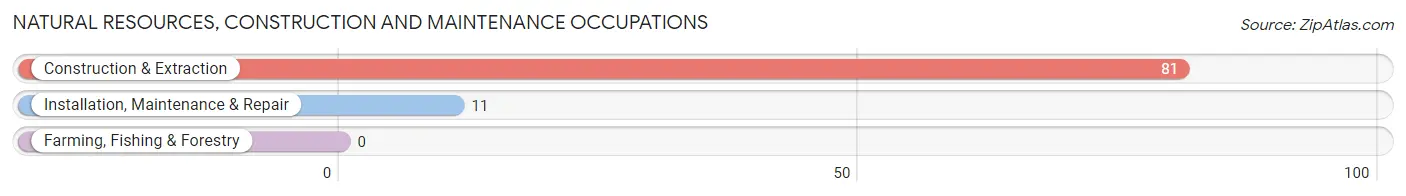
Natural Resources, Construction and Maintenance Occupations
The most common Natural Resources, Construction and Maintenance occupations in Sour Lake are Construction & Extraction (81 | 9.9%), and Installation, Maintenance & Repair (11 | 1.3%).
Natural Resources, Construction and Maintenance Occupations by Sex
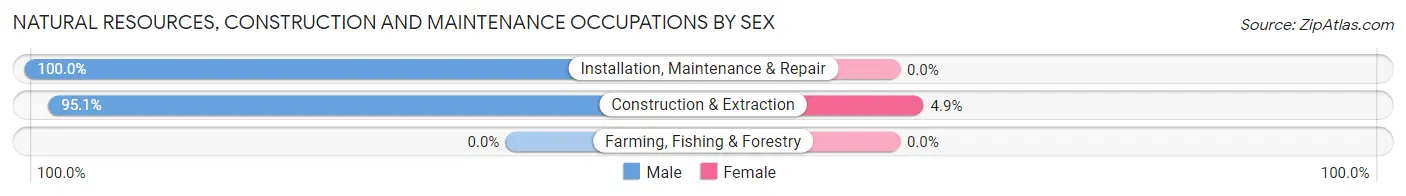
| Occupation | Male | Female |
| Farming, Fishing & Forestry | 0 (0.0%) | 0 (0.0%) |
| Construction & Extraction | 77 (95.1%) | 4 (4.9%) |
| Installation, Maintenance & Repair | 11 (100.0%) | 0 (0.0%) |
| Total (Category) | 88 (95.7%) | 4 (4.3%) |
| Total (Overall) | 440 (53.6%) | 381 (46.4%) |
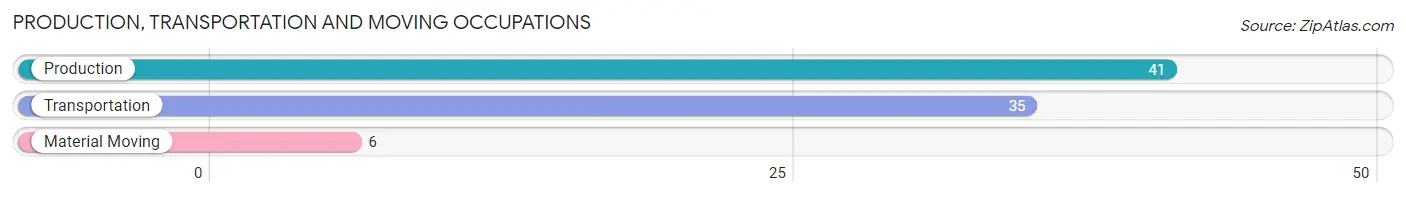
Production, Transportation and Moving Occupations
The most common Production, Transportation and Moving occupations in Sour Lake are Production (41 | 5.0%), Transportation (35 | 4.3%), and Material Moving (6 | 0.7%).
Production, Transportation and Moving Occupations by Sex
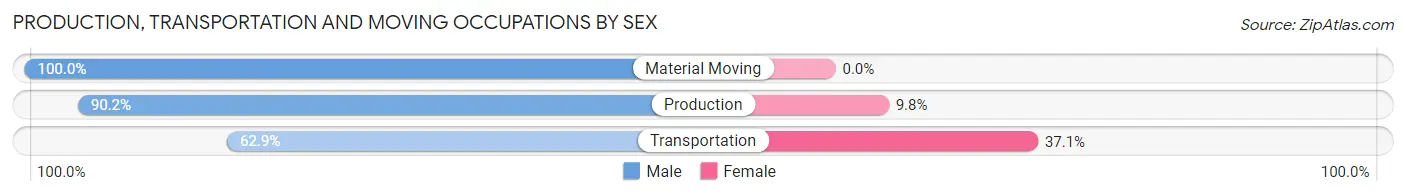
| Occupation | Male | Female |
| Production | 37 (90.2%) | 4 (9.8%) |
| Transportation | 22 (62.9%) | 13 (37.1%) |
| Material Moving | 6 (100.0%) | 0 (0.0%) |
| Total (Category) | 65 (79.3%) | 17 (20.7%) |
| Total (Overall) | 440 (53.6%) | 381 (46.4%) |
Employment Industries by Sex in Sour Lake
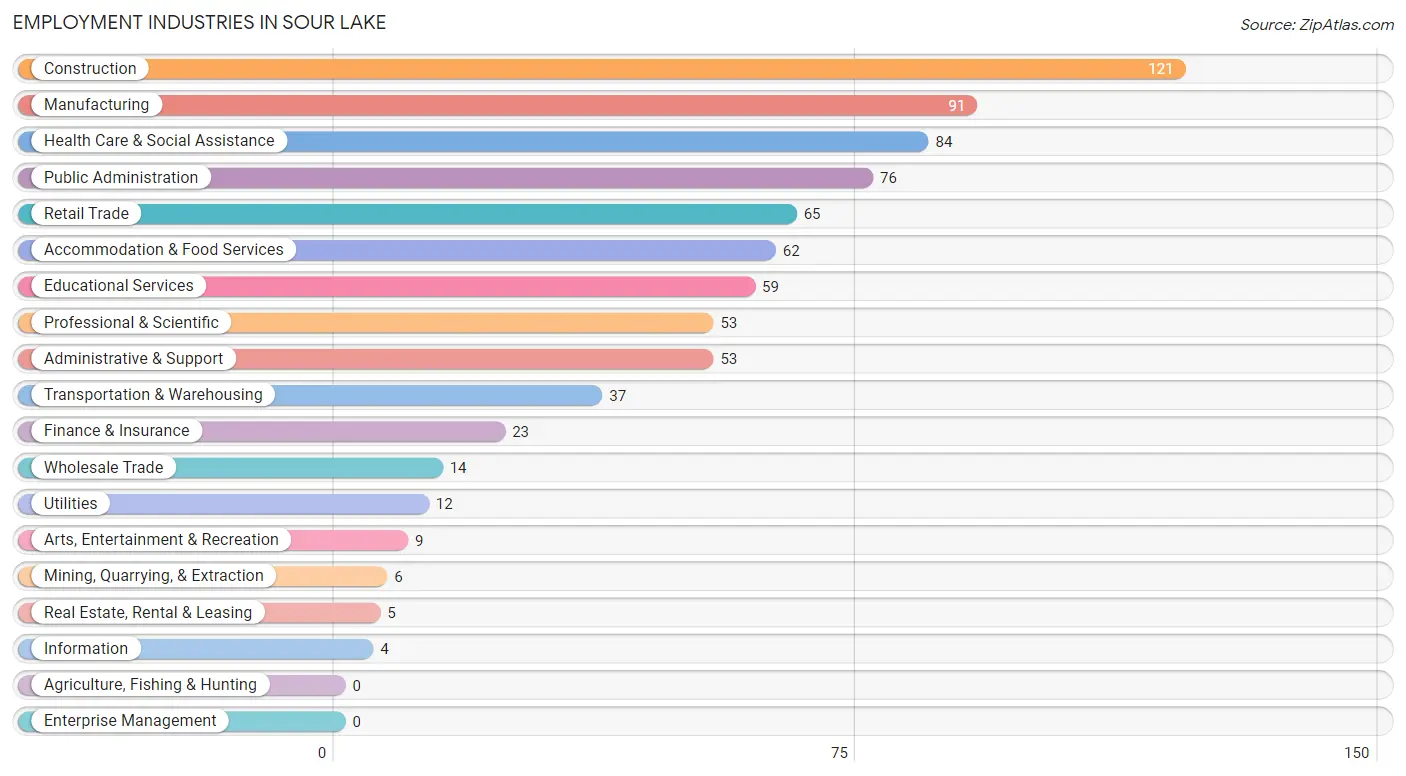
Employment Industries in Sour Lake
The major employment industries in Sour Lake include Construction (121 | 14.7%), Manufacturing (91 | 11.1%), Health Care & Social Assistance (84 | 10.2%), Public Administration (76 | 9.3%), and Retail Trade (65 | 7.9%).
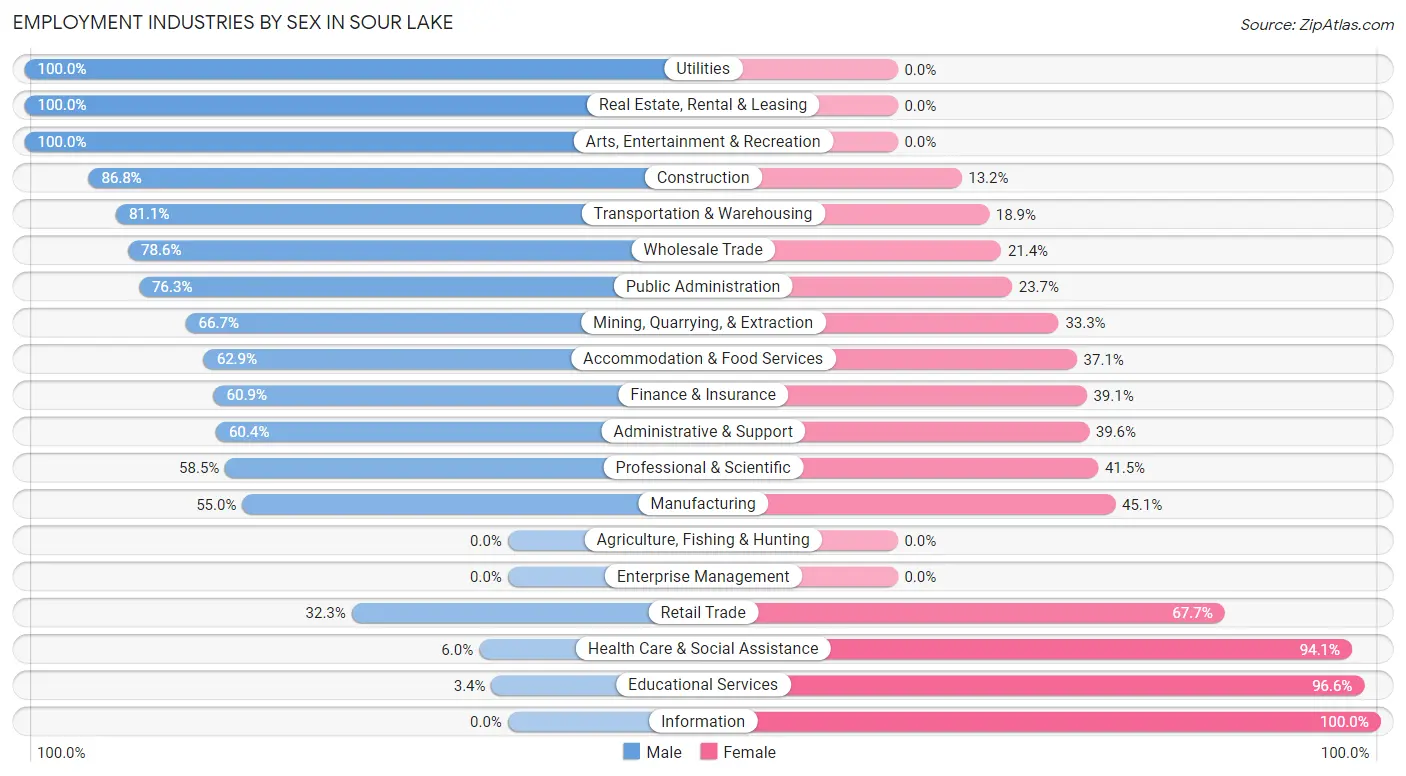
Employment Industries by Sex in Sour Lake
The Sour Lake industries that see more men than women are Utilities (100.0%), Real Estate, Rental & Leasing (100.0%), and Arts, Entertainment & Recreation (100.0%), whereas the industries that tend to have a higher number of women are Information (100.0%), Educational Services (96.6%), and Health Care & Social Assistance (94.1%).
| Industry | Male | Female |
| Agriculture, Fishing & Hunting | 0 (0.0%) | 0 (0.0%) |
| Mining, Quarrying, & Extraction | 4 (66.7%) | 2 (33.3%) |
| Construction | 105 (86.8%) | 16 (13.2%) |
| Manufacturing | 50 (54.9%) | 41 (45.1%) |
| Wholesale Trade | 11 (78.6%) | 3 (21.4%) |
| Retail Trade | 21 (32.3%) | 44 (67.7%) |
| Transportation & Warehousing | 30 (81.1%) | 7 (18.9%) |
| Utilities | 12 (100.0%) | 0 (0.0%) |
| Information | 0 (0.0%) | 4 (100.0%) |
| Finance & Insurance | 14 (60.9%) | 9 (39.1%) |
| Real Estate, Rental & Leasing | 5 (100.0%) | 0 (0.0%) |
| Professional & Scientific | 31 (58.5%) | 22 (41.5%) |
| Enterprise Management | 0 (0.0%) | 0 (0.0%) |
| Administrative & Support | 32 (60.4%) | 21 (39.6%) |
| Educational Services | 2 (3.4%) | 57 (96.6%) |
| Health Care & Social Assistance | 5 (5.9%) | 79 (94.1%) |
| Arts, Entertainment & Recreation | 9 (100.0%) | 0 (0.0%) |
| Accommodation & Food Services | 39 (62.9%) | 23 (37.1%) |
| Public Administration | 58 (76.3%) | 18 (23.7%) |
| Total | 440 (53.6%) | 381 (46.4%) |
Education in Sour Lake
School Enrollment in Sour Lake
The most common levels of schooling among the 548 students in Sour Lake are elementary school (190 | 34.7%), high school (120 | 21.9%), and nursery / preschool (80 | 14.6%).
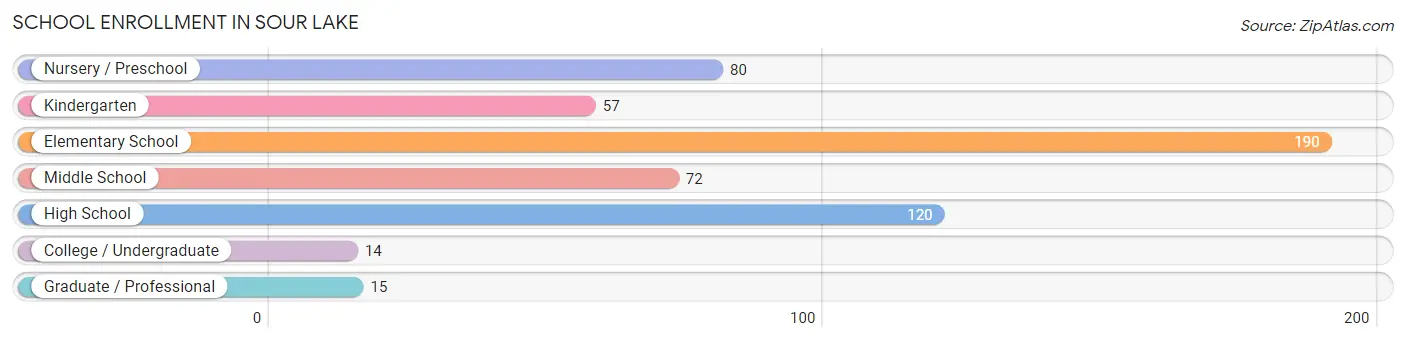
| School Level | # Students | % Students |
| Nursery / Preschool | 80 | 14.6% |
| Kindergarten | 57 | 10.4% |
| Elementary School | 190 | 34.7% |
| Middle School | 72 | 13.1% |
| High School | 120 | 21.9% |
| College / Undergraduate | 14 | 2.5% |
| Graduate / Professional | 15 | 2.7% |
| Total | 548 | 100.0% |
School Enrollment by Age by Funding Source in Sour Lake
Out of a total of 548 students who are enrolled in schools in Sour Lake, 143 (26.1%) attend a private institution, while the remaining 405 (73.9%) are enrolled in public schools. The age group of 25 to 34 year olds has the highest likelihood of being enrolled in private schools, with 6 (100.0% in the age bracket) enrolled. Conversely, the age group of 3 to 4 year olds has the lowest likelihood of being enrolled in a private school, with 12 (100.0% in the age bracket) attending a public institution.
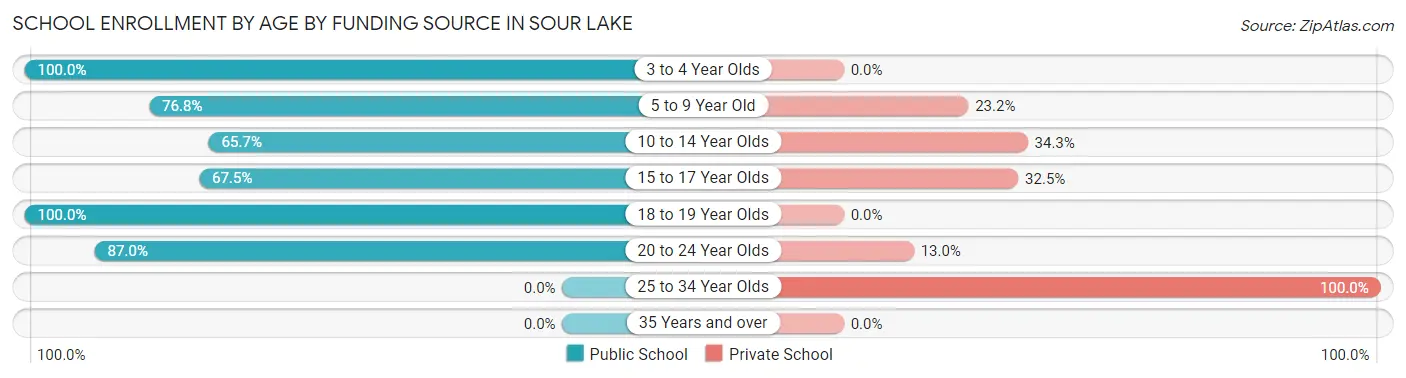
| Age Bracket | Public School | Private School |
| 3 to 4 Year Olds | 12 (100.0%) | 0 (0.0%) |
| 5 to 9 Year Old | 235 (76.8%) | 71 (23.2%) |
| 10 to 14 Year Olds | 71 (65.7%) | 37 (34.3%) |
| 15 to 17 Year Olds | 54 (67.5%) | 26 (32.5%) |
| 18 to 19 Year Olds | 13 (100.0%) | 0 (0.0%) |
| 20 to 24 Year Olds | 20 (87.0%) | 3 (13.0%) |
| 25 to 34 Year Olds | 0 (0.0%) | 6 (100.0%) |
| 35 Years and over | 0 (0.0%) | 0 (0.0%) |
| Total | 405 (73.9%) | 143 (26.1%) |
Educational Attainment by Field of Study in Sour Lake
Business (38 | 16.3%), bio, nature & agricultural (37 | 15.9%), education (37 | 15.9%), arts & humanities (32 | 13.7%), and science & technology (31 | 13.3%) are the most common fields of study among 233 individuals in Sour Lake who have obtained a bachelor's degree or higher.
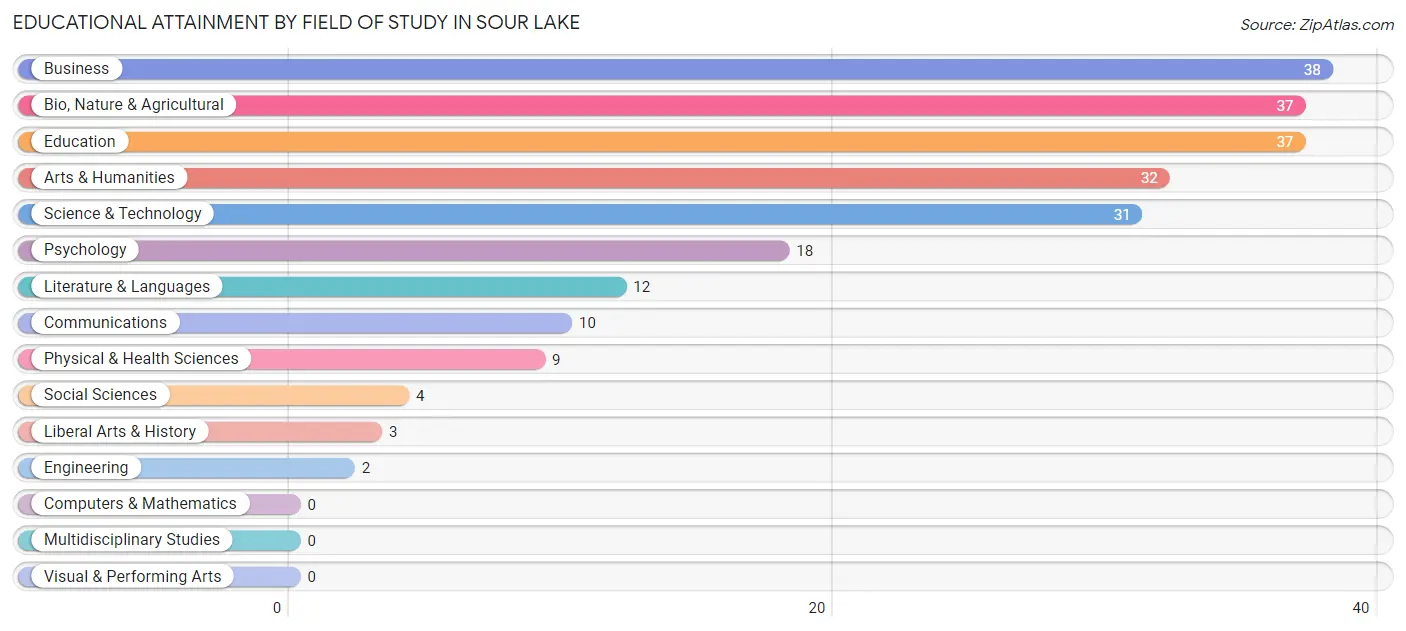
| Field of Study | # Graduates | % Graduates |
| Computers & Mathematics | 0 | 0.0% |
| Bio, Nature & Agricultural | 37 | 15.9% |
| Physical & Health Sciences | 9 | 3.9% |
| Psychology | 18 | 7.7% |
| Social Sciences | 4 | 1.7% |
| Engineering | 2 | 0.9% |
| Multidisciplinary Studies | 0 | 0.0% |
| Science & Technology | 31 | 13.3% |
| Business | 38 | 16.3% |
| Education | 37 | 15.9% |
| Literature & Languages | 12 | 5.1% |
| Liberal Arts & History | 3 | 1.3% |
| Visual & Performing Arts | 0 | 0.0% |
| Communications | 10 | 4.3% |
| Arts & Humanities | 32 | 13.7% |
| Total | 233 | 100.0% |
Transportation & Commute in Sour Lake
Vehicle Availability by Sex in Sour Lake
The most prevalent vehicle ownership categories in Sour Lake are males with 2 vehicles (244, accounting for 55.8%) and females with 2 vehicles (179, making up 66.7%).
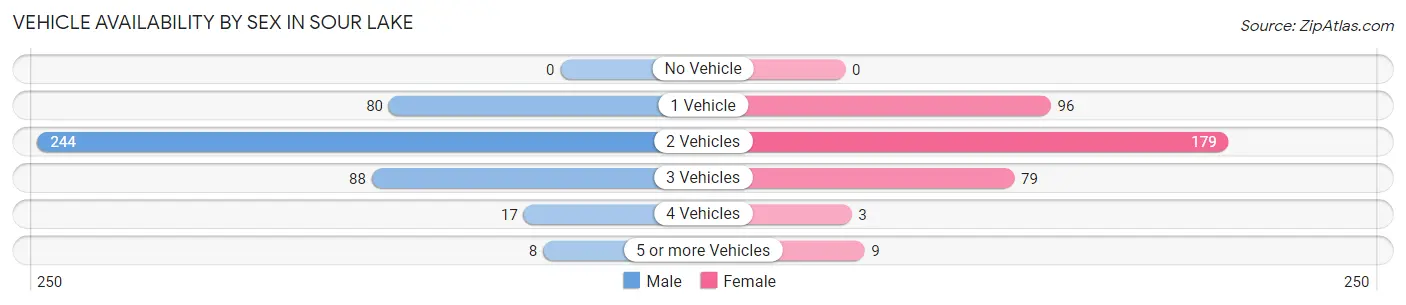
| Vehicles Available | Male | Female |
| No Vehicle | 0 (0.0%) | 0 (0.0%) |
| 1 Vehicle | 80 (18.3%) | 96 (26.2%) |
| 2 Vehicles | 244 (55.8%) | 179 (48.9%) |
| 3 Vehicles | 88 (20.1%) | 79 (21.6%) |
| 4 Vehicles | 17 (3.9%) | 3 (0.8%) |
| 5 or more Vehicles | 8 (1.8%) | 9 (2.5%) |
| Total | 437 (100.0%) | 366 (100.0%) |
Commute Time in Sour Lake
The most frequently occuring commute durations in Sour Lake are 30 to 34 minutes (117 commuters, 15.8%), 20 to 24 minutes (96 commuters, 12.9%), and 5 to 9 minutes (91 commuters, 12.2%).
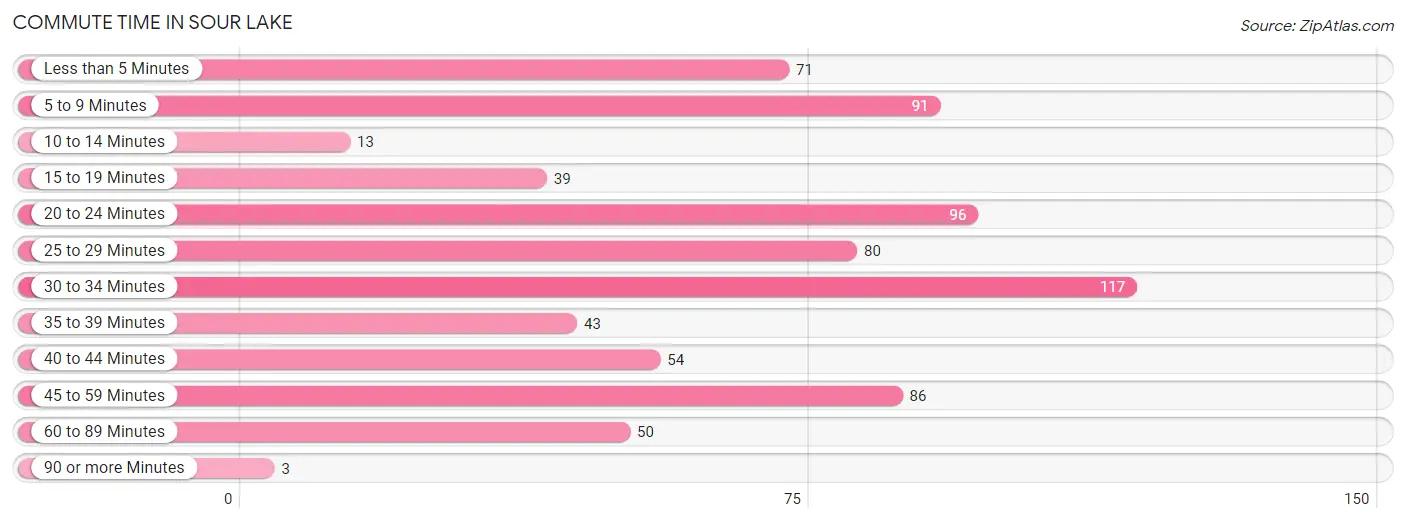
| Commute Time | # Commuters | % Commuters |
| Less than 5 Minutes | 71 | 9.6% |
| 5 to 9 Minutes | 91 | 12.2% |
| 10 to 14 Minutes | 13 | 1.8% |
| 15 to 19 Minutes | 39 | 5.2% |
| 20 to 24 Minutes | 96 | 12.9% |
| 25 to 29 Minutes | 80 | 10.8% |
| 30 to 34 Minutes | 117 | 15.8% |
| 35 to 39 Minutes | 43 | 5.8% |
| 40 to 44 Minutes | 54 | 7.3% |
| 45 to 59 Minutes | 86 | 11.6% |
| 60 to 89 Minutes | 50 | 6.7% |
| 90 or more Minutes | 3 | 0.4% |
Commute Time by Sex in Sour Lake
The most common commute times in Sour Lake are 45 to 59 minutes (83 commuters, 20.3%) for males and 30 to 34 minutes (82 commuters, 24.5%) for females.
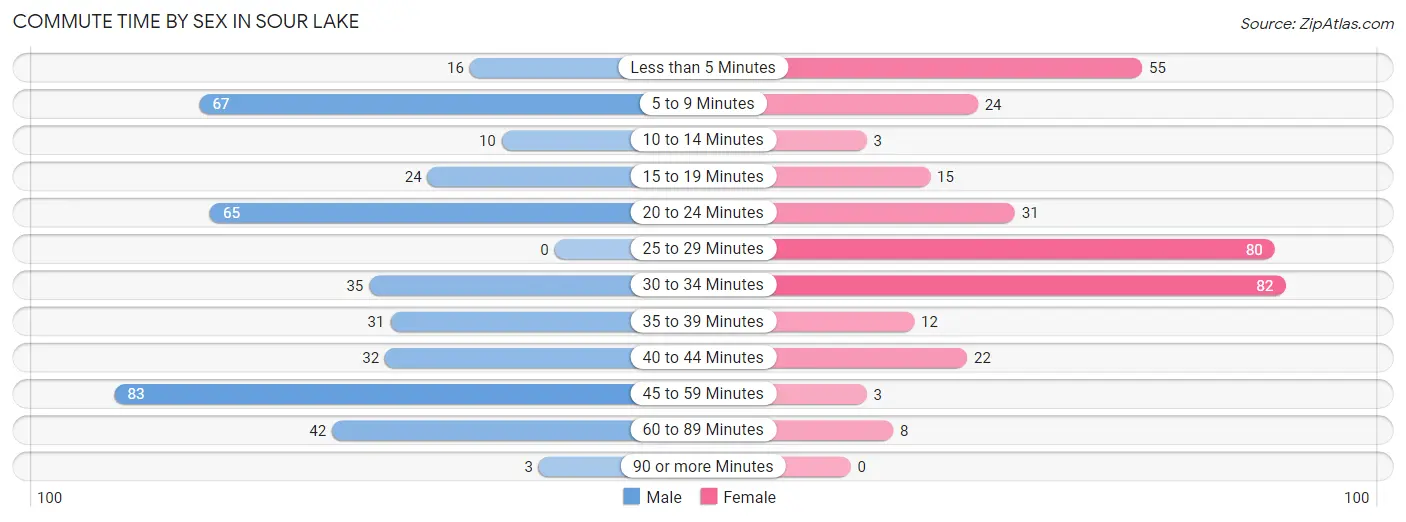
| Commute Time | Male | Female |
| Less than 5 Minutes | 16 (3.9%) | 55 (16.4%) |
| 5 to 9 Minutes | 67 (16.4%) | 24 (7.2%) |
| 10 to 14 Minutes | 10 (2.5%) | 3 (0.9%) |
| 15 to 19 Minutes | 24 (5.9%) | 15 (4.5%) |
| 20 to 24 Minutes | 65 (15.9%) | 31 (9.2%) |
| 25 to 29 Minutes | 0 (0.0%) | 80 (23.9%) |
| 30 to 34 Minutes | 35 (8.6%) | 82 (24.5%) |
| 35 to 39 Minutes | 31 (7.6%) | 12 (3.6%) |
| 40 to 44 Minutes | 32 (7.8%) | 22 (6.6%) |
| 45 to 59 Minutes | 83 (20.3%) | 3 (0.9%) |
| 60 to 89 Minutes | 42 (10.3%) | 8 (2.4%) |
| 90 or more Minutes | 3 (0.7%) | 0 (0.0%) |
Time of Departure to Work by Sex in Sour Lake
The most frequent times of departure to work in Sour Lake are 8:00 AM to 8:29 AM (90, 22.1%) for males and 7:00 AM to 7:29 AM (90, 26.9%) for females.
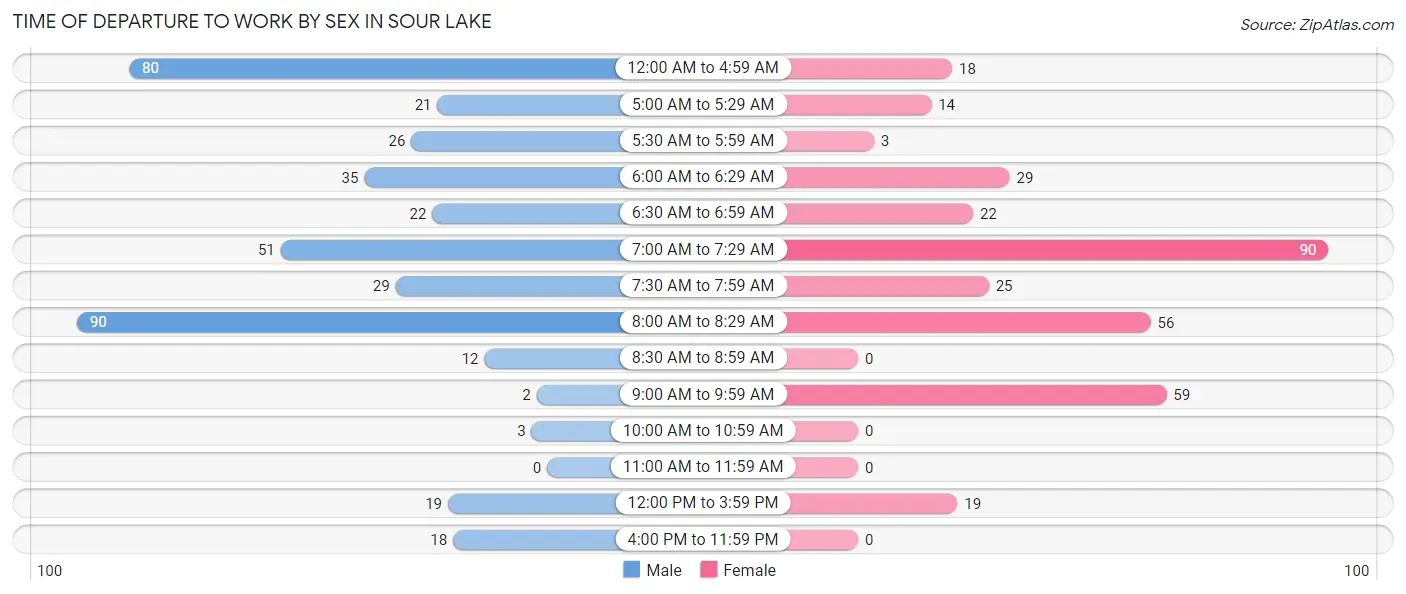
| Time of Departure | Male | Female |
| 12:00 AM to 4:59 AM | 80 (19.6%) | 18 (5.4%) |
| 5:00 AM to 5:29 AM | 21 (5.1%) | 14 (4.2%) |
| 5:30 AM to 5:59 AM | 26 (6.4%) | 3 (0.9%) |
| 6:00 AM to 6:29 AM | 35 (8.6%) | 29 (8.7%) |
| 6:30 AM to 6:59 AM | 22 (5.4%) | 22 (6.6%) |
| 7:00 AM to 7:29 AM | 51 (12.5%) | 90 (26.9%) |
| 7:30 AM to 7:59 AM | 29 (7.1%) | 25 (7.5%) |
| 8:00 AM to 8:29 AM | 90 (22.1%) | 56 (16.7%) |
| 8:30 AM to 8:59 AM | 12 (2.9%) | 0 (0.0%) |
| 9:00 AM to 9:59 AM | 2 (0.5%) | 59 (17.6%) |
| 10:00 AM to 10:59 AM | 3 (0.7%) | 0 (0.0%) |
| 11:00 AM to 11:59 AM | 0 (0.0%) | 0 (0.0%) |
| 12:00 PM to 3:59 PM | 19 (4.7%) | 19 (5.7%) |
| 4:00 PM to 11:59 PM | 18 (4.4%) | 0 (0.0%) |
| Total | 408 (100.0%) | 335 (100.0%) |
Housing Occupancy in Sour Lake
Occupancy by Ownership in Sour Lake
Of the total 691 dwellings in Sour Lake, owner-occupied units account for 471 (68.2%), while renter-occupied units make up 220 (31.8%).
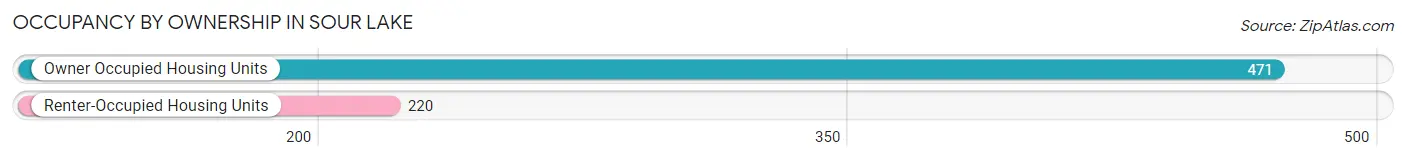
| Occupancy | # Housing Units | % Housing Units |
| Owner Occupied Housing Units | 471 | 68.2% |
| Renter-Occupied Housing Units | 220 | 31.8% |
| Total Occupied Housing Units | 691 | 100.0% |
Occupancy by Household Size in Sour Lake
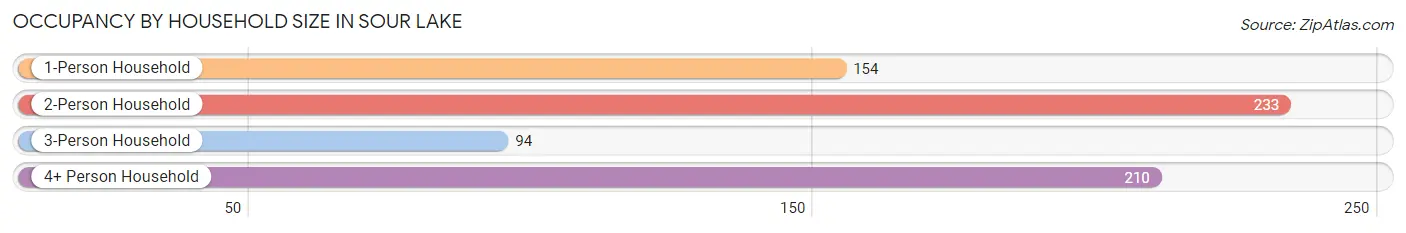
| Household Size | # Housing Units | % Housing Units |
| 1-Person Household | 154 | 22.3% |
| 2-Person Household | 233 | 33.7% |
| 3-Person Household | 94 | 13.6% |
| 4+ Person Household | 210 | 30.4% |
| Total Housing Units | 691 | 100.0% |
Occupancy by Ownership by Household Size in Sour Lake
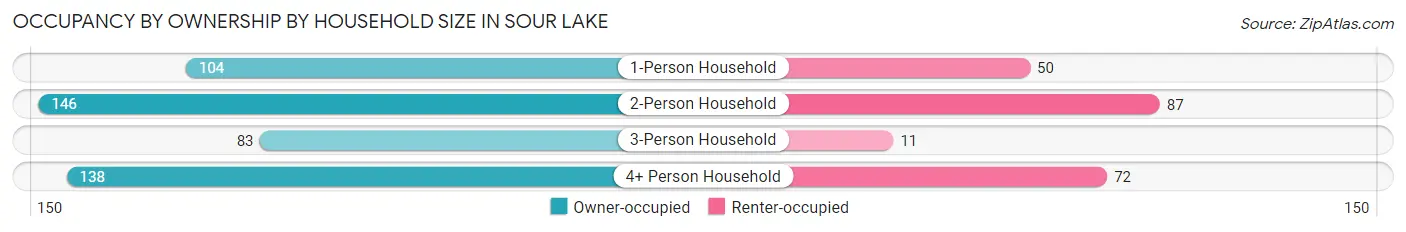
| Household Size | Owner-occupied | Renter-occupied |
| 1-Person Household | 104 (67.5%) | 50 (32.5%) |
| 2-Person Household | 146 (62.7%) | 87 (37.3%) |
| 3-Person Household | 83 (88.3%) | 11 (11.7%) |
| 4+ Person Household | 138 (65.7%) | 72 (34.3%) |
| Total Housing Units | 471 (68.2%) | 220 (31.8%) |
Occupancy by Educational Attainment in Sour Lake
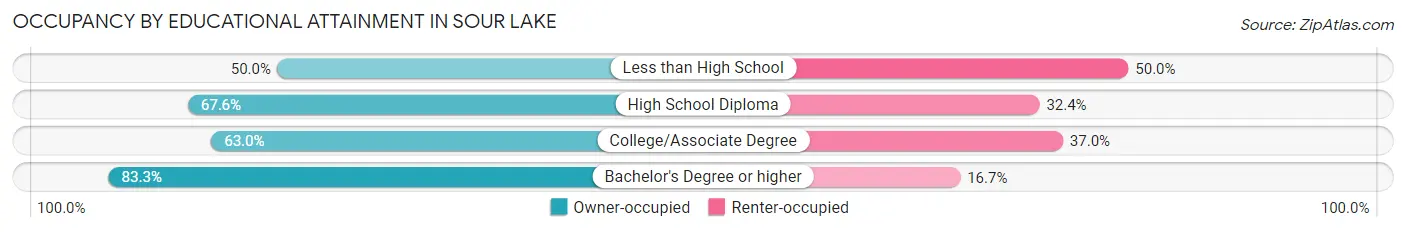
| Household Size | Owner-occupied | Renter-occupied |
| Less than High School | 37 (50.0%) | 37 (50.0%) |
| High School Diploma | 163 (67.6%) | 78 (32.4%) |
| College/Associate Degree | 131 (63.0%) | 77 (37.0%) |
| Bachelor's Degree or higher | 140 (83.3%) | 28 (16.7%) |
Occupancy by Age of Householder in Sour Lake
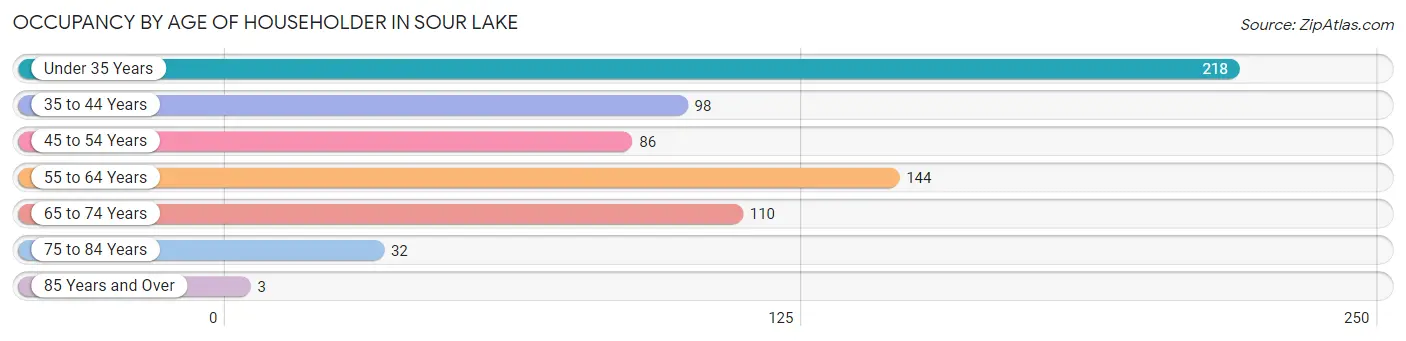
| Age Bracket | # Households | % Households |
| Under 35 Years | 218 | 31.6% |
| 35 to 44 Years | 98 | 14.2% |
| 45 to 54 Years | 86 | 12.4% |
| 55 to 64 Years | 144 | 20.8% |
| 65 to 74 Years | 110 | 15.9% |
| 75 to 84 Years | 32 | 4.6% |
| 85 Years and Over | 3 | 0.4% |
| Total | 691 | 100.0% |
Housing Finances in Sour Lake
Median Income by Occupancy in Sour Lake
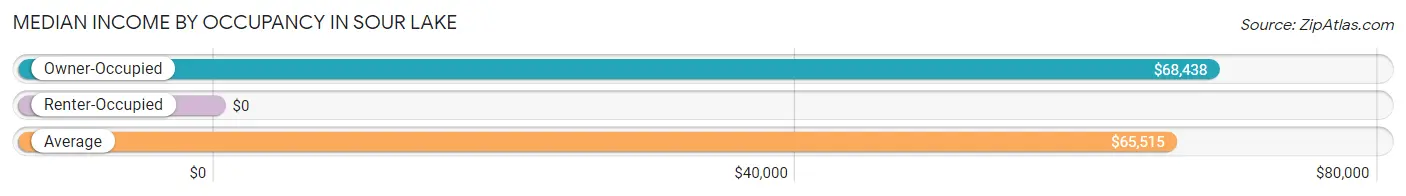
| Occupancy Type | # Households | Median Income |
| Owner-Occupied | 471 (68.2%) | $68,438 |
| Renter-Occupied | 220 (31.8%) | $0 |
| Average | 691 (100.0%) | $65,515 |
Occupancy by Householder Income Bracket in Sour Lake
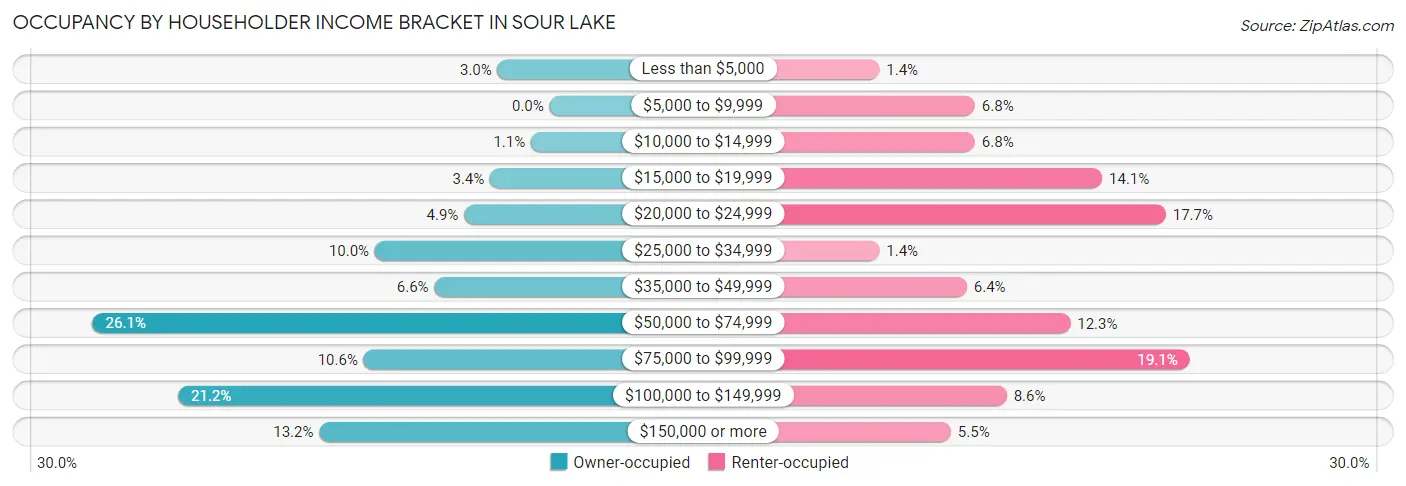
| Income Bracket | Owner-occupied | Renter-occupied |
| Less than $5,000 | 14 (3.0%) | 3 (1.4%) |
| $5,000 to $9,999 | 0 (0.0%) | 15 (6.8%) |
| $10,000 to $14,999 | 5 (1.1%) | 15 (6.8%) |
| $15,000 to $19,999 | 16 (3.4%) | 31 (14.1%) |
| $20,000 to $24,999 | 23 (4.9%) | 39 (17.7%) |
| $25,000 to $34,999 | 47 (10.0%) | 3 (1.4%) |
| $35,000 to $49,999 | 31 (6.6%) | 14 (6.4%) |
| $50,000 to $74,999 | 123 (26.1%) | 27 (12.3%) |
| $75,000 to $99,999 | 50 (10.6%) | 42 (19.1%) |
| $100,000 to $149,999 | 100 (21.2%) | 19 (8.6%) |
| $150,000 or more | 62 (13.2%) | 12 (5.4%) |
| Total | 471 (100.0%) | 220 (100.0%) |
Monthly Housing Cost Tiers in Sour Lake
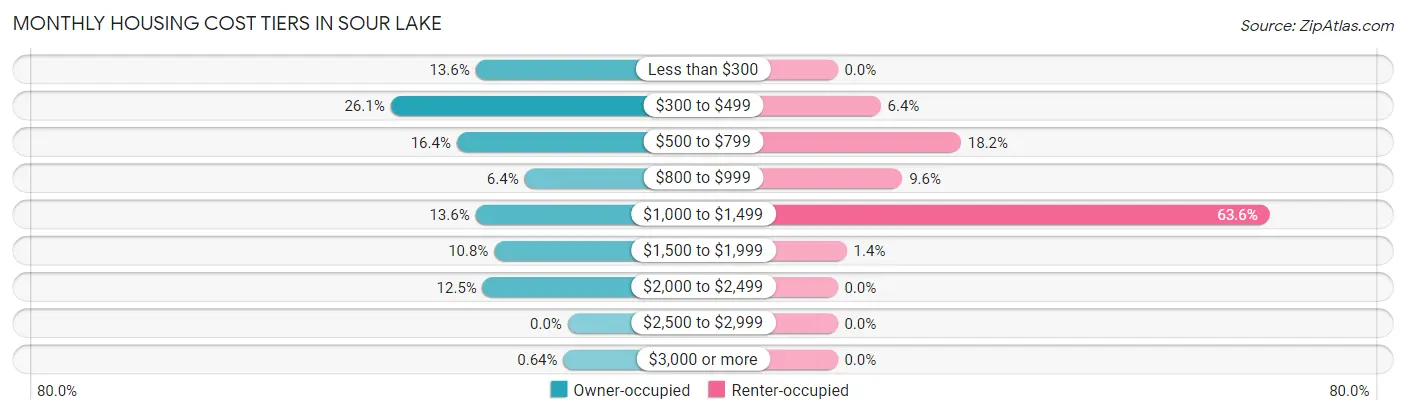
| Monthly Cost | Owner-occupied | Renter-occupied |
| Less than $300 | 64 (13.6%) | 0 (0.0%) |
| $300 to $499 | 123 (26.1%) | 14 (6.4%) |
| $500 to $799 | 77 (16.4%) | 40 (18.2%) |
| $800 to $999 | 30 (6.4%) | 21 (9.6%) |
| $1,000 to $1,499 | 64 (13.6%) | 140 (63.6%) |
| $1,500 to $1,999 | 51 (10.8%) | 3 (1.4%) |
| $2,000 to $2,499 | 59 (12.5%) | 0 (0.0%) |
| $2,500 to $2,999 | 0 (0.0%) | 0 (0.0%) |
| $3,000 or more | 3 (0.6%) | 0 (0.0%) |
| Total | 471 (100.0%) | 220 (100.0%) |
Physical Housing Characteristics in Sour Lake
Housing Structures in Sour Lake
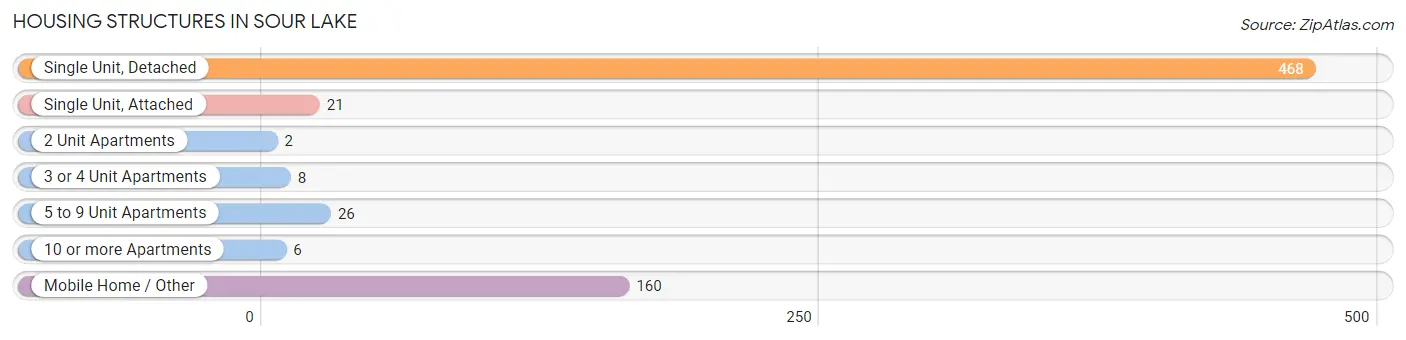
| Structure Type | # Housing Units | % Housing Units |
| Single Unit, Detached | 468 | 67.7% |
| Single Unit, Attached | 21 | 3.0% |
| 2 Unit Apartments | 2 | 0.3% |
| 3 or 4 Unit Apartments | 8 | 1.2% |
| 5 to 9 Unit Apartments | 26 | 3.8% |
| 10 or more Apartments | 6 | 0.9% |
| Mobile Home / Other | 160 | 23.2% |
| Total | 691 | 100.0% |
Housing Structures by Occupancy in Sour Lake
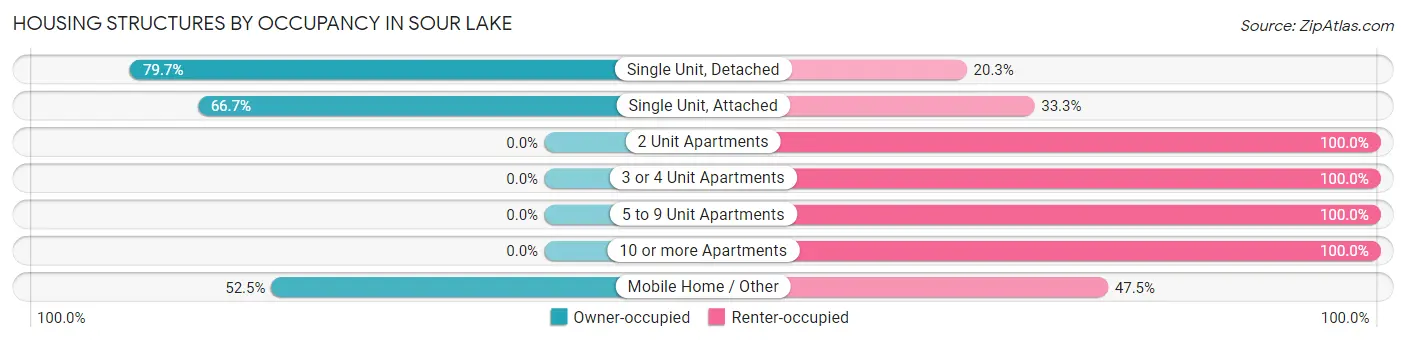
| Structure Type | Owner-occupied | Renter-occupied |
| Single Unit, Detached | 373 (79.7%) | 95 (20.3%) |
| Single Unit, Attached | 14 (66.7%) | 7 (33.3%) |
| 2 Unit Apartments | 0 (0.0%) | 2 (100.0%) |
| 3 or 4 Unit Apartments | 0 (0.0%) | 8 (100.0%) |
| 5 to 9 Unit Apartments | 0 (0.0%) | 26 (100.0%) |
| 10 or more Apartments | 0 (0.0%) | 6 (100.0%) |
| Mobile Home / Other | 84 (52.5%) | 76 (47.5%) |
| Total | 471 (68.2%) | 220 (31.8%) |
Housing Structures by Number of Rooms in Sour Lake
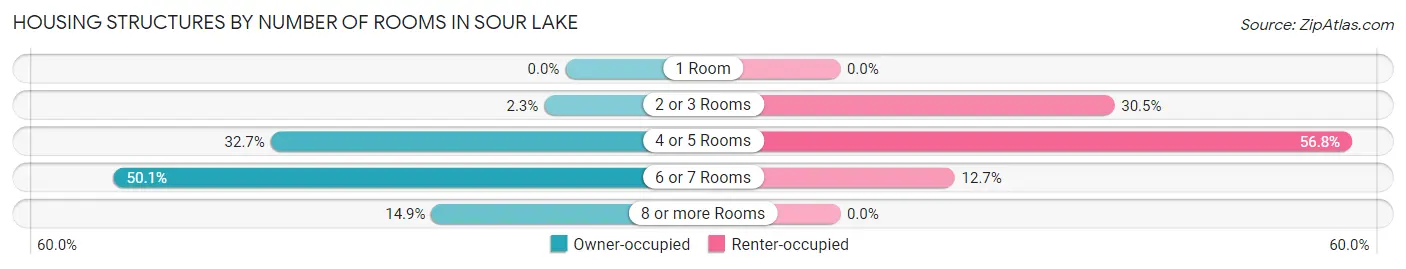
| Number of Rooms | Owner-occupied | Renter-occupied |
| 1 Room | 0 (0.0%) | 0 (0.0%) |
| 2 or 3 Rooms | 11 (2.3%) | 67 (30.4%) |
| 4 or 5 Rooms | 154 (32.7%) | 125 (56.8%) |
| 6 or 7 Rooms | 236 (50.1%) | 28 (12.7%) |
| 8 or more Rooms | 70 (14.9%) | 0 (0.0%) |
| Total | 471 (100.0%) | 220 (100.0%) |
Housing Structure by Heating Type in Sour Lake
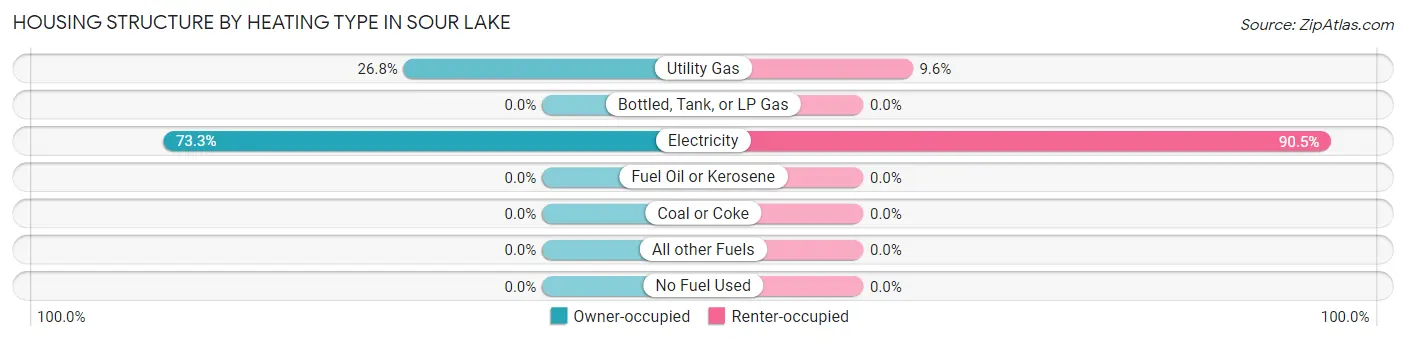
| Heating Type | Owner-occupied | Renter-occupied |
| Utility Gas | 126 (26.8%) | 21 (9.6%) |
| Bottled, Tank, or LP Gas | 0 (0.0%) | 0 (0.0%) |
| Electricity | 345 (73.3%) | 199 (90.4%) |
| Fuel Oil or Kerosene | 0 (0.0%) | 0 (0.0%) |
| Coal or Coke | 0 (0.0%) | 0 (0.0%) |
| All other Fuels | 0 (0.0%) | 0 (0.0%) |
| No Fuel Used | 0 (0.0%) | 0 (0.0%) |
| Total | 471 (100.0%) | 220 (100.0%) |
Household Vehicle Usage in Sour Lake
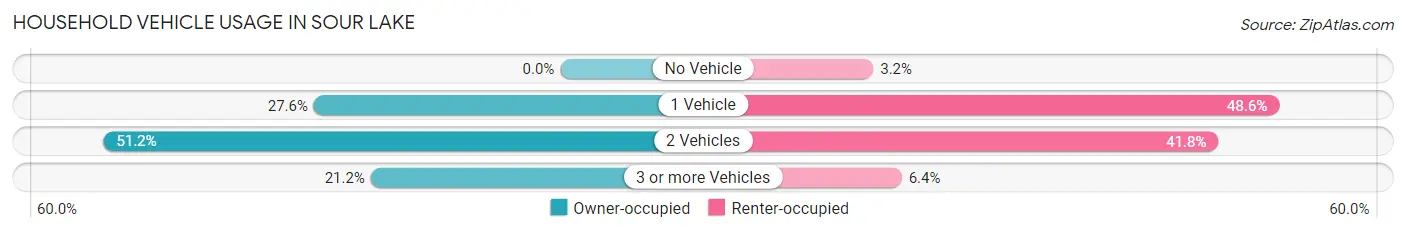
| Vehicles per Household | Owner-occupied | Renter-occupied |
| No Vehicle | 0 (0.0%) | 7 (3.2%) |
| 1 Vehicle | 130 (27.6%) | 107 (48.6%) |
| 2 Vehicles | 241 (51.2%) | 92 (41.8%) |
| 3 or more Vehicles | 100 (21.2%) | 14 (6.4%) |
| Total | 471 (100.0%) | 220 (100.0%) |
Real Estate & Mortgages in Sour Lake
Real Estate and Mortgage Overview in Sour Lake
| Characteristic | Without Mortgage | With Mortgage |
| Housing Units | 285 | 186 |
| Median Property Value | $86,900 | $179,300 |
| Median Household Income | $56,359 | $44 |
| Monthly Housing Costs | $443 | $3 |
| Real Estate Taxes | $918 | $4 |
Property Value by Mortgage Status in Sour Lake
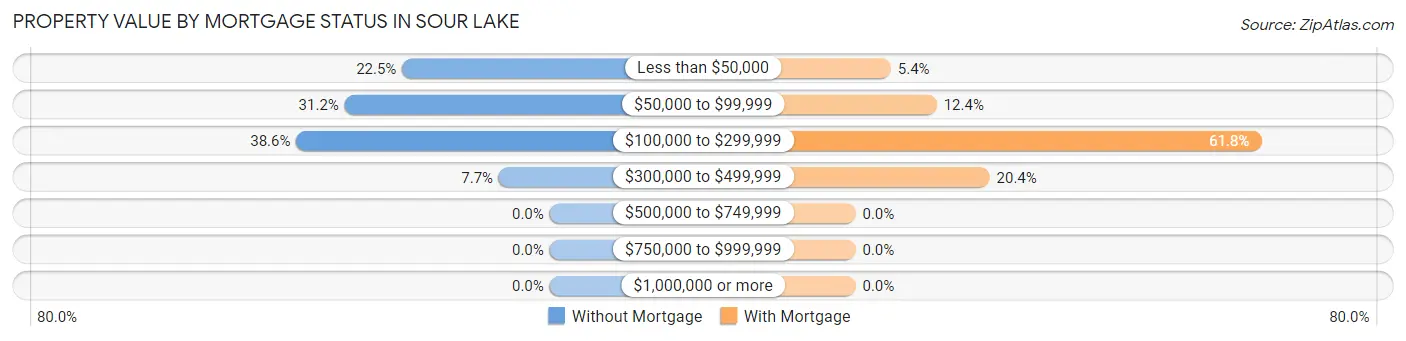
| Property Value | Without Mortgage | With Mortgage |
| Less than $50,000 | 64 (22.5%) | 10 (5.4%) |
| $50,000 to $99,999 | 89 (31.2%) | 23 (12.4%) |
| $100,000 to $299,999 | 110 (38.6%) | 115 (61.8%) |
| $300,000 to $499,999 | 22 (7.7%) | 38 (20.4%) |
| $500,000 to $749,999 | 0 (0.0%) | 0 (0.0%) |
| $750,000 to $999,999 | 0 (0.0%) | 0 (0.0%) |
| $1,000,000 or more | 0 (0.0%) | 0 (0.0%) |
| Total | 285 (100.0%) | 186 (100.0%) |
Household Income by Mortgage Status in Sour Lake
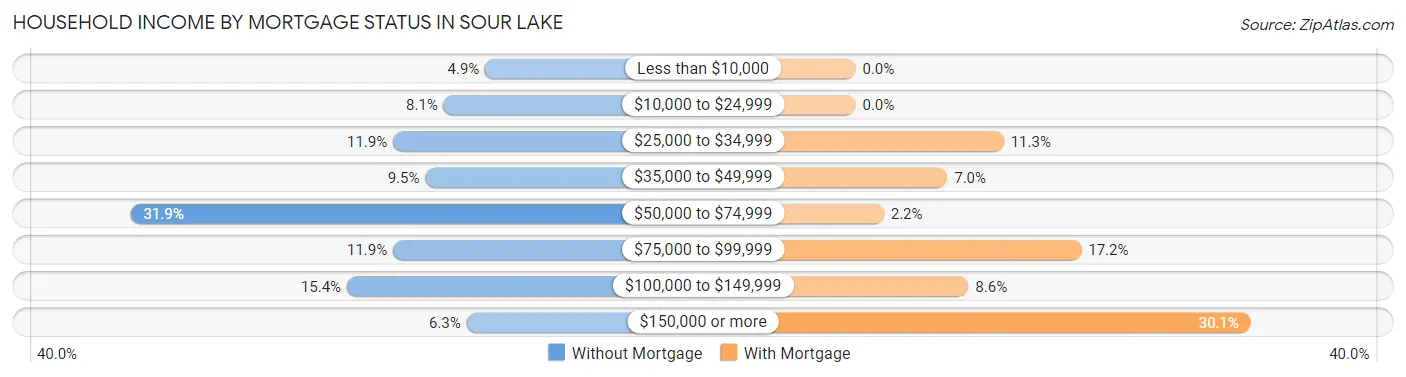
| Household Income | Without Mortgage | With Mortgage |
| Less than $10,000 | 14 (4.9%) | 0 (0.0%) |
| $10,000 to $24,999 | 23 (8.1%) | 0 (0.0%) |
| $25,000 to $34,999 | 34 (11.9%) | 21 (11.3%) |
| $35,000 to $49,999 | 27 (9.5%) | 13 (7.0%) |
| $50,000 to $74,999 | 91 (31.9%) | 4 (2.1%) |
| $75,000 to $99,999 | 34 (11.9%) | 32 (17.2%) |
| $100,000 to $149,999 | 44 (15.4%) | 16 (8.6%) |
| $150,000 or more | 18 (6.3%) | 56 (30.1%) |
| Total | 285 (100.0%) | 186 (100.0%) |
Property Value to Household Income Ratio in Sour Lake
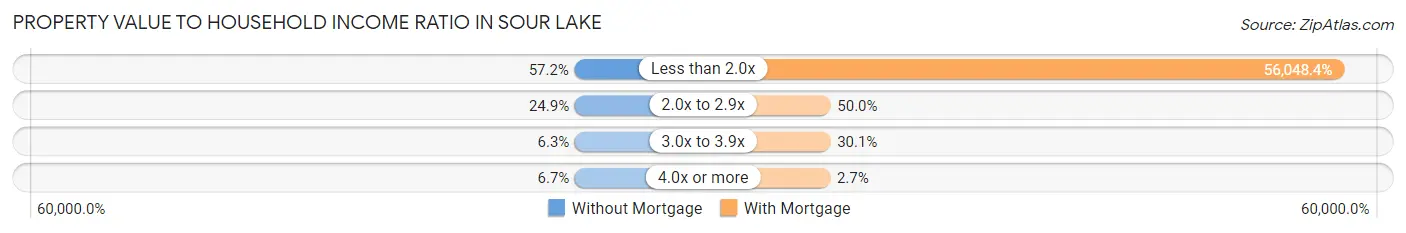
| Value-to-Income Ratio | Without Mortgage | With Mortgage |
| Less than 2.0x | 163 (57.2%) | 104,250 (56,048.4%) |
| 2.0x to 2.9x | 71 (24.9%) | 93 (50.0%) |
| 3.0x to 3.9x | 18 (6.3%) | 56 (30.1%) |
| 4.0x or more | 19 (6.7%) | 5 (2.7%) |
| Total | 285 (100.0%) | 186 (100.0%) |
Real Estate Taxes by Mortgage Status in Sour Lake
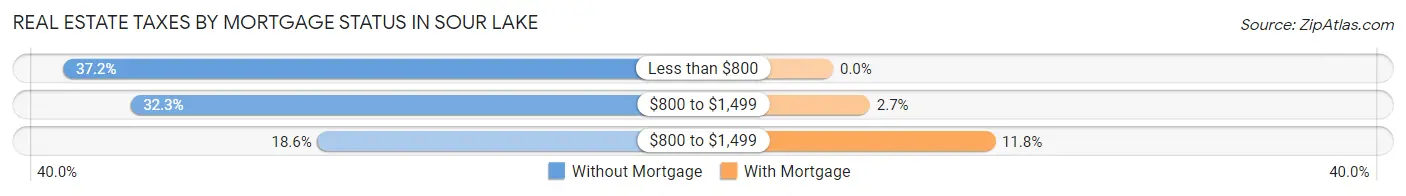
| Property Taxes | Without Mortgage | With Mortgage |
| Less than $800 | 106 (37.2%) | 0 (0.0%) |
| $800 to $1,499 | 92 (32.3%) | 5 (2.7%) |
| $800 to $1,499 | 53 (18.6%) | 22 (11.8%) |
| Total | 285 (100.0%) | 186 (100.0%) |
Health & Disability in Sour Lake
Health Insurance Coverage by Age in Sour Lake
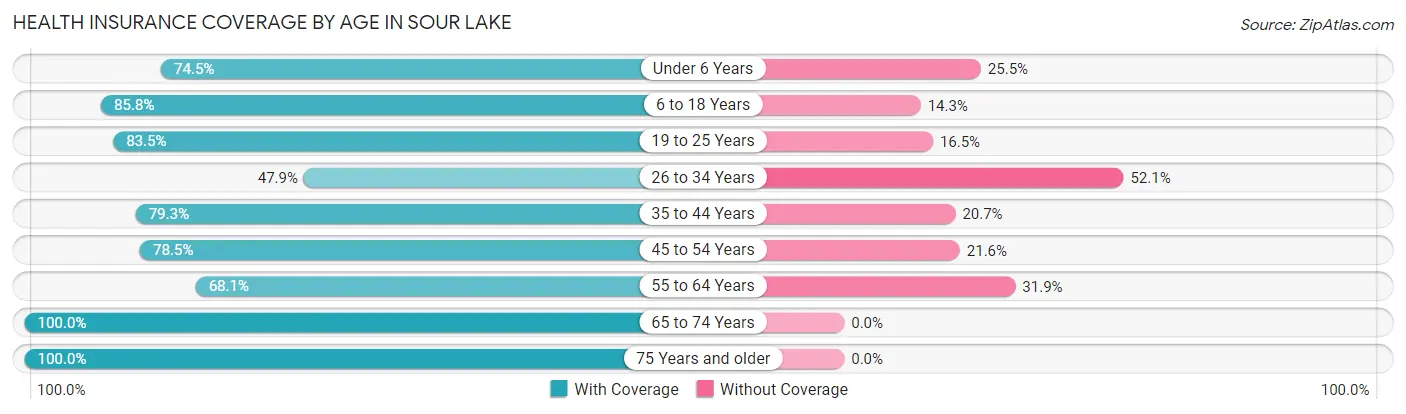
| Age Bracket | With Coverage | Without Coverage |
| Under 6 Years | 275 (74.5%) | 94 (25.5%) |
| 6 to 18 Years | 355 (85.8%) | 59 (14.2%) |
| 19 to 25 Years | 101 (83.5%) | 20 (16.5%) |
| 26 to 34 Years | 151 (47.9%) | 164 (52.1%) |
| 35 to 44 Years | 153 (79.3%) | 40 (20.7%) |
| 45 to 54 Years | 142 (78.4%) | 39 (21.5%) |
| 55 to 64 Years | 160 (68.1%) | 75 (31.9%) |
| 65 to 74 Years | 194 (100.0%) | 0 (0.0%) |
| 75 Years and older | 61 (100.0%) | 0 (0.0%) |
| Total | 1,592 (76.4%) | 491 (23.6%) |
Health Insurance Coverage by Citizenship Status in Sour Lake
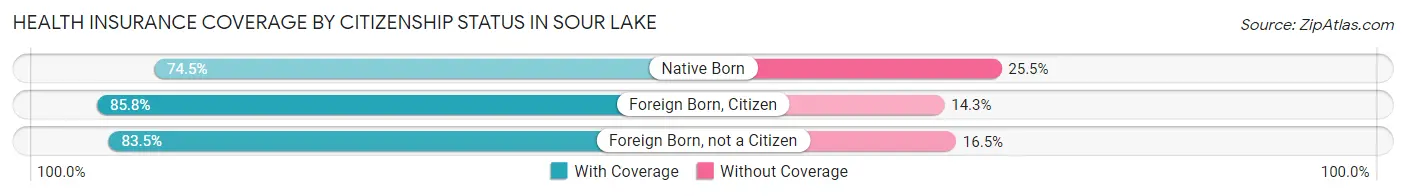
| Citizenship Status | With Coverage | Without Coverage |
| Native Born | 275 (74.5%) | 94 (25.5%) |
| Foreign Born, Citizen | 355 (85.8%) | 59 (14.2%) |
| Foreign Born, not a Citizen | 101 (83.5%) | 20 (16.5%) |
Health Insurance Coverage by Household Income in Sour Lake
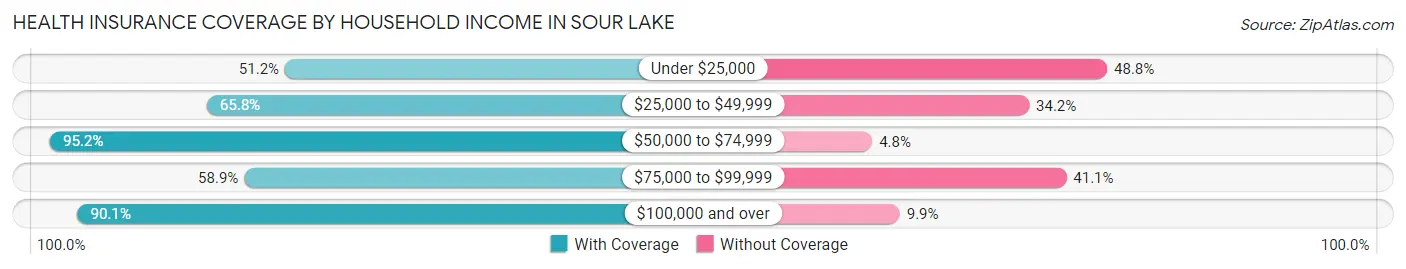
| Household Income | With Coverage | Without Coverage |
| Under $25,000 | 167 (51.2%) | 159 (48.8%) |
| $25,000 to $49,999 | 160 (65.8%) | 83 (34.2%) |
| $50,000 to $74,999 | 419 (95.2%) | 21 (4.8%) |
| $75,000 to $99,999 | 229 (58.9%) | 160 (41.1%) |
| $100,000 and over | 617 (90.1%) | 68 (9.9%) |
Public vs Private Health Insurance Coverage by Age in Sour Lake
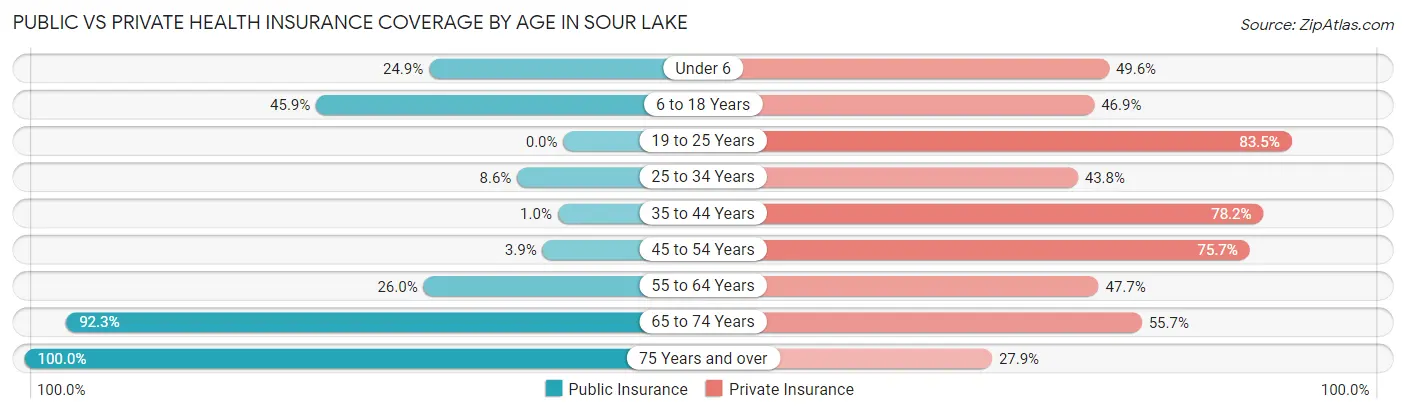
| Age Bracket | Public Insurance | Private Insurance |
| Under 6 | 92 (24.9%) | 183 (49.6%) |
| 6 to 18 Years | 190 (45.9%) | 194 (46.9%) |
| 19 to 25 Years | 0 (0.0%) | 101 (83.5%) |
| 25 to 34 Years | 27 (8.6%) | 138 (43.8%) |
| 35 to 44 Years | 2 (1.0%) | 151 (78.2%) |
| 45 to 54 Years | 7 (3.9%) | 137 (75.7%) |
| 55 to 64 Years | 61 (26.0%) | 112 (47.7%) |
| 65 to 74 Years | 179 (92.3%) | 108 (55.7%) |
| 75 Years and over | 61 (100.0%) | 17 (27.9%) |
| Total | 619 (29.7%) | 1,141 (54.8%) |
Disability Status by Sex by Age in Sour Lake
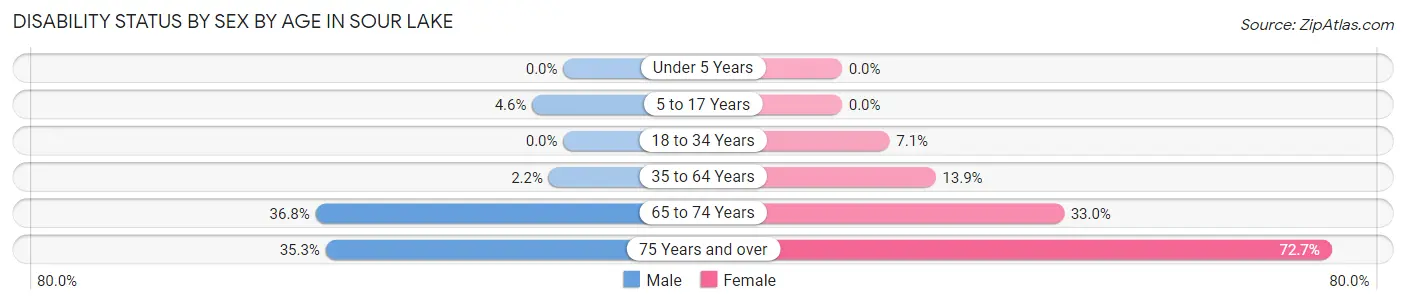
| Age Bracket | Male | Female |
| Under 5 Years | 0 (0.0%) | 0 (0.0%) |
| 5 to 17 Years | 14 (4.6%) | 0 (0.0%) |
| 18 to 34 Years | 0 (0.0%) | 18 (7.1%) |
| 35 to 64 Years | 6 (2.2%) | 46 (13.9%) |
| 65 to 74 Years | 39 (36.8%) | 29 (33.0%) |
| 75 Years and over | 6 (35.3%) | 32 (72.7%) |
Disability Class by Sex by Age in Sour Lake
Disability Class: Hearing Difficulty
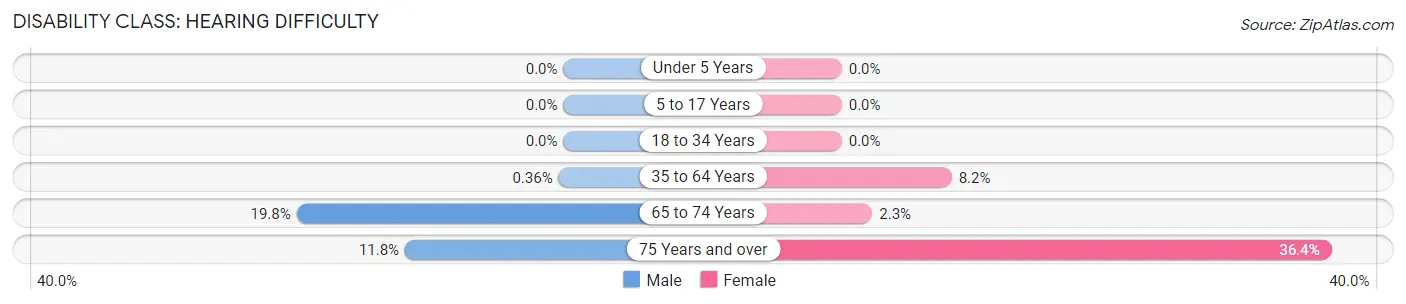
| Age Bracket | Male | Female |
| Under 5 Years | 0 (0.0%) | 0 (0.0%) |
| 5 to 17 Years | 0 (0.0%) | 0 (0.0%) |
| 18 to 34 Years | 0 (0.0%) | 0 (0.0%) |
| 35 to 64 Years | 1 (0.4%) | 27 (8.2%) |
| 65 to 74 Years | 21 (19.8%) | 2 (2.3%) |
| 75 Years and over | 2 (11.8%) | 16 (36.4%) |
Disability Class: Vision Difficulty
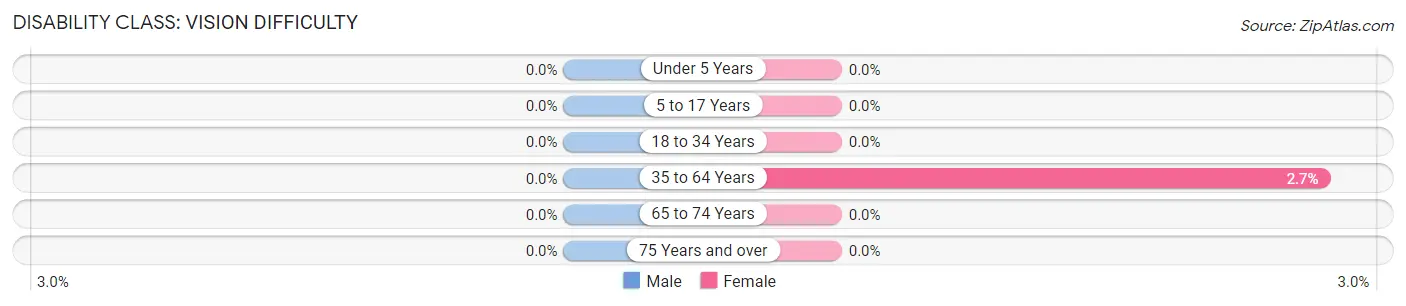
| Age Bracket | Male | Female |
| Under 5 Years | 0 (0.0%) | 0 (0.0%) |
| 5 to 17 Years | 0 (0.0%) | 0 (0.0%) |
| 18 to 34 Years | 0 (0.0%) | 0 (0.0%) |
| 35 to 64 Years | 0 (0.0%) | 9 (2.7%) |
| 65 to 74 Years | 0 (0.0%) | 0 (0.0%) |
| 75 Years and over | 0 (0.0%) | 0 (0.0%) |
Disability Class: Cognitive Difficulty
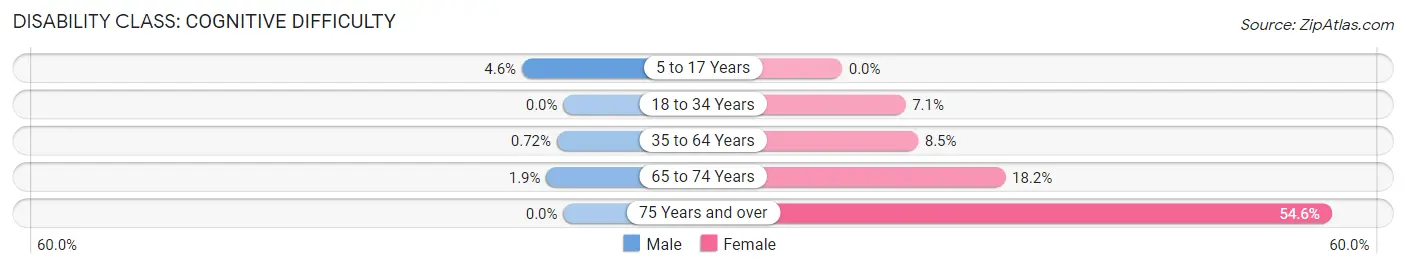
| Age Bracket | Male | Female |
| 5 to 17 Years | 14 (4.6%) | 0 (0.0%) |
| 18 to 34 Years | 0 (0.0%) | 18 (7.1%) |
| 35 to 64 Years | 2 (0.7%) | 28 (8.5%) |
| 65 to 74 Years | 2 (1.9%) | 16 (18.2%) |
| 75 Years and over | 0 (0.0%) | 24 (54.5%) |
Disability Class: Ambulatory Difficulty
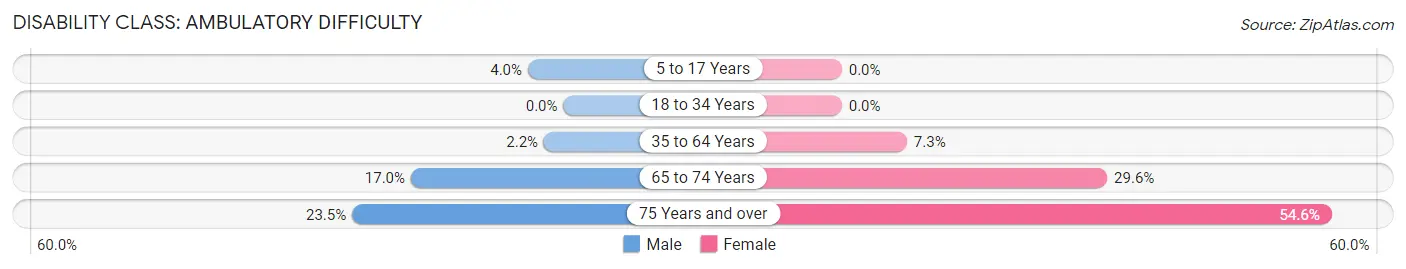
| Age Bracket | Male | Female |
| 5 to 17 Years | 12 (4.0%) | 0 (0.0%) |
| 18 to 34 Years | 0 (0.0%) | 0 (0.0%) |
| 35 to 64 Years | 6 (2.2%) | 24 (7.2%) |
| 65 to 74 Years | 18 (17.0%) | 26 (29.5%) |
| 75 Years and over | 4 (23.5%) | 24 (54.5%) |
Disability Class: Self-Care Difficulty
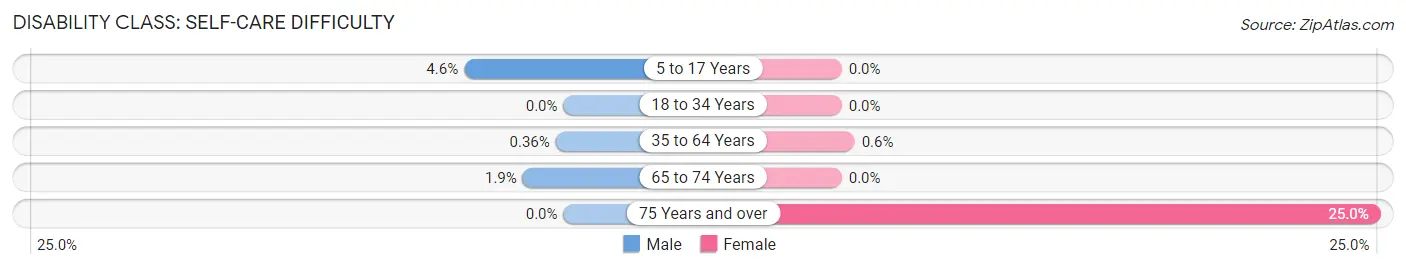
| Age Bracket | Male | Female |
| 5 to 17 Years | 14 (4.6%) | 0 (0.0%) |
| 18 to 34 Years | 0 (0.0%) | 0 (0.0%) |
| 35 to 64 Years | 1 (0.4%) | 2 (0.6%) |
| 65 to 74 Years | 2 (1.9%) | 0 (0.0%) |
| 75 Years and over | 0 (0.0%) | 11 (25.0%) |
Technology Access in Sour Lake
Computing Device Access in Sour Lake
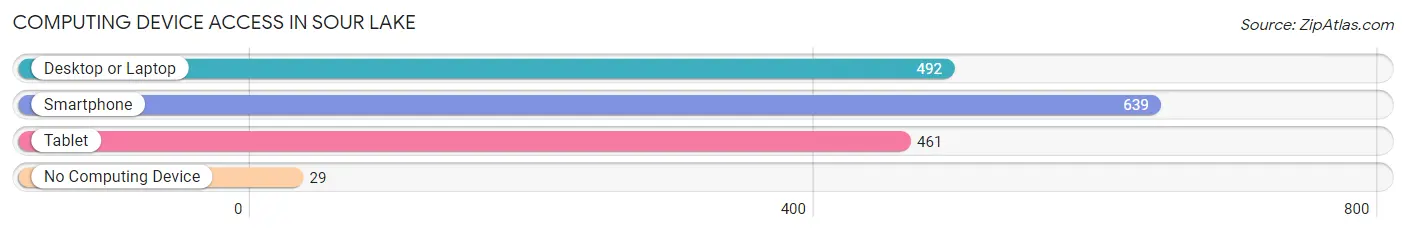
| Device Type | # Households | % Households |
| Desktop or Laptop | 492 | 71.2% |
| Smartphone | 639 | 92.5% |
| Tablet | 461 | 66.7% |
| No Computing Device | 29 | 4.2% |
| Total | 691 | 100.0% |
Internet Access in Sour Lake
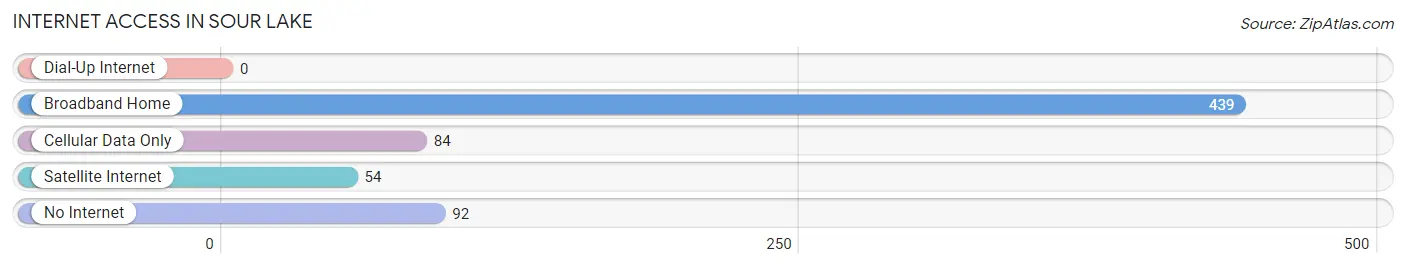
| Internet Type | # Households | % Households |
| Dial-Up Internet | 0 | 0.0% |
| Broadband Home | 439 | 63.5% |
| Cellular Data Only | 84 | 12.2% |
| Satellite Internet | 54 | 7.8% |
| No Internet | 92 | 13.3% |
| Total | 691 | 100.0% |
Sour Lake Summary
Sour Lake is a small town located in Hardin County, Texas, United States. It is situated about 25 miles northeast of Beaumont and about 10 miles south of Kountze. The town was founded in 1894 and is named after a nearby sulfur spring. As of the 2010 census, the population of Sour Lake was 1,813.
History
Sour Lake was founded in 1894 by a group of settlers from Louisiana. The town was named after a nearby sulfur spring, which was believed to have healing properties. The settlers built a hotel and a general store, and the town quickly grew. By the early 1900s, Sour Lake had become a popular tourist destination, with visitors coming from all over the country to take advantage of the healing waters.
In the early 1900s, the town was also home to a thriving lumber industry. The lumber industry provided jobs for many of the town’s residents and helped to fuel the local economy.
In the 1920s, oil was discovered in the area and the town quickly became a center for oil production. The oil industry provided jobs for many of the town’s residents and helped to fuel the local economy.
In the 1950s, the town began to decline as the oil industry moved away and the lumber industry began to decline. The town’s population began to decline as well, and by the 1970s, the population had dropped to just over 1,000.
Geography
Sour Lake is located in Hardin County, Texas, United States. It is situated about 25 miles northeast of Beaumont and about 10 miles south of Kountze. The town is located on the western edge of the Big Thicket National Preserve.
The town is situated on the banks of the Neches River, which flows through the area. The terrain in the area is mostly flat, with some rolling hills. The climate in the area is humid subtropical, with hot summers and mild winters.
Economy
The economy of Sour Lake is largely based on oil and gas production. The town is home to several oil and gas companies, including Chevron, ExxonMobil, and Shell. The town is also home to several manufacturing companies, including a paper mill and a plastics plant.
The town is also home to several retail stores, including a Walmart Supercenter and a Home Depot. The town is also home to several restaurants, including a Sonic Drive-In and a Whataburger.
Demographics
As of the 2010 census, the population of Sour Lake was 1,813. The racial makeup of the town was 79.3% White, 15.2% African American, 0.3% Native American, 0.7% Asian, 0.1% Pacific Islander, and 4.4% from other races. Hispanic or Latino of any race were 8.2% of the population.
The median household income in Sour Lake was $37,917, and the median family income was $45,938. The per capita income in the town was $19,945. About 16.2% of the population was below the poverty line.
Common Questions
What is the Total Population of Sour Lake?
Total Population of Sour Lake is 2,083.
What is the Total Male Population of Sour Lake?
Total Male Population of Sour Lake is 1,005.
What is the Total Female Population of Sour Lake?
Total Female Population of Sour Lake is 1,078.
What is the Ratio of Males per 100 Females in Sour Lake?
There are 93.23 Males per 100 Females in Sour Lake.
What is the Ratio of Females per 100 Males in Sour Lake?
There are 107.26 Females per 100 Males in Sour Lake.
What is the Median Population Age in Sour Lake?
Median Population Age in Sour Lake is 30.3 Years.
What is the Average Family Size in Sour Lake
Average Family Size in Sour Lake is 3.3 People.
What is the Average Household Size in Sour Lake
Average Household Size in Sour Lake is 3.0 People.
What is Per Capita Income in Sour Lake?
Per Capita income in Sour Lake is $27,882.
What is the Median Family Income in Sour Lake?
Median Family Income in Sour Lake is $71,439.
What is the Median Household income in Sour Lake?
Median Household Income in Sour Lake is $65,515.
What is Income or Wage Gap in Sour Lake?
Income or Wage Gap in Sour Lake is 39.8%.
Women in Sour Lake earn 60.2 cents for every dollar earned by a man.
What is Inequality or Gini Index in Sour Lake?
Inequality or Gini Index in Sour Lake is 0.45.
How Large is the Labor Force in Sour Lake?
There are 863 People in the Labor Forcein in Sour Lake.
What is the Percentage of People in the Labor Force in Sour Lake?
62.9% of People are in the Labor Force in Sour Lake.
What is the Unemployment Rate in Sour Lake?
Unemployment Rate in Sour Lake is 4.9%.