Snyder, TX
Snyder Map
Snyder Overview
11,378
TOTAL POPULATION
5,523
MALE POPULATION
5,855
FEMALE POPULATION
94.33
MALES / 100 FEMALES
106.01
FEMALES / 100 MALES
31.3
MEDIAN AGE
3.3
AVG FAMILY SIZE
2.7
AVG HOUSEHOLD SIZE
$29,491
PER CAPITA INCOME
$73,420
AVG FAMILY INCOME
$54,915
AVG HOUSEHOLD INCOME
40.0%
WAGE / INCOME GAP [ % ]
60.0¢/ $1
WAGE / INCOME GAP [ $ ]
0.41
INEQUALITY / GINI INDEX
5,222
LABOR FORCE [ PEOPLE ]
61.0%
PERCENT IN LABOR FORCE
2.5%
UNEMPLOYMENT RATE
Snyder Zip Codes
Snyder Area Codes
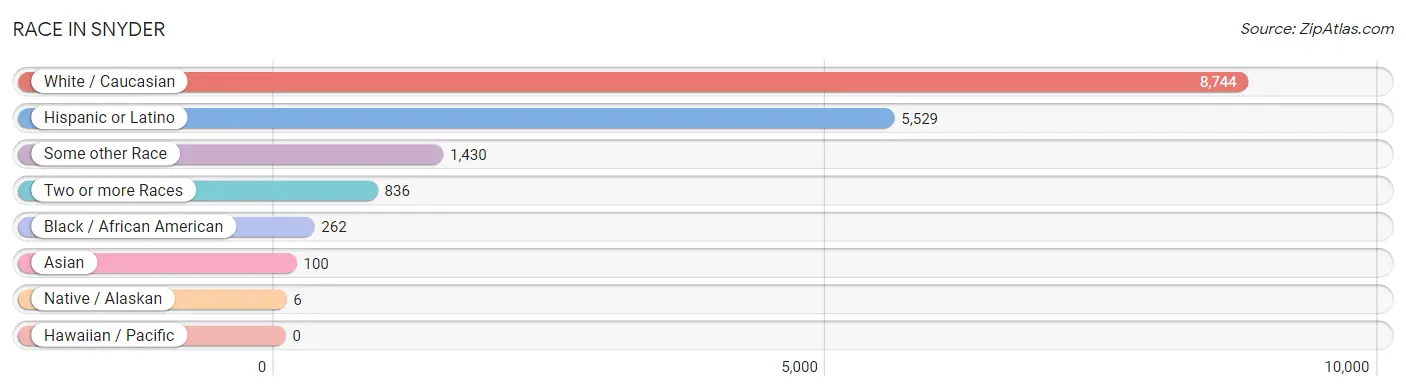
Race in Snyder
The most populous races in Snyder are White / Caucasian (8,744 | 76.8%), Hispanic or Latino (5,529 | 48.6%), and Some other Race (1,430 | 12.6%).
| Race | # Population | % Population |
| Asian | 100 | 0.9% |
| Black / African American | 262 | 2.3% |
| Hawaiian / Pacific | 0 | 0.0% |
| Hispanic or Latino | 5,529 | 48.6% |
| Native / Alaskan | 6 | 0.1% |
| White / Caucasian | 8,744 | 76.8% |
| Two or more Races | 836 | 7.3% |
| Some other Race | 1,430 | 12.6% |
| Total | 11,378 | 100.0% |
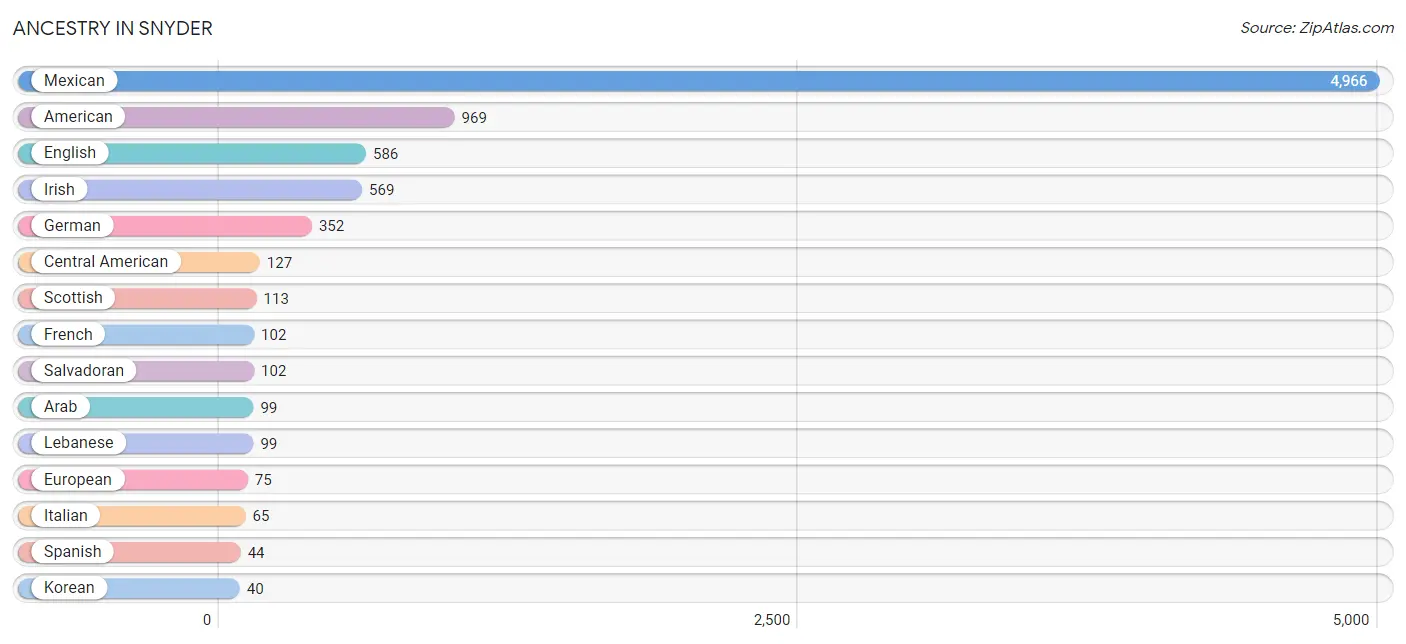
Ancestry in Snyder
The most populous ancestries reported in Snyder are Mexican (4,966 | 43.6%), American (969 | 8.5%), English (586 | 5.1%), Irish (569 | 5.0%), and German (352 | 3.1%), together accounting for 65.4% of all Snyder residents.
| Ancestry | # Population | % Population |
| American | 969 | 8.5% |
| Apache | 6 | 0.1% |
| Arab | 99 | 0.9% |
| Austrian | 27 | 0.2% |
| Blackfeet | 5 | 0.0% |
| British | 10 | 0.1% |
| Burmese | 19 | 0.2% |
| Central American | 127 | 1.1% |
| Creek | 5 | 0.0% |
| Cuban | 9 | 0.1% |
| Czech | 35 | 0.3% |
| Eastern European | 16 | 0.1% |
| English | 586 | 5.1% |
| European | 75 | 0.7% |
| French | 102 | 0.9% |
| German | 352 | 3.1% |
| Greek | 6 | 0.1% |
| Honduran | 25 | 0.2% |
| Indian (Asian) | 11 | 0.1% |
| Irish | 569 | 5.0% |
| Italian | 65 | 0.6% |
| Korean | 40 | 0.4% |
| Laotian | 9 | 0.1% |
| Lebanese | 99 | 0.9% |
| Lithuanian | 10 | 0.1% |
| Mexican | 4,966 | 43.6% |
| Nigerian | 7 | 0.1% |
| Norwegian | 11 | 0.1% |
| Puerto Rican | 8 | 0.1% |
| Salvadoran | 102 | 0.9% |
| Scotch-Irish | 30 | 0.3% |
| Scottish | 113 | 1.0% |
| Spanish | 44 | 0.4% |
| Sri Lankan | 40 | 0.4% |
| Subsaharan African | 7 | 0.1% |
| Welsh | 12 | 0.1% | View All 36 Rows |
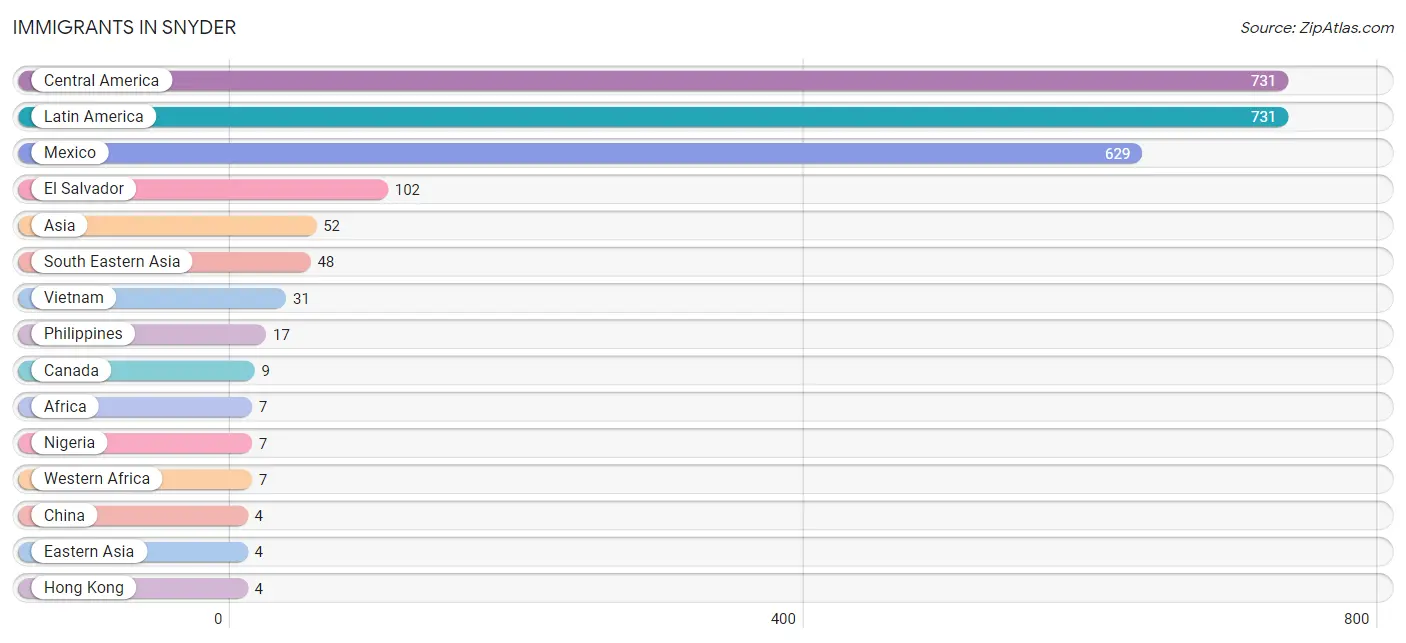
Immigrants in Snyder
The most numerous immigrant groups reported in Snyder came from Central America (731 | 6.4%), Latin America (731 | 6.4%), Mexico (629 | 5.5%), El Salvador (102 | 0.9%), and Asia (52 | 0.5%), together accounting for 19.7% of all Snyder residents.
| Immigration Origin | # Population | % Population |
| Africa | 7 | 0.1% |
| Asia | 52 | 0.5% |
| Canada | 9 | 0.1% |
| Central America | 731 | 6.4% |
| China | 4 | 0.0% |
| Eastern Asia | 4 | 0.0% |
| El Salvador | 102 | 0.9% |
| Hong Kong | 4 | 0.0% |
| Latin America | 731 | 6.4% |
| Mexico | 629 | 5.5% |
| Nigeria | 7 | 0.1% |
| Philippines | 17 | 0.2% |
| South Eastern Asia | 48 | 0.4% |
| Vietnam | 31 | 0.3% |
| Western Africa | 7 | 0.1% | View All 15 Rows |
Sex and Age in Snyder
Sex and Age in Snyder
The most populous age groups in Snyder are 20 to 24 Years (552 | 10.0%) for men and 10 to 14 Years (590 | 10.1%) for women.
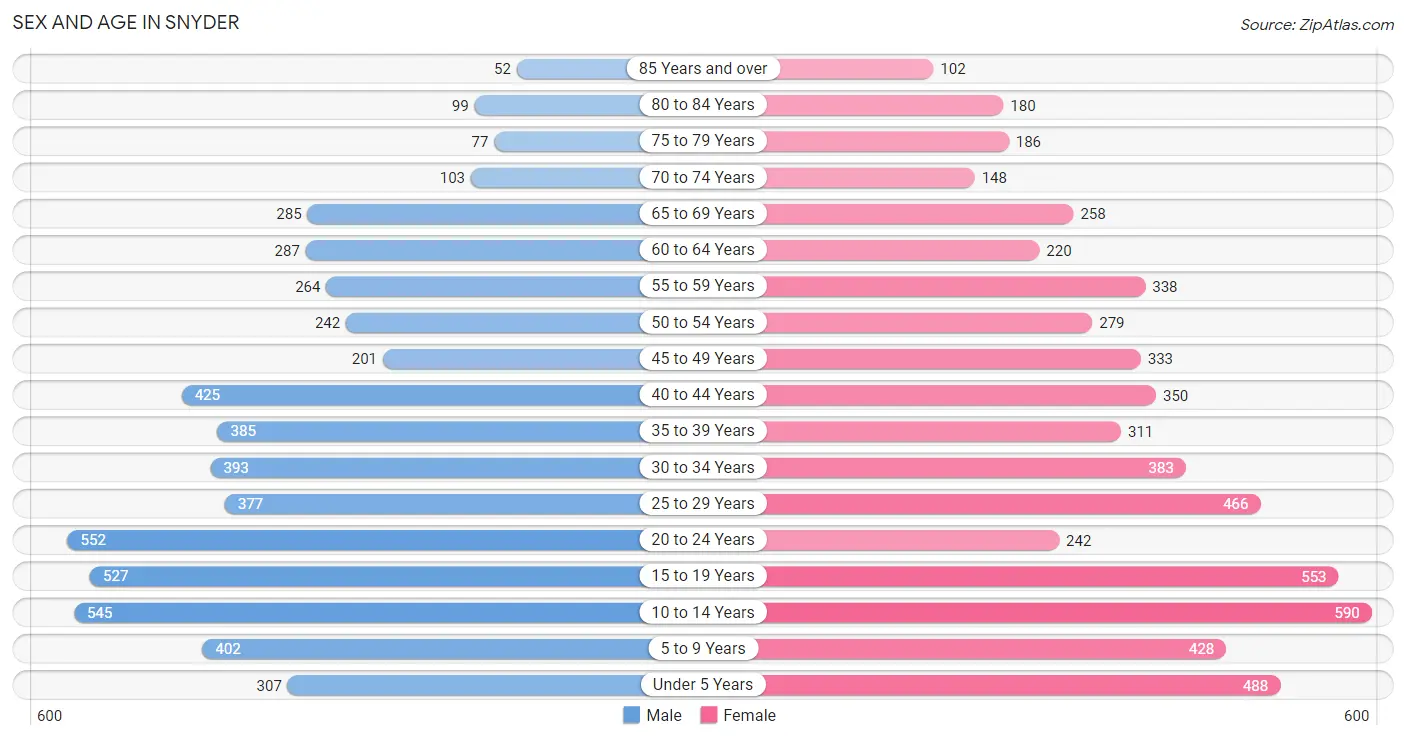
| Age Bracket | Male | Female |
| Under 5 Years | 307 (5.6%) | 488 (8.3%) |
| 5 to 9 Years | 402 (7.3%) | 428 (7.3%) |
| 10 to 14 Years | 545 (9.9%) | 590 (10.1%) |
| 15 to 19 Years | 527 (9.5%) | 553 (9.4%) |
| 20 to 24 Years | 552 (10.0%) | 242 (4.1%) |
| 25 to 29 Years | 377 (6.8%) | 466 (8.0%) |
| 30 to 34 Years | 393 (7.1%) | 383 (6.5%) |
| 35 to 39 Years | 385 (7.0%) | 311 (5.3%) |
| 40 to 44 Years | 425 (7.7%) | 350 (6.0%) |
| 45 to 49 Years | 201 (3.6%) | 333 (5.7%) |
| 50 to 54 Years | 242 (4.4%) | 279 (4.8%) |
| 55 to 59 Years | 264 (4.8%) | 338 (5.8%) |
| 60 to 64 Years | 287 (5.2%) | 220 (3.8%) |
| 65 to 69 Years | 285 (5.2%) | 258 (4.4%) |
| 70 to 74 Years | 103 (1.9%) | 148 (2.5%) |
| 75 to 79 Years | 77 (1.4%) | 186 (3.2%) |
| 80 to 84 Years | 99 (1.8%) | 180 (3.1%) |
| 85 Years and over | 52 (0.9%) | 102 (1.7%) |
| Total | 5,523 (100.0%) | 5,855 (100.0%) |
Families and Households in Snyder
Median Family Size in Snyder
The median family size in Snyder is 3.28 persons per family, with single female/mother families (319 | 11.9%) accounting for the largest median family size of 3.33 persons per family. On the other hand, single male/father families (253 | 9.5%) represent the smallest median family size with 2.92 persons per family.
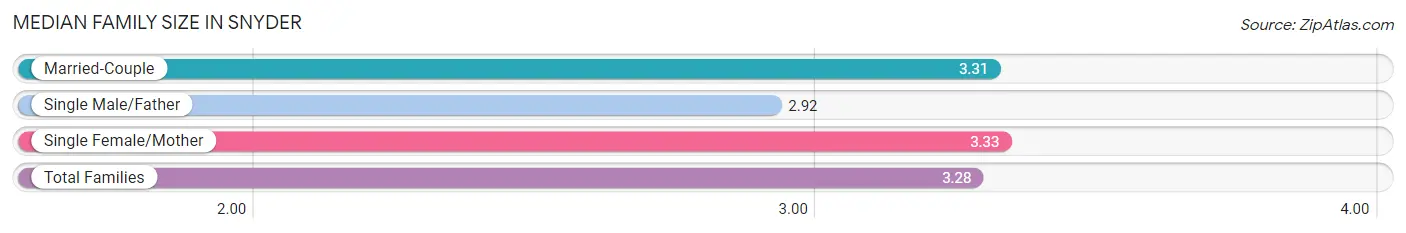
| Family Type | # Families | Family Size |
| Married-Couple | 2,101 (78.6%) | 3.31 |
| Single Male/Father | 253 (9.5%) | 2.92 |
| Single Female/Mother | 319 (11.9%) | 3.33 |
| Total Families | 2,673 (100.0%) | 3.28 |
Median Household Size in Snyder
The median household size in Snyder is 2.66 persons per household, with single female/mother households (319 | 7.8%) accounting for the largest median household size of 3.89 persons per household. non-family households (1,409 | 34.5%) represent the smallest median household size with 1.20 persons per household.
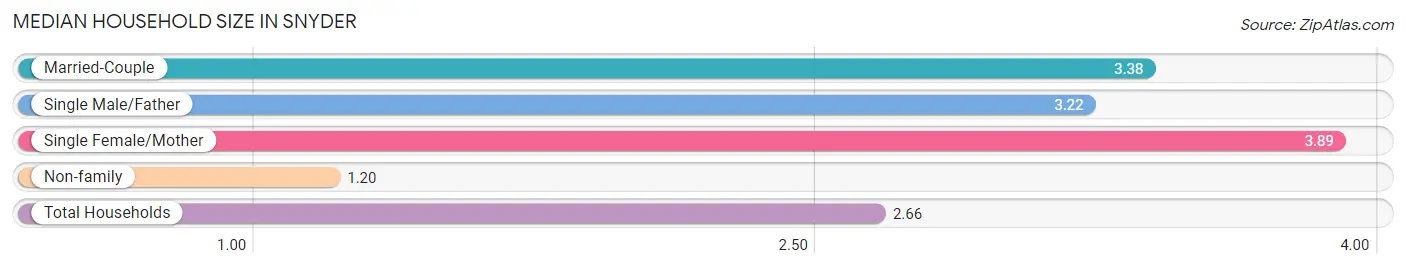
| Household Type | # Households | Household Size |
| Married-Couple | 2,101 (51.5%) | 3.38 |
| Single Male/Father | 253 (6.2%) | 3.22 |
| Single Female/Mother | 319 (7.8%) | 3.89 |
| Non-family | 1,409 (34.5%) | 1.20 |
| Total Households | 4,082 (100.0%) | 2.66 |
Household Size by Marriage Status in Snyder
Out of a total of 4,082 households in Snyder, 2,673 (65.5%) are family households, while 1,409 (34.5%) are nonfamily households. The most numerous type of family households are 2-person households, comprising 1,024, and the most common type of nonfamily households are 1-person households, comprising 1,338.
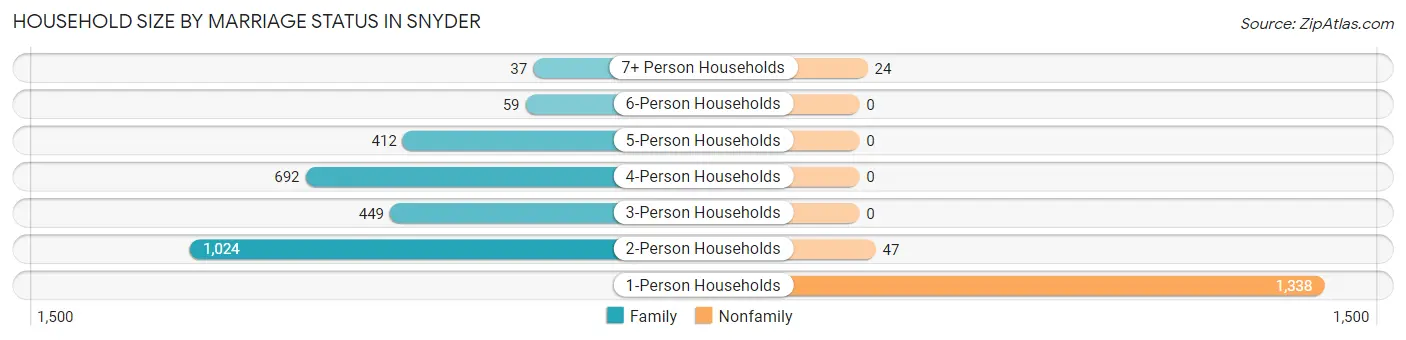
| Household Size | Family Households | Nonfamily Households |
| 1-Person Households | - | 1,338 (32.8%) |
| 2-Person Households | 1,024 (25.1%) | 47 (1.1%) |
| 3-Person Households | 449 (11.0%) | 0 (0.0%) |
| 4-Person Households | 692 (17.0%) | 0 (0.0%) |
| 5-Person Households | 412 (10.1%) | 0 (0.0%) |
| 6-Person Households | 59 (1.5%) | 0 (0.0%) |
| 7+ Person Households | 37 (0.9%) | 24 (0.6%) |
| Total | 2,673 (65.5%) | 1,409 (34.5%) |
Female Fertility in Snyder
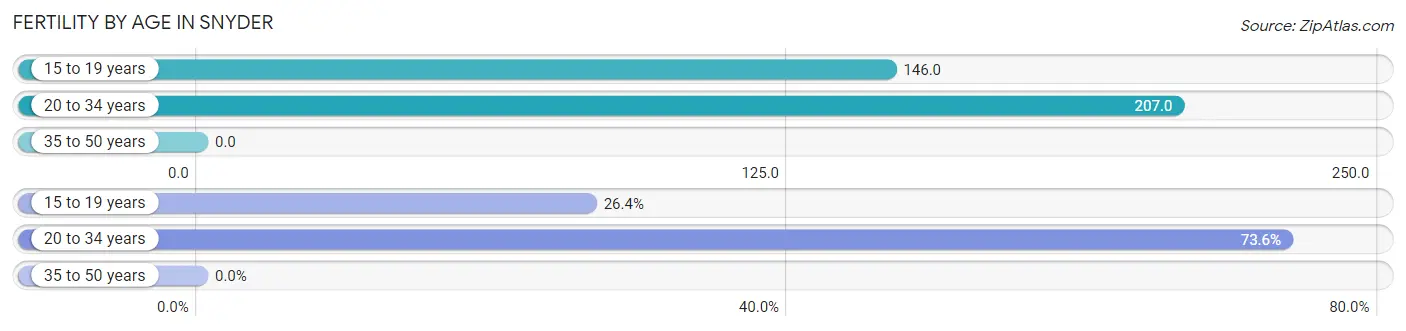
Fertility by Age in Snyder
Average fertility rate in Snyder is 113.0 births per 1,000 women. Women in the age bracket of 20 to 34 years have the highest fertility rate with 207.0 births per 1,000 women. Women in the age bracket of 20 to 34 years acount for 73.6% of all women with births.
| Age Bracket | Women with Births | Births / 1,000 Women |
| 15 to 19 years | 81 (26.4%) | 146.0 |
| 20 to 34 years | 226 (73.6%) | 207.0 |
| 35 to 50 years | 0 (0.0%) | 0.0 |
| Total | 307 (100.0%) | 113.0 |
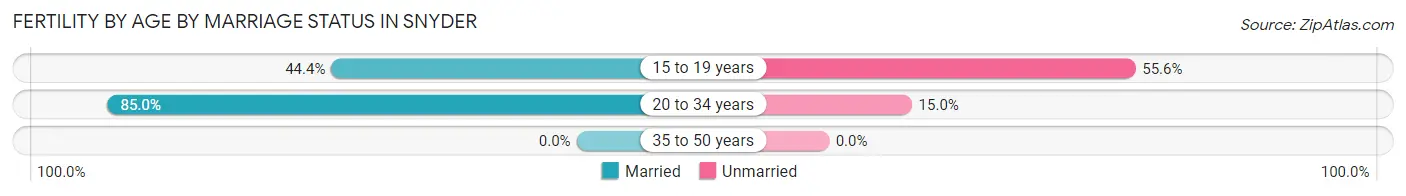
Fertility by Age by Marriage Status in Snyder
74.3% of women with births (307) in Snyder are married. The highest percentage of unmarried women with births falls into 15 to 19 years age bracket with 55.6% of them unmarried at the time of birth, while the lowest percentage of unmarried women with births belong to 20 to 34 years age bracket with 15.0% of them unmarried.
| Age Bracket | Married | Unmarried |
| 15 to 19 years | 36 (44.4%) | 45 (55.6%) |
| 20 to 34 years | 192 (85.0%) | 34 (15.0%) |
| 35 to 50 years | 0 (0.0%) | 0 (0.0%) |
| Total | 228 (74.3%) | 79 (25.7%) |
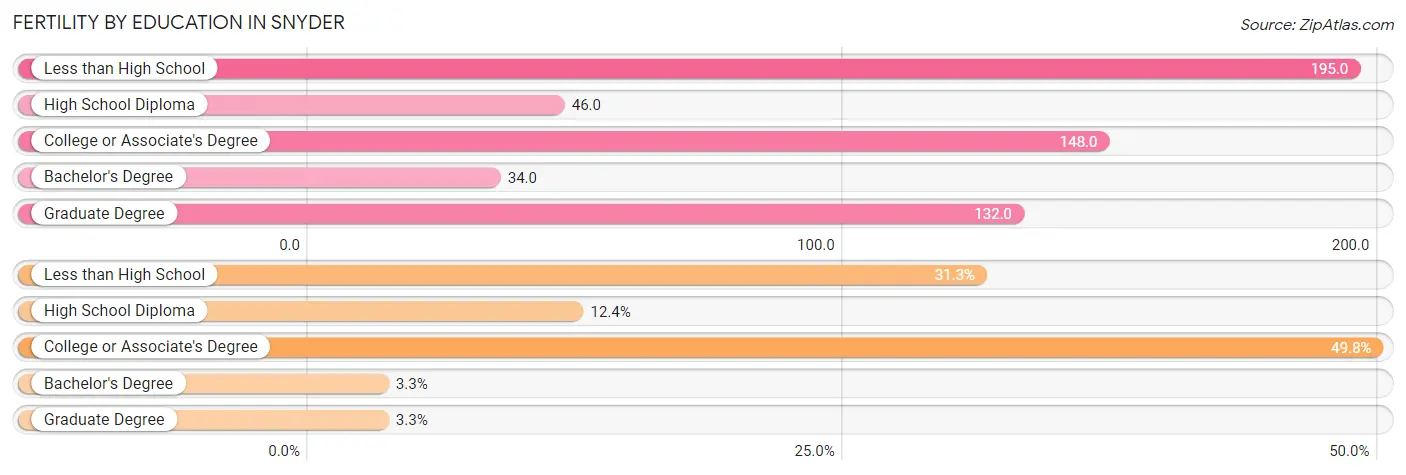
Fertility by Education in Snyder
Average fertility rate in Snyder is 113.0 births per 1,000 women. Women with the education attainment of less than high school have the highest fertility rate of 195.0 births per 1,000 women, while women with the education attainment of bachelor's degree have the lowest fertility at 34.0 births per 1,000 women. Women with the education attainment of college or associate's degree represent 49.8% of all women with births.
| Educational Attainment | Women with Births | Births / 1,000 Women |
| Less than High School | 96 (31.3%) | 195.0 |
| High School Diploma | 38 (12.4%) | 46.0 |
| College or Associate's Degree | 153 (49.8%) | 148.0 |
| Bachelor's Degree | 10 (3.3%) | 34.0 |
| Graduate Degree | 10 (3.3%) | 132.0 |
| Total | 307 (100.0%) | 113.0 |
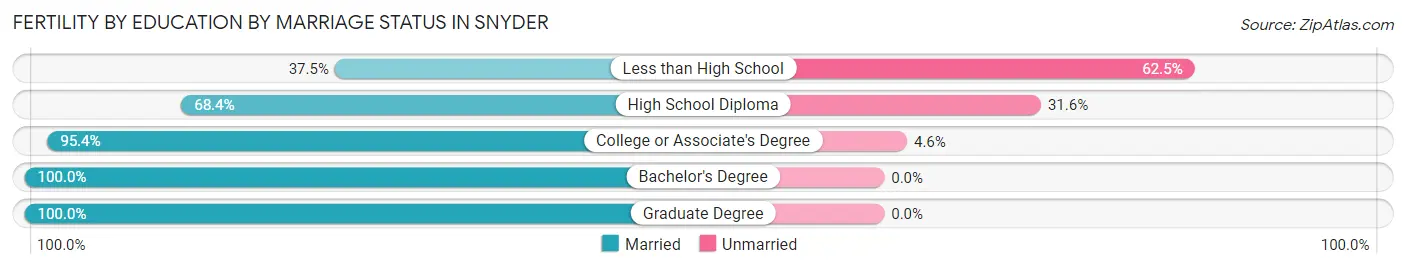
Fertility by Education by Marriage Status in Snyder
25.7% of women with births in Snyder are unmarried. Women with the educational attainment of bachelor's degree are most likely to be married with 100.0% of them married at childbirth, while women with the educational attainment of less than high school are least likely to be married with 62.5% of them unmarried at childbirth.
| Educational Attainment | Married | Unmarried |
| Less than High School | 36 (37.5%) | 60 (62.5%) |
| High School Diploma | 26 (68.4%) | 12 (31.6%) |
| College or Associate's Degree | 146 (95.4%) | 7 (4.6%) |
| Bachelor's Degree | 10 (100.0%) | 0 (0.0%) |
| Graduate Degree | 10 (100.0%) | 0 (0.0%) |
| Total | 228 (74.3%) | 79 (25.7%) |
Income in Snyder
Income Overview in Snyder
Per Capita Income in Snyder is $29,491, while median incomes of families and households are $73,420 and $54,915 respectively.
| Characteristic | Number | Measure |
| Per Capita Income | 11,378 | $29,491 |
| Median Family Income | 2,673 | $73,420 |
| Mean Family Income | 2,673 | $89,320 |
| Median Household Income | 4,082 | $54,915 |
| Mean Household Income | 4,082 | $80,249 |
| Income Deficit | 2,673 | $0 |
| Wage / Income Gap (%) | 11,378 | 40.02% |
| Wage / Income Gap ($) | 11,378 | 59.98¢ per $1 |
| Gini / Inequality Index | 11,378 | 0.41 |
Earnings by Sex in Snyder
Average Earnings in Snyder are $34,291, $45,032 for men and $27,011 for women, a difference of 40.0%.
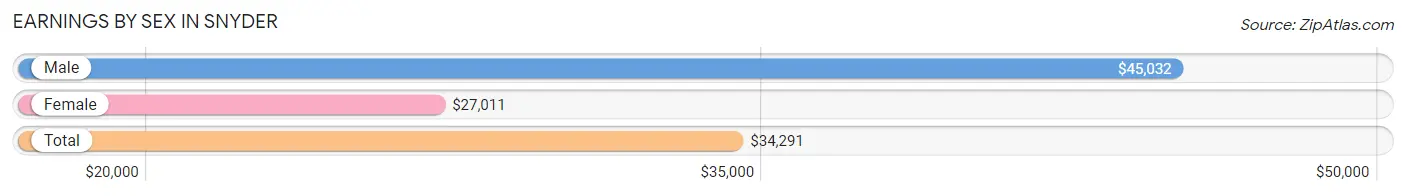
| Sex | Number | Average Earnings |
| Male | 3,184 (56.1%) | $45,032 |
| Female | 2,489 (43.9%) | $27,011 |
| Total | 5,673 (100.0%) | $34,291 |
Earnings by Sex by Income Bracket in Snyder
The most common earnings brackets in Snyder are $100,000+ for men (610 | 19.2%) and $25,000 to $29,999 for women (428 | 17.2%).
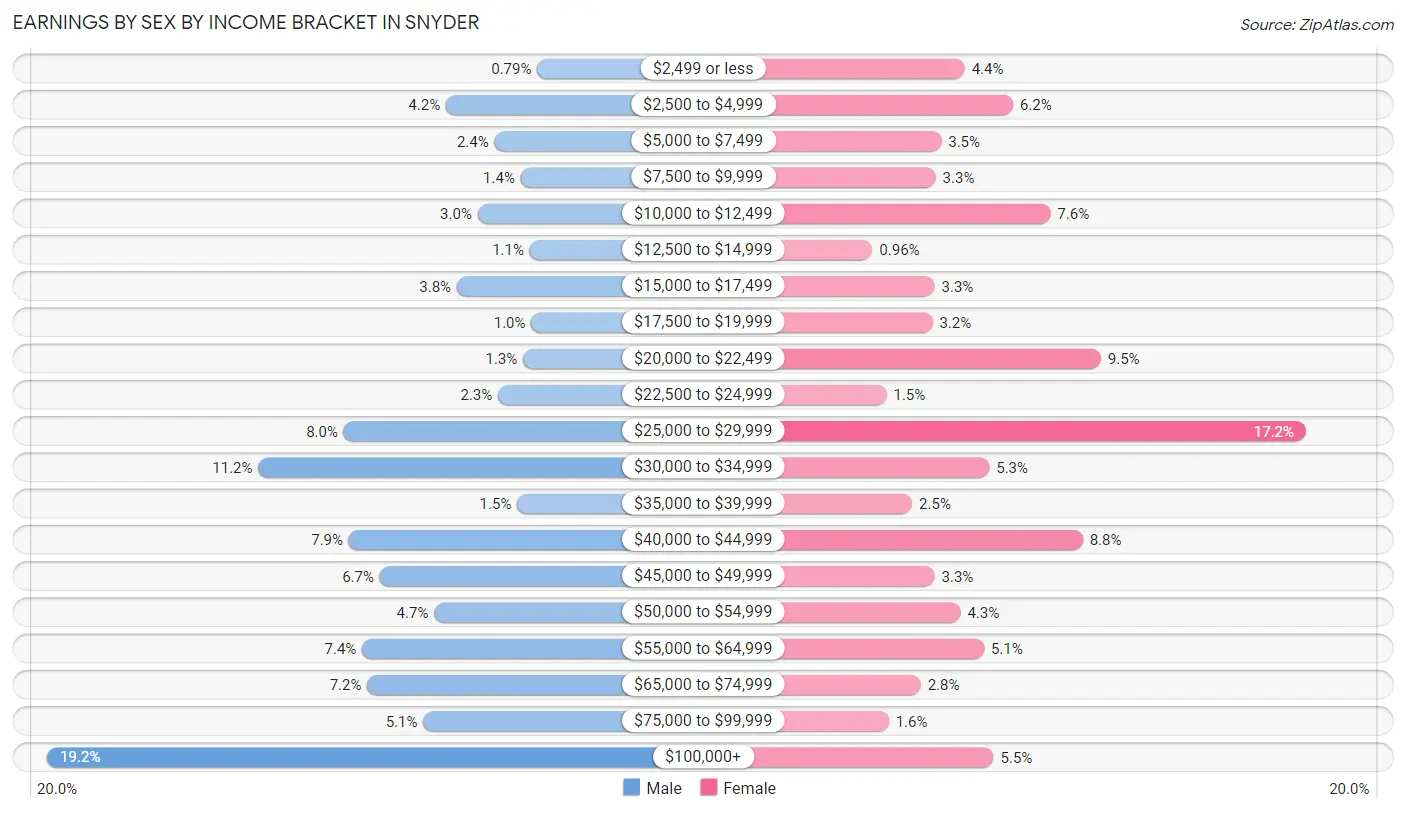
| Income | Male | Female |
| $2,499 or less | 25 (0.8%) | 110 (4.4%) |
| $2,500 to $4,999 | 134 (4.2%) | 155 (6.2%) |
| $5,000 to $7,499 | 76 (2.4%) | 88 (3.5%) |
| $7,500 to $9,999 | 45 (1.4%) | 83 (3.3%) |
| $10,000 to $12,499 | 96 (3.0%) | 190 (7.6%) |
| $12,500 to $14,999 | 34 (1.1%) | 24 (1.0%) |
| $15,000 to $17,499 | 121 (3.8%) | 82 (3.3%) |
| $17,500 to $19,999 | 32 (1.0%) | 80 (3.2%) |
| $20,000 to $22,499 | 42 (1.3%) | 237 (9.5%) |
| $22,500 to $24,999 | 72 (2.3%) | 37 (1.5%) |
| $25,000 to $29,999 | 256 (8.0%) | 428 (17.2%) |
| $30,000 to $34,999 | 358 (11.2%) | 133 (5.3%) |
| $35,000 to $39,999 | 49 (1.5%) | 61 (2.5%) |
| $40,000 to $44,999 | 250 (7.9%) | 220 (8.8%) |
| $45,000 to $49,999 | 213 (6.7%) | 82 (3.3%) |
| $50,000 to $54,999 | 148 (4.6%) | 106 (4.3%) |
| $55,000 to $64,999 | 234 (7.3%) | 128 (5.1%) |
| $65,000 to $74,999 | 228 (7.2%) | 69 (2.8%) |
| $75,000 to $99,999 | 161 (5.1%) | 39 (1.6%) |
| $100,000+ | 610 (19.2%) | 137 (5.5%) |
| Total | 3,184 (100.0%) | 2,489 (100.0%) |
Earnings by Sex by Educational Attainment in Snyder
Average earnings in Snyder are $48,083 for men and $28,688 for women, a difference of 40.3%. Men with an educational attainment of college or associate's degree enjoy the highest average annual earnings of $56,691, while those with high school diploma education earn the least with $29,970. Women with an educational attainment of graduate degree earn the most with the average annual earnings of $59,948, while those with less than high school education have the smallest earnings of $18,354.
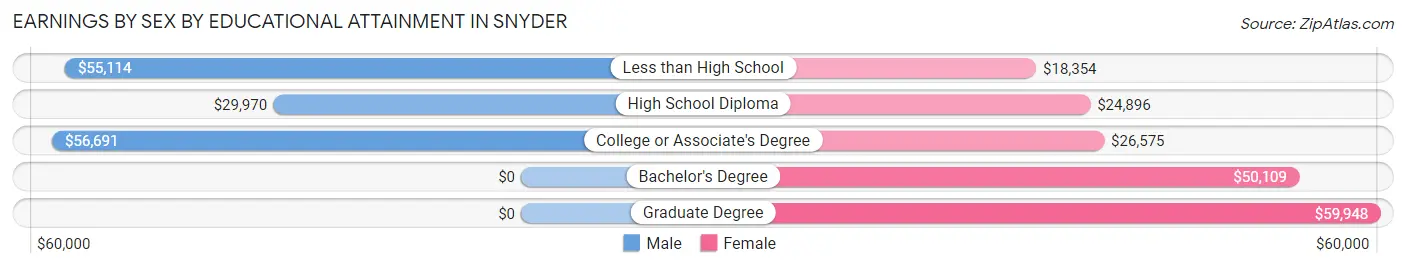
| Educational Attainment | Male Income | Female Income |
| Less than High School | $55,114 | $18,354 |
| High School Diploma | $29,970 | $24,896 |
| College or Associate's Degree | $56,691 | $26,575 |
| Bachelor's Degree | - | - |
| Graduate Degree | - | - |
| Total | $48,083 | $28,688 |
Family Income in Snyder
Family Income Brackets in Snyder
According to the Snyder family income data, there are 634 families falling into the $100,000 to $149,999 income range, which is the most common income bracket and makes up 23.7% of all families. Conversely, the less than $10,000 income bracket is the least frequent group with only 48 families (1.8%) belonging to this category.
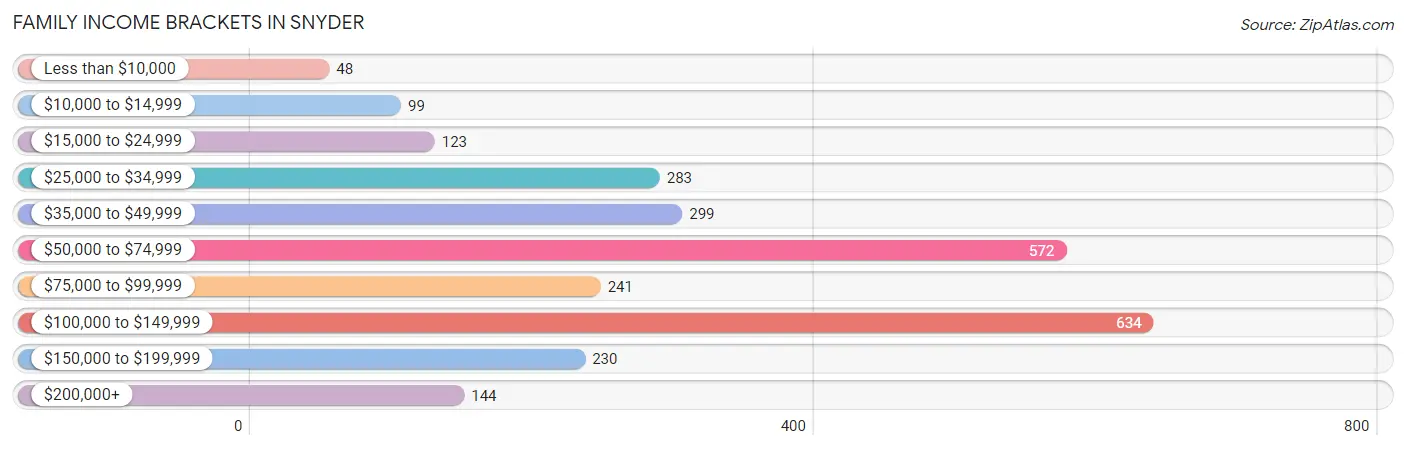
| Income Bracket | # Families | % Families |
| Less than $10,000 | 48 | 1.8% |
| $10,000 to $14,999 | 99 | 3.7% |
| $15,000 to $24,999 | 123 | 4.6% |
| $25,000 to $34,999 | 283 | 10.6% |
| $35,000 to $49,999 | 299 | 11.2% |
| $50,000 to $74,999 | 572 | 21.4% |
| $75,000 to $99,999 | 241 | 9.0% |
| $100,000 to $149,999 | 634 | 23.7% |
| $150,000 to $199,999 | 230 | 8.6% |
| $200,000+ | 144 | 5.4% |
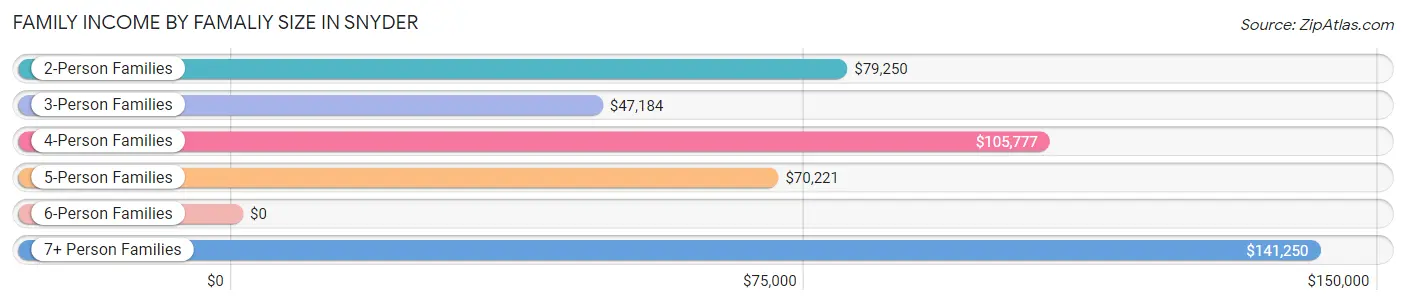
Family Income by Famaliy Size in Snyder
7+ person families (36 | 1.3%) account for the highest median family income in Snyder with $141,250 per family, while 2-person families (1,080 | 40.4%) have the highest median income of $39,625 per family member.
| Income Bracket | # Families | Median Income |
| 2-Person Families | 1,080 (40.4%) | $79,250 |
| 3-Person Families | 606 (22.7%) | $47,184 |
| 4-Person Families | 539 (20.2%) | $105,777 |
| 5-Person Families | 396 (14.8%) | $70,221 |
| 6-Person Families | 16 (0.6%) | $0 |
| 7+ Person Families | 36 (1.3%) | $141,250 |
| Total | 2,673 (100.0%) | $73,420 |
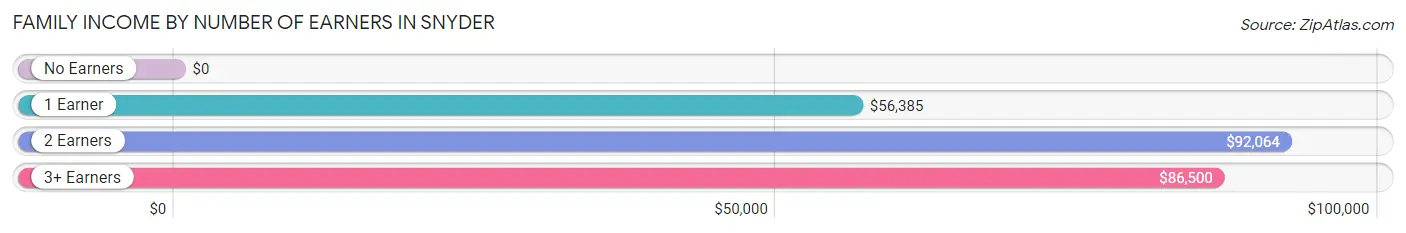
Family Income by Number of Earners in Snyder
| Number of Earners | # Families | Median Income |
| No Earners | 140 (5.2%) | $0 |
| 1 Earner | 1,160 (43.4%) | $56,385 |
| 2 Earners | 1,207 (45.2%) | $92,064 |
| 3+ Earners | 166 (6.2%) | $86,500 |
| Total | 2,673 (100.0%) | $73,420 |
Household Income in Snyder
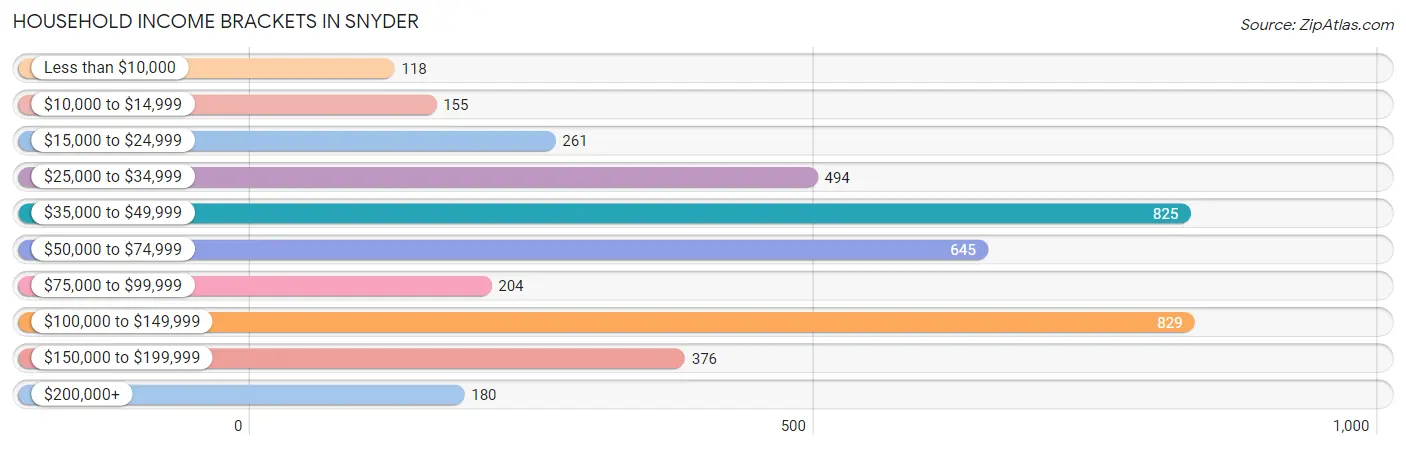
Household Income Brackets in Snyder
With 829 households falling in the category, the $100,000 to $149,999 income range is the most frequent in Snyder, accounting for 20.3% of all households. In contrast, only 118 households (2.9%) fall into the less than $10,000 income bracket, making it the least populous group.
| Income Bracket | # Households | % Households |
| Less than $10,000 | 118 | 2.9% |
| $10,000 to $14,999 | 155 | 3.8% |
| $15,000 to $24,999 | 261 | 6.4% |
| $25,000 to $34,999 | 494 | 12.1% |
| $35,000 to $49,999 | 825 | 20.2% |
| $50,000 to $74,999 | 645 | 15.8% |
| $75,000 to $99,999 | 204 | 5.0% |
| $100,000 to $149,999 | 829 | 20.3% |
| $150,000 to $199,999 | 376 | 9.2% |
| $200,000+ | 180 | 4.4% |
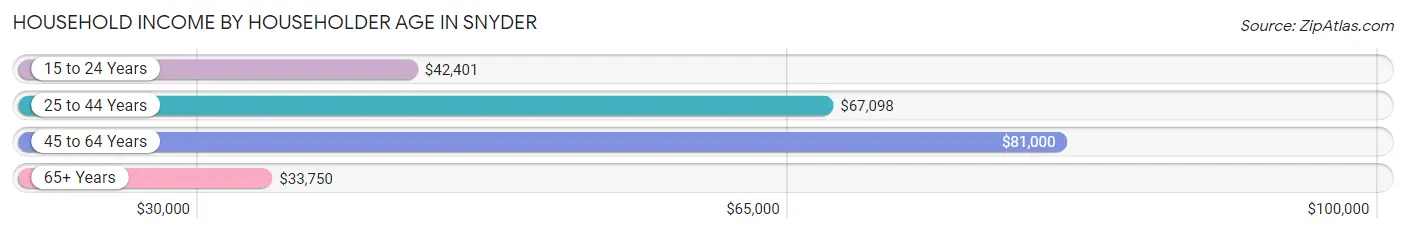
Household Income by Householder Age in Snyder
The median household income in Snyder is $54,915, with the highest median household income of $81,000 found in the 45 to 64 years age bracket for the primary householder. A total of 1,194 households (29.2%) fall into this category. Meanwhile, the 65+ years age bracket for the primary householder has the lowest median household income of $33,750, with 994 households (24.3%) in this group.
| Income Bracket | # Households | Median Income |
| 15 to 24 Years | 355 (8.7%) | $42,401 |
| 25 to 44 Years | 1,539 (37.7%) | $67,098 |
| 45 to 64 Years | 1,194 (29.2%) | $81,000 |
| 65+ Years | 994 (24.3%) | $33,750 |
| Total | 4,082 (100.0%) | $54,915 |
Poverty in Snyder
Income Below Poverty by Sex and Age in Snyder
With 15.0% poverty level for males and 11.2% for females among the residents of Snyder, 12 to 14 year old males and 5 year old females are the most vulnerable to poverty, with 127 males (38.6%) and 19 females (23.2%) in their respective age groups living below the poverty level.
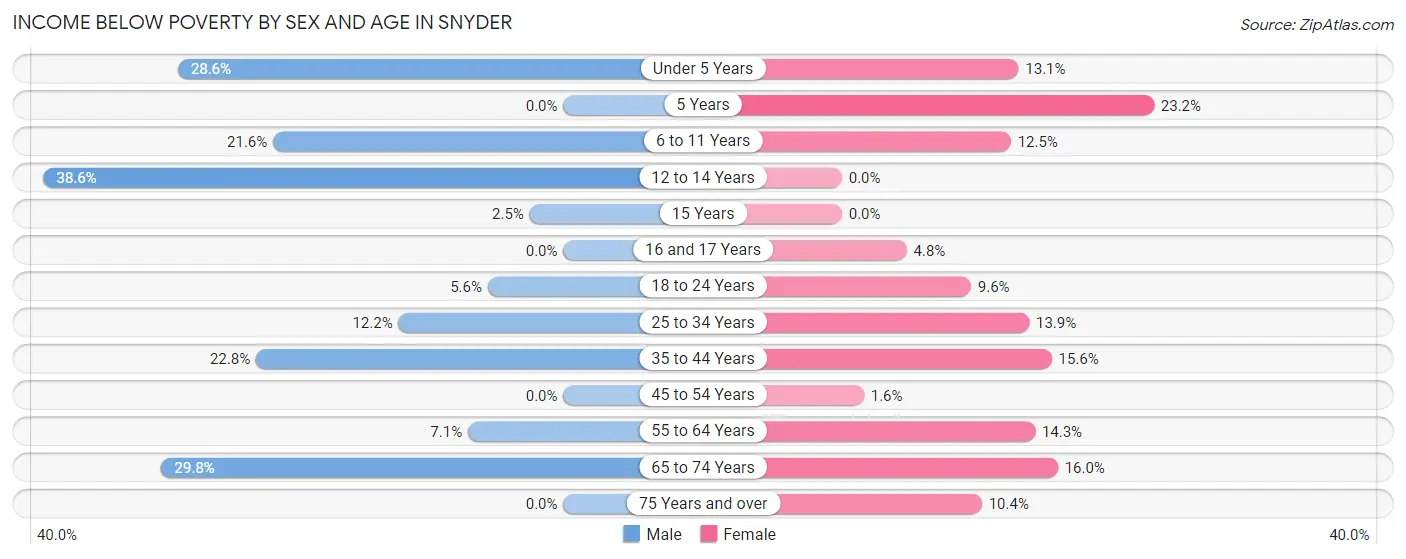
| Age Bracket | Male | Female |
| Under 5 Years | 77 (28.6%) | 64 (13.1%) |
| 5 Years | 0 (0.0%) | 19 (23.2%) |
| 6 to 11 Years | 111 (21.5%) | 71 (12.5%) |
| 12 to 14 Years | 127 (38.6%) | 0 (0.0%) |
| 15 Years | 1 (2.5%) | 0 (0.0%) |
| 16 and 17 Years | 0 (0.0%) | 10 (4.8%) |
| 18 to 24 Years | 38 (5.6%) | 41 (9.6%) |
| 25 to 34 Years | 90 (12.2%) | 118 (13.9%) |
| 35 to 44 Years | 181 (22.8%) | 103 (15.6%) |
| 45 to 54 Years | 0 (0.0%) | 10 (1.6%) |
| 55 to 64 Years | 39 (7.1%) | 80 (14.3%) |
| 65 to 74 Years | 114 (29.8%) | 63 (16.0%) |
| 75 Years and over | 0 (0.0%) | 43 (10.4%) |
| Total | 778 (15.0%) | 622 (11.2%) |
Income Above Poverty by Sex and Age in Snyder
According to the poverty statistics in Snyder, males aged 5 years and females aged 12 to 14 years are the age groups that are most secure financially, with 100.0% of males and 100.0% of females in these age groups living above the poverty line.
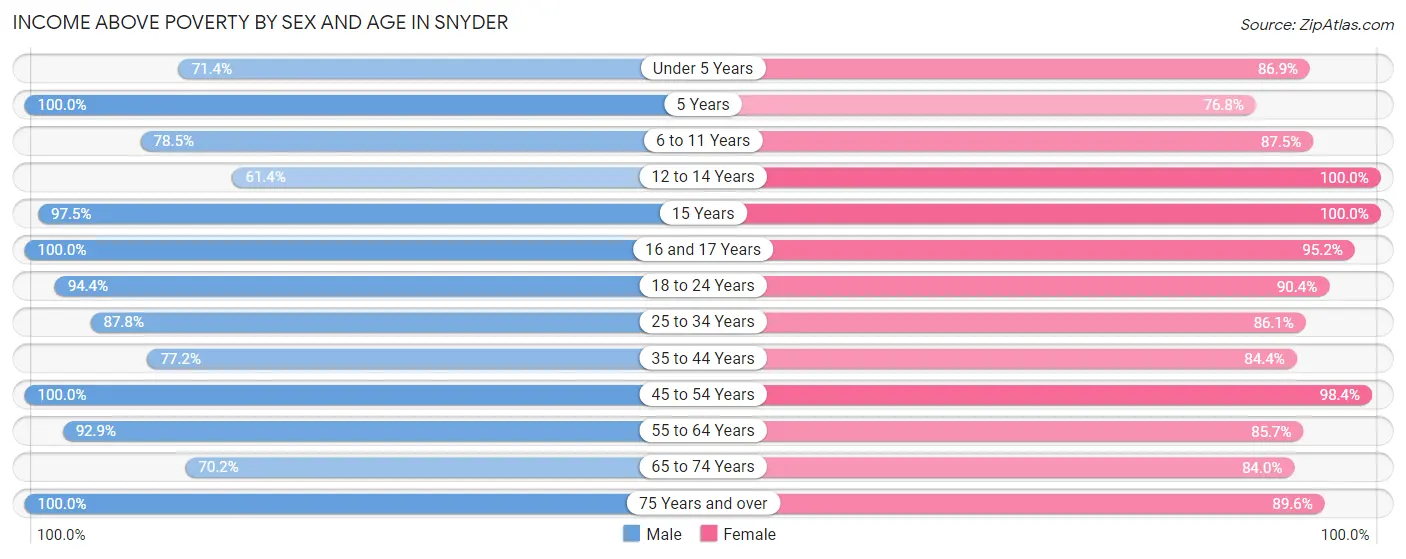
| Age Bracket | Male | Female |
| Under 5 Years | 192 (71.4%) | 424 (86.9%) |
| 5 Years | 45 (100.0%) | 63 (76.8%) |
| 6 to 11 Years | 404 (78.4%) | 495 (87.5%) |
| 12 to 14 Years | 202 (61.4%) | 295 (100.0%) |
| 15 Years | 39 (97.5%) | 18 (100.0%) |
| 16 and 17 Years | 211 (100.0%) | 198 (95.2%) |
| 18 to 24 Years | 639 (94.4%) | 387 (90.4%) |
| 25 to 34 Years | 645 (87.8%) | 731 (86.1%) |
| 35 to 44 Years | 612 (77.2%) | 558 (84.4%) |
| 45 to 54 Years | 443 (100.0%) | 602 (98.4%) |
| 55 to 64 Years | 512 (92.9%) | 478 (85.7%) |
| 65 to 74 Years | 268 (70.2%) | 330 (84.0%) |
| 75 Years and over | 204 (100.0%) | 371 (89.6%) |
| Total | 4,416 (85.0%) | 4,950 (88.8%) |
Income Below Poverty Among Married-Couple Families in Snyder
The poverty statistics for married-couple families in Snyder show that 10.0% or 211 of the total 2,101 families live below the poverty line. Families with 3 or 4 children have the highest poverty rate of 38.2%, comprising of 100 families. On the other hand, families with 5 or more children have the lowest poverty rate of 0.0%, which includes 0 families.
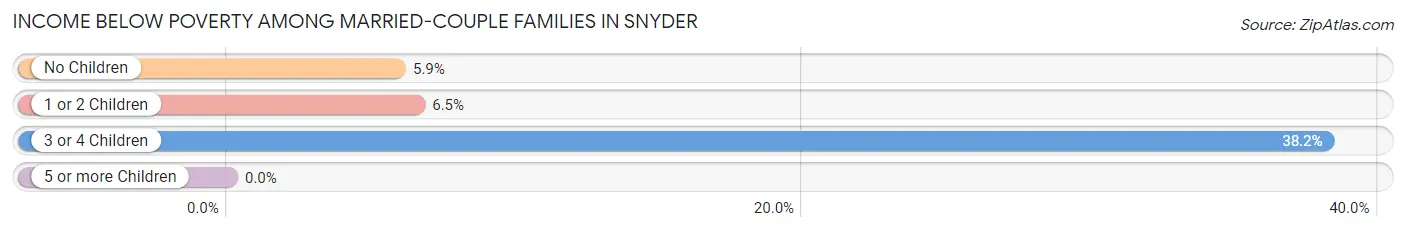
| Children | Above Poverty | Below Poverty |
| No Children | 1,062 (94.2%) | 66 (5.9%) |
| 1 or 2 Children | 645 (93.5%) | 45 (6.5%) |
| 3 or 4 Children | 162 (61.8%) | 100 (38.2%) |
| 5 or more Children | 21 (100.0%) | 0 (0.0%) |
| Total | 1,890 (90.0%) | 211 (10.0%) |
Income Below Poverty Among Single-Parent Households in Snyder
According to the poverty data in Snyder, 13.4% or 34 single-father households and 6.9% or 22 single-mother households are living below the poverty line. Among single-father households, those with 3 or 4 children have the highest poverty rate, with 16 households (100.0%) experiencing poverty. Likewise, among single-mother households, those with 3 or 4 children have the highest poverty rate, with 12 households (100.0%) falling below the poverty line.
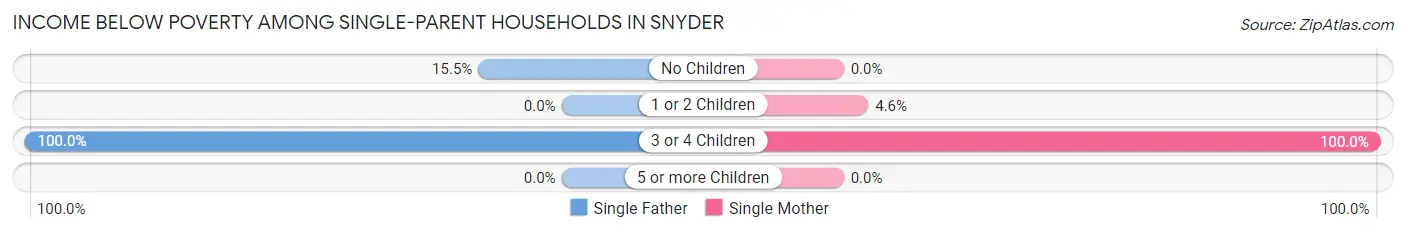
| Children | Single Father | Single Mother |
| No Children | 18 (15.5%) | 0 (0.0%) |
| 1 or 2 Children | 0 (0.0%) | 10 (4.6%) |
| 3 or 4 Children | 16 (100.0%) | 12 (100.0%) |
| 5 or more Children | 0 (0.0%) | 0 (0.0%) |
| Total | 34 (13.4%) | 22 (6.9%) |
Income Below Poverty Among Married-Couple vs Single-Parent Households in Snyder
The poverty data for Snyder shows that 211 of the married-couple family households (10.0%) and 56 of the single-parent households (9.8%) are living below the poverty level. Within the married-couple family households, those with 3 or 4 children have the highest poverty rate, with 100 households (38.2%) falling below the poverty line. Among the single-parent households, those with 3 or 4 children have the highest poverty rate, with 28 household (100.0%) living below poverty.
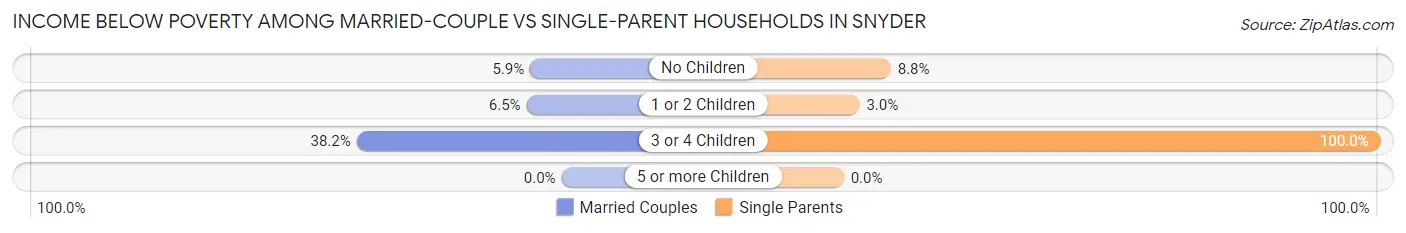
| Children | Married-Couple Families | Single-Parent Households |
| No Children | 66 (5.9%) | 18 (8.8%) |
| 1 or 2 Children | 45 (6.5%) | 10 (2.9%) |
| 3 or 4 Children | 100 (38.2%) | 28 (100.0%) |
| 5 or more Children | 0 (0.0%) | 0 (0.0%) |
| Total | 211 (10.0%) | 56 (9.8%) |
Employment Characteristics in Snyder
Employment by Class of Employer in Snyder
Among the 5,070 employed individuals in Snyder, private company employees (3,252 | 64.1%), local government employees (432 | 8.5%), and self-employed (not incorporated) (396 | 7.8%) make up the most common classes of employment.
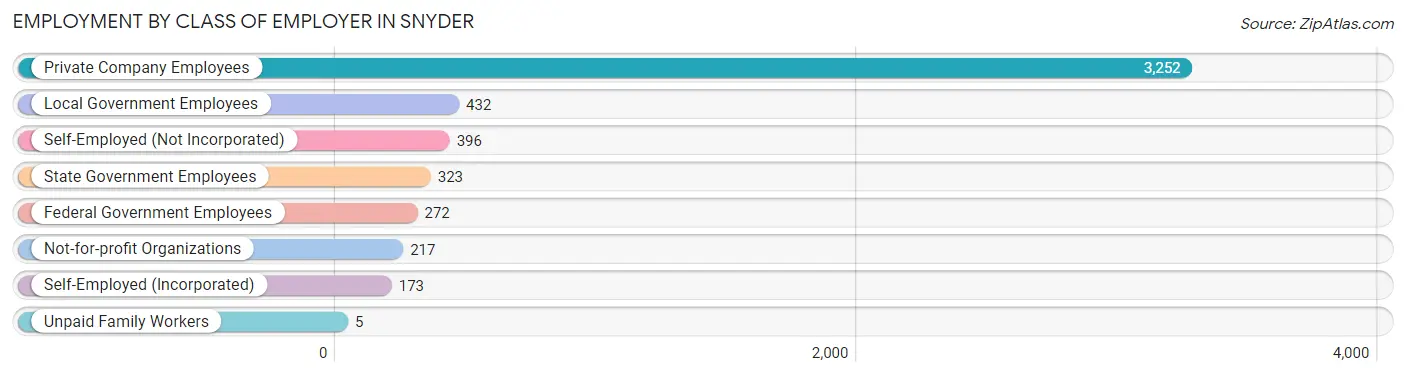
| Employer Class | # Employees | % Employees |
| Private Company Employees | 3,252 | 64.1% |
| Self-Employed (Incorporated) | 173 | 3.4% |
| Self-Employed (Not Incorporated) | 396 | 7.8% |
| Not-for-profit Organizations | 217 | 4.3% |
| Local Government Employees | 432 | 8.5% |
| State Government Employees | 323 | 6.4% |
| Federal Government Employees | 272 | 5.4% |
| Unpaid Family Workers | 5 | 0.1% |
| Total | 5,070 | 100.0% |
Employment Status by Age in Snyder
According to the labor force statistics for Snyder, out of the total population over 16 years of age (8,560), 61.0% or 5,222 individuals are in the labor force, with 2.5% or 131 of them unemployed. The age group with the highest labor force participation rate is 35 to 44 years, with 85.7% or 1,261 individuals in the labor force. Within the labor force, the 20 to 24 years age range has the highest percentage of unemployed individuals, with 6.7% or 37 of them being unemployed.
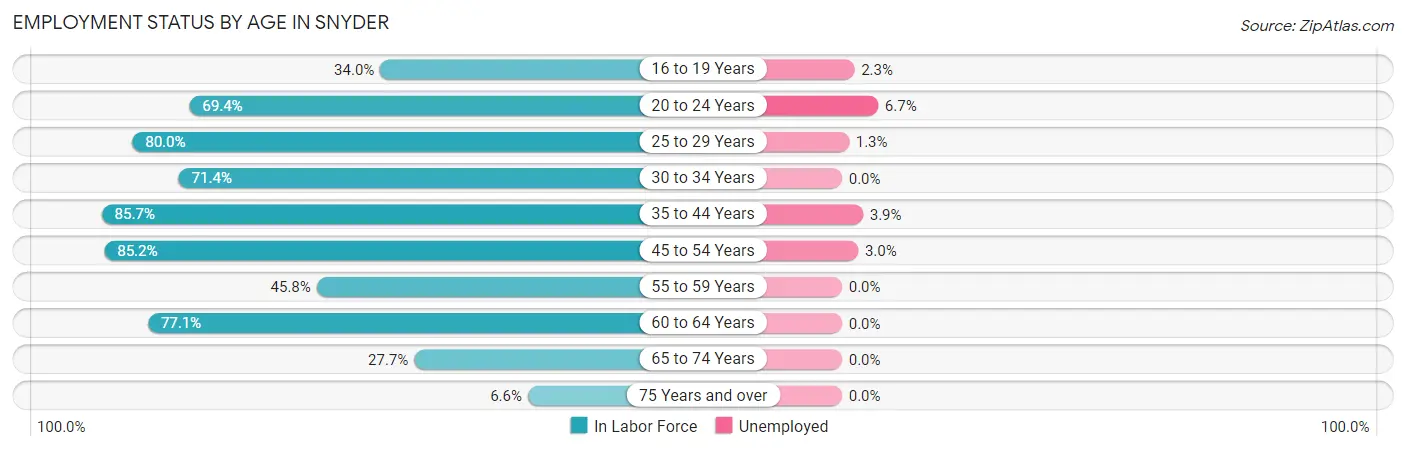
| Age Bracket | In Labor Force | Unemployed |
| 16 to 19 Years | 347 (34.0%) | 8 (2.3%) |
| 20 to 24 Years | 551 (69.4%) | 37 (6.7%) |
| 25 to 29 Years | 674 (80.0%) | 9 (1.3%) |
| 30 to 34 Years | 554 (71.4%) | 0 (0.0%) |
| 35 to 44 Years | 1,261 (85.7%) | 49 (3.9%) |
| 45 to 54 Years | 899 (85.2%) | 27 (3.0%) |
| 55 to 59 Years | 276 (45.8%) | 0 (0.0%) |
| 60 to 64 Years | 391 (77.1%) | 0 (0.0%) |
| 65 to 74 Years | 220 (27.7%) | 0 (0.0%) |
| 75 Years and over | 46 (6.6%) | 0 (0.0%) |
| Total | 5,222 (61.0%) | 131 (2.5%) |
Employment Status by Educational Attainment in Snyder
According to labor force statistics for Snyder, 77.2% of individuals (4,056) out of the total population between 25 and 64 years of age (5,254) are in the labor force, with 2.1% or 85 of them being unemployed. The group with the highest labor force participation rate are those with the educational attainment of bachelor's degree or higher, with 93.7% or 915 individuals in the labor force. Within the labor force, individuals with bachelor's degree or higher education have the highest percentage of unemployment, with 3.9% or 36 of them being unemployed.
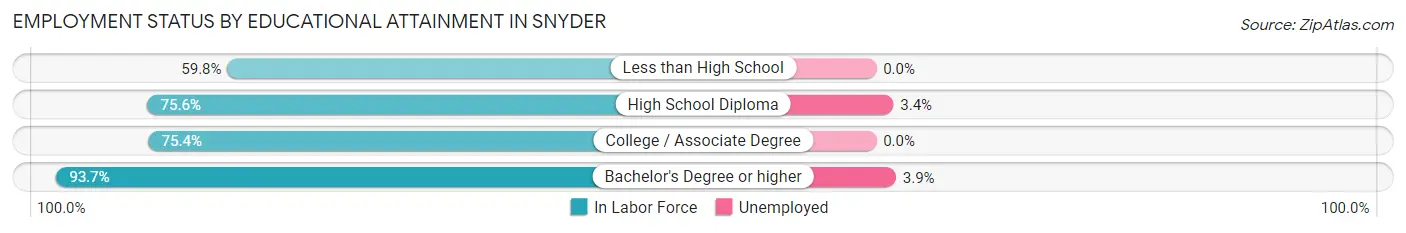
| Educational Attainment | In Labor Force | Unemployed |
| Less than High School | 342 (59.8%) | 0 (0.0%) |
| High School Diploma | 1,436 (75.6%) | 65 (3.4%) |
| College / Associate Degree | 1,361 (75.4%) | 0 (0.0%) |
| Bachelor's Degree or higher | 915 (93.7%) | 38 (3.9%) |
| Total | 4,056 (77.2%) | 110 (2.1%) |
Employment Occupations by Sex in Snyder
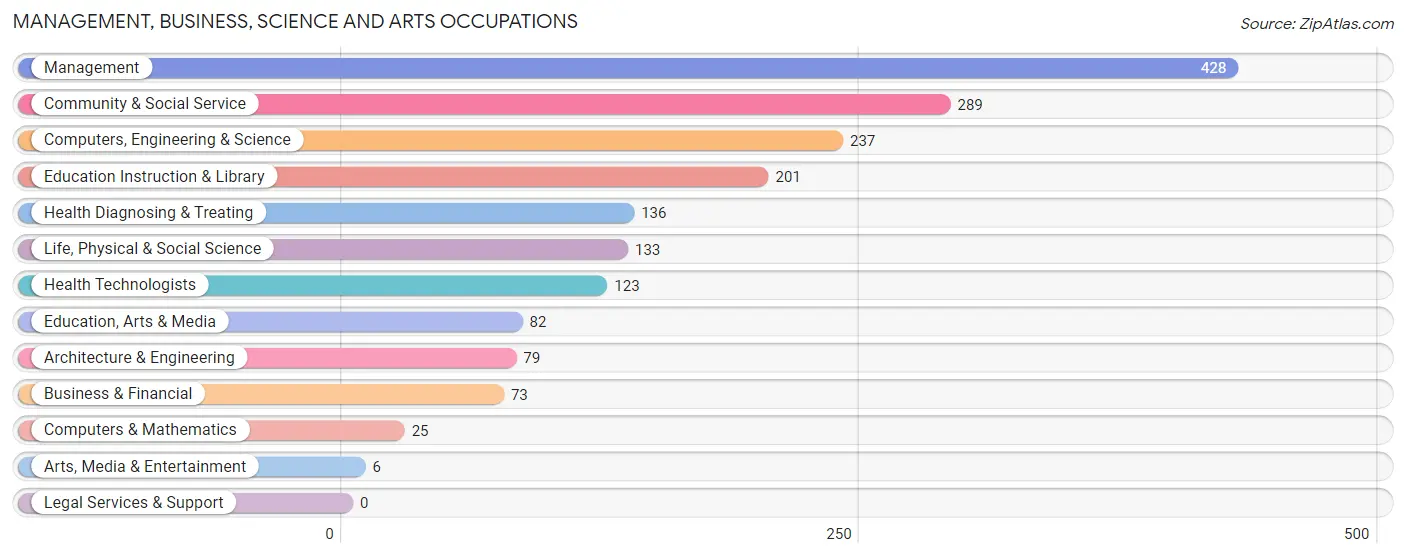
Management, Business, Science and Arts Occupations
The most common Management, Business, Science and Arts occupations in Snyder are Management (428 | 8.4%), Community & Social Service (289 | 5.7%), Computers, Engineering & Science (237 | 4.7%), Education Instruction & Library (201 | 4.0%), and Health Diagnosing & Treating (136 | 2.7%).
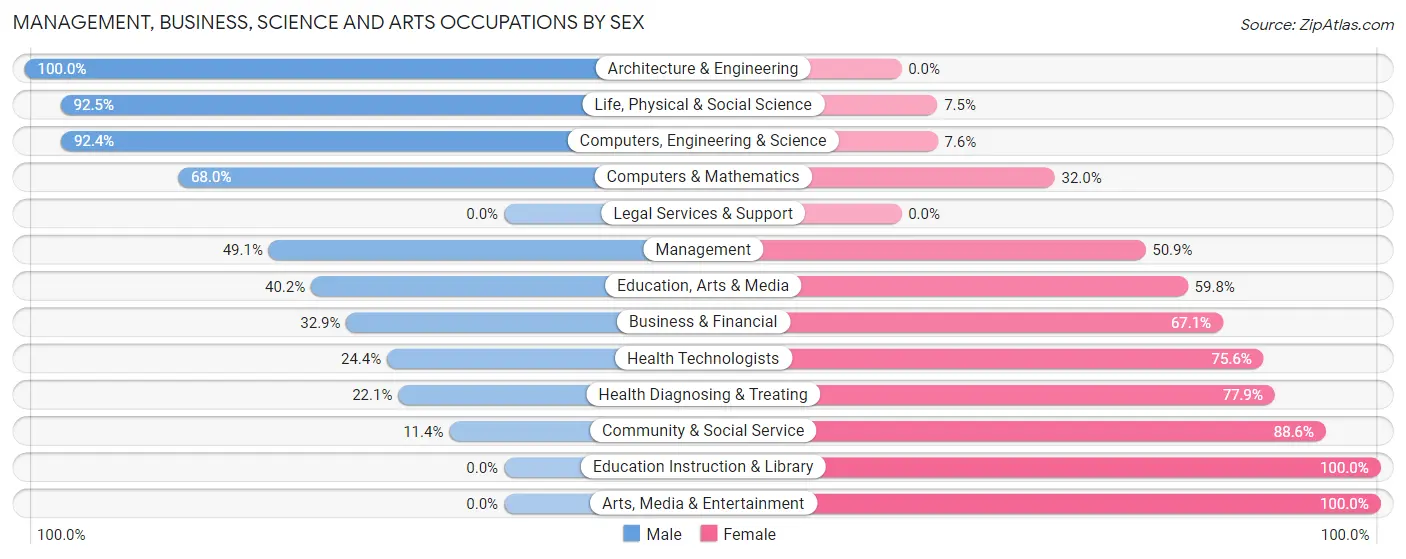
Management, Business, Science and Arts Occupations by Sex
Within the Management, Business, Science and Arts occupations in Snyder, the most male-oriented occupations are Architecture & Engineering (100.0%), Life, Physical & Social Science (92.5%), and Computers, Engineering & Science (92.4%), while the most female-oriented occupations are Education Instruction & Library (100.0%), Arts, Media & Entertainment (100.0%), and Community & Social Service (88.6%).
| Occupation | Male | Female |
| Management | 210 (49.1%) | 218 (50.9%) |
| Business & Financial | 24 (32.9%) | 49 (67.1%) |
| Computers, Engineering & Science | 219 (92.4%) | 18 (7.6%) |
| Computers & Mathematics | 17 (68.0%) | 8 (32.0%) |
| Architecture & Engineering | 79 (100.0%) | 0 (0.0%) |
| Life, Physical & Social Science | 123 (92.5%) | 10 (7.5%) |
| Community & Social Service | 33 (11.4%) | 256 (88.6%) |
| Education, Arts & Media | 33 (40.2%) | 49 (59.8%) |
| Legal Services & Support | 0 (0.0%) | 0 (0.0%) |
| Education Instruction & Library | 0 (0.0%) | 201 (100.0%) |
| Arts, Media & Entertainment | 0 (0.0%) | 6 (100.0%) |
| Health Diagnosing & Treating | 30 (22.1%) | 106 (77.9%) |
| Health Technologists | 30 (24.4%) | 93 (75.6%) |
| Total (Category) | 516 (44.4%) | 647 (55.6%) |
| Total (Overall) | 2,927 (57.5%) | 2,161 (42.5%) |
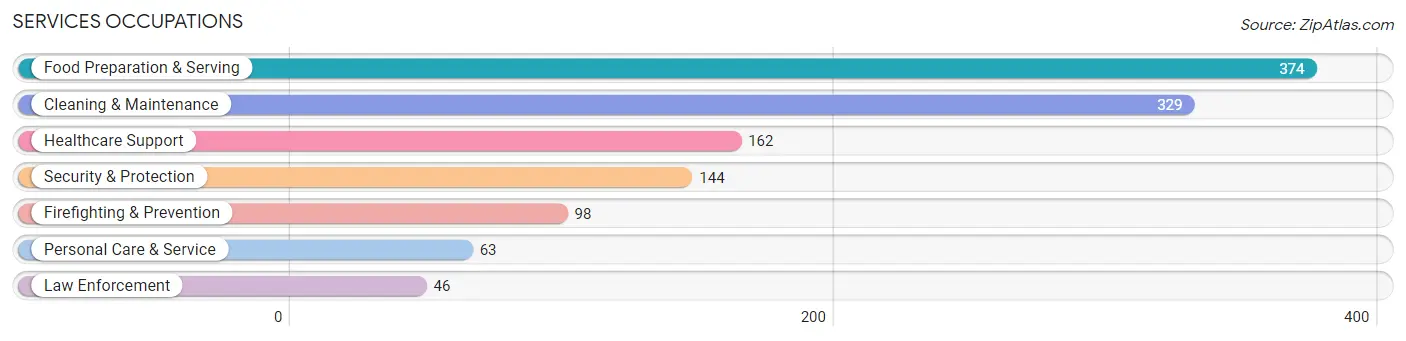
Services Occupations
The most common Services occupations in Snyder are Food Preparation & Serving (374 | 7.3%), Cleaning & Maintenance (329 | 6.5%), Healthcare Support (162 | 3.2%), Security & Protection (144 | 2.8%), and Firefighting & Prevention (98 | 1.9%).
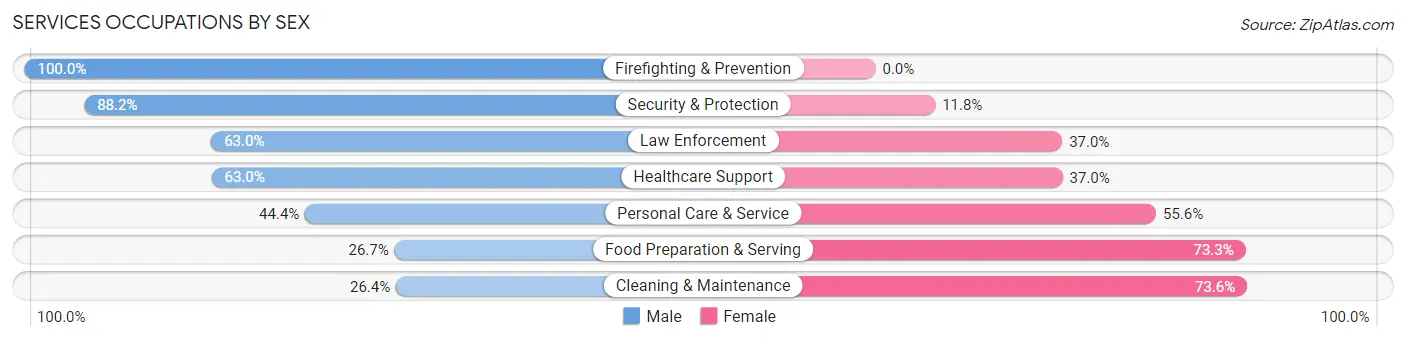
Services Occupations by Sex
Within the Services occupations in Snyder, the most male-oriented occupations are Firefighting & Prevention (100.0%), Security & Protection (88.2%), and Law Enforcement (63.0%), while the most female-oriented occupations are Cleaning & Maintenance (73.6%), Food Preparation & Serving (73.3%), and Personal Care & Service (55.6%).
| Occupation | Male | Female |
| Healthcare Support | 102 (63.0%) | 60 (37.0%) |
| Security & Protection | 127 (88.2%) | 17 (11.8%) |
| Firefighting & Prevention | 98 (100.0%) | 0 (0.0%) |
| Law Enforcement | 29 (63.0%) | 17 (37.0%) |
| Food Preparation & Serving | 100 (26.7%) | 274 (73.3%) |
| Cleaning & Maintenance | 87 (26.4%) | 242 (73.6%) |
| Personal Care & Service | 28 (44.4%) | 35 (55.6%) |
| Total (Category) | 444 (41.4%) | 628 (58.6%) |
| Total (Overall) | 2,927 (57.5%) | 2,161 (42.5%) |
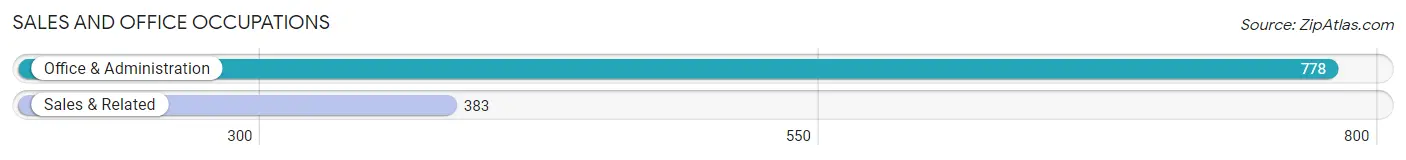
Sales and Office Occupations
The most common Sales and Office occupations in Snyder are Office & Administration (778 | 15.3%), and Sales & Related (383 | 7.5%).
Sales and Office Occupations by Sex
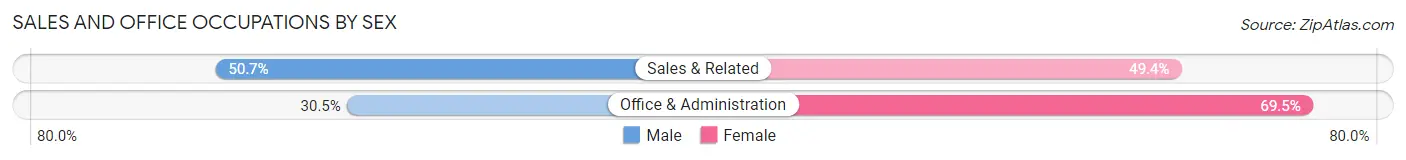
| Occupation | Male | Female |
| Sales & Related | 194 (50.6%) | 189 (49.3%) |
| Office & Administration | 237 (30.5%) | 541 (69.5%) |
| Total (Category) | 431 (37.1%) | 730 (62.9%) |
| Total (Overall) | 2,927 (57.5%) | 2,161 (42.5%) |
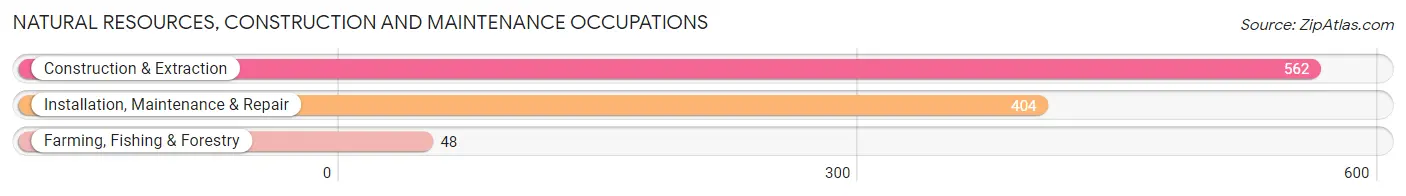
Natural Resources, Construction and Maintenance Occupations
The most common Natural Resources, Construction and Maintenance occupations in Snyder are Construction & Extraction (562 | 11.1%), Installation, Maintenance & Repair (404 | 7.9%), and Farming, Fishing & Forestry (48 | 0.9%).
Natural Resources, Construction and Maintenance Occupations by Sex
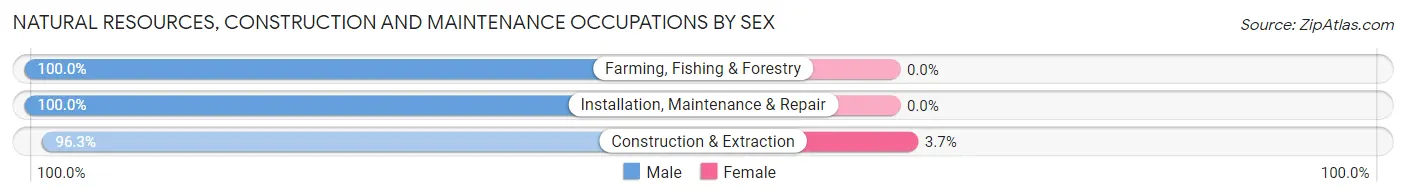
| Occupation | Male | Female |
| Farming, Fishing & Forestry | 48 (100.0%) | 0 (0.0%) |
| Construction & Extraction | 541 (96.3%) | 21 (3.7%) |
| Installation, Maintenance & Repair | 404 (100.0%) | 0 (0.0%) |
| Total (Category) | 993 (97.9%) | 21 (2.1%) |
| Total (Overall) | 2,927 (57.5%) | 2,161 (42.5%) |
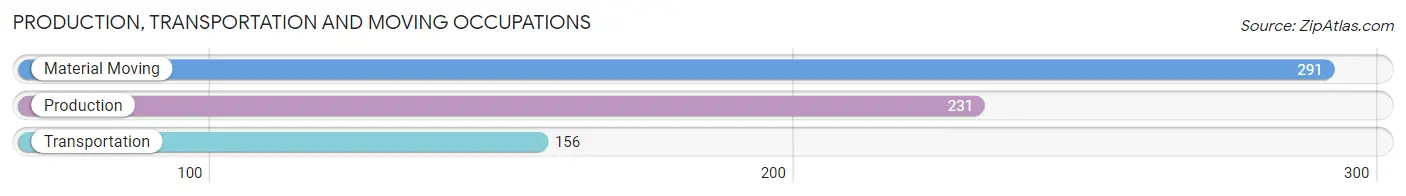
Production, Transportation and Moving Occupations
The most common Production, Transportation and Moving occupations in Snyder are Material Moving (291 | 5.7%), Production (231 | 4.5%), and Transportation (156 | 3.1%).
Production, Transportation and Moving Occupations by Sex
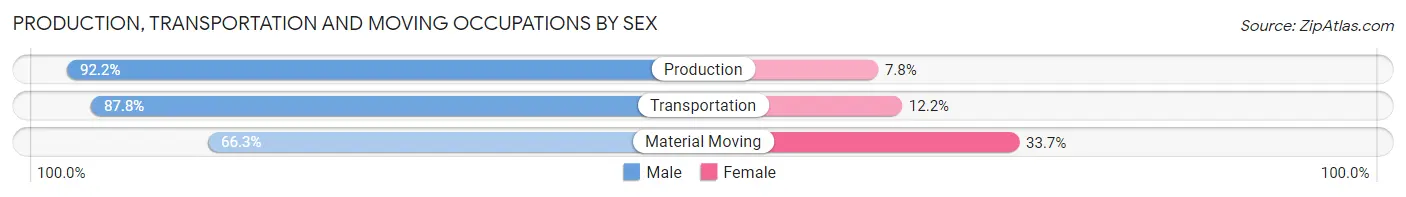
| Occupation | Male | Female |
| Production | 213 (92.2%) | 18 (7.8%) |
| Transportation | 137 (87.8%) | 19 (12.2%) |
| Material Moving | 193 (66.3%) | 98 (33.7%) |
| Total (Category) | 543 (80.1%) | 135 (19.9%) |
| Total (Overall) | 2,927 (57.5%) | 2,161 (42.5%) |
Employment Industries by Sex in Snyder
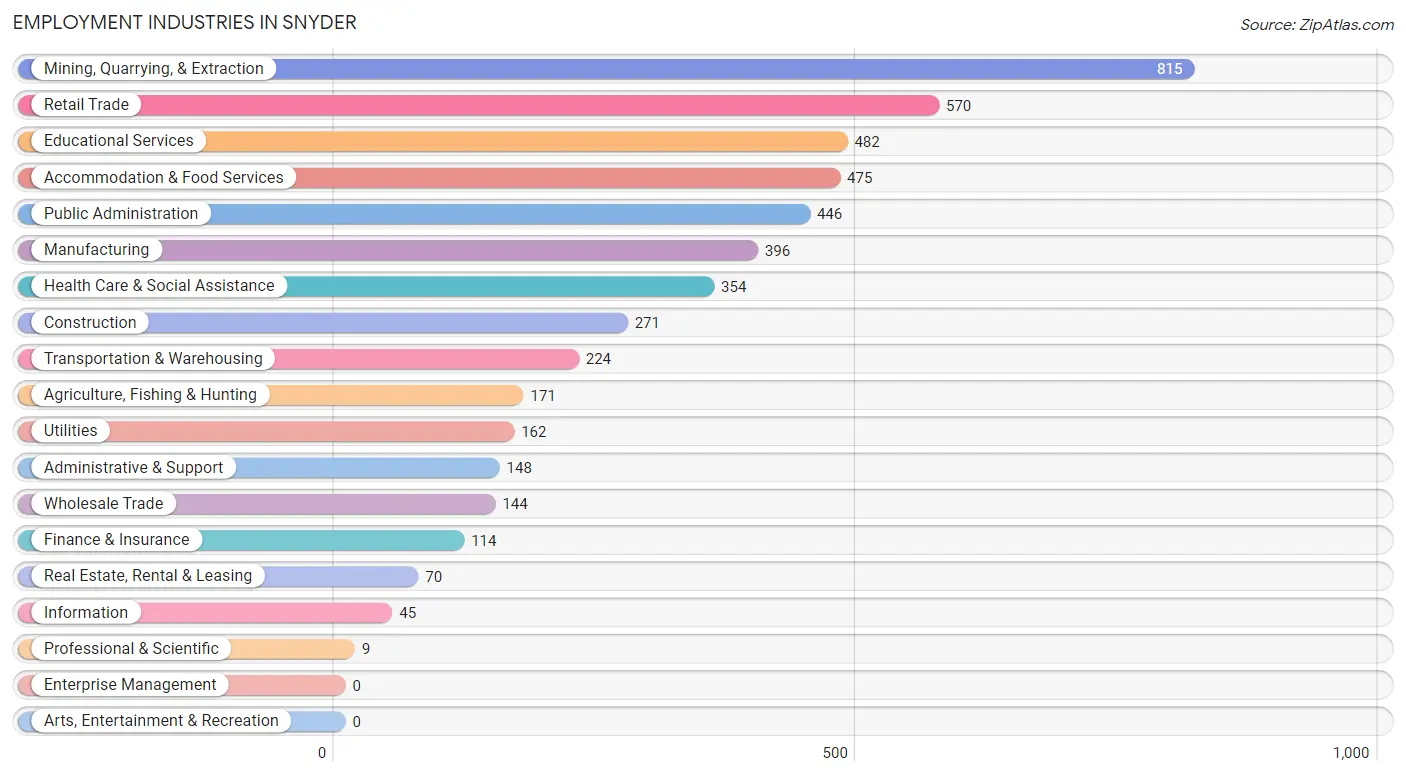
Employment Industries in Snyder
The major employment industries in Snyder include Mining, Quarrying, & Extraction (815 | 16.0%), Retail Trade (570 | 11.2%), Educational Services (482 | 9.5%), Accommodation & Food Services (475 | 9.3%), and Public Administration (446 | 8.8%).
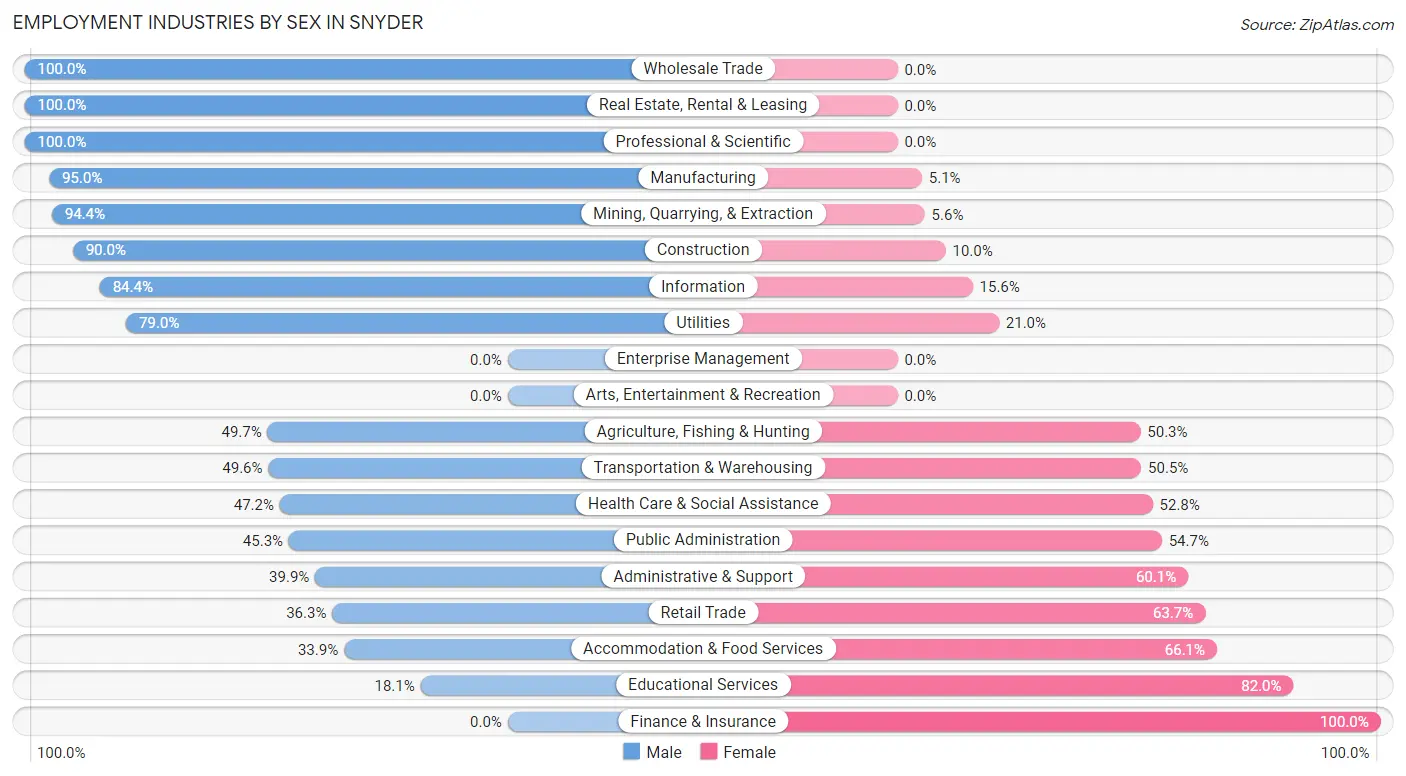
Employment Industries by Sex in Snyder
The Snyder industries that see more men than women are Wholesale Trade (100.0%), Real Estate, Rental & Leasing (100.0%), and Professional & Scientific (100.0%), whereas the industries that tend to have a higher number of women are Finance & Insurance (100.0%), Educational Services (82.0%), and Accommodation & Food Services (66.1%).
| Industry | Male | Female |
| Agriculture, Fishing & Hunting | 85 (49.7%) | 86 (50.3%) |
| Mining, Quarrying, & Extraction | 769 (94.4%) | 46 (5.6%) |
| Construction | 244 (90.0%) | 27 (10.0%) |
| Manufacturing | 376 (95.0%) | 20 (5.1%) |
| Wholesale Trade | 144 (100.0%) | 0 (0.0%) |
| Retail Trade | 207 (36.3%) | 363 (63.7%) |
| Transportation & Warehousing | 111 (49.5%) | 113 (50.4%) |
| Utilities | 128 (79.0%) | 34 (21.0%) |
| Information | 38 (84.4%) | 7 (15.6%) |
| Finance & Insurance | 0 (0.0%) | 114 (100.0%) |
| Real Estate, Rental & Leasing | 70 (100.0%) | 0 (0.0%) |
| Professional & Scientific | 9 (100.0%) | 0 (0.0%) |
| Enterprise Management | 0 (0.0%) | 0 (0.0%) |
| Administrative & Support | 59 (39.9%) | 89 (60.1%) |
| Educational Services | 87 (18.0%) | 395 (82.0%) |
| Health Care & Social Assistance | 167 (47.2%) | 187 (52.8%) |
| Arts, Entertainment & Recreation | 0 (0.0%) | 0 (0.0%) |
| Accommodation & Food Services | 161 (33.9%) | 314 (66.1%) |
| Public Administration | 202 (45.3%) | 244 (54.7%) |
| Total | 2,927 (57.5%) | 2,161 (42.5%) |
Education in Snyder
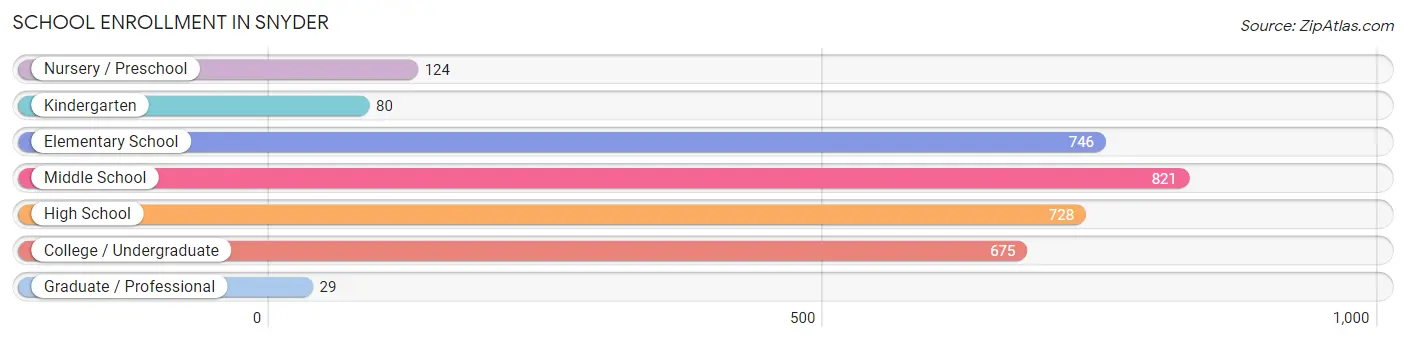
School Enrollment in Snyder
The most common levels of schooling among the 3,203 students in Snyder are middle school (821 | 25.6%), elementary school (746 | 23.3%), and high school (728 | 22.7%).
| School Level | # Students | % Students |
| Nursery / Preschool | 124 | 3.9% |
| Kindergarten | 80 | 2.5% |
| Elementary School | 746 | 23.3% |
| Middle School | 821 | 25.6% |
| High School | 728 | 22.7% |
| College / Undergraduate | 675 | 21.1% |
| Graduate / Professional | 29 | 0.9% |
| Total | 3,203 | 100.0% |
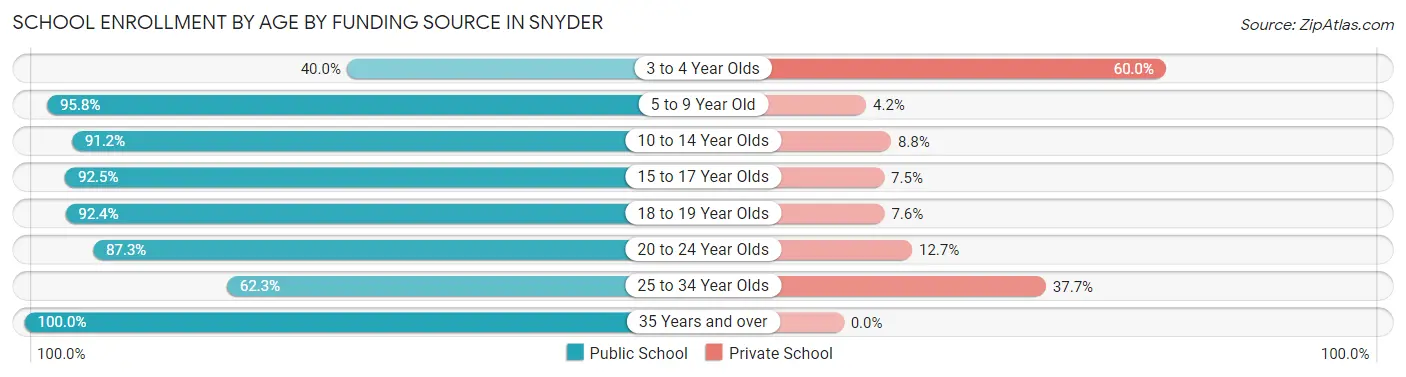
School Enrollment by Age by Funding Source in Snyder
Out of a total of 3,203 students who are enrolled in schools in Snyder, 349 (10.9%) attend a private institution, while the remaining 2,854 (89.1%) are enrolled in public schools. The age group of 3 to 4 year olds has the highest likelihood of being enrolled in private schools, with 27 (60.0% in the age bracket) enrolled. Conversely, the age group of 35 years and over has the lowest likelihood of being enrolled in a private school, with 26 (100.0% in the age bracket) attending a public institution.
| Age Bracket | Public School | Private School |
| 3 to 4 Year Olds | 18 (40.0%) | 27 (60.0%) |
| 5 to 9 Year Old | 711 (95.8%) | 31 (4.2%) |
| 10 to 14 Year Olds | 963 (91.2%) | 93 (8.8%) |
| 15 to 17 Year Olds | 429 (92.5%) | 35 (7.5%) |
| 18 to 19 Year Olds | 389 (92.4%) | 32 (7.6%) |
| 20 to 24 Year Olds | 137 (87.3%) | 20 (12.7%) |
| 25 to 34 Year Olds | 182 (62.3%) | 110 (37.7%) |
| 35 Years and over | 26 (100.0%) | 0 (0.0%) |
| Total | 2,854 (89.1%) | 349 (10.9%) |
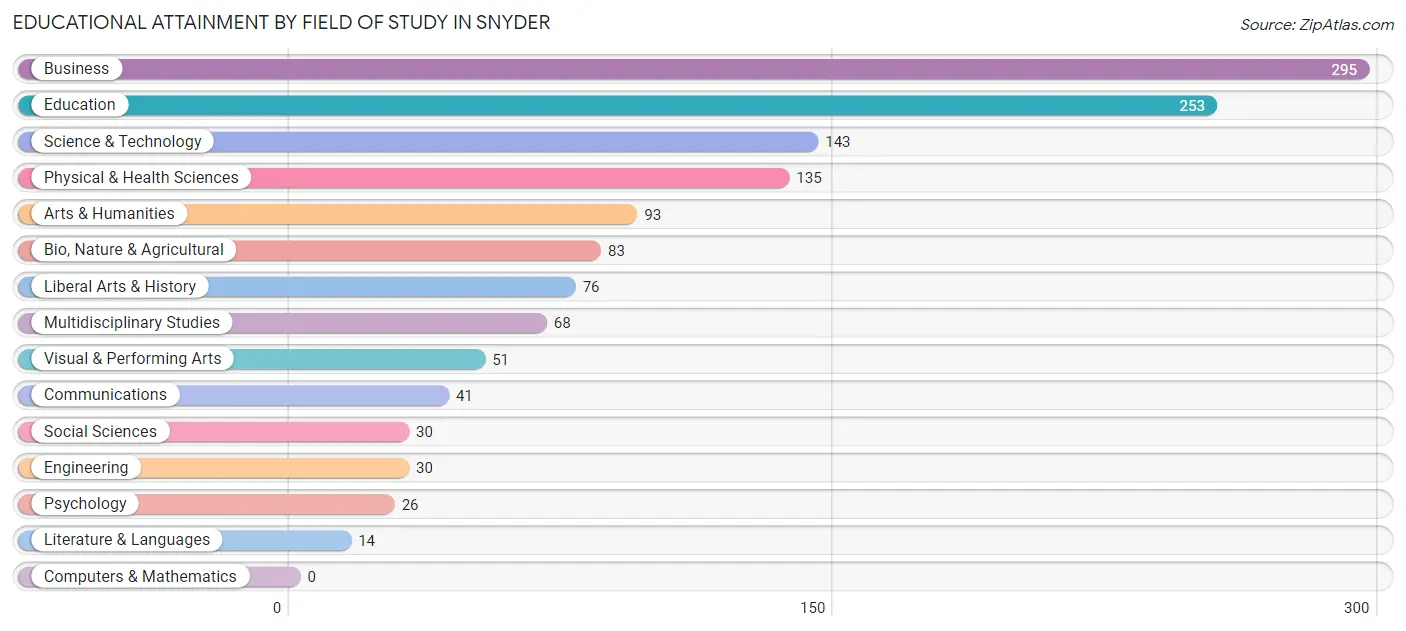
Educational Attainment by Field of Study in Snyder
Business (295 | 22.1%), education (253 | 18.9%), science & technology (143 | 10.7%), physical & health sciences (135 | 10.1%), and arts & humanities (93 | 7.0%) are the most common fields of study among 1,338 individuals in Snyder who have obtained a bachelor's degree or higher.
| Field of Study | # Graduates | % Graduates |
| Computers & Mathematics | 0 | 0.0% |
| Bio, Nature & Agricultural | 83 | 6.2% |
| Physical & Health Sciences | 135 | 10.1% |
| Psychology | 26 | 1.9% |
| Social Sciences | 30 | 2.2% |
| Engineering | 30 | 2.2% |
| Multidisciplinary Studies | 68 | 5.1% |
| Science & Technology | 143 | 10.7% |
| Business | 295 | 22.1% |
| Education | 253 | 18.9% |
| Literature & Languages | 14 | 1.1% |
| Liberal Arts & History | 76 | 5.7% |
| Visual & Performing Arts | 51 | 3.8% |
| Communications | 41 | 3.1% |
| Arts & Humanities | 93 | 7.0% |
| Total | 1,338 | 100.0% |
Transportation & Commute in Snyder
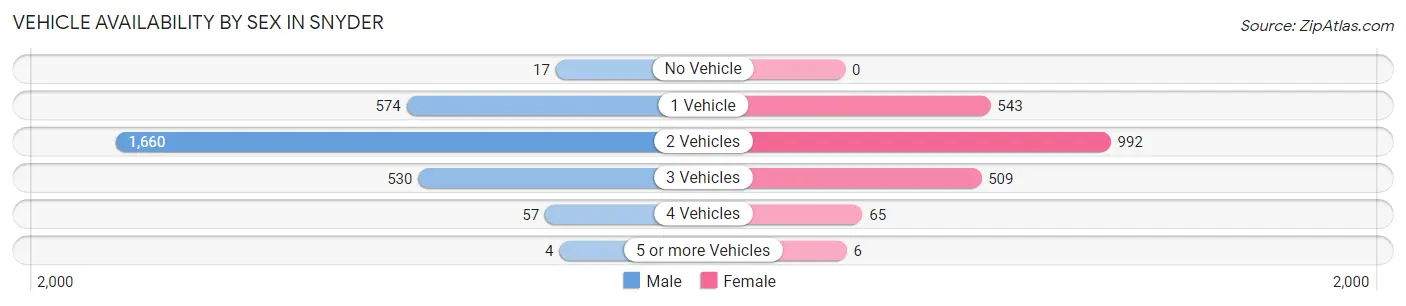
Vehicle Availability by Sex in Snyder
The most prevalent vehicle ownership categories in Snyder are males with 2 vehicles (1,660, accounting for 58.4%) and females with 2 vehicles (992, making up 78.5%).
| Vehicles Available | Male | Female |
| No Vehicle | 17 (0.6%) | 0 (0.0%) |
| 1 Vehicle | 574 (20.2%) | 543 (25.7%) |
| 2 Vehicles | 1,660 (58.4%) | 992 (46.9%) |
| 3 Vehicles | 530 (18.6%) | 509 (24.1%) |
| 4 Vehicles | 57 (2.0%) | 65 (3.1%) |
| 5 or more Vehicles | 4 (0.1%) | 6 (0.3%) |
| Total | 2,842 (100.0%) | 2,115 (100.0%) |
Commute Time in Snyder
The most frequently occuring commute durations in Snyder are 5 to 9 minutes (2,027 commuters, 41.2%), 10 to 14 minutes (1,256 commuters, 25.5%), and 15 to 19 minutes (741 commuters, 15.0%).
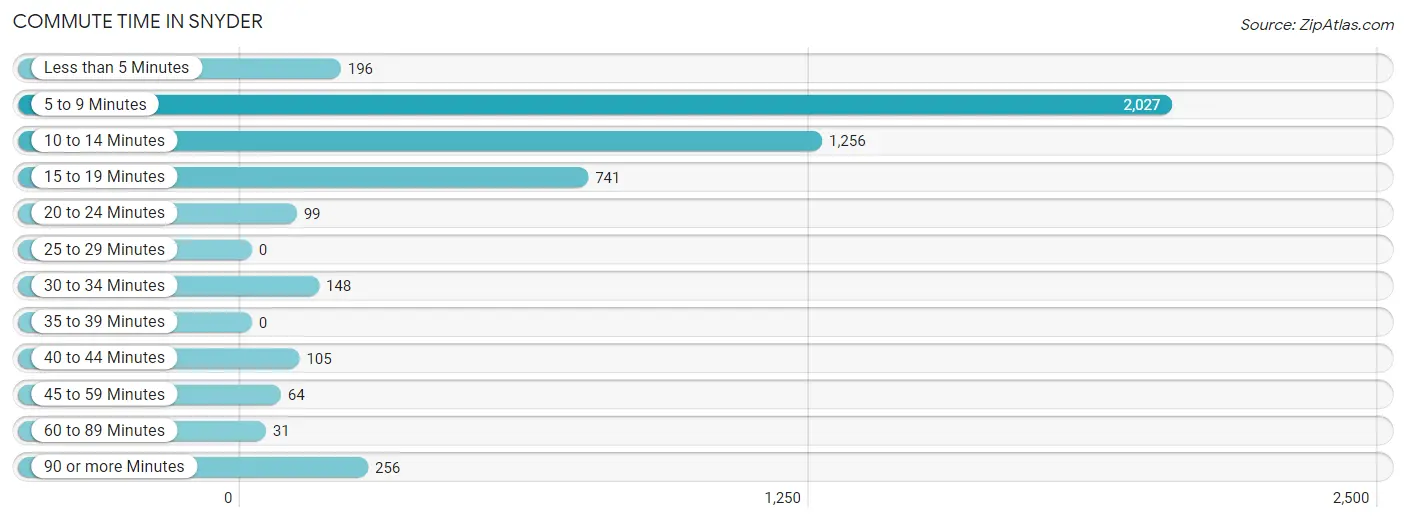
| Commute Time | # Commuters | % Commuters |
| Less than 5 Minutes | 196 | 4.0% |
| 5 to 9 Minutes | 2,027 | 41.2% |
| 10 to 14 Minutes | 1,256 | 25.5% |
| 15 to 19 Minutes | 741 | 15.0% |
| 20 to 24 Minutes | 99 | 2.0% |
| 25 to 29 Minutes | 0 | 0.0% |
| 30 to 34 Minutes | 148 | 3.0% |
| 35 to 39 Minutes | 0 | 0.0% |
| 40 to 44 Minutes | 105 | 2.1% |
| 45 to 59 Minutes | 64 | 1.3% |
| 60 to 89 Minutes | 31 | 0.6% |
| 90 or more Minutes | 256 | 5.2% |
Commute Time by Sex in Snyder
The most common commute times in Snyder are 5 to 9 minutes (970 commuters, 33.8%) for males and 5 to 9 minutes (1,057 commuters, 51.6%) for females.
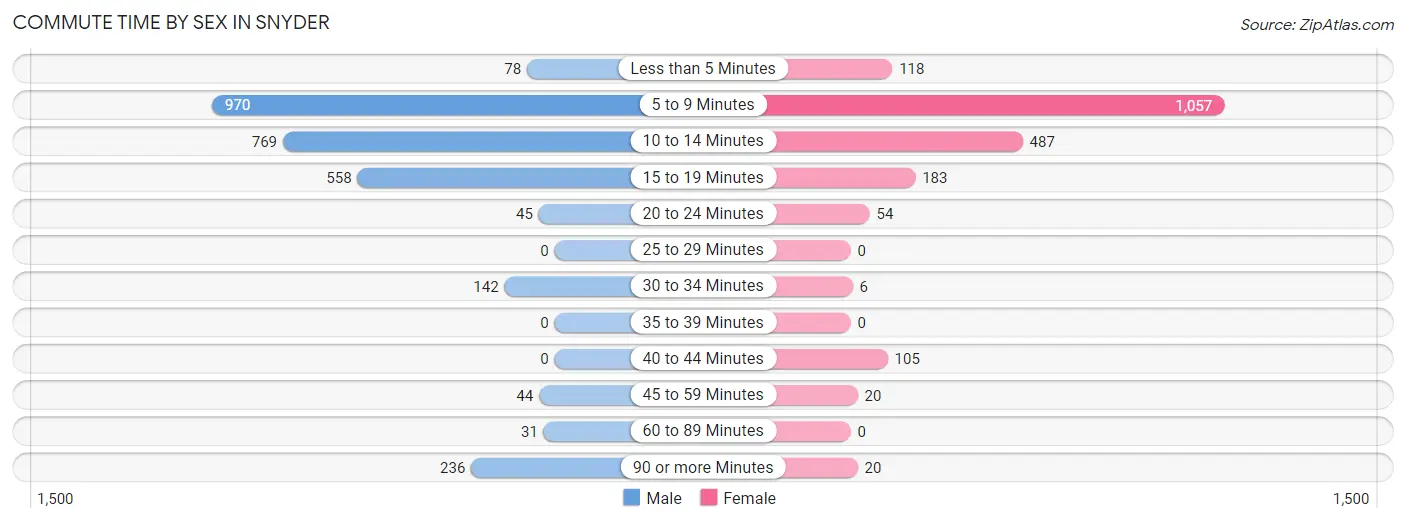
| Commute Time | Male | Female |
| Less than 5 Minutes | 78 (2.7%) | 118 (5.8%) |
| 5 to 9 Minutes | 970 (33.8%) | 1,057 (51.6%) |
| 10 to 14 Minutes | 769 (26.8%) | 487 (23.8%) |
| 15 to 19 Minutes | 558 (19.4%) | 183 (8.9%) |
| 20 to 24 Minutes | 45 (1.6%) | 54 (2.6%) |
| 25 to 29 Minutes | 0 (0.0%) | 0 (0.0%) |
| 30 to 34 Minutes | 142 (4.9%) | 6 (0.3%) |
| 35 to 39 Minutes | 0 (0.0%) | 0 (0.0%) |
| 40 to 44 Minutes | 0 (0.0%) | 105 (5.1%) |
| 45 to 59 Minutes | 44 (1.5%) | 20 (1.0%) |
| 60 to 89 Minutes | 31 (1.1%) | 0 (0.0%) |
| 90 or more Minutes | 236 (8.2%) | 20 (1.0%) |
Time of Departure to Work by Sex in Snyder
The most frequent times of departure to work in Snyder are 6:30 AM to 6:59 AM (505, 17.6%) for males and 7:30 AM to 7:59 AM (411, 20.1%) for females.
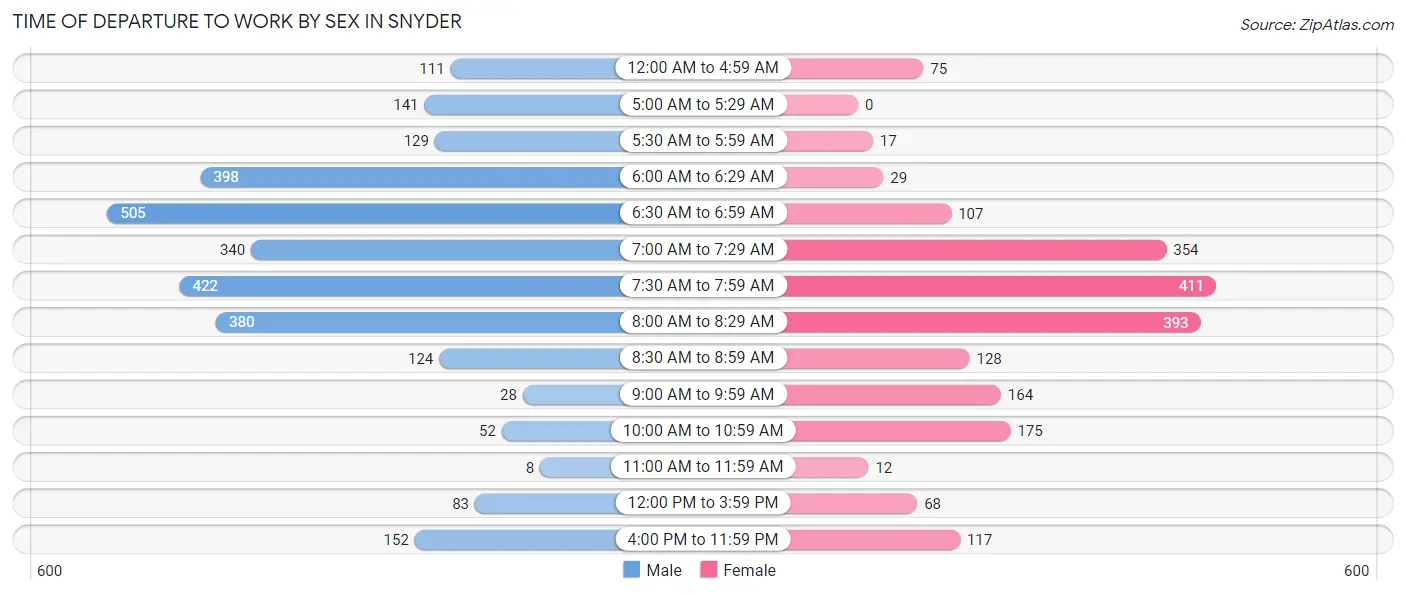
| Time of Departure | Male | Female |
| 12:00 AM to 4:59 AM | 111 (3.9%) | 75 (3.7%) |
| 5:00 AM to 5:29 AM | 141 (4.9%) | 0 (0.0%) |
| 5:30 AM to 5:59 AM | 129 (4.5%) | 17 (0.8%) |
| 6:00 AM to 6:29 AM | 398 (13.9%) | 29 (1.4%) |
| 6:30 AM to 6:59 AM | 505 (17.6%) | 107 (5.2%) |
| 7:00 AM to 7:29 AM | 340 (11.8%) | 354 (17.3%) |
| 7:30 AM to 7:59 AM | 422 (14.7%) | 411 (20.1%) |
| 8:00 AM to 8:29 AM | 380 (13.2%) | 393 (19.2%) |
| 8:30 AM to 8:59 AM | 124 (4.3%) | 128 (6.2%) |
| 9:00 AM to 9:59 AM | 28 (1.0%) | 164 (8.0%) |
| 10:00 AM to 10:59 AM | 52 (1.8%) | 175 (8.5%) |
| 11:00 AM to 11:59 AM | 8 (0.3%) | 12 (0.6%) |
| 12:00 PM to 3:59 PM | 83 (2.9%) | 68 (3.3%) |
| 4:00 PM to 11:59 PM | 152 (5.3%) | 117 (5.7%) |
| Total | 2,873 (100.0%) | 2,050 (100.0%) |
Housing Occupancy in Snyder
Occupancy by Ownership in Snyder
Of the total 4,082 dwellings in Snyder, owner-occupied units account for 3,119 (76.4%), while renter-occupied units make up 963 (23.6%).
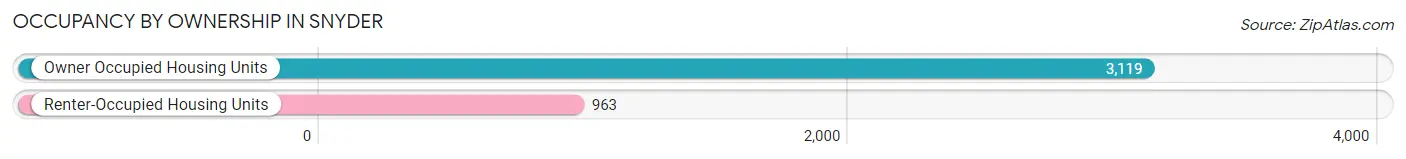
| Occupancy | # Housing Units | % Housing Units |
| Owner Occupied Housing Units | 3,119 | 76.4% |
| Renter-Occupied Housing Units | 963 | 23.6% |
| Total Occupied Housing Units | 4,082 | 100.0% |
Occupancy by Household Size in Snyder
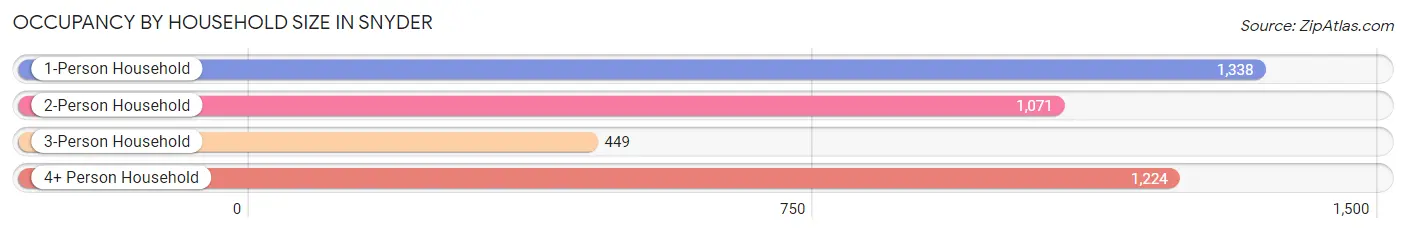
| Household Size | # Housing Units | % Housing Units |
| 1-Person Household | 1,338 | 32.8% |
| 2-Person Household | 1,071 | 26.2% |
| 3-Person Household | 449 | 11.0% |
| 4+ Person Household | 1,224 | 30.0% |
| Total Housing Units | 4,082 | 100.0% |
Occupancy by Ownership by Household Size in Snyder
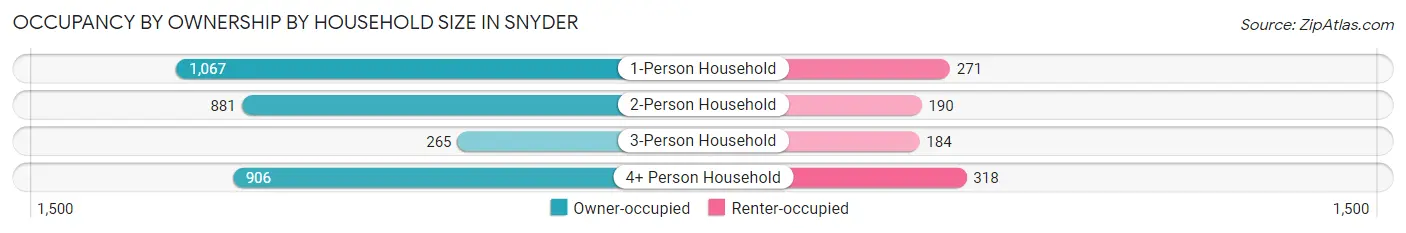
| Household Size | Owner-occupied | Renter-occupied |
| 1-Person Household | 1,067 (79.7%) | 271 (20.3%) |
| 2-Person Household | 881 (82.3%) | 190 (17.7%) |
| 3-Person Household | 265 (59.0%) | 184 (41.0%) |
| 4+ Person Household | 906 (74.0%) | 318 (26.0%) |
| Total Housing Units | 3,119 (76.4%) | 963 (23.6%) |
Occupancy by Educational Attainment in Snyder
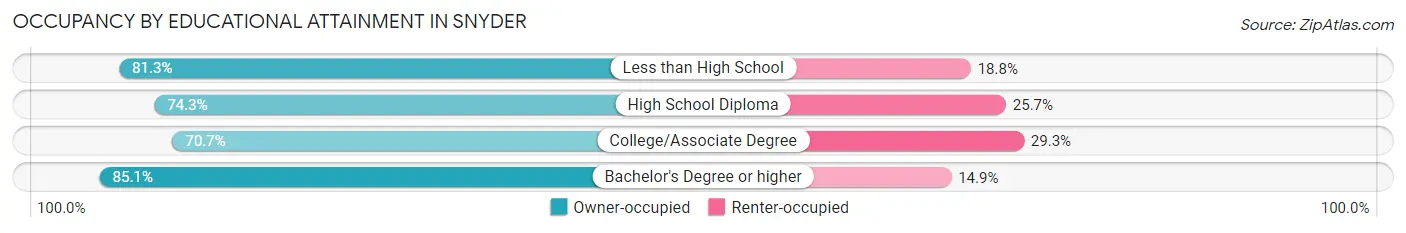
| Household Size | Owner-occupied | Renter-occupied |
| Less than High School | 351 (81.2%) | 81 (18.8%) |
| High School Diploma | 948 (74.3%) | 328 (25.7%) |
| College/Associate Degree | 985 (70.7%) | 408 (29.3%) |
| Bachelor's Degree or higher | 835 (85.1%) | 146 (14.9%) |
Occupancy by Age of Householder in Snyder
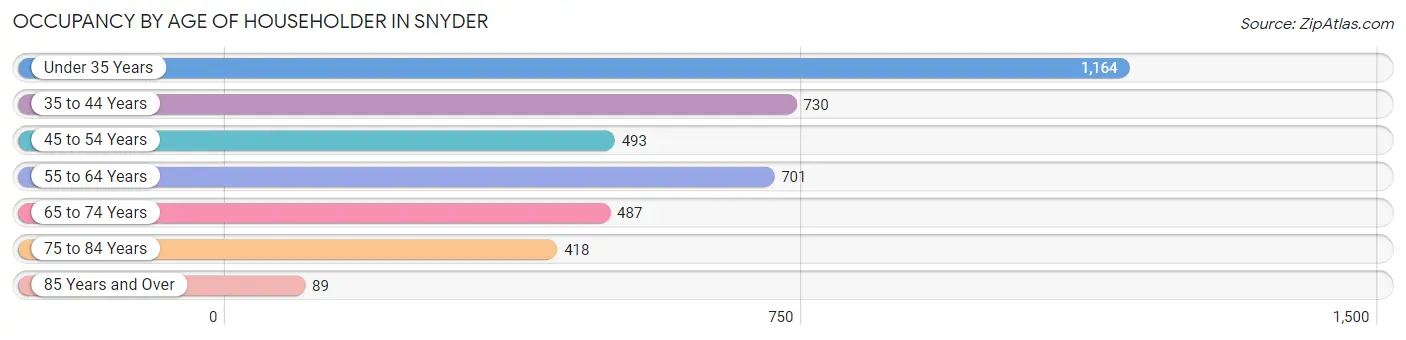
| Age Bracket | # Households | % Households |
| Under 35 Years | 1,164 | 28.5% |
| 35 to 44 Years | 730 | 17.9% |
| 45 to 54 Years | 493 | 12.1% |
| 55 to 64 Years | 701 | 17.2% |
| 65 to 74 Years | 487 | 11.9% |
| 75 to 84 Years | 418 | 10.2% |
| 85 Years and Over | 89 | 2.2% |
| Total | 4,082 | 100.0% |
Housing Finances in Snyder
Median Income by Occupancy in Snyder
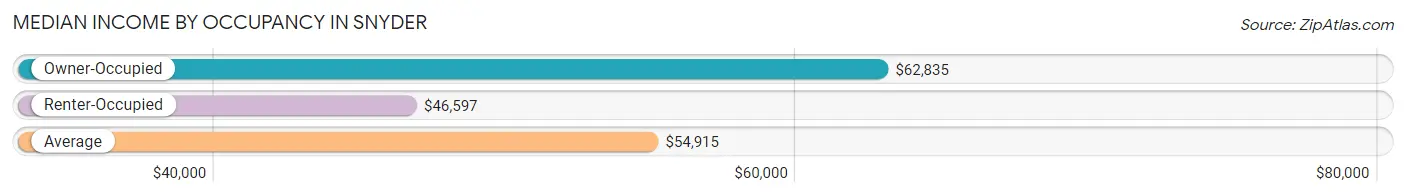
| Occupancy Type | # Households | Median Income |
| Owner-Occupied | 3,119 (76.4%) | $62,835 |
| Renter-Occupied | 963 (23.6%) | $46,597 |
| Average | 4,082 (100.0%) | $54,915 |
Occupancy by Householder Income Bracket in Snyder
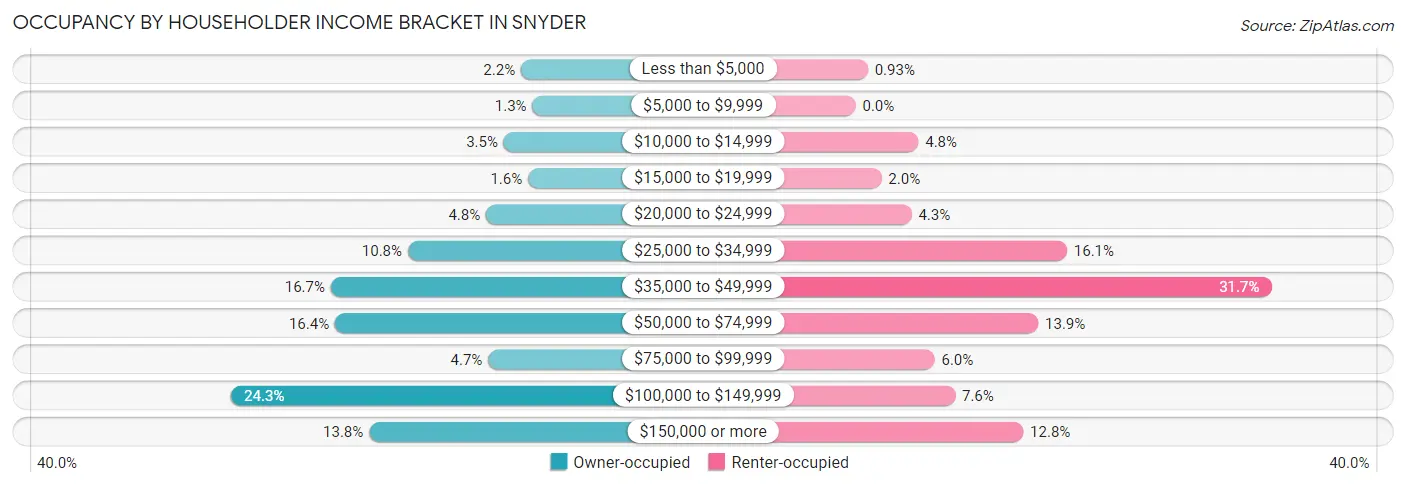
| Income Bracket | Owner-occupied | Renter-occupied |
| Less than $5,000 | 68 (2.2%) | 9 (0.9%) |
| $5,000 to $9,999 | 41 (1.3%) | 0 (0.0%) |
| $10,000 to $14,999 | 109 (3.5%) | 46 (4.8%) |
| $15,000 to $19,999 | 51 (1.6%) | 19 (2.0%) |
| $20,000 to $24,999 | 151 (4.8%) | 41 (4.3%) |
| $25,000 to $34,999 | 337 (10.8%) | 155 (16.1%) |
| $35,000 to $49,999 | 520 (16.7%) | 305 (31.7%) |
| $50,000 to $74,999 | 510 (16.4%) | 134 (13.9%) |
| $75,000 to $99,999 | 146 (4.7%) | 58 (6.0%) |
| $100,000 to $149,999 | 757 (24.3%) | 73 (7.6%) |
| $150,000 or more | 429 (13.8%) | 123 (12.8%) |
| Total | 3,119 (100.0%) | 963 (100.0%) |
Monthly Housing Cost Tiers in Snyder
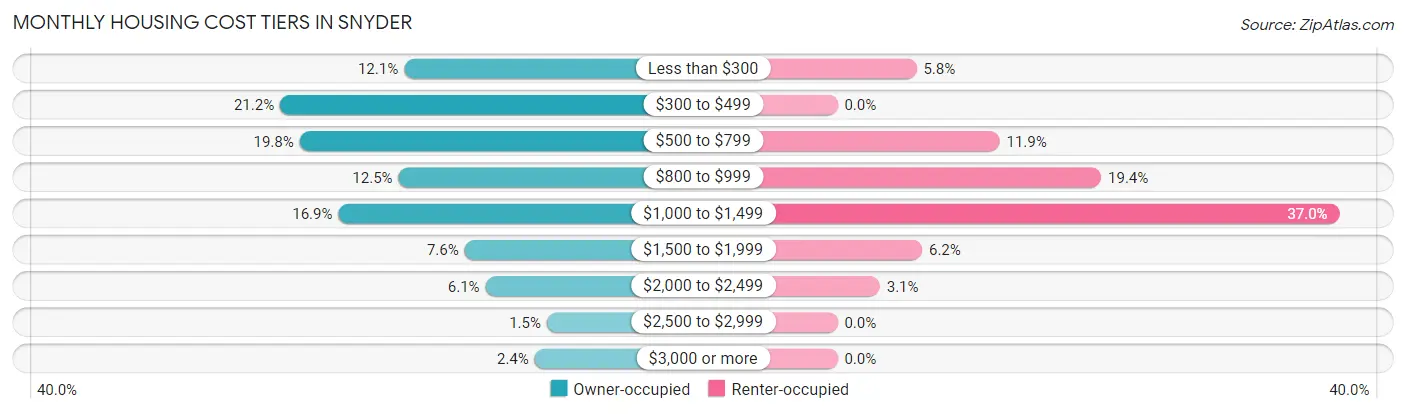
| Monthly Cost | Owner-occupied | Renter-occupied |
| Less than $300 | 376 (12.1%) | 56 (5.8%) |
| $300 to $499 | 661 (21.2%) | 0 (0.0%) |
| $500 to $799 | 616 (19.8%) | 115 (11.9%) |
| $800 to $999 | 389 (12.5%) | 187 (19.4%) |
| $1,000 to $1,499 | 527 (16.9%) | 356 (37.0%) |
| $1,500 to $1,999 | 237 (7.6%) | 60 (6.2%) |
| $2,000 to $2,499 | 189 (6.1%) | 30 (3.1%) |
| $2,500 to $2,999 | 48 (1.5%) | 0 (0.0%) |
| $3,000 or more | 76 (2.4%) | 0 (0.0%) |
| Total | 3,119 (100.0%) | 963 (100.0%) |
Physical Housing Characteristics in Snyder
Housing Structures in Snyder
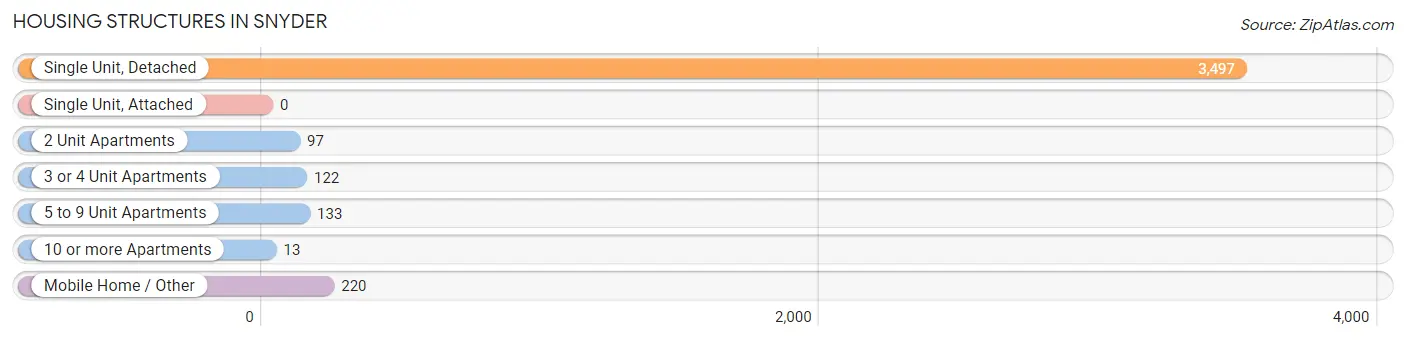
| Structure Type | # Housing Units | % Housing Units |
| Single Unit, Detached | 3,497 | 85.7% |
| Single Unit, Attached | 0 | 0.0% |
| 2 Unit Apartments | 97 | 2.4% |
| 3 or 4 Unit Apartments | 122 | 3.0% |
| 5 to 9 Unit Apartments | 133 | 3.3% |
| 10 or more Apartments | 13 | 0.3% |
| Mobile Home / Other | 220 | 5.4% |
| Total | 4,082 | 100.0% |
Housing Structures by Occupancy in Snyder
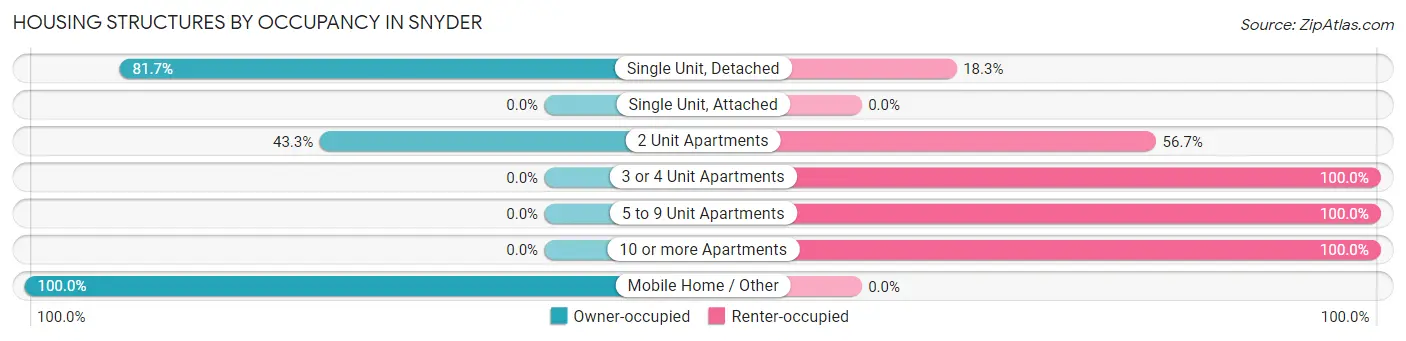
| Structure Type | Owner-occupied | Renter-occupied |
| Single Unit, Detached | 2,857 (81.7%) | 640 (18.3%) |
| Single Unit, Attached | 0 (0.0%) | 0 (0.0%) |
| 2 Unit Apartments | 42 (43.3%) | 55 (56.7%) |
| 3 or 4 Unit Apartments | 0 (0.0%) | 122 (100.0%) |
| 5 to 9 Unit Apartments | 0 (0.0%) | 133 (100.0%) |
| 10 or more Apartments | 0 (0.0%) | 13 (100.0%) |
| Mobile Home / Other | 220 (100.0%) | 0 (0.0%) |
| Total | 3,119 (76.4%) | 963 (23.6%) |
Housing Structures by Number of Rooms in Snyder
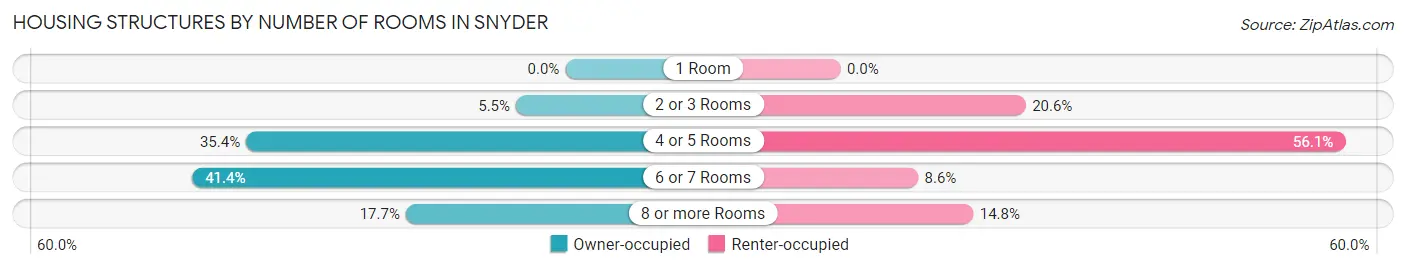
| Number of Rooms | Owner-occupied | Renter-occupied |
| 1 Room | 0 (0.0%) | 0 (0.0%) |
| 2 or 3 Rooms | 171 (5.5%) | 198 (20.6%) |
| 4 or 5 Rooms | 1,105 (35.4%) | 540 (56.1%) |
| 6 or 7 Rooms | 1,291 (41.4%) | 83 (8.6%) |
| 8 or more Rooms | 552 (17.7%) | 142 (14.7%) |
| Total | 3,119 (100.0%) | 963 (100.0%) |
Housing Structure by Heating Type in Snyder
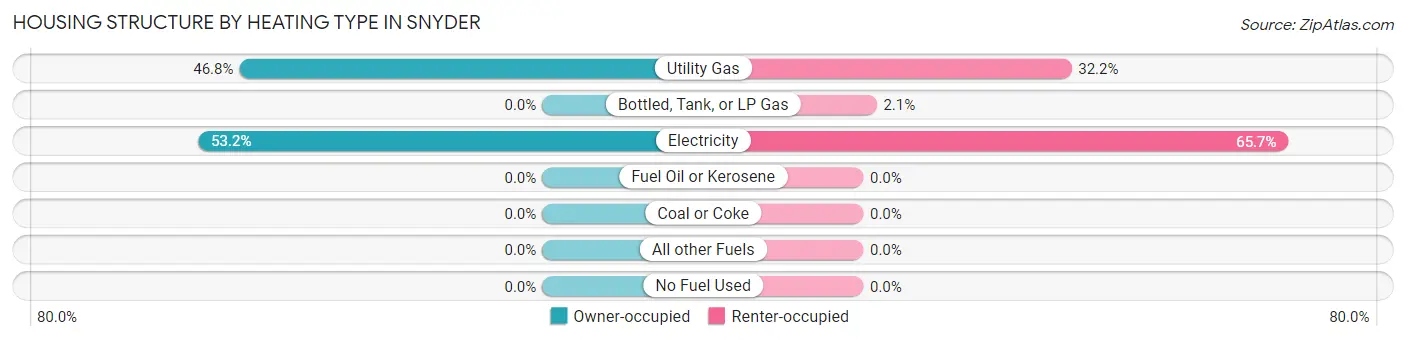
| Heating Type | Owner-occupied | Renter-occupied |
| Utility Gas | 1,460 (46.8%) | 310 (32.2%) |
| Bottled, Tank, or LP Gas | 0 (0.0%) | 20 (2.1%) |
| Electricity | 1,659 (53.2%) | 633 (65.7%) |
| Fuel Oil or Kerosene | 0 (0.0%) | 0 (0.0%) |
| Coal or Coke | 0 (0.0%) | 0 (0.0%) |
| All other Fuels | 0 (0.0%) | 0 (0.0%) |
| No Fuel Used | 0 (0.0%) | 0 (0.0%) |
| Total | 3,119 (100.0%) | 963 (100.0%) |
Household Vehicle Usage in Snyder
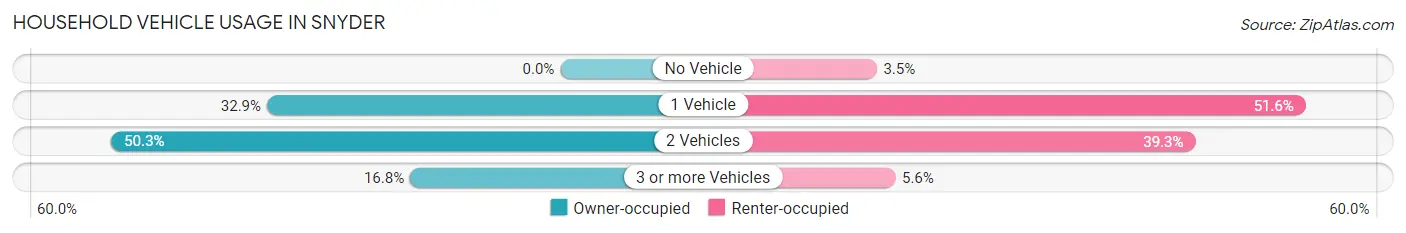
| Vehicles per Household | Owner-occupied | Renter-occupied |
| No Vehicle | 0 (0.0%) | 34 (3.5%) |
| 1 Vehicle | 1,025 (32.9%) | 497 (51.6%) |
| 2 Vehicles | 1,569 (50.3%) | 378 (39.3%) |
| 3 or more Vehicles | 525 (16.8%) | 54 (5.6%) |
| Total | 3,119 (100.0%) | 963 (100.0%) |
Real Estate & Mortgages in Snyder
Real Estate and Mortgage Overview in Snyder
| Characteristic | Without Mortgage | With Mortgage |
| Housing Units | 1,758 | 1,361 |
| Median Property Value | $83,500 | $164,900 |
| Median Household Income | $44,835 | $269 |
| Monthly Housing Costs | $479 | $76 |
| Real Estate Taxes | $1,266 | $42 |
Property Value by Mortgage Status in Snyder
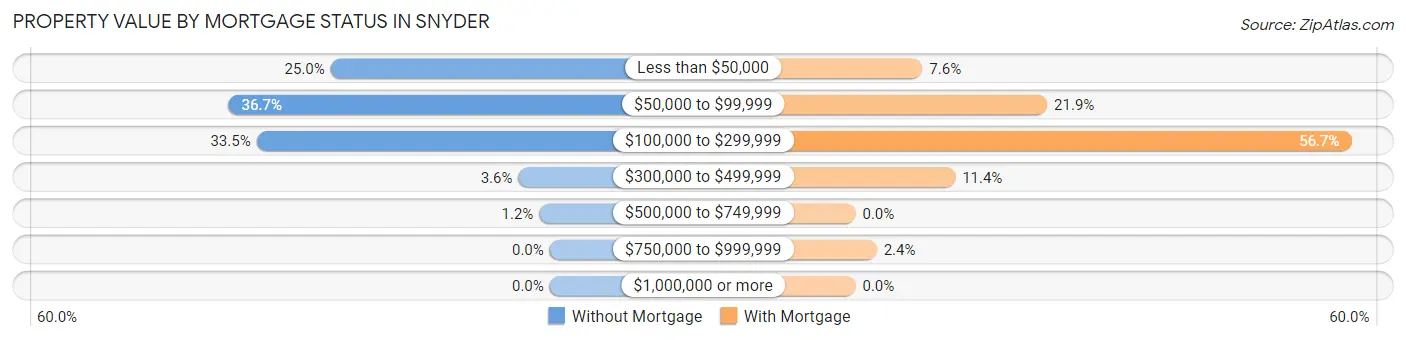
| Property Value | Without Mortgage | With Mortgage |
| Less than $50,000 | 440 (25.0%) | 104 (7.6%) |
| $50,000 to $99,999 | 645 (36.7%) | 298 (21.9%) |
| $100,000 to $299,999 | 589 (33.5%) | 771 (56.7%) |
| $300,000 to $499,999 | 63 (3.6%) | 155 (11.4%) |
| $500,000 to $749,999 | 21 (1.2%) | 0 (0.0%) |
| $750,000 to $999,999 | 0 (0.0%) | 33 (2.4%) |
| $1,000,000 or more | 0 (0.0%) | 0 (0.0%) |
| Total | 1,758 (100.0%) | 1,361 (100.0%) |
Household Income by Mortgage Status in Snyder
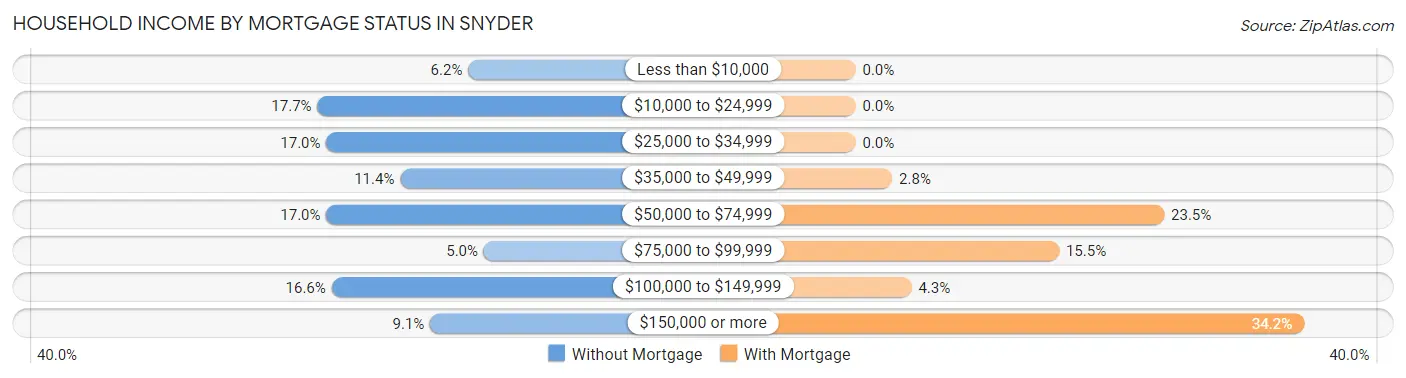
| Household Income | Without Mortgage | With Mortgage |
| Less than $10,000 | 109 (6.2%) | 0 (0.0%) |
| $10,000 to $24,999 | 311 (17.7%) | 0 (0.0%) |
| $25,000 to $34,999 | 299 (17.0%) | 0 (0.0%) |
| $35,000 to $49,999 | 200 (11.4%) | 38 (2.8%) |
| $50,000 to $74,999 | 299 (17.0%) | 320 (23.5%) |
| $75,000 to $99,999 | 88 (5.0%) | 211 (15.5%) |
| $100,000 to $149,999 | 292 (16.6%) | 58 (4.3%) |
| $150,000 or more | 160 (9.1%) | 465 (34.2%) |
| Total | 1,758 (100.0%) | 1,361 (100.0%) |
Property Value to Household Income Ratio in Snyder
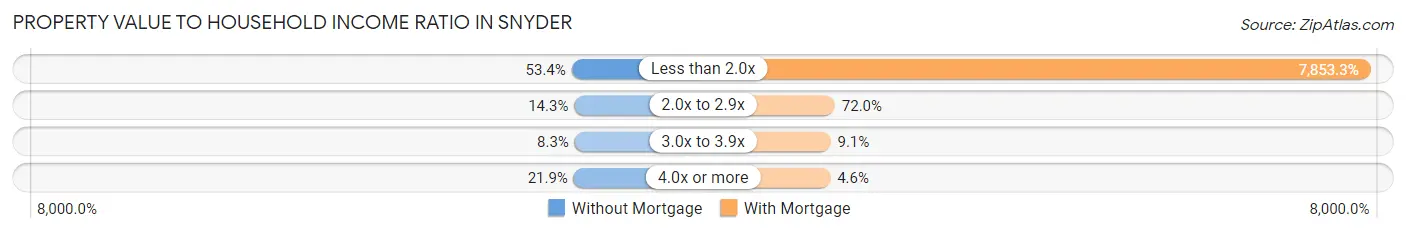
| Value-to-Income Ratio | Without Mortgage | With Mortgage |
| Less than 2.0x | 938 (53.4%) | 106,884 (7,853.3%) |
| 2.0x to 2.9x | 251 (14.3%) | 980 (72.0%) |
| 3.0x to 3.9x | 145 (8.3%) | 124 (9.1%) |
| 4.0x or more | 385 (21.9%) | 63 (4.6%) |
| Total | 1,758 (100.0%) | 1,361 (100.0%) |
Real Estate Taxes by Mortgage Status in Snyder
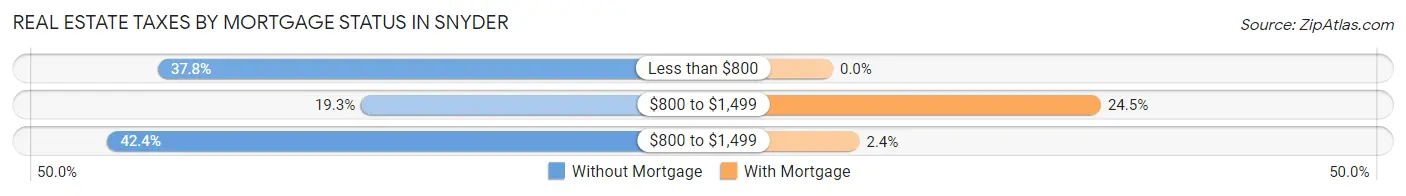
| Property Taxes | Without Mortgage | With Mortgage |
| Less than $800 | 665 (37.8%) | 0 (0.0%) |
| $800 to $1,499 | 339 (19.3%) | 333 (24.5%) |
| $800 to $1,499 | 746 (42.4%) | 33 (2.4%) |
| Total | 1,758 (100.0%) | 1,361 (100.0%) |
Health & Disability in Snyder
Health Insurance Coverage by Age in Snyder
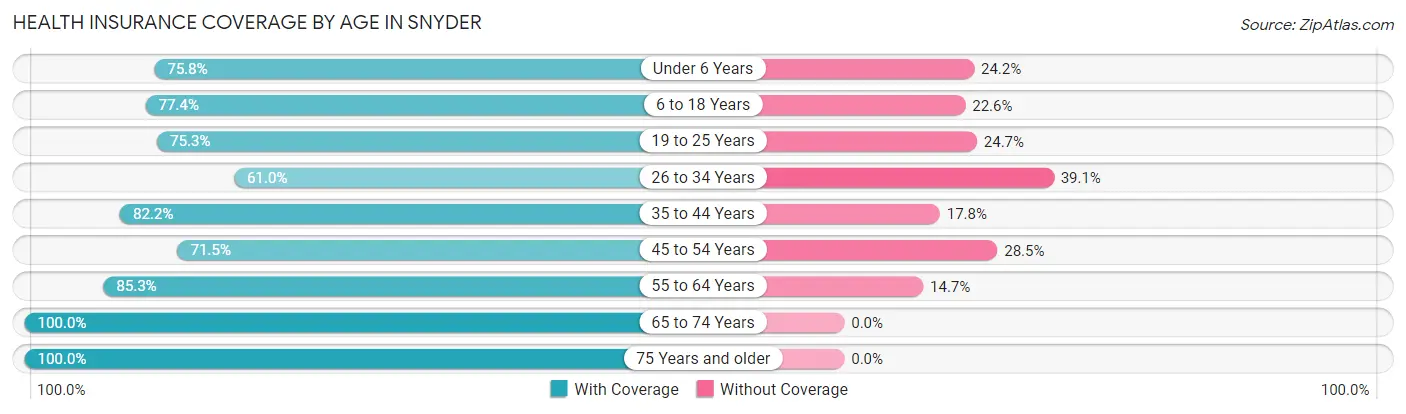
| Age Bracket | With Coverage | Without Coverage |
| Under 6 Years | 699 (75.8%) | 223 (24.2%) |
| 6 to 18 Years | 2,001 (77.4%) | 583 (22.6%) |
| 19 to 25 Years | 935 (75.3%) | 307 (24.7%) |
| 26 to 34 Years | 896 (61.0%) | 574 (39.1%) |
| 35 to 44 Years | 1,195 (82.2%) | 259 (17.8%) |
| 45 to 54 Years | 754 (71.5%) | 301 (28.5%) |
| 55 to 64 Years | 946 (85.3%) | 163 (14.7%) |
| 65 to 74 Years | 775 (100.0%) | 0 (0.0%) |
| 75 Years and older | 618 (100.0%) | 0 (0.0%) |
| Total | 8,819 (78.5%) | 2,410 (21.5%) |
Health Insurance Coverage by Citizenship Status in Snyder
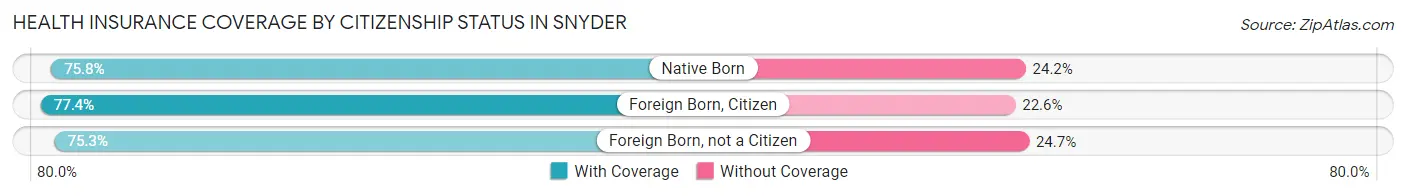
| Citizenship Status | With Coverage | Without Coverage |
| Native Born | 699 (75.8%) | 223 (24.2%) |
| Foreign Born, Citizen | 2,001 (77.4%) | 583 (22.6%) |
| Foreign Born, not a Citizen | 935 (75.3%) | 307 (24.7%) |
Health Insurance Coverage by Household Income in Snyder
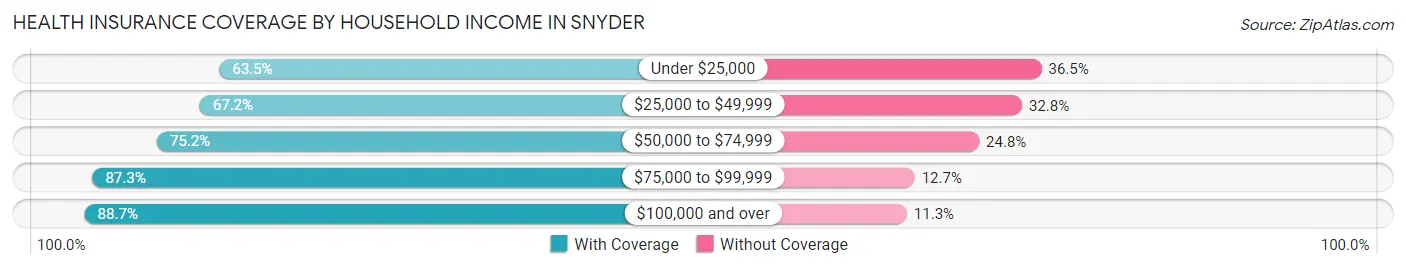
| Household Income | With Coverage | Without Coverage |
| Under $25,000 | 705 (63.5%) | 405 (36.5%) |
| $25,000 to $49,999 | 1,971 (67.2%) | 964 (32.8%) |
| $50,000 to $74,999 | 1,474 (75.2%) | 486 (24.8%) |
| $75,000 to $99,999 | 569 (87.3%) | 83 (12.7%) |
| $100,000 and over | 3,720 (88.7%) | 472 (11.3%) |
Public vs Private Health Insurance Coverage by Age in Snyder
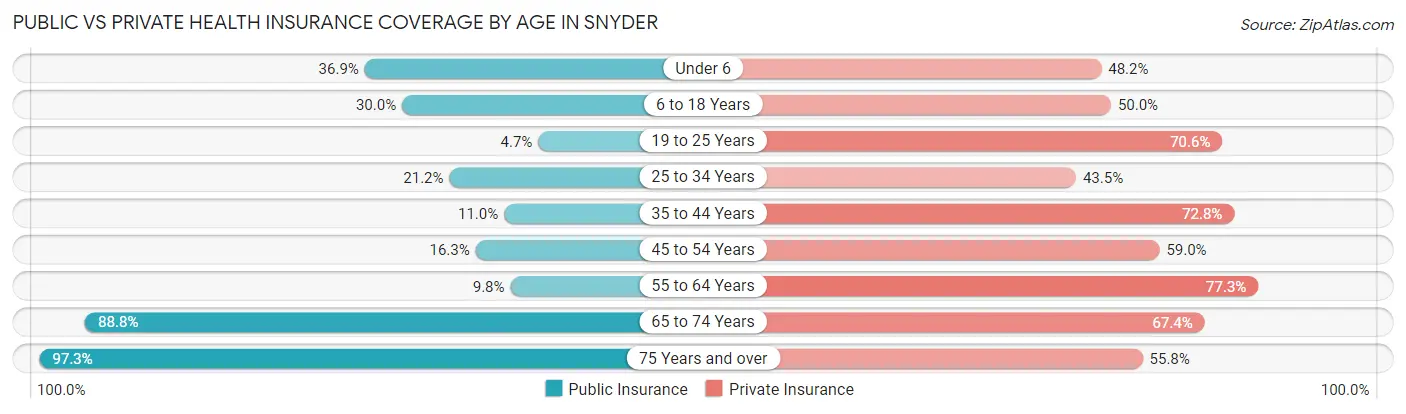
| Age Bracket | Public Insurance | Private Insurance |
| Under 6 | 340 (36.9%) | 444 (48.2%) |
| 6 to 18 Years | 774 (29.9%) | 1,291 (50.0%) |
| 19 to 25 Years | 58 (4.7%) | 877 (70.6%) |
| 25 to 34 Years | 311 (21.2%) | 639 (43.5%) |
| 35 to 44 Years | 160 (11.0%) | 1,059 (72.8%) |
| 45 to 54 Years | 172 (16.3%) | 622 (59.0%) |
| 55 to 64 Years | 109 (9.8%) | 857 (77.3%) |
| 65 to 74 Years | 688 (88.8%) | 522 (67.3%) |
| 75 Years and over | 601 (97.3%) | 345 (55.8%) |
| Total | 3,213 (28.6%) | 6,656 (59.3%) |
Disability Status by Sex by Age in Snyder
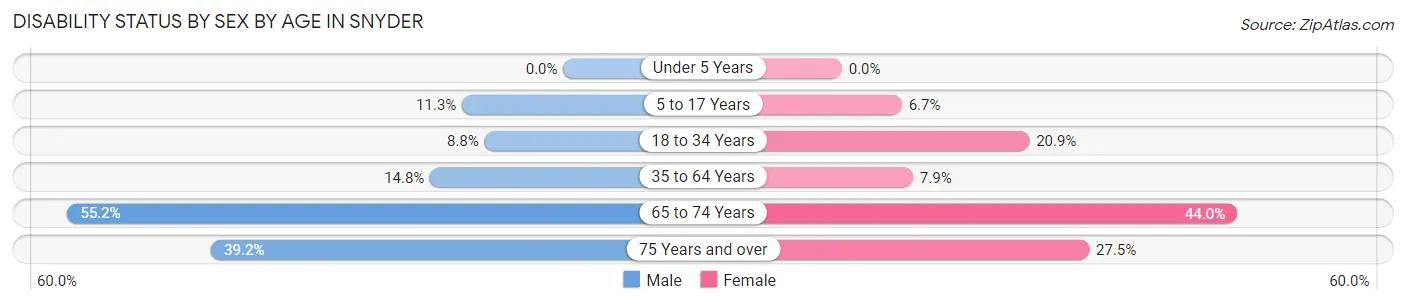
| Age Bracket | Male | Female |
| Under 5 Years | 0 (0.0%) | 0 (0.0%) |
| 5 to 17 Years | 135 (11.3%) | 83 (6.7%) |
| 18 to 34 Years | 137 (8.8%) | 296 (20.9%) |
| 35 to 64 Years | 265 (14.8%) | 145 (7.9%) |
| 65 to 74 Years | 211 (55.2%) | 173 (44.0%) |
| 75 Years and over | 80 (39.2%) | 114 (27.5%) |
Disability Class by Sex by Age in Snyder
Disability Class: Hearing Difficulty
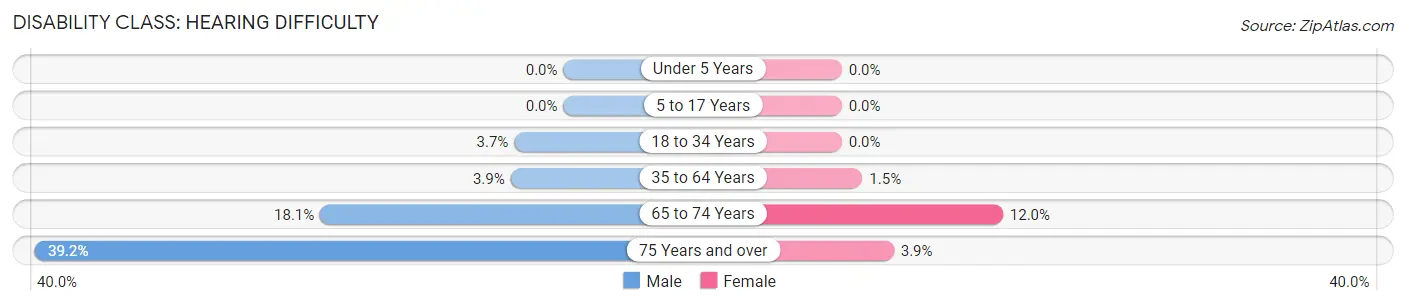
| Age Bracket | Male | Female |
| Under 5 Years | 0 (0.0%) | 0 (0.0%) |
| 5 to 17 Years | 0 (0.0%) | 0 (0.0%) |
| 18 to 34 Years | 57 (3.6%) | 0 (0.0%) |
| 35 to 64 Years | 70 (3.9%) | 28 (1.5%) |
| 65 to 74 Years | 69 (18.1%) | 47 (12.0%) |
| 75 Years and over | 80 (39.2%) | 16 (3.9%) |
Disability Class: Vision Difficulty
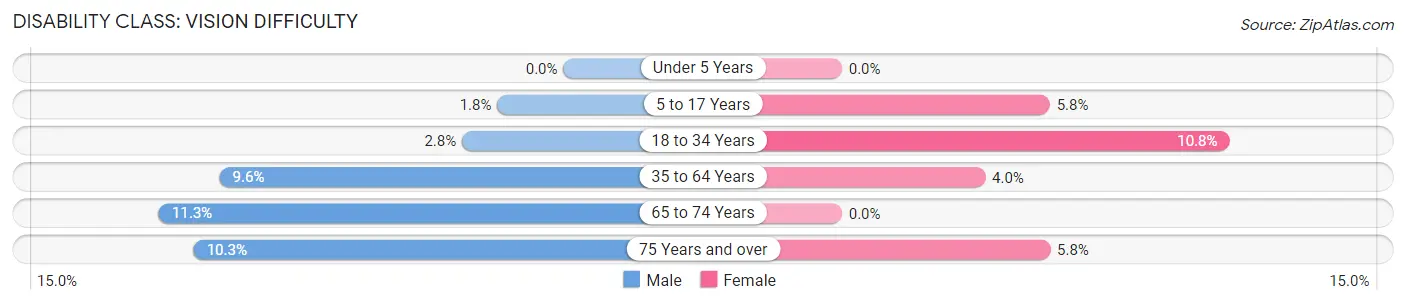
| Age Bracket | Male | Female |
| Under 5 Years | 0 (0.0%) | 0 (0.0%) |
| 5 to 17 Years | 22 (1.8%) | 72 (5.8%) |
| 18 to 34 Years | 44 (2.8%) | 153 (10.8%) |
| 35 to 64 Years | 171 (9.6%) | 73 (4.0%) |
| 65 to 74 Years | 43 (11.3%) | 0 (0.0%) |
| 75 Years and over | 21 (10.3%) | 24 (5.8%) |
Disability Class: Cognitive Difficulty
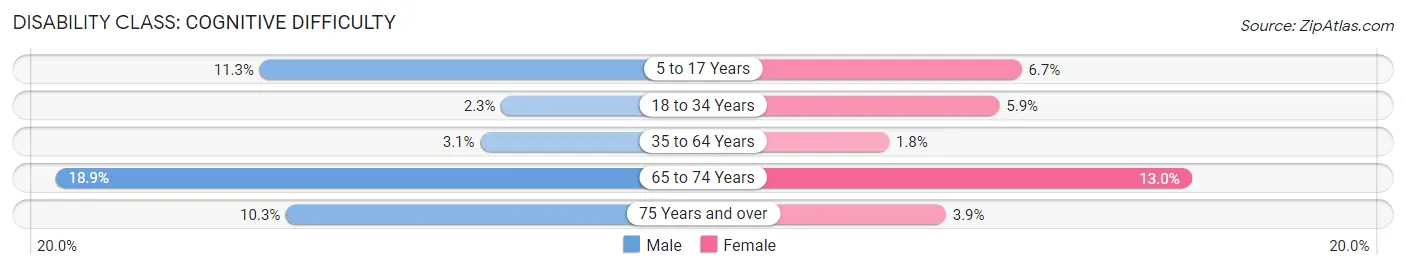
| Age Bracket | Male | Female |
| 5 to 17 Years | 135 (11.3%) | 83 (6.7%) |
| 18 to 34 Years | 36 (2.3%) | 83 (5.9%) |
| 35 to 64 Years | 55 (3.1%) | 32 (1.8%) |
| 65 to 74 Years | 72 (18.9%) | 51 (13.0%) |
| 75 Years and over | 21 (10.3%) | 16 (3.9%) |
Disability Class: Ambulatory Difficulty
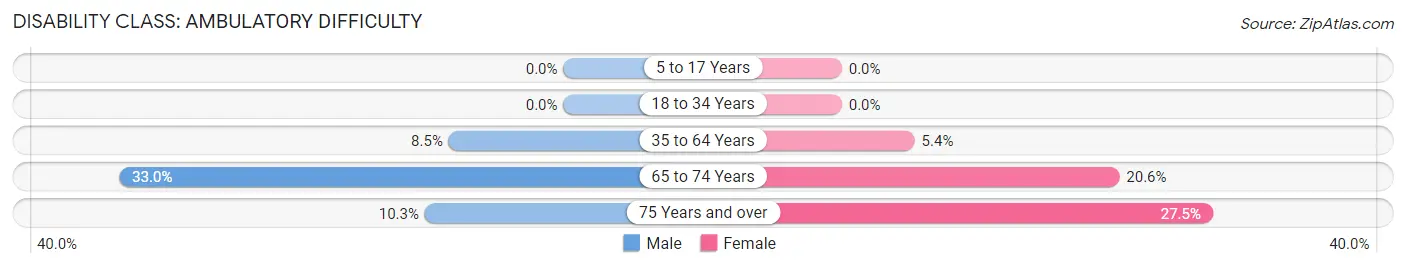
| Age Bracket | Male | Female |
| 5 to 17 Years | 0 (0.0%) | 0 (0.0%) |
| 18 to 34 Years | 0 (0.0%) | 0 (0.0%) |
| 35 to 64 Years | 152 (8.5%) | 99 (5.4%) |
| 65 to 74 Years | 126 (33.0%) | 81 (20.6%) |
| 75 Years and over | 21 (10.3%) | 114 (27.5%) |
Disability Class: Self-Care Difficulty
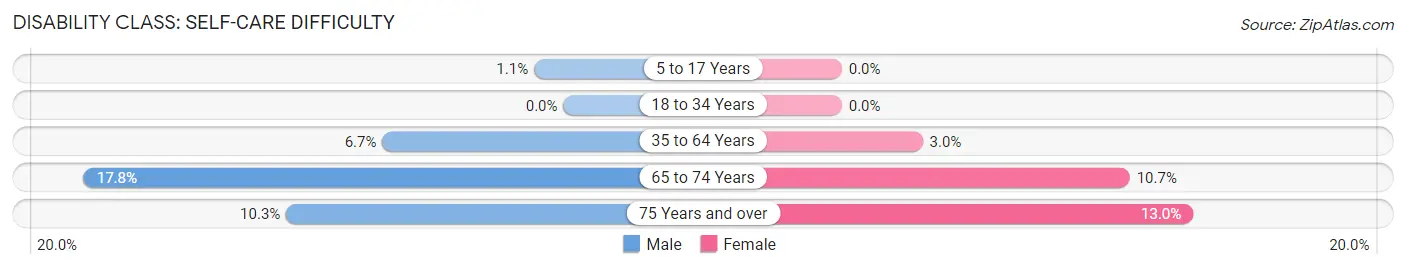
| Age Bracket | Male | Female |
| 5 to 17 Years | 13 (1.1%) | 0 (0.0%) |
| 18 to 34 Years | 0 (0.0%) | 0 (0.0%) |
| 35 to 64 Years | 120 (6.7%) | 55 (3.0%) |
| 65 to 74 Years | 68 (17.8%) | 42 (10.7%) |
| 75 Years and over | 21 (10.3%) | 54 (13.0%) |
Technology Access in Snyder
Computing Device Access in Snyder
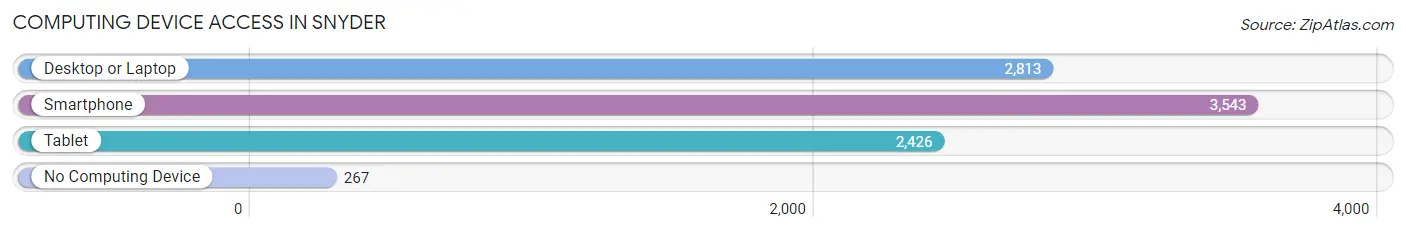
| Device Type | # Households | % Households |
| Desktop or Laptop | 2,813 | 68.9% |
| Smartphone | 3,543 | 86.8% |
| Tablet | 2,426 | 59.4% |
| No Computing Device | 267 | 6.5% |
| Total | 4,082 | 100.0% |
Internet Access in Snyder
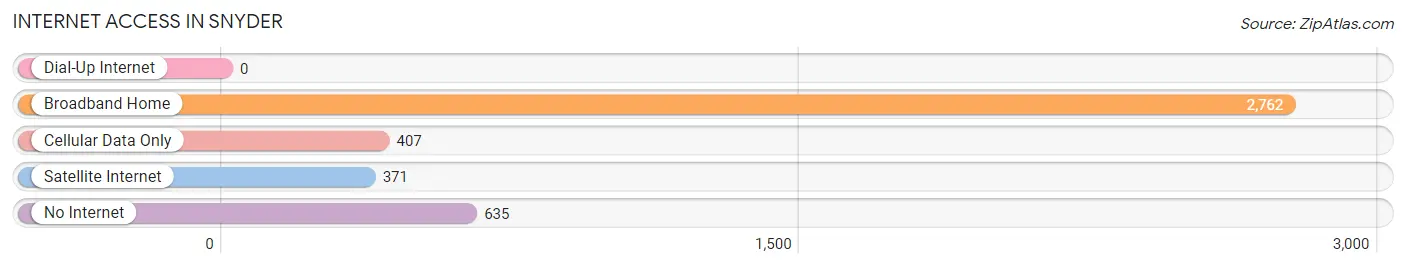
| Internet Type | # Households | % Households |
| Dial-Up Internet | 0 | 0.0% |
| Broadband Home | 2,762 | 67.7% |
| Cellular Data Only | 407 | 10.0% |
| Satellite Internet | 371 | 9.1% |
| No Internet | 635 | 15.6% |
| Total | 4,082 | 100.0% |
Snyder Summary
Snyder is a city located in Scurry County, Texas, United States. It is the county seat of Scurry County and is located in the western part of the state. The population was 11,202 at the 2010 census.
History
Snyder was founded in 1881 by William Henry Snyder, a rancher and businessman from Illinois. He purchased land in the area and established a trading post. The town was named after him and was incorporated in 1883.
The town grew rapidly in the early years, and by 1890 it had a population of 1,000. The town was a center for the cattle industry, and it was also a stop on the Texas and Pacific Railway.
In the early 1900s, Snyder became a center for oil production. The first oil well was drilled in the area in 1911, and by the 1920s the town was producing more than 1 million barrels of oil a year.
The town continued to grow throughout the 20th century, and by the 2000 census it had a population of 11,202.
Geography
Snyder is located in western Texas, about 100 miles southeast of Lubbock. It is situated in the rolling plains of the Llano Estacado, an area of flat, grassy land. The town is located at the intersection of U.S. Highway 84 and State Highway 208.
The climate in Snyder is semi-arid, with hot summers and mild winters. The average annual temperature is 64°F, and the average annual precipitation is 19 inches.
Economy
The economy of Snyder is largely based on agriculture and oil production. The town is a center for the production of cotton, wheat, and sorghum. It is also a major center for oil production, with more than 1 million barrels of oil produced annually.
The town is also home to several manufacturing companies, including a plastics plant and a food processing plant.
Demographics
As of the 2010 census, the population of Snyder was 11,202. The racial makeup of the town was 75.3% White, 1.3% African American, 0.7% Native American, 0.4% Asian, 0.1% Pacific Islander, 19.7% from other races, and 2.5% from two or more races. Hispanic or Latino of any race were 37.2% of the population.
The median household income in Snyder was $31,945, and the median family income was $37,917. The per capita income was $17,845. About 18.2% of the population was below the poverty line.
Snyder is served by the Scurry-Rosser Independent School District. The town is home to two elementary schools, one middle school, and one high school. It is also home to Western Texas College, a two-year community college.
Common Questions
What is the Total Population of Snyder?
Total Population of Snyder is 11,378.
What is the Total Male Population of Snyder?
Total Male Population of Snyder is 5,523.
What is the Total Female Population of Snyder?
Total Female Population of Snyder is 5,855.
What is the Ratio of Males per 100 Females in Snyder?
There are 94.33 Males per 100 Females in Snyder.
What is the Ratio of Females per 100 Males in Snyder?
There are 106.01 Females per 100 Males in Snyder.
What is the Median Population Age in Snyder?
Median Population Age in Snyder is 31.3 Years.
What is the Average Family Size in Snyder
Average Family Size in Snyder is 3.3 People.
What is the Average Household Size in Snyder
Average Household Size in Snyder is 2.7 People.
What is Per Capita Income in Snyder?
Per Capita income in Snyder is $29,491.
What is the Median Family Income in Snyder?
Median Family Income in Snyder is $73,420.
What is the Median Household income in Snyder?
Median Household Income in Snyder is $54,915.
What is Income or Wage Gap in Snyder?
Income or Wage Gap in Snyder is 40.0%.
Women in Snyder earn 60.0 cents for every dollar earned by a man.
What is Inequality or Gini Index in Snyder?
Inequality or Gini Index in Snyder is 0.41.
How Large is the Labor Force in Snyder?
There are 5,222 People in the Labor Forcein in Snyder.
What is the Percentage of People in the Labor Force in Snyder?
61.0% of People are in the Labor Force in Snyder.
What is the Unemployment Rate in Snyder?
Unemployment Rate in Snyder is 2.5%.