Siesta Acres, TX
Siesta Acres Map
Siesta Acres Overview
1,636
TOTAL POPULATION
911
MALE POPULATION
725
FEMALE POPULATION
125.66
MALES / 100 FEMALES
79.58
FEMALES / 100 MALES
32.8
MEDIAN AGE
4.4
AVG FAMILY SIZE
4.2
AVG HOUSEHOLD SIZE
$20,724
PER CAPITA INCOME
$60,000
AVG FAMILY INCOME
$55,268
AVG HOUSEHOLD INCOME
13.3%
WAGE / INCOME GAP [ % ]
86.7¢/ $1
WAGE / INCOME GAP [ $ ]
0.33
INEQUALITY / GINI INDEX
727
LABOR FORCE [ PEOPLE ]
69.4%
PERCENT IN LABOR FORCE
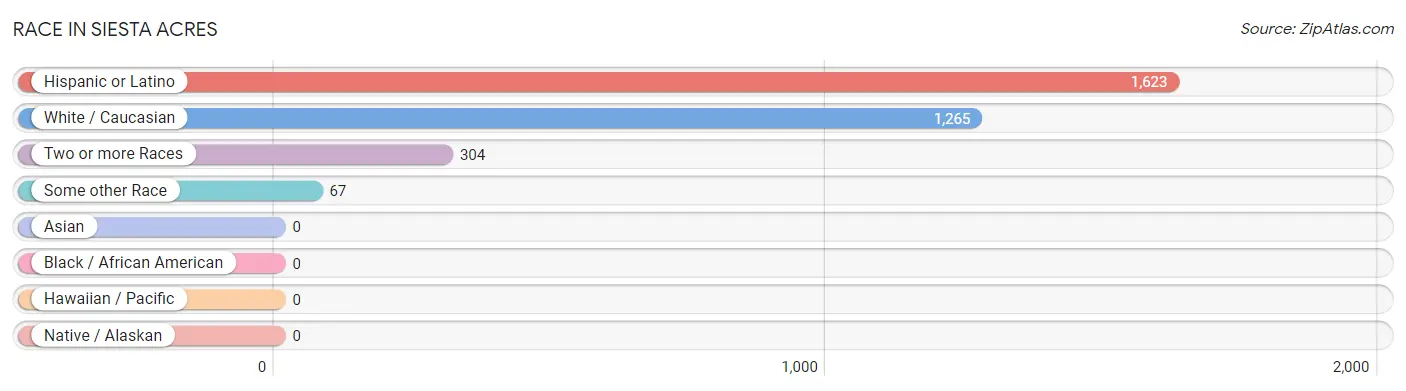
Race in Siesta Acres
The most populous races in Siesta Acres are Hispanic or Latino (1,623 | 99.2%), White / Caucasian (1,265 | 77.3%), and Two or more Races (304 | 18.6%).
| Race | # Population | % Population |
| Asian | 0 | 0.0% |
| Black / African American | 0 | 0.0% |
| Hawaiian / Pacific | 0 | 0.0% |
| Hispanic or Latino | 1,623 | 99.2% |
| Native / Alaskan | 0 | 0.0% |
| White / Caucasian | 1,265 | 77.3% |
| Two or more Races | 304 | 18.6% |
| Some other Race | 67 | 4.1% |
| Total | 1,636 | 100.0% |
Ancestry in Siesta Acres
The most populous ancestries reported in Siesta Acres are , and Mexican (1,623 | 99.2%), together accounting for 99.2% of all Siesta Acres residents.

| Ancestry | # Population | % Population |
| Mexican | 1,623 | 99.2% | View All 1 Rows |
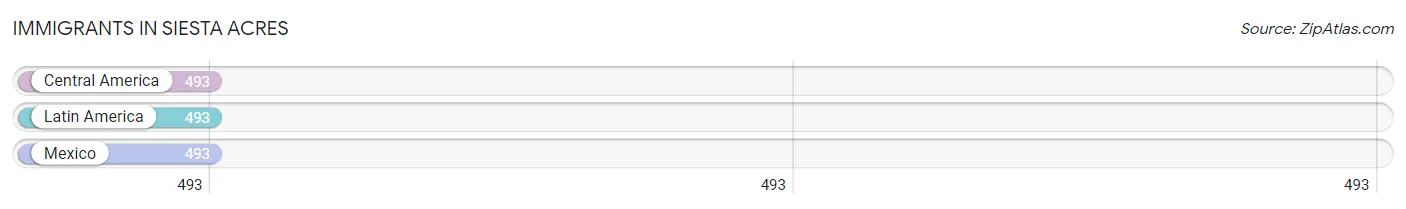
Immigrants in Siesta Acres
The most numerous immigrant groups reported in Siesta Acres came from Central America (493 | 30.1%), Latin America (493 | 30.1%), and Mexico (493 | 30.1%), together accounting for 90.4% of all Siesta Acres residents.
| Immigration Origin | # Population | % Population |
| Central America | 493 | 30.1% |
| Latin America | 493 | 30.1% |
| Mexico | 493 | 30.1% | View All 3 Rows |
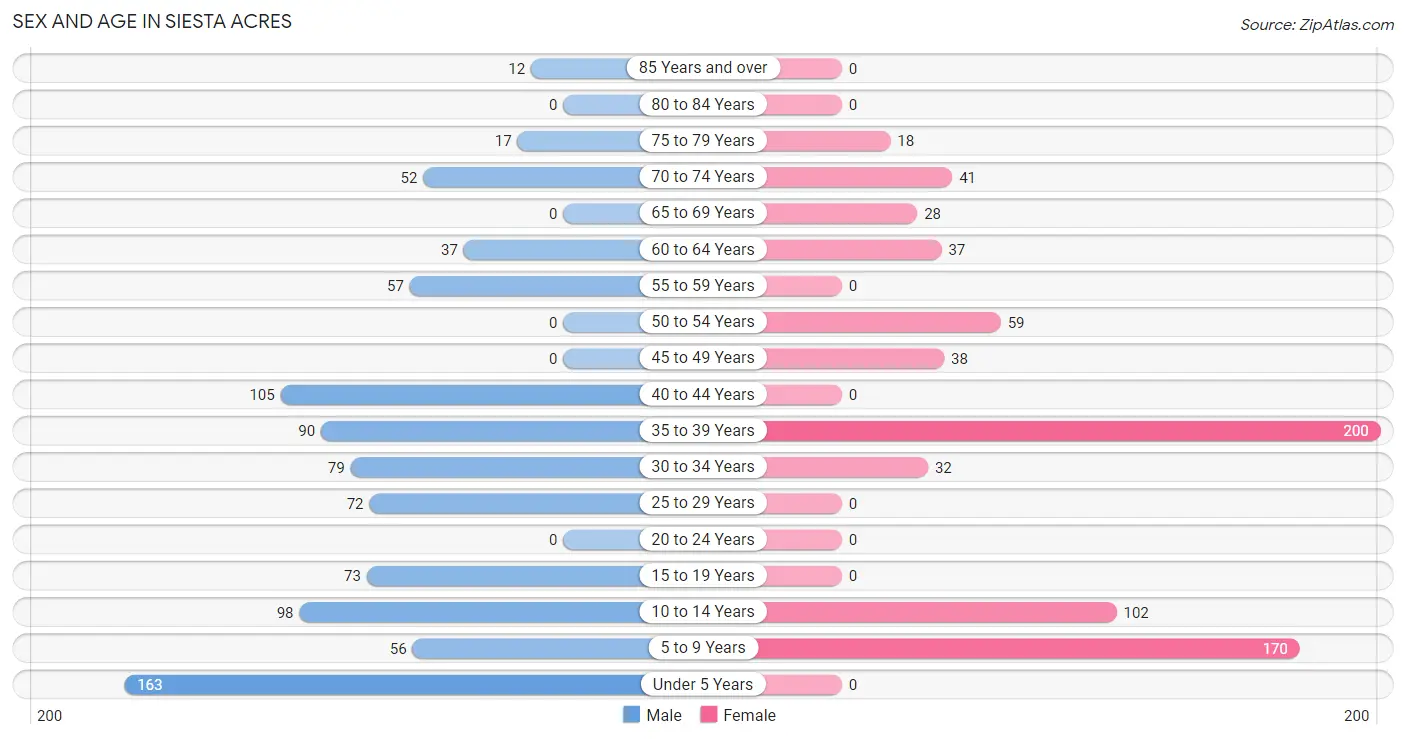
Sex and Age in Siesta Acres
Sex and Age in Siesta Acres
The most populous age groups in Siesta Acres are Under 5 Years (163 | 17.9%) for men and 35 to 39 Years (200 | 27.6%) for women.
| Age Bracket | Male | Female |
| Under 5 Years | 163 (17.9%) | 0 (0.0%) |
| 5 to 9 Years | 56 (6.1%) | 170 (23.4%) |
| 10 to 14 Years | 98 (10.8%) | 102 (14.1%) |
| 15 to 19 Years | 73 (8.0%) | 0 (0.0%) |
| 20 to 24 Years | 0 (0.0%) | 0 (0.0%) |
| 25 to 29 Years | 72 (7.9%) | 0 (0.0%) |
| 30 to 34 Years | 79 (8.7%) | 32 (4.4%) |
| 35 to 39 Years | 90 (9.9%) | 200 (27.6%) |
| 40 to 44 Years | 105 (11.5%) | 0 (0.0%) |
| 45 to 49 Years | 0 (0.0%) | 38 (5.2%) |
| 50 to 54 Years | 0 (0.0%) | 59 (8.1%) |
| 55 to 59 Years | 57 (6.3%) | 0 (0.0%) |
| 60 to 64 Years | 37 (4.1%) | 37 (5.1%) |
| 65 to 69 Years | 0 (0.0%) | 28 (3.9%) |
| 70 to 74 Years | 52 (5.7%) | 41 (5.7%) |
| 75 to 79 Years | 17 (1.9%) | 18 (2.5%) |
| 80 to 84 Years | 0 (0.0%) | 0 (0.0%) |
| 85 Years and over | 12 (1.3%) | 0 (0.0%) |
| Total | 911 (100.0%) | 725 (100.0%) |
Families and Households in Siesta Acres
Median Family Size in Siesta Acres
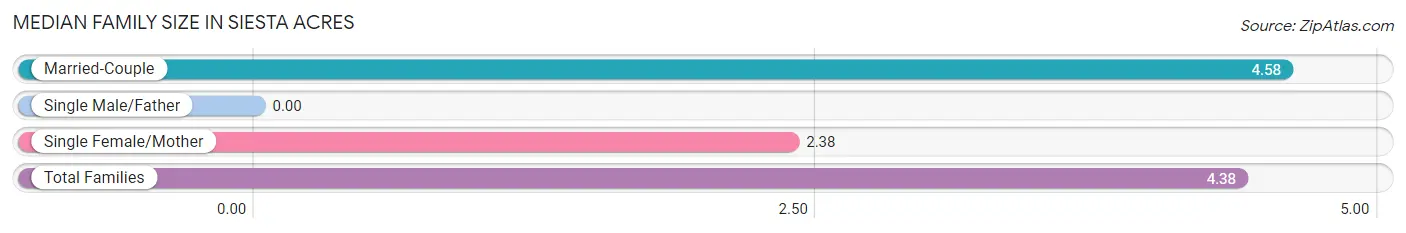
| Family Type | # Families | Family Size |
| Married-Couple | 334 (90.8%) | 4.58 |
| Single Male/Father | 0 (0.0%) | - |
| Single Female/Mother | 34 (9.2%) | 2.38 |
| Total Families | 368 (100.0%) | 4.38 |
Median Household Size in Siesta Acres
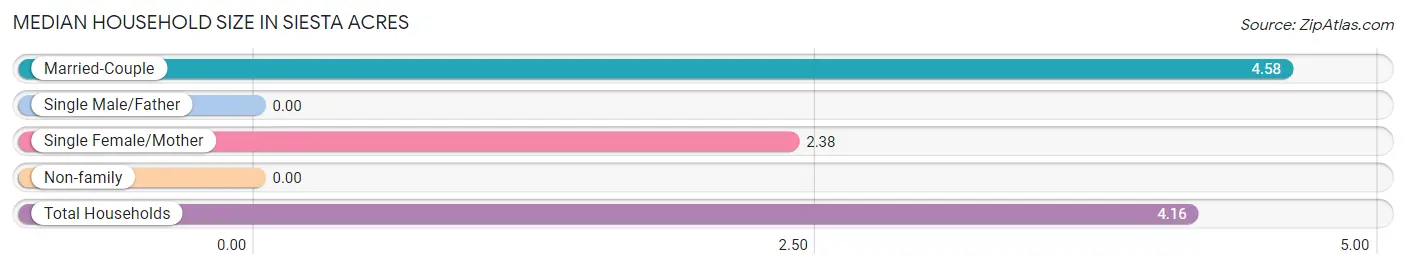
| Household Type | # Households | Household Size |
| Married-Couple | 334 (85.0%) | 4.58 |
| Single Male/Father | 0 (0.0%) | - |
| Single Female/Mother | 34 (8.6%) | 2.38 |
| Non-family | 25 (6.4%) | - |
| Total Households | 393 (100.0%) | 4.16 |
Household Size by Marriage Status in Siesta Acres
Out of a total of 393 households in Siesta Acres, 368 (93.6%) are family households, while 25 (6.4%) are nonfamily households. The most numerous type of family households are 2-person households, comprising 127, and the most common type of nonfamily households are 1-person households, comprising 25.
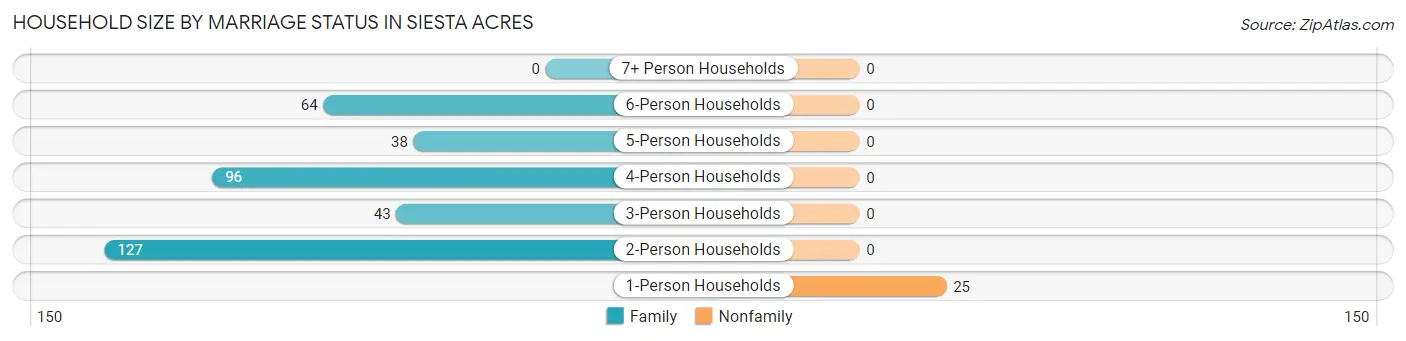
| Household Size | Family Households | Nonfamily Households |
| 1-Person Households | - | 25 (6.4%) |
| 2-Person Households | 127 (32.3%) | 0 (0.0%) |
| 3-Person Households | 43 (10.9%) | 0 (0.0%) |
| 4-Person Households | 96 (24.4%) | 0 (0.0%) |
| 5-Person Households | 38 (9.7%) | 0 (0.0%) |
| 6-Person Households | 64 (16.3%) | 0 (0.0%) |
| 7+ Person Households | 0 (0.0%) | 0 (0.0%) |
| Total | 368 (93.6%) | 25 (6.4%) |
Female Fertility in Siesta Acres
Fertility by Age in Siesta Acres
| Age Bracket | Women with Births | Births / 1,000 Women |
| 15 to 19 years | 0 (0.0%) | 0.0 |
| 20 to 34 years | 0 (0.0%) | 0.0 |
| 35 to 50 years | 0 (0.0%) | 0.0 |
| Total | 0 (0.0%) | 0.0 |
Fertility by Age by Marriage Status in Siesta Acres
| Age Bracket | Married | Unmarried |
| 15 to 19 years | 0 (0.0%) | 0 (0.0%) |
| 20 to 34 years | 0 (0.0%) | 0 (0.0%) |
| 35 to 50 years | 0 (0.0%) | 0 (0.0%) |
| Total | 0 (0.0%) | 0 (0.0%) |
Fertility by Education in Siesta Acres
| Educational Attainment | Women with Births | Births / 1,000 Women |
| Less than High School | 0 (0.0%) | 0.0 |
| High School Diploma | 0 (0.0%) | 0.0 |
| College or Associate's Degree | 0 (0.0%) | 0.0 |
| Bachelor's Degree | 0 (0.0%) | 0.0 |
| Graduate Degree | 0 (0.0%) | 0.0 |
| Total | 0 (0.0%) | 0.0 |
Fertility by Education by Marriage Status in Siesta Acres
| Educational Attainment | Married | Unmarried |
| Less than High School | 0 (0.0%) | 0 (0.0%) |
| High School Diploma | 0 (0.0%) | 0 (0.0%) |
| College or Associate's Degree | 0 (0.0%) | 0 (0.0%) |
| Bachelor's Degree | 0 (0.0%) | 0 (0.0%) |
| Graduate Degree | 0 (0.0%) | 0 (0.0%) |
| Total | 0 (0.0%) | 0 (0.0%) |
Income in Siesta Acres
Income Overview in Siesta Acres
Per Capita Income in Siesta Acres is $20,724, while median incomes of families and households are $60,000 and $55,268 respectively.
| Characteristic | Number | Measure |
| Per Capita Income | 1,636 | $20,724 |
| Median Family Income | 368 | $60,000 |
| Mean Family Income | 368 | $75,979 |
| Median Household Income | 393 | $55,268 |
| Mean Household Income | 393 | $71,969 |
| Income Deficit | 368 | $0 |
| Wage / Income Gap (%) | 1,636 | 13.33% |
| Wage / Income Gap ($) | 1,636 | 86.67¢ per $1 |
| Gini / Inequality Index | 1,636 | 0.33 |
Earnings by Sex in Siesta Acres
Average Earnings in Siesta Acres are $32,563, $33,402 for men and $28,948 for women, a difference of 13.3%.
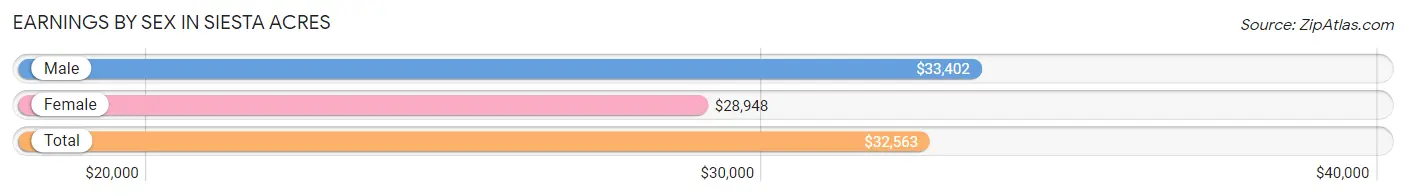
| Sex | Number | Average Earnings |
| Male | 487 (60.9%) | $33,402 |
| Female | 313 (39.1%) | $28,948 |
| Total | 800 (100.0%) | $32,563 |
Earnings by Sex by Income Bracket in Siesta Acres
The most common earnings brackets in Siesta Acres are $30,000 to $34,999 for men (92 | 18.9%) and $65,000 to $74,999 for women (64 | 20.4%).
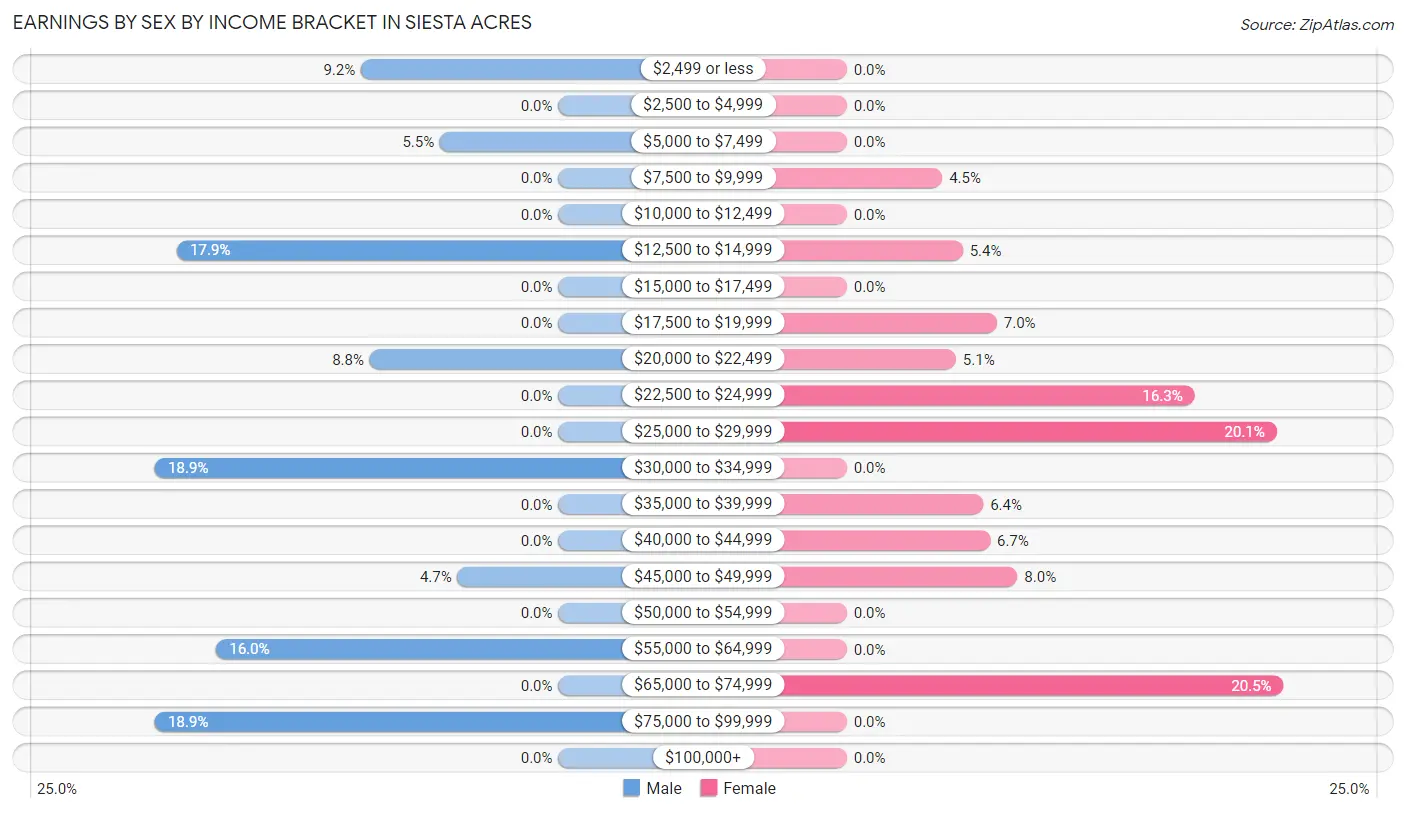
| Income | Male | Female |
| $2,499 or less | 45 (9.2%) | 0 (0.0%) |
| $2,500 to $4,999 | 0 (0.0%) | 0 (0.0%) |
| $5,000 to $7,499 | 27 (5.5%) | 0 (0.0%) |
| $7,500 to $9,999 | 0 (0.0%) | 14 (4.5%) |
| $10,000 to $12,499 | 0 (0.0%) | 0 (0.0%) |
| $12,500 to $14,999 | 87 (17.9%) | 17 (5.4%) |
| $15,000 to $17,499 | 0 (0.0%) | 0 (0.0%) |
| $17,500 to $19,999 | 0 (0.0%) | 22 (7.0%) |
| $20,000 to $22,499 | 43 (8.8%) | 16 (5.1%) |
| $22,500 to $24,999 | 0 (0.0%) | 51 (16.3%) |
| $25,000 to $29,999 | 0 (0.0%) | 63 (20.1%) |
| $30,000 to $34,999 | 92 (18.9%) | 0 (0.0%) |
| $35,000 to $39,999 | 0 (0.0%) | 20 (6.4%) |
| $40,000 to $44,999 | 0 (0.0%) | 21 (6.7%) |
| $45,000 to $49,999 | 23 (4.7%) | 25 (8.0%) |
| $50,000 to $54,999 | 0 (0.0%) | 0 (0.0%) |
| $55,000 to $64,999 | 78 (16.0%) | 0 (0.0%) |
| $65,000 to $74,999 | 0 (0.0%) | 64 (20.4%) |
| $75,000 to $99,999 | 92 (18.9%) | 0 (0.0%) |
| $100,000+ | 0 (0.0%) | 0 (0.0%) |
| Total | 487 (100.0%) | 313 (100.0%) |
Earnings by Sex by Educational Attainment in Siesta Acres
Average earnings in Siesta Acres are $34,367 for men and $28,948 for women, a difference of 15.8%. Men with an educational attainment of high school diploma enjoy the highest average annual earnings of $34,161, while those with high school diploma education earn the least with $34,161. Women with an educational attainment of bachelor's degree earn the most with the average annual earnings of $72,969, while those with less than high school education have the smallest earnings of $22,819.
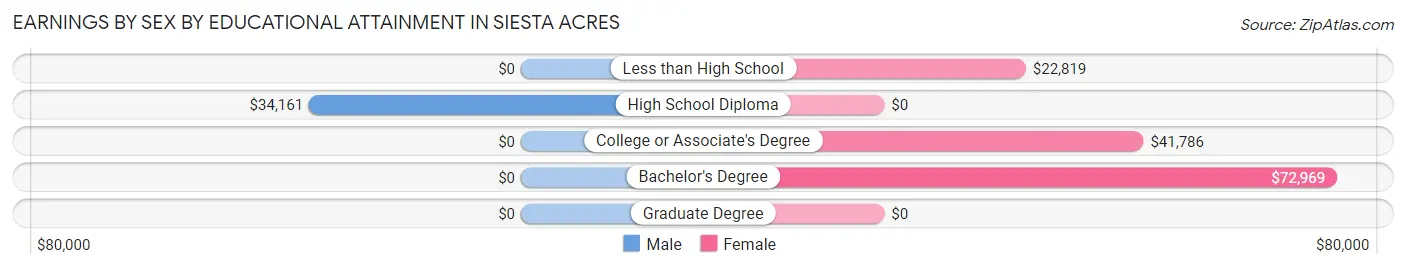
| Educational Attainment | Male Income | Female Income |
| Less than High School | - | - |
| High School Diploma | $34,161 | $0 |
| College or Associate's Degree | - | - |
| Bachelor's Degree | - | - |
| Graduate Degree | - | - |
| Total | $34,367 | $28,948 |
Family Income in Siesta Acres
Family Income Brackets in Siesta Acres
According to the Siesta Acres family income data, there are 144 families falling into the $100,000 to $149,999 income range, which is the most common income bracket and makes up 39.1% of all families.
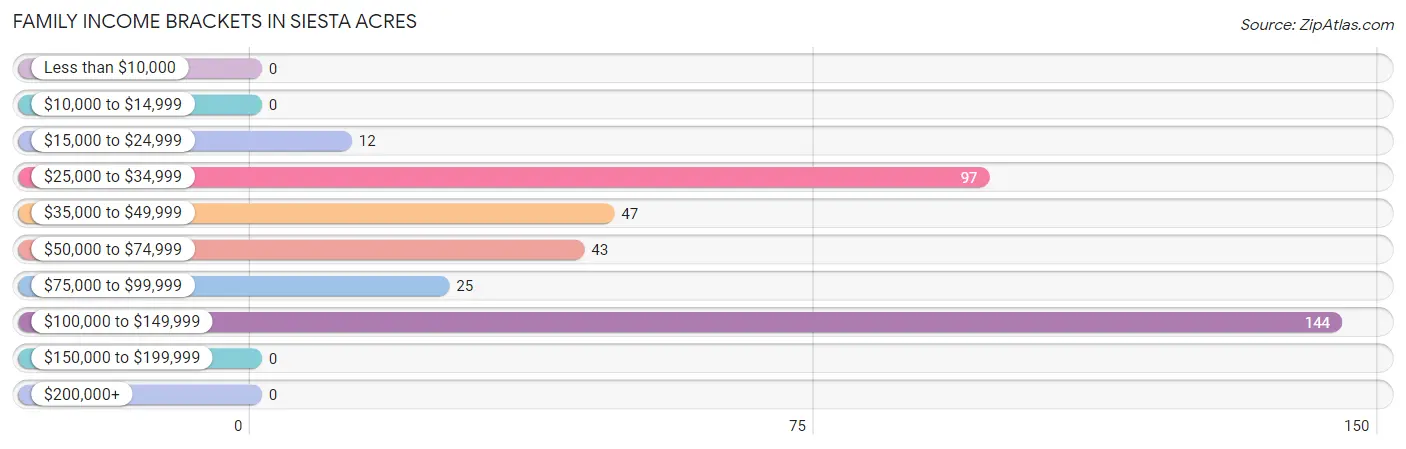
| Income Bracket | # Families | % Families |
| Less than $10,000 | 0 | 0.0% |
| $10,000 to $14,999 | 0 | 0.0% |
| $15,000 to $24,999 | 12 | 3.3% |
| $25,000 to $34,999 | 97 | 26.4% |
| $35,000 to $49,999 | 47 | 12.8% |
| $50,000 to $74,999 | 43 | 11.7% |
| $75,000 to $99,999 | 25 | 6.8% |
| $100,000 to $149,999 | 144 | 39.1% |
| $150,000 to $199,999 | 0 | 0.0% |
| $200,000+ | 0 | 0.0% |
Family Income by Famaliy Size in Siesta Acres
3-person families (43 | 11.7%) account for the highest median family income in Siesta Acres with $56,339 per family, while 2-person families (127 | 34.5%) have the highest median income of $24,062 per family member.
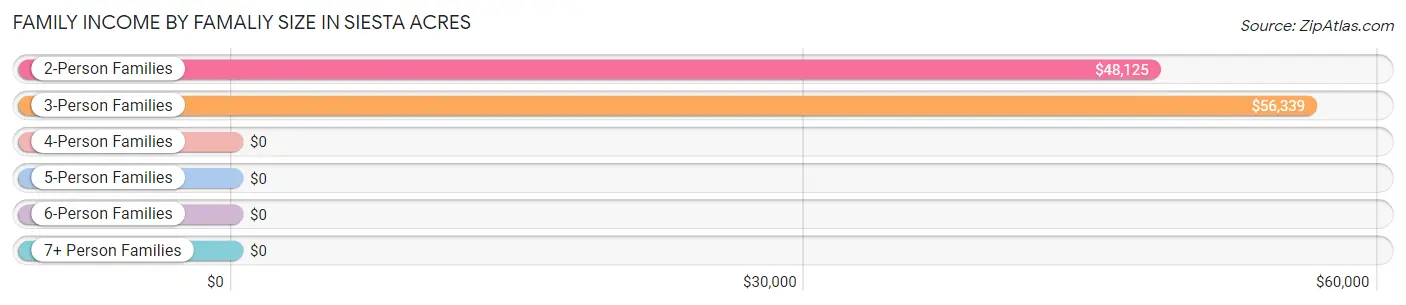
| Income Bracket | # Families | Median Income |
| 2-Person Families | 127 (34.5%) | $48,125 |
| 3-Person Families | 43 (11.7%) | $56,339 |
| 4-Person Families | 96 (26.1%) | $0 |
| 5-Person Families | 38 (10.3%) | $0 |
| 6-Person Families | 64 (17.4%) | $0 |
| 7+ Person Families | 0 (0.0%) | $0 |
| Total | 368 (100.0%) | $60,000 |
Family Income by Number of Earners in Siesta Acres
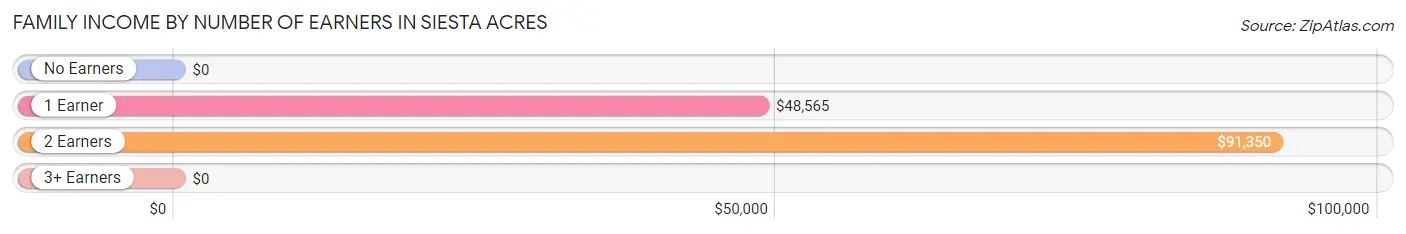
| Number of Earners | # Families | Median Income |
| No Earners | 25 (6.8%) | $0 |
| 1 Earner | 87 (23.6%) | $48,565 |
| 2 Earners | 183 (49.7%) | $91,350 |
| 3+ Earners | 73 (19.8%) | $0 |
| Total | 368 (100.0%) | $60,000 |
Household Income in Siesta Acres
Household Income Brackets in Siesta Acres
With 144 households falling in the category, the $100,000 to $149,999 income range is the most frequent in Siesta Acres, accounting for 36.6% of all households.
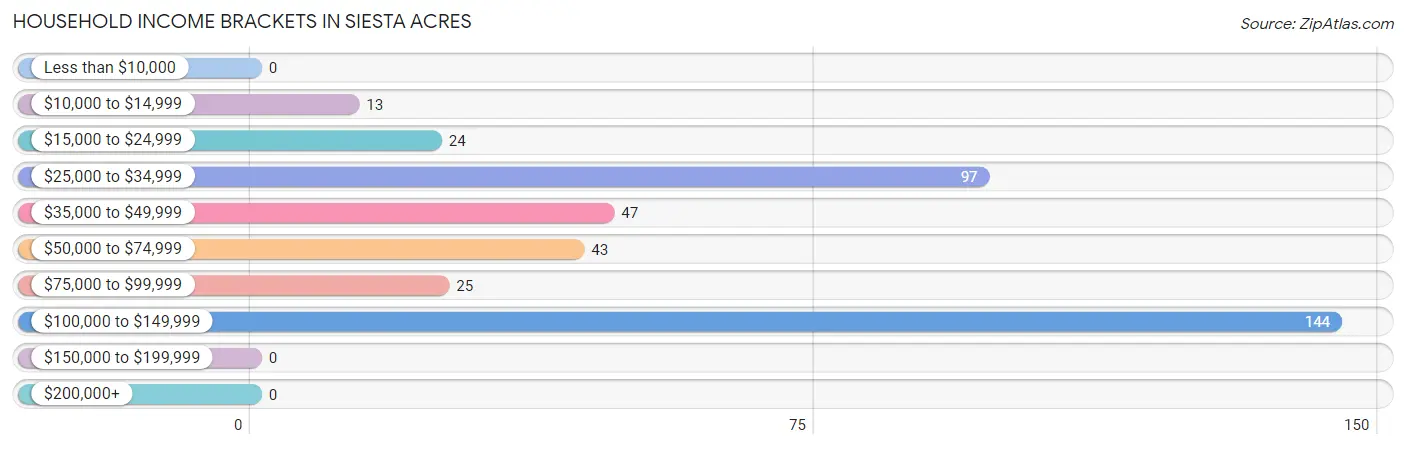
| Income Bracket | # Households | % Households |
| Less than $10,000 | 0 | 0.0% |
| $10,000 to $14,999 | 13 | 3.3% |
| $15,000 to $24,999 | 24 | 6.1% |
| $25,000 to $34,999 | 97 | 24.7% |
| $35,000 to $49,999 | 47 | 12.0% |
| $50,000 to $74,999 | 43 | 10.9% |
| $75,000 to $99,999 | 25 | 6.4% |
| $100,000 to $149,999 | 144 | 36.6% |
| $150,000 to $199,999 | 0 | 0.0% |
| $200,000+ | 0 | 0.0% |
Household Income by Householder Age in Siesta Acres
The median household income in Siesta Acres is $55,268, with the highest median household income of $118,995 found in the 25 to 44 years age bracket for the primary householder. A total of 169 households (43.0%) fall into this category.
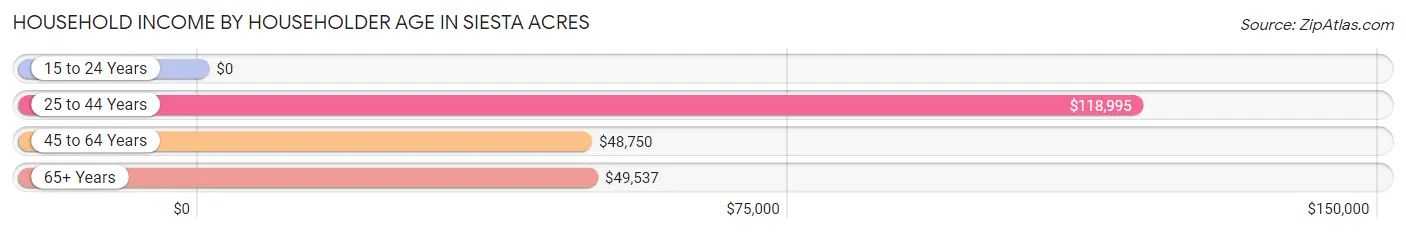
| Income Bracket | # Households | Median Income |
| 15 to 24 Years | 0 (0.0%) | $0 |
| 25 to 44 Years | 169 (43.0%) | $118,995 |
| 45 to 64 Years | 132 (33.6%) | $48,750 |
| 65+ Years | 92 (23.4%) | $49,537 |
| Total | 393 (100.0%) | $55,268 |
Poverty in Siesta Acres
Income Below Poverty by Sex and Age in Siesta Acres
With 6.4% poverty level for males and 12.1% for females among the residents of Siesta Acres, 16 and 17 year old males and 12 to 14 year old females are the most vulnerable to poverty, with 19 males (100.0%) and 21 females (25.6%) in their respective age groups living below the poverty level.
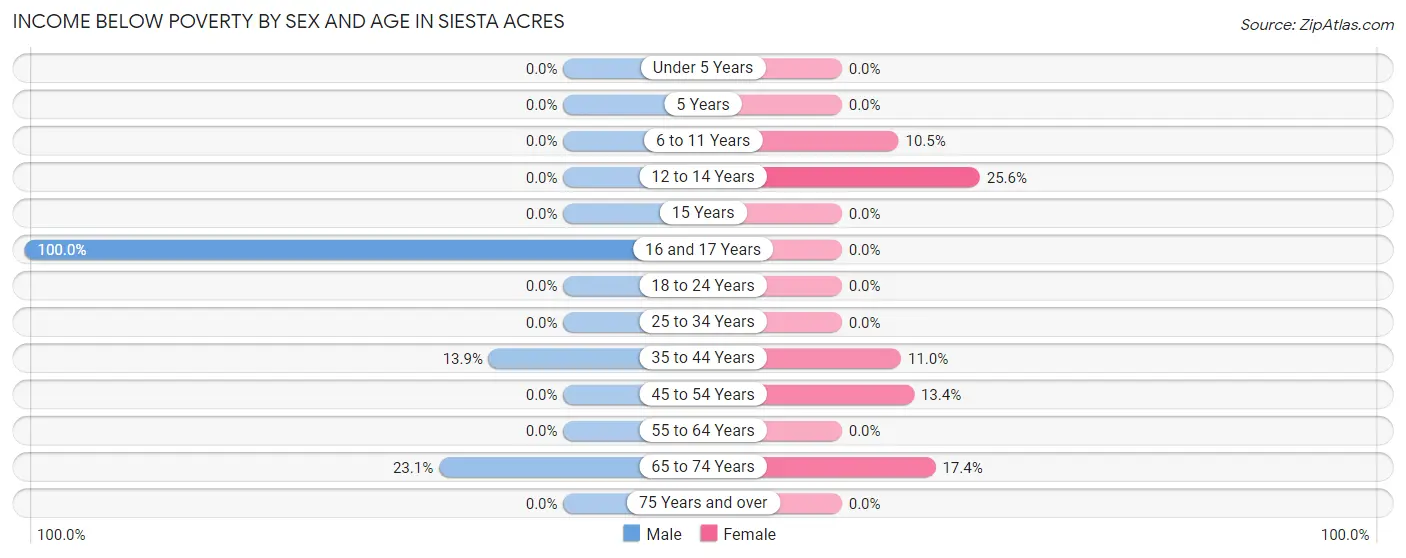
| Age Bracket | Male | Female |
| Under 5 Years | 0 (0.0%) | 0 (0.0%) |
| 5 Years | 0 (0.0%) | 0 (0.0%) |
| 6 to 11 Years | 0 (0.0%) | 20 (10.5%) |
| 12 to 14 Years | 0 (0.0%) | 21 (25.6%) |
| 15 Years | 0 (0.0%) | 0 (0.0%) |
| 16 and 17 Years | 19 (100.0%) | 0 (0.0%) |
| 18 to 24 Years | 0 (0.0%) | 0 (0.0%) |
| 25 to 34 Years | 0 (0.0%) | 0 (0.0%) |
| 35 to 44 Years | 27 (13.9%) | 22 (11.0%) |
| 45 to 54 Years | 0 (0.0%) | 13 (13.4%) |
| 55 to 64 Years | 0 (0.0%) | 0 (0.0%) |
| 65 to 74 Years | 12 (23.1%) | 12 (17.4%) |
| 75 Years and over | 0 (0.0%) | 0 (0.0%) |
| Total | 58 (6.4%) | 88 (12.1%) |
Income Above Poverty by Sex and Age in Siesta Acres
According to the poverty statistics in Siesta Acres, males aged under 5 years and females aged 25 to 34 years are the age groups that are most secure financially, with 100.0% of males and 100.0% of females in these age groups living above the poverty line.
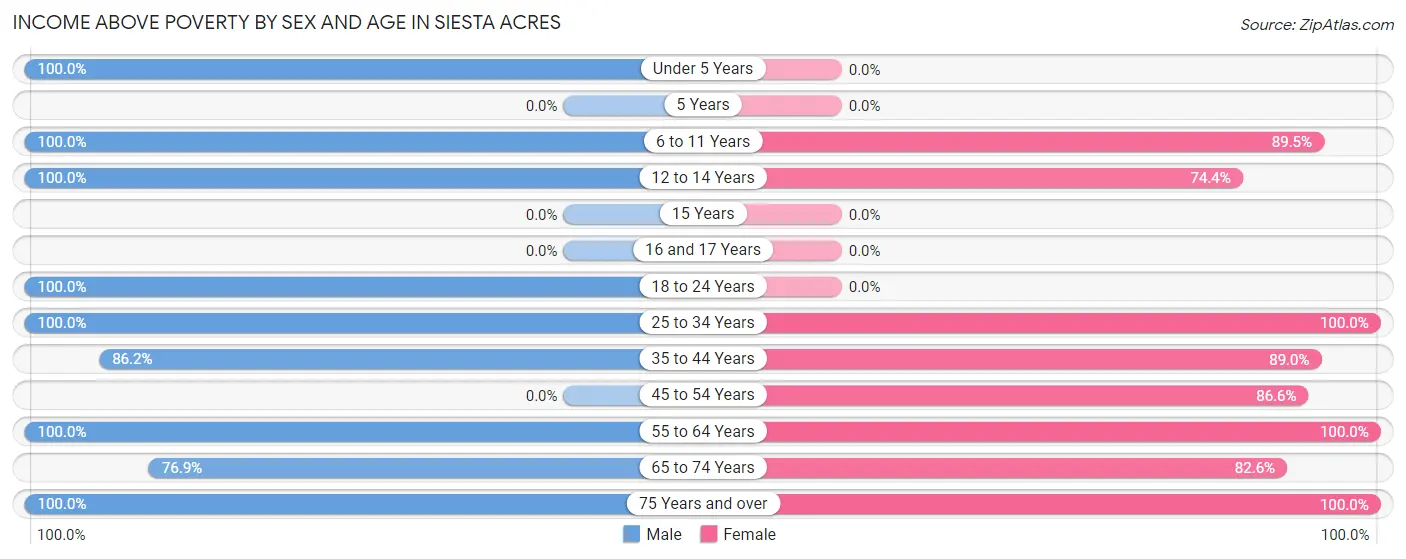
| Age Bracket | Male | Female |
| Under 5 Years | 163 (100.0%) | 0 (0.0%) |
| 5 Years | 0 (0.0%) | 0 (0.0%) |
| 6 to 11 Years | 56 (100.0%) | 170 (89.5%) |
| 12 to 14 Years | 98 (100.0%) | 61 (74.4%) |
| 15 Years | 0 (0.0%) | 0 (0.0%) |
| 16 and 17 Years | 0 (0.0%) | 0 (0.0%) |
| 18 to 24 Years | 54 (100.0%) | 0 (0.0%) |
| 25 to 34 Years | 151 (100.0%) | 32 (100.0%) |
| 35 to 44 Years | 168 (86.2%) | 178 (89.0%) |
| 45 to 54 Years | 0 (0.0%) | 84 (86.6%) |
| 55 to 64 Years | 94 (100.0%) | 37 (100.0%) |
| 65 to 74 Years | 40 (76.9%) | 57 (82.6%) |
| 75 Years and over | 29 (100.0%) | 18 (100.0%) |
| Total | 853 (93.6%) | 637 (87.9%) |
Income Below Poverty Among Married-Couple Families in Siesta Acres
The poverty statistics for married-couple families in Siesta Acres show that 10.2% or 34 of the total 334 families live below the poverty line. Families with 3 or 4 children have the highest poverty rate of 25.6%, comprising of 22 families. On the other hand, families with 1 or 2 children have the lowest poverty rate of 0.0%, which includes 0 families.
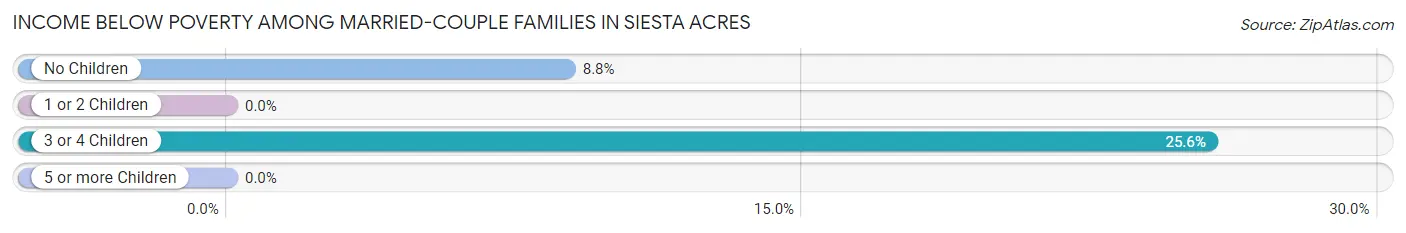
| Children | Above Poverty | Below Poverty |
| No Children | 124 (91.2%) | 12 (8.8%) |
| 1 or 2 Children | 112 (100.0%) | 0 (0.0%) |
| 3 or 4 Children | 64 (74.4%) | 22 (25.6%) |
| 5 or more Children | 0 (0.0%) | 0 (0.0%) |
| Total | 300 (89.8%) | 34 (10.2%) |
Income Below Poverty Among Single-Parent Households in Siesta Acres
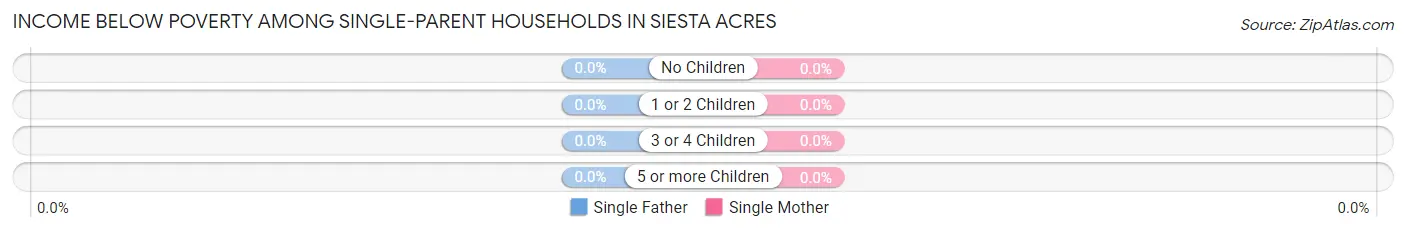
| Children | Single Father | Single Mother |
| No Children | 0 (0.0%) | 0 (0.0%) |
| 1 or 2 Children | 0 (0.0%) | 0 (0.0%) |
| 3 or 4 Children | 0 (0.0%) | 0 (0.0%) |
| 5 or more Children | 0 (0.0%) | 0 (0.0%) |
| Total | 0 (0.0%) | 0 (0.0%) |
Income Below Poverty Among Married-Couple vs Single-Parent Households in Siesta Acres
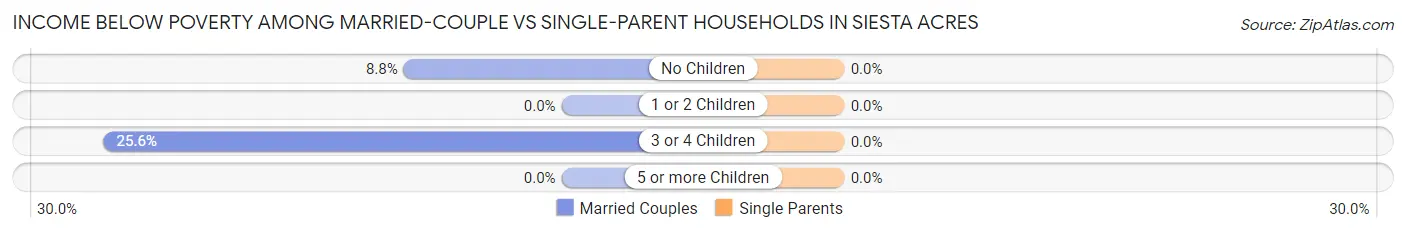
| Children | Married-Couple Families | Single-Parent Households |
| No Children | 12 (8.8%) | 0 (0.0%) |
| 1 or 2 Children | 0 (0.0%) | 0 (0.0%) |
| 3 or 4 Children | 22 (25.6%) | 0 (0.0%) |
| 5 or more Children | 0 (0.0%) | 0 (0.0%) |
| Total | 34 (10.2%) | 0 (0.0%) |
Employment Characteristics in Siesta Acres
Employment by Class of Employer in Siesta Acres
Among the 727 employed individuals in Siesta Acres, private company employees (503 | 69.2%), self-employed (incorporated) (78 | 10.7%), and state government employees (69 | 9.5%) make up the most common classes of employment.
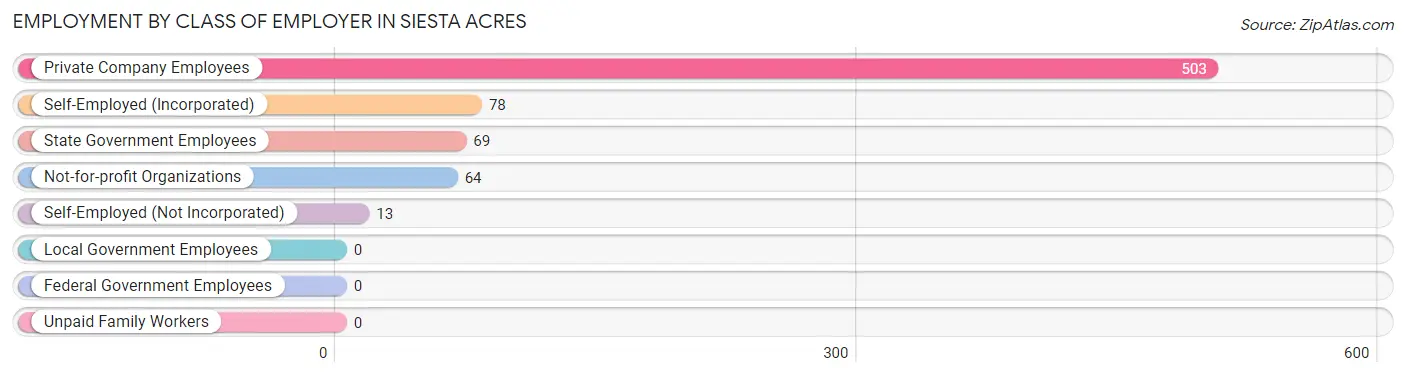
| Employer Class | # Employees | % Employees |
| Private Company Employees | 503 | 69.2% |
| Self-Employed (Incorporated) | 78 | 10.7% |
| Self-Employed (Not Incorporated) | 13 | 1.8% |
| Not-for-profit Organizations | 64 | 8.8% |
| Local Government Employees | 0 | 0.0% |
| State Government Employees | 69 | 9.5% |
| Federal Government Employees | 0 | 0.0% |
| Unpaid Family Workers | 0 | 0.0% |
| Total | 727 | 100.0% |
Employment Status by Age in Siesta Acres
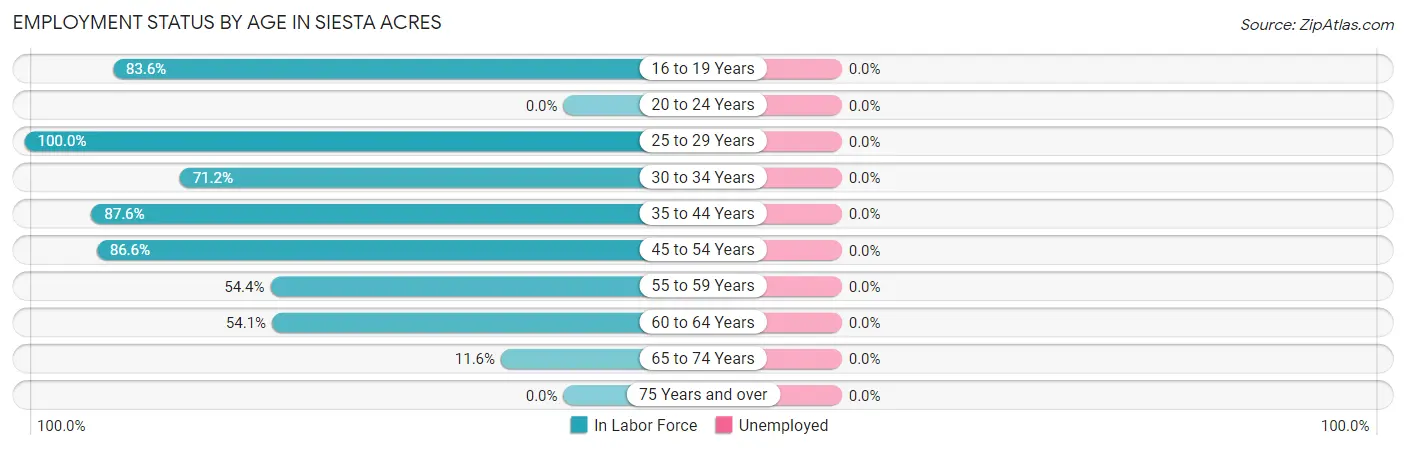
| Age Bracket | In Labor Force | Unemployed |
| 16 to 19 Years | 61 (83.6%) | 0 (0.0%) |
| 20 to 24 Years | 0 (0.0%) | 0 (0.0%) |
| 25 to 29 Years | 72 (100.0%) | 0 (0.0%) |
| 30 to 34 Years | 79 (71.2%) | 0 (0.0%) |
| 35 to 44 Years | 346 (87.6%) | 0 (0.0%) |
| 45 to 54 Years | 84 (86.6%) | 0 (0.0%) |
| 55 to 59 Years | 31 (54.4%) | 0 (0.0%) |
| 60 to 64 Years | 40 (54.1%) | 0 (0.0%) |
| 65 to 74 Years | 14 (11.6%) | 0 (0.0%) |
| 75 Years and over | 0 (0.0%) | 0 (0.0%) |
| Total | 727 (69.4%) | 0 (0.0%) |
Employment Status by Educational Attainment in Siesta Acres
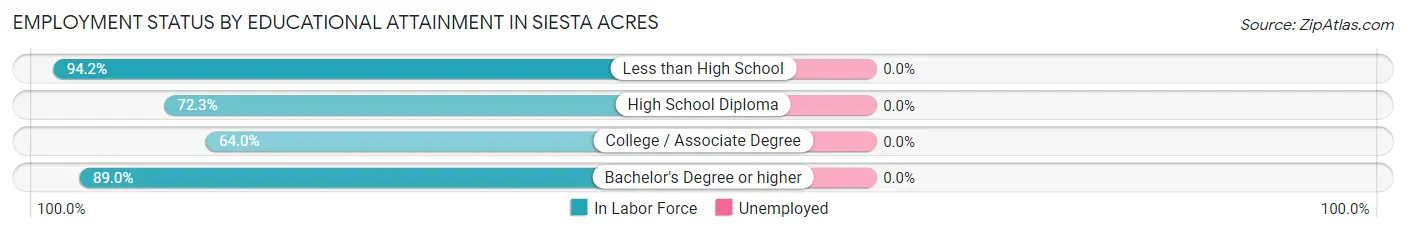
| Educational Attainment | In Labor Force | Unemployed |
| Less than High School | 226 (94.2%) | 0 (0.0%) |
| High School Diploma | 159 (72.3%) | 0 (0.0%) |
| College / Associate Degree | 105 (64.0%) | 0 (0.0%) |
| Bachelor's Degree or higher | 162 (89.0%) | 0 (0.0%) |
| Total | 652 (80.9%) | 0 (0.0%) |
Employment Occupations by Sex in Siesta Acres
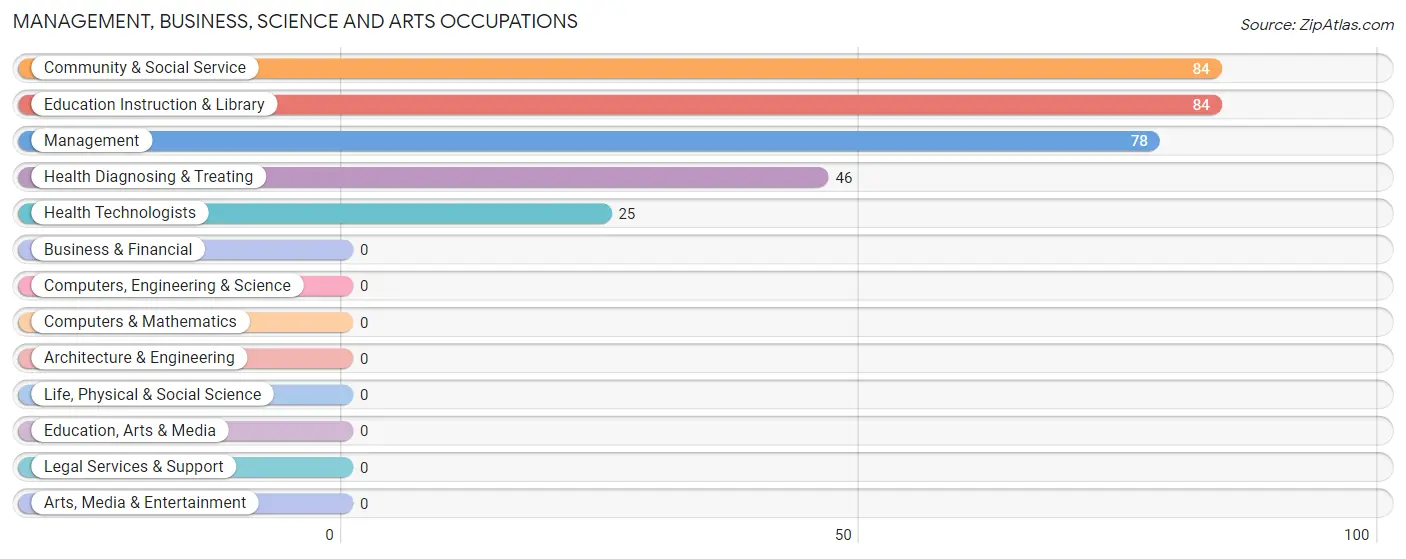
Management, Business, Science and Arts Occupations
The most common Management, Business, Science and Arts occupations in Siesta Acres are Community & Social Service (84 | 11.6%), Education Instruction & Library (84 | 11.6%), Management (78 | 10.7%), Health Diagnosing & Treating (46 | 6.3%), and Health Technologists (25 | 3.4%).
Management, Business, Science and Arts Occupations by Sex
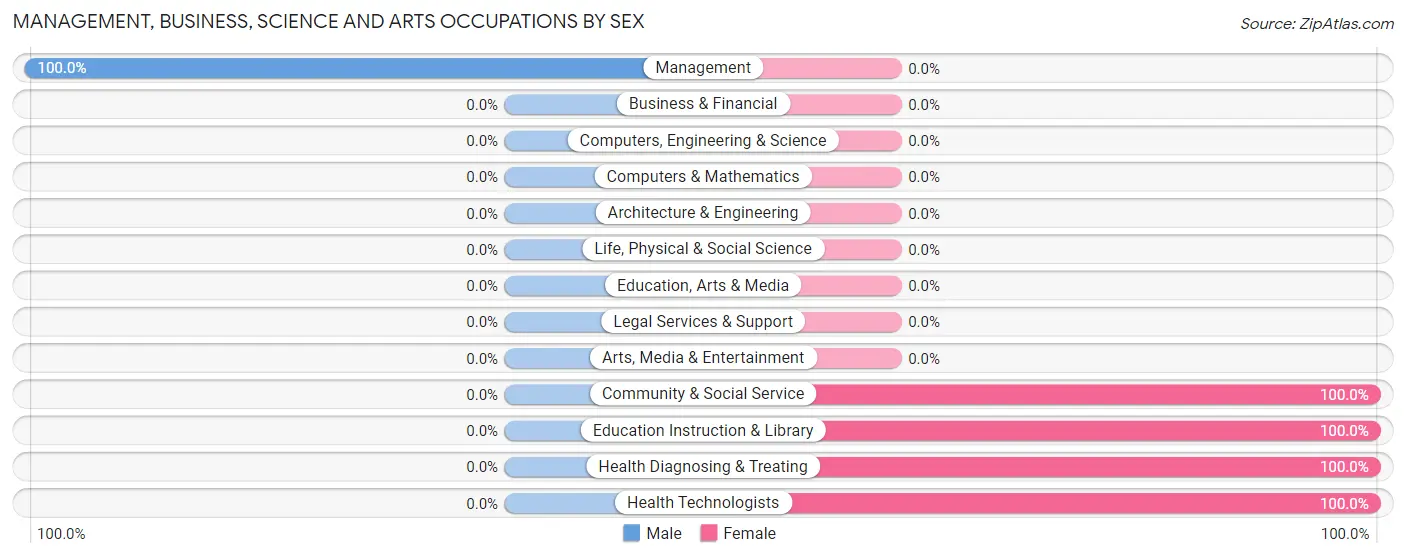
| Occupation | Male | Female |
| Management | 78 (100.0%) | 0 (0.0%) |
| Business & Financial | 0 (0.0%) | 0 (0.0%) |
| Computers, Engineering & Science | 0 (0.0%) | 0 (0.0%) |
| Computers & Mathematics | 0 (0.0%) | 0 (0.0%) |
| Architecture & Engineering | 0 (0.0%) | 0 (0.0%) |
| Life, Physical & Social Science | 0 (0.0%) | 0 (0.0%) |
| Community & Social Service | 0 (0.0%) | 84 (100.0%) |
| Education, Arts & Media | 0 (0.0%) | 0 (0.0%) |
| Legal Services & Support | 0 (0.0%) | 0 (0.0%) |
| Education Instruction & Library | 0 (0.0%) | 84 (100.0%) |
| Arts, Media & Entertainment | 0 (0.0%) | 0 (0.0%) |
| Health Diagnosing & Treating | 0 (0.0%) | 46 (100.0%) |
| Health Technologists | 0 (0.0%) | 25 (100.0%) |
| Total (Category) | 78 (37.5%) | 130 (62.5%) |
| Total (Overall) | 434 (59.7%) | 293 (40.3%) |
Services Occupations
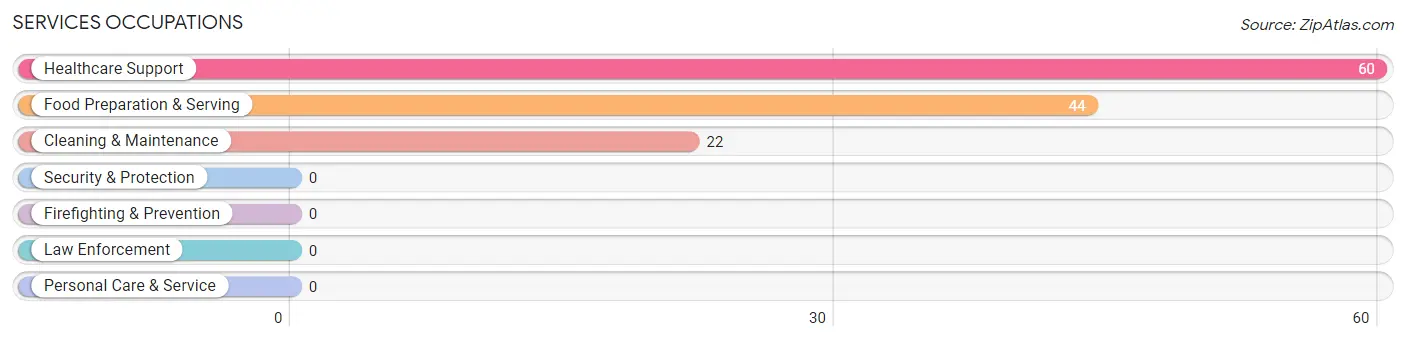
The most common Services occupations in Siesta Acres are Healthcare Support (60 | 8.3%), Food Preparation & Serving (44 | 6.0%), and Cleaning & Maintenance (22 | 3.0%).
Services Occupations by Sex
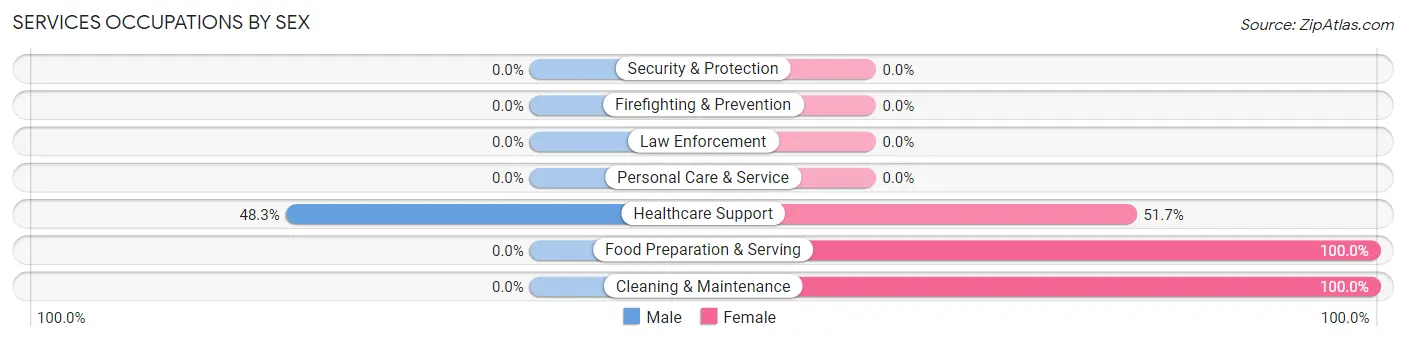
| Occupation | Male | Female |
| Healthcare Support | 29 (48.3%) | 31 (51.7%) |
| Security & Protection | 0 (0.0%) | 0 (0.0%) |
| Firefighting & Prevention | 0 (0.0%) | 0 (0.0%) |
| Law Enforcement | 0 (0.0%) | 0 (0.0%) |
| Food Preparation & Serving | 0 (0.0%) | 44 (100.0%) |
| Cleaning & Maintenance | 0 (0.0%) | 22 (100.0%) |
| Personal Care & Service | 0 (0.0%) | 0 (0.0%) |
| Total (Category) | 29 (23.0%) | 97 (77.0%) |
| Total (Overall) | 434 (59.7%) | 293 (40.3%) |
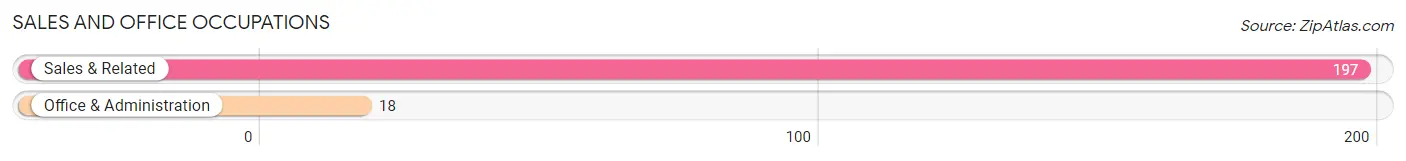
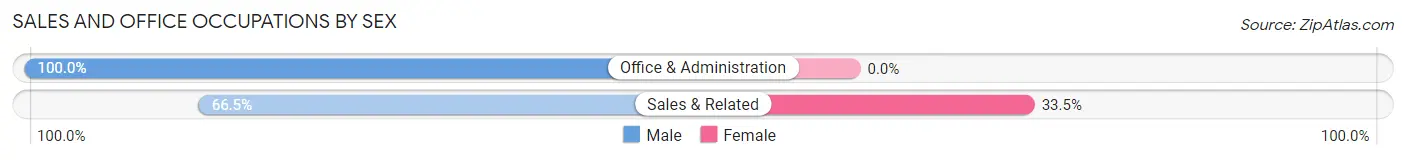
Sales and Office Occupations
The most common Sales and Office occupations in Siesta Acres are Sales & Related (197 | 27.1%), and Office & Administration (18 | 2.5%).
Sales and Office Occupations by Sex
| Occupation | Male | Female |
| Sales & Related | 131 (66.5%) | 66 (33.5%) |
| Office & Administration | 18 (100.0%) | 0 (0.0%) |
| Total (Category) | 149 (69.3%) | 66 (30.7%) |
| Total (Overall) | 434 (59.7%) | 293 (40.3%) |
Natural Resources, Construction and Maintenance Occupations
Natural Resources, Construction and Maintenance Occupations by Sex
| Occupation | Male | Female |
| Farming, Fishing & Forestry | 0 (0.0%) | 0 (0.0%) |
| Construction & Extraction | 0 (0.0%) | 0 (0.0%) |
| Installation, Maintenance & Repair | 0 (0.0%) | 0 (0.0%) |
| Total (Category) | 0 (0.0%) | 0 (0.0%) |
| Total (Overall) | 434 (59.7%) | 293 (40.3%) |
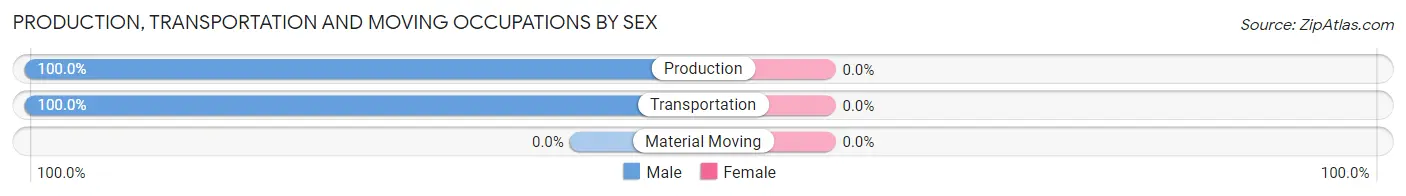
Production, Transportation and Moving Occupations
The most common Production, Transportation and Moving occupations in Siesta Acres are Transportation (99 | 13.6%), and Production (79 | 10.9%).
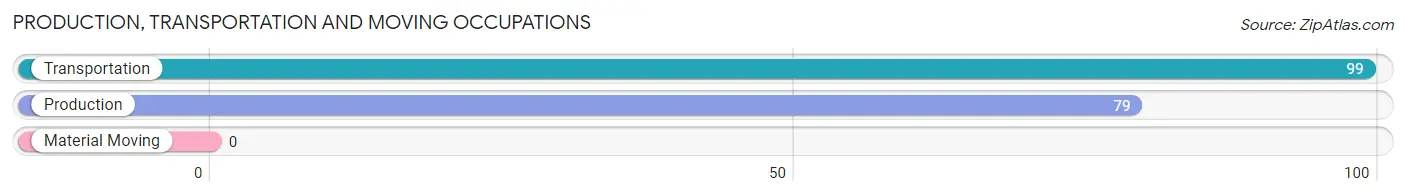
Production, Transportation and Moving Occupations by Sex
| Occupation | Male | Female |
| Production | 79 (100.0%) | 0 (0.0%) |
| Transportation | 99 (100.0%) | 0 (0.0%) |
| Material Moving | 0 (0.0%) | 0 (0.0%) |
| Total (Category) | 178 (100.0%) | 0 (0.0%) |
| Total (Overall) | 434 (59.7%) | 293 (40.3%) |
Employment Industries by Sex in Siesta Acres
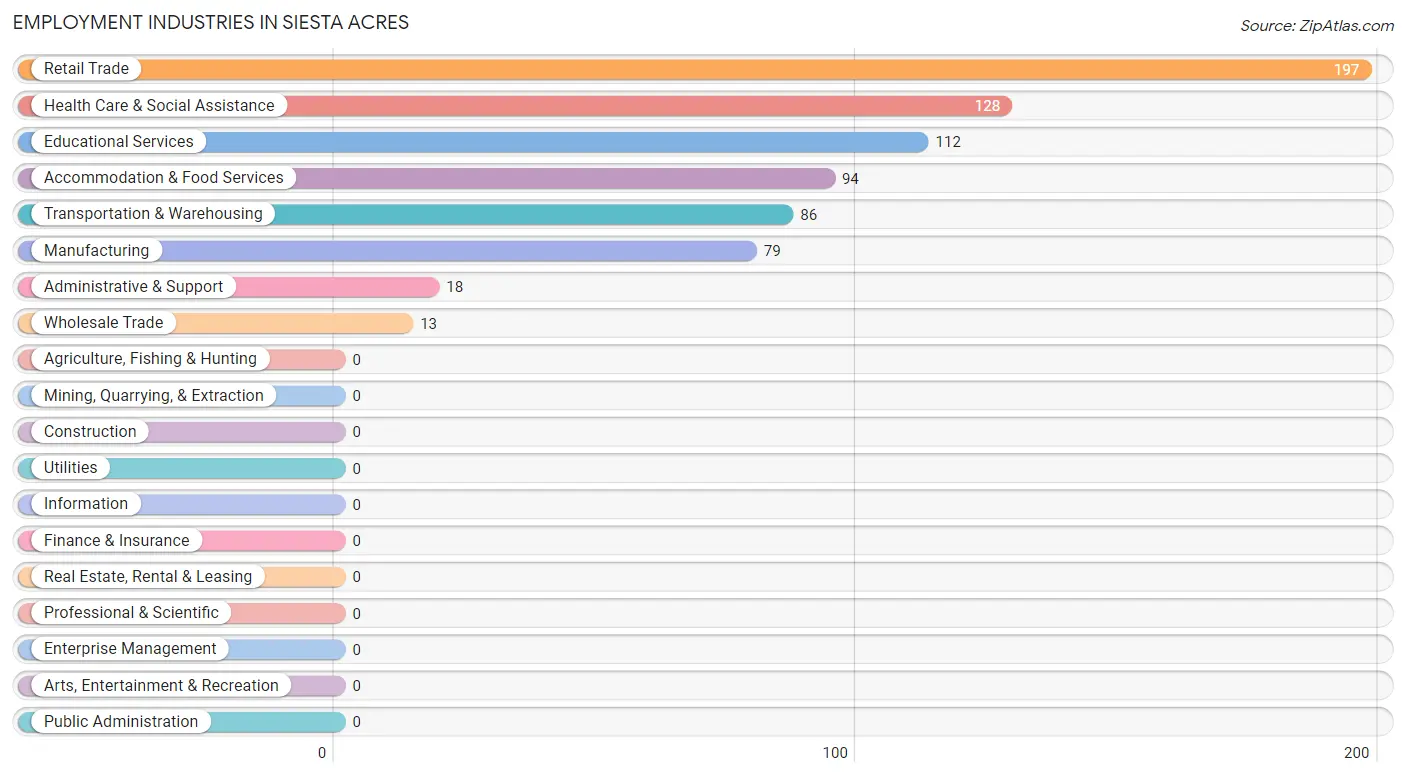
Employment Industries in Siesta Acres
The major employment industries in Siesta Acres include Retail Trade (197 | 27.1%), Health Care & Social Assistance (128 | 17.6%), Educational Services (112 | 15.4%), Accommodation & Food Services (94 | 12.9%), and Transportation & Warehousing (86 | 11.8%).
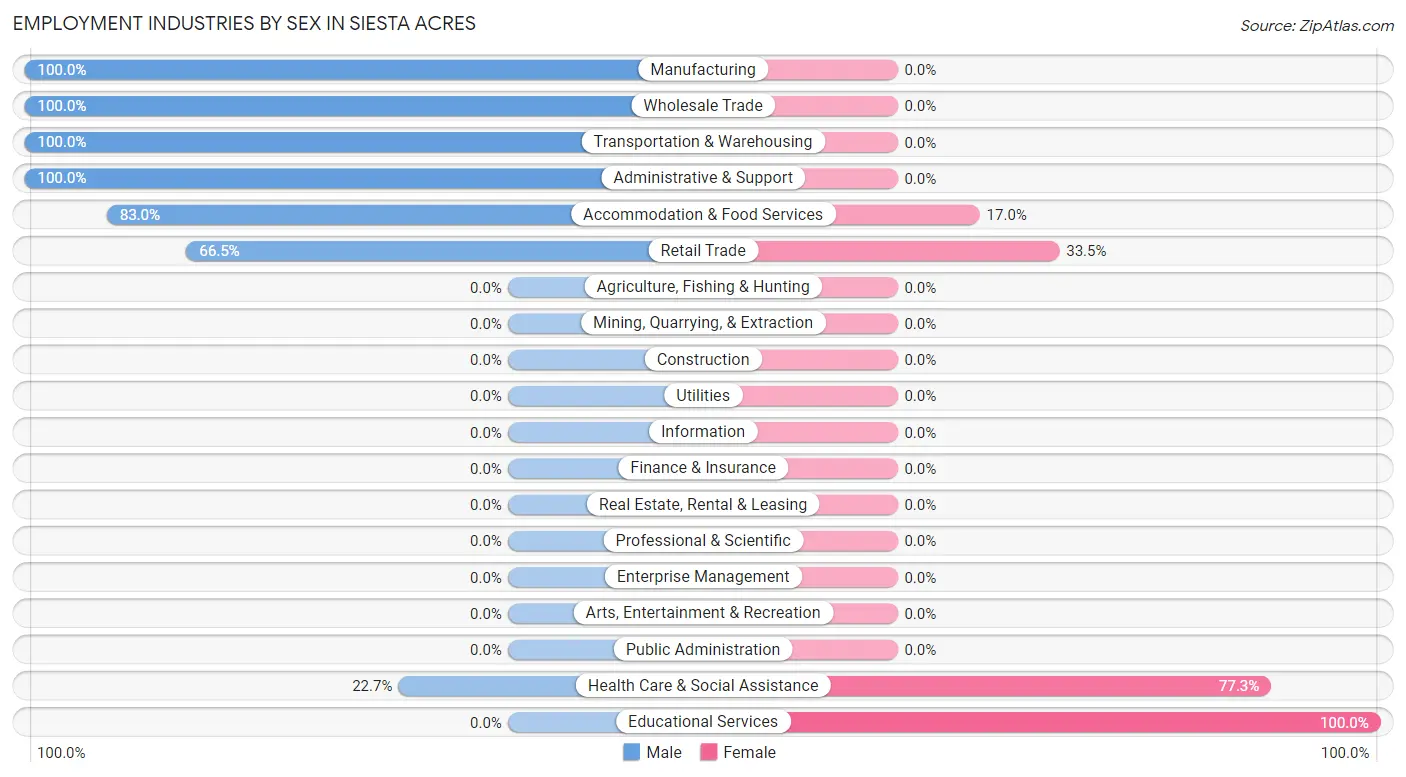
Employment Industries by Sex in Siesta Acres
The Siesta Acres industries that see more men than women are Manufacturing (100.0%), Wholesale Trade (100.0%), and Transportation & Warehousing (100.0%), whereas the industries that tend to have a higher number of women are Educational Services (100.0%), Health Care & Social Assistance (77.3%), and Retail Trade (33.5%).
| Industry | Male | Female |
| Agriculture, Fishing & Hunting | 0 (0.0%) | 0 (0.0%) |
| Mining, Quarrying, & Extraction | 0 (0.0%) | 0 (0.0%) |
| Construction | 0 (0.0%) | 0 (0.0%) |
| Manufacturing | 79 (100.0%) | 0 (0.0%) |
| Wholesale Trade | 13 (100.0%) | 0 (0.0%) |
| Retail Trade | 131 (66.5%) | 66 (33.5%) |
| Transportation & Warehousing | 86 (100.0%) | 0 (0.0%) |
| Utilities | 0 (0.0%) | 0 (0.0%) |
| Information | 0 (0.0%) | 0 (0.0%) |
| Finance & Insurance | 0 (0.0%) | 0 (0.0%) |
| Real Estate, Rental & Leasing | 0 (0.0%) | 0 (0.0%) |
| Professional & Scientific | 0 (0.0%) | 0 (0.0%) |
| Enterprise Management | 0 (0.0%) | 0 (0.0%) |
| Administrative & Support | 18 (100.0%) | 0 (0.0%) |
| Educational Services | 0 (0.0%) | 112 (100.0%) |
| Health Care & Social Assistance | 29 (22.7%) | 99 (77.3%) |
| Arts, Entertainment & Recreation | 0 (0.0%) | 0 (0.0%) |
| Accommodation & Food Services | 78 (83.0%) | 16 (17.0%) |
| Public Administration | 0 (0.0%) | 0 (0.0%) |
| Total | 434 (59.7%) | 293 (40.3%) |
Education in Siesta Acres
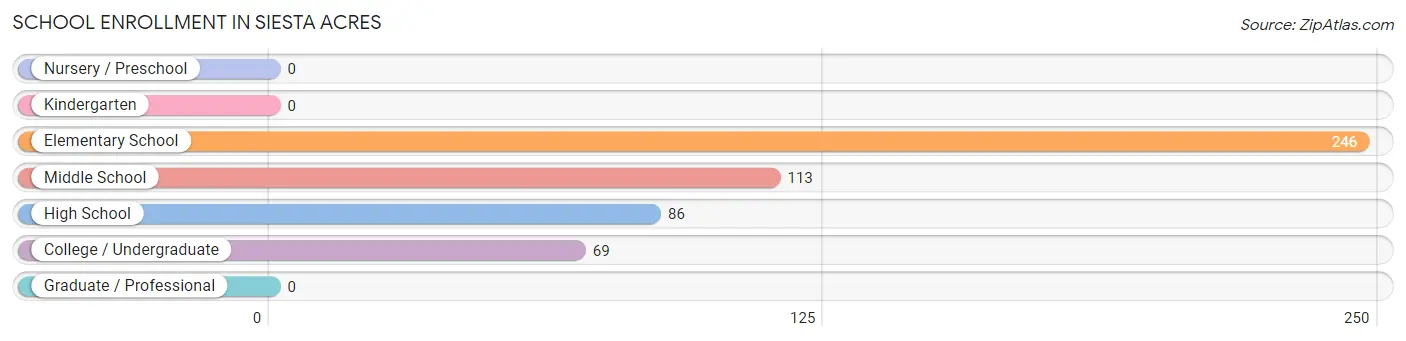
School Enrollment in Siesta Acres
The most common levels of schooling among the 514 students in Siesta Acres are elementary school (246 | 47.9%), middle school (113 | 22.0%), and high school (86 | 16.7%).
| School Level | # Students | % Students |
| Nursery / Preschool | 0 | 0.0% |
| Kindergarten | 0 | 0.0% |
| Elementary School | 246 | 47.9% |
| Middle School | 113 | 22.0% |
| High School | 86 | 16.7% |
| College / Undergraduate | 69 | 13.4% |
| Graduate / Professional | 0 | 0.0% |
| Total | 514 | 100.0% |
School Enrollment by Age by Funding Source in Siesta Acres
Out of a total of 514 students who are enrolled in schools in Siesta Acres, 25 (4.9%) attend a private institution, while the remaining 489 (95.1%) are enrolled in public schools. The age group of 35 years and over has the highest likelihood of being enrolled in private schools, with 25 (100.0% in the age bracket) enrolled. Conversely, the age group of 5 to 9 year old has the lowest likelihood of being enrolled in a private school, with 226 (100.0% in the age bracket) attending a public institution.
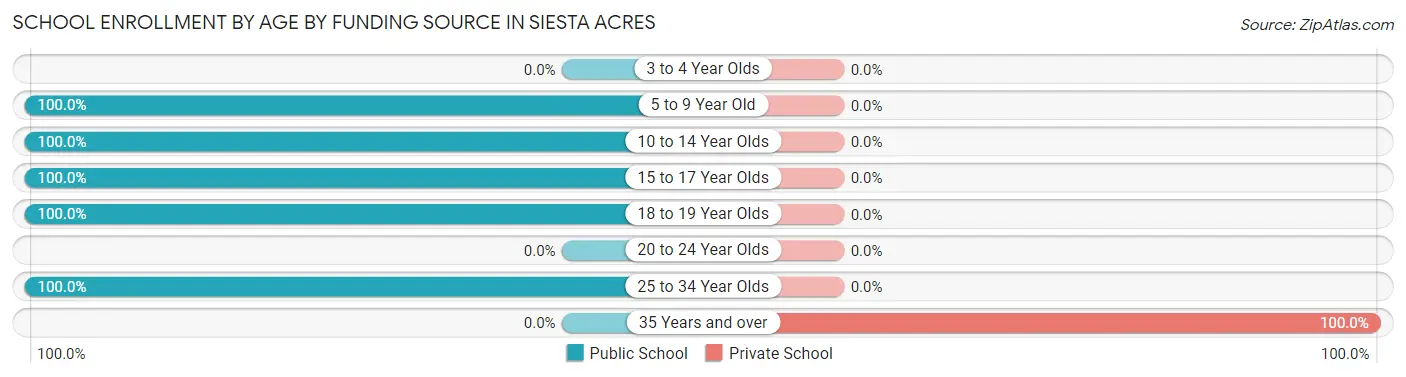
| Age Bracket | Public School | Private School |
| 3 to 4 Year Olds | 0 (0.0%) | 0 (0.0%) |
| 5 to 9 Year Old | 226 (100.0%) | 0 (0.0%) |
| 10 to 14 Year Olds | 200 (100.0%) | 0 (0.0%) |
| 15 to 17 Year Olds | 19 (100.0%) | 0 (0.0%) |
| 18 to 19 Year Olds | 12 (100.0%) | 0 (0.0%) |
| 20 to 24 Year Olds | 0 (0.0%) | 0 (0.0%) |
| 25 to 34 Year Olds | 32 (100.0%) | 0 (0.0%) |
| 35 Years and over | 0 (0.0%) | 25 (100.0%) |
| Total | 489 (95.1%) | 25 (4.9%) |
Educational Attainment by Field of Study in Siesta Acres
Business (78 | 42.9%), arts & humanities (64 | 35.2%), multidisciplinary studies (20 | 11.0%), and education (20 | 11.0%) are the most common fields of study among 182 individuals in Siesta Acres who have obtained a bachelor's degree or higher.
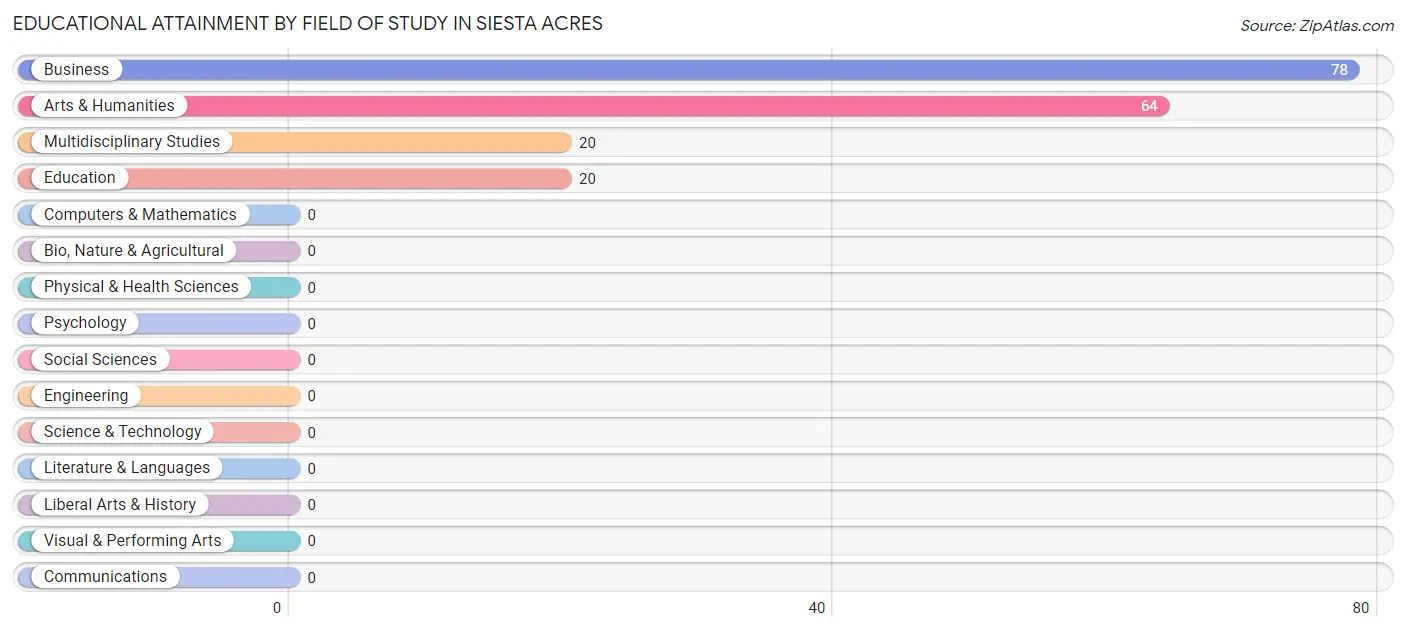
| Field of Study | # Graduates | % Graduates |
| Computers & Mathematics | 0 | 0.0% |
| Bio, Nature & Agricultural | 0 | 0.0% |
| Physical & Health Sciences | 0 | 0.0% |
| Psychology | 0 | 0.0% |
| Social Sciences | 0 | 0.0% |
| Engineering | 0 | 0.0% |
| Multidisciplinary Studies | 20 | 11.0% |
| Science & Technology | 0 | 0.0% |
| Business | 78 | 42.9% |
| Education | 20 | 11.0% |
| Literature & Languages | 0 | 0.0% |
| Liberal Arts & History | 0 | 0.0% |
| Visual & Performing Arts | 0 | 0.0% |
| Communications | 0 | 0.0% |
| Arts & Humanities | 64 | 35.2% |
| Total | 182 | 100.0% |
Transportation & Commute in Siesta Acres
Vehicle Availability by Sex in Siesta Acres
The most prevalent vehicle ownership categories in Siesta Acres are males with 2 vehicles (250, accounting for 57.6%) and females with 2 vehicles (181, making up 85.3%).
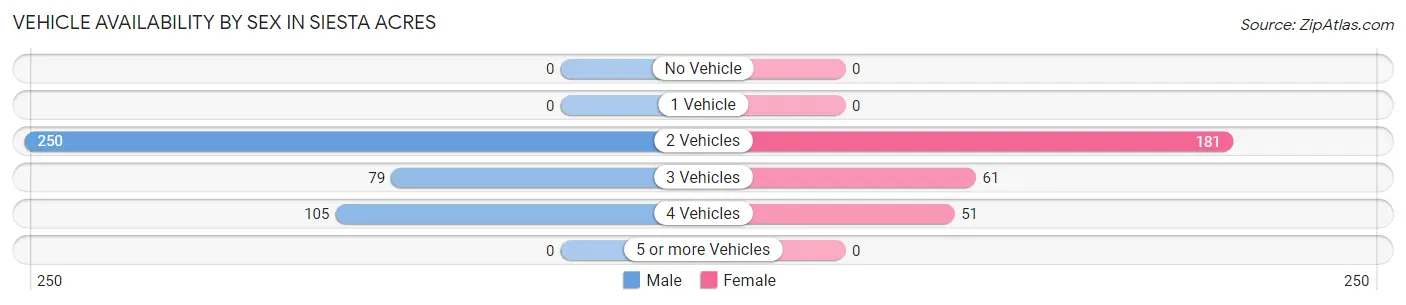
| Vehicles Available | Male | Female |
| No Vehicle | 0 (0.0%) | 0 (0.0%) |
| 1 Vehicle | 0 (0.0%) | 0 (0.0%) |
| 2 Vehicles | 250 (57.6%) | 181 (61.8%) |
| 3 Vehicles | 79 (18.2%) | 61 (20.8%) |
| 4 Vehicles | 105 (24.2%) | 51 (17.4%) |
| 5 or more Vehicles | 0 (0.0%) | 0 (0.0%) |
| Total | 434 (100.0%) | 293 (100.0%) |
Commute Time in Siesta Acres
The most frequently occuring commute durations in Siesta Acres are 10 to 14 minutes (258 commuters, 35.5%), 15 to 19 minutes (186 commuters, 25.6%), and 20 to 24 minutes (117 commuters, 16.1%).
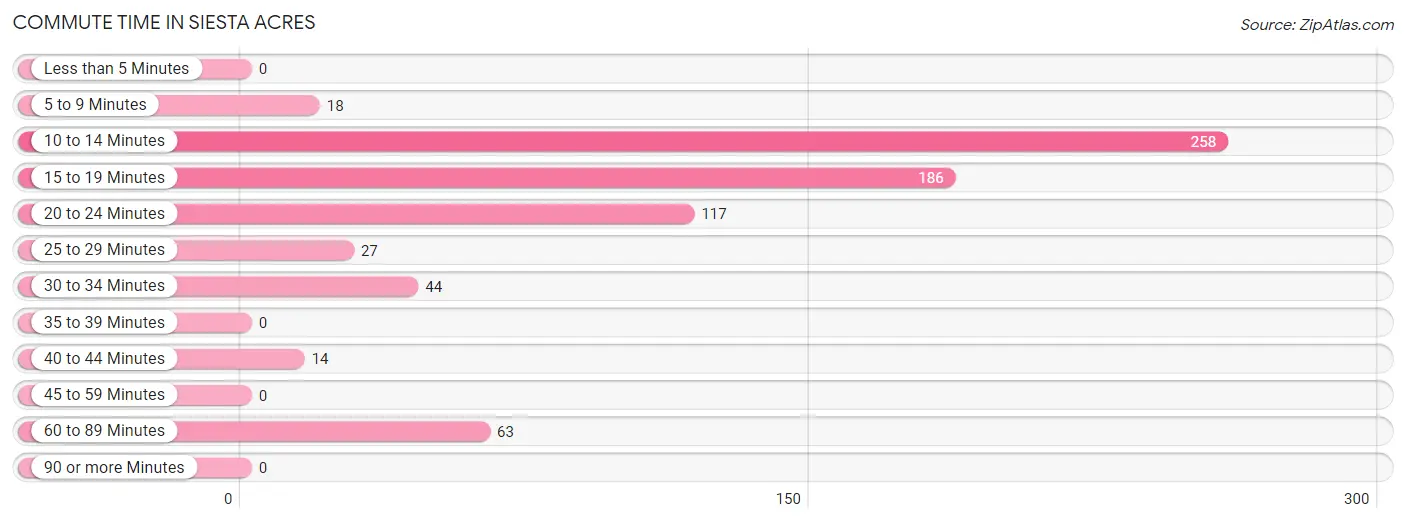
| Commute Time | # Commuters | % Commuters |
| Less than 5 Minutes | 0 | 0.0% |
| 5 to 9 Minutes | 18 | 2.5% |
| 10 to 14 Minutes | 258 | 35.5% |
| 15 to 19 Minutes | 186 | 25.6% |
| 20 to 24 Minutes | 117 | 16.1% |
| 25 to 29 Minutes | 27 | 3.7% |
| 30 to 34 Minutes | 44 | 6.0% |
| 35 to 39 Minutes | 0 | 0.0% |
| 40 to 44 Minutes | 14 | 1.9% |
| 45 to 59 Minutes | 0 | 0.0% |
| 60 to 89 Minutes | 63 | 8.7% |
| 90 or more Minutes | 0 | 0.0% |
Commute Time by Sex in Siesta Acres
The most common commute times in Siesta Acres are 10 to 14 minutes (205 commuters, 47.2%) for males and 20 to 24 minutes (104 commuters, 35.5%) for females.
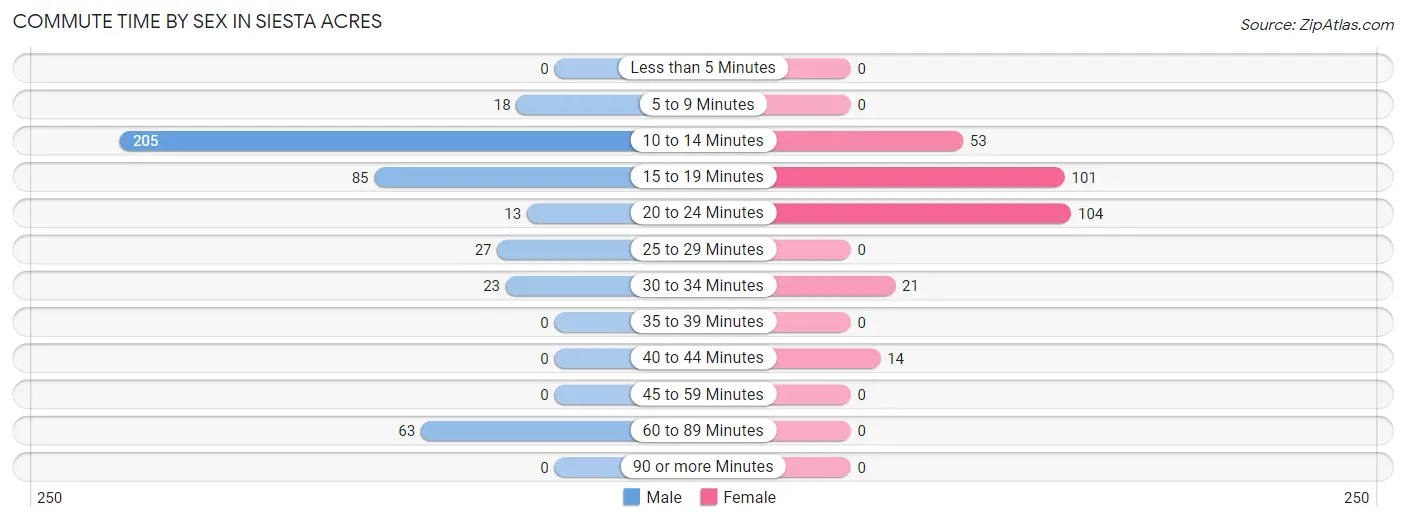
| Commute Time | Male | Female |
| Less than 5 Minutes | 0 (0.0%) | 0 (0.0%) |
| 5 to 9 Minutes | 18 (4.2%) | 0 (0.0%) |
| 10 to 14 Minutes | 205 (47.2%) | 53 (18.1%) |
| 15 to 19 Minutes | 85 (19.6%) | 101 (34.5%) |
| 20 to 24 Minutes | 13 (3.0%) | 104 (35.5%) |
| 25 to 29 Minutes | 27 (6.2%) | 0 (0.0%) |
| 30 to 34 Minutes | 23 (5.3%) | 21 (7.2%) |
| 35 to 39 Minutes | 0 (0.0%) | 0 (0.0%) |
| 40 to 44 Minutes | 0 (0.0%) | 14 (4.8%) |
| 45 to 59 Minutes | 0 (0.0%) | 0 (0.0%) |
| 60 to 89 Minutes | 63 (14.5%) | 0 (0.0%) |
| 90 or more Minutes | 0 (0.0%) | 0 (0.0%) |
Time of Departure to Work by Sex in Siesta Acres
The most frequent times of departure to work in Siesta Acres are 8:00 AM to 8:29 AM (96, 22.1%) for males and 7:30 AM to 7:59 AM (89, 30.4%) for females.
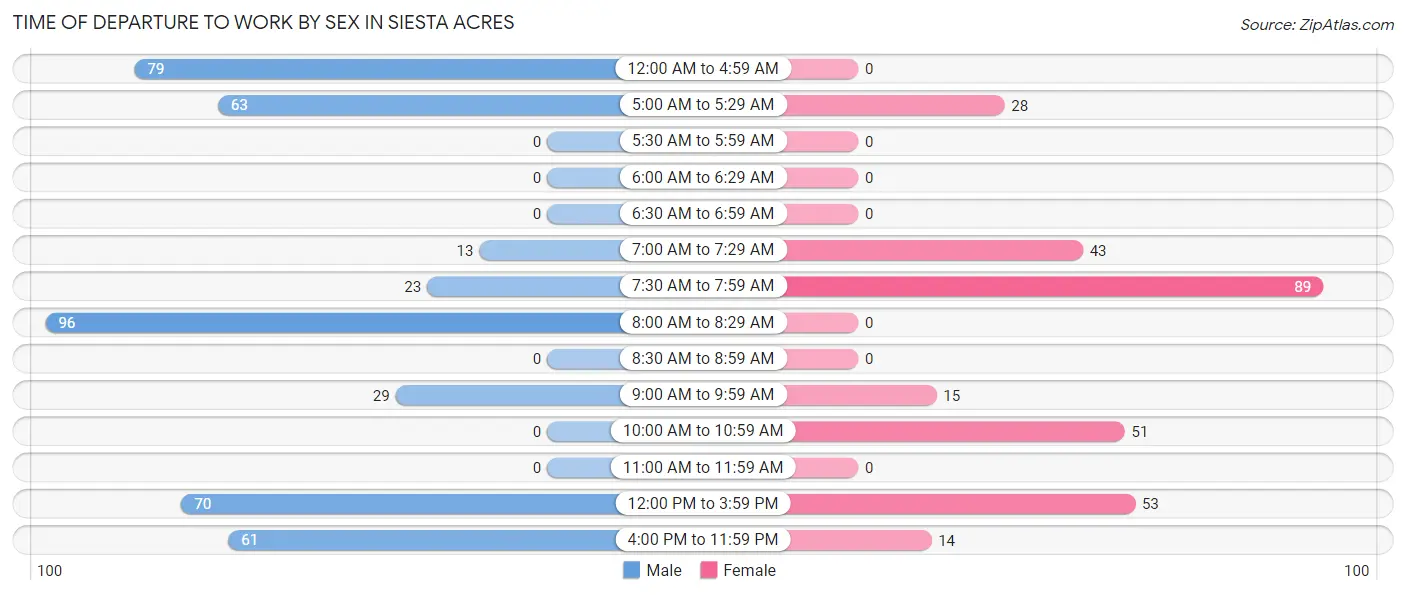
| Time of Departure | Male | Female |
| 12:00 AM to 4:59 AM | 79 (18.2%) | 0 (0.0%) |
| 5:00 AM to 5:29 AM | 63 (14.5%) | 28 (9.6%) |
| 5:30 AM to 5:59 AM | 0 (0.0%) | 0 (0.0%) |
| 6:00 AM to 6:29 AM | 0 (0.0%) | 0 (0.0%) |
| 6:30 AM to 6:59 AM | 0 (0.0%) | 0 (0.0%) |
| 7:00 AM to 7:29 AM | 13 (3.0%) | 43 (14.7%) |
| 7:30 AM to 7:59 AM | 23 (5.3%) | 89 (30.4%) |
| 8:00 AM to 8:29 AM | 96 (22.1%) | 0 (0.0%) |
| 8:30 AM to 8:59 AM | 0 (0.0%) | 0 (0.0%) |
| 9:00 AM to 9:59 AM | 29 (6.7%) | 15 (5.1%) |
| 10:00 AM to 10:59 AM | 0 (0.0%) | 51 (17.4%) |
| 11:00 AM to 11:59 AM | 0 (0.0%) | 0 (0.0%) |
| 12:00 PM to 3:59 PM | 70 (16.1%) | 53 (18.1%) |
| 4:00 PM to 11:59 PM | 61 (14.1%) | 14 (4.8%) |
| Total | 434 (100.0%) | 293 (100.0%) |
Housing Occupancy in Siesta Acres
Occupancy by Ownership in Siesta Acres
Of the total 393 dwellings in Siesta Acres, owner-occupied units account for 358 (91.1%), while renter-occupied units make up 35 (8.9%).
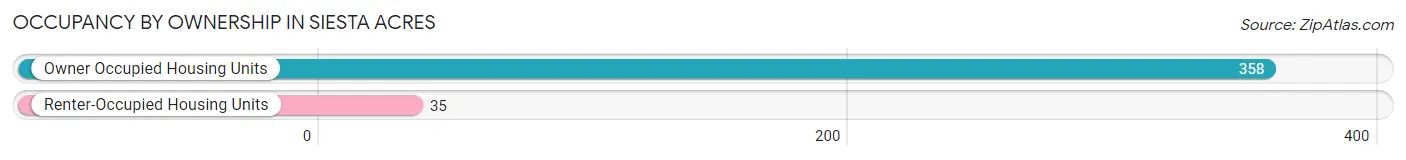
| Occupancy | # Housing Units | % Housing Units |
| Owner Occupied Housing Units | 358 | 91.1% |
| Renter-Occupied Housing Units | 35 | 8.9% |
| Total Occupied Housing Units | 393 | 100.0% |
Occupancy by Household Size in Siesta Acres
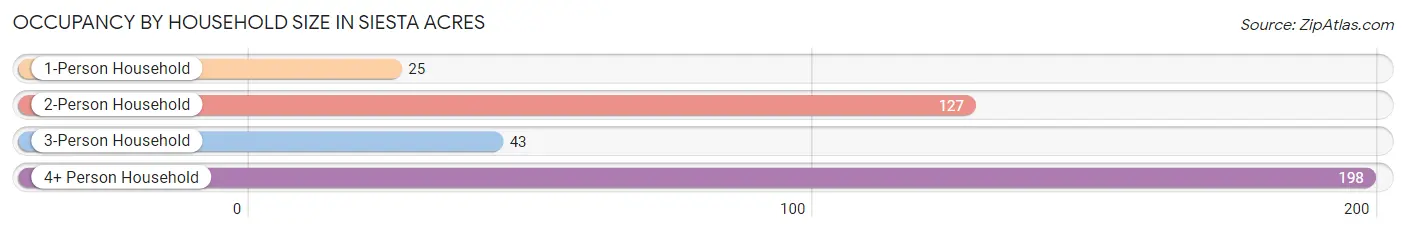
| Household Size | # Housing Units | % Housing Units |
| 1-Person Household | 25 | 6.4% |
| 2-Person Household | 127 | 32.3% |
| 3-Person Household | 43 | 10.9% |
| 4+ Person Household | 198 | 50.4% |
| Total Housing Units | 393 | 100.0% |
Occupancy by Ownership by Household Size in Siesta Acres
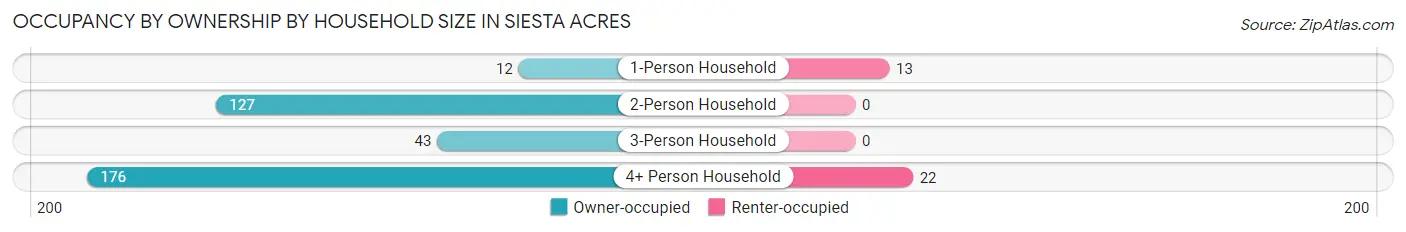
| Household Size | Owner-occupied | Renter-occupied |
| 1-Person Household | 12 (48.0%) | 13 (52.0%) |
| 2-Person Household | 127 (100.0%) | 0 (0.0%) |
| 3-Person Household | 43 (100.0%) | 0 (0.0%) |
| 4+ Person Household | 176 (88.9%) | 22 (11.1%) |
| Total Housing Units | 358 (91.1%) | 35 (8.9%) |
Occupancy by Educational Attainment in Siesta Acres
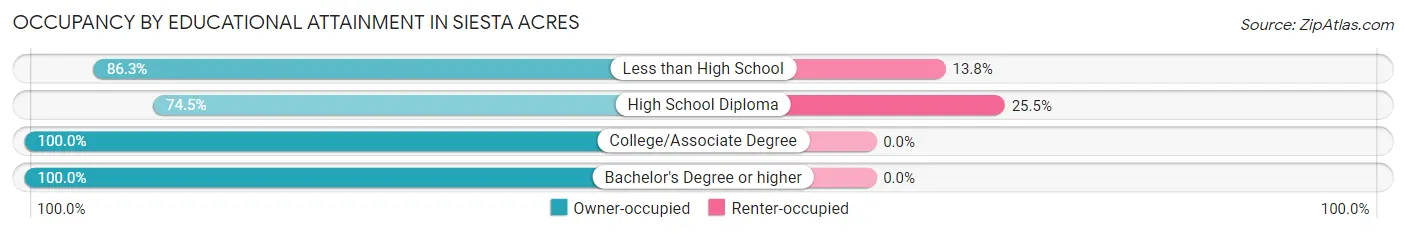
| Household Size | Owner-occupied | Renter-occupied |
| Less than High School | 138 (86.3%) | 22 (13.8%) |
| High School Diploma | 38 (74.5%) | 13 (25.5%) |
| College/Associate Degree | 98 (100.0%) | 0 (0.0%) |
| Bachelor's Degree or higher | 84 (100.0%) | 0 (0.0%) |
Occupancy by Age of Householder in Siesta Acres
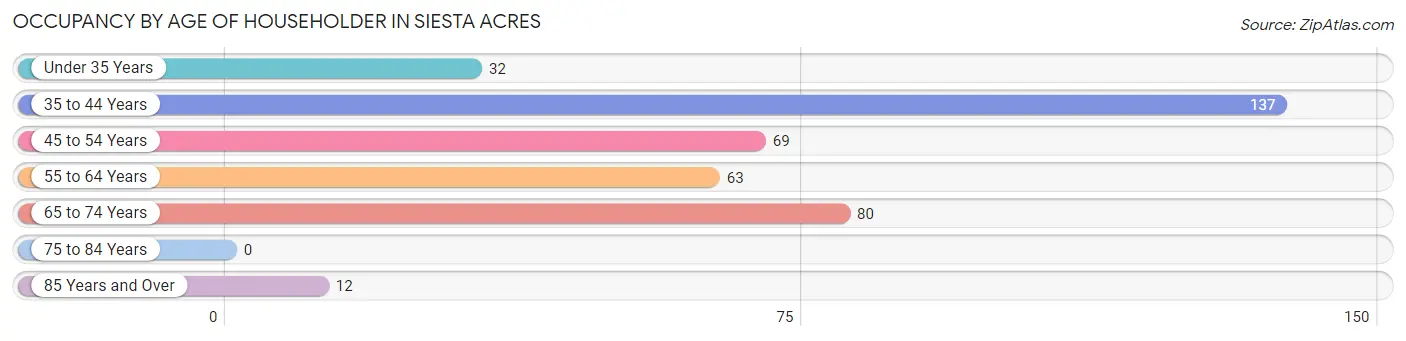
| Age Bracket | # Households | % Households |
| Under 35 Years | 32 | 8.1% |
| 35 to 44 Years | 137 | 34.9% |
| 45 to 54 Years | 69 | 17.6% |
| 55 to 64 Years | 63 | 16.0% |
| 65 to 74 Years | 80 | 20.4% |
| 75 to 84 Years | 0 | 0.0% |
| 85 Years and Over | 12 | 3.0% |
| Total | 393 | 100.0% |
Housing Finances in Siesta Acres
Median Income by Occupancy in Siesta Acres
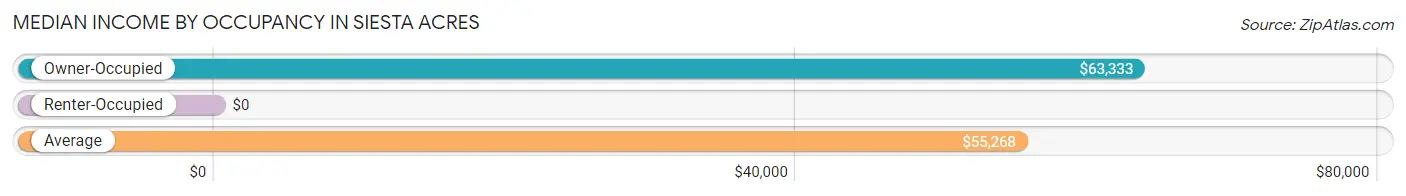
| Occupancy Type | # Households | Median Income |
| Owner-Occupied | 358 (91.1%) | $63,333 |
| Renter-Occupied | 35 (8.9%) | $0 |
| Average | 393 (100.0%) | $55,268 |
Occupancy by Householder Income Bracket in Siesta Acres
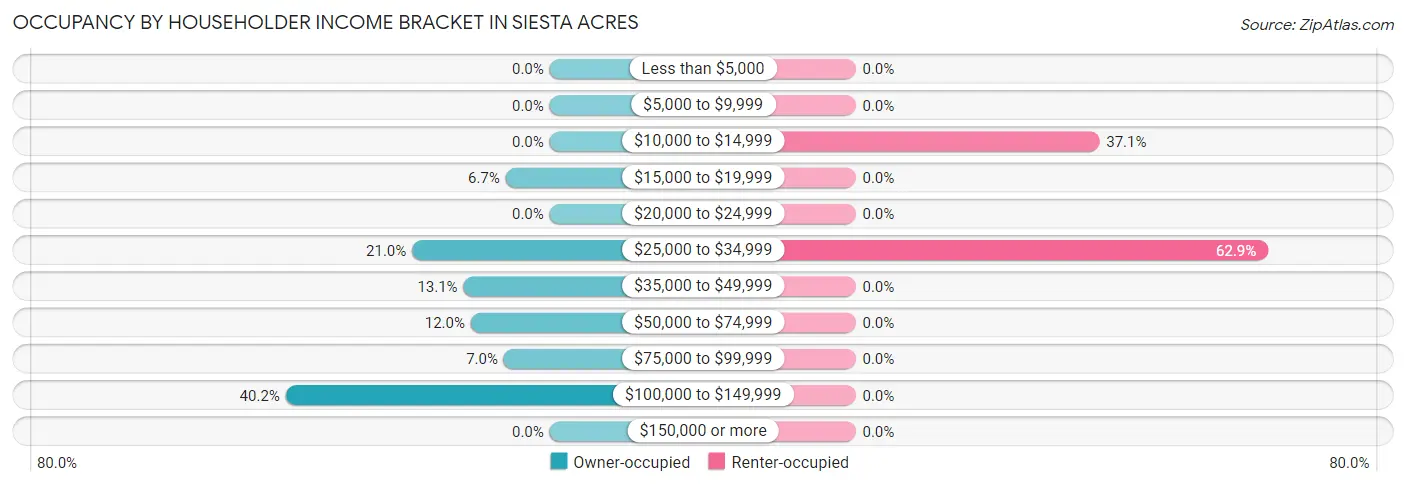
| Income Bracket | Owner-occupied | Renter-occupied |
| Less than $5,000 | 0 (0.0%) | 0 (0.0%) |
| $5,000 to $9,999 | 0 (0.0%) | 0 (0.0%) |
| $10,000 to $14,999 | 0 (0.0%) | 13 (37.1%) |
| $15,000 to $19,999 | 24 (6.7%) | 0 (0.0%) |
| $20,000 to $24,999 | 0 (0.0%) | 0 (0.0%) |
| $25,000 to $34,999 | 75 (20.9%) | 22 (62.9%) |
| $35,000 to $49,999 | 47 (13.1%) | 0 (0.0%) |
| $50,000 to $74,999 | 43 (12.0%) | 0 (0.0%) |
| $75,000 to $99,999 | 25 (7.0%) | 0 (0.0%) |
| $100,000 to $149,999 | 144 (40.2%) | 0 (0.0%) |
| $150,000 or more | 0 (0.0%) | 0 (0.0%) |
| Total | 358 (100.0%) | 35 (100.0%) |
Monthly Housing Cost Tiers in Siesta Acres
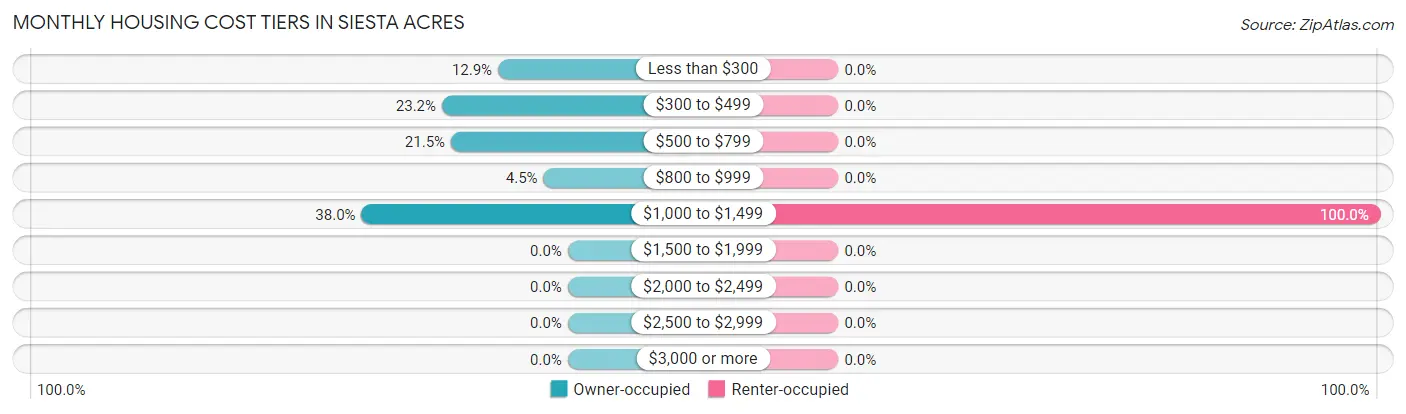
| Monthly Cost | Owner-occupied | Renter-occupied |
| Less than $300 | 46 (12.9%) | 0 (0.0%) |
| $300 to $499 | 83 (23.2%) | 0 (0.0%) |
| $500 to $799 | 77 (21.5%) | 0 (0.0%) |
| $800 to $999 | 16 (4.5%) | 0 (0.0%) |
| $1,000 to $1,499 | 136 (38.0%) | 35 (100.0%) |
| $1,500 to $1,999 | 0 (0.0%) | 0 (0.0%) |
| $2,000 to $2,499 | 0 (0.0%) | 0 (0.0%) |
| $2,500 to $2,999 | 0 (0.0%) | 0 (0.0%) |
| $3,000 or more | 0 (0.0%) | 0 (0.0%) |
| Total | 358 (100.0%) | 35 (100.0%) |
Physical Housing Characteristics in Siesta Acres
Housing Structures in Siesta Acres
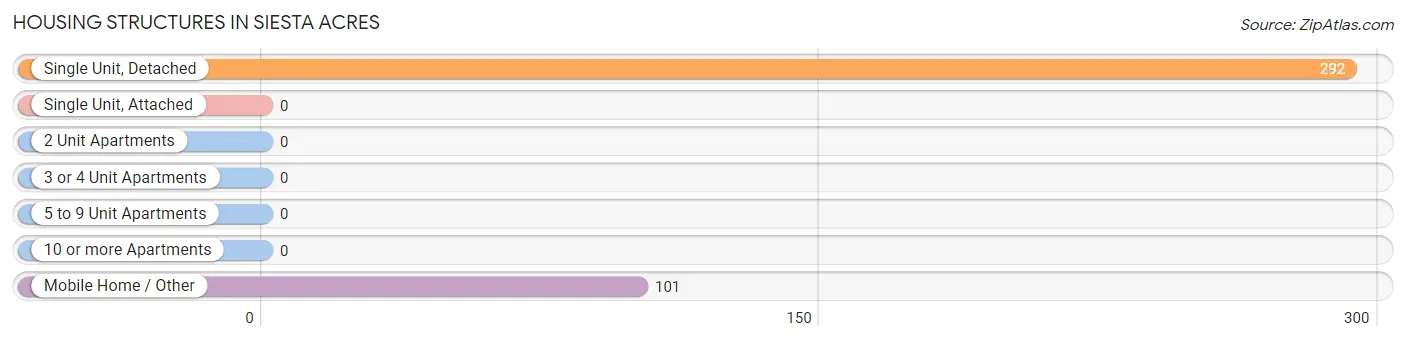
| Structure Type | # Housing Units | % Housing Units |
| Single Unit, Detached | 292 | 74.3% |
| Single Unit, Attached | 0 | 0.0% |
| 2 Unit Apartments | 0 | 0.0% |
| 3 or 4 Unit Apartments | 0 | 0.0% |
| 5 to 9 Unit Apartments | 0 | 0.0% |
| 10 or more Apartments | 0 | 0.0% |
| Mobile Home / Other | 101 | 25.7% |
| Total | 393 | 100.0% |
Housing Structures by Occupancy in Siesta Acres
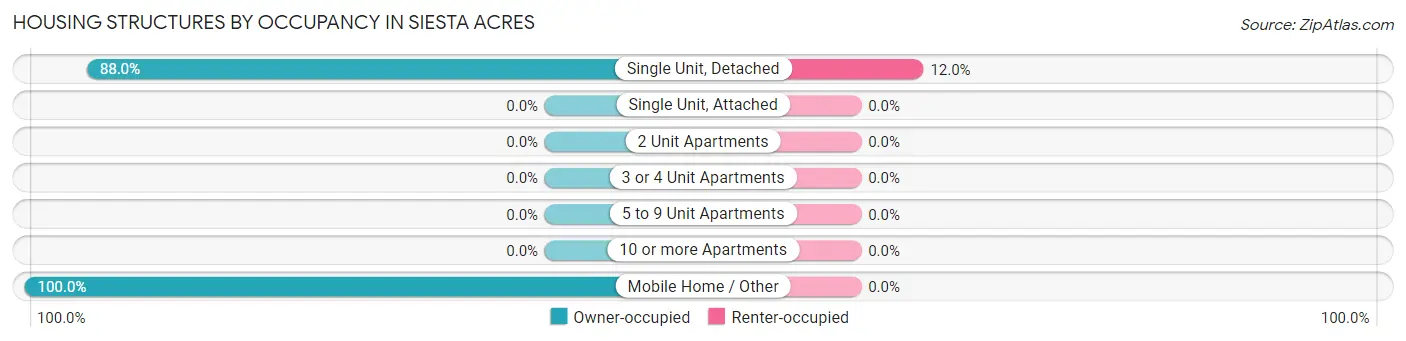
| Structure Type | Owner-occupied | Renter-occupied |
| Single Unit, Detached | 257 (88.0%) | 35 (12.0%) |
| Single Unit, Attached | 0 (0.0%) | 0 (0.0%) |
| 2 Unit Apartments | 0 (0.0%) | 0 (0.0%) |
| 3 or 4 Unit Apartments | 0 (0.0%) | 0 (0.0%) |
| 5 to 9 Unit Apartments | 0 (0.0%) | 0 (0.0%) |
| 10 or more Apartments | 0 (0.0%) | 0 (0.0%) |
| Mobile Home / Other | 101 (100.0%) | 0 (0.0%) |
| Total | 358 (91.1%) | 35 (8.9%) |
Housing Structures by Number of Rooms in Siesta Acres
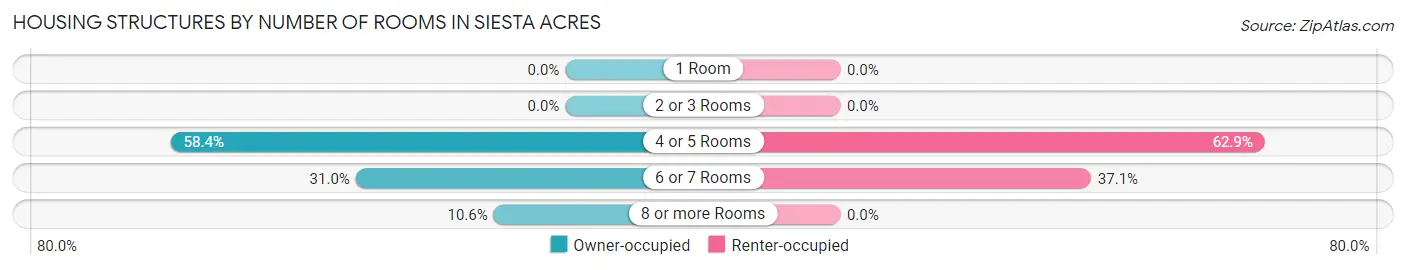
| Number of Rooms | Owner-occupied | Renter-occupied |
| 1 Room | 0 (0.0%) | 0 (0.0%) |
| 2 or 3 Rooms | 0 (0.0%) | 0 (0.0%) |
| 4 or 5 Rooms | 209 (58.4%) | 22 (62.9%) |
| 6 or 7 Rooms | 111 (31.0%) | 13 (37.1%) |
| 8 or more Rooms | 38 (10.6%) | 0 (0.0%) |
| Total | 358 (100.0%) | 35 (100.0%) |
Housing Structure by Heating Type in Siesta Acres
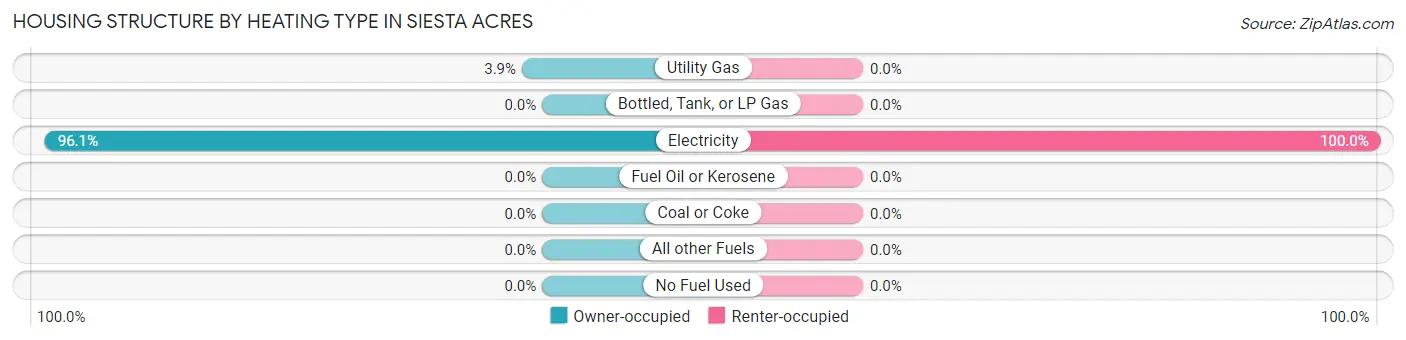
| Heating Type | Owner-occupied | Renter-occupied |
| Utility Gas | 14 (3.9%) | 0 (0.0%) |
| Bottled, Tank, or LP Gas | 0 (0.0%) | 0 (0.0%) |
| Electricity | 344 (96.1%) | 35 (100.0%) |
| Fuel Oil or Kerosene | 0 (0.0%) | 0 (0.0%) |
| Coal or Coke | 0 (0.0%) | 0 (0.0%) |
| All other Fuels | 0 (0.0%) | 0 (0.0%) |
| No Fuel Used | 0 (0.0%) | 0 (0.0%) |
| Total | 358 (100.0%) | 35 (100.0%) |
Household Vehicle Usage in Siesta Acres
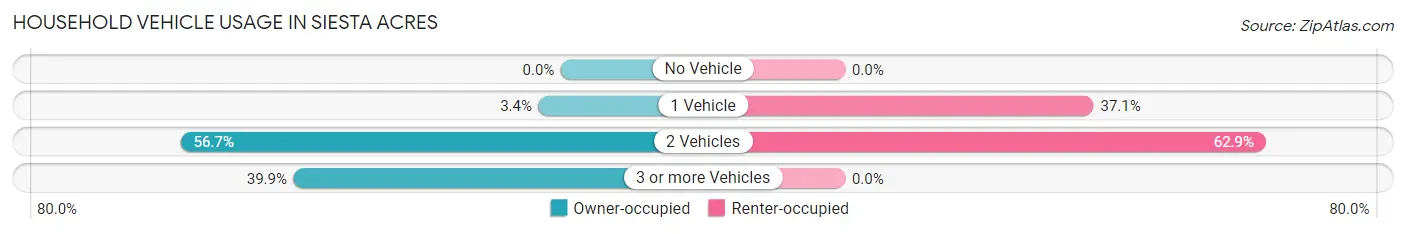
| Vehicles per Household | Owner-occupied | Renter-occupied |
| No Vehicle | 0 (0.0%) | 0 (0.0%) |
| 1 Vehicle | 12 (3.4%) | 13 (37.1%) |
| 2 Vehicles | 203 (56.7%) | 22 (62.9%) |
| 3 or more Vehicles | 143 (39.9%) | 0 (0.0%) |
| Total | 358 (100.0%) | 35 (100.0%) |
Real Estate & Mortgages in Siesta Acres
Real Estate and Mortgage Overview in Siesta Acres
| Characteristic | Without Mortgage | With Mortgage |
| Housing Units | 206 | 152 |
| Median Property Value | $102,100 | $150,900 |
| Median Household Income | $49,415 | $0 |
| Monthly Housing Costs | $433 | $0 |
| Real Estate Taxes | $837 | $0 |
Property Value by Mortgage Status in Siesta Acres
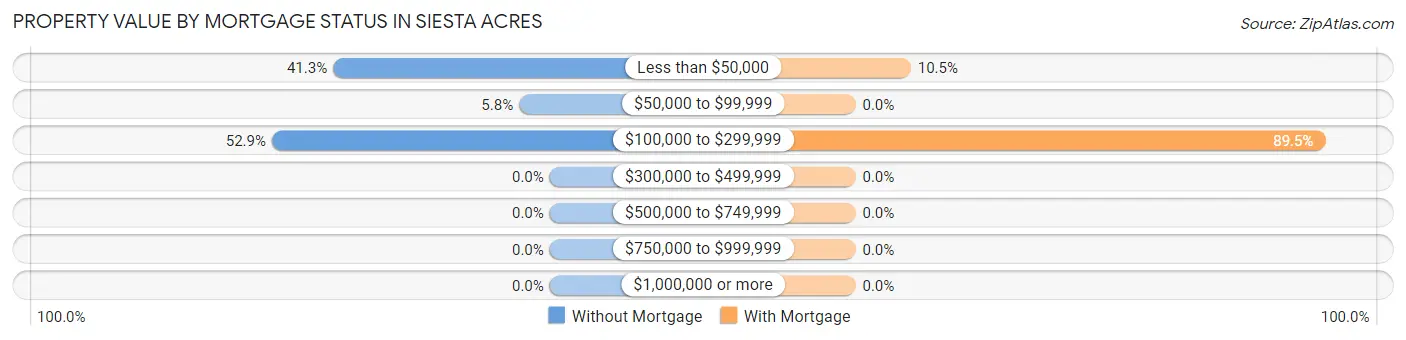
| Property Value | Without Mortgage | With Mortgage |
| Less than $50,000 | 85 (41.3%) | 16 (10.5%) |
| $50,000 to $99,999 | 12 (5.8%) | 0 (0.0%) |
| $100,000 to $299,999 | 109 (52.9%) | 136 (89.5%) |
| $300,000 to $499,999 | 0 (0.0%) | 0 (0.0%) |
| $500,000 to $749,999 | 0 (0.0%) | 0 (0.0%) |
| $750,000 to $999,999 | 0 (0.0%) | 0 (0.0%) |
| $1,000,000 or more | 0 (0.0%) | 0 (0.0%) |
| Total | 206 (100.0%) | 152 (100.0%) |
Household Income by Mortgage Status in Siesta Acres
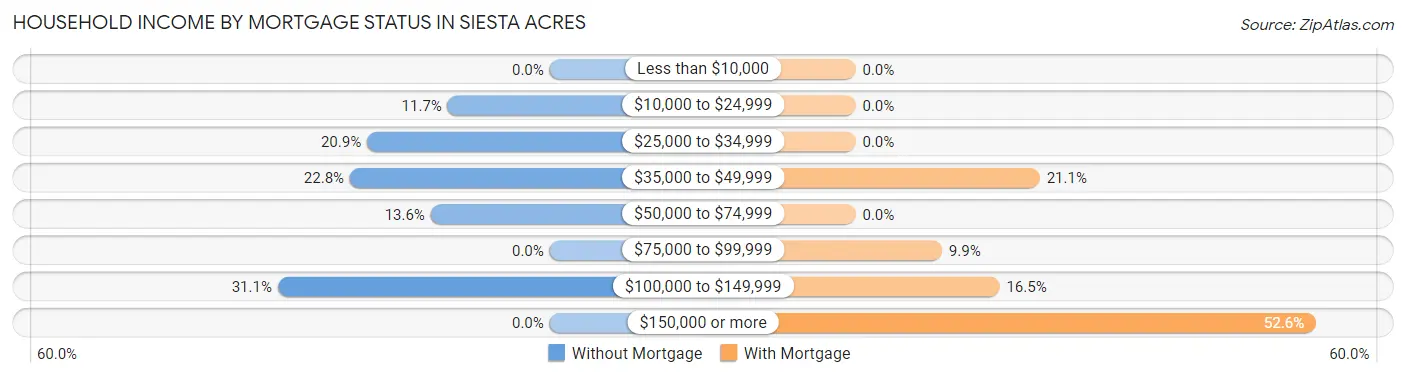
| Household Income | Without Mortgage | With Mortgage |
| Less than $10,000 | 0 (0.0%) | 0 (0.0%) |
| $10,000 to $24,999 | 24 (11.7%) | 0 (0.0%) |
| $25,000 to $34,999 | 43 (20.9%) | 0 (0.0%) |
| $35,000 to $49,999 | 47 (22.8%) | 32 (21.0%) |
| $50,000 to $74,999 | 28 (13.6%) | 0 (0.0%) |
| $75,000 to $99,999 | 0 (0.0%) | 15 (9.9%) |
| $100,000 to $149,999 | 64 (31.1%) | 25 (16.5%) |
| $150,000 or more | 0 (0.0%) | 80 (52.6%) |
| Total | 206 (100.0%) | 152 (100.0%) |
Property Value to Household Income Ratio in Siesta Acres
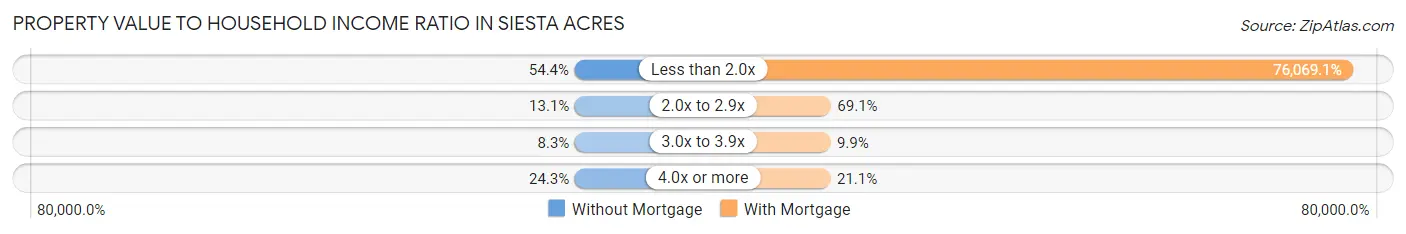
| Value-to-Income Ratio | Without Mortgage | With Mortgage |
| Less than 2.0x | 112 (54.4%) | 115,625 (76,069.1%) |
| 2.0x to 2.9x | 27 (13.1%) | 105 (69.1%) |
| 3.0x to 3.9x | 17 (8.3%) | 15 (9.9%) |
| 4.0x or more | 50 (24.3%) | 32 (21.0%) |
| Total | 206 (100.0%) | 152 (100.0%) |
Real Estate Taxes by Mortgage Status in Siesta Acres
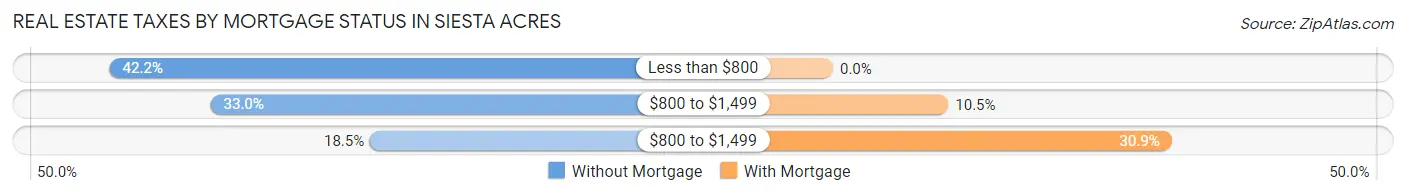
| Property Taxes | Without Mortgage | With Mortgage |
| Less than $800 | 87 (42.2%) | 0 (0.0%) |
| $800 to $1,499 | 68 (33.0%) | 16 (10.5%) |
| $800 to $1,499 | 38 (18.4%) | 47 (30.9%) |
| Total | 206 (100.0%) | 152 (100.0%) |
Health & Disability in Siesta Acres
Health Insurance Coverage by Age in Siesta Acres
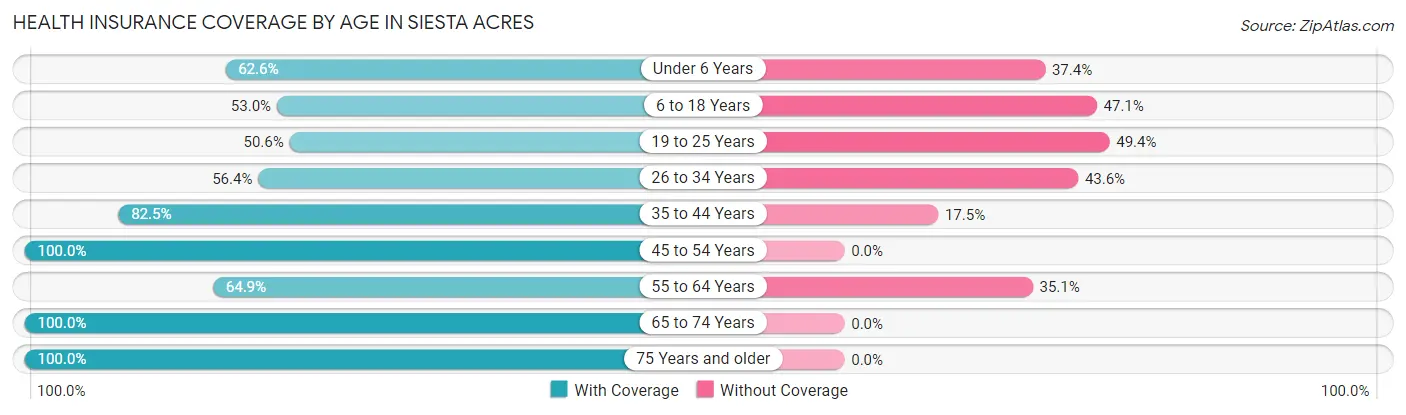
| Age Bracket | With Coverage | Without Coverage |
| Under 6 Years | 102 (62.6%) | 61 (37.4%) |
| 6 to 18 Years | 242 (52.9%) | 215 (47.0%) |
| 19 to 25 Years | 43 (50.6%) | 42 (49.4%) |
| 26 to 34 Years | 79 (56.4%) | 61 (43.6%) |
| 35 to 44 Years | 326 (82.5%) | 69 (17.5%) |
| 45 to 54 Years | 97 (100.0%) | 0 (0.0%) |
| 55 to 64 Years | 85 (64.9%) | 46 (35.1%) |
| 65 to 74 Years | 121 (100.0%) | 0 (0.0%) |
| 75 Years and older | 47 (100.0%) | 0 (0.0%) |
| Total | 1,142 (69.8%) | 494 (30.2%) |
Health Insurance Coverage by Citizenship Status in Siesta Acres
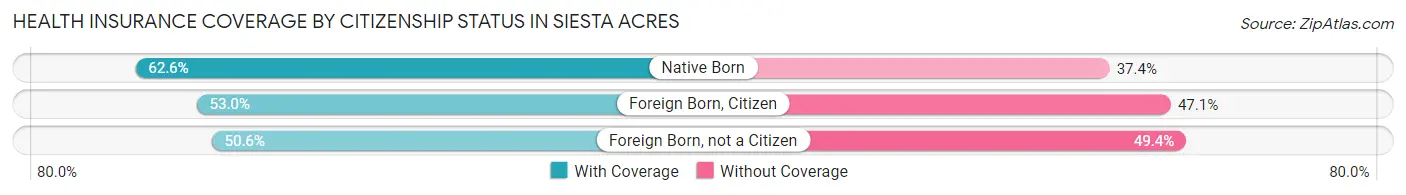
| Citizenship Status | With Coverage | Without Coverage |
| Native Born | 102 (62.6%) | 61 (37.4%) |
| Foreign Born, Citizen | 242 (52.9%) | 215 (47.0%) |
| Foreign Born, not a Citizen | 43 (50.6%) | 42 (49.4%) |
Health Insurance Coverage by Household Income in Siesta Acres
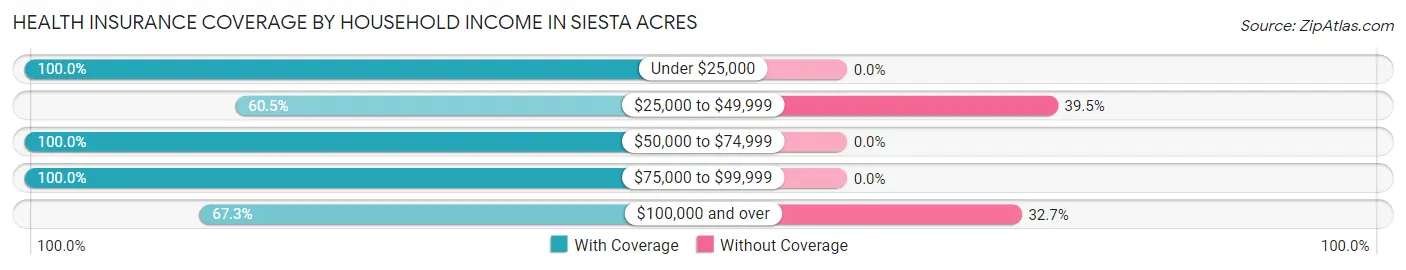
| Household Income | With Coverage | Without Coverage |
| Under $25,000 | 49 (100.0%) | 0 (0.0%) |
| $25,000 to $49,999 | 397 (60.5%) | 259 (39.5%) |
| $50,000 to $74,999 | 165 (100.0%) | 0 (0.0%) |
| $75,000 to $99,999 | 48 (100.0%) | 0 (0.0%) |
| $100,000 and over | 483 (67.3%) | 235 (32.7%) |
Public vs Private Health Insurance Coverage by Age in Siesta Acres
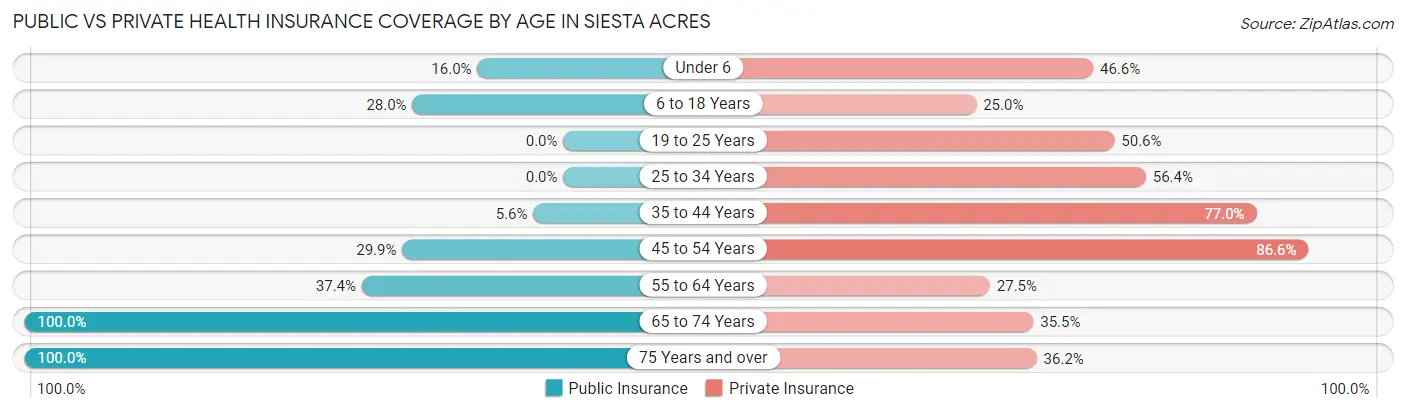
| Age Bracket | Public Insurance | Private Insurance |
| Under 6 | 26 (16.0%) | 76 (46.6%) |
| 6 to 18 Years | 128 (28.0%) | 114 (24.9%) |
| 19 to 25 Years | 0 (0.0%) | 43 (50.6%) |
| 25 to 34 Years | 0 (0.0%) | 79 (56.4%) |
| 35 to 44 Years | 22 (5.6%) | 304 (77.0%) |
| 45 to 54 Years | 29 (29.9%) | 84 (86.6%) |
| 55 to 64 Years | 49 (37.4%) | 36 (27.5%) |
| 65 to 74 Years | 121 (100.0%) | 43 (35.5%) |
| 75 Years and over | 47 (100.0%) | 17 (36.2%) |
| Total | 422 (25.8%) | 796 (48.7%) |
Disability Status by Sex by Age in Siesta Acres
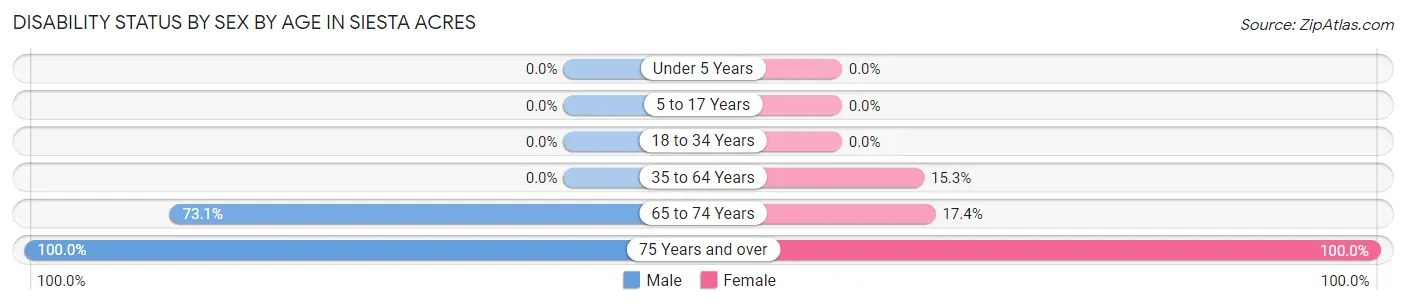
| Age Bracket | Male | Female |
| Under 5 Years | 0 (0.0%) | 0 (0.0%) |
| 5 to 17 Years | 0 (0.0%) | 0 (0.0%) |
| 18 to 34 Years | 0 (0.0%) | 0 (0.0%) |
| 35 to 64 Years | 0 (0.0%) | 51 (15.3%) |
| 65 to 74 Years | 38 (73.1%) | 12 (17.4%) |
| 75 Years and over | 29 (100.0%) | 18 (100.0%) |
Disability Class by Sex by Age in Siesta Acres
Disability Class: Hearing Difficulty
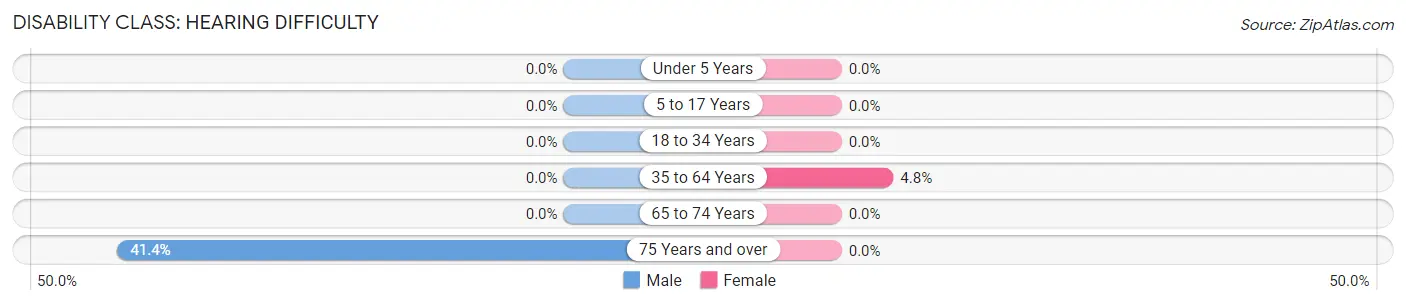
| Age Bracket | Male | Female |
| Under 5 Years | 0 (0.0%) | 0 (0.0%) |
| 5 to 17 Years | 0 (0.0%) | 0 (0.0%) |
| 18 to 34 Years | 0 (0.0%) | 0 (0.0%) |
| 35 to 64 Years | 0 (0.0%) | 16 (4.8%) |
| 65 to 74 Years | 0 (0.0%) | 0 (0.0%) |
| 75 Years and over | 12 (41.4%) | 0 (0.0%) |
Disability Class: Vision Difficulty
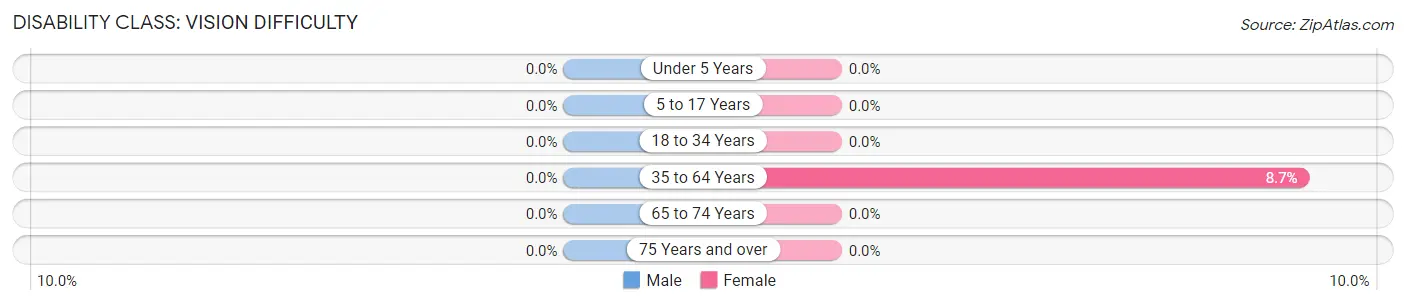
| Age Bracket | Male | Female |
| Under 5 Years | 0 (0.0%) | 0 (0.0%) |
| 5 to 17 Years | 0 (0.0%) | 0 (0.0%) |
| 18 to 34 Years | 0 (0.0%) | 0 (0.0%) |
| 35 to 64 Years | 0 (0.0%) | 29 (8.7%) |
| 65 to 74 Years | 0 (0.0%) | 0 (0.0%) |
| 75 Years and over | 0 (0.0%) | 0 (0.0%) |
Disability Class: Cognitive Difficulty
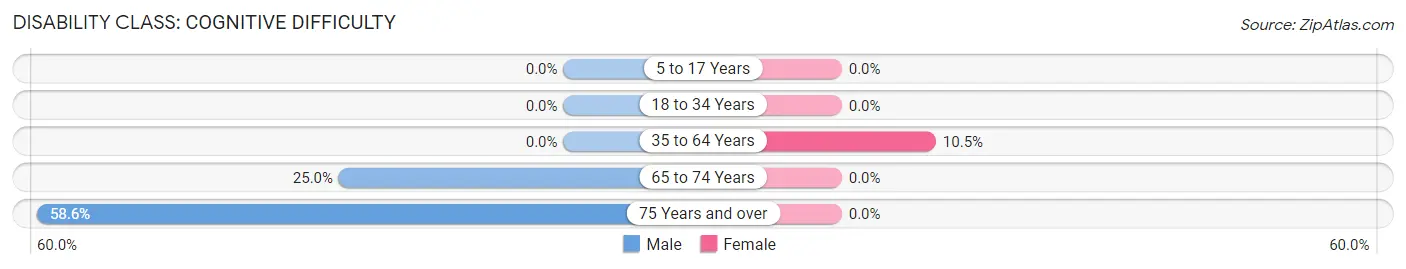
| Age Bracket | Male | Female |
| 5 to 17 Years | 0 (0.0%) | 0 (0.0%) |
| 18 to 34 Years | 0 (0.0%) | 0 (0.0%) |
| 35 to 64 Years | 0 (0.0%) | 35 (10.5%) |
| 65 to 74 Years | 13 (25.0%) | 0 (0.0%) |
| 75 Years and over | 17 (58.6%) | 0 (0.0%) |
Disability Class: Ambulatory Difficulty
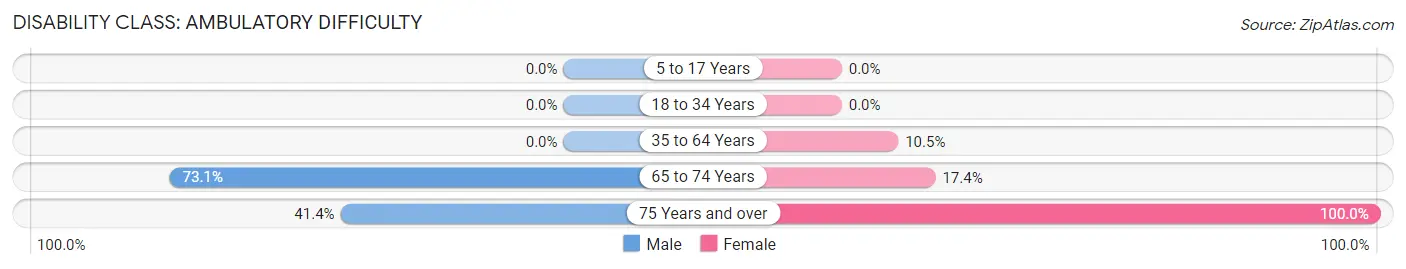
| Age Bracket | Male | Female |
| 5 to 17 Years | 0 (0.0%) | 0 (0.0%) |
| 18 to 34 Years | 0 (0.0%) | 0 (0.0%) |
| 35 to 64 Years | 0 (0.0%) | 35 (10.5%) |
| 65 to 74 Years | 38 (73.1%) | 12 (17.4%) |
| 75 Years and over | 12 (41.4%) | 18 (100.0%) |
Disability Class: Self-Care Difficulty
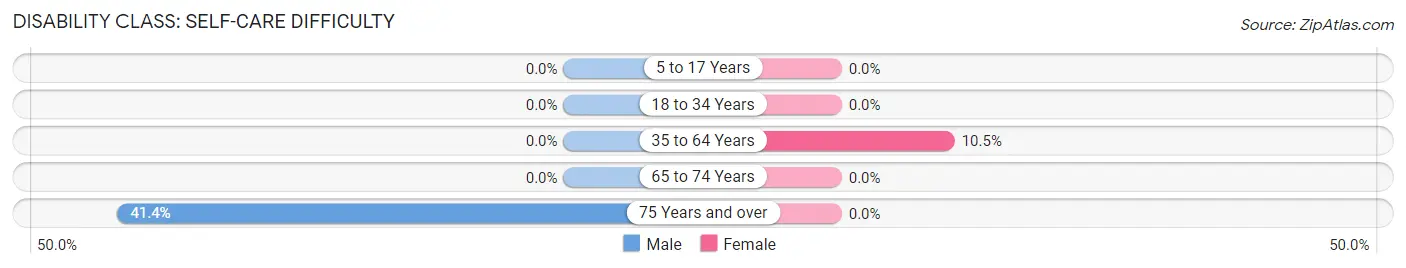
| Age Bracket | Male | Female |
| 5 to 17 Years | 0 (0.0%) | 0 (0.0%) |
| 18 to 34 Years | 0 (0.0%) | 0 (0.0%) |
| 35 to 64 Years | 0 (0.0%) | 35 (10.5%) |
| 65 to 74 Years | 0 (0.0%) | 0 (0.0%) |
| 75 Years and over | 12 (41.4%) | 0 (0.0%) |
Technology Access in Siesta Acres
Computing Device Access in Siesta Acres
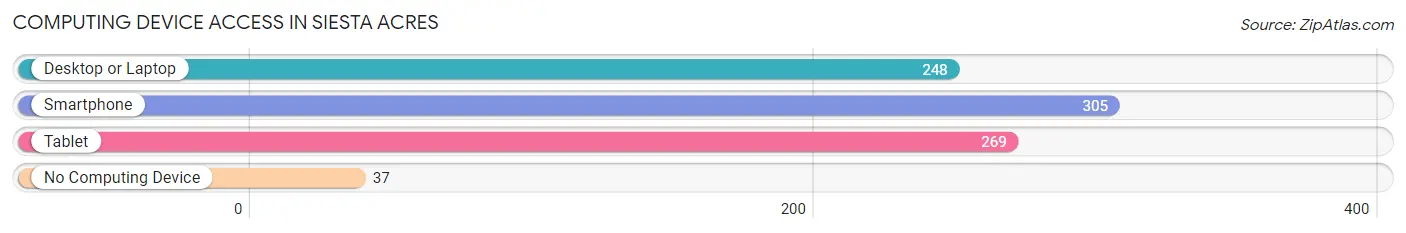
| Device Type | # Households | % Households |
| Desktop or Laptop | 248 | 63.1% |
| Smartphone | 305 | 77.6% |
| Tablet | 269 | 68.4% |
| No Computing Device | 37 | 9.4% |
| Total | 393 | 100.0% |
Internet Access in Siesta Acres
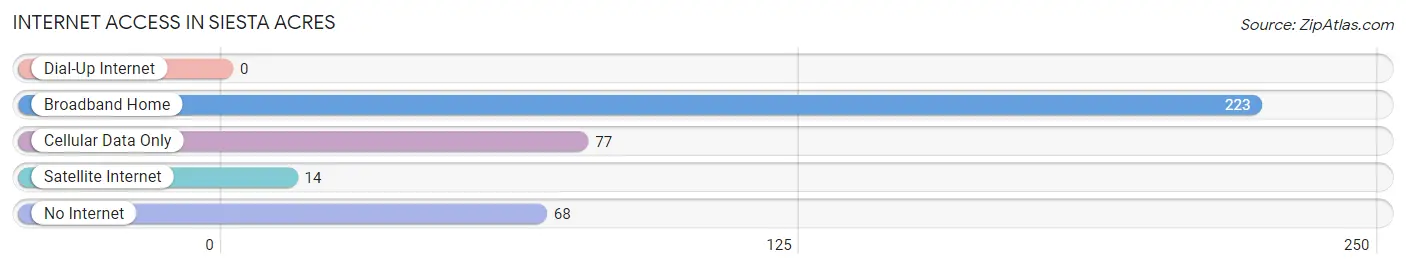
| Internet Type | # Households | % Households |
| Dial-Up Internet | 0 | 0.0% |
| Broadband Home | 223 | 56.7% |
| Cellular Data Only | 77 | 19.6% |
| Satellite Internet | 14 | 3.6% |
| No Internet | 68 | 17.3% |
| Total | 393 | 100.0% |
Siesta Acres Summary
Siesta Acres is a small unincorporated community located in Hidalgo County, Texas. It is situated about 10 miles south of the city of McAllen and is part of the McAllen–Edinburg–Mission metropolitan area. The population of Siesta Acres was estimated to be 1,845 in 2019.
History
Siesta Acres was founded in the early 1900s by a group of Mexican-American farmers who were looking for a place to settle and farm. The area was originally known as “La Siesta”, which translates to “the rest” in English. The name was changed to Siesta Acres in the 1950s when the area was developed into a residential community.
Geography
Siesta Acres is located in the Rio Grande Valley of South Texas. It is situated in the southernmost part of Hidalgo County, about 10 miles south of the city of McAllen. The area is characterized by flat terrain and is surrounded by agricultural fields. The climate is subtropical, with hot summers and mild winters.
Economy
The economy of Siesta Acres is largely based on agriculture. The area is home to a number of farms that produce a variety of crops, including cotton, corn, sorghum, and vegetables. The area is also home to a number of small businesses, including restaurants, convenience stores, and auto repair shops.
Demographics
As of 2019, the population of Siesta Acres was estimated to be 1,845. The population is predominantly Hispanic, with over 90% of the population identifying as such. The median household income in Siesta Acres is $30,000, which is lower than the national average. The poverty rate in Siesta Acres is also higher than the national average, with over 25% of the population living below the poverty line.
Conclusion
Siesta Acres is a small unincorporated community located in Hidalgo County, Texas. It is situated about 10 miles south of the city of McAllen and is part of the McAllen–Edinburg–Mission metropolitan area. The population of Siesta Acres was estimated to be 1,845 in 2019. The economy of Siesta Acres is largely based on agriculture, with a number of farms producing a variety of crops. The population is predominantly Hispanic, with over 90% of the population identifying as such. The median household income in Siesta Acres is $30,000, which is lower than the national average. The poverty rate in Siesta Acres is also higher than the national average, with over 25% of the population living below the poverty line.
Common Questions
What is the Total Population of Siesta Acres?
Total Population of Siesta Acres is 1,636.
What is the Total Male Population of Siesta Acres?
Total Male Population of Siesta Acres is 911.
What is the Total Female Population of Siesta Acres?
Total Female Population of Siesta Acres is 725.
What is the Ratio of Males per 100 Females in Siesta Acres?
There are 125.66 Males per 100 Females in Siesta Acres.
What is the Ratio of Females per 100 Males in Siesta Acres?
There are 79.58 Females per 100 Males in Siesta Acres.
What is the Median Population Age in Siesta Acres?
Median Population Age in Siesta Acres is 32.8 Years.
What is the Average Family Size in Siesta Acres
Average Family Size in Siesta Acres is 4.4 People.
What is the Average Household Size in Siesta Acres
Average Household Size in Siesta Acres is 4.2 People.
What is Per Capita Income in Siesta Acres?
Per Capita income in Siesta Acres is $20,724.
What is the Median Family Income in Siesta Acres?
Median Family Income in Siesta Acres is $60,000.
What is the Median Household income in Siesta Acres?
Median Household Income in Siesta Acres is $55,268.
What is Income or Wage Gap in Siesta Acres?
Income or Wage Gap in Siesta Acres is 13.3%.
Women in Siesta Acres earn 86.7 cents for every dollar earned by a man.
What is Inequality or Gini Index in Siesta Acres?
Inequality or Gini Index in Siesta Acres is 0.33.
How Large is the Labor Force in Siesta Acres?
There are 727 People in the Labor Forcein in Siesta Acres.
What is the Percentage of People in the Labor Force in Siesta Acres?
69.4% of People are in the Labor Force in Siesta Acres.