Scurry, TX
Scurry Map
Scurry Overview
616
TOTAL POPULATION
273
MALE POPULATION
343
FEMALE POPULATION
79.59
MALES / 100 FEMALES
125.64
FEMALES / 100 MALES
29.9
MEDIAN AGE
3.5
AVG FAMILY SIZE
2.7
AVG HOUSEHOLD SIZE
$37,775
PER CAPITA INCOME
$116,000
AVG FAMILY INCOME
$90,750
AVG HOUSEHOLD INCOME
37.9%
WAGE / INCOME GAP [ % ]
62.1¢/ $1
WAGE / INCOME GAP [ $ ]
0.45
INEQUALITY / GINI INDEX
276
LABOR FORCE [ PEOPLE ]
64.3%
PERCENT IN LABOR FORCE
2.2%
UNEMPLOYMENT RATE
Scurry Zip Codes
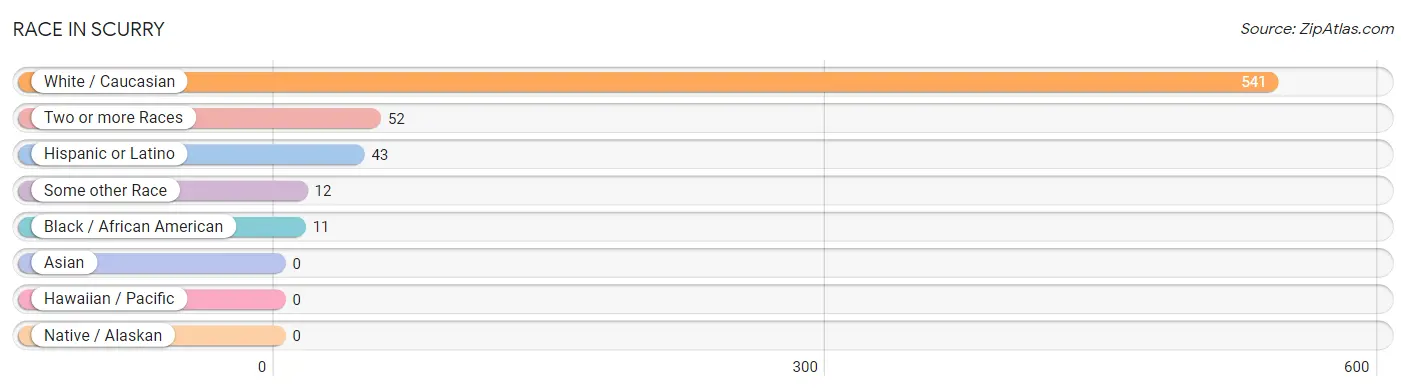
Race in Scurry
The most populous races in Scurry are White / Caucasian (541 | 87.8%), Two or more Races (52 | 8.4%), and Hispanic or Latino (43 | 7.0%).
| Race | # Population | % Population |
| Asian | 0 | 0.0% |
| Black / African American | 11 | 1.8% |
| Hawaiian / Pacific | 0 | 0.0% |
| Hispanic or Latino | 43 | 7.0% |
| Native / Alaskan | 0 | 0.0% |
| White / Caucasian | 541 | 87.8% |
| Two or more Races | 52 | 8.4% |
| Some other Race | 12 | 1.9% |
| Total | 616 | 100.0% |
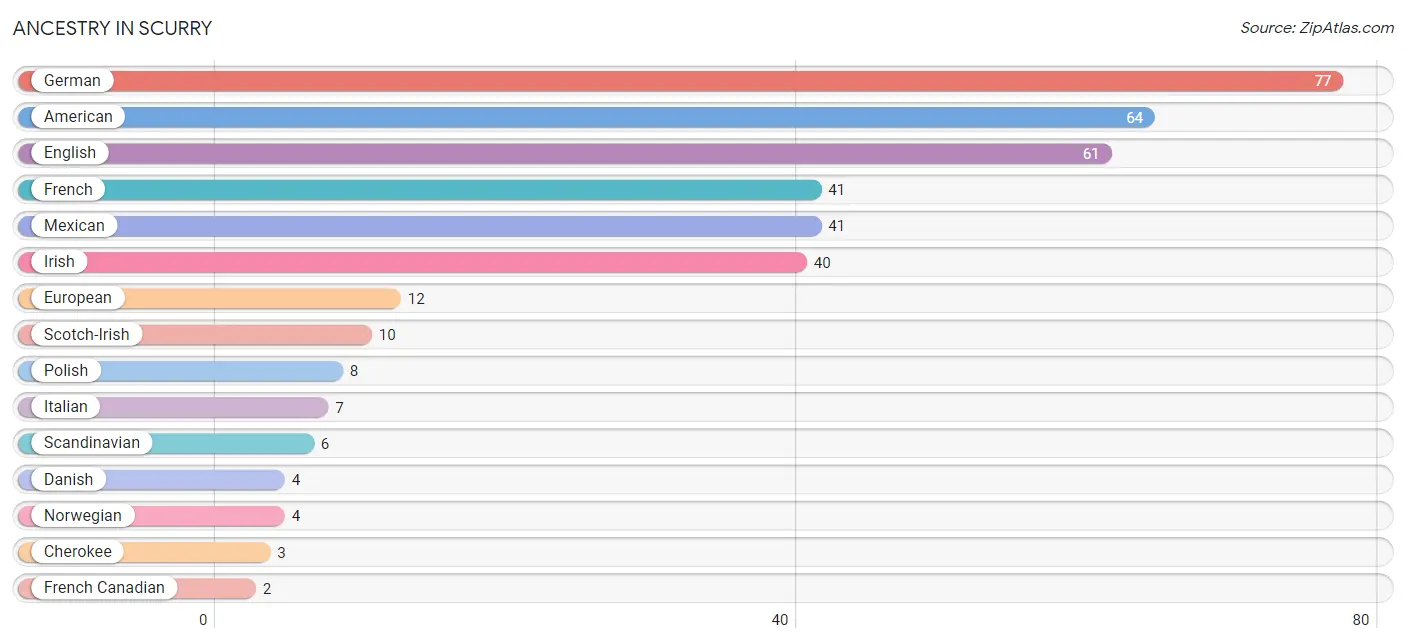
Ancestry in Scurry
The most populous ancestries reported in Scurry are German (77 | 12.5%), American (64 | 10.4%), English (61 | 9.9%), French (41 | 6.7%), and Mexican (41 | 6.7%), together accounting for 46.1% of all Scurry residents.
| Ancestry | # Population | % Population |
| American | 64 | 10.4% |
| Cherokee | 3 | 0.5% |
| Comanche | 1 | 0.2% |
| Danish | 4 | 0.6% |
| English | 61 | 9.9% |
| European | 12 | 1.9% |
| French | 41 | 6.7% |
| French Canadian | 2 | 0.3% |
| German | 77 | 12.5% |
| Irish | 40 | 6.5% |
| Italian | 7 | 1.1% |
| Mexican | 41 | 6.7% |
| Norwegian | 4 | 0.6% |
| Polish | 8 | 1.3% |
| Scandinavian | 6 | 1.0% |
| Scotch-Irish | 10 | 1.6% |
| Spanish | 2 | 0.3% | View All 17 Rows |
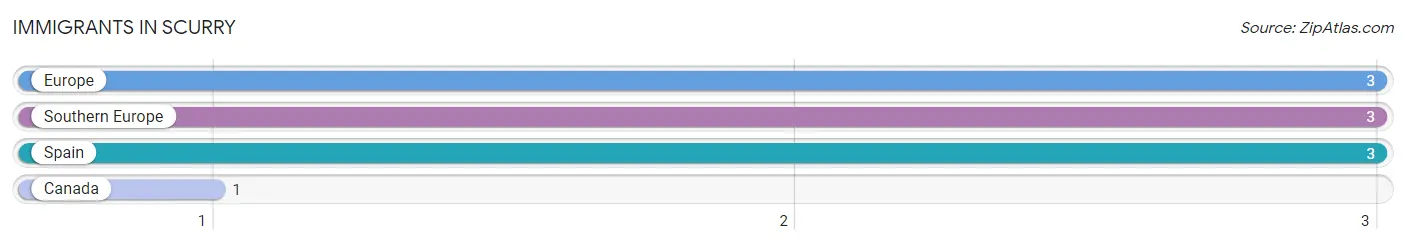
Immigrants in Scurry
The most numerous immigrant groups reported in Scurry came from Europe (3 | 0.5%), Southern Europe (3 | 0.5%), Spain (3 | 0.5%), and Canada (1 | 0.2%), together accounting for 1.6% of all Scurry residents.
| Immigration Origin | # Population | % Population |
| Canada | 1 | 0.2% |
| Europe | 3 | 0.5% |
| Southern Europe | 3 | 0.5% |
| Spain | 3 | 0.5% | View All 4 Rows |
Sex and Age in Scurry
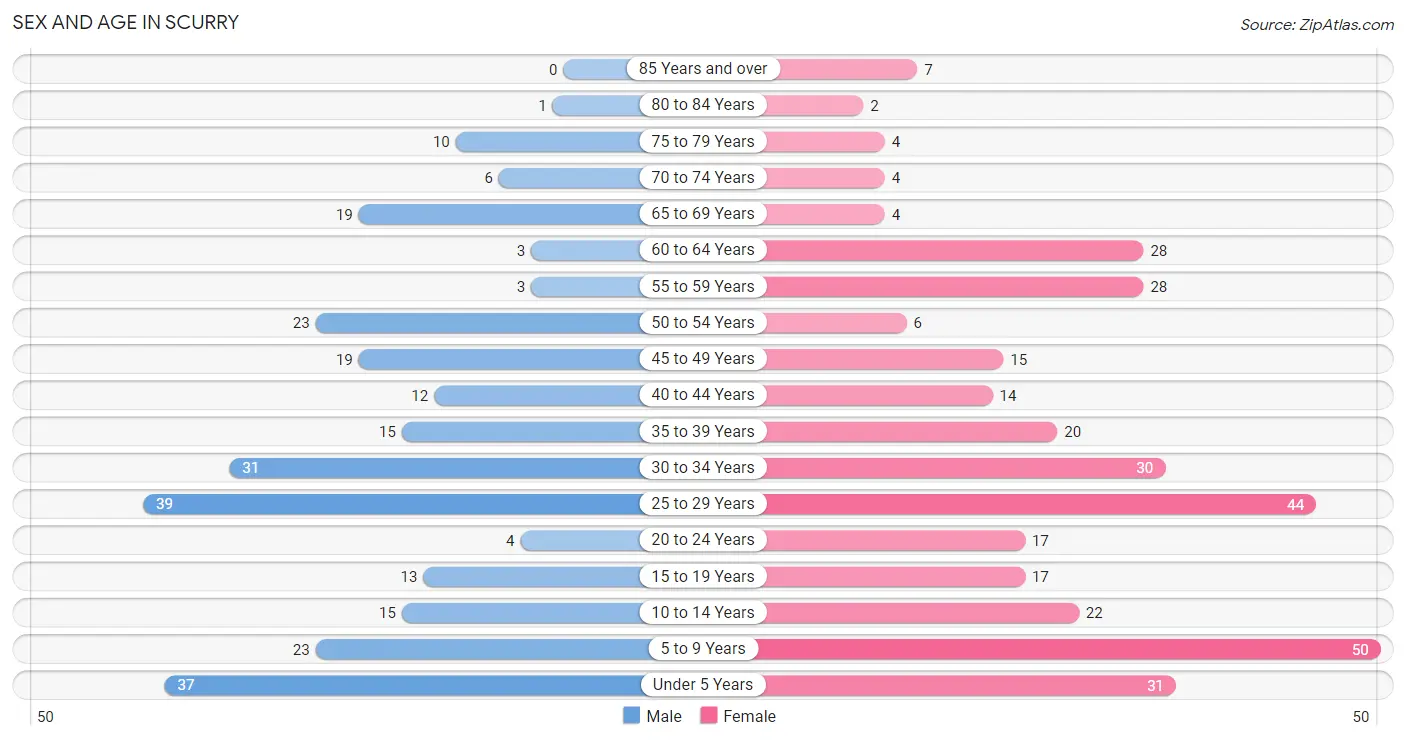
Sex and Age in Scurry
The most populous age groups in Scurry are 25 to 29 Years (39 | 14.3%) for men and 5 to 9 Years (50 | 14.6%) for women.
| Age Bracket | Male | Female |
| Under 5 Years | 37 (13.6%) | 31 (9.0%) |
| 5 to 9 Years | 23 (8.4%) | 50 (14.6%) |
| 10 to 14 Years | 15 (5.5%) | 22 (6.4%) |
| 15 to 19 Years | 13 (4.8%) | 17 (5.0%) |
| 20 to 24 Years | 4 (1.5%) | 17 (5.0%) |
| 25 to 29 Years | 39 (14.3%) | 44 (12.8%) |
| 30 to 34 Years | 31 (11.4%) | 30 (8.7%) |
| 35 to 39 Years | 15 (5.5%) | 20 (5.8%) |
| 40 to 44 Years | 12 (4.4%) | 14 (4.1%) |
| 45 to 49 Years | 19 (7.0%) | 15 (4.4%) |
| 50 to 54 Years | 23 (8.4%) | 6 (1.8%) |
| 55 to 59 Years | 3 (1.1%) | 28 (8.2%) |
| 60 to 64 Years | 3 (1.1%) | 28 (8.2%) |
| 65 to 69 Years | 19 (7.0%) | 4 (1.2%) |
| 70 to 74 Years | 6 (2.2%) | 4 (1.2%) |
| 75 to 79 Years | 10 (3.7%) | 4 (1.2%) |
| 80 to 84 Years | 1 (0.4%) | 2 (0.6%) |
| 85 Years and over | 0 (0.0%) | 7 (2.0%) |
| Total | 273 (100.0%) | 343 (100.0%) |
Families and Households in Scurry
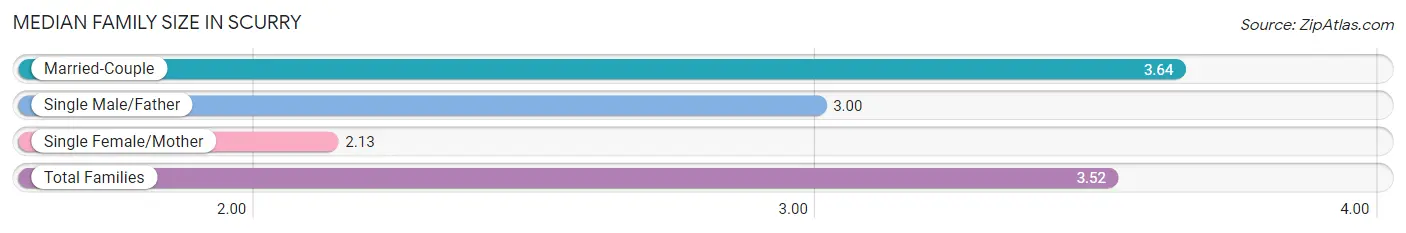
Median Family Size in Scurry
The median family size in Scurry is 3.52 persons per family, with married-couple families (124 | 89.9%) accounting for the largest median family size of 3.64 persons per family. On the other hand, single female/mother families (8 | 5.8%) represent the smallest median family size with 2.13 persons per family.
| Family Type | # Families | Family Size |
| Married-Couple | 124 (89.9%) | 3.64 |
| Single Male/Father | 6 (4.3%) | 3.00 |
| Single Female/Mother | 8 (5.8%) | 2.13 |
| Total Families | 138 (100.0%) | 3.52 |
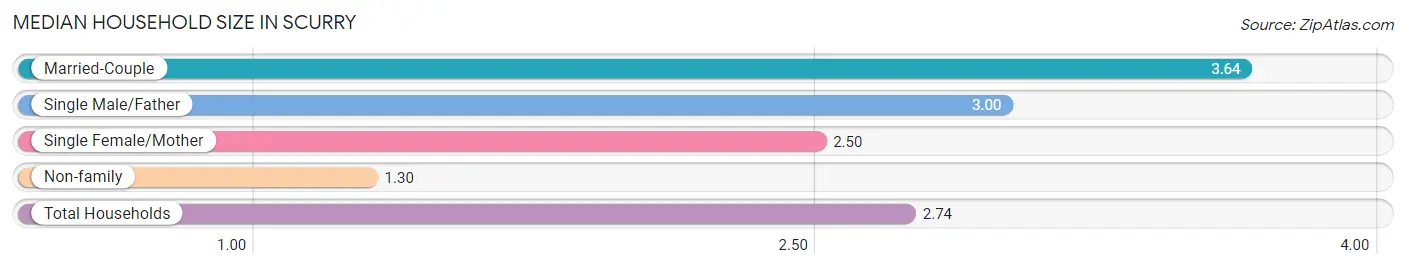
Median Household Size in Scurry
The median household size in Scurry is 2.74 persons per household, with married-couple households (124 | 57.7%) accounting for the largest median household size of 3.64 persons per household. non-family households (77 | 35.8%) represent the smallest median household size with 1.30 persons per household.
| Household Type | # Households | Household Size |
| Married-Couple | 124 (57.7%) | 3.64 |
| Single Male/Father | 6 (2.8%) | 3.00 |
| Single Female/Mother | 8 (3.7%) | 2.50 |
| Non-family | 77 (35.8%) | 1.30 |
| Total Households | 215 (100.0%) | 2.74 |
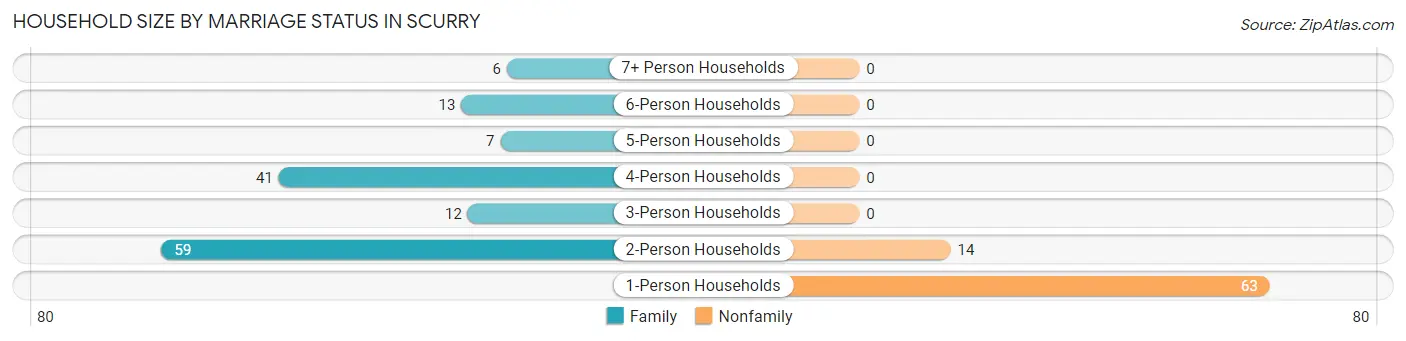
Household Size by Marriage Status in Scurry
Out of a total of 215 households in Scurry, 138 (64.2%) are family households, while 77 (35.8%) are nonfamily households. The most numerous type of family households are 2-person households, comprising 59, and the most common type of nonfamily households are 1-person households, comprising 63.
| Household Size | Family Households | Nonfamily Households |
| 1-Person Households | - | 63 (29.3%) |
| 2-Person Households | 59 (27.4%) | 14 (6.5%) |
| 3-Person Households | 12 (5.6%) | 0 (0.0%) |
| 4-Person Households | 41 (19.1%) | 0 (0.0%) |
| 5-Person Households | 7 (3.3%) | 0 (0.0%) |
| 6-Person Households | 13 (6.0%) | 0 (0.0%) |
| 7+ Person Households | 6 (2.8%) | 0 (0.0%) |
| Total | 138 (64.2%) | 77 (35.8%) |
Female Fertility in Scurry
Fertility by Age in Scurry
Average fertility rate in Scurry is 88.0 births per 1,000 women. Women in the age bracket of 20 to 34 years have the highest fertility rate with 132.0 births per 1,000 women. Women in the age bracket of 20 to 34 years acount for 85.7% of all women with births.
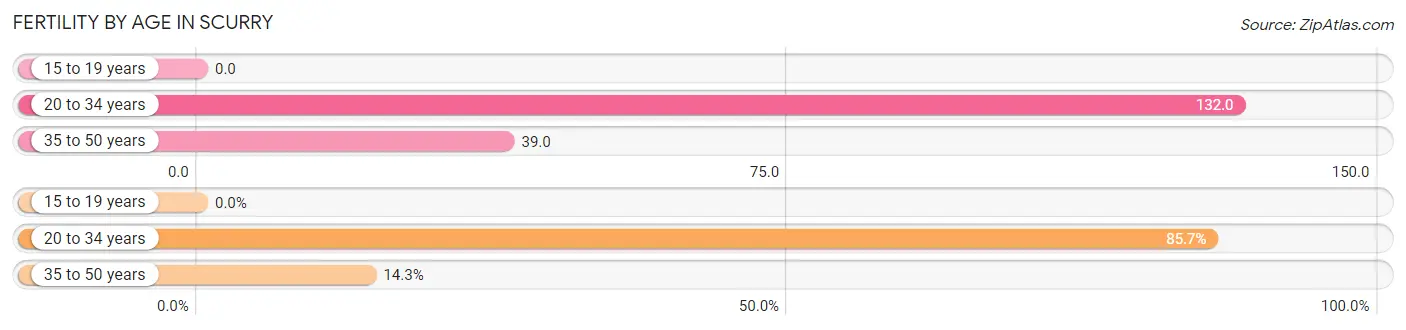
| Age Bracket | Women with Births | Births / 1,000 Women |
| 15 to 19 years | 0 (0.0%) | 0.0 |
| 20 to 34 years | 12 (85.7%) | 132.0 |
| 35 to 50 years | 2 (14.3%) | 39.0 |
| Total | 14 (100.0%) | 88.0 |
Fertility by Age by Marriage Status in Scurry
85.7% of women with births (14) in Scurry are married. The highest percentage of unmarried women with births falls into 20 to 34 years age bracket with 16.7% of them unmarried at the time of birth, while the lowest percentage of unmarried women with births belong to 35 to 50 years age bracket with 0.0% of them unmarried.
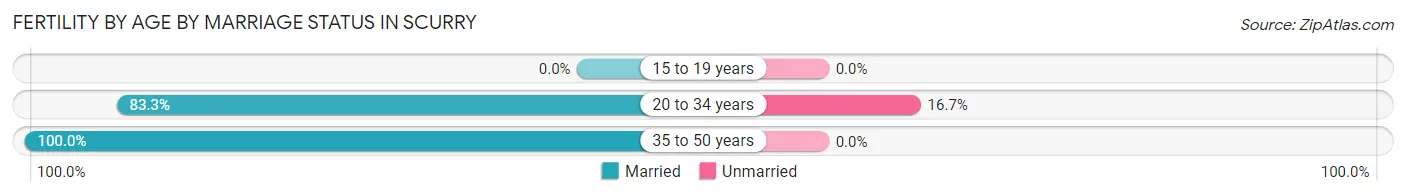
| Age Bracket | Married | Unmarried |
| 15 to 19 years | 0 (0.0%) | 0 (0.0%) |
| 20 to 34 years | 10 (83.3%) | 2 (16.7%) |
| 35 to 50 years | 2 (100.0%) | 0 (0.0%) |
| Total | 12 (85.7%) | 2 (14.3%) |
Fertility by Education in Scurry
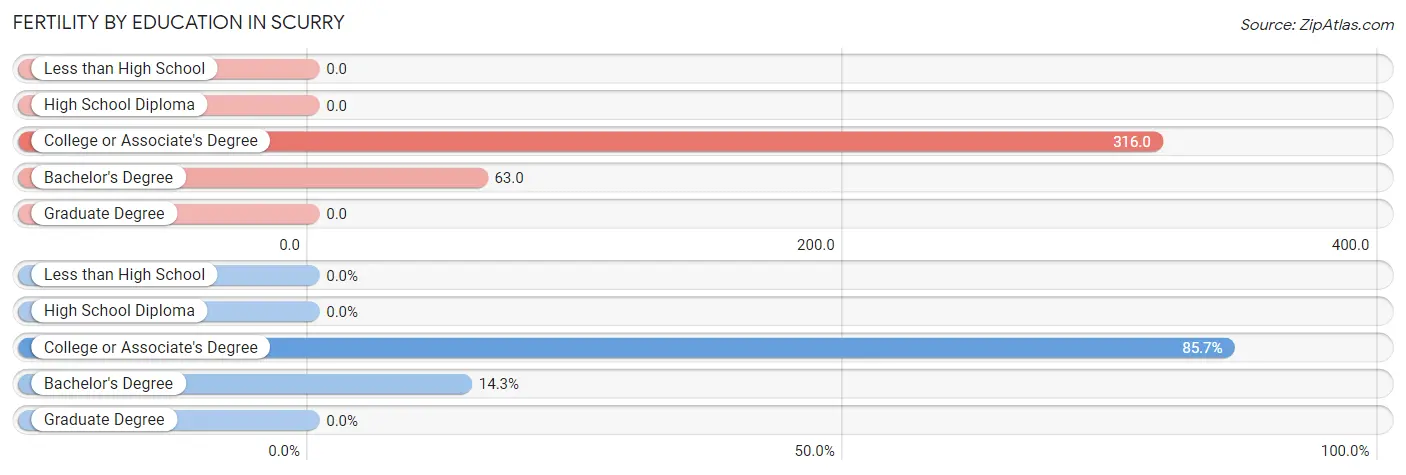
| Educational Attainment | Women with Births | Births / 1,000 Women |
| Less than High School | 0 (0.0%) | 0.0 |
| High School Diploma | 0 (0.0%) | 0.0 |
| College or Associate's Degree | 12 (85.7%) | 316.0 |
| Bachelor's Degree | 2 (14.3%) | 63.0 |
| Graduate Degree | 0 (0.0%) | 0.0 |
| Total | 14 (100.0%) | 88.0 |
Fertility by Education by Marriage Status in Scurry
14.3% of women with births in Scurry are unmarried. Women with the educational attainment of college or associate's degree are most likely to be married with 100.0% of them married at childbirth, while women with the educational attainment of bachelor's degree are least likely to be married with 100.0% of them unmarried at childbirth.
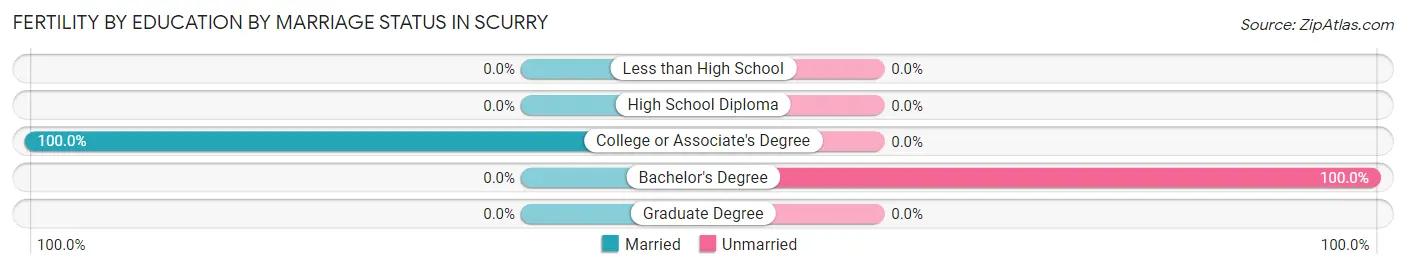
| Educational Attainment | Married | Unmarried |
| Less than High School | 0 (0.0%) | 0 (0.0%) |
| High School Diploma | 0 (0.0%) | 0 (0.0%) |
| College or Associate's Degree | 12 (100.0%) | 0 (0.0%) |
| Bachelor's Degree | 0 (0.0%) | 2 (100.0%) |
| Graduate Degree | 0 (0.0%) | 0 (0.0%) |
| Total | 12 (85.7%) | 2 (14.3%) |
Income in Scurry
Income Overview in Scurry
Per Capita Income in Scurry is $37,775, while median incomes of families and households are $116,000 and $90,750 respectively.
| Characteristic | Number | Measure |
| Per Capita Income | 616 | $37,775 |
| Median Family Income | 138 | $116,000 |
| Mean Family Income | 138 | $140,395 |
| Median Household Income | 215 | $90,750 |
| Mean Household Income | 215 | $101,187 |
| Income Deficit | 138 | $0 |
| Wage / Income Gap (%) | 616 | 37.89% |
| Wage / Income Gap ($) | 616 | 62.11¢ per $1 |
| Gini / Inequality Index | 616 | 0.45 |
Earnings by Sex in Scurry
Average Earnings in Scurry are $58,333, $75,469 for men and $46,875 for women, a difference of 37.9%.
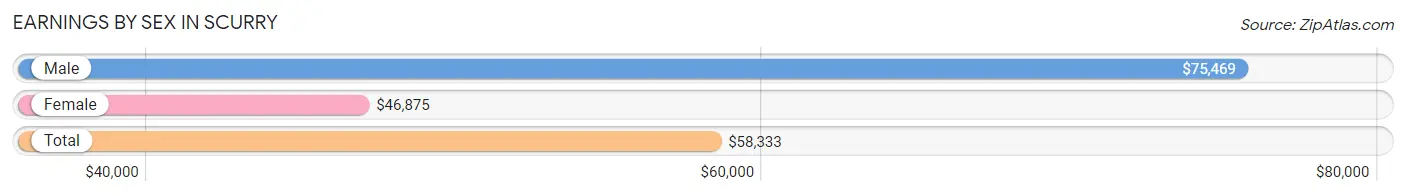
| Sex | Number | Average Earnings |
| Male | 151 (53.2%) | $75,469 |
| Female | 133 (46.8%) | $46,875 |
| Total | 284 (100.0%) | $58,333 |
Earnings by Sex by Income Bracket in Scurry
The most common earnings brackets in Scurry are $75,000 to $99,999 for men (47 | 31.1%) and $55,000 to $64,999 for women (25 | 18.8%).
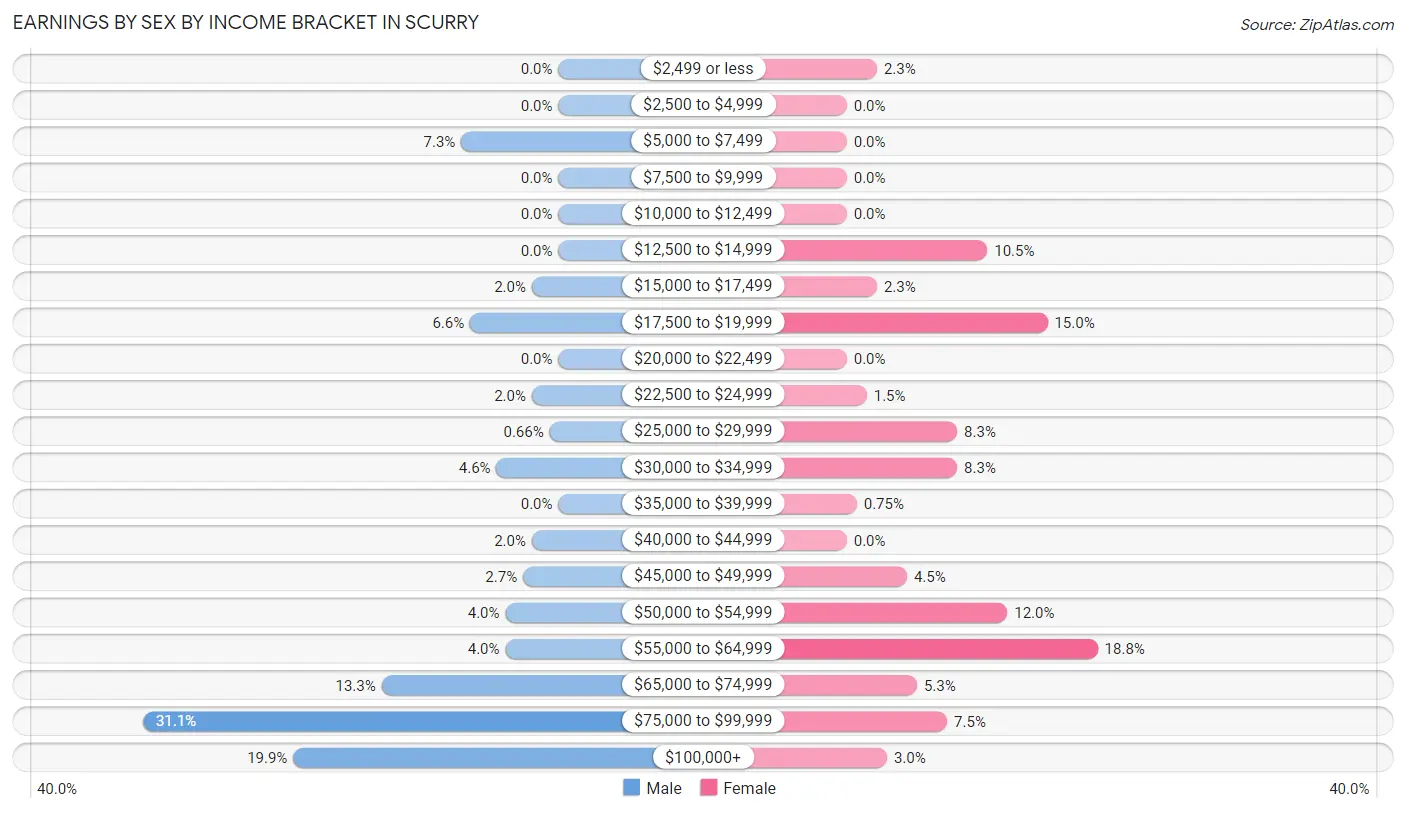
| Income | Male | Female |
| $2,499 or less | 0 (0.0%) | 3 (2.3%) |
| $2,500 to $4,999 | 0 (0.0%) | 0 (0.0%) |
| $5,000 to $7,499 | 11 (7.3%) | 0 (0.0%) |
| $7,500 to $9,999 | 0 (0.0%) | 0 (0.0%) |
| $10,000 to $12,499 | 0 (0.0%) | 0 (0.0%) |
| $12,500 to $14,999 | 0 (0.0%) | 14 (10.5%) |
| $15,000 to $17,499 | 3 (2.0%) | 3 (2.3%) |
| $17,500 to $19,999 | 10 (6.6%) | 20 (15.0%) |
| $20,000 to $22,499 | 0 (0.0%) | 0 (0.0%) |
| $22,500 to $24,999 | 3 (2.0%) | 2 (1.5%) |
| $25,000 to $29,999 | 1 (0.7%) | 11 (8.3%) |
| $30,000 to $34,999 | 7 (4.6%) | 11 (8.3%) |
| $35,000 to $39,999 | 0 (0.0%) | 1 (0.7%) |
| $40,000 to $44,999 | 3 (2.0%) | 0 (0.0%) |
| $45,000 to $49,999 | 4 (2.6%) | 6 (4.5%) |
| $50,000 to $54,999 | 6 (4.0%) | 16 (12.0%) |
| $55,000 to $64,999 | 6 (4.0%) | 25 (18.8%) |
| $65,000 to $74,999 | 20 (13.3%) | 7 (5.3%) |
| $75,000 to $99,999 | 47 (31.1%) | 10 (7.5%) |
| $100,000+ | 30 (19.9%) | 4 (3.0%) |
| Total | 151 (100.0%) | 133 (100.0%) |
Earnings by Sex by Educational Attainment in Scurry
Average earnings in Scurry are $76,563 for men and $50,893 for women, a difference of 33.5%. Men with an educational attainment of college or associate's degree enjoy the highest average annual earnings of $89,125, while those with high school diploma education earn the least with $65,536. Women with an educational attainment of bachelor's degree earn the most with the average annual earnings of $59,444, while those with high school diploma education have the smallest earnings of $18,333.
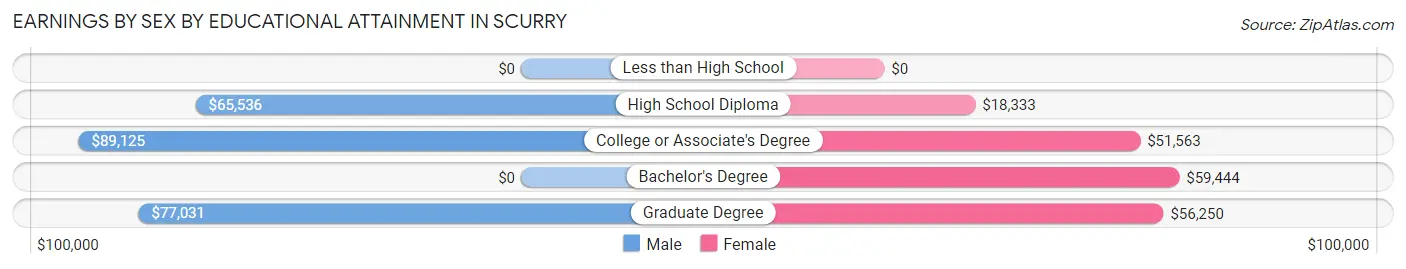
| Educational Attainment | Male Income | Female Income |
| Less than High School | - | - |
| High School Diploma | $65,536 | $18,333 |
| College or Associate's Degree | $89,125 | $51,563 |
| Bachelor's Degree | - | - |
| Graduate Degree | $77,031 | $56,250 |
| Total | $76,563 | $50,893 |
Family Income in Scurry
Family Income Brackets in Scurry
According to the Scurry family income data, there are 65 families falling into the $100,000 to $149,999 income range, which is the most common income bracket and makes up 47.1% of all families.
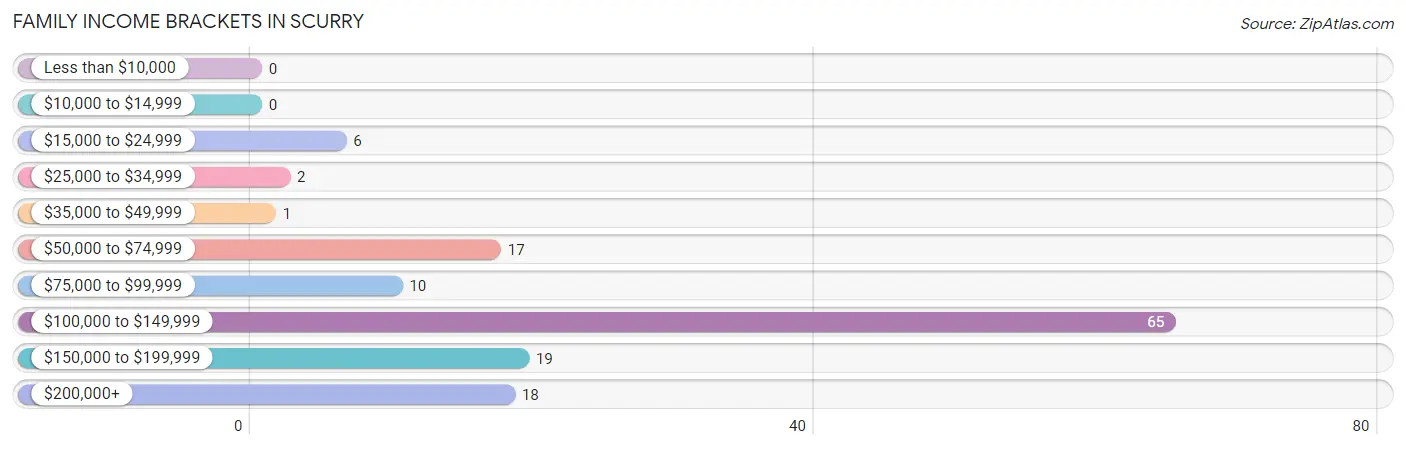
| Income Bracket | # Families | % Families |
| Less than $10,000 | 0 | 0.0% |
| $10,000 to $14,999 | 0 | 0.0% |
| $15,000 to $24,999 | 6 | 4.3% |
| $25,000 to $34,999 | 2 | 1.4% |
| $35,000 to $49,999 | 1 | 0.7% |
| $50,000 to $74,999 | 17 | 12.3% |
| $75,000 to $99,999 | 10 | 7.2% |
| $100,000 to $149,999 | 65 | 47.1% |
| $150,000 to $199,999 | 19 | 13.8% |
| $200,000+ | 18 | 13.0% |
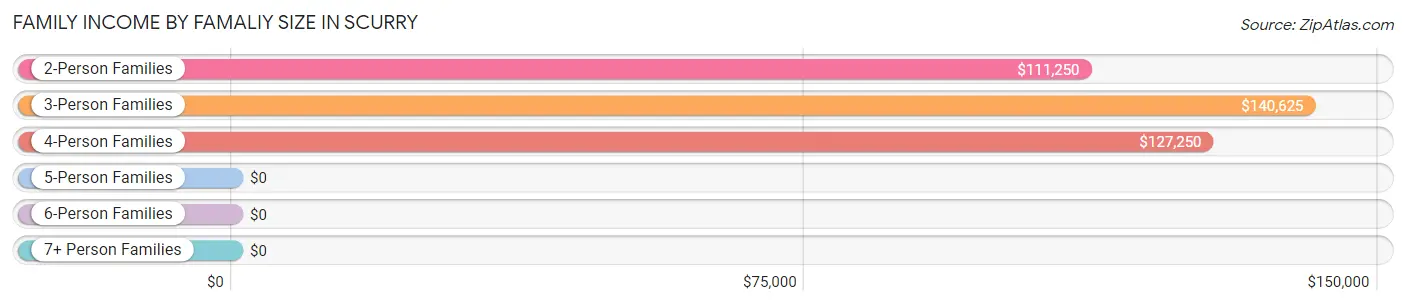
Family Income by Famaliy Size in Scurry
3-person families (10 | 7.2%) account for the highest median family income in Scurry with $140,625 per family, while 2-person families (61 | 44.2%) have the highest median income of $55,625 per family member.
| Income Bracket | # Families | Median Income |
| 2-Person Families | 61 (44.2%) | $111,250 |
| 3-Person Families | 10 (7.2%) | $140,625 |
| 4-Person Families | 41 (29.7%) | $127,250 |
| 5-Person Families | 7 (5.1%) | $0 |
| 6-Person Families | 13 (9.4%) | $0 |
| 7+ Person Families | 6 (4.3%) | $0 |
| Total | 138 (100.0%) | $116,000 |
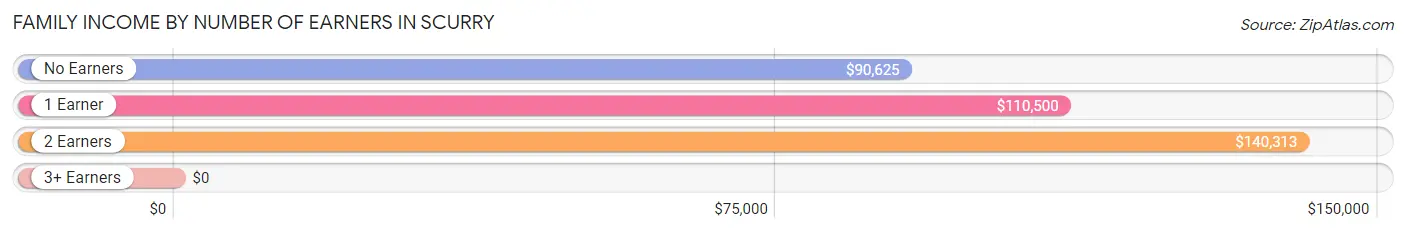
Family Income by Number of Earners in Scurry
| Number of Earners | # Families | Median Income |
| No Earners | 16 (11.6%) | $90,625 |
| 1 Earner | 38 (27.5%) | $110,500 |
| 2 Earners | 77 (55.8%) | $140,313 |
| 3+ Earners | 7 (5.1%) | $0 |
| Total | 138 (100.0%) | $116,000 |
Household Income in Scurry
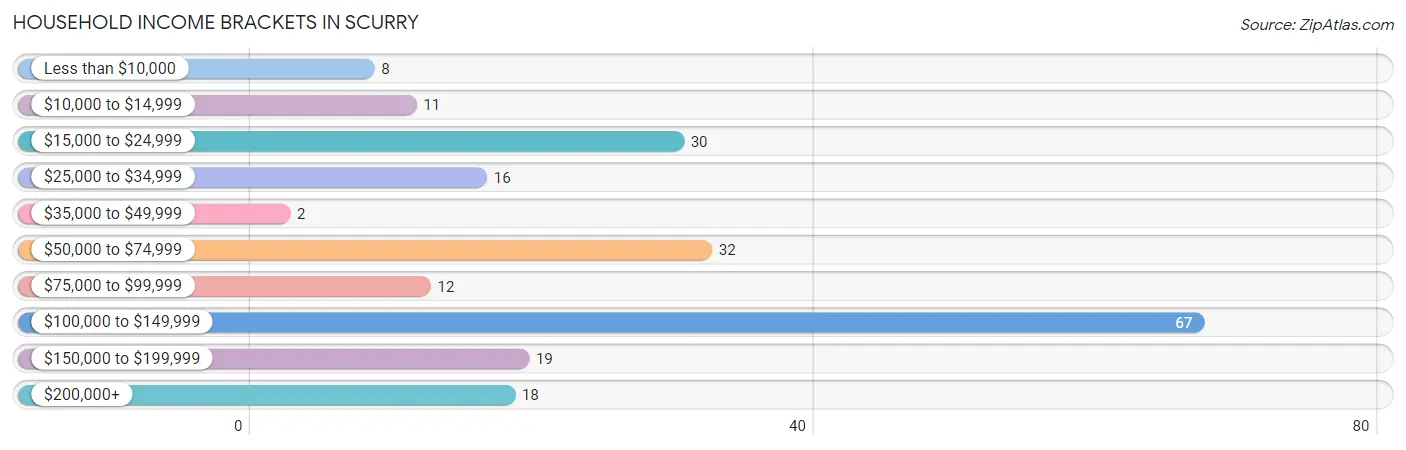
Household Income Brackets in Scurry
With 67 households falling in the category, the $100,000 to $149,999 income range is the most frequent in Scurry, accounting for 31.2% of all households. In contrast, only 2 households (0.9%) fall into the $35,000 to $49,999 income bracket, making it the least populous group.
| Income Bracket | # Households | % Households |
| Less than $10,000 | 8 | 3.7% |
| $10,000 to $14,999 | 11 | 5.1% |
| $15,000 to $24,999 | 30 | 14.0% |
| $25,000 to $34,999 | 16 | 7.4% |
| $35,000 to $49,999 | 2 | 0.9% |
| $50,000 to $74,999 | 32 | 14.9% |
| $75,000 to $99,999 | 12 | 5.6% |
| $100,000 to $149,999 | 67 | 31.2% |
| $150,000 to $199,999 | 19 | 8.8% |
| $200,000+ | 18 | 8.4% |
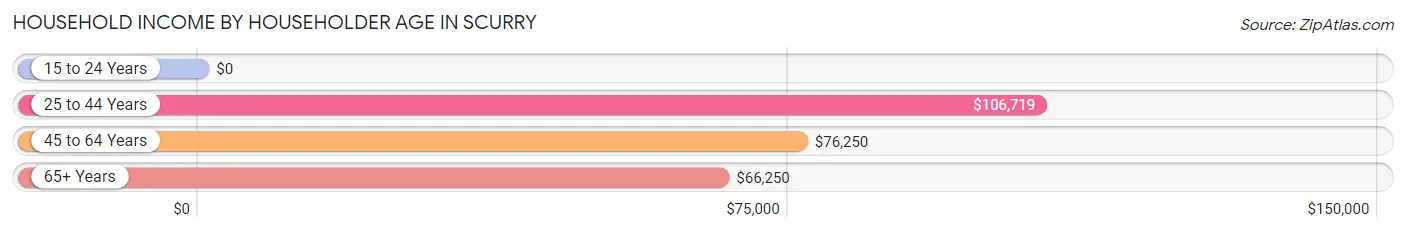
Household Income by Householder Age in Scurry
The median household income in Scurry is $90,750, with the highest median household income of $106,719 found in the 25 to 44 years age bracket for the primary householder. A total of 101 households (47.0%) fall into this category. Meanwhile, the 15 to 24 years age bracket for the primary householder has the lowest median household income of $0, with 1 households (0.5%) in this group.
| Income Bracket | # Households | Median Income |
| 15 to 24 Years | 1 (0.5%) | $0 |
| 25 to 44 Years | 101 (47.0%) | $106,719 |
| 45 to 64 Years | 73 (34.0%) | $76,250 |
| 65+ Years | 40 (18.6%) | $66,250 |
| Total | 215 (100.0%) | $90,750 |
Poverty in Scurry
Income Below Poverty by Sex and Age in Scurry
With 9.2% poverty level for males and 14.0% for females among the residents of Scurry, 25 to 34 year old males and 25 to 34 year old females are the most vulnerable to poverty, with 20 males (28.6%) and 28 females (37.8%) in their respective age groups living below the poverty level.
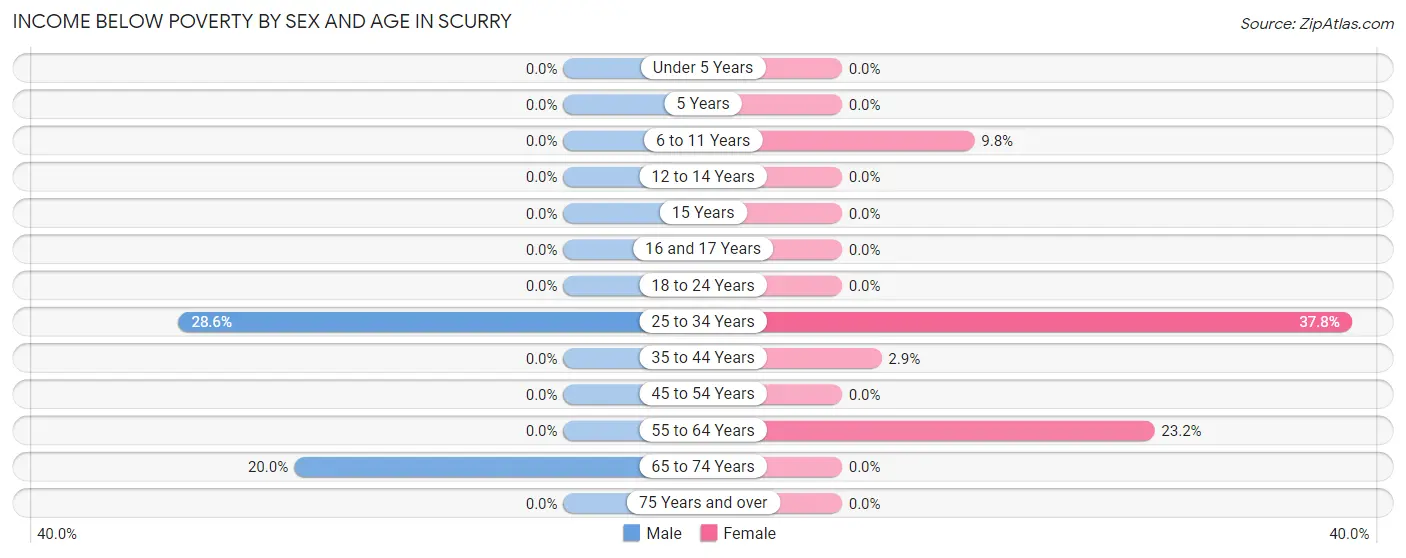
| Age Bracket | Male | Female |
| Under 5 Years | 0 (0.0%) | 0 (0.0%) |
| 5 Years | 0 (0.0%) | 0 (0.0%) |
| 6 to 11 Years | 0 (0.0%) | 6 (9.8%) |
| 12 to 14 Years | 0 (0.0%) | 0 (0.0%) |
| 15 Years | 0 (0.0%) | 0 (0.0%) |
| 16 and 17 Years | 0 (0.0%) | 0 (0.0%) |
| 18 to 24 Years | 0 (0.0%) | 0 (0.0%) |
| 25 to 34 Years | 20 (28.6%) | 28 (37.8%) |
| 35 to 44 Years | 0 (0.0%) | 1 (2.9%) |
| 45 to 54 Years | 0 (0.0%) | 0 (0.0%) |
| 55 to 64 Years | 0 (0.0%) | 13 (23.2%) |
| 65 to 74 Years | 5 (20.0%) | 0 (0.0%) |
| 75 Years and over | 0 (0.0%) | 0 (0.0%) |
| Total | 25 (9.2%) | 48 (14.0%) |
Income Above Poverty by Sex and Age in Scurry
According to the poverty statistics in Scurry, males aged under 5 years and females aged under 5 years are the age groups that are most secure financially, with 100.0% of males and 100.0% of females in these age groups living above the poverty line.
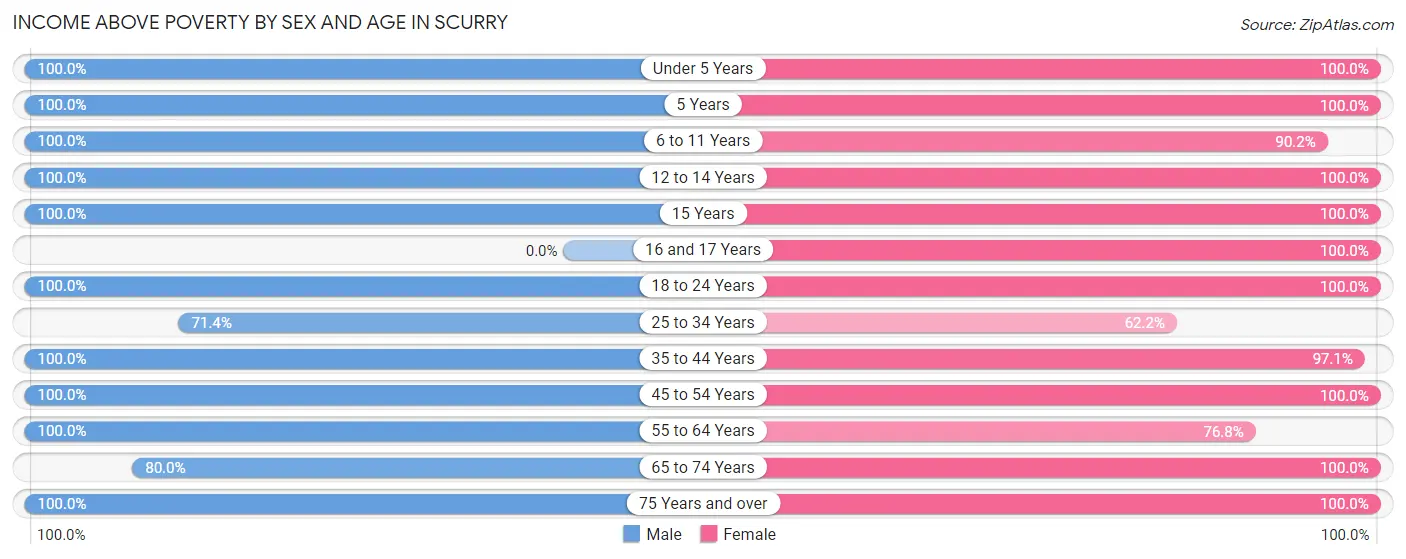
| Age Bracket | Male | Female |
| Under 5 Years | 37 (100.0%) | 31 (100.0%) |
| 5 Years | 2 (100.0%) | 2 (100.0%) |
| 6 to 11 Years | 32 (100.0%) | 55 (90.2%) |
| 12 to 14 Years | 4 (100.0%) | 9 (100.0%) |
| 15 Years | 7 (100.0%) | 2 (100.0%) |
| 16 and 17 Years | 0 (0.0%) | 4 (100.0%) |
| 18 to 24 Years | 10 (100.0%) | 28 (100.0%) |
| 25 to 34 Years | 50 (71.4%) | 46 (62.2%) |
| 35 to 44 Years | 27 (100.0%) | 33 (97.1%) |
| 45 to 54 Years | 42 (100.0%) | 21 (100.0%) |
| 55 to 64 Years | 6 (100.0%) | 43 (76.8%) |
| 65 to 74 Years | 20 (80.0%) | 8 (100.0%) |
| 75 Years and over | 11 (100.0%) | 13 (100.0%) |
| Total | 248 (90.8%) | 295 (86.0%) |
Income Below Poverty Among Married-Couple Families in Scurry
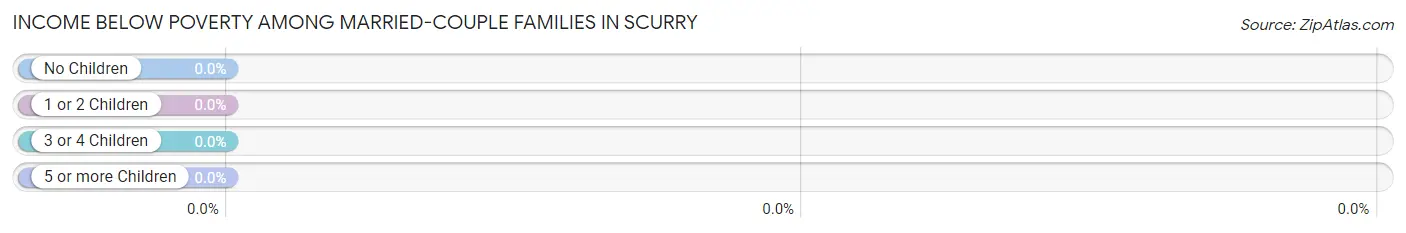
| Children | Above Poverty | Below Poverty |
| No Children | 52 (100.0%) | 0 (0.0%) |
| 1 or 2 Children | 46 (100.0%) | 0 (0.0%) |
| 3 or 4 Children | 24 (100.0%) | 0 (0.0%) |
| 5 or more Children | 2 (100.0%) | 0 (0.0%) |
| Total | 124 (100.0%) | 0 (0.0%) |
Income Below Poverty Among Single-Parent Households in Scurry
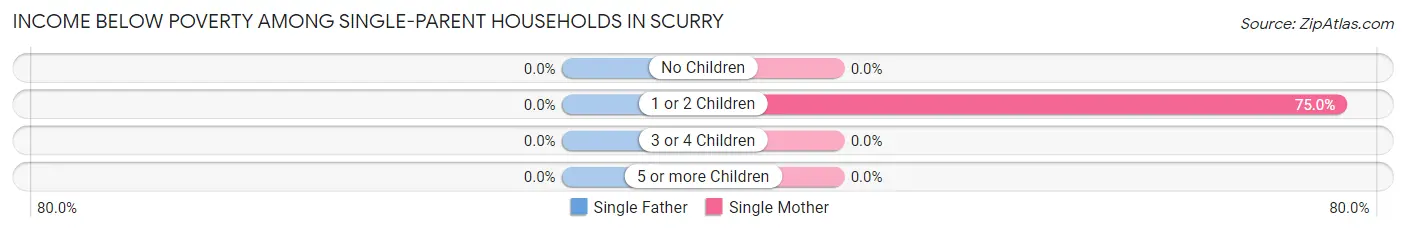
| Children | Single Father | Single Mother |
| No Children | 0 (0.0%) | 0 (0.0%) |
| 1 or 2 Children | 0 (0.0%) | 6 (75.0%) |
| 3 or 4 Children | 0 (0.0%) | 0 (0.0%) |
| 5 or more Children | 0 (0.0%) | 0 (0.0%) |
| Total | 0 (0.0%) | 6 (75.0%) |
Income Below Poverty Among Married-Couple vs Single-Parent Households in Scurry
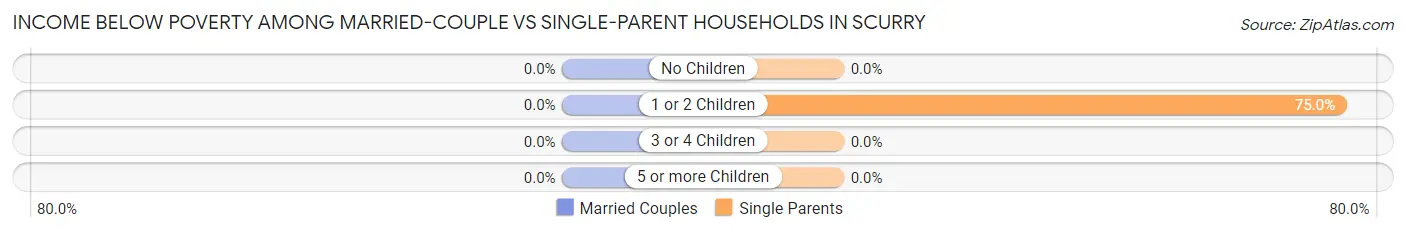
| Children | Married-Couple Families | Single-Parent Households |
| No Children | 0 (0.0%) | 0 (0.0%) |
| 1 or 2 Children | 0 (0.0%) | 6 (75.0%) |
| 3 or 4 Children | 0 (0.0%) | 0 (0.0%) |
| 5 or more Children | 0 (0.0%) | 0 (0.0%) |
| Total | 0 (0.0%) | 6 (42.9%) |
Employment Characteristics in Scurry
Employment by Class of Employer in Scurry
Among the 270 employed individuals in Scurry, private company employees (158 | 58.5%), self-employed (not incorporated) (45 | 16.7%), and local government employees (41 | 15.2%) make up the most common classes of employment.
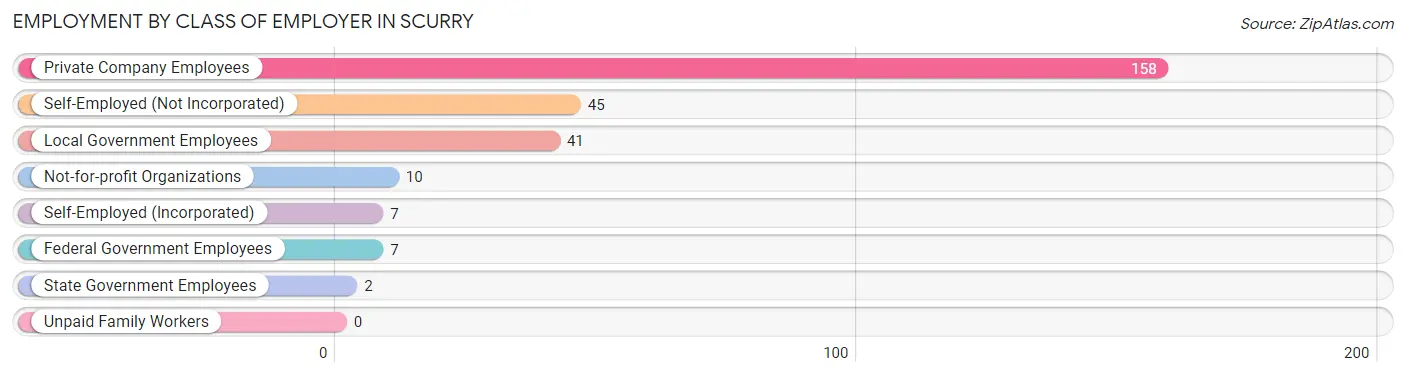
| Employer Class | # Employees | % Employees |
| Private Company Employees | 158 | 58.5% |
| Self-Employed (Incorporated) | 7 | 2.6% |
| Self-Employed (Not Incorporated) | 45 | 16.7% |
| Not-for-profit Organizations | 10 | 3.7% |
| Local Government Employees | 41 | 15.2% |
| State Government Employees | 2 | 0.7% |
| Federal Government Employees | 7 | 2.6% |
| Unpaid Family Workers | 0 | 0.0% |
| Total | 270 | 100.0% |
Employment Status by Age in Scurry
According to the labor force statistics for Scurry, out of the total population over 16 years of age (429), 64.3% or 276 individuals are in the labor force, with 2.2% or 6 of them unemployed. The age group with the highest labor force participation rate is 35 to 44 years, with 96.7% or 59 individuals in the labor force. Within the labor force, the 25 to 29 years age range has the highest percentage of unemployed individuals, with 13.0% or 6 of them being unemployed.
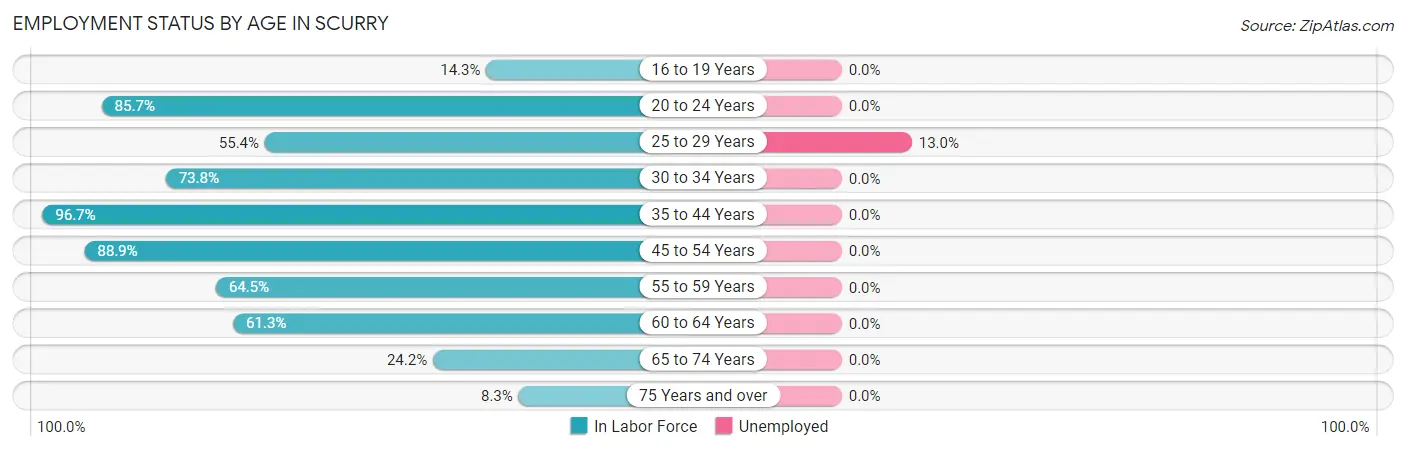
| Age Bracket | In Labor Force | Unemployed |
| 16 to 19 Years | 3 (14.3%) | 0 (0.0%) |
| 20 to 24 Years | 18 (85.7%) | 0 (0.0%) |
| 25 to 29 Years | 46 (55.4%) | 6 (13.0%) |
| 30 to 34 Years | 45 (73.8%) | 0 (0.0%) |
| 35 to 44 Years | 59 (96.7%) | 0 (0.0%) |
| 45 to 54 Years | 56 (88.9%) | 0 (0.0%) |
| 55 to 59 Years | 20 (64.5%) | 0 (0.0%) |
| 60 to 64 Years | 19 (61.3%) | 0 (0.0%) |
| 65 to 74 Years | 8 (24.2%) | 0 (0.0%) |
| 75 Years and over | 2 (8.3%) | 0 (0.0%) |
| Total | 276 (64.3%) | 6 (2.2%) |
Employment Status by Educational Attainment in Scurry
According to labor force statistics for Scurry, 74.2% of individuals (245) out of the total population between 25 and 64 years of age (330) are in the labor force, with 2.4% or 6 of them being unemployed. The group with the highest labor force participation rate are those with the educational attainment of bachelor's degree or higher, with 93.8% or 90 individuals in the labor force. Within the labor force, individuals with high school diploma education have the highest percentage of unemployment, with 9.7% or 6 of them being unemployed.
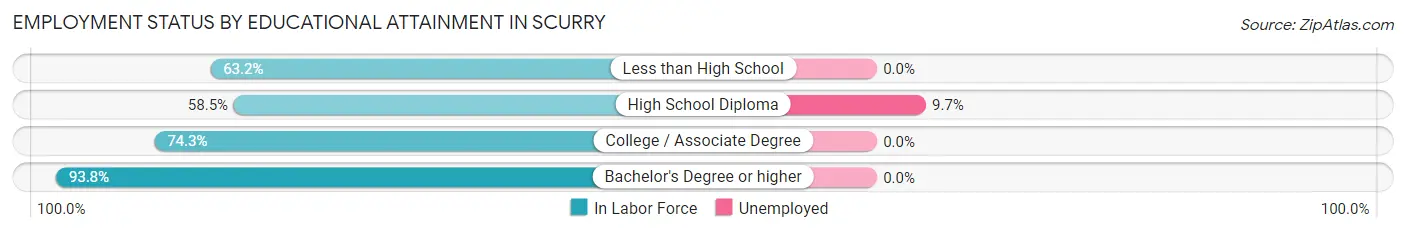
| Educational Attainment | In Labor Force | Unemployed |
| Less than High School | 12 (63.2%) | 0 (0.0%) |
| High School Diploma | 62 (58.5%) | 10 (9.7%) |
| College / Associate Degree | 81 (74.3%) | 0 (0.0%) |
| Bachelor's Degree or higher | 90 (93.8%) | 0 (0.0%) |
| Total | 245 (74.2%) | 8 (2.4%) |
Employment Occupations by Sex in Scurry
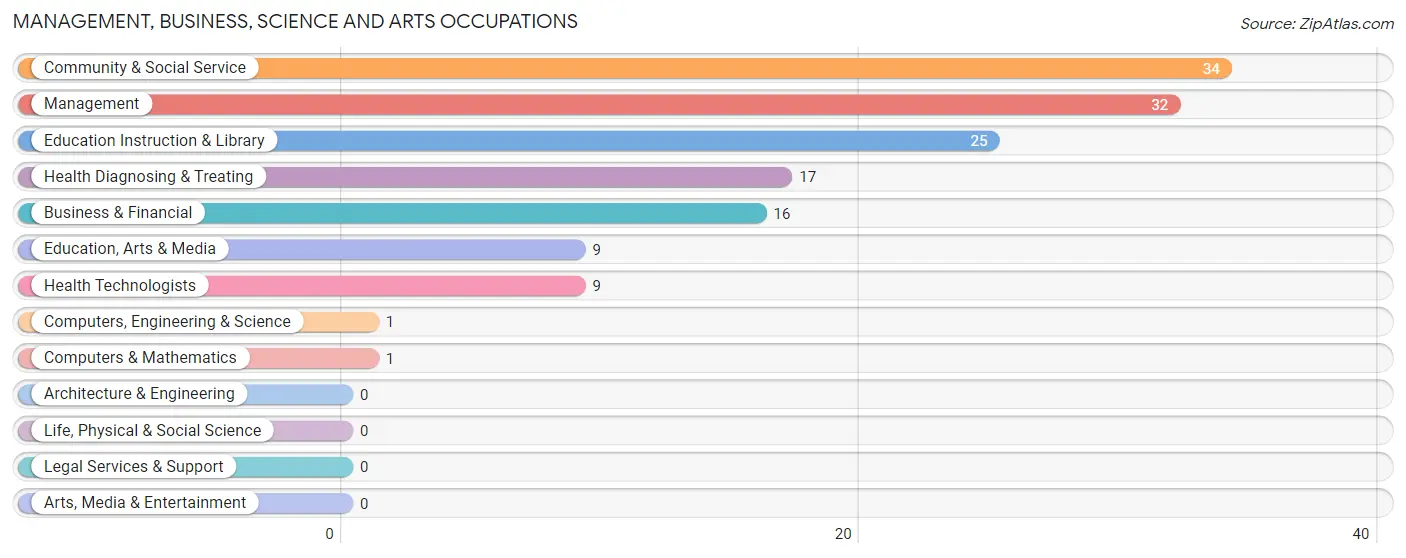
Management, Business, Science and Arts Occupations
The most common Management, Business, Science and Arts occupations in Scurry are Community & Social Service (34 | 12.6%), Management (32 | 11.8%), Education Instruction & Library (25 | 9.3%), Health Diagnosing & Treating (17 | 6.3%), and Business & Financial (16 | 5.9%).
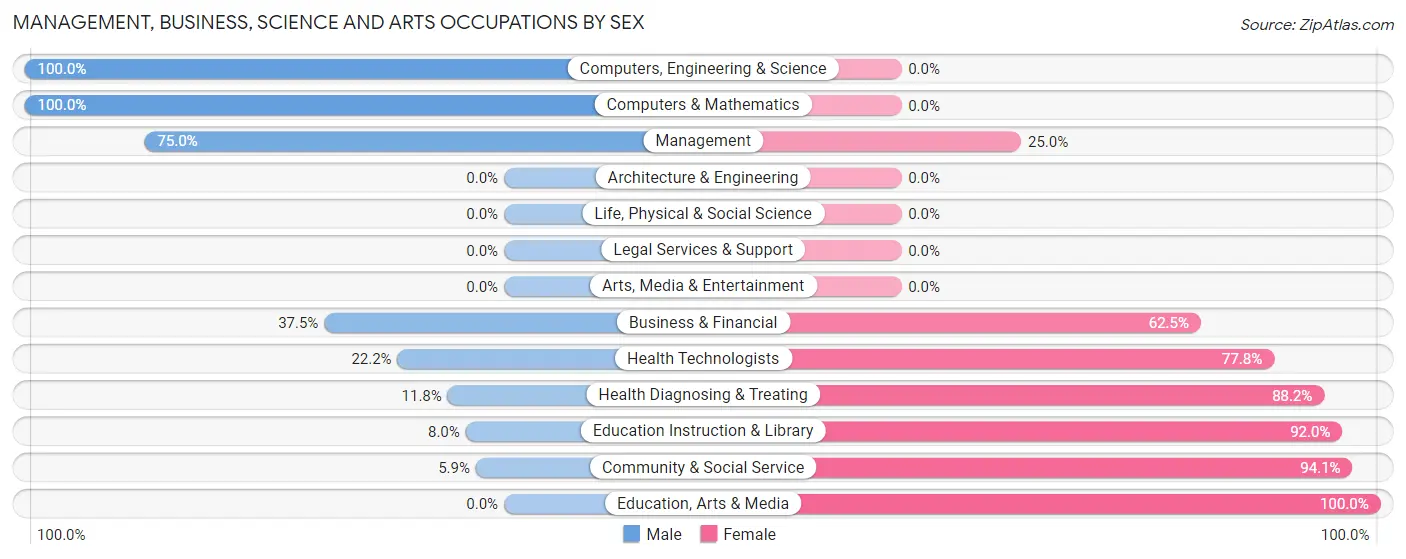
Management, Business, Science and Arts Occupations by Sex
Within the Management, Business, Science and Arts occupations in Scurry, the most male-oriented occupations are Computers, Engineering & Science (100.0%), Computers & Mathematics (100.0%), and Management (75.0%), while the most female-oriented occupations are Education, Arts & Media (100.0%), Community & Social Service (94.1%), and Education Instruction & Library (92.0%).
| Occupation | Male | Female |
| Management | 24 (75.0%) | 8 (25.0%) |
| Business & Financial | 6 (37.5%) | 10 (62.5%) |
| Computers, Engineering & Science | 1 (100.0%) | 0 (0.0%) |
| Computers & Mathematics | 1 (100.0%) | 0 (0.0%) |
| Architecture & Engineering | 0 (0.0%) | 0 (0.0%) |
| Life, Physical & Social Science | 0 (0.0%) | 0 (0.0%) |
| Community & Social Service | 2 (5.9%) | 32 (94.1%) |
| Education, Arts & Media | 0 (0.0%) | 9 (100.0%) |
| Legal Services & Support | 0 (0.0%) | 0 (0.0%) |
| Education Instruction & Library | 2 (8.0%) | 23 (92.0%) |
| Arts, Media & Entertainment | 0 (0.0%) | 0 (0.0%) |
| Health Diagnosing & Treating | 2 (11.8%) | 15 (88.2%) |
| Health Technologists | 2 (22.2%) | 7 (77.8%) |
| Total (Category) | 35 (35.0%) | 65 (65.0%) |
| Total (Overall) | 148 (54.8%) | 122 (45.2%) |
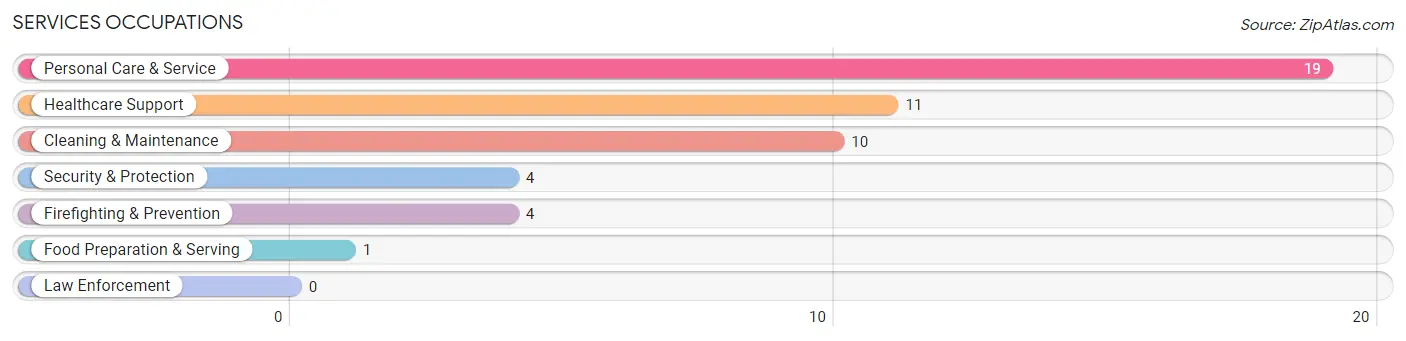
Services Occupations
The most common Services occupations in Scurry are Personal Care & Service (19 | 7.0%), Healthcare Support (11 | 4.1%), Cleaning & Maintenance (10 | 3.7%), Security & Protection (4 | 1.5%), and Firefighting & Prevention (4 | 1.5%).
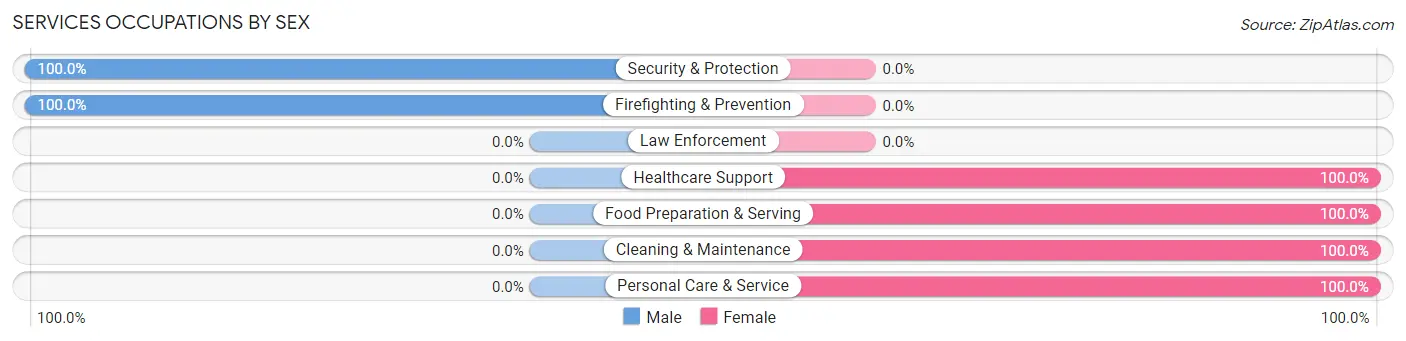
Services Occupations by Sex
Within the Services occupations in Scurry, the most male-oriented occupations are Security & Protection (100.0%), and Firefighting & Prevention (100.0%), while the most female-oriented occupations are Healthcare Support (100.0%), Food Preparation & Serving (100.0%), and Cleaning & Maintenance (100.0%).
| Occupation | Male | Female |
| Healthcare Support | 0 (0.0%) | 11 (100.0%) |
| Security & Protection | 4 (100.0%) | 0 (0.0%) |
| Firefighting & Prevention | 4 (100.0%) | 0 (0.0%) |
| Law Enforcement | 0 (0.0%) | 0 (0.0%) |
| Food Preparation & Serving | 0 (0.0%) | 1 (100.0%) |
| Cleaning & Maintenance | 0 (0.0%) | 10 (100.0%) |
| Personal Care & Service | 0 (0.0%) | 19 (100.0%) |
| Total (Category) | 4 (8.9%) | 41 (91.1%) |
| Total (Overall) | 148 (54.8%) | 122 (45.2%) |
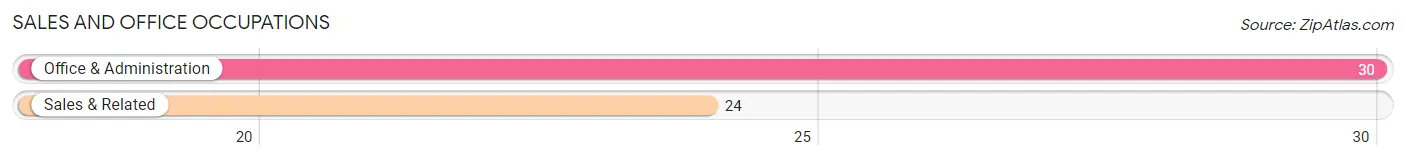
Sales and Office Occupations
The most common Sales and Office occupations in Scurry are Office & Administration (30 | 11.1%), and Sales & Related (24 | 8.9%).
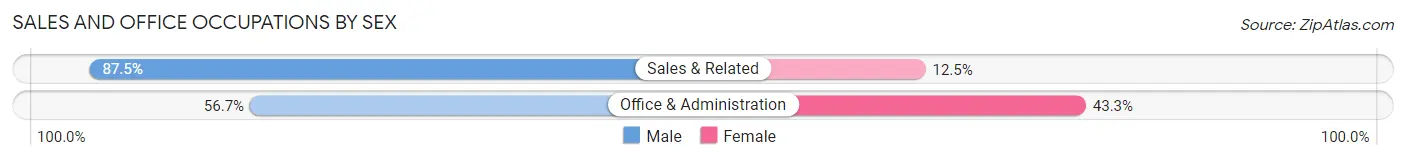
Sales and Office Occupations by Sex
| Occupation | Male | Female |
| Sales & Related | 21 (87.5%) | 3 (12.5%) |
| Office & Administration | 17 (56.7%) | 13 (43.3%) |
| Total (Category) | 38 (70.4%) | 16 (29.6%) |
| Total (Overall) | 148 (54.8%) | 122 (45.2%) |
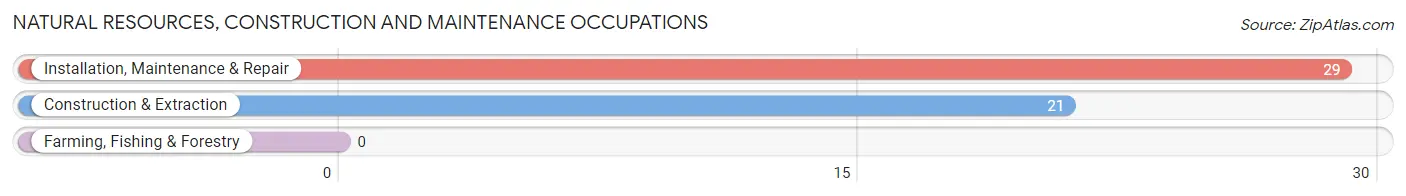
Natural Resources, Construction and Maintenance Occupations
The most common Natural Resources, Construction and Maintenance occupations in Scurry are Installation, Maintenance & Repair (29 | 10.7%), and Construction & Extraction (21 | 7.8%).
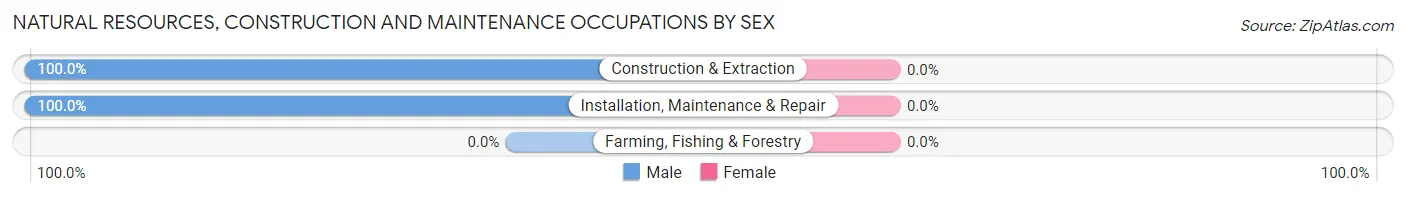
Natural Resources, Construction and Maintenance Occupations by Sex
| Occupation | Male | Female |
| Farming, Fishing & Forestry | 0 (0.0%) | 0 (0.0%) |
| Construction & Extraction | 21 (100.0%) | 0 (0.0%) |
| Installation, Maintenance & Repair | 29 (100.0%) | 0 (0.0%) |
| Total (Category) | 50 (100.0%) | 0 (0.0%) |
| Total (Overall) | 148 (54.8%) | 122 (45.2%) |
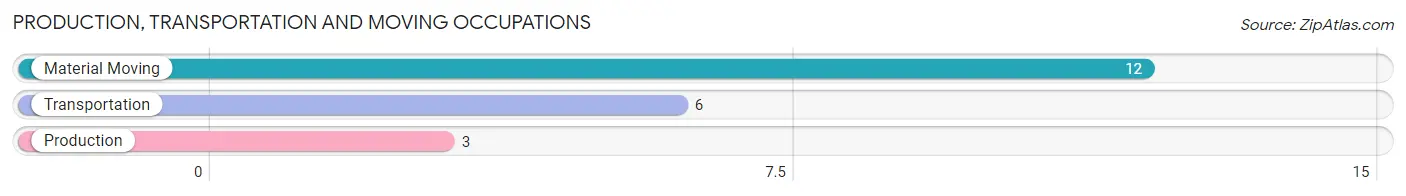
Production, Transportation and Moving Occupations
The most common Production, Transportation and Moving occupations in Scurry are Material Moving (12 | 4.4%), Transportation (6 | 2.2%), and Production (3 | 1.1%).
Production, Transportation and Moving Occupations by Sex
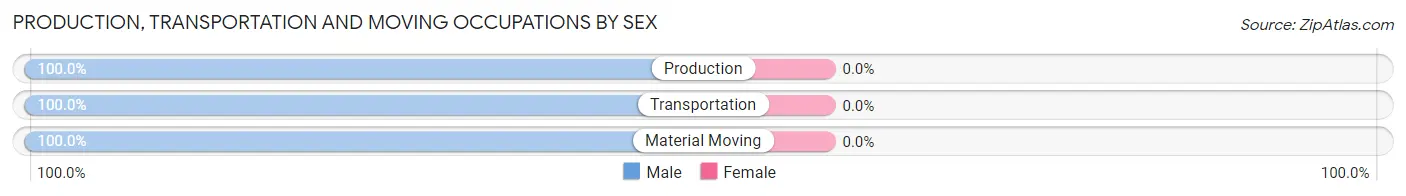
| Occupation | Male | Female |
| Production | 3 (100.0%) | 0 (0.0%) |
| Transportation | 6 (100.0%) | 0 (0.0%) |
| Material Moving | 12 (100.0%) | 0 (0.0%) |
| Total (Category) | 21 (100.0%) | 0 (0.0%) |
| Total (Overall) | 148 (54.8%) | 122 (45.2%) |
Employment Industries by Sex in Scurry
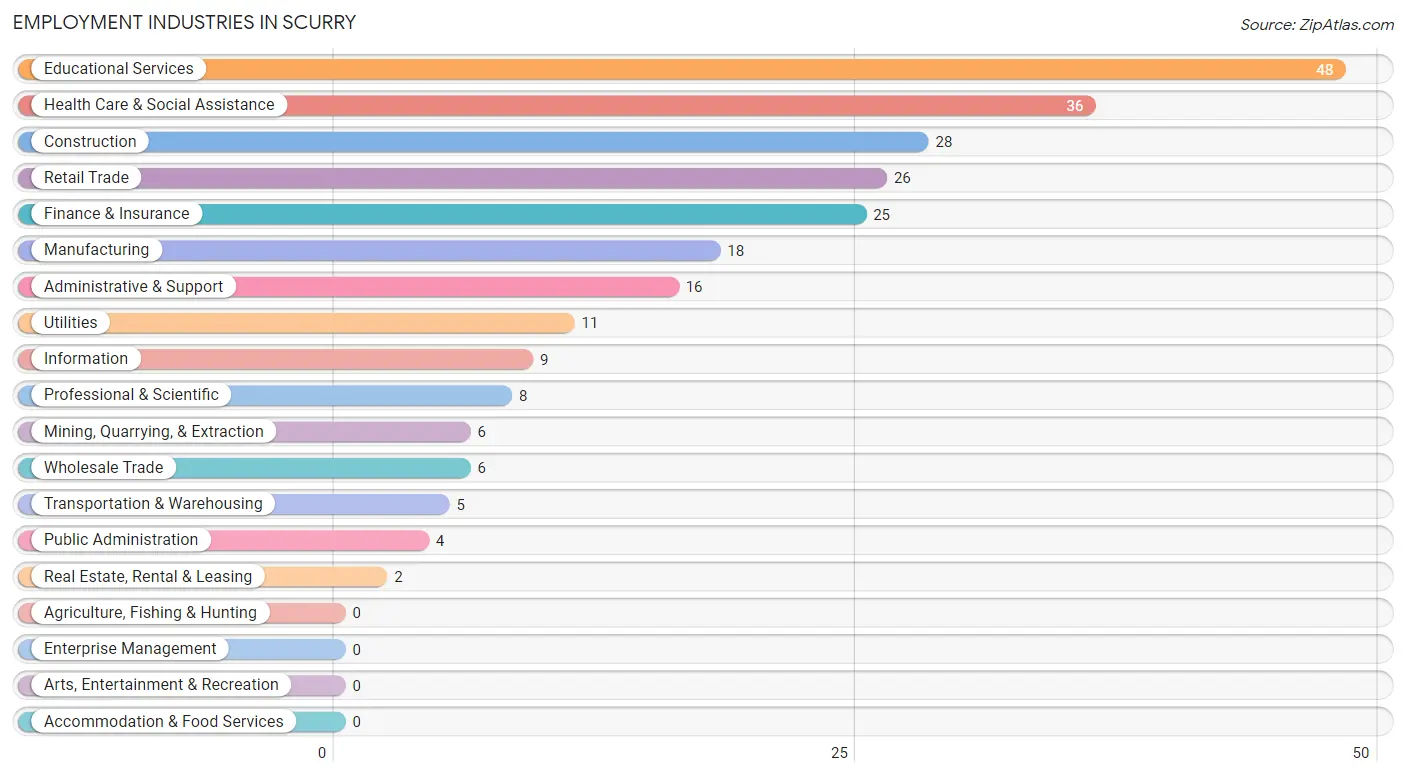
Employment Industries in Scurry
The major employment industries in Scurry include Educational Services (48 | 17.8%), Health Care & Social Assistance (36 | 13.3%), Construction (28 | 10.4%), Retail Trade (26 | 9.6%), and Finance & Insurance (25 | 9.3%).
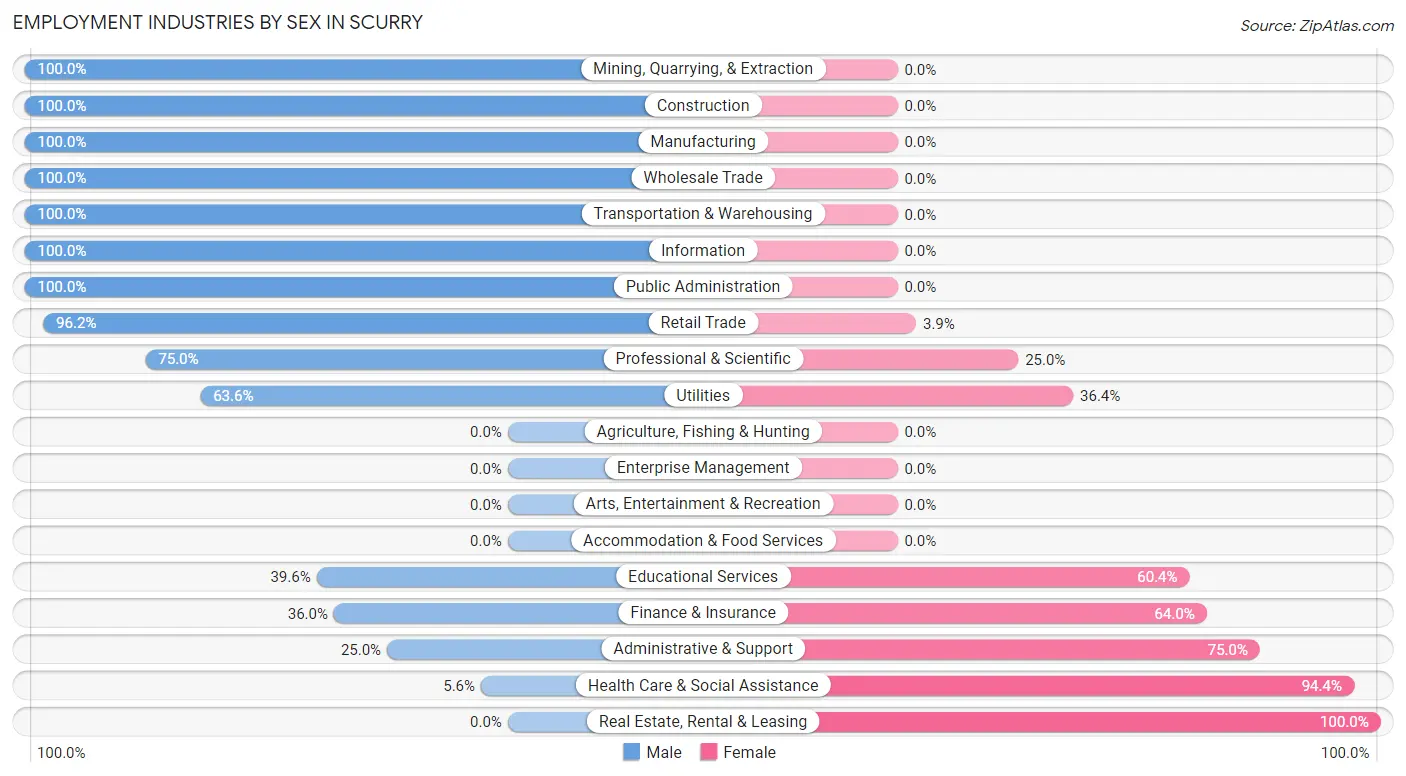
Employment Industries by Sex in Scurry
The Scurry industries that see more men than women are Mining, Quarrying, & Extraction (100.0%), Construction (100.0%), and Manufacturing (100.0%), whereas the industries that tend to have a higher number of women are Real Estate, Rental & Leasing (100.0%), Health Care & Social Assistance (94.4%), and Administrative & Support (75.0%).
| Industry | Male | Female |
| Agriculture, Fishing & Hunting | 0 (0.0%) | 0 (0.0%) |
| Mining, Quarrying, & Extraction | 6 (100.0%) | 0 (0.0%) |
| Construction | 28 (100.0%) | 0 (0.0%) |
| Manufacturing | 18 (100.0%) | 0 (0.0%) |
| Wholesale Trade | 6 (100.0%) | 0 (0.0%) |
| Retail Trade | 25 (96.2%) | 1 (3.8%) |
| Transportation & Warehousing | 5 (100.0%) | 0 (0.0%) |
| Utilities | 7 (63.6%) | 4 (36.4%) |
| Information | 9 (100.0%) | 0 (0.0%) |
| Finance & Insurance | 9 (36.0%) | 16 (64.0%) |
| Real Estate, Rental & Leasing | 0 (0.0%) | 2 (100.0%) |
| Professional & Scientific | 6 (75.0%) | 2 (25.0%) |
| Enterprise Management | 0 (0.0%) | 0 (0.0%) |
| Administrative & Support | 4 (25.0%) | 12 (75.0%) |
| Educational Services | 19 (39.6%) | 29 (60.4%) |
| Health Care & Social Assistance | 2 (5.6%) | 34 (94.4%) |
| Arts, Entertainment & Recreation | 0 (0.0%) | 0 (0.0%) |
| Accommodation & Food Services | 0 (0.0%) | 0 (0.0%) |
| Public Administration | 4 (100.0%) | 0 (0.0%) |
| Total | 148 (54.8%) | 122 (45.2%) |
Education in Scurry
School Enrollment in Scurry
The most common levels of schooling among the 146 students in Scurry are elementary school (56 | 38.4%), middle school (30 | 20.5%), and high school (20 | 13.7%).
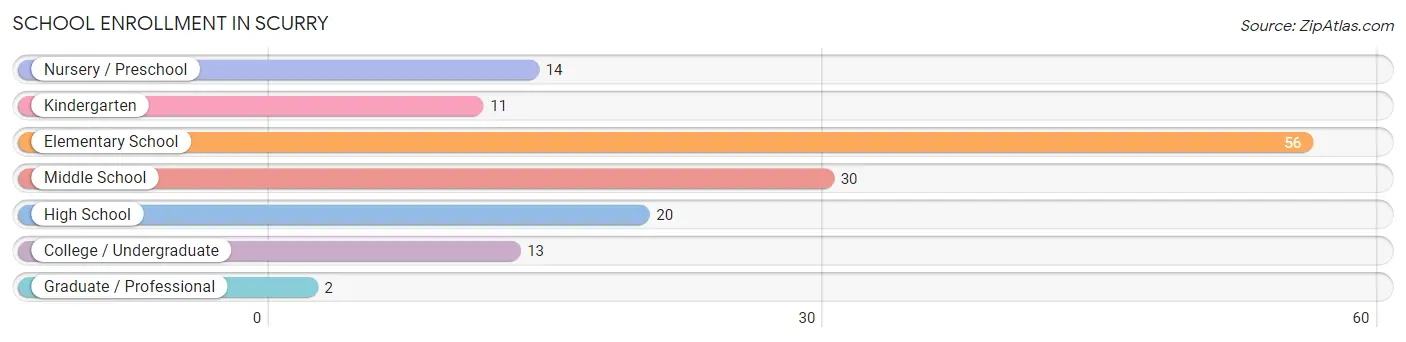
| School Level | # Students | % Students |
| Nursery / Preschool | 14 | 9.6% |
| Kindergarten | 11 | 7.5% |
| Elementary School | 56 | 38.4% |
| Middle School | 30 | 20.5% |
| High School | 20 | 13.7% |
| College / Undergraduate | 13 | 8.9% |
| Graduate / Professional | 2 | 1.4% |
| Total | 146 | 100.0% |
School Enrollment by Age by Funding Source in Scurry
Out of a total of 146 students who are enrolled in schools in Scurry, 17 (11.6%) attend a private institution, while the remaining 129 (88.4%) are enrolled in public schools. The age group of 15 to 17 year olds has the highest likelihood of being enrolled in private schools, with 6 (46.2% in the age bracket) enrolled. Conversely, the age group of 3 to 4 year olds has the lowest likelihood of being enrolled in a private school, with 12 (100.0% in the age bracket) attending a public institution.
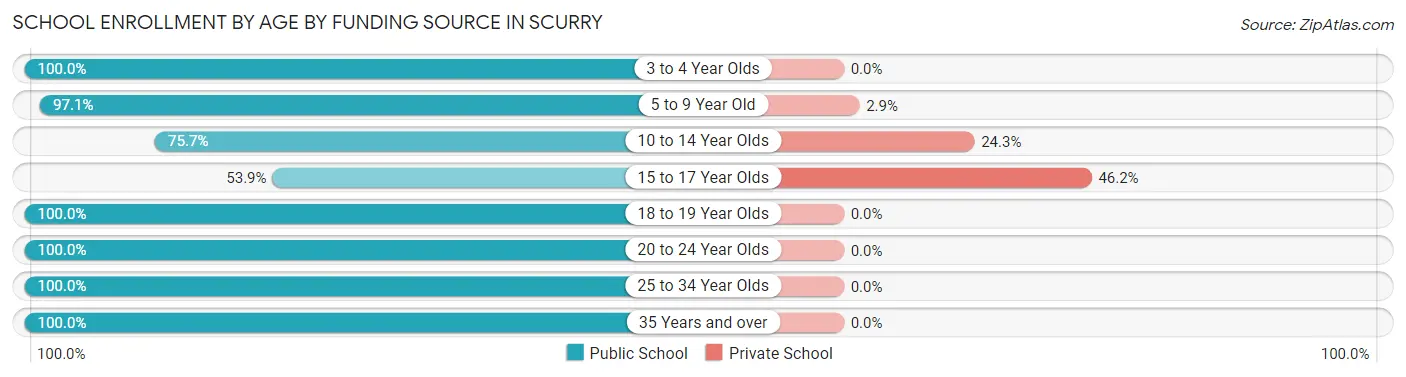
| Age Bracket | Public School | Private School |
| 3 to 4 Year Olds | 12 (100.0%) | 0 (0.0%) |
| 5 to 9 Year Old | 67 (97.1%) | 2 (2.9%) |
| 10 to 14 Year Olds | 28 (75.7%) | 9 (24.3%) |
| 15 to 17 Year Olds | 7 (53.8%) | 6 (46.2%) |
| 18 to 19 Year Olds | 6 (100.0%) | 0 (0.0%) |
| 20 to 24 Year Olds | 3 (100.0%) | 0 (0.0%) |
| 25 to 34 Year Olds | 2 (100.0%) | 0 (0.0%) |
| 35 Years and over | 4 (100.0%) | 0 (0.0%) |
| Total | 129 (88.4%) | 17 (11.6%) |
Educational Attainment by Field of Study in Scurry
Business (24 | 24.0%), education (24 | 24.0%), arts & humanities (11 | 11.0%), multidisciplinary studies (9 | 9.0%), and engineering (8 | 8.0%) are the most common fields of study among 100 individuals in Scurry who have obtained a bachelor's degree or higher.
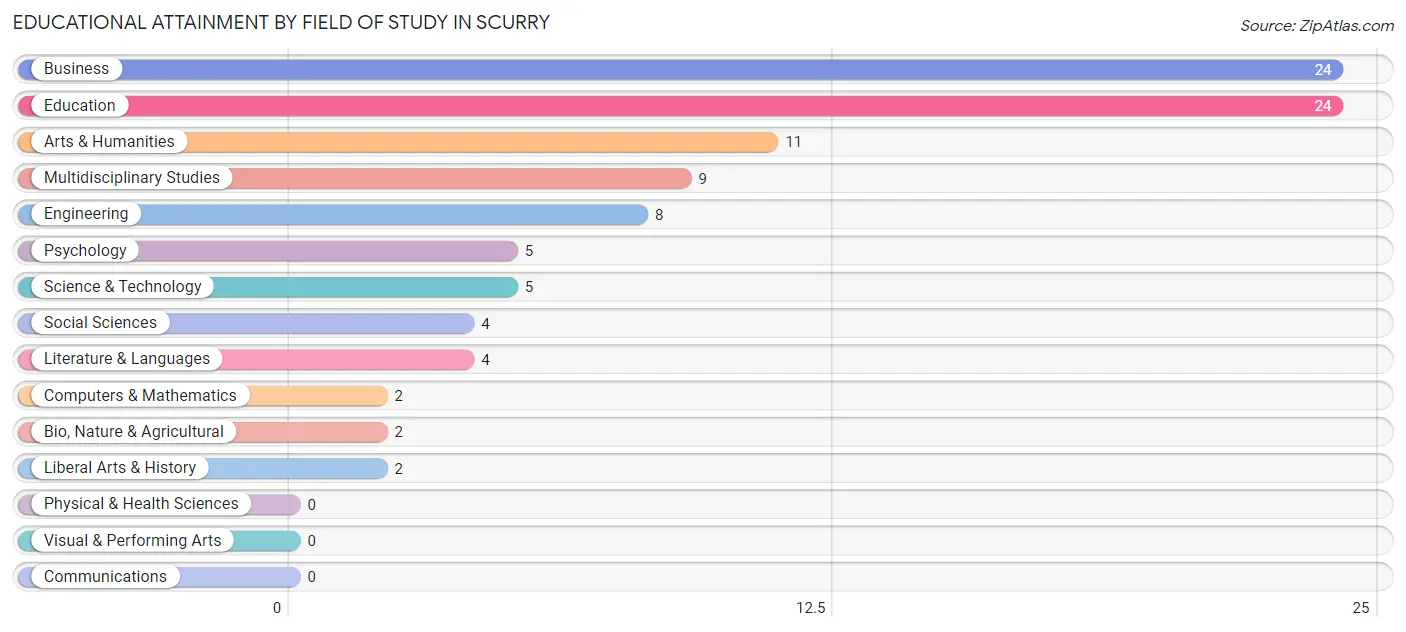
| Field of Study | # Graduates | % Graduates |
| Computers & Mathematics | 2 | 2.0% |
| Bio, Nature & Agricultural | 2 | 2.0% |
| Physical & Health Sciences | 0 | 0.0% |
| Psychology | 5 | 5.0% |
| Social Sciences | 4 | 4.0% |
| Engineering | 8 | 8.0% |
| Multidisciplinary Studies | 9 | 9.0% |
| Science & Technology | 5 | 5.0% |
| Business | 24 | 24.0% |
| Education | 24 | 24.0% |
| Literature & Languages | 4 | 4.0% |
| Liberal Arts & History | 2 | 2.0% |
| Visual & Performing Arts | 0 | 0.0% |
| Communications | 0 | 0.0% |
| Arts & Humanities | 11 | 11.0% |
| Total | 100 | 100.0% |
Transportation & Commute in Scurry
Vehicle Availability by Sex in Scurry
The most prevalent vehicle ownership categories in Scurry are males with 2 vehicles (64, accounting for 43.2%) and females with 2 vehicles (57, making up 52.5%).
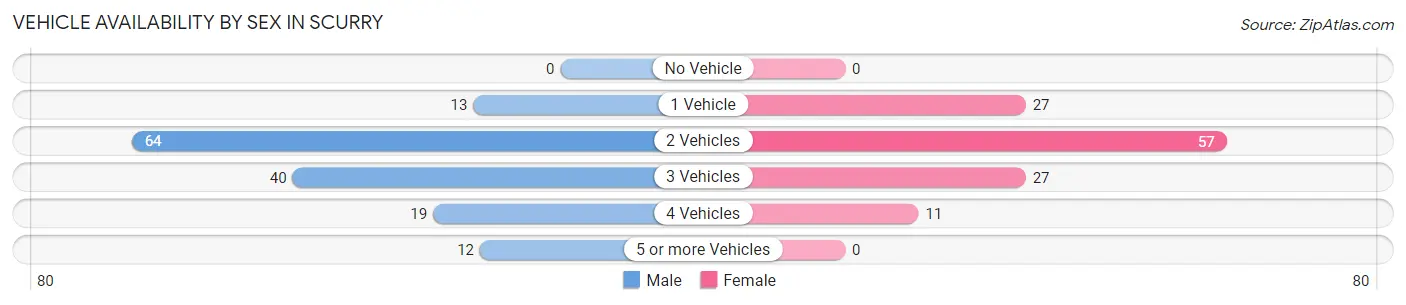
| Vehicles Available | Male | Female |
| No Vehicle | 0 (0.0%) | 0 (0.0%) |
| 1 Vehicle | 13 (8.8%) | 27 (22.1%) |
| 2 Vehicles | 64 (43.2%) | 57 (46.7%) |
| 3 Vehicles | 40 (27.0%) | 27 (22.1%) |
| 4 Vehicles | 19 (12.8%) | 11 (9.0%) |
| 5 or more Vehicles | 12 (8.1%) | 0 (0.0%) |
| Total | 148 (100.0%) | 122 (100.0%) |
Commute Time in Scurry
The most frequently occuring commute durations in Scurry are 45 to 59 minutes (58 commuters, 23.4%), 60 to 89 minutes (42 commuters, 16.9%), and 30 to 34 minutes (25 commuters, 10.1%).
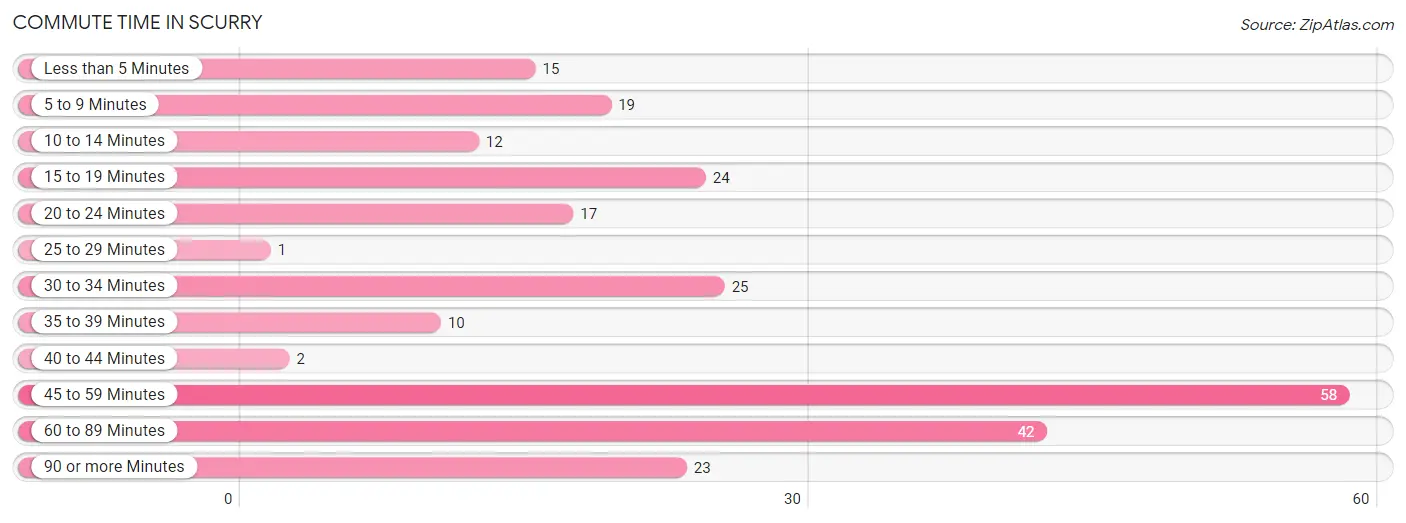
| Commute Time | # Commuters | % Commuters |
| Less than 5 Minutes | 15 | 6.0% |
| 5 to 9 Minutes | 19 | 7.7% |
| 10 to 14 Minutes | 12 | 4.8% |
| 15 to 19 Minutes | 24 | 9.7% |
| 20 to 24 Minutes | 17 | 6.9% |
| 25 to 29 Minutes | 1 | 0.4% |
| 30 to 34 Minutes | 25 | 10.1% |
| 35 to 39 Minutes | 10 | 4.0% |
| 40 to 44 Minutes | 2 | 0.8% |
| 45 to 59 Minutes | 58 | 23.4% |
| 60 to 89 Minutes | 42 | 16.9% |
| 90 or more Minutes | 23 | 9.3% |
Commute Time by Sex in Scurry
The most common commute times in Scurry are 60 to 89 minutes (31 commuters, 23.0%) for males and 45 to 59 minutes (28 commuters, 24.8%) for females.
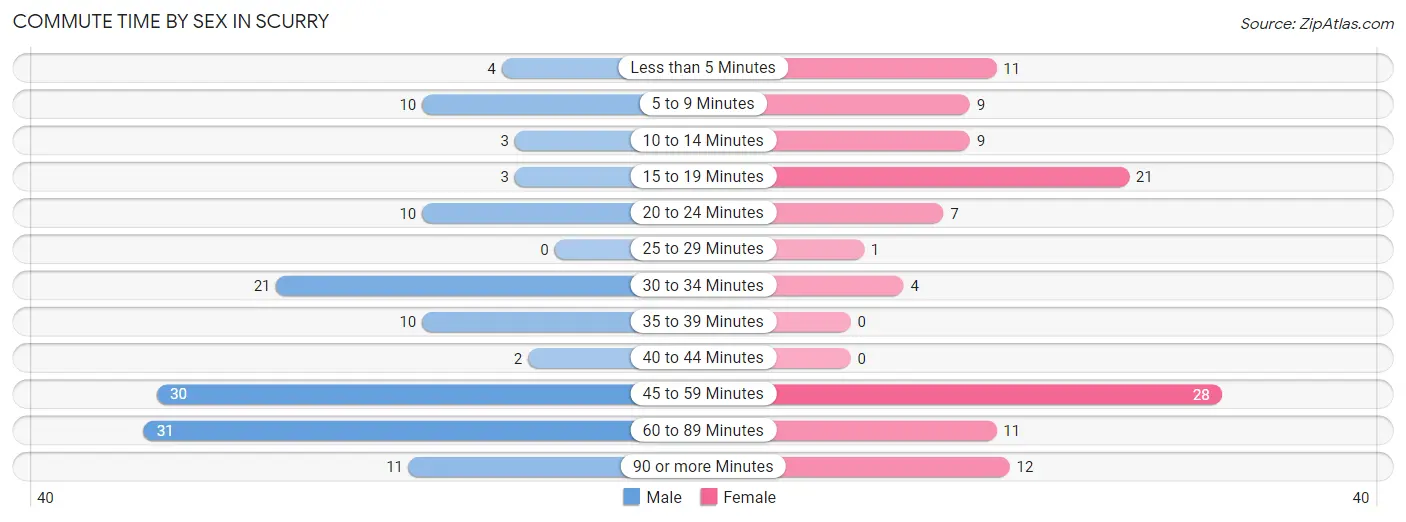
| Commute Time | Male | Female |
| Less than 5 Minutes | 4 (3.0%) | 11 (9.7%) |
| 5 to 9 Minutes | 10 (7.4%) | 9 (8.0%) |
| 10 to 14 Minutes | 3 (2.2%) | 9 (8.0%) |
| 15 to 19 Minutes | 3 (2.2%) | 21 (18.6%) |
| 20 to 24 Minutes | 10 (7.4%) | 7 (6.2%) |
| 25 to 29 Minutes | 0 (0.0%) | 1 (0.9%) |
| 30 to 34 Minutes | 21 (15.6%) | 4 (3.5%) |
| 35 to 39 Minutes | 10 (7.4%) | 0 (0.0%) |
| 40 to 44 Minutes | 2 (1.5%) | 0 (0.0%) |
| 45 to 59 Minutes | 30 (22.2%) | 28 (24.8%) |
| 60 to 89 Minutes | 31 (23.0%) | 11 (9.7%) |
| 90 or more Minutes | 11 (8.2%) | 12 (10.6%) |
Time of Departure to Work by Sex in Scurry
The most frequent times of departure to work in Scurry are 7:00 AM to 7:29 AM (37, 27.4%) for males and 6:30 AM to 6:59 AM (26, 23.0%) for females.
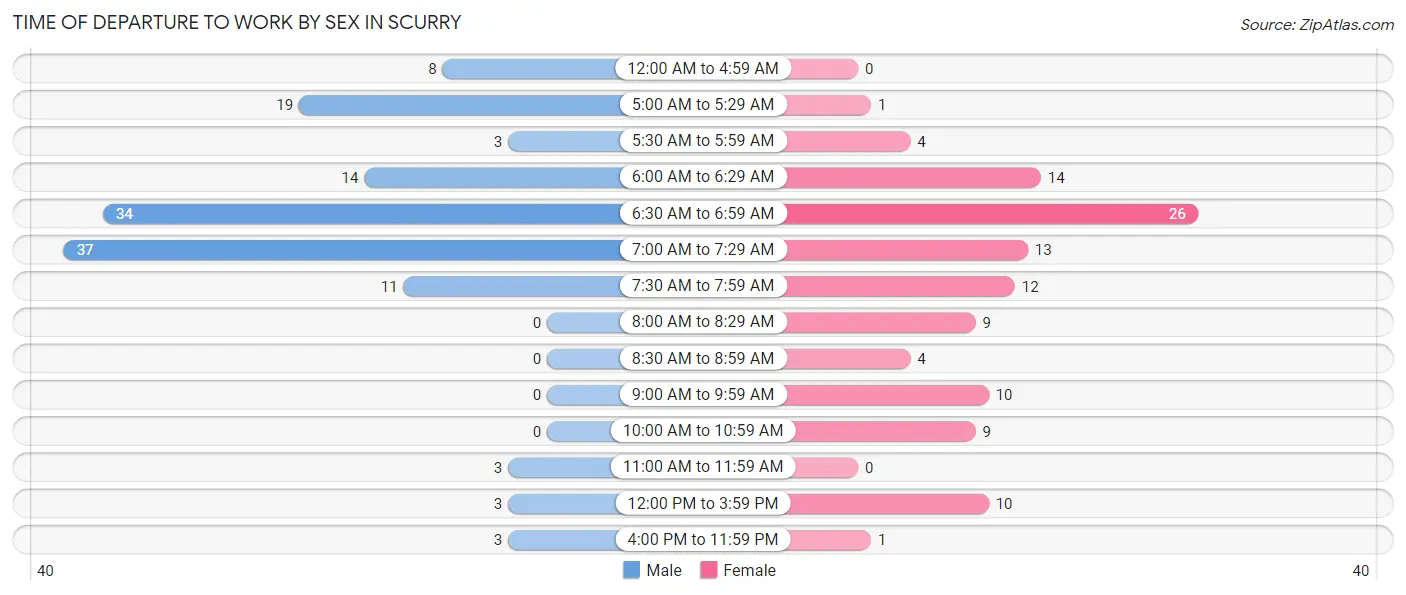
| Time of Departure | Male | Female |
| 12:00 AM to 4:59 AM | 8 (5.9%) | 0 (0.0%) |
| 5:00 AM to 5:29 AM | 19 (14.1%) | 1 (0.9%) |
| 5:30 AM to 5:59 AM | 3 (2.2%) | 4 (3.5%) |
| 6:00 AM to 6:29 AM | 14 (10.4%) | 14 (12.4%) |
| 6:30 AM to 6:59 AM | 34 (25.2%) | 26 (23.0%) |
| 7:00 AM to 7:29 AM | 37 (27.4%) | 13 (11.5%) |
| 7:30 AM to 7:59 AM | 11 (8.2%) | 12 (10.6%) |
| 8:00 AM to 8:29 AM | 0 (0.0%) | 9 (8.0%) |
| 8:30 AM to 8:59 AM | 0 (0.0%) | 4 (3.5%) |
| 9:00 AM to 9:59 AM | 0 (0.0%) | 10 (8.8%) |
| 10:00 AM to 10:59 AM | 0 (0.0%) | 9 (8.0%) |
| 11:00 AM to 11:59 AM | 3 (2.2%) | 0 (0.0%) |
| 12:00 PM to 3:59 PM | 3 (2.2%) | 10 (8.8%) |
| 4:00 PM to 11:59 PM | 3 (2.2%) | 1 (0.9%) |
| Total | 135 (100.0%) | 113 (100.0%) |
Housing Occupancy in Scurry
Occupancy by Ownership in Scurry
Of the total 215 dwellings in Scurry, owner-occupied units account for 158 (73.5%), while renter-occupied units make up 57 (26.5%).
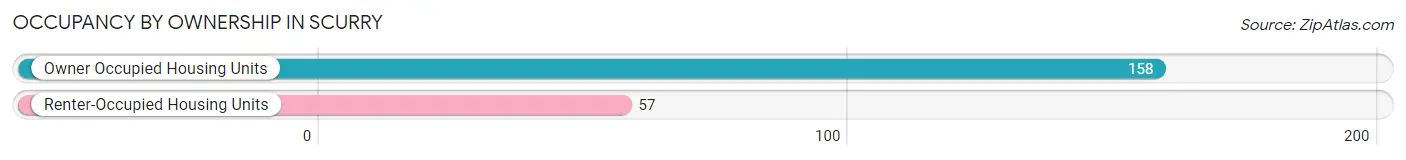
| Occupancy | # Housing Units | % Housing Units |
| Owner Occupied Housing Units | 158 | 73.5% |
| Renter-Occupied Housing Units | 57 | 26.5% |
| Total Occupied Housing Units | 215 | 100.0% |
Occupancy by Household Size in Scurry
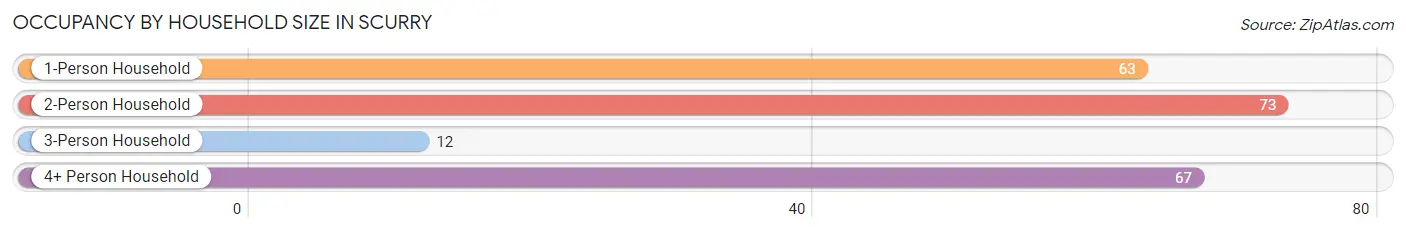
| Household Size | # Housing Units | % Housing Units |
| 1-Person Household | 63 | 29.3% |
| 2-Person Household | 73 | 34.0% |
| 3-Person Household | 12 | 5.6% |
| 4+ Person Household | 67 | 31.2% |
| Total Housing Units | 215 | 100.0% |
Occupancy by Ownership by Household Size in Scurry
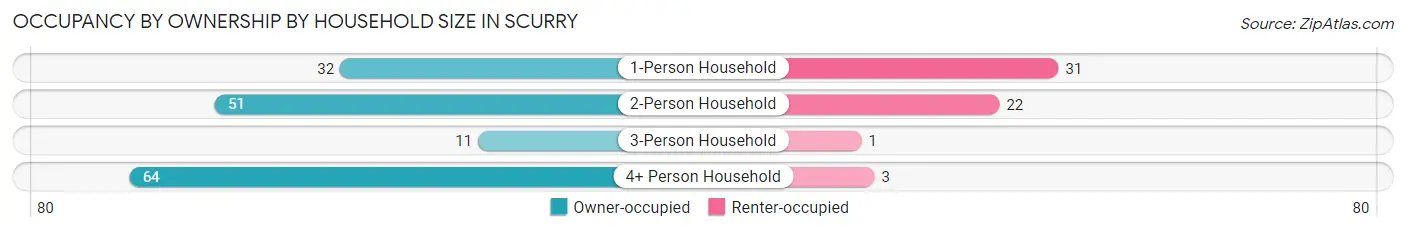
| Household Size | Owner-occupied | Renter-occupied |
| 1-Person Household | 32 (50.8%) | 31 (49.2%) |
| 2-Person Household | 51 (69.9%) | 22 (30.1%) |
| 3-Person Household | 11 (91.7%) | 1 (8.3%) |
| 4+ Person Household | 64 (95.5%) | 3 (4.5%) |
| Total Housing Units | 158 (73.5%) | 57 (26.5%) |
Occupancy by Educational Attainment in Scurry
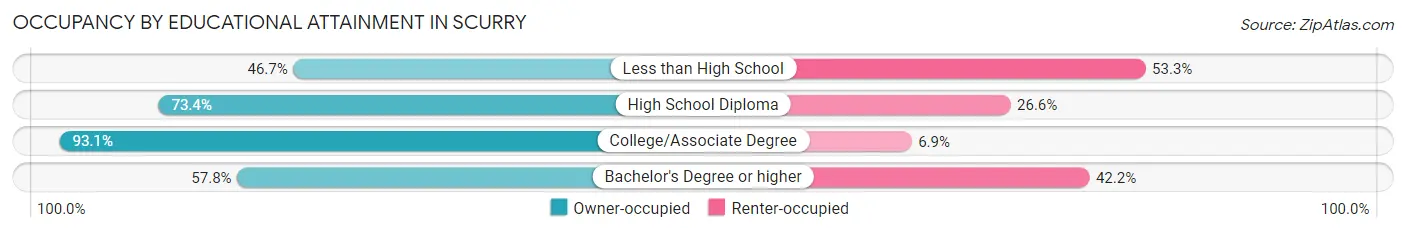
| Household Size | Owner-occupied | Renter-occupied |
| Less than High School | 7 (46.7%) | 8 (53.3%) |
| High School Diploma | 47 (73.4%) | 17 (26.6%) |
| College/Associate Degree | 67 (93.1%) | 5 (6.9%) |
| Bachelor's Degree or higher | 37 (57.8%) | 27 (42.2%) |
Occupancy by Age of Householder in Scurry
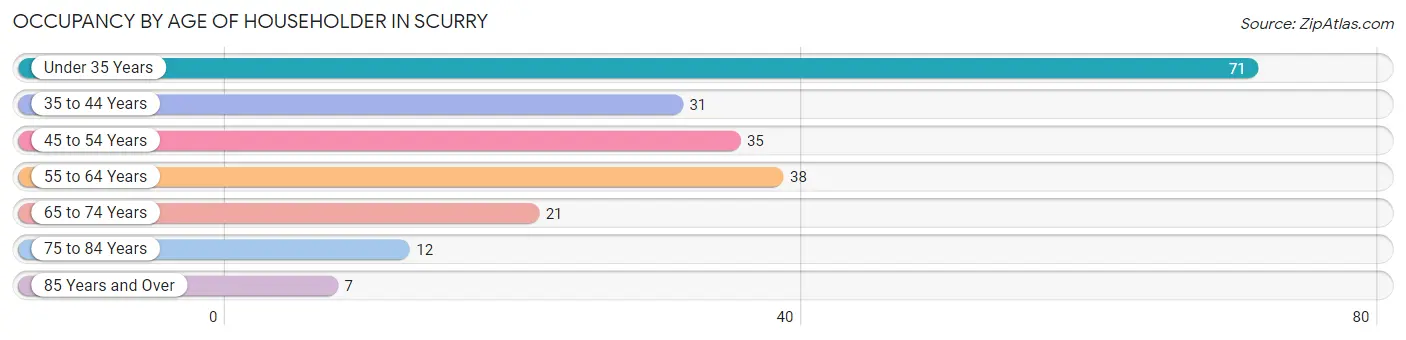
| Age Bracket | # Households | % Households |
| Under 35 Years | 71 | 33.0% |
| 35 to 44 Years | 31 | 14.4% |
| 45 to 54 Years | 35 | 16.3% |
| 55 to 64 Years | 38 | 17.7% |
| 65 to 74 Years | 21 | 9.8% |
| 75 to 84 Years | 12 | 5.6% |
| 85 Years and Over | 7 | 3.3% |
| Total | 215 | 100.0% |
Housing Finances in Scurry
Median Income by Occupancy in Scurry
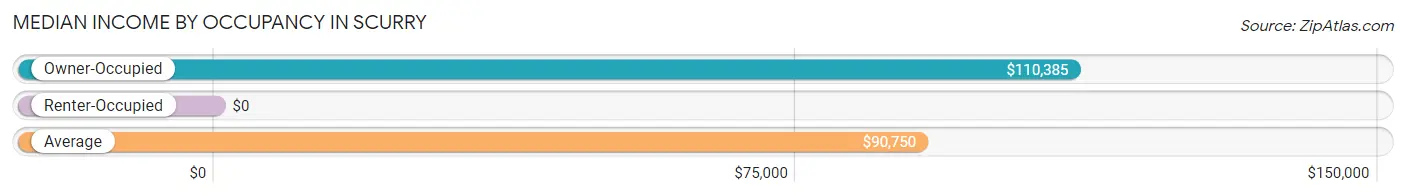
| Occupancy Type | # Households | Median Income |
| Owner-Occupied | 158 (73.5%) | $110,385 |
| Renter-Occupied | 57 (26.5%) | $0 |
| Average | 215 (100.0%) | $90,750 |
Occupancy by Householder Income Bracket in Scurry
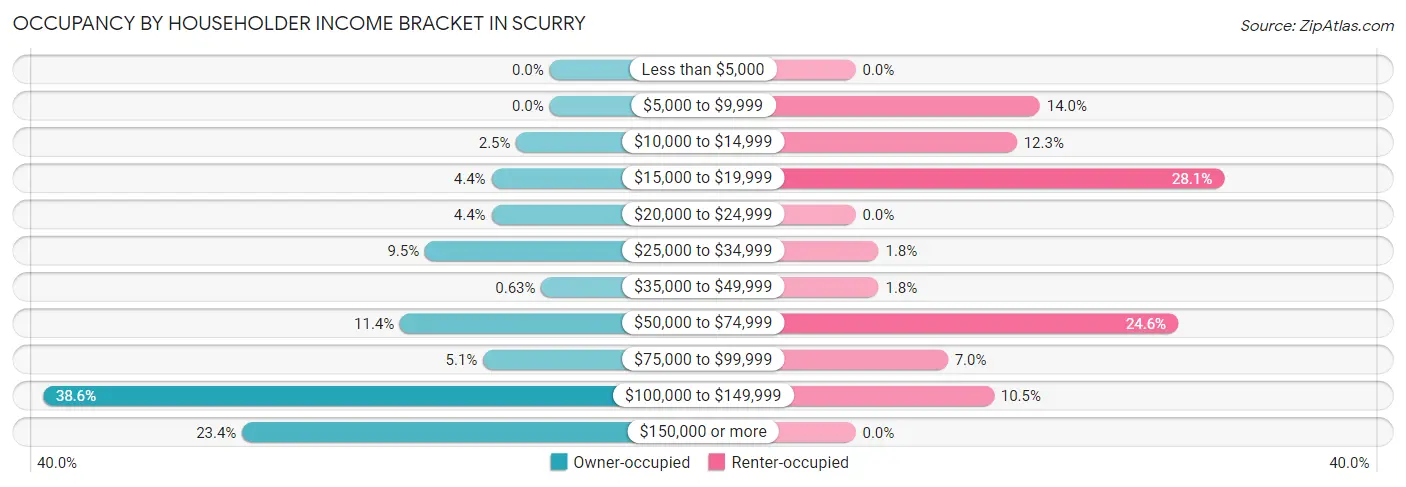
| Income Bracket | Owner-occupied | Renter-occupied |
| Less than $5,000 | 0 (0.0%) | 0 (0.0%) |
| $5,000 to $9,999 | 0 (0.0%) | 8 (14.0%) |
| $10,000 to $14,999 | 4 (2.5%) | 7 (12.3%) |
| $15,000 to $19,999 | 7 (4.4%) | 16 (28.1%) |
| $20,000 to $24,999 | 7 (4.4%) | 0 (0.0%) |
| $25,000 to $34,999 | 15 (9.5%) | 1 (1.8%) |
| $35,000 to $49,999 | 1 (0.6%) | 1 (1.8%) |
| $50,000 to $74,999 | 18 (11.4%) | 14 (24.6%) |
| $75,000 to $99,999 | 8 (5.1%) | 4 (7.0%) |
| $100,000 to $149,999 | 61 (38.6%) | 6 (10.5%) |
| $150,000 or more | 37 (23.4%) | 0 (0.0%) |
| Total | 158 (100.0%) | 57 (100.0%) |
Monthly Housing Cost Tiers in Scurry
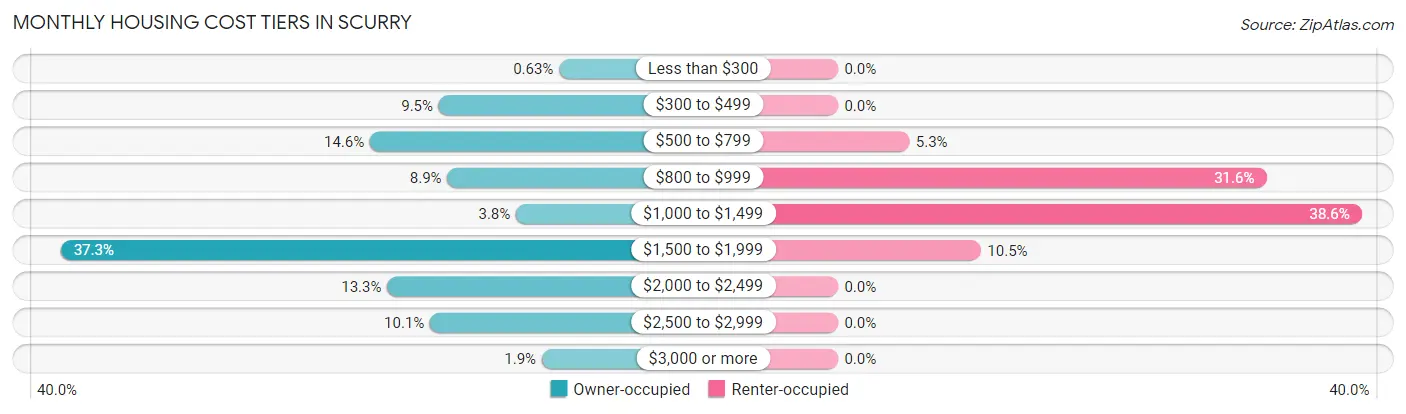
| Monthly Cost | Owner-occupied | Renter-occupied |
| Less than $300 | 1 (0.6%) | 0 (0.0%) |
| $300 to $499 | 15 (9.5%) | 0 (0.0%) |
| $500 to $799 | 23 (14.6%) | 3 (5.3%) |
| $800 to $999 | 14 (8.9%) | 18 (31.6%) |
| $1,000 to $1,499 | 6 (3.8%) | 22 (38.6%) |
| $1,500 to $1,999 | 59 (37.3%) | 6 (10.5%) |
| $2,000 to $2,499 | 21 (13.3%) | 0 (0.0%) |
| $2,500 to $2,999 | 16 (10.1%) | 0 (0.0%) |
| $3,000 or more | 3 (1.9%) | 0 (0.0%) |
| Total | 158 (100.0%) | 57 (100.0%) |
Physical Housing Characteristics in Scurry
Housing Structures in Scurry
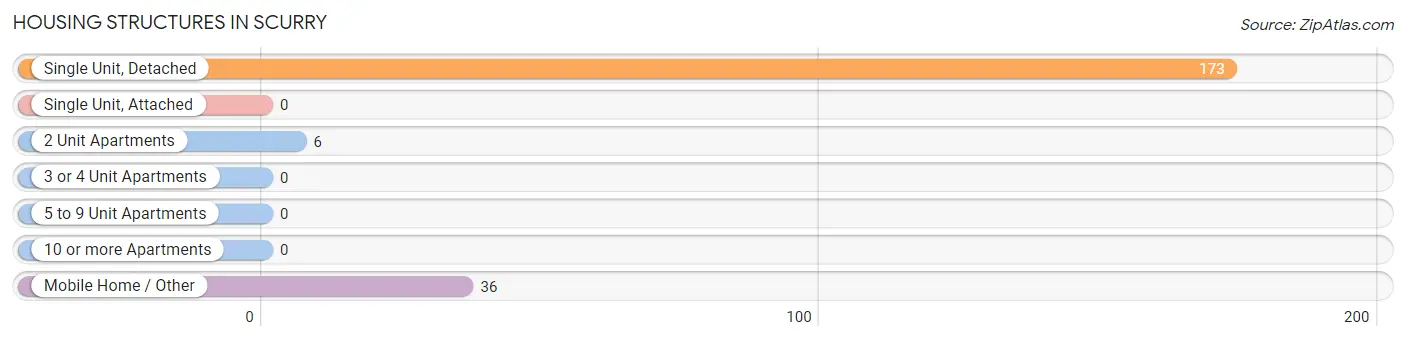
| Structure Type | # Housing Units | % Housing Units |
| Single Unit, Detached | 173 | 80.5% |
| Single Unit, Attached | 0 | 0.0% |
| 2 Unit Apartments | 6 | 2.8% |
| 3 or 4 Unit Apartments | 0 | 0.0% |
| 5 to 9 Unit Apartments | 0 | 0.0% |
| 10 or more Apartments | 0 | 0.0% |
| Mobile Home / Other | 36 | 16.7% |
| Total | 215 | 100.0% |
Housing Structures by Occupancy in Scurry
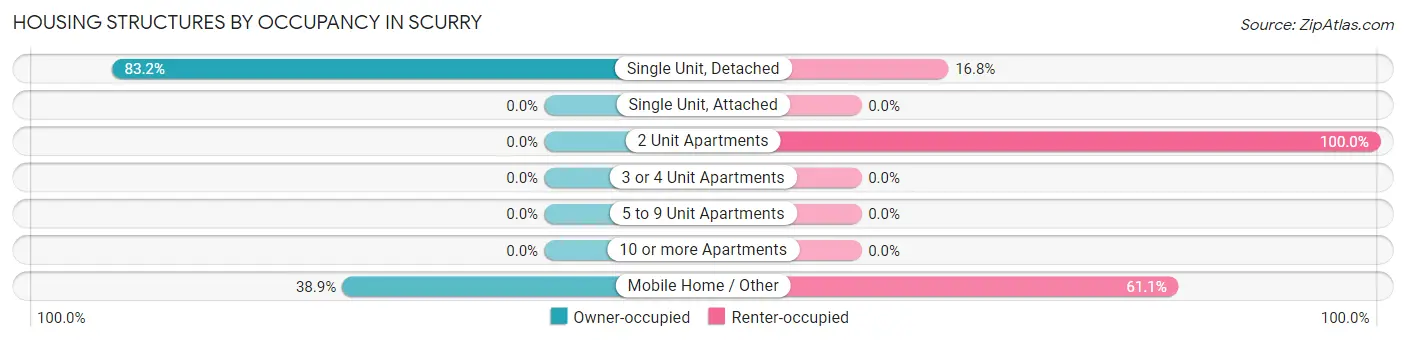
| Structure Type | Owner-occupied | Renter-occupied |
| Single Unit, Detached | 144 (83.2%) | 29 (16.8%) |
| Single Unit, Attached | 0 (0.0%) | 0 (0.0%) |
| 2 Unit Apartments | 0 (0.0%) | 6 (100.0%) |
| 3 or 4 Unit Apartments | 0 (0.0%) | 0 (0.0%) |
| 5 to 9 Unit Apartments | 0 (0.0%) | 0 (0.0%) |
| 10 or more Apartments | 0 (0.0%) | 0 (0.0%) |
| Mobile Home / Other | 14 (38.9%) | 22 (61.1%) |
| Total | 158 (73.5%) | 57 (26.5%) |
Housing Structures by Number of Rooms in Scurry
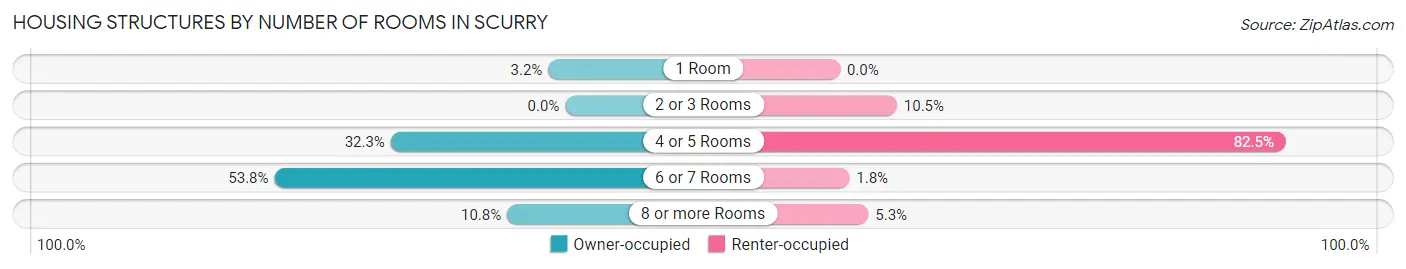
| Number of Rooms | Owner-occupied | Renter-occupied |
| 1 Room | 5 (3.2%) | 0 (0.0%) |
| 2 or 3 Rooms | 0 (0.0%) | 6 (10.5%) |
| 4 or 5 Rooms | 51 (32.3%) | 47 (82.5%) |
| 6 or 7 Rooms | 85 (53.8%) | 1 (1.8%) |
| 8 or more Rooms | 17 (10.8%) | 3 (5.3%) |
| Total | 158 (100.0%) | 57 (100.0%) |
Housing Structure by Heating Type in Scurry
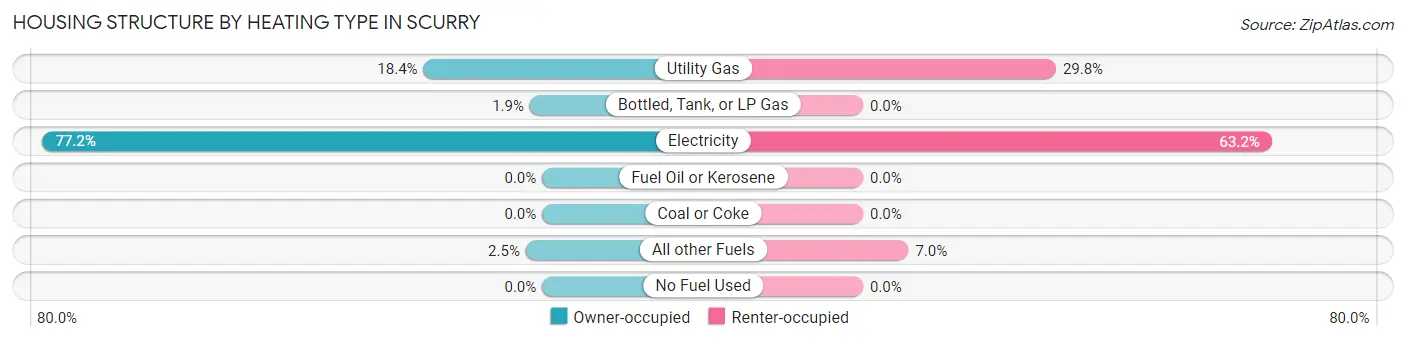
| Heating Type | Owner-occupied | Renter-occupied |
| Utility Gas | 29 (18.3%) | 17 (29.8%) |
| Bottled, Tank, or LP Gas | 3 (1.9%) | 0 (0.0%) |
| Electricity | 122 (77.2%) | 36 (63.2%) |
| Fuel Oil or Kerosene | 0 (0.0%) | 0 (0.0%) |
| Coal or Coke | 0 (0.0%) | 0 (0.0%) |
| All other Fuels | 4 (2.5%) | 4 (7.0%) |
| No Fuel Used | 0 (0.0%) | 0 (0.0%) |
| Total | 158 (100.0%) | 57 (100.0%) |
Household Vehicle Usage in Scurry
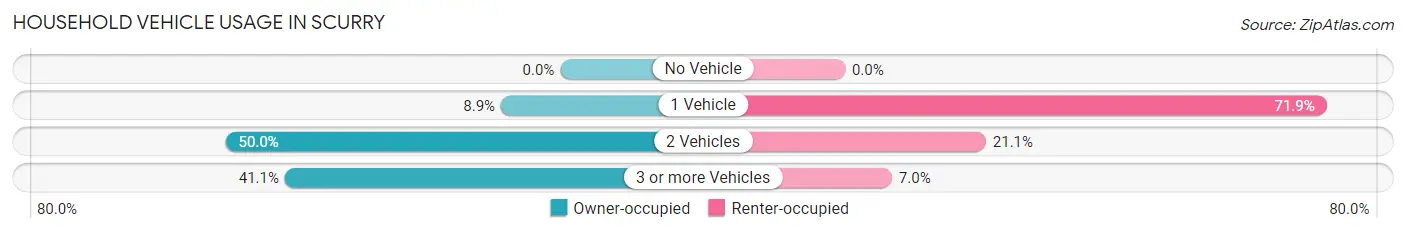
| Vehicles per Household | Owner-occupied | Renter-occupied |
| No Vehicle | 0 (0.0%) | 0 (0.0%) |
| 1 Vehicle | 14 (8.9%) | 41 (71.9%) |
| 2 Vehicles | 79 (50.0%) | 12 (21.0%) |
| 3 or more Vehicles | 65 (41.1%) | 4 (7.0%) |
| Total | 158 (100.0%) | 57 (100.0%) |
Real Estate & Mortgages in Scurry
Real Estate and Mortgage Overview in Scurry
| Characteristic | Without Mortgage | With Mortgage |
| Housing Units | 57 | 101 |
| Median Property Value | $123,600 | $313,600 |
| Median Household Income | - | - |
| Monthly Housing Costs | $613 | $3 |
| Real Estate Taxes | - | - |
Property Value by Mortgage Status in Scurry
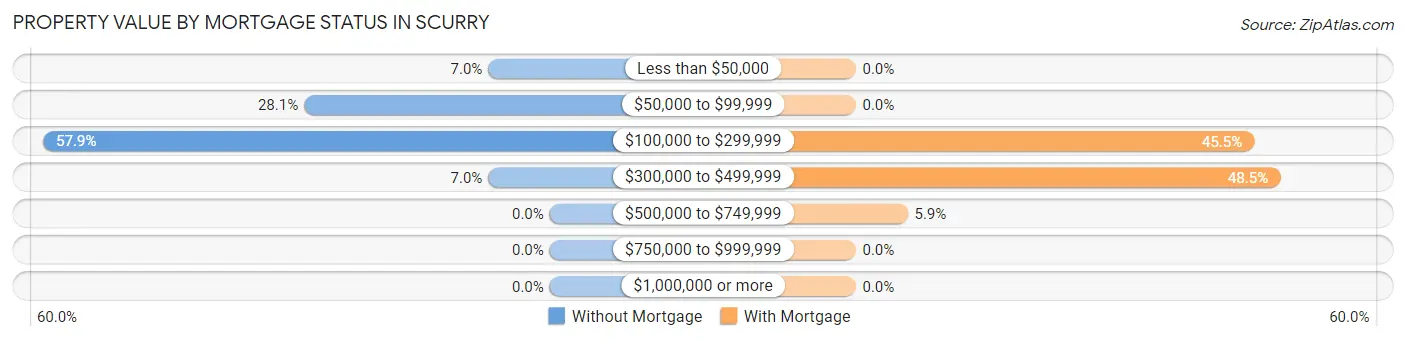
| Property Value | Without Mortgage | With Mortgage |
| Less than $50,000 | 4 (7.0%) | 0 (0.0%) |
| $50,000 to $99,999 | 16 (28.1%) | 0 (0.0%) |
| $100,000 to $299,999 | 33 (57.9%) | 46 (45.5%) |
| $300,000 to $499,999 | 4 (7.0%) | 49 (48.5%) |
| $500,000 to $749,999 | 0 (0.0%) | 6 (5.9%) |
| $750,000 to $999,999 | 0 (0.0%) | 0 (0.0%) |
| $1,000,000 or more | 0 (0.0%) | 0 (0.0%) |
| Total | 57 (100.0%) | 101 (100.0%) |
Household Income by Mortgage Status in Scurry
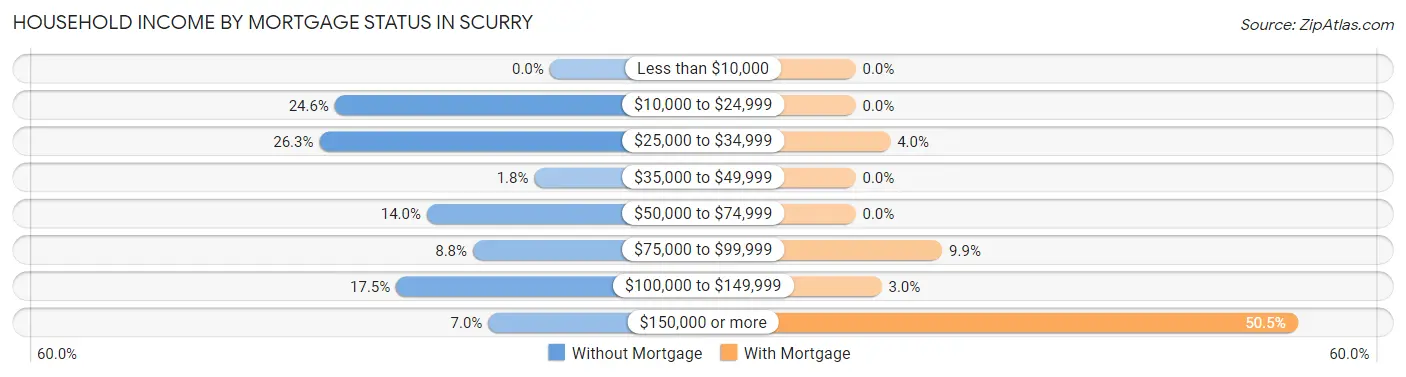
| Household Income | Without Mortgage | With Mortgage |
| Less than $10,000 | 0 (0.0%) | 0 (0.0%) |
| $10,000 to $24,999 | 14 (24.6%) | 0 (0.0%) |
| $25,000 to $34,999 | 15 (26.3%) | 4 (4.0%) |
| $35,000 to $49,999 | 1 (1.8%) | 0 (0.0%) |
| $50,000 to $74,999 | 8 (14.0%) | 0 (0.0%) |
| $75,000 to $99,999 | 5 (8.8%) | 10 (9.9%) |
| $100,000 to $149,999 | 10 (17.5%) | 3 (3.0%) |
| $150,000 or more | 4 (7.0%) | 51 (50.5%) |
| Total | 57 (100.0%) | 101 (100.0%) |
Property Value to Household Income Ratio in Scurry
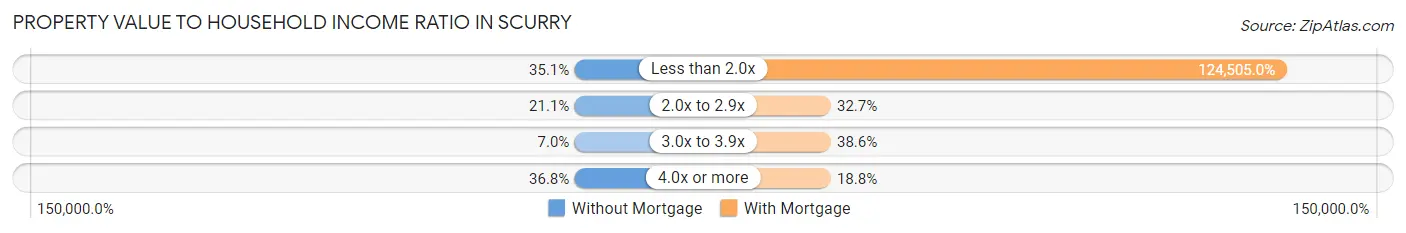
| Value-to-Income Ratio | Without Mortgage | With Mortgage |
| Less than 2.0x | 20 (35.1%) | 125,750 (124,505.0%) |
| 2.0x to 2.9x | 12 (21.0%) | 33 (32.7%) |
| 3.0x to 3.9x | 4 (7.0%) | 39 (38.6%) |
| 4.0x or more | 21 (36.8%) | 19 (18.8%) |
| Total | 57 (100.0%) | 101 (100.0%) |
Real Estate Taxes by Mortgage Status in Scurry
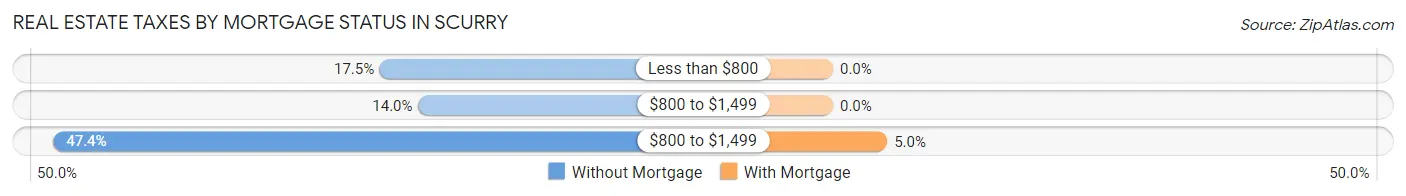
| Property Taxes | Without Mortgage | With Mortgage |
| Less than $800 | 10 (17.5%) | 0 (0.0%) |
| $800 to $1,499 | 8 (14.0%) | 0 (0.0%) |
| $800 to $1,499 | 27 (47.4%) | 5 (5.0%) |
| Total | 57 (100.0%) | 101 (100.0%) |
Health & Disability in Scurry
Health Insurance Coverage by Age in Scurry
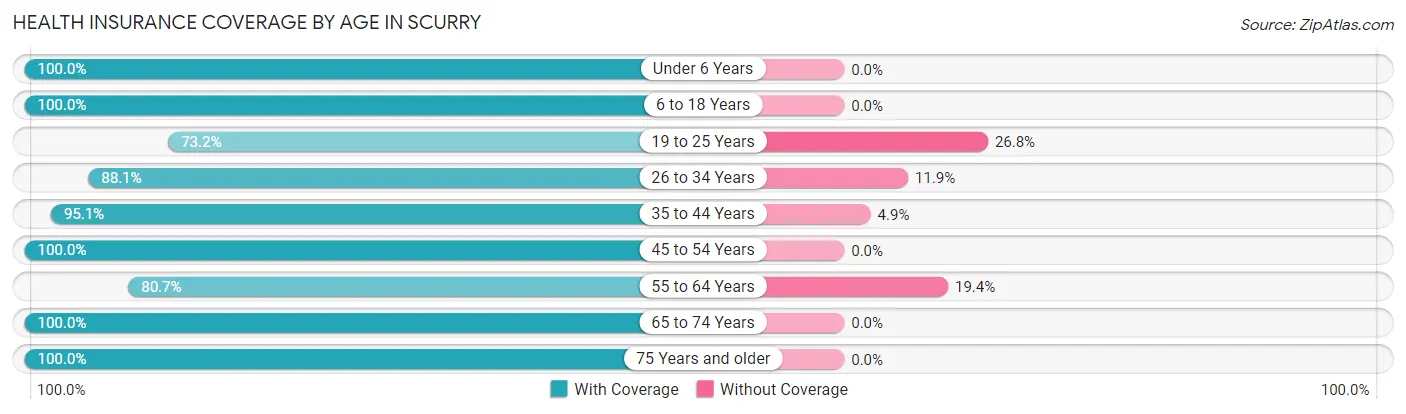
| Age Bracket | With Coverage | Without Coverage |
| Under 6 Years | 72 (100.0%) | 0 (0.0%) |
| 6 to 18 Years | 119 (100.0%) | 0 (0.0%) |
| 19 to 25 Years | 41 (73.2%) | 15 (26.8%) |
| 26 to 34 Years | 111 (88.1%) | 15 (11.9%) |
| 35 to 44 Years | 58 (95.1%) | 3 (4.9%) |
| 45 to 54 Years | 63 (100.0%) | 0 (0.0%) |
| 55 to 64 Years | 50 (80.6%) | 12 (19.4%) |
| 65 to 74 Years | 33 (100.0%) | 0 (0.0%) |
| 75 Years and older | 24 (100.0%) | 0 (0.0%) |
| Total | 571 (92.7%) | 45 (7.3%) |
Health Insurance Coverage by Citizenship Status in Scurry
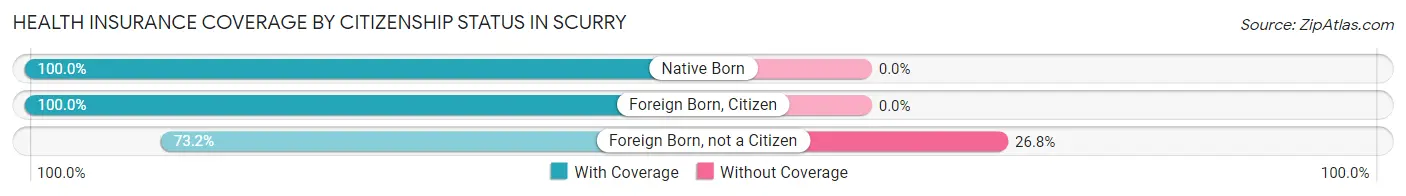
| Citizenship Status | With Coverage | Without Coverage |
| Native Born | 72 (100.0%) | 0 (0.0%) |
| Foreign Born, Citizen | 119 (100.0%) | 0 (0.0%) |
| Foreign Born, not a Citizen | 41 (73.2%) | 15 (26.8%) |
Health Insurance Coverage by Household Income in Scurry
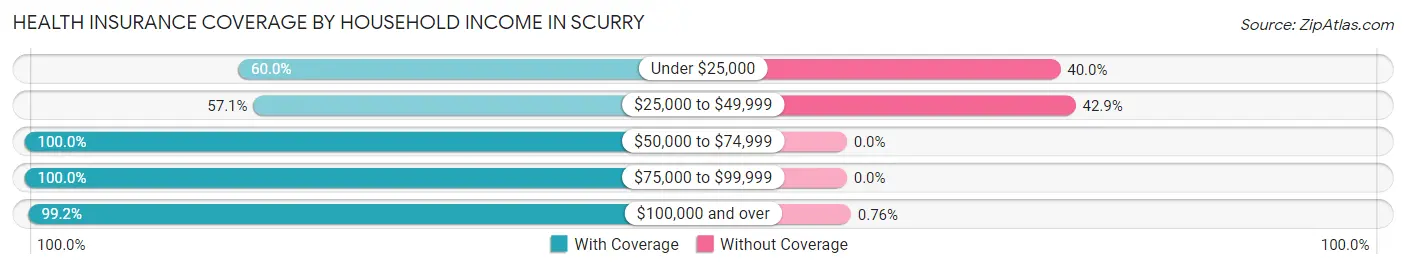
| Household Income | With Coverage | Without Coverage |
| Under $25,000 | 45 (60.0%) | 30 (40.0%) |
| $25,000 to $49,999 | 16 (57.1%) | 12 (42.9%) |
| $50,000 to $74,999 | 67 (100.0%) | 0 (0.0%) |
| $75,000 to $99,999 | 26 (100.0%) | 0 (0.0%) |
| $100,000 and over | 390 (99.2%) | 3 (0.8%) |
Public vs Private Health Insurance Coverage by Age in Scurry
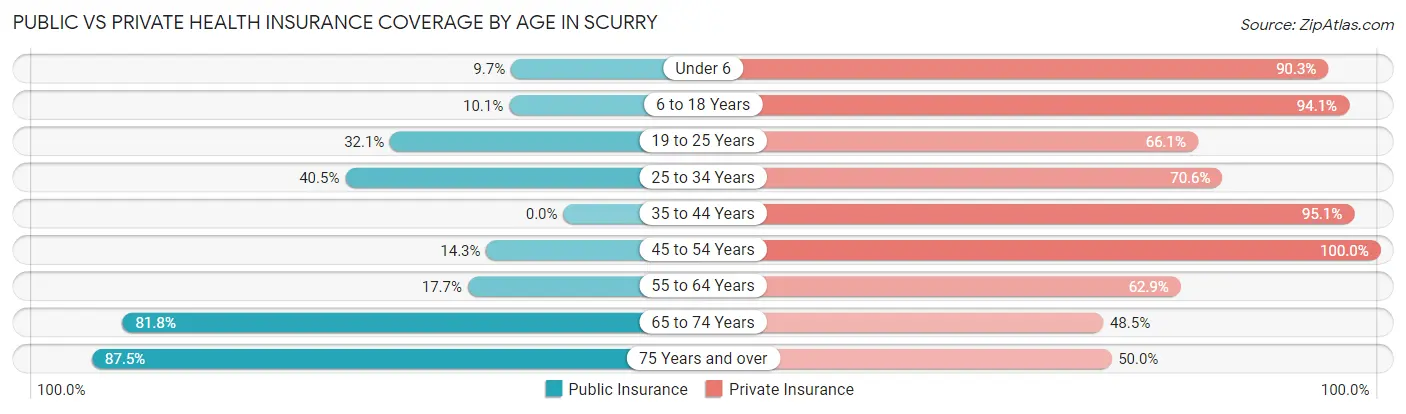
| Age Bracket | Public Insurance | Private Insurance |
| Under 6 | 7 (9.7%) | 65 (90.3%) |
| 6 to 18 Years | 12 (10.1%) | 112 (94.1%) |
| 19 to 25 Years | 18 (32.1%) | 37 (66.1%) |
| 25 to 34 Years | 51 (40.5%) | 89 (70.6%) |
| 35 to 44 Years | 0 (0.0%) | 58 (95.1%) |
| 45 to 54 Years | 9 (14.3%) | 63 (100.0%) |
| 55 to 64 Years | 11 (17.7%) | 39 (62.9%) |
| 65 to 74 Years | 27 (81.8%) | 16 (48.5%) |
| 75 Years and over | 21 (87.5%) | 12 (50.0%) |
| Total | 156 (25.3%) | 491 (79.7%) |
Disability Status by Sex by Age in Scurry
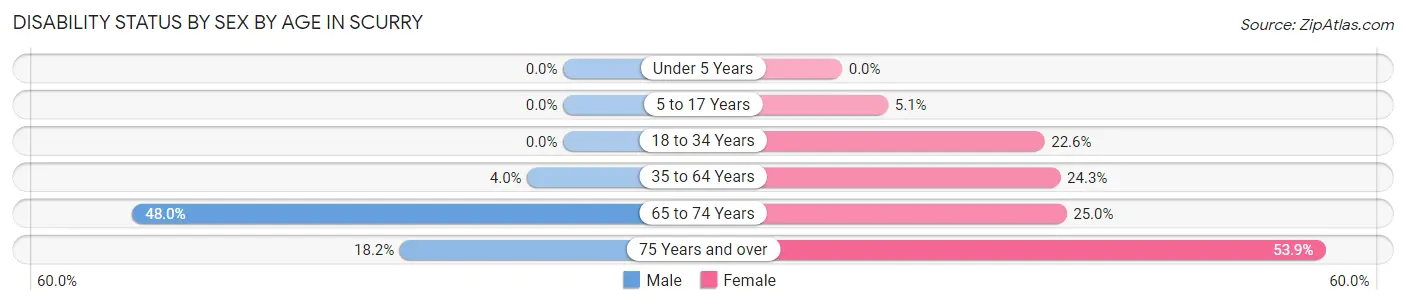
| Age Bracket | Male | Female |
| Under 5 Years | 0 (0.0%) | 0 (0.0%) |
| 5 to 17 Years | 0 (0.0%) | 4 (5.1%) |
| 18 to 34 Years | 0 (0.0%) | 23 (22.6%) |
| 35 to 64 Years | 3 (4.0%) | 27 (24.3%) |
| 65 to 74 Years | 12 (48.0%) | 2 (25.0%) |
| 75 Years and over | 2 (18.2%) | 7 (53.8%) |
Disability Class by Sex by Age in Scurry
Disability Class: Hearing Difficulty
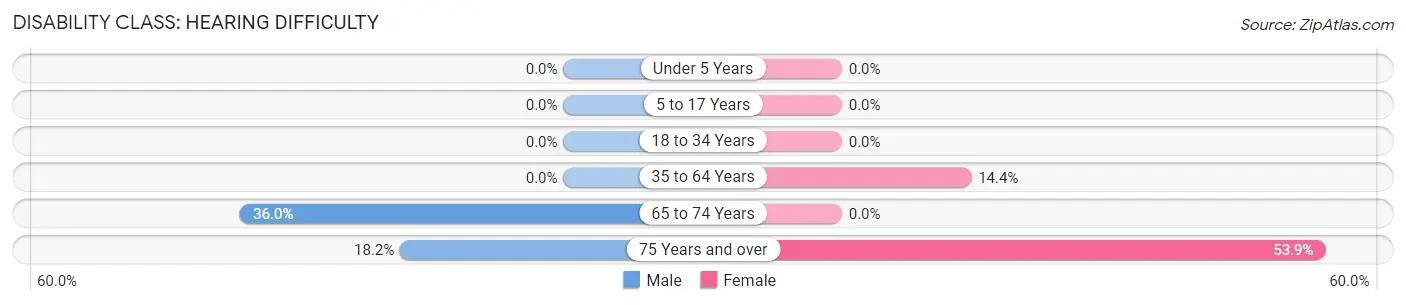
| Age Bracket | Male | Female |
| Under 5 Years | 0 (0.0%) | 0 (0.0%) |
| 5 to 17 Years | 0 (0.0%) | 0 (0.0%) |
| 18 to 34 Years | 0 (0.0%) | 0 (0.0%) |
| 35 to 64 Years | 0 (0.0%) | 16 (14.4%) |
| 65 to 74 Years | 9 (36.0%) | 0 (0.0%) |
| 75 Years and over | 2 (18.2%) | 7 (53.8%) |
Disability Class: Vision Difficulty
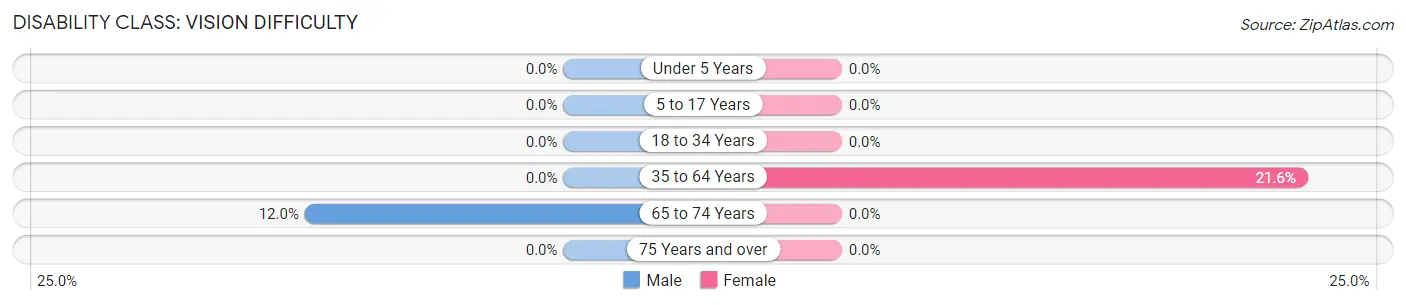
| Age Bracket | Male | Female |
| Under 5 Years | 0 (0.0%) | 0 (0.0%) |
| 5 to 17 Years | 0 (0.0%) | 0 (0.0%) |
| 18 to 34 Years | 0 (0.0%) | 0 (0.0%) |
| 35 to 64 Years | 0 (0.0%) | 24 (21.6%) |
| 65 to 74 Years | 3 (12.0%) | 0 (0.0%) |
| 75 Years and over | 0 (0.0%) | 0 (0.0%) |
Disability Class: Cognitive Difficulty
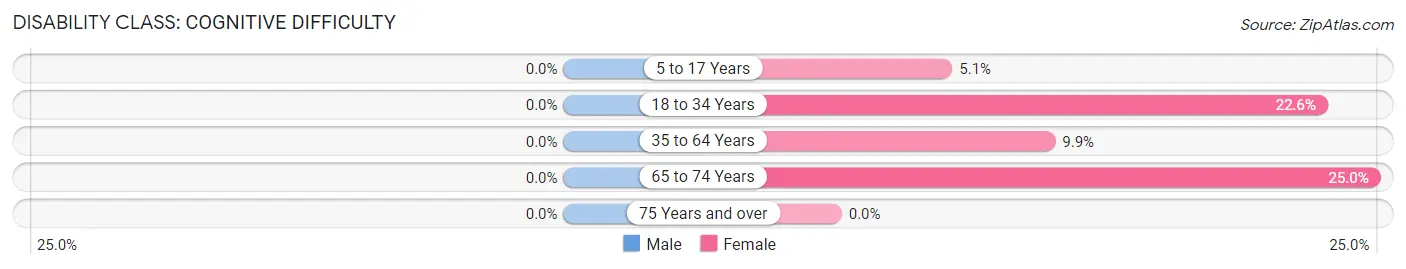
| Age Bracket | Male | Female |
| 5 to 17 Years | 0 (0.0%) | 4 (5.1%) |
| 18 to 34 Years | 0 (0.0%) | 23 (22.6%) |
| 35 to 64 Years | 0 (0.0%) | 11 (9.9%) |
| 65 to 74 Years | 0 (0.0%) | 2 (25.0%) |
| 75 Years and over | 0 (0.0%) | 0 (0.0%) |
Disability Class: Ambulatory Difficulty
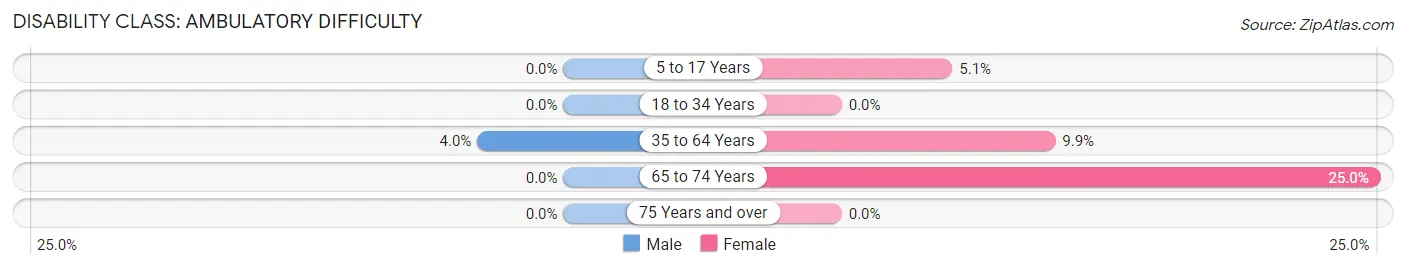
| Age Bracket | Male | Female |
| 5 to 17 Years | 0 (0.0%) | 4 (5.1%) |
| 18 to 34 Years | 0 (0.0%) | 0 (0.0%) |
| 35 to 64 Years | 3 (4.0%) | 11 (9.9%) |
| 65 to 74 Years | 0 (0.0%) | 2 (25.0%) |
| 75 Years and over | 0 (0.0%) | 0 (0.0%) |
Disability Class: Self-Care Difficulty
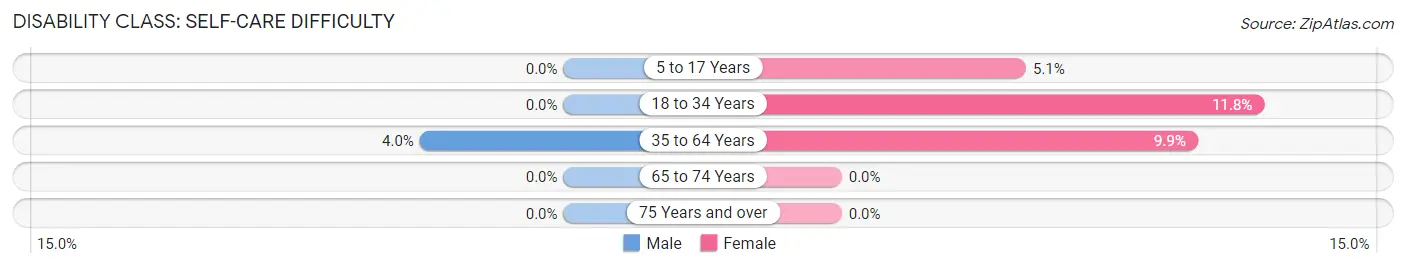
| Age Bracket | Male | Female |
| 5 to 17 Years | 0 (0.0%) | 4 (5.1%) |
| 18 to 34 Years | 0 (0.0%) | 12 (11.8%) |
| 35 to 64 Years | 3 (4.0%) | 11 (9.9%) |
| 65 to 74 Years | 0 (0.0%) | 0 (0.0%) |
| 75 Years and over | 0 (0.0%) | 0 (0.0%) |
Technology Access in Scurry
Computing Device Access in Scurry
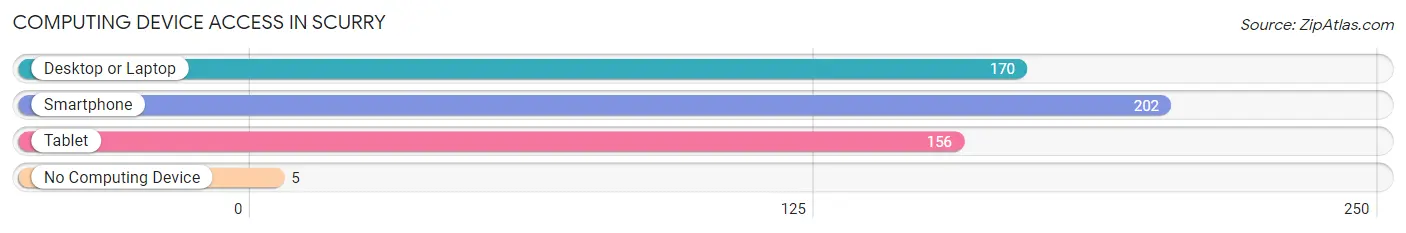
| Device Type | # Households | % Households |
| Desktop or Laptop | 170 | 79.1% |
| Smartphone | 202 | 94.0% |
| Tablet | 156 | 72.6% |
| No Computing Device | 5 | 2.3% |
| Total | 215 | 100.0% |
Internet Access in Scurry
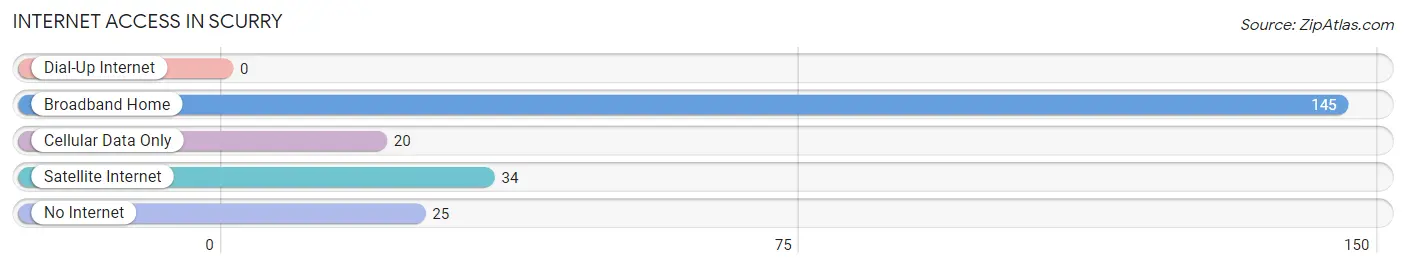
| Internet Type | # Households | % Households |
| Dial-Up Internet | 0 | 0.0% |
| Broadband Home | 145 | 67.4% |
| Cellular Data Only | 20 | 9.3% |
| Satellite Internet | 34 | 15.8% |
| No Internet | 25 | 11.6% |
| Total | 215 | 100.0% |
Scurry Summary
Scurry, Texas is a small town located in Kaufman County, Texas. It is situated about 40 miles southeast of Dallas and is part of the Dallas-Fort Worth-Arlington metropolitan area. The town has a population of 1,845 people, according to the 2010 census.
History
Scurry, Texas was founded in 1881 by a group of settlers from Kentucky. The town was named after the nearby Scurry Creek, which was named after a local Native American tribe. The town was originally a farming community, but it soon became a center for the oil and gas industry. In the early 1900s, the town was home to several oil refineries and gas plants.
The town experienced a period of growth in the 1950s and 1960s, when the population increased from 1,000 to over 2,000. During this time, the town was home to several businesses, including a grocery store, a bank, a post office, and a movie theater.
Geography
Scurry, Texas is located in Kaufman County, Texas. It is situated about 40 miles southeast of Dallas and is part of the Dallas-Fort Worth-Arlington metropolitan area. The town is located on the western edge of the Blackland Prairie, a region of flat, fertile land that stretches from the Red River to the Brazos River. The town is situated on the banks of Scurry Creek, which flows through the town and into the Trinity River.
The town has a total area of 1.2 square miles, all of which is land. The town has a humid subtropical climate, with hot summers and mild winters. The average temperature in the summer is around 90 degrees Fahrenheit, and the average temperature in the winter is around 50 degrees Fahrenheit.
Economy
Scurry, Texas is a small town with a population of 1,845 people, according to the 2010 census. The town is primarily a farming community, with the majority of the population employed in the agricultural sector. The town is also home to several businesses, including a grocery store, a bank, a post office, and a movie theater.
The town is also home to several oil and gas companies, including Chevron, ExxonMobil, and Shell. These companies are responsible for much of the town's economic activity, as they employ many of the town's residents.
Demographics
According to the 2010 census, the population of Scurry, Texas was 1,845 people. The racial makeup of the town was 94.3% White, 0.7% African American, 0.2% Native American, 0.2% Asian, 0.1% Pacific Islander, 2.7% from other races, and 1.9% from two or more races. Hispanic or Latino of any race were 5.2% of the population.
The median income for a household in the town was $37,500, and the median income for a family was $41,250. The per capita income for the town was $17,845. About 11.2% of families and 13.2% of the population were below the poverty line, including 17.2% of those under age 18 and 8.3% of those age 65 or over.
Common Questions
What is the Total Population of Scurry?
Total Population of Scurry is 616.
What is the Total Male Population of Scurry?
Total Male Population of Scurry is 273.
What is the Total Female Population of Scurry?
Total Female Population of Scurry is 343.
What is the Ratio of Males per 100 Females in Scurry?
There are 79.59 Males per 100 Females in Scurry.
What is the Ratio of Females per 100 Males in Scurry?
There are 125.64 Females per 100 Males in Scurry.
What is the Median Population Age in Scurry?
Median Population Age in Scurry is 29.9 Years.
What is the Average Family Size in Scurry
Average Family Size in Scurry is 3.5 People.
What is the Average Household Size in Scurry
Average Household Size in Scurry is 2.7 People.
What is Per Capita Income in Scurry?
Per Capita income in Scurry is $37,775.
What is the Median Family Income in Scurry?
Median Family Income in Scurry is $116,000.
What is the Median Household income in Scurry?
Median Household Income in Scurry is $90,750.
What is Income or Wage Gap in Scurry?
Income or Wage Gap in Scurry is 37.9%.
Women in Scurry earn 62.1 cents for every dollar earned by a man.
What is Inequality or Gini Index in Scurry?
Inequality or Gini Index in Scurry is 0.45.
How Large is the Labor Force in Scurry?
There are 276 People in the Labor Forcein in Scurry.
What is the Percentage of People in the Labor Force in Scurry?
64.3% of People are in the Labor Force in Scurry.
What is the Unemployment Rate in Scurry?
Unemployment Rate in Scurry is 2.2%.