San Patricio, TX
San Patricio Map
San Patricio Overview
391
TOTAL POPULATION
173
MALE POPULATION
218
FEMALE POPULATION
79.36
MALES / 100 FEMALES
126.01
FEMALES / 100 MALES
50.2
MEDIAN AGE
2.8
AVG FAMILY SIZE
2.3
AVG HOUSEHOLD SIZE
$30,506
PER CAPITA INCOME
$63,125
AVG FAMILY INCOME
$61,875
AVG HOUSEHOLD INCOME
45.5%
WAGE / INCOME GAP [ % ]
54.5¢/ $1
WAGE / INCOME GAP [ $ ]
0.44
INEQUALITY / GINI INDEX
145
LABOR FORCE [ PEOPLE ]
47.7%
PERCENT IN LABOR FORCE
3.4%
UNEMPLOYMENT RATE
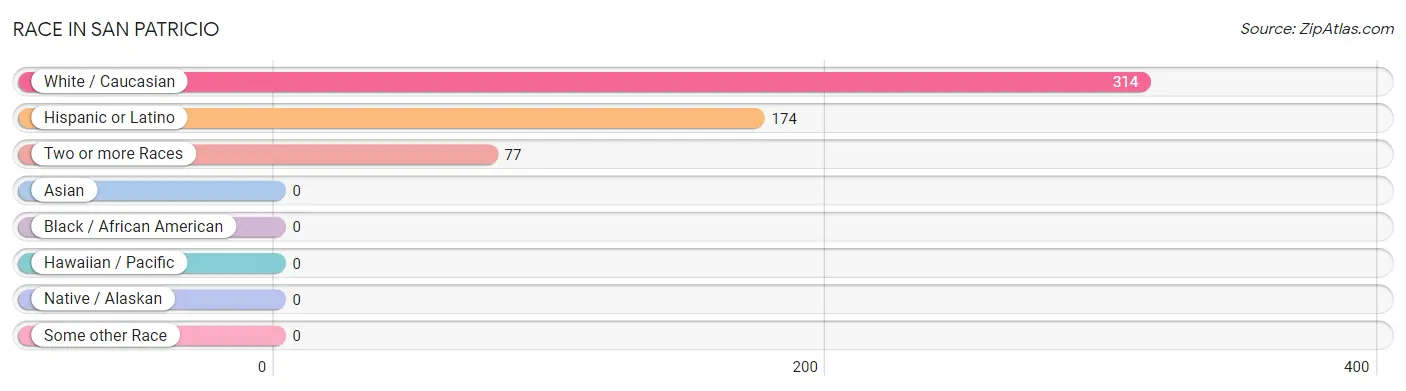
Race in San Patricio
The most populous races in San Patricio are White / Caucasian (314 | 80.3%), Hispanic or Latino (174 | 44.5%), and Two or more Races (77 | 19.7%).
| Race | # Population | % Population |
| Asian | 0 | 0.0% |
| Black / African American | 0 | 0.0% |
| Hawaiian / Pacific | 0 | 0.0% |
| Hispanic or Latino | 174 | 44.5% |
| Native / Alaskan | 0 | 0.0% |
| White / Caucasian | 314 | 80.3% |
| Two or more Races | 77 | 19.7% |
| Some other Race | 0 | 0.0% |
| Total | 391 | 100.0% |
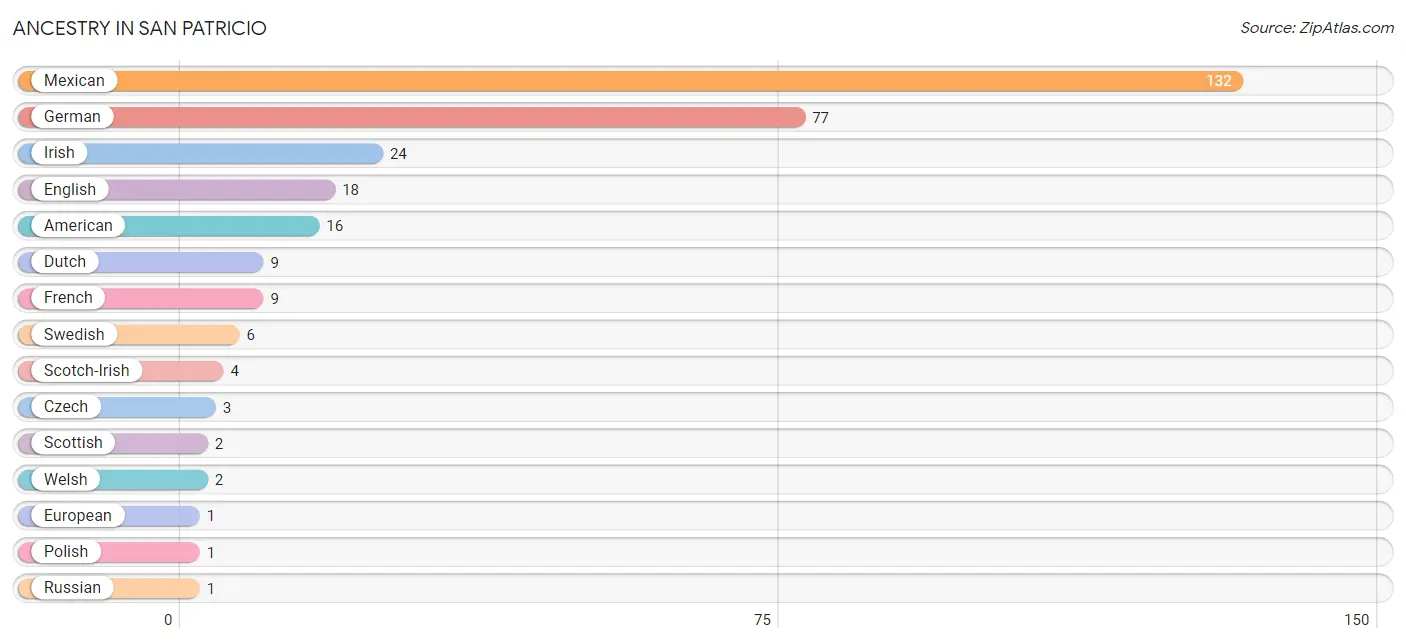
Ancestry in San Patricio
The most populous ancestries reported in San Patricio are Mexican (132 | 33.8%), German (77 | 19.7%), Irish (24 | 6.1%), English (18 | 4.6%), and American (16 | 4.1%), together accounting for 68.3% of all San Patricio residents.
| Ancestry | # Population | % Population |
| American | 16 | 4.1% |
| Czech | 3 | 0.8% |
| Dutch | 9 | 2.3% |
| English | 18 | 4.6% |
| European | 1 | 0.3% |
| French | 9 | 2.3% |
| German | 77 | 19.7% |
| Irish | 24 | 6.1% |
| Mexican | 132 | 33.8% |
| Polish | 1 | 0.3% |
| Russian | 1 | 0.3% |
| Scotch-Irish | 4 | 1.0% |
| Scottish | 2 | 0.5% |
| Swedish | 6 | 1.5% |
| Welsh | 2 | 0.5% | View All 15 Rows |
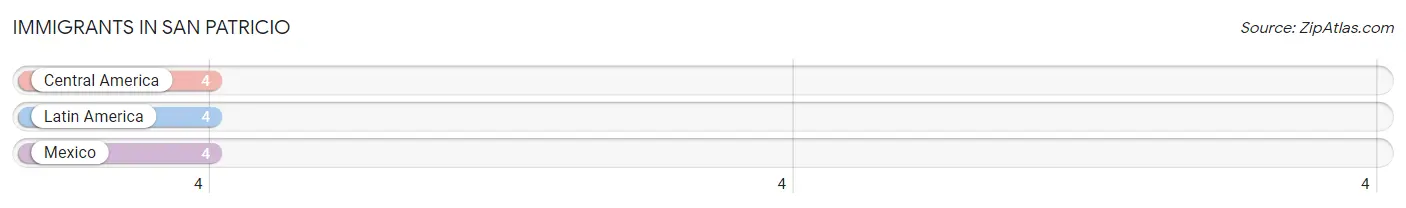
Immigrants in San Patricio
The most numerous immigrant groups reported in San Patricio came from Central America (4 | 1.0%), Latin America (4 | 1.0%), and Mexico (4 | 1.0%), together accounting for 3.1% of all San Patricio residents.
| Immigration Origin | # Population | % Population |
| Central America | 4 | 1.0% |
| Latin America | 4 | 1.0% |
| Mexico | 4 | 1.0% | View All 3 Rows |
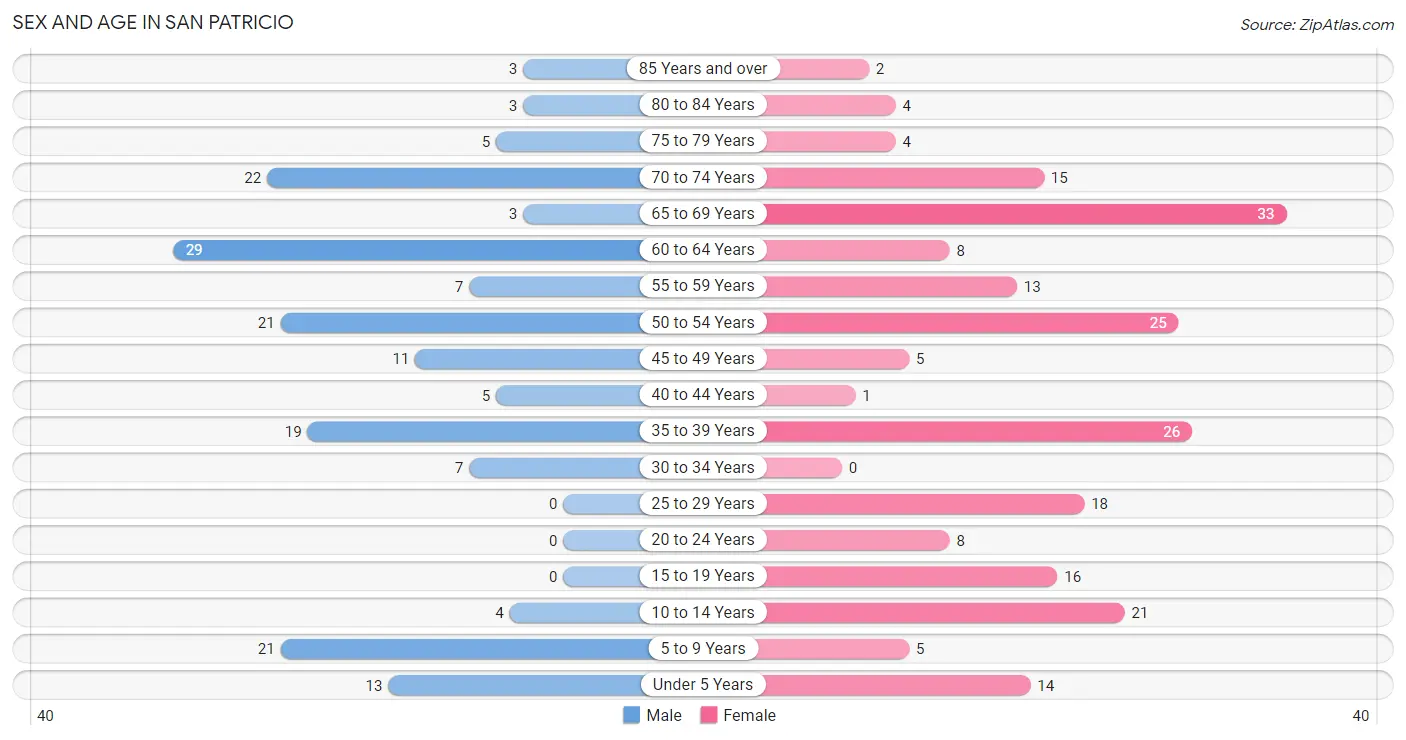
Sex and Age in San Patricio
Sex and Age in San Patricio
The most populous age groups in San Patricio are 60 to 64 Years (29 | 16.8%) for men and 65 to 69 Years (33 | 15.1%) for women.
| Age Bracket | Male | Female |
| Under 5 Years | 13 (7.5%) | 14 (6.4%) |
| 5 to 9 Years | 21 (12.1%) | 5 (2.3%) |
| 10 to 14 Years | 4 (2.3%) | 21 (9.6%) |
| 15 to 19 Years | 0 (0.0%) | 16 (7.3%) |
| 20 to 24 Years | 0 (0.0%) | 8 (3.7%) |
| 25 to 29 Years | 0 (0.0%) | 18 (8.3%) |
| 30 to 34 Years | 7 (4.1%) | 0 (0.0%) |
| 35 to 39 Years | 19 (11.0%) | 26 (11.9%) |
| 40 to 44 Years | 5 (2.9%) | 1 (0.5%) |
| 45 to 49 Years | 11 (6.4%) | 5 (2.3%) |
| 50 to 54 Years | 21 (12.1%) | 25 (11.5%) |
| 55 to 59 Years | 7 (4.1%) | 13 (6.0%) |
| 60 to 64 Years | 29 (16.8%) | 8 (3.7%) |
| 65 to 69 Years | 3 (1.7%) | 33 (15.1%) |
| 70 to 74 Years | 22 (12.7%) | 15 (6.9%) |
| 75 to 79 Years | 5 (2.9%) | 4 (1.8%) |
| 80 to 84 Years | 3 (1.7%) | 4 (1.8%) |
| 85 Years and over | 3 (1.7%) | 2 (0.9%) |
| Total | 173 (100.0%) | 218 (100.0%) |
Families and Households in San Patricio
Median Family Size in San Patricio
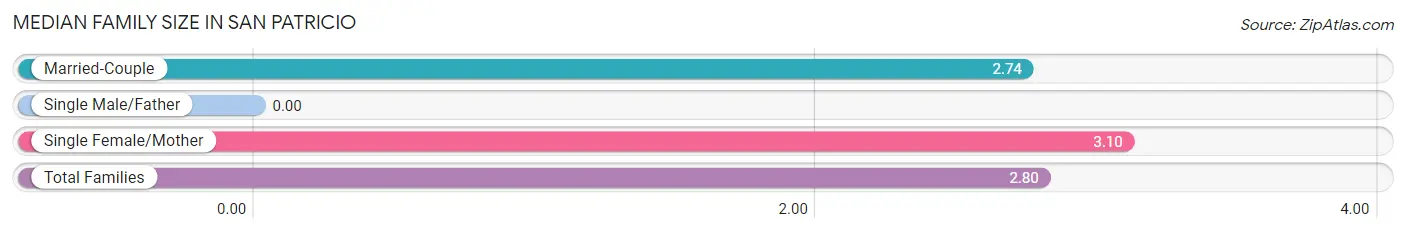
| Family Type | # Families | Family Size |
| Married-Couple | 96 (82.1%) | 2.74 |
| Single Male/Father | 0 (0.0%) | - |
| Single Female/Mother | 21 (17.9%) | 3.10 |
| Total Families | 117 (100.0%) | 2.80 |
Median Household Size in San Patricio
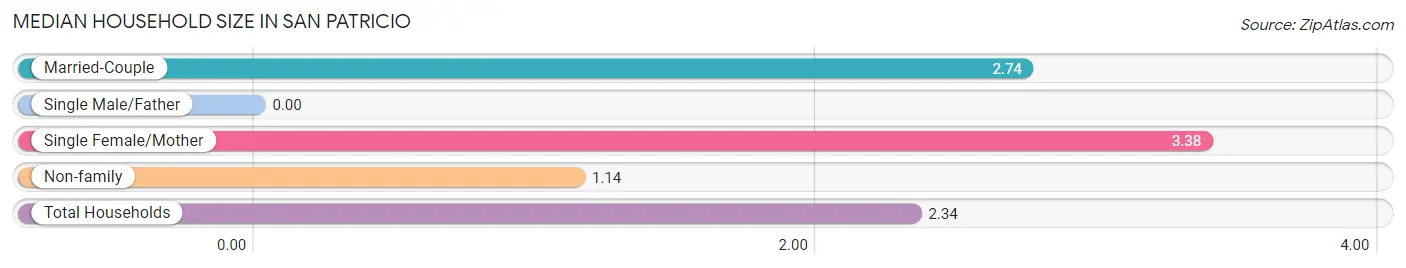
| Household Type | # Households | Household Size |
| Married-Couple | 96 (57.5%) | 2.74 |
| Single Male/Father | 0 (0.0%) | - |
| Single Female/Mother | 21 (12.6%) | 3.38 |
| Non-family | 50 (29.9%) | 1.14 |
| Total Households | 167 (100.0%) | 2.34 |
Household Size by Marriage Status in San Patricio
Out of a total of 167 households in San Patricio, 117 (70.1%) are family households, while 50 (29.9%) are nonfamily households. The most numerous type of family households are 2-person households, comprising 60, and the most common type of nonfamily households are 1-person households, comprising 44.
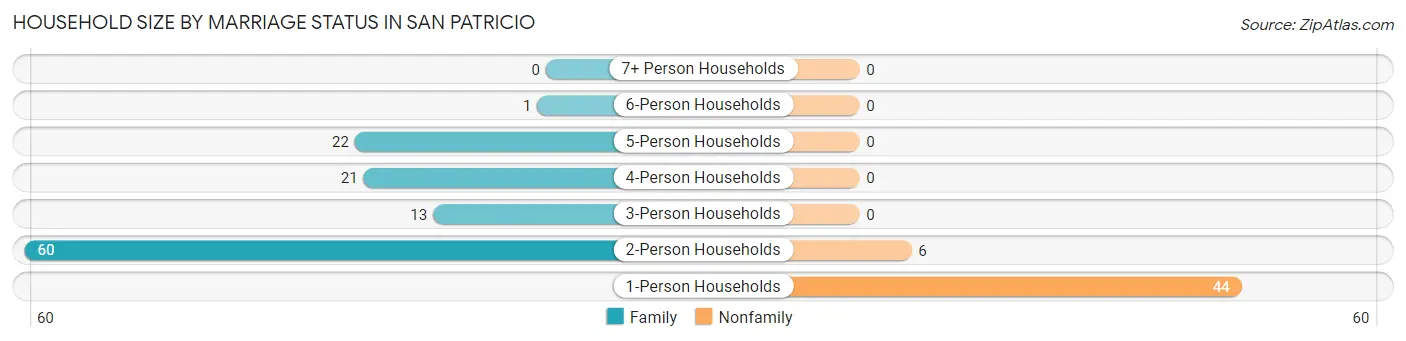
| Household Size | Family Households | Nonfamily Households |
| 1-Person Households | - | 44 (26.4%) |
| 2-Person Households | 60 (35.9%) | 6 (3.6%) |
| 3-Person Households | 13 (7.8%) | 0 (0.0%) |
| 4-Person Households | 21 (12.6%) | 0 (0.0%) |
| 5-Person Households | 22 (13.2%) | 0 (0.0%) |
| 6-Person Households | 1 (0.6%) | 0 (0.0%) |
| 7+ Person Households | 0 (0.0%) | 0 (0.0%) |
| Total | 117 (70.1%) | 50 (29.9%) |
Female Fertility in San Patricio
Fertility by Age in San Patricio
Average fertility rate in San Patricio is 24.0 births per 1,000 women. Women in the age bracket of 35 to 50 years have the highest fertility rate with 50.0 births per 1,000 women. Women in the age bracket of 35 to 50 years acount for 100.0% of all women with births.
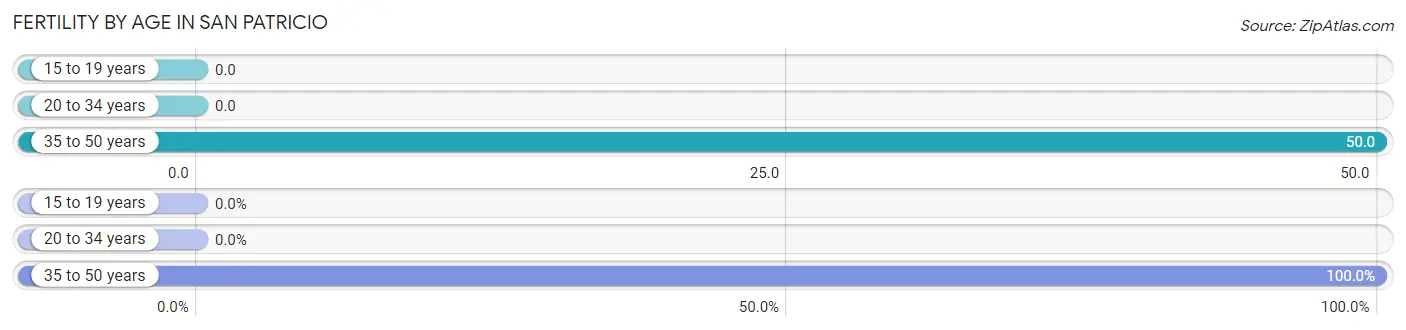
| Age Bracket | Women with Births | Births / 1,000 Women |
| 15 to 19 years | 0 (0.0%) | 0.0 |
| 20 to 34 years | 0 (0.0%) | 0.0 |
| 35 to 50 years | 2 (100.0%) | 50.0 |
| Total | 2 (100.0%) | 24.0 |
Fertility by Age by Marriage Status in San Patricio
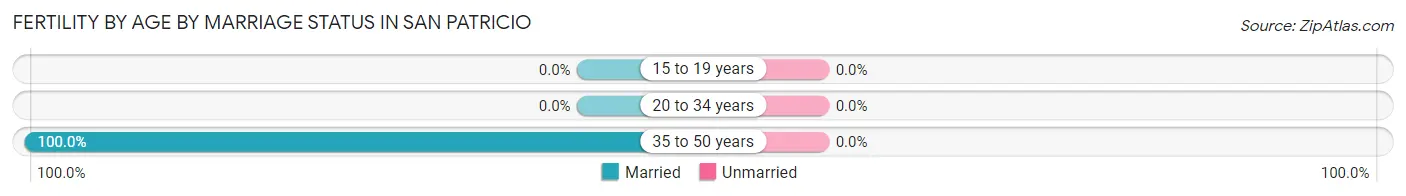
| Age Bracket | Married | Unmarried |
| 15 to 19 years | 0 (0.0%) | 0 (0.0%) |
| 20 to 34 years | 0 (0.0%) | 0 (0.0%) |
| 35 to 50 years | 2 (100.0%) | 0 (0.0%) |
| Total | 2 (100.0%) | 0 (0.0%) |
Fertility by Education in San Patricio
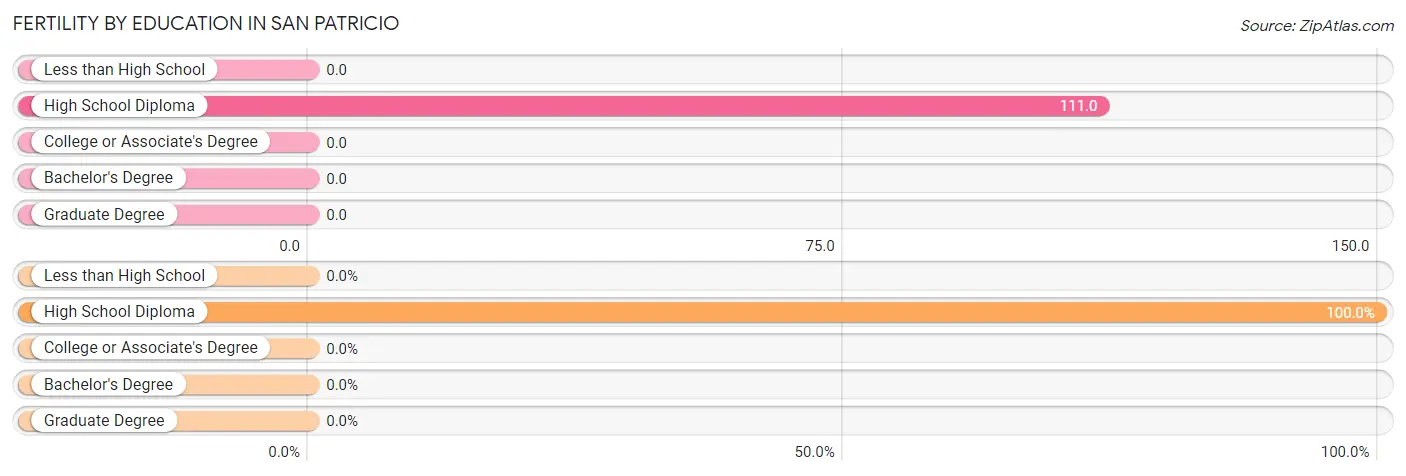
| Educational Attainment | Women with Births | Births / 1,000 Women |
| Less than High School | 0 (0.0%) | 0.0 |
| High School Diploma | 2 (100.0%) | 111.0 |
| College or Associate's Degree | 0 (0.0%) | 0.0 |
| Bachelor's Degree | 0 (0.0%) | 0.0 |
| Graduate Degree | 0 (0.0%) | 0.0 |
| Total | 2 (100.0%) | 24.0 |
Fertility by Education by Marriage Status in San Patricio
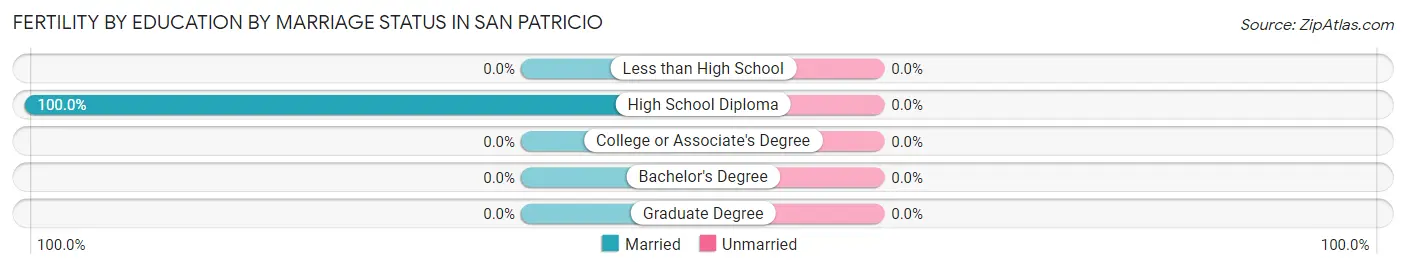
| Educational Attainment | Married | Unmarried |
| Less than High School | 0 (0.0%) | 0 (0.0%) |
| High School Diploma | 2 (100.0%) | 0 (0.0%) |
| College or Associate's Degree | 0 (0.0%) | 0 (0.0%) |
| Bachelor's Degree | 0 (0.0%) | 0 (0.0%) |
| Graduate Degree | 0 (0.0%) | 0 (0.0%) |
| Total | 2 (100.0%) | 0 (0.0%) |
Income in San Patricio
Income Overview in San Patricio
Per Capita Income in San Patricio is $30,506, while median incomes of families and households are $63,125 and $61,875 respectively.
| Characteristic | Number | Measure |
| Per Capita Income | 391 | $30,506 |
| Median Family Income | 117 | $63,125 |
| Mean Family Income | 117 | $77,381 |
| Median Household Income | 167 | $61,875 |
| Mean Household Income | 167 | $68,985 |
| Income Deficit | 117 | $0 |
| Wage / Income Gap (%) | 391 | 45.51% |
| Wage / Income Gap ($) | 391 | 54.49¢ per $1 |
| Gini / Inequality Index | 391 | 0.44 |
Earnings by Sex in San Patricio
Average Earnings in San Patricio are $51,944, $65,000 for men and $35,417 for women, a difference of 45.5%.
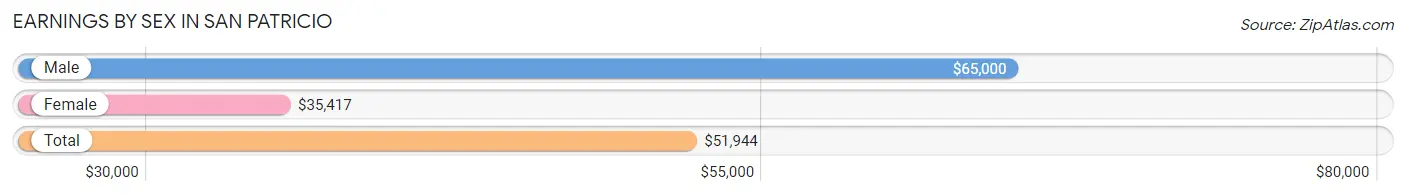
| Sex | Number | Average Earnings |
| Male | 88 (59.5%) | $65,000 |
| Female | 60 (40.5%) | $35,417 |
| Total | 148 (100.0%) | $51,944 |
Earnings by Sex by Income Bracket in San Patricio
The most common earnings brackets in San Patricio are $65,000 to $74,999 for men (17 | 19.3%) and $10,000 to $12,499 for women (11 | 18.3%).
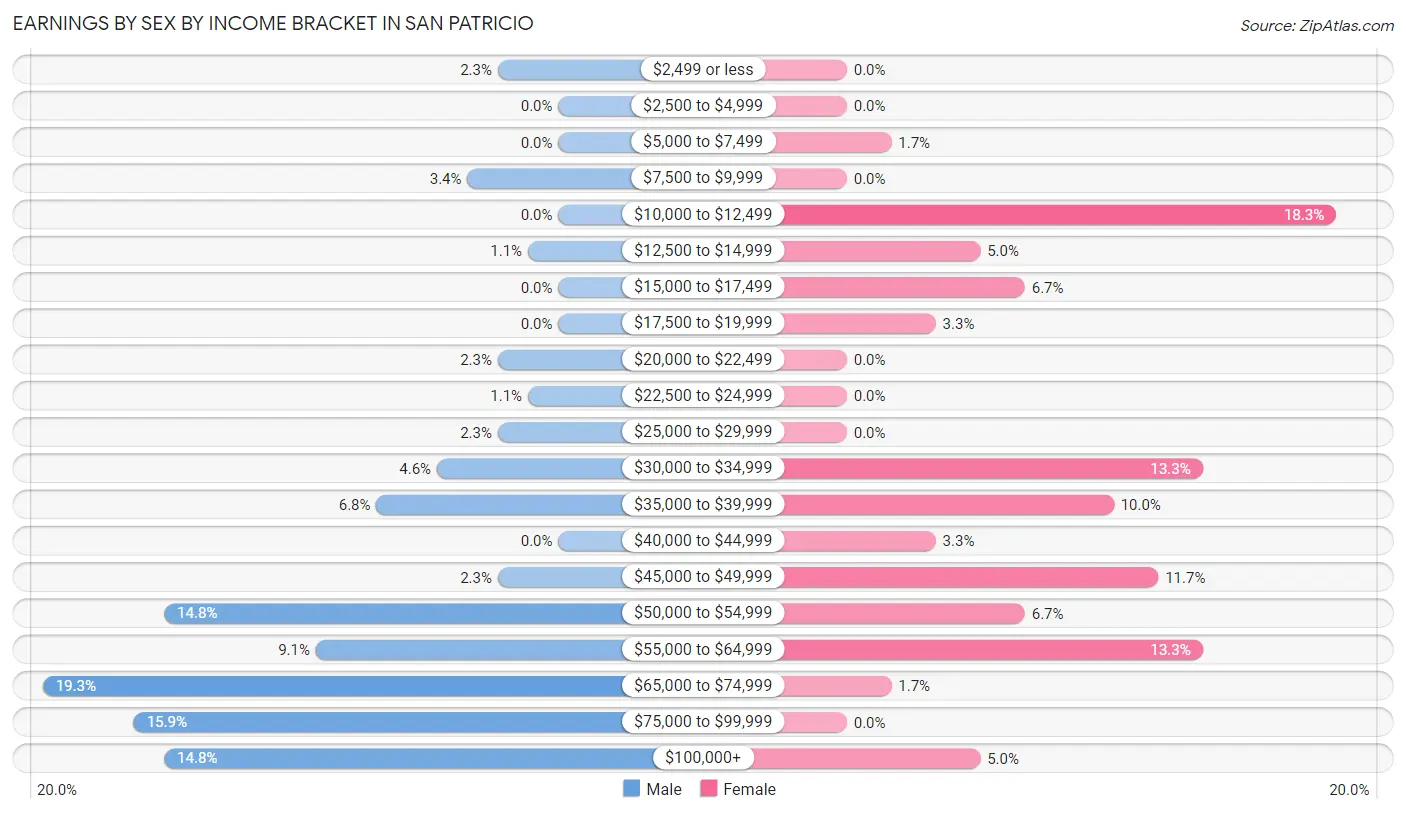
| Income | Male | Female |
| $2,499 or less | 2 (2.3%) | 0 (0.0%) |
| $2,500 to $4,999 | 0 (0.0%) | 0 (0.0%) |
| $5,000 to $7,499 | 0 (0.0%) | 1 (1.7%) |
| $7,500 to $9,999 | 3 (3.4%) | 0 (0.0%) |
| $10,000 to $12,499 | 0 (0.0%) | 11 (18.3%) |
| $12,500 to $14,999 | 1 (1.1%) | 3 (5.0%) |
| $15,000 to $17,499 | 0 (0.0%) | 4 (6.7%) |
| $17,500 to $19,999 | 0 (0.0%) | 2 (3.3%) |
| $20,000 to $22,499 | 2 (2.3%) | 0 (0.0%) |
| $22,500 to $24,999 | 1 (1.1%) | 0 (0.0%) |
| $25,000 to $29,999 | 2 (2.3%) | 0 (0.0%) |
| $30,000 to $34,999 | 4 (4.5%) | 8 (13.3%) |
| $35,000 to $39,999 | 6 (6.8%) | 6 (10.0%) |
| $40,000 to $44,999 | 0 (0.0%) | 2 (3.3%) |
| $45,000 to $49,999 | 2 (2.3%) | 7 (11.7%) |
| $50,000 to $54,999 | 13 (14.8%) | 4 (6.7%) |
| $55,000 to $64,999 | 8 (9.1%) | 8 (13.3%) |
| $65,000 to $74,999 | 17 (19.3%) | 1 (1.7%) |
| $75,000 to $99,999 | 14 (15.9%) | 0 (0.0%) |
| $100,000+ | 13 (14.8%) | 3 (5.0%) |
| Total | 88 (100.0%) | 60 (100.0%) |
Earnings by Sex by Educational Attainment in San Patricio
Average earnings in San Patricio are $65,000 for men and $35,417 for women, a difference of 45.5%. Men with an educational attainment of bachelor's degree enjoy the highest average annual earnings of $97,000, while those with high school diploma education earn the least with $52,361. Women with an educational attainment of bachelor's degree earn the most with the average annual earnings of $51,250, while those with high school diploma education have the smallest earnings of $30,833.
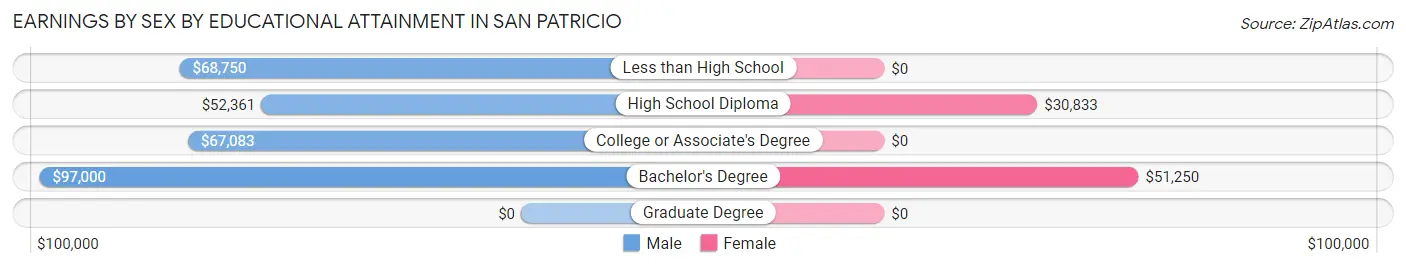
| Educational Attainment | Male Income | Female Income |
| Less than High School | $68,750 | $0 |
| High School Diploma | $52,361 | $30,833 |
| College or Associate's Degree | $67,083 | $0 |
| Bachelor's Degree | $97,000 | $51,250 |
| Graduate Degree | - | - |
| Total | $65,000 | $35,417 |
Family Income in San Patricio
Family Income Brackets in San Patricio
According to the San Patricio family income data, there are 21 families falling into the $15,000 to $24,999 income range, which is the most common income bracket and makes up 17.9% of all families.
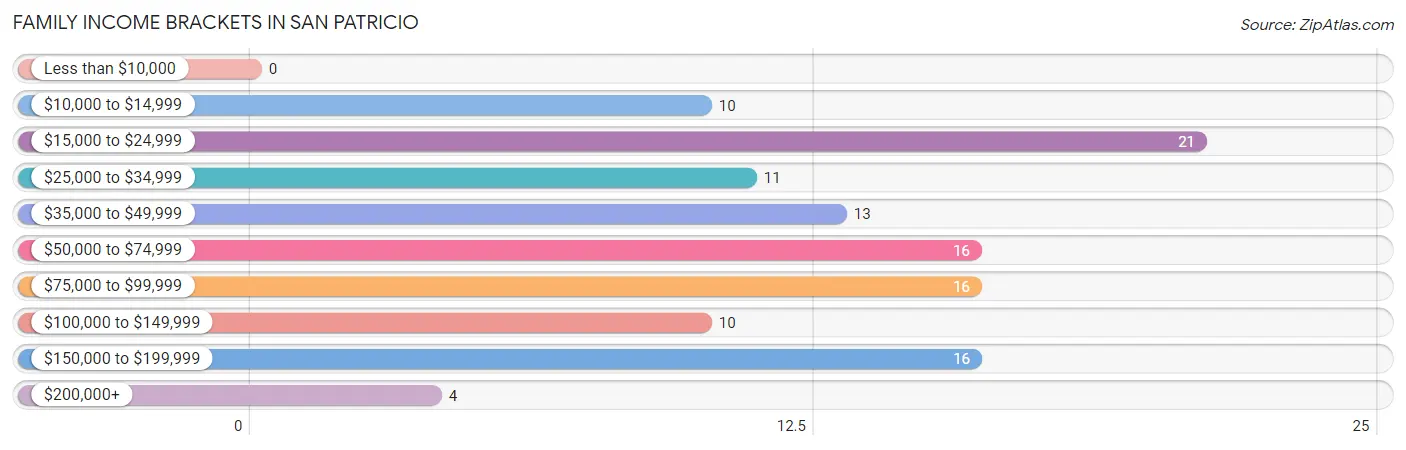
| Income Bracket | # Families | % Families |
| Less than $10,000 | 0 | 0.0% |
| $10,000 to $14,999 | 10 | 8.5% |
| $15,000 to $24,999 | 21 | 17.9% |
| $25,000 to $34,999 | 11 | 9.4% |
| $35,000 to $49,999 | 13 | 11.1% |
| $50,000 to $74,999 | 16 | 13.7% |
| $75,000 to $99,999 | 16 | 13.7% |
| $100,000 to $149,999 | 10 | 8.5% |
| $150,000 to $199,999 | 16 | 13.7% |
| $200,000+ | 4 | 3.4% |
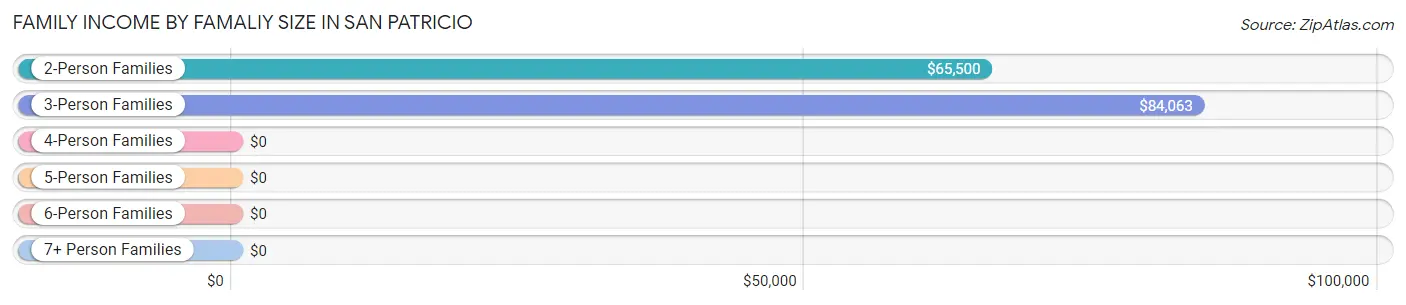
Family Income by Famaliy Size in San Patricio
3-person families (13 | 11.1%) account for the highest median family income in San Patricio with $84,063 per family, while 2-person families (60 | 51.3%) have the highest median income of $32,750 per family member.
| Income Bracket | # Families | Median Income |
| 2-Person Families | 60 (51.3%) | $65,500 |
| 3-Person Families | 13 (11.1%) | $84,063 |
| 4-Person Families | 27 (23.1%) | $0 |
| 5-Person Families | 16 (13.7%) | $0 |
| 6-Person Families | 1 (0.9%) | $0 |
| 7+ Person Families | 0 (0.0%) | $0 |
| Total | 117 (100.0%) | $63,125 |
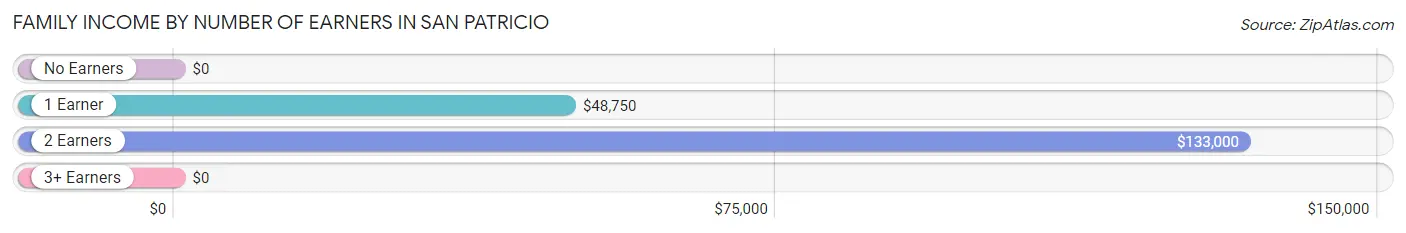
Family Income by Number of Earners in San Patricio
| Number of Earners | # Families | Median Income |
| No Earners | 32 (27.4%) | $0 |
| 1 Earner | 46 (39.3%) | $48,750 |
| 2 Earners | 38 (32.5%) | $133,000 |
| 3+ Earners | 1 (0.9%) | $0 |
| Total | 117 (100.0%) | $63,125 |
Household Income in San Patricio
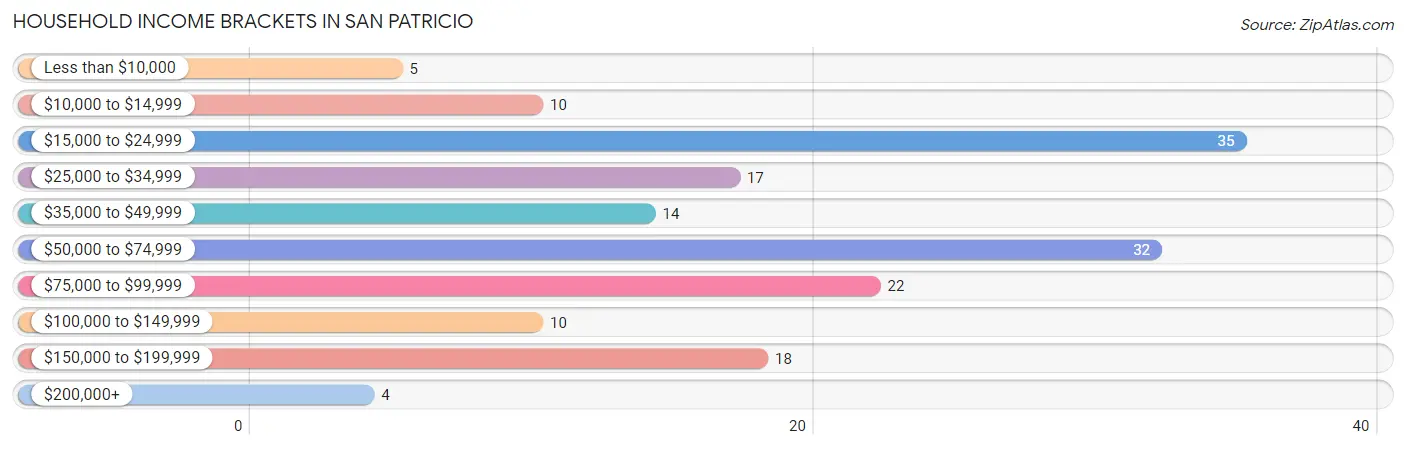
Household Income Brackets in San Patricio
With 35 households falling in the category, the $15,000 to $24,999 income range is the most frequent in San Patricio, accounting for 21.0% of all households. In contrast, only 4 households (2.4%) fall into the $200,000+ income bracket, making it the least populous group.
| Income Bracket | # Households | % Households |
| Less than $10,000 | 5 | 3.0% |
| $10,000 to $14,999 | 10 | 6.0% |
| $15,000 to $24,999 | 35 | 21.0% |
| $25,000 to $34,999 | 17 | 10.2% |
| $35,000 to $49,999 | 14 | 8.4% |
| $50,000 to $74,999 | 32 | 19.2% |
| $75,000 to $99,999 | 22 | 13.2% |
| $100,000 to $149,999 | 10 | 6.0% |
| $150,000 to $199,999 | 18 | 10.8% |
| $200,000+ | 4 | 2.4% |
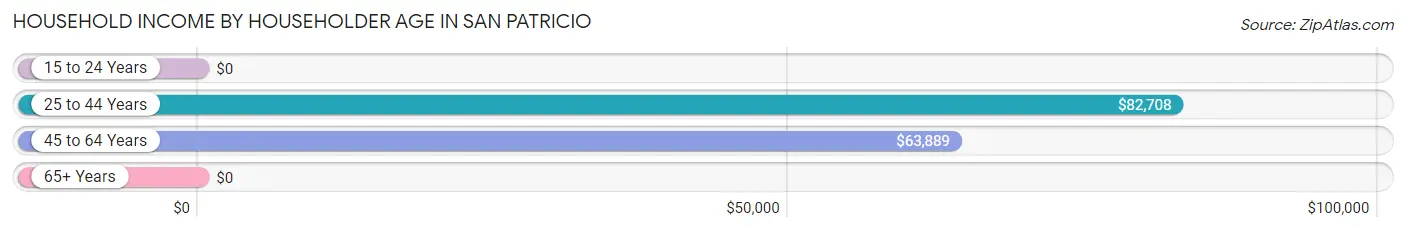
Household Income by Householder Age in San Patricio
The median household income in San Patricio is $61,875, with the highest median household income of $82,708 found in the 25 to 44 years age bracket for the primary householder. A total of 44 households (26.4%) fall into this category.
| Income Bracket | # Households | Median Income |
| 15 to 24 Years | 0 (0.0%) | $0 |
| 25 to 44 Years | 44 (26.4%) | $82,708 |
| 45 to 64 Years | 68 (40.7%) | $63,889 |
| 65+ Years | 55 (32.9%) | $0 |
| Total | 167 (100.0%) | $61,875 |
Poverty in San Patricio
Income Below Poverty by Sex and Age in San Patricio
With 17.9% poverty level for males and 12.8% for females among the residents of San Patricio, 5 year old males and 25 to 34 year old females are the most vulnerable to poverty, with 4 males (100.0%) and 8 females (44.4%) in their respective age groups living below the poverty level.
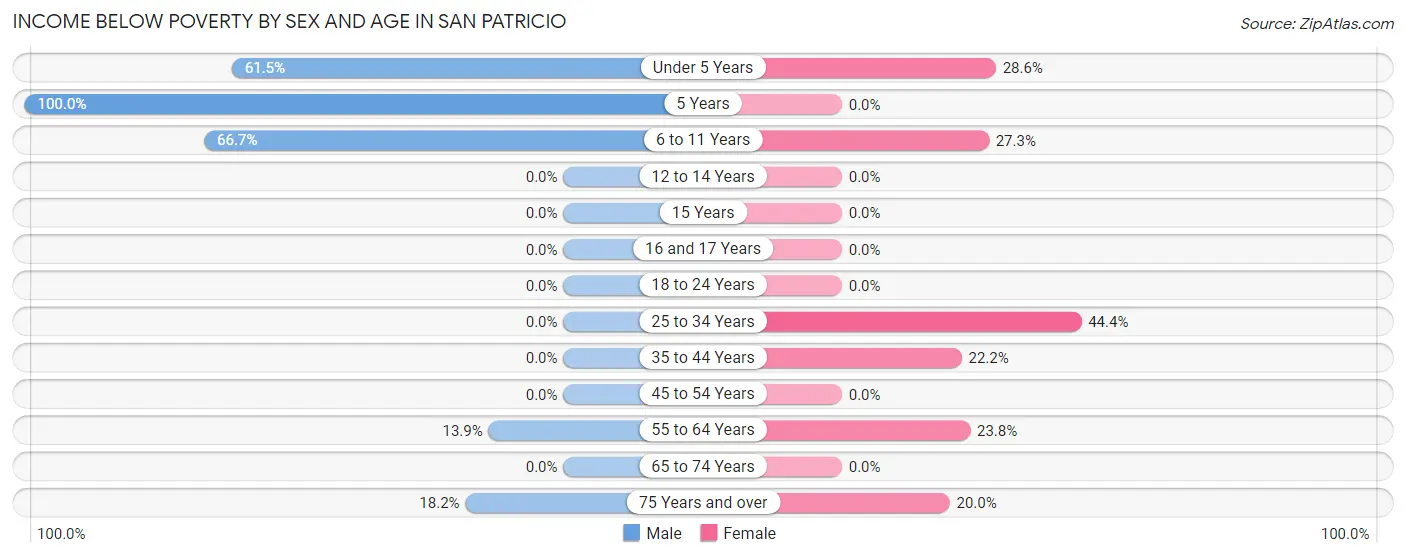
| Age Bracket | Male | Female |
| Under 5 Years | 8 (61.5%) | 4 (28.6%) |
| 5 Years | 4 (100.0%) | 0 (0.0%) |
| 6 to 11 Years | 12 (66.7%) | 3 (27.3%) |
| 12 to 14 Years | 0 (0.0%) | 0 (0.0%) |
| 15 Years | 0 (0.0%) | 0 (0.0%) |
| 16 and 17 Years | 0 (0.0%) | 0 (0.0%) |
| 18 to 24 Years | 0 (0.0%) | 0 (0.0%) |
| 25 to 34 Years | 0 (0.0%) | 8 (44.4%) |
| 35 to 44 Years | 0 (0.0%) | 6 (22.2%) |
| 45 to 54 Years | 0 (0.0%) | 0 (0.0%) |
| 55 to 64 Years | 5 (13.9%) | 5 (23.8%) |
| 65 to 74 Years | 0 (0.0%) | 0 (0.0%) |
| 75 Years and over | 2 (18.2%) | 2 (20.0%) |
| Total | 31 (17.9%) | 28 (12.8%) |
Income Above Poverty by Sex and Age in San Patricio
According to the poverty statistics in San Patricio, males aged 12 to 14 years and females aged 12 to 14 years are the age groups that are most secure financially, with 100.0% of males and 100.0% of females in these age groups living above the poverty line.
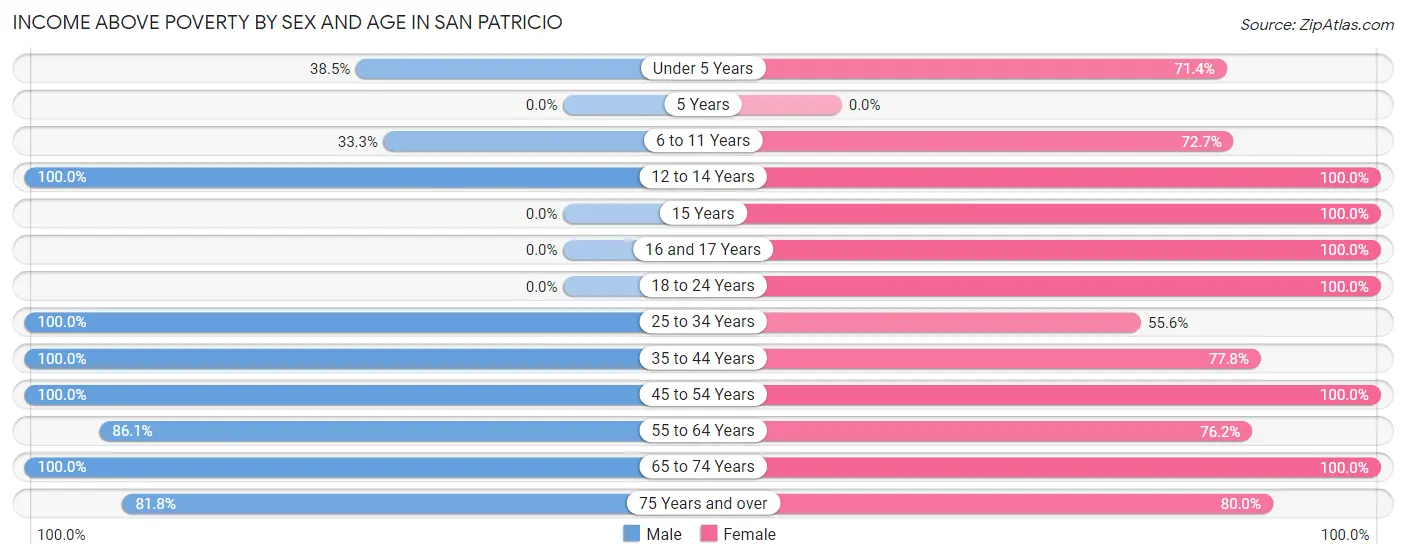
| Age Bracket | Male | Female |
| Under 5 Years | 5 (38.5%) | 10 (71.4%) |
| 5 Years | 0 (0.0%) | 0 (0.0%) |
| 6 to 11 Years | 6 (33.3%) | 8 (72.7%) |
| 12 to 14 Years | 3 (100.0%) | 15 (100.0%) |
| 15 Years | 0 (0.0%) | 9 (100.0%) |
| 16 and 17 Years | 0 (0.0%) | 7 (100.0%) |
| 18 to 24 Years | 0 (0.0%) | 8 (100.0%) |
| 25 to 34 Years | 7 (100.0%) | 10 (55.6%) |
| 35 to 44 Years | 24 (100.0%) | 21 (77.8%) |
| 45 to 54 Years | 32 (100.0%) | 30 (100.0%) |
| 55 to 64 Years | 31 (86.1%) | 16 (76.2%) |
| 65 to 74 Years | 25 (100.0%) | 48 (100.0%) |
| 75 Years and over | 9 (81.8%) | 8 (80.0%) |
| Total | 142 (82.1%) | 190 (87.2%) |
Income Below Poverty Among Married-Couple Families in San Patricio
The poverty statistics for married-couple families in San Patricio show that 2.1% or 2 of the total 96 families live below the poverty line. Families with no children have the highest poverty rate of 3.0%, comprising of 2 families. On the other hand, families with 1 or 2 children have the lowest poverty rate of 0.0%, which includes 0 families.
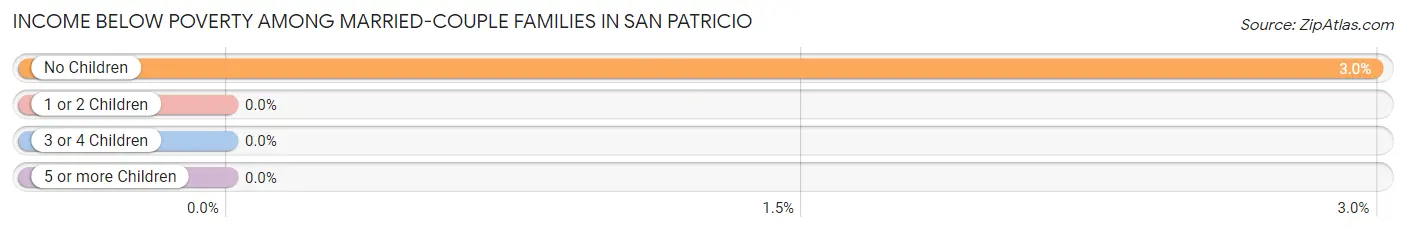
| Children | Above Poverty | Below Poverty |
| No Children | 65 (97.0%) | 2 (3.0%) |
| 1 or 2 Children | 21 (100.0%) | 0 (0.0%) |
| 3 or 4 Children | 8 (100.0%) | 0 (0.0%) |
| 5 or more Children | 0 (0.0%) | 0 (0.0%) |
| Total | 94 (97.9%) | 2 (2.1%) |
Income Below Poverty Among Single-Parent Households in San Patricio
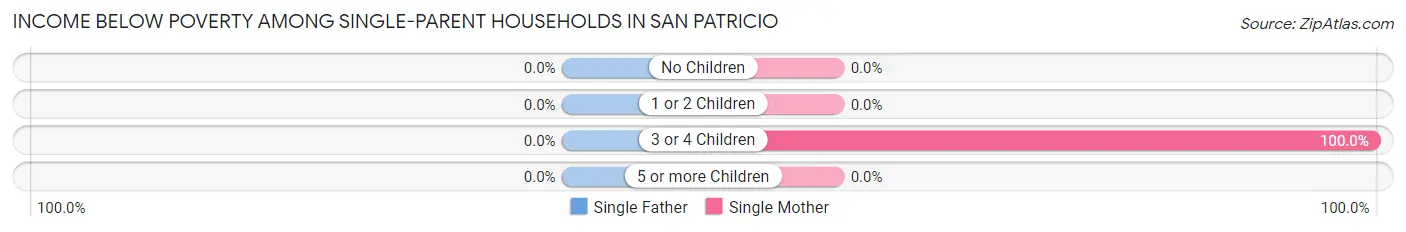
| Children | Single Father | Single Mother |
| No Children | 0 (0.0%) | 0 (0.0%) |
| 1 or 2 Children | 0 (0.0%) | 0 (0.0%) |
| 3 or 4 Children | 0 (0.0%) | 14 (100.0%) |
| 5 or more Children | 0 (0.0%) | 0 (0.0%) |
| Total | 0 (0.0%) | 14 (66.7%) |
Income Below Poverty Among Married-Couple vs Single-Parent Households in San Patricio
The poverty data for San Patricio shows that 2 of the married-couple family households (2.1%) and 14 of the single-parent households (66.7%) are living below the poverty level. Within the married-couple family households, those with no children have the highest poverty rate, with 2 households (3.0%) falling below the poverty line. Among the single-parent households, those with 3 or 4 children have the highest poverty rate, with 14 household (100.0%) living below poverty.
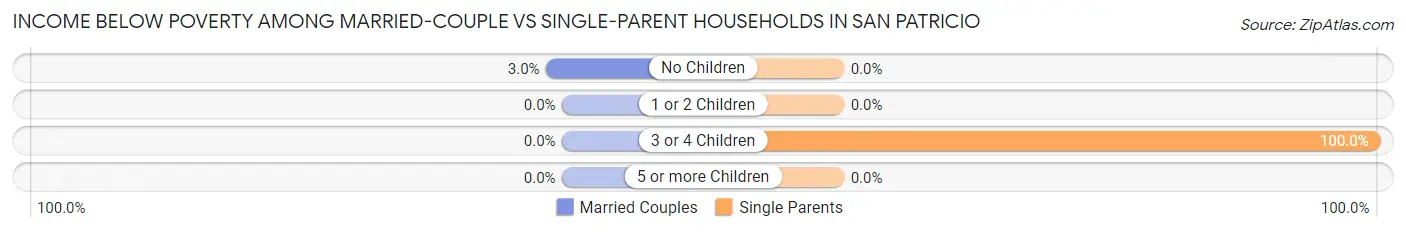
| Children | Married-Couple Families | Single-Parent Households |
| No Children | 2 (3.0%) | 0 (0.0%) |
| 1 or 2 Children | 0 (0.0%) | 0 (0.0%) |
| 3 or 4 Children | 0 (0.0%) | 14 (100.0%) |
| 5 or more Children | 0 (0.0%) | 0 (0.0%) |
| Total | 2 (2.1%) | 14 (66.7%) |
Employment Characteristics in San Patricio
Employment by Class of Employer in San Patricio
Among the 140 employed individuals in San Patricio, private company employees (91 | 65.0%), self-employed (not incorporated) (16 | 11.4%), and self-employed (incorporated) (11 | 7.9%) make up the most common classes of employment.
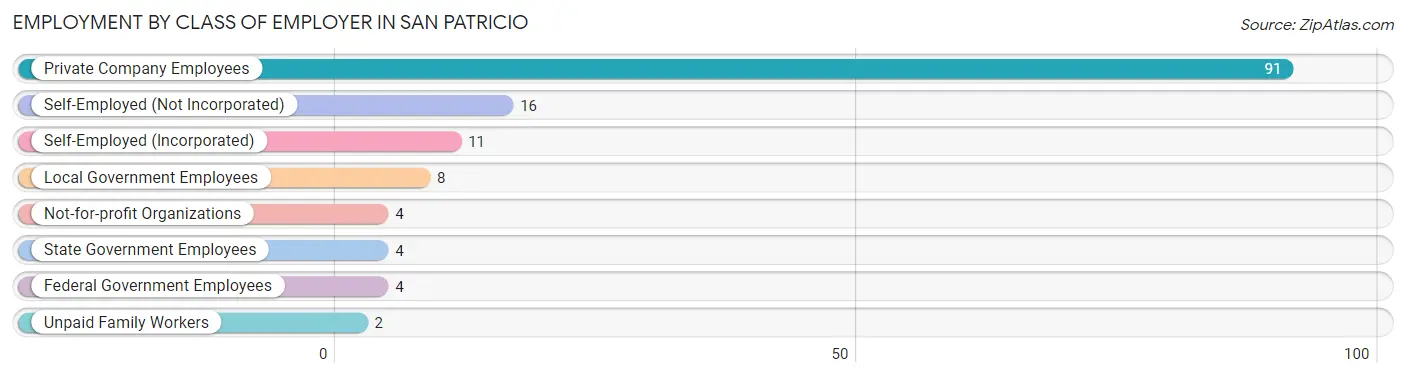
| Employer Class | # Employees | % Employees |
| Private Company Employees | 91 | 65.0% |
| Self-Employed (Incorporated) | 11 | 7.9% |
| Self-Employed (Not Incorporated) | 16 | 11.4% |
| Not-for-profit Organizations | 4 | 2.9% |
| Local Government Employees | 8 | 5.7% |
| State Government Employees | 4 | 2.9% |
| Federal Government Employees | 4 | 2.9% |
| Unpaid Family Workers | 2 | 1.4% |
| Total | 140 | 100.0% |
Employment Status by Age in San Patricio
According to the labor force statistics for San Patricio, out of the total population over 16 years of age (304), 47.7% or 145 individuals are in the labor force, with 3.4% or 5 of them unemployed. The age group with the highest labor force participation rate is 30 to 34 years, with 100.0% or 7 individuals in the labor force. Within the labor force, the 65 to 74 years age range has the highest percentage of unemployed individuals, with 12.5% or 2 of them being unemployed.
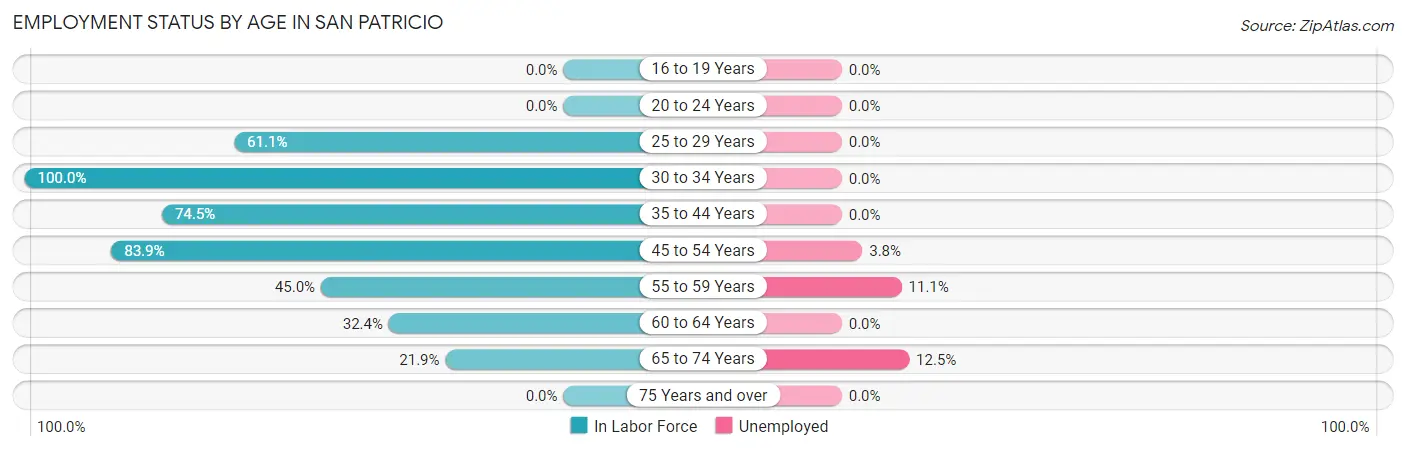
| Age Bracket | In Labor Force | Unemployed |
| 16 to 19 Years | 0 (0.0%) | 0 (0.0%) |
| 20 to 24 Years | 0 (0.0%) | 0 (0.0%) |
| 25 to 29 Years | 11 (61.1%) | 0 (0.0%) |
| 30 to 34 Years | 7 (100.0%) | 0 (0.0%) |
| 35 to 44 Years | 38 (74.5%) | 0 (0.0%) |
| 45 to 54 Years | 52 (83.9%) | 2 (3.8%) |
| 55 to 59 Years | 9 (45.0%) | 1 (11.1%) |
| 60 to 64 Years | 12 (32.4%) | 0 (0.0%) |
| 65 to 74 Years | 16 (21.9%) | 2 (12.5%) |
| 75 Years and over | 0 (0.0%) | 0 (0.0%) |
| Total | 145 (47.7%) | 5 (3.4%) |
Employment Status by Educational Attainment in San Patricio
According to labor force statistics for San Patricio, 66.2% of individuals (129) out of the total population between 25 and 64 years of age (195) are in the labor force, with 2.3% or 3 of them being unemployed. The group with the highest labor force participation rate are those with the educational attainment of bachelor's degree or higher, with 100.0% or 29 individuals in the labor force. Within the labor force, individuals with high school diploma education have the highest percentage of unemployment, with 4.1% or 2 of them being unemployed.
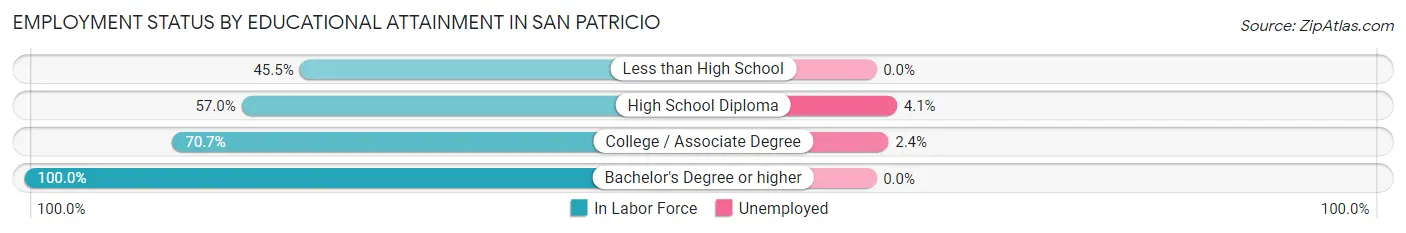
| Educational Attainment | In Labor Force | Unemployed |
| Less than High School | 10 (45.5%) | 0 (0.0%) |
| High School Diploma | 49 (57.0%) | 4 (4.1%) |
| College / Associate Degree | 41 (70.7%) | 1 (2.4%) |
| Bachelor's Degree or higher | 29 (100.0%) | 0 (0.0%) |
| Total | 129 (66.2%) | 4 (2.3%) |
Employment Occupations by Sex in San Patricio
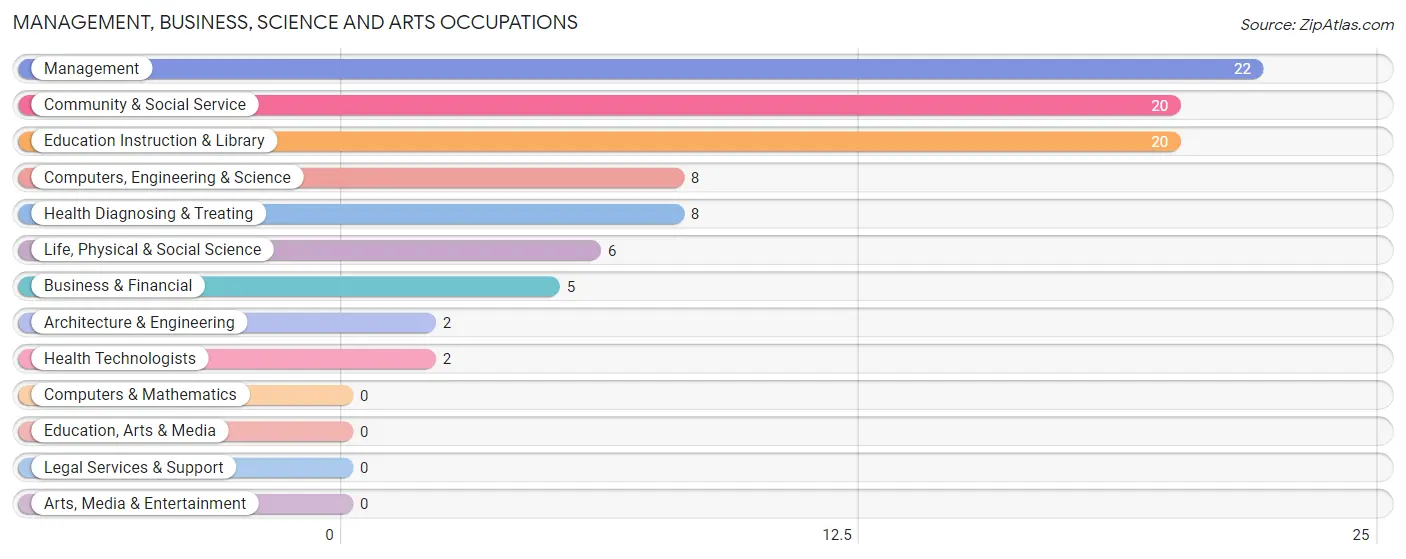
Management, Business, Science and Arts Occupations
The most common Management, Business, Science and Arts occupations in San Patricio are Management (22 | 15.7%), Community & Social Service (20 | 14.3%), Education Instruction & Library (20 | 14.3%), Computers, Engineering & Science (8 | 5.7%), and Health Diagnosing & Treating (8 | 5.7%).
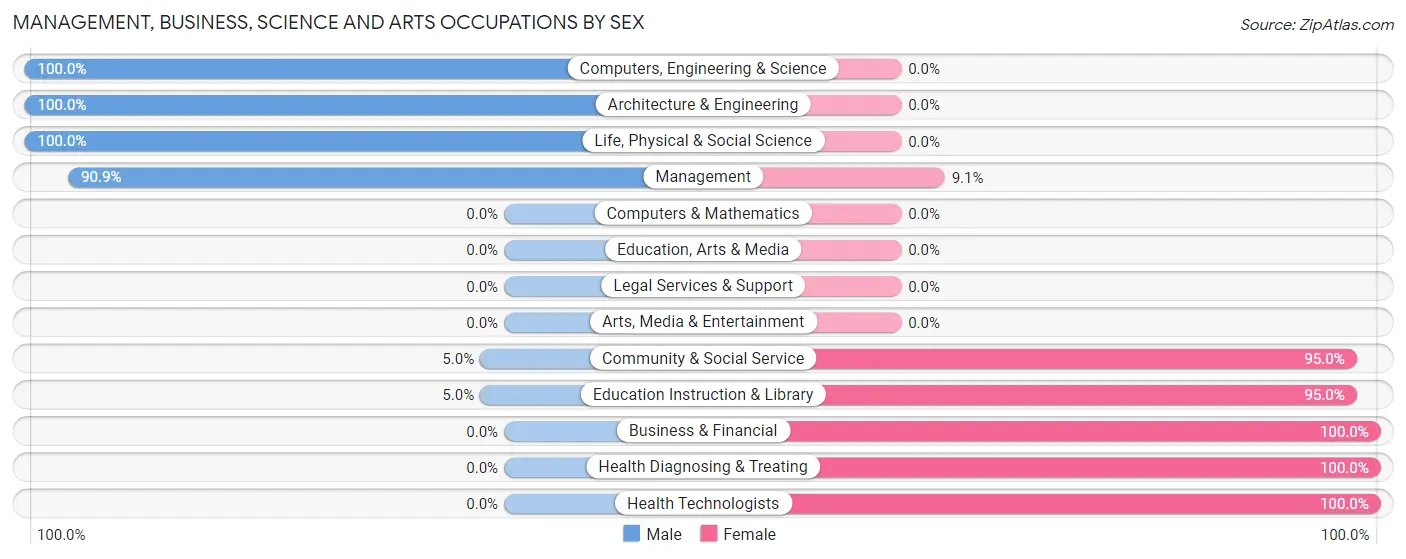
Management, Business, Science and Arts Occupations by Sex
Within the Management, Business, Science and Arts occupations in San Patricio, the most male-oriented occupations are Computers, Engineering & Science (100.0%), Architecture & Engineering (100.0%), and Life, Physical & Social Science (100.0%), while the most female-oriented occupations are Business & Financial (100.0%), Health Diagnosing & Treating (100.0%), and Health Technologists (100.0%).
| Occupation | Male | Female |
| Management | 20 (90.9%) | 2 (9.1%) |
| Business & Financial | 0 (0.0%) | 5 (100.0%) |
| Computers, Engineering & Science | 8 (100.0%) | 0 (0.0%) |
| Computers & Mathematics | 0 (0.0%) | 0 (0.0%) |
| Architecture & Engineering | 2 (100.0%) | 0 (0.0%) |
| Life, Physical & Social Science | 6 (100.0%) | 0 (0.0%) |
| Community & Social Service | 1 (5.0%) | 19 (95.0%) |
| Education, Arts & Media | 0 (0.0%) | 0 (0.0%) |
| Legal Services & Support | 0 (0.0%) | 0 (0.0%) |
| Education Instruction & Library | 1 (5.0%) | 19 (95.0%) |
| Arts, Media & Entertainment | 0 (0.0%) | 0 (0.0%) |
| Health Diagnosing & Treating | 0 (0.0%) | 8 (100.0%) |
| Health Technologists | 0 (0.0%) | 2 (100.0%) |
| Total (Category) | 29 (46.0%) | 34 (54.0%) |
| Total (Overall) | 88 (62.9%) | 52 (37.1%) |
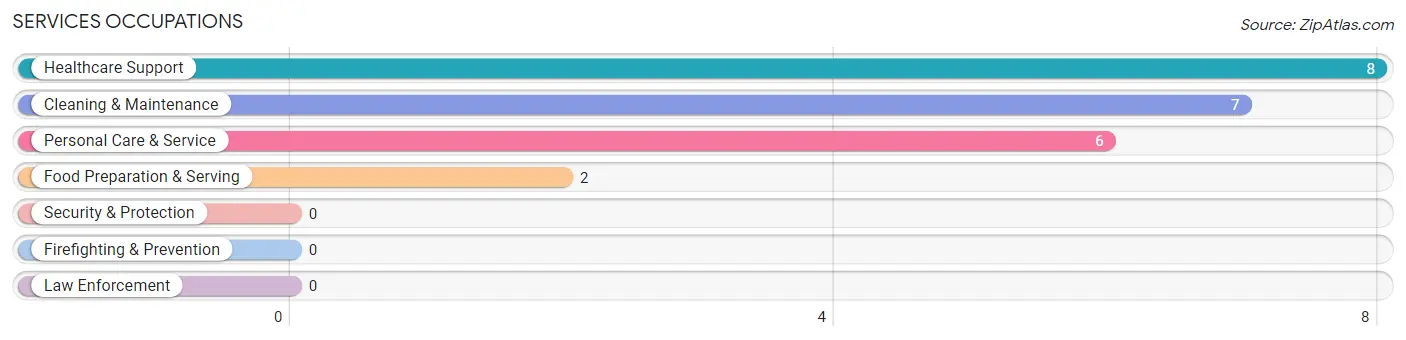
Services Occupations
The most common Services occupations in San Patricio are Healthcare Support (8 | 5.7%), Cleaning & Maintenance (7 | 5.0%), Personal Care & Service (6 | 4.3%), and Food Preparation & Serving (2 | 1.4%).
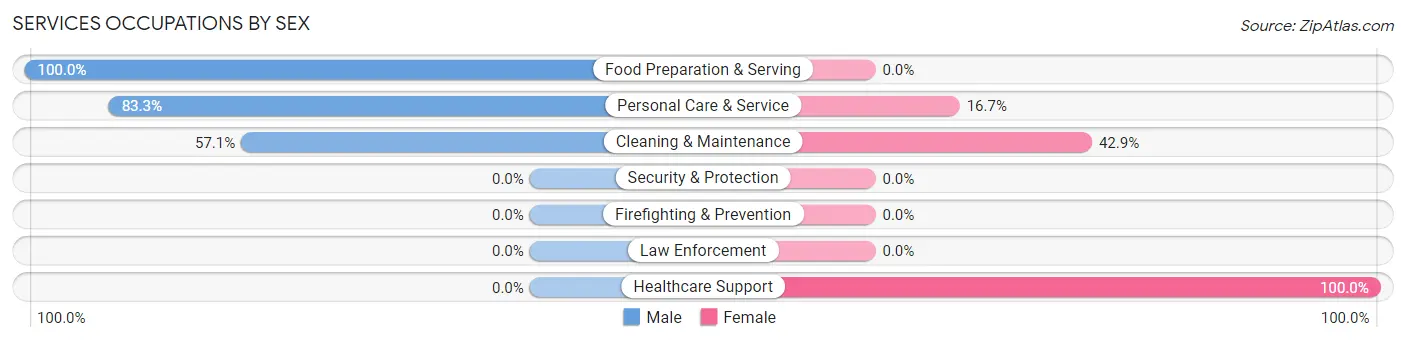
Services Occupations by Sex
Within the Services occupations in San Patricio, the most male-oriented occupations are Food Preparation & Serving (100.0%), Personal Care & Service (83.3%), and Cleaning & Maintenance (57.1%), while the most female-oriented occupations are Healthcare Support (100.0%), Cleaning & Maintenance (42.9%), and Personal Care & Service (16.7%).
| Occupation | Male | Female |
| Healthcare Support | 0 (0.0%) | 8 (100.0%) |
| Security & Protection | 0 (0.0%) | 0 (0.0%) |
| Firefighting & Prevention | 0 (0.0%) | 0 (0.0%) |
| Law Enforcement | 0 (0.0%) | 0 (0.0%) |
| Food Preparation & Serving | 2 (100.0%) | 0 (0.0%) |
| Cleaning & Maintenance | 4 (57.1%) | 3 (42.9%) |
| Personal Care & Service | 5 (83.3%) | 1 (16.7%) |
| Total (Category) | 11 (47.8%) | 12 (52.2%) |
| Total (Overall) | 88 (62.9%) | 52 (37.1%) |
Sales and Office Occupations
The most common Sales and Office occupations in San Patricio are Sales & Related (8 | 5.7%), and Office & Administration (3 | 2.1%).

Sales and Office Occupations by Sex

| Occupation | Male | Female |
| Sales & Related | 5 (62.5%) | 3 (37.5%) |
| Office & Administration | 0 (0.0%) | 3 (100.0%) |
| Total (Category) | 5 (45.5%) | 6 (54.5%) |
| Total (Overall) | 88 (62.9%) | 52 (37.1%) |
Natural Resources, Construction and Maintenance Occupations
The most common Natural Resources, Construction and Maintenance occupations in San Patricio are Construction & Extraction (22 | 15.7%), and Installation, Maintenance & Repair (2 | 1.4%).
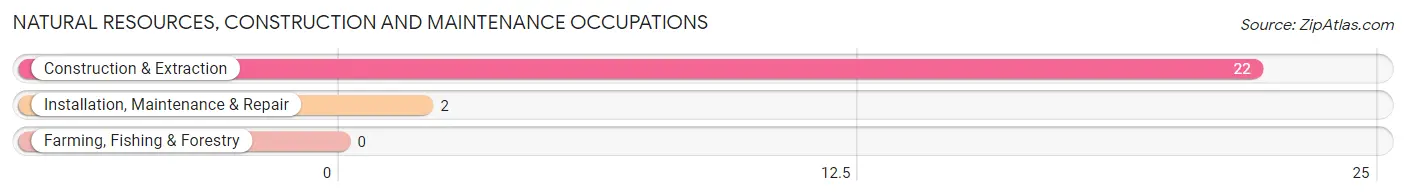
Natural Resources, Construction and Maintenance Occupations by Sex

| Occupation | Male | Female |
| Farming, Fishing & Forestry | 0 (0.0%) | 0 (0.0%) |
| Construction & Extraction | 22 (100.0%) | 0 (0.0%) |
| Installation, Maintenance & Repair | 2 (100.0%) | 0 (0.0%) |
| Total (Category) | 24 (100.0%) | 0 (0.0%) |
| Total (Overall) | 88 (62.9%) | 52 (37.1%) |
Production, Transportation and Moving Occupations
The most common Production, Transportation and Moving occupations in San Patricio are Transportation (12 | 8.6%), and Production (7 | 5.0%).
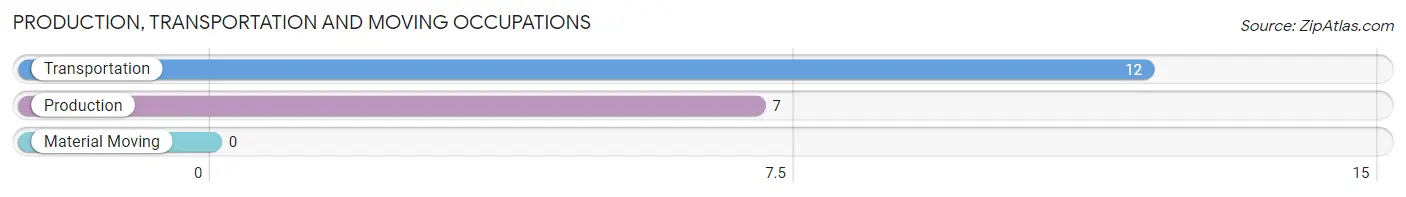
Production, Transportation and Moving Occupations by Sex
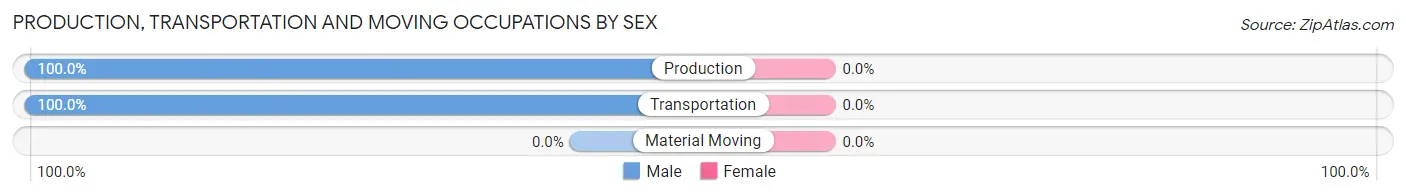
| Occupation | Male | Female |
| Production | 7 (100.0%) | 0 (0.0%) |
| Transportation | 12 (100.0%) | 0 (0.0%) |
| Material Moving | 0 (0.0%) | 0 (0.0%) |
| Total (Category) | 19 (100.0%) | 0 (0.0%) |
| Total (Overall) | 88 (62.9%) | 52 (37.1%) |
Employment Industries by Sex in San Patricio
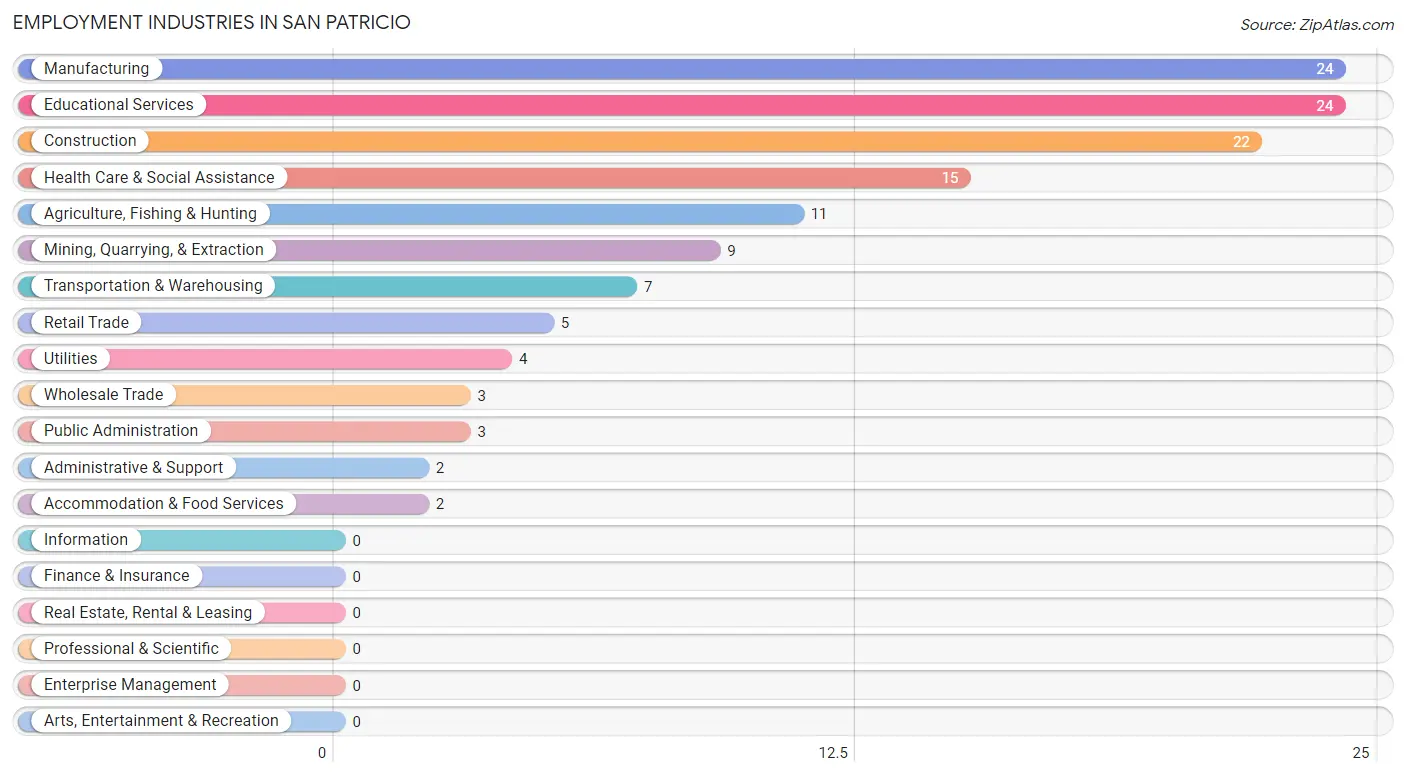
Employment Industries in San Patricio
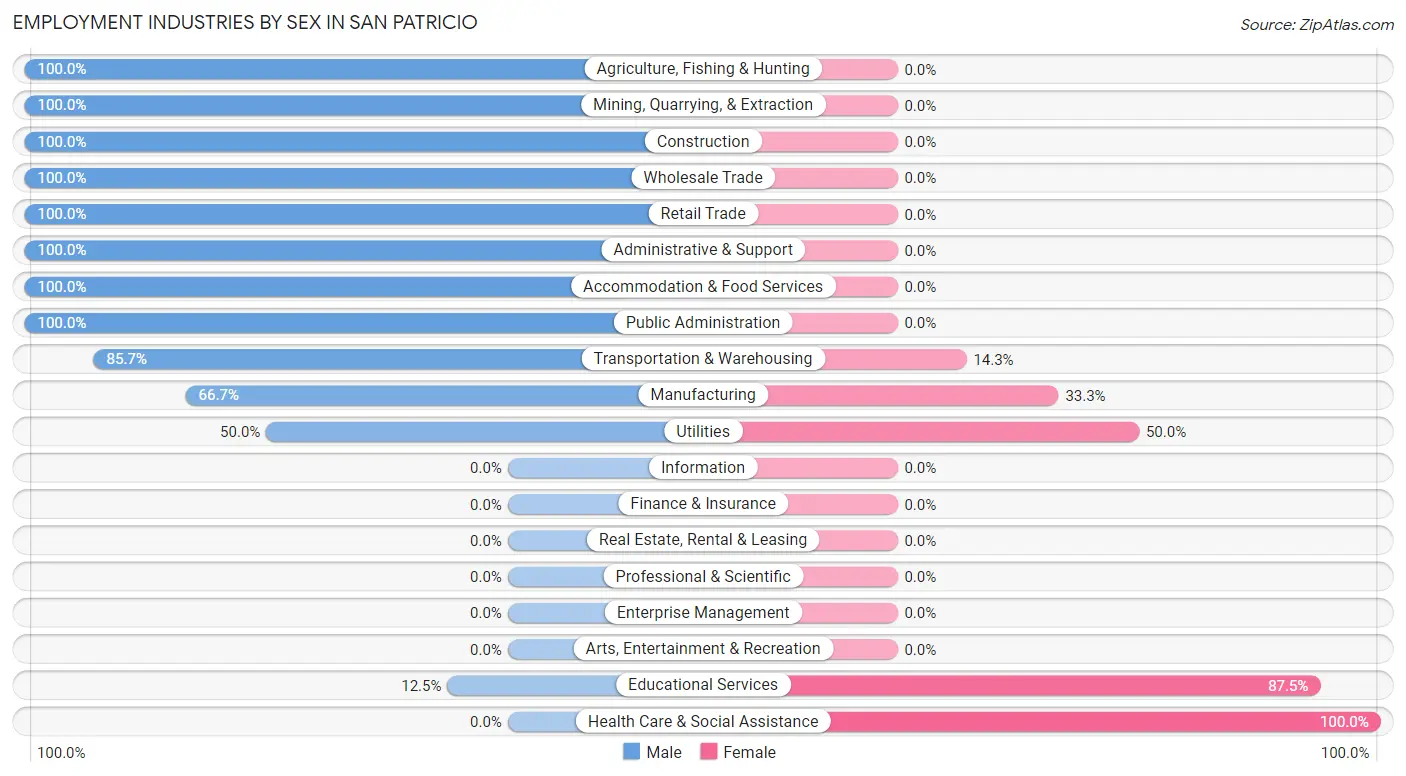
The major employment industries in San Patricio include Manufacturing (24 | 17.1%), Educational Services (24 | 17.1%), Construction (22 | 15.7%), Health Care & Social Assistance (15 | 10.7%), and Agriculture, Fishing & Hunting (11 | 7.9%).
Employment Industries by Sex in San Patricio
The San Patricio industries that see more men than women are Agriculture, Fishing & Hunting (100.0%), Mining, Quarrying, & Extraction (100.0%), and Construction (100.0%), whereas the industries that tend to have a higher number of women are Health Care & Social Assistance (100.0%), Educational Services (87.5%), and Utilities (50.0%).
| Industry | Male | Female |
| Agriculture, Fishing & Hunting | 11 (100.0%) | 0 (0.0%) |
| Mining, Quarrying, & Extraction | 9 (100.0%) | 0 (0.0%) |
| Construction | 22 (100.0%) | 0 (0.0%) |
| Manufacturing | 16 (66.7%) | 8 (33.3%) |
| Wholesale Trade | 3 (100.0%) | 0 (0.0%) |
| Retail Trade | 5 (100.0%) | 0 (0.0%) |
| Transportation & Warehousing | 6 (85.7%) | 1 (14.3%) |
| Utilities | 2 (50.0%) | 2 (50.0%) |
| Information | 0 (0.0%) | 0 (0.0%) |
| Finance & Insurance | 0 (0.0%) | 0 (0.0%) |
| Real Estate, Rental & Leasing | 0 (0.0%) | 0 (0.0%) |
| Professional & Scientific | 0 (0.0%) | 0 (0.0%) |
| Enterprise Management | 0 (0.0%) | 0 (0.0%) |
| Administrative & Support | 2 (100.0%) | 0 (0.0%) |
| Educational Services | 3 (12.5%) | 21 (87.5%) |
| Health Care & Social Assistance | 0 (0.0%) | 15 (100.0%) |
| Arts, Entertainment & Recreation | 0 (0.0%) | 0 (0.0%) |
| Accommodation & Food Services | 2 (100.0%) | 0 (0.0%) |
| Public Administration | 3 (100.0%) | 0 (0.0%) |
| Total | 88 (62.9%) | 52 (37.1%) |
Education in San Patricio
School Enrollment in San Patricio
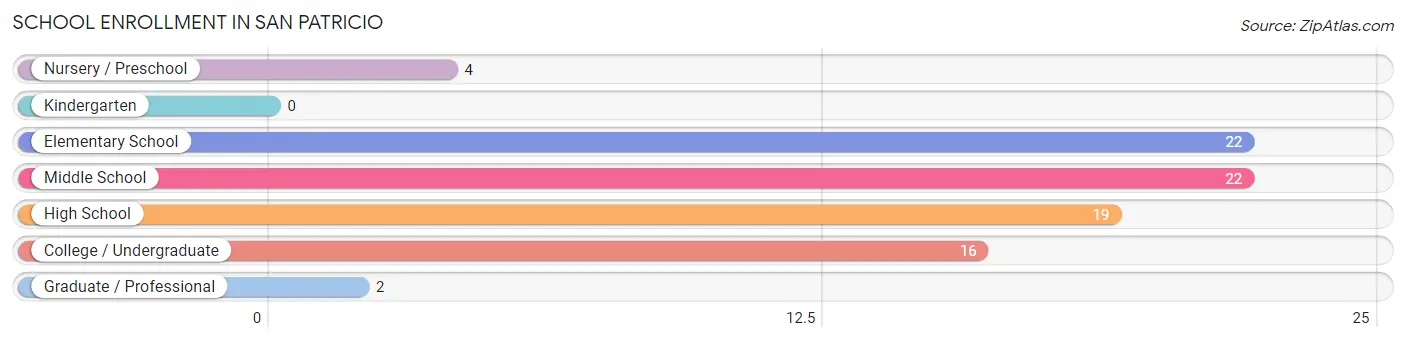
The most common levels of schooling among the 85 students in San Patricio are elementary school (22 | 25.9%), middle school (22 | 25.9%), and high school (19 | 22.4%).
| School Level | # Students | % Students |
| Nursery / Preschool | 4 | 4.7% |
| Kindergarten | 0 | 0.0% |
| Elementary School | 22 | 25.9% |
| Middle School | 22 | 25.9% |
| High School | 19 | 22.4% |
| College / Undergraduate | 16 | 18.8% |
| Graduate / Professional | 2 | 2.4% |
| Total | 85 | 100.0% |
School Enrollment by Age by Funding Source in San Patricio
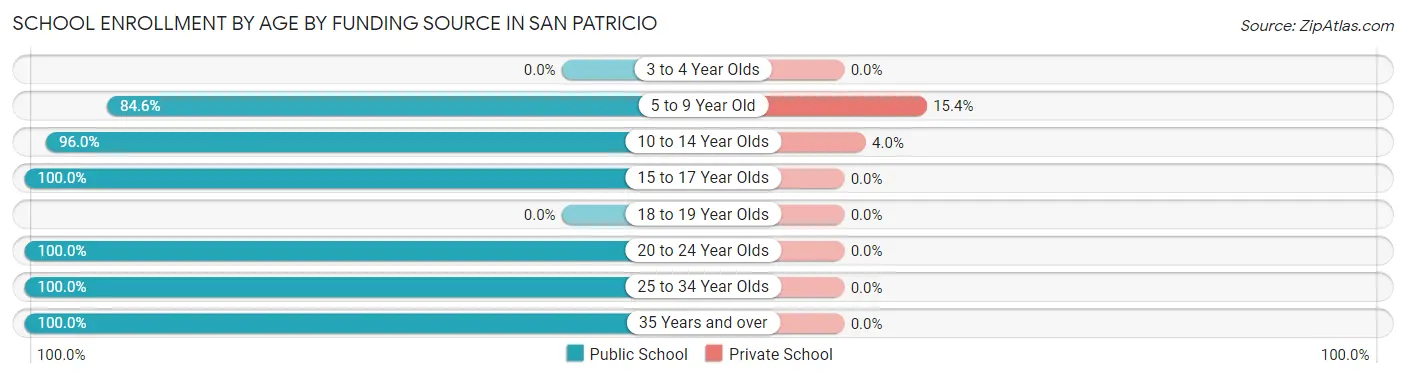
Out of a total of 85 students who are enrolled in schools in San Patricio, 5 (5.9%) attend a private institution, while the remaining 80 (94.1%) are enrolled in public schools. The age group of 5 to 9 year old has the highest likelihood of being enrolled in private schools, with 4 (15.4% in the age bracket) enrolled. Conversely, the age group of 15 to 17 year olds has the lowest likelihood of being enrolled in a private school, with 16 (100.0% in the age bracket) attending a public institution.
| Age Bracket | Public School | Private School |
| 3 to 4 Year Olds | 0 (0.0%) | 0 (0.0%) |
| 5 to 9 Year Old | 22 (84.6%) | 4 (15.4%) |
| 10 to 14 Year Olds | 24 (96.0%) | 1 (4.0%) |
| 15 to 17 Year Olds | 16 (100.0%) | 0 (0.0%) |
| 18 to 19 Year Olds | 0 (0.0%) | 0 (0.0%) |
| 20 to 24 Year Olds | 8 (100.0%) | 0 (0.0%) |
| 25 to 34 Year Olds | 8 (100.0%) | 0 (0.0%) |
| 35 Years and over | 2 (100.0%) | 0 (0.0%) |
| Total | 80 (94.1%) | 5 (5.9%) |
Educational Attainment by Field of Study in San Patricio
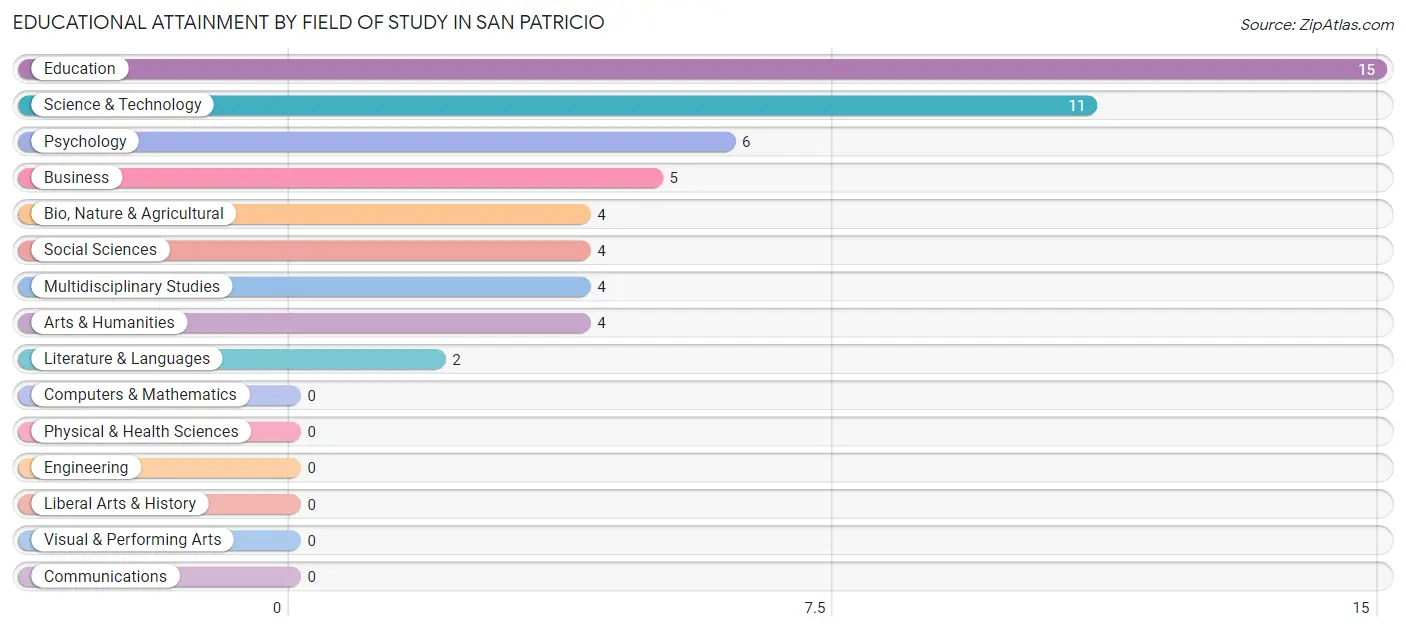
Education (15 | 27.3%), science & technology (11 | 20.0%), psychology (6 | 10.9%), business (5 | 9.1%), and bio, nature & agricultural (4 | 7.3%) are the most common fields of study among 55 individuals in San Patricio who have obtained a bachelor's degree or higher.
| Field of Study | # Graduates | % Graduates |
| Computers & Mathematics | 0 | 0.0% |
| Bio, Nature & Agricultural | 4 | 7.3% |
| Physical & Health Sciences | 0 | 0.0% |
| Psychology | 6 | 10.9% |
| Social Sciences | 4 | 7.3% |
| Engineering | 0 | 0.0% |
| Multidisciplinary Studies | 4 | 7.3% |
| Science & Technology | 11 | 20.0% |
| Business | 5 | 9.1% |
| Education | 15 | 27.3% |
| Literature & Languages | 2 | 3.6% |
| Liberal Arts & History | 0 | 0.0% |
| Visual & Performing Arts | 0 | 0.0% |
| Communications | 0 | 0.0% |
| Arts & Humanities | 4 | 7.3% |
| Total | 55 | 100.0% |
Transportation & Commute in San Patricio
Vehicle Availability by Sex in San Patricio
The most prevalent vehicle ownership categories in San Patricio are males with 2 vehicles (53, accounting for 60.2%) and females with 2 vehicles (28, making up 101.9%).
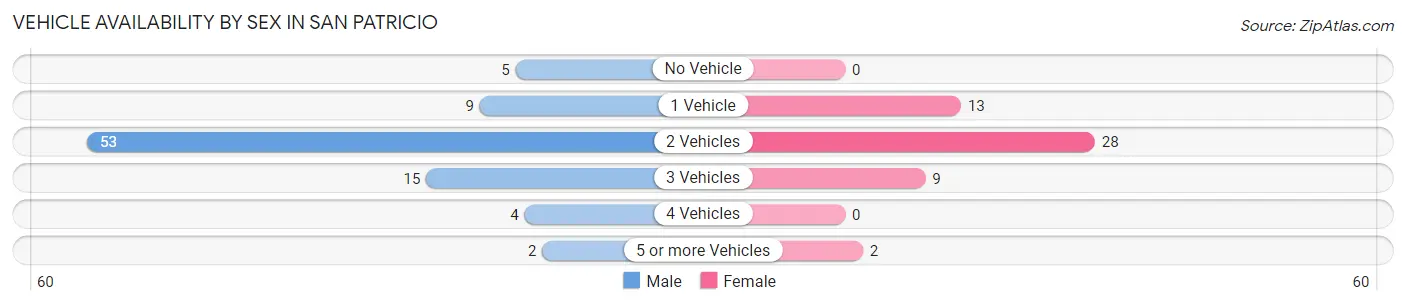
| Vehicles Available | Male | Female |
| No Vehicle | 5 (5.7%) | 0 (0.0%) |
| 1 Vehicle | 9 (10.2%) | 13 (25.0%) |
| 2 Vehicles | 53 (60.2%) | 28 (53.8%) |
| 3 Vehicles | 15 (17.1%) | 9 (17.3%) |
| 4 Vehicles | 4 (4.5%) | 0 (0.0%) |
| 5 or more Vehicles | 2 (2.3%) | 2 (3.8%) |
| Total | 88 (100.0%) | 52 (100.0%) |
Commute Time in San Patricio
The most frequently occuring commute durations in San Patricio are 45 to 59 minutes (38 commuters, 29.2%), 30 to 34 minutes (33 commuters, 25.4%), and 20 to 24 minutes (21 commuters, 16.2%).
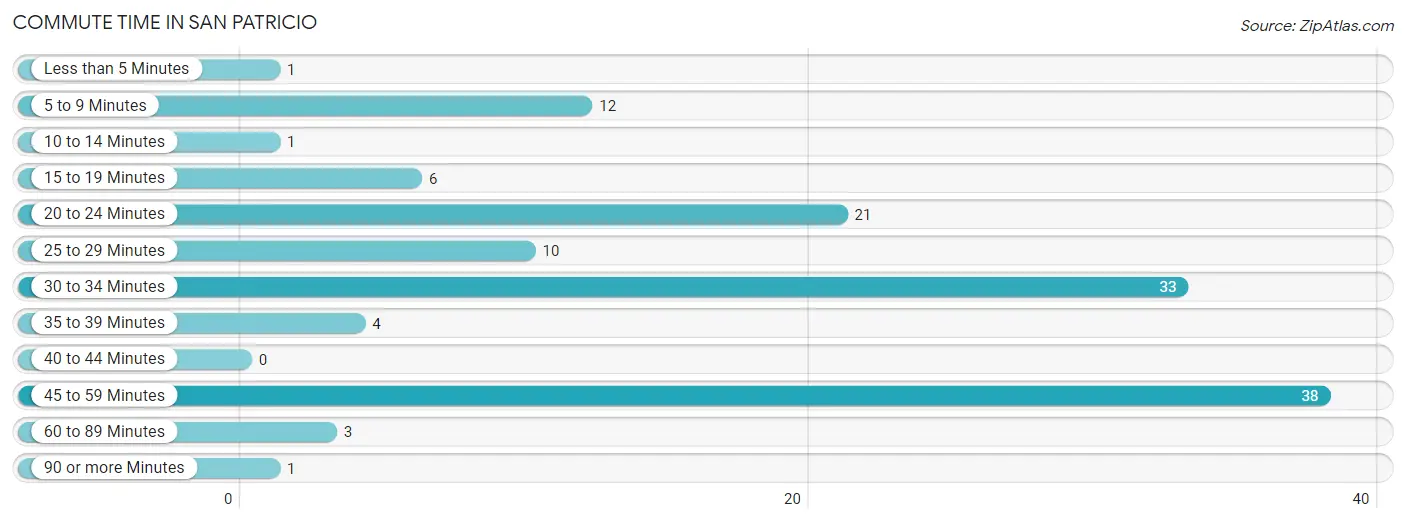
| Commute Time | # Commuters | % Commuters |
| Less than 5 Minutes | 1 | 0.8% |
| 5 to 9 Minutes | 12 | 9.2% |
| 10 to 14 Minutes | 1 | 0.8% |
| 15 to 19 Minutes | 6 | 4.6% |
| 20 to 24 Minutes | 21 | 16.2% |
| 25 to 29 Minutes | 10 | 7.7% |
| 30 to 34 Minutes | 33 | 25.4% |
| 35 to 39 Minutes | 4 | 3.1% |
| 40 to 44 Minutes | 0 | 0.0% |
| 45 to 59 Minutes | 38 | 29.2% |
| 60 to 89 Minutes | 3 | 2.3% |
| 90 or more Minutes | 1 | 0.8% |
Commute Time by Sex in San Patricio
The most common commute times in San Patricio are 45 to 59 minutes (28 commuters, 34.2%) for males and 30 to 34 minutes (14 commuters, 29.2%) for females.
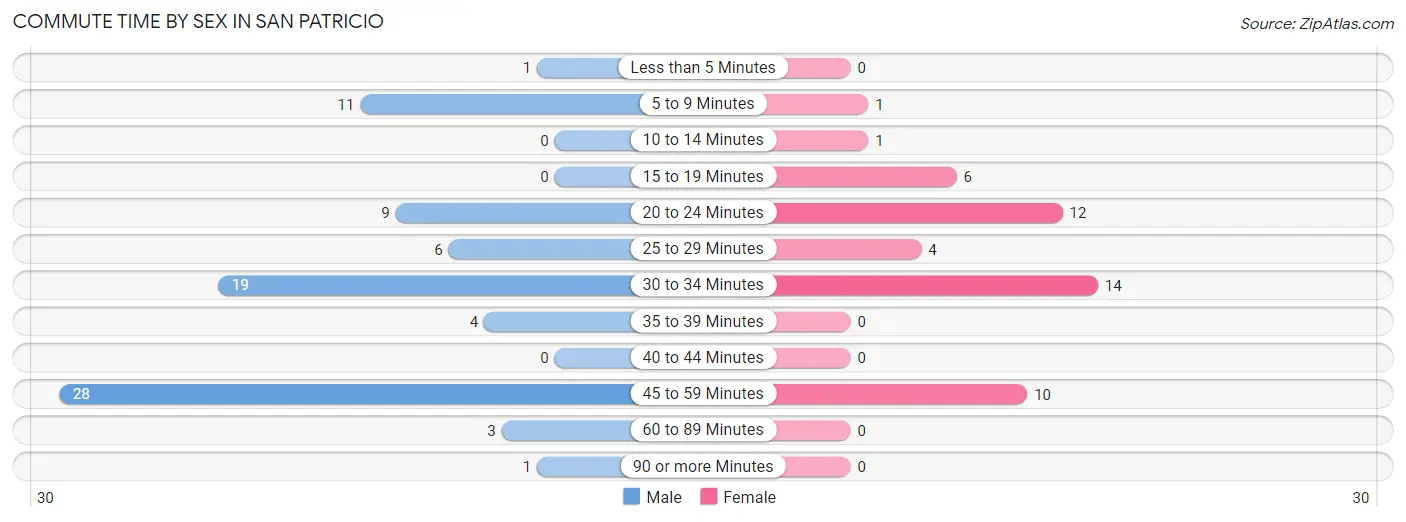
| Commute Time | Male | Female |
| Less than 5 Minutes | 1 (1.2%) | 0 (0.0%) |
| 5 to 9 Minutes | 11 (13.4%) | 1 (2.1%) |
| 10 to 14 Minutes | 0 (0.0%) | 1 (2.1%) |
| 15 to 19 Minutes | 0 (0.0%) | 6 (12.5%) |
| 20 to 24 Minutes | 9 (11.0%) | 12 (25.0%) |
| 25 to 29 Minutes | 6 (7.3%) | 4 (8.3%) |
| 30 to 34 Minutes | 19 (23.2%) | 14 (29.2%) |
| 35 to 39 Minutes | 4 (4.9%) | 0 (0.0%) |
| 40 to 44 Minutes | 0 (0.0%) | 0 (0.0%) |
| 45 to 59 Minutes | 28 (34.2%) | 10 (20.8%) |
| 60 to 89 Minutes | 3 (3.7%) | 0 (0.0%) |
| 90 or more Minutes | 1 (1.2%) | 0 (0.0%) |
Time of Departure to Work by Sex in San Patricio
The most frequent times of departure to work in San Patricio are 6:00 AM to 6:29 AM (15, 18.3%) for males and 7:00 AM to 7:29 AM (16, 33.3%) for females.
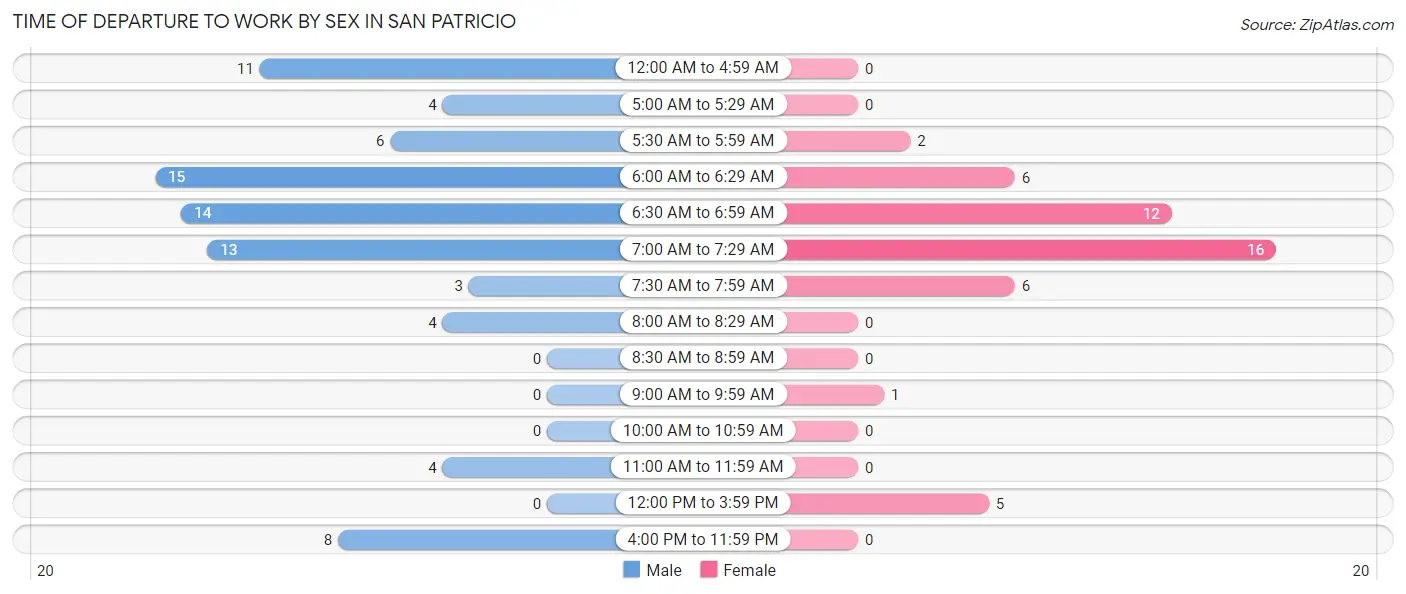
| Time of Departure | Male | Female |
| 12:00 AM to 4:59 AM | 11 (13.4%) | 0 (0.0%) |
| 5:00 AM to 5:29 AM | 4 (4.9%) | 0 (0.0%) |
| 5:30 AM to 5:59 AM | 6 (7.3%) | 2 (4.2%) |
| 6:00 AM to 6:29 AM | 15 (18.3%) | 6 (12.5%) |
| 6:30 AM to 6:59 AM | 14 (17.1%) | 12 (25.0%) |
| 7:00 AM to 7:29 AM | 13 (15.9%) | 16 (33.3%) |
| 7:30 AM to 7:59 AM | 3 (3.7%) | 6 (12.5%) |
| 8:00 AM to 8:29 AM | 4 (4.9%) | 0 (0.0%) |
| 8:30 AM to 8:59 AM | 0 (0.0%) | 0 (0.0%) |
| 9:00 AM to 9:59 AM | 0 (0.0%) | 1 (2.1%) |
| 10:00 AM to 10:59 AM | 0 (0.0%) | 0 (0.0%) |
| 11:00 AM to 11:59 AM | 4 (4.9%) | 0 (0.0%) |
| 12:00 PM to 3:59 PM | 0 (0.0%) | 5 (10.4%) |
| 4:00 PM to 11:59 PM | 8 (9.8%) | 0 (0.0%) |
| Total | 82 (100.0%) | 48 (100.0%) |
Housing Occupancy in San Patricio
Occupancy by Ownership in San Patricio
Of the total 167 dwellings in San Patricio, owner-occupied units account for 146 (87.4%), while renter-occupied units make up 21 (12.6%).
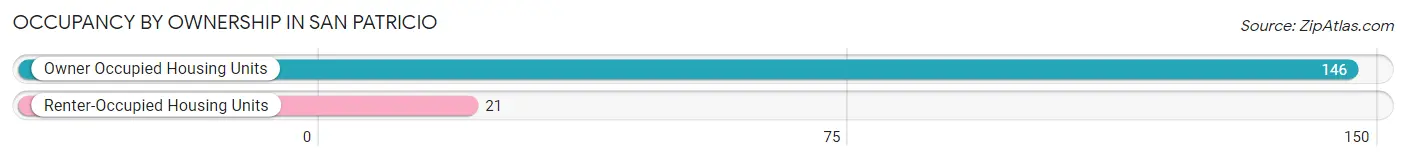
| Occupancy | # Housing Units | % Housing Units |
| Owner Occupied Housing Units | 146 | 87.4% |
| Renter-Occupied Housing Units | 21 | 12.6% |
| Total Occupied Housing Units | 167 | 100.0% |
Occupancy by Household Size in San Patricio
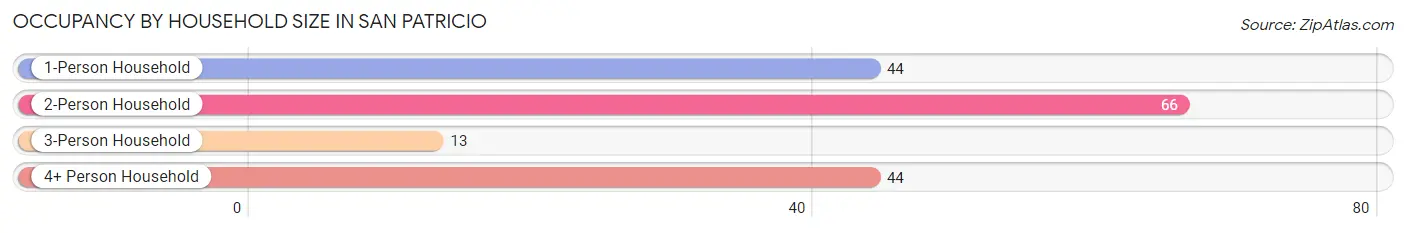
| Household Size | # Housing Units | % Housing Units |
| 1-Person Household | 44 | 26.4% |
| 2-Person Household | 66 | 39.5% |
| 3-Person Household | 13 | 7.8% |
| 4+ Person Household | 44 | 26.4% |
| Total Housing Units | 167 | 100.0% |
Occupancy by Ownership by Household Size in San Patricio
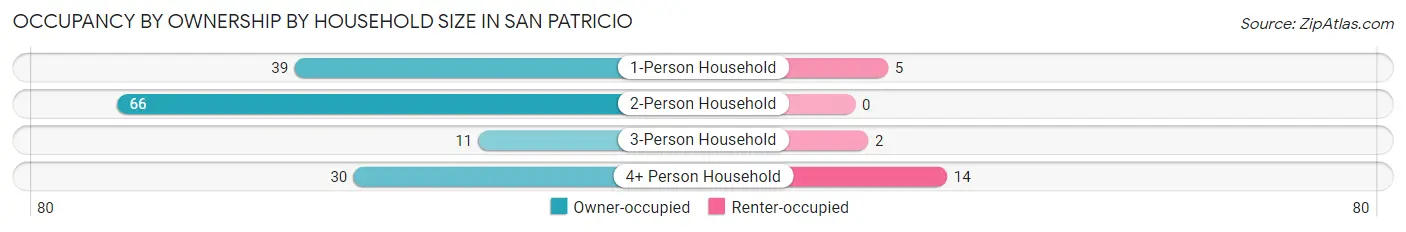
| Household Size | Owner-occupied | Renter-occupied |
| 1-Person Household | 39 (88.6%) | 5 (11.4%) |
| 2-Person Household | 66 (100.0%) | 0 (0.0%) |
| 3-Person Household | 11 (84.6%) | 2 (15.4%) |
| 4+ Person Household | 30 (68.2%) | 14 (31.8%) |
| Total Housing Units | 146 (87.4%) | 21 (12.6%) |
Occupancy by Educational Attainment in San Patricio
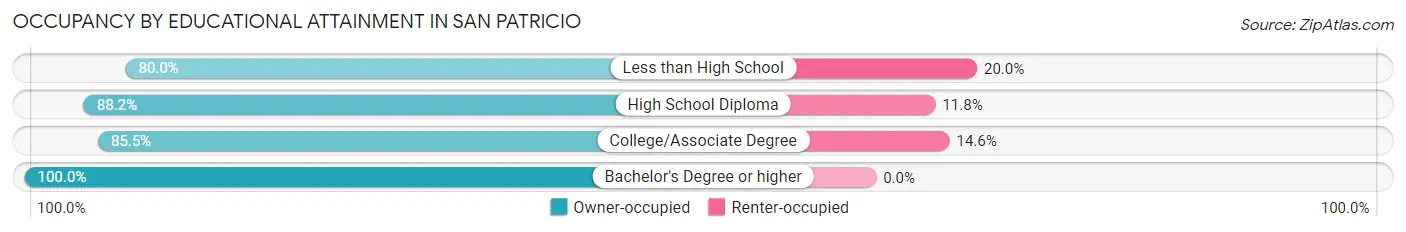
| Household Size | Owner-occupied | Renter-occupied |
| Less than High School | 20 (80.0%) | 5 (20.0%) |
| High School Diploma | 60 (88.2%) | 8 (11.8%) |
| College/Associate Degree | 47 (85.5%) | 8 (14.5%) |
| Bachelor's Degree or higher | 19 (100.0%) | 0 (0.0%) |
Occupancy by Age of Householder in San Patricio
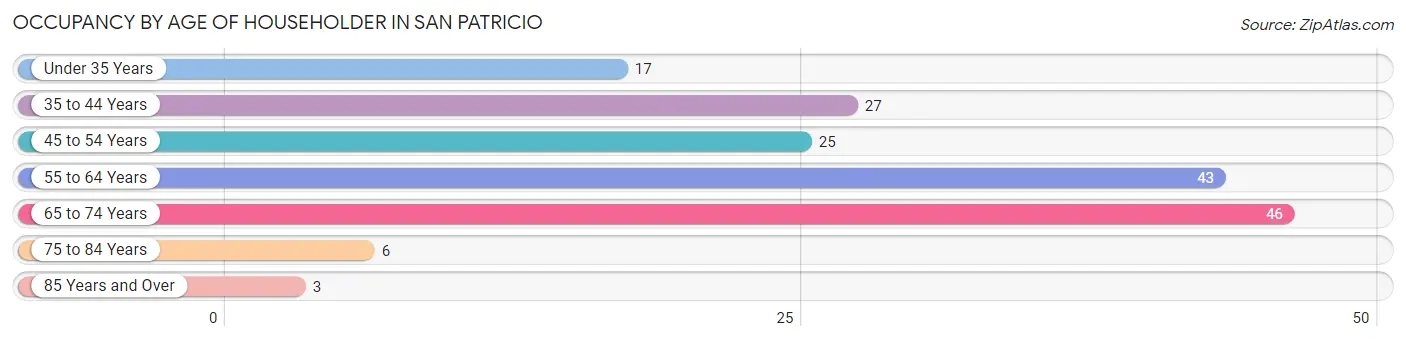
| Age Bracket | # Households | % Households |
| Under 35 Years | 17 | 10.2% |
| 35 to 44 Years | 27 | 16.2% |
| 45 to 54 Years | 25 | 15.0% |
| 55 to 64 Years | 43 | 25.8% |
| 65 to 74 Years | 46 | 27.5% |
| 75 to 84 Years | 6 | 3.6% |
| 85 Years and Over | 3 | 1.8% |
| Total | 167 | 100.0% |
Housing Finances in San Patricio
Median Income by Occupancy in San Patricio
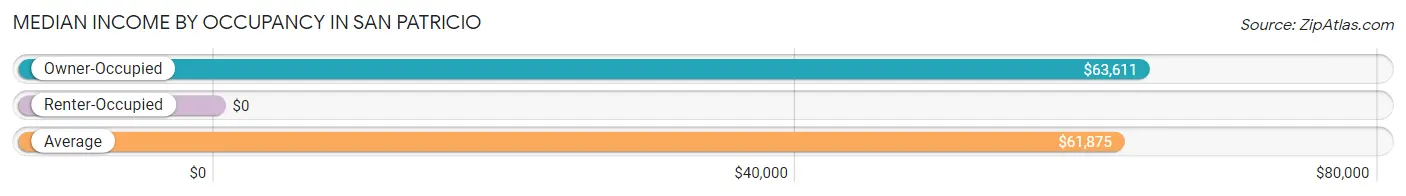
| Occupancy Type | # Households | Median Income |
| Owner-Occupied | 146 (87.4%) | $63,611 |
| Renter-Occupied | 21 (12.6%) | $0 |
| Average | 167 (100.0%) | $61,875 |
Occupancy by Householder Income Bracket in San Patricio
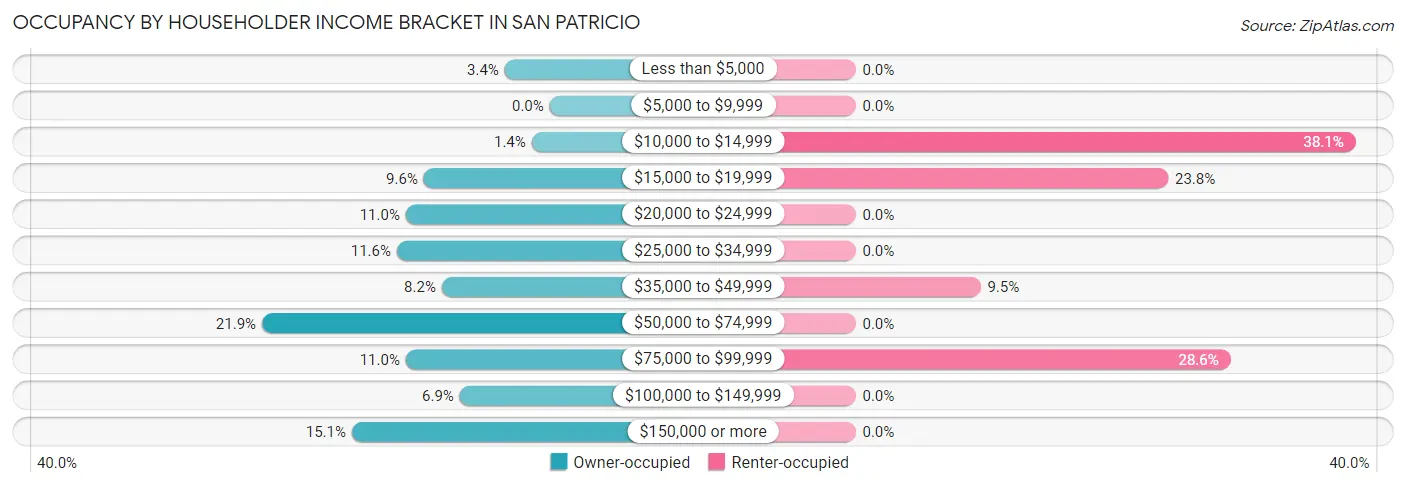
| Income Bracket | Owner-occupied | Renter-occupied |
| Less than $5,000 | 5 (3.4%) | 0 (0.0%) |
| $5,000 to $9,999 | 0 (0.0%) | 0 (0.0%) |
| $10,000 to $14,999 | 2 (1.4%) | 8 (38.1%) |
| $15,000 to $19,999 | 14 (9.6%) | 5 (23.8%) |
| $20,000 to $24,999 | 16 (11.0%) | 0 (0.0%) |
| $25,000 to $34,999 | 17 (11.6%) | 0 (0.0%) |
| $35,000 to $49,999 | 12 (8.2%) | 2 (9.5%) |
| $50,000 to $74,999 | 32 (21.9%) | 0 (0.0%) |
| $75,000 to $99,999 | 16 (11.0%) | 6 (28.6%) |
| $100,000 to $149,999 | 10 (6.9%) | 0 (0.0%) |
| $150,000 or more | 22 (15.1%) | 0 (0.0%) |
| Total | 146 (100.0%) | 21 (100.0%) |
Monthly Housing Cost Tiers in San Patricio
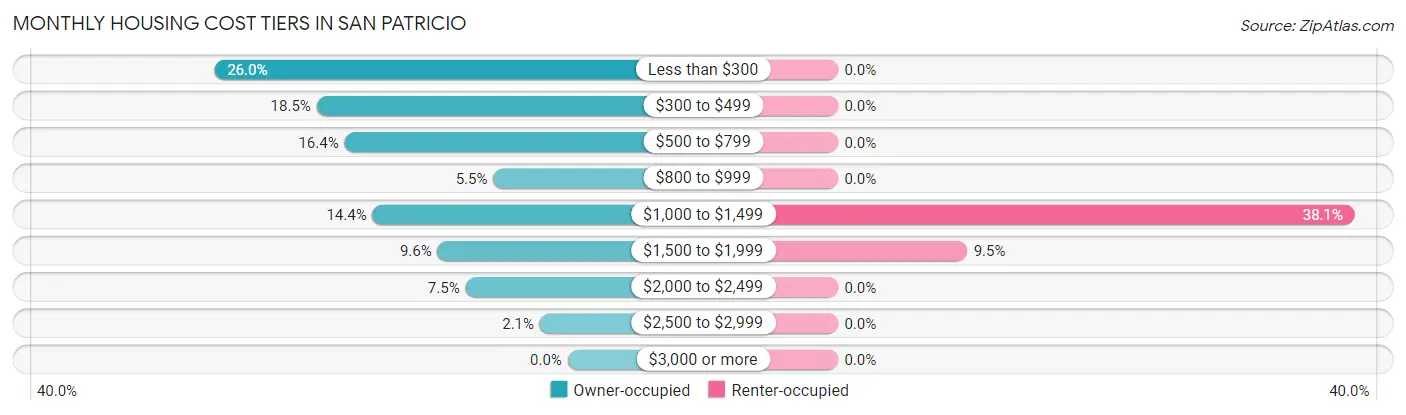
| Monthly Cost | Owner-occupied | Renter-occupied |
| Less than $300 | 38 (26.0%) | 0 (0.0%) |
| $300 to $499 | 27 (18.5%) | 0 (0.0%) |
| $500 to $799 | 24 (16.4%) | 0 (0.0%) |
| $800 to $999 | 8 (5.5%) | 0 (0.0%) |
| $1,000 to $1,499 | 21 (14.4%) | 8 (38.1%) |
| $1,500 to $1,999 | 14 (9.6%) | 2 (9.5%) |
| $2,000 to $2,499 | 11 (7.5%) | 0 (0.0%) |
| $2,500 to $2,999 | 3 (2.1%) | 0 (0.0%) |
| $3,000 or more | 0 (0.0%) | 0 (0.0%) |
| Total | 146 (100.0%) | 21 (100.0%) |
Physical Housing Characteristics in San Patricio
Housing Structures in San Patricio
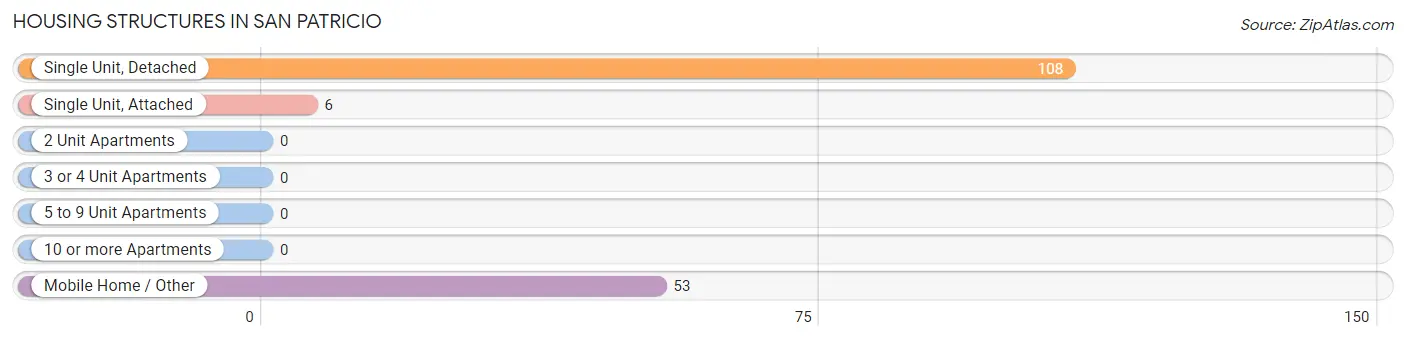
| Structure Type | # Housing Units | % Housing Units |
| Single Unit, Detached | 108 | 64.7% |
| Single Unit, Attached | 6 | 3.6% |
| 2 Unit Apartments | 0 | 0.0% |
| 3 or 4 Unit Apartments | 0 | 0.0% |
| 5 to 9 Unit Apartments | 0 | 0.0% |
| 10 or more Apartments | 0 | 0.0% |
| Mobile Home / Other | 53 | 31.7% |
| Total | 167 | 100.0% |
Housing Structures by Occupancy in San Patricio
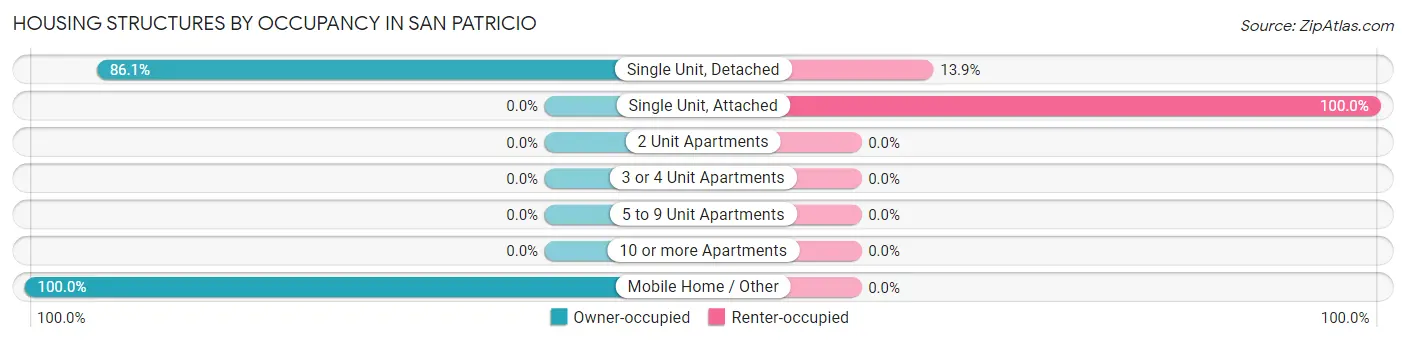
| Structure Type | Owner-occupied | Renter-occupied |
| Single Unit, Detached | 93 (86.1%) | 15 (13.9%) |
| Single Unit, Attached | 0 (0.0%) | 6 (100.0%) |
| 2 Unit Apartments | 0 (0.0%) | 0 (0.0%) |
| 3 or 4 Unit Apartments | 0 (0.0%) | 0 (0.0%) |
| 5 to 9 Unit Apartments | 0 (0.0%) | 0 (0.0%) |
| 10 or more Apartments | 0 (0.0%) | 0 (0.0%) |
| Mobile Home / Other | 53 (100.0%) | 0 (0.0%) |
| Total | 146 (87.4%) | 21 (12.6%) |
Housing Structures by Number of Rooms in San Patricio
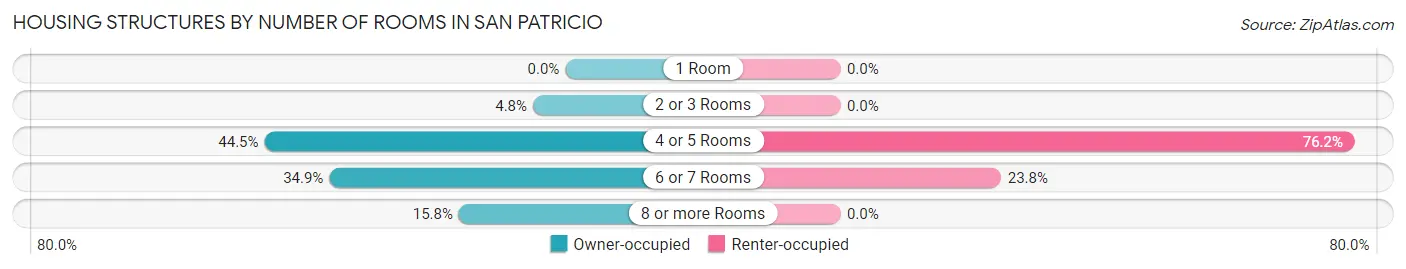
| Number of Rooms | Owner-occupied | Renter-occupied |
| 1 Room | 0 (0.0%) | 0 (0.0%) |
| 2 or 3 Rooms | 7 (4.8%) | 0 (0.0%) |
| 4 or 5 Rooms | 65 (44.5%) | 16 (76.2%) |
| 6 or 7 Rooms | 51 (34.9%) | 5 (23.8%) |
| 8 or more Rooms | 23 (15.8%) | 0 (0.0%) |
| Total | 146 (100.0%) | 21 (100.0%) |
Housing Structure by Heating Type in San Patricio
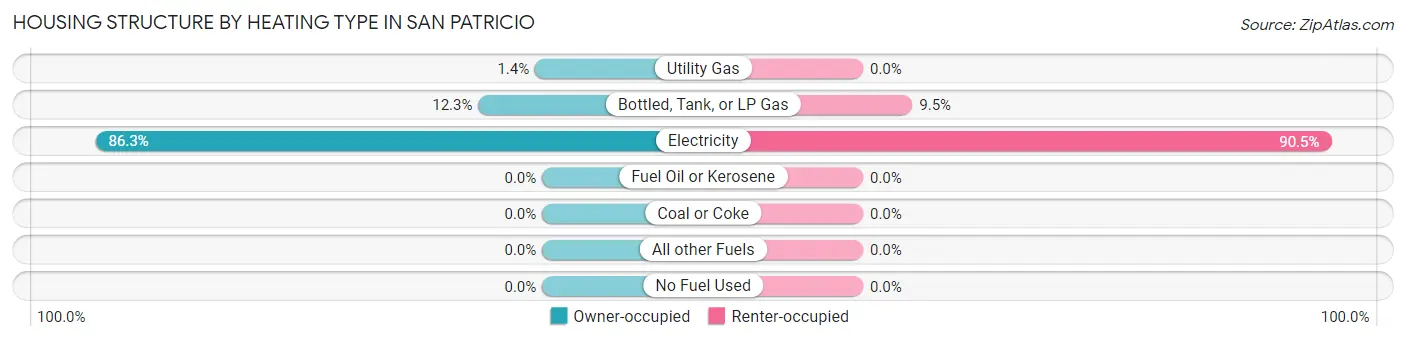
| Heating Type | Owner-occupied | Renter-occupied |
| Utility Gas | 2 (1.4%) | 0 (0.0%) |
| Bottled, Tank, or LP Gas | 18 (12.3%) | 2 (9.5%) |
| Electricity | 126 (86.3%) | 19 (90.5%) |
| Fuel Oil or Kerosene | 0 (0.0%) | 0 (0.0%) |
| Coal or Coke | 0 (0.0%) | 0 (0.0%) |
| All other Fuels | 0 (0.0%) | 0 (0.0%) |
| No Fuel Used | 0 (0.0%) | 0 (0.0%) |
| Total | 146 (100.0%) | 21 (100.0%) |
Household Vehicle Usage in San Patricio
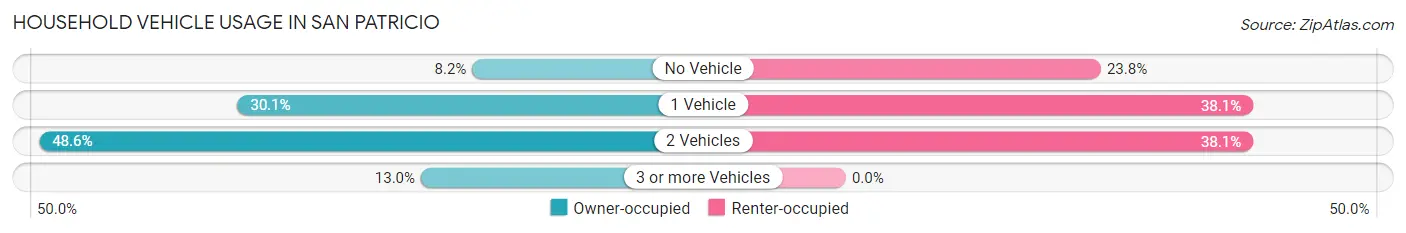
| Vehicles per Household | Owner-occupied | Renter-occupied |
| No Vehicle | 12 (8.2%) | 5 (23.8%) |
| 1 Vehicle | 44 (30.1%) | 8 (38.1%) |
| 2 Vehicles | 71 (48.6%) | 8 (38.1%) |
| 3 or more Vehicles | 19 (13.0%) | 0 (0.0%) |
| Total | 146 (100.0%) | 21 (100.0%) |
Real Estate & Mortgages in San Patricio
Real Estate and Mortgage Overview in San Patricio
| Characteristic | Without Mortgage | With Mortgage |
| Housing Units | 100 | 46 |
| Median Property Value | $75,000 | $216,700 |
| Median Household Income | $40,625 | $14 |
| Monthly Housing Costs | $424 | $0 |
| Real Estate Taxes | $880 | $0 |
Property Value by Mortgage Status in San Patricio
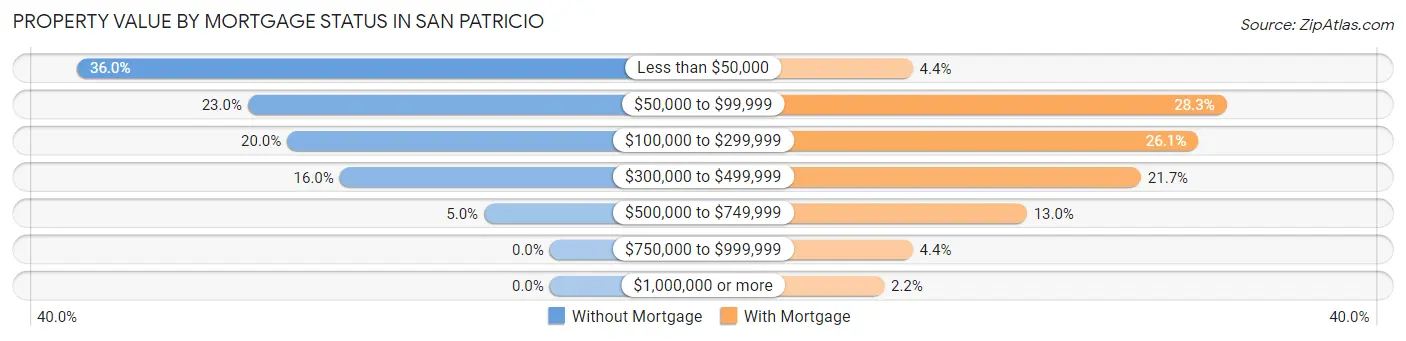
| Property Value | Without Mortgage | With Mortgage |
| Less than $50,000 | 36 (36.0%) | 2 (4.3%) |
| $50,000 to $99,999 | 23 (23.0%) | 13 (28.3%) |
| $100,000 to $299,999 | 20 (20.0%) | 12 (26.1%) |
| $300,000 to $499,999 | 16 (16.0%) | 10 (21.7%) |
| $500,000 to $749,999 | 5 (5.0%) | 6 (13.0%) |
| $750,000 to $999,999 | 0 (0.0%) | 2 (4.3%) |
| $1,000,000 or more | 0 (0.0%) | 1 (2.2%) |
| Total | 100 (100.0%) | 46 (100.0%) |
Household Income by Mortgage Status in San Patricio
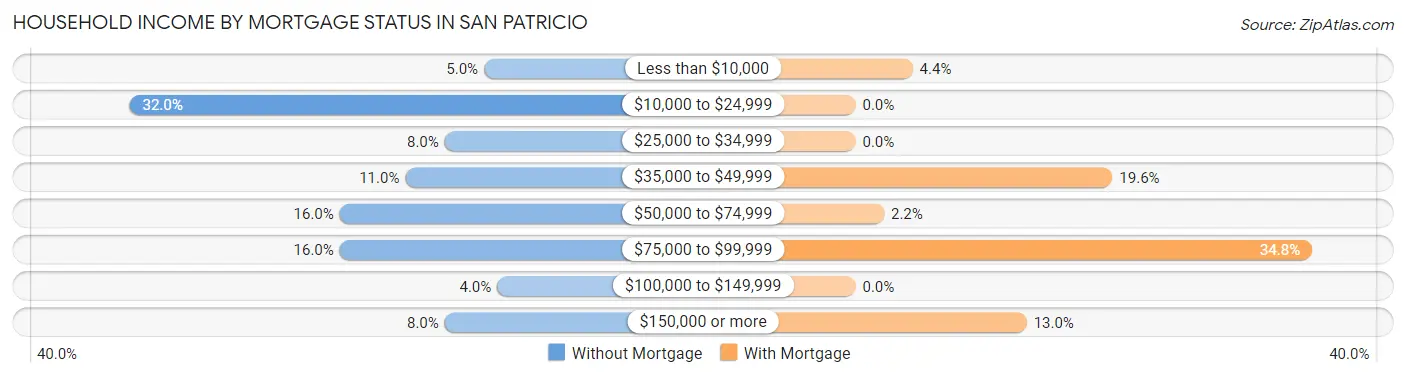
| Household Income | Without Mortgage | With Mortgage |
| Less than $10,000 | 5 (5.0%) | 2 (4.3%) |
| $10,000 to $24,999 | 32 (32.0%) | 0 (0.0%) |
| $25,000 to $34,999 | 8 (8.0%) | 0 (0.0%) |
| $35,000 to $49,999 | 11 (11.0%) | 9 (19.6%) |
| $50,000 to $74,999 | 16 (16.0%) | 1 (2.2%) |
| $75,000 to $99,999 | 16 (16.0%) | 16 (34.8%) |
| $100,000 to $149,999 | 4 (4.0%) | 0 (0.0%) |
| $150,000 or more | 8 (8.0%) | 6 (13.0%) |
| Total | 100 (100.0%) | 46 (100.0%) |
Property Value to Household Income Ratio in San Patricio
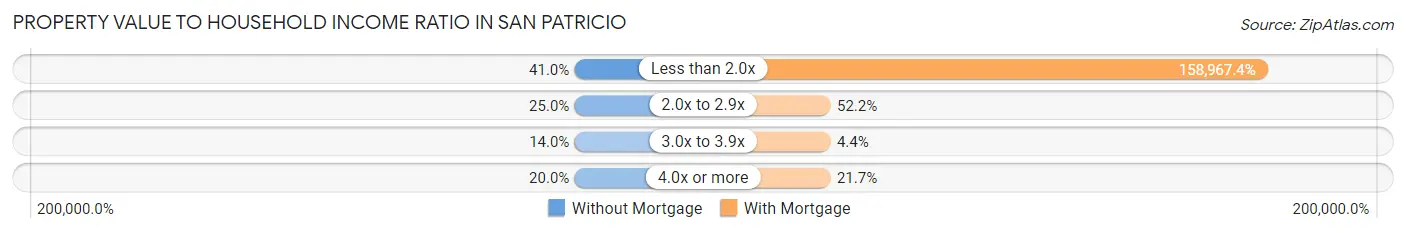
| Value-to-Income Ratio | Without Mortgage | With Mortgage |
| Less than 2.0x | 41 (41.0%) | 73,125 (158,967.4%) |
| 2.0x to 2.9x | 25 (25.0%) | 24 (52.2%) |
| 3.0x to 3.9x | 14 (14.0%) | 2 (4.3%) |
| 4.0x or more | 20 (20.0%) | 10 (21.7%) |
| Total | 100 (100.0%) | 46 (100.0%) |
Real Estate Taxes by Mortgage Status in San Patricio
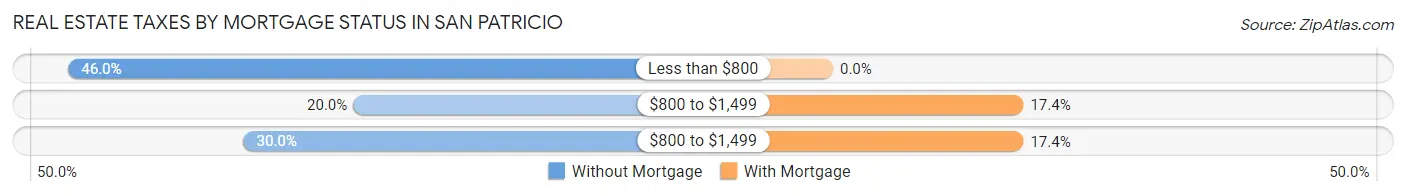
| Property Taxes | Without Mortgage | With Mortgage |
| Less than $800 | 46 (46.0%) | 0 (0.0%) |
| $800 to $1,499 | 20 (20.0%) | 8 (17.4%) |
| $800 to $1,499 | 30 (30.0%) | 8 (17.4%) |
| Total | 100 (100.0%) | 46 (100.0%) |
Health & Disability in San Patricio
Health Insurance Coverage by Age in San Patricio
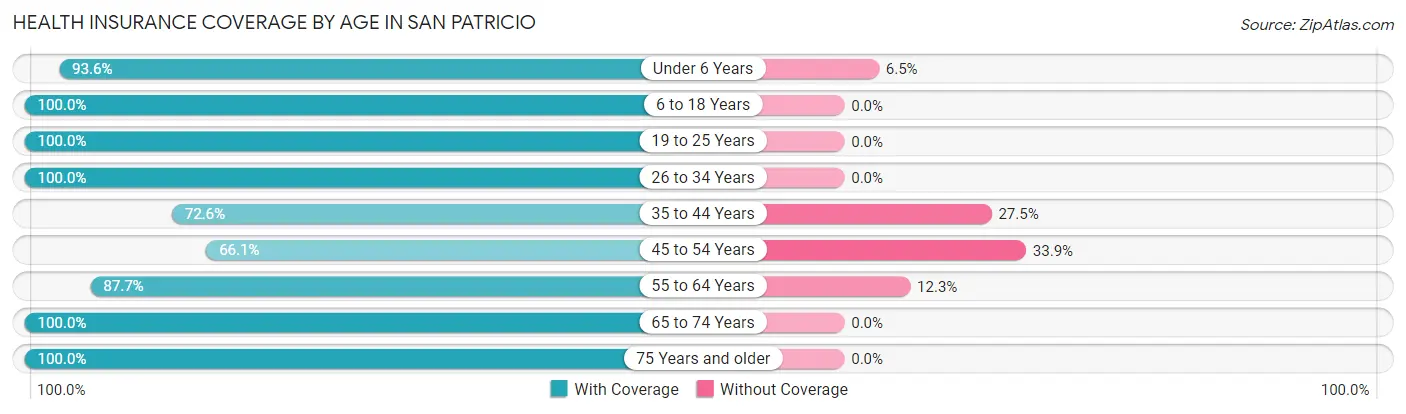
| Age Bracket | With Coverage | Without Coverage |
| Under 6 Years | 29 (93.5%) | 2 (6.5%) |
| 6 to 18 Years | 63 (100.0%) | 0 (0.0%) |
| 19 to 25 Years | 8 (100.0%) | 0 (0.0%) |
| 26 to 34 Years | 25 (100.0%) | 0 (0.0%) |
| 35 to 44 Years | 37 (72.6%) | 14 (27.5%) |
| 45 to 54 Years | 41 (66.1%) | 21 (33.9%) |
| 55 to 64 Years | 50 (87.7%) | 7 (12.3%) |
| 65 to 74 Years | 73 (100.0%) | 0 (0.0%) |
| 75 Years and older | 21 (100.0%) | 0 (0.0%) |
| Total | 347 (88.7%) | 44 (11.3%) |
Health Insurance Coverage by Citizenship Status in San Patricio

| Citizenship Status | With Coverage | Without Coverage |
| Native Born | 29 (93.5%) | 2 (6.5%) |
| Foreign Born, Citizen | 63 (100.0%) | 0 (0.0%) |
| Foreign Born, not a Citizen | 8 (100.0%) | 0 (0.0%) |
Health Insurance Coverage by Household Income in San Patricio
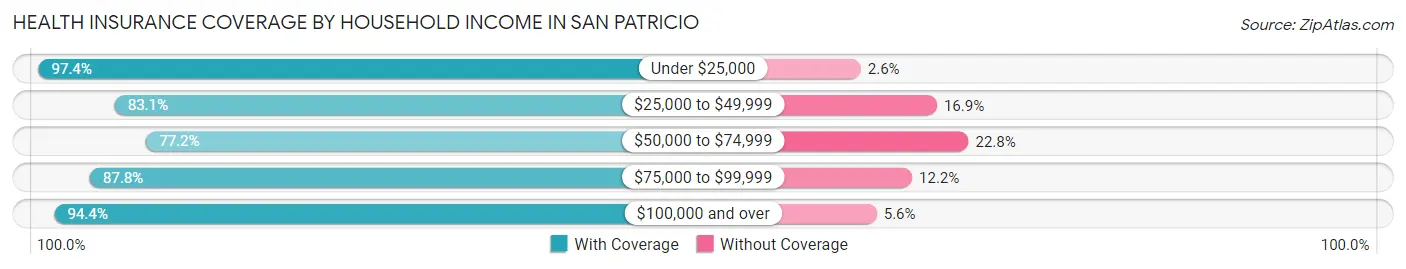
| Household Income | With Coverage | Without Coverage |
| Under $25,000 | 74 (97.4%) | 2 (2.6%) |
| $25,000 to $49,999 | 59 (83.1%) | 12 (16.9%) |
| $50,000 to $74,999 | 44 (77.2%) | 13 (22.8%) |
| $75,000 to $99,999 | 86 (87.8%) | 12 (12.2%) |
| $100,000 and over | 84 (94.4%) | 5 (5.6%) |
Public vs Private Health Insurance Coverage by Age in San Patricio
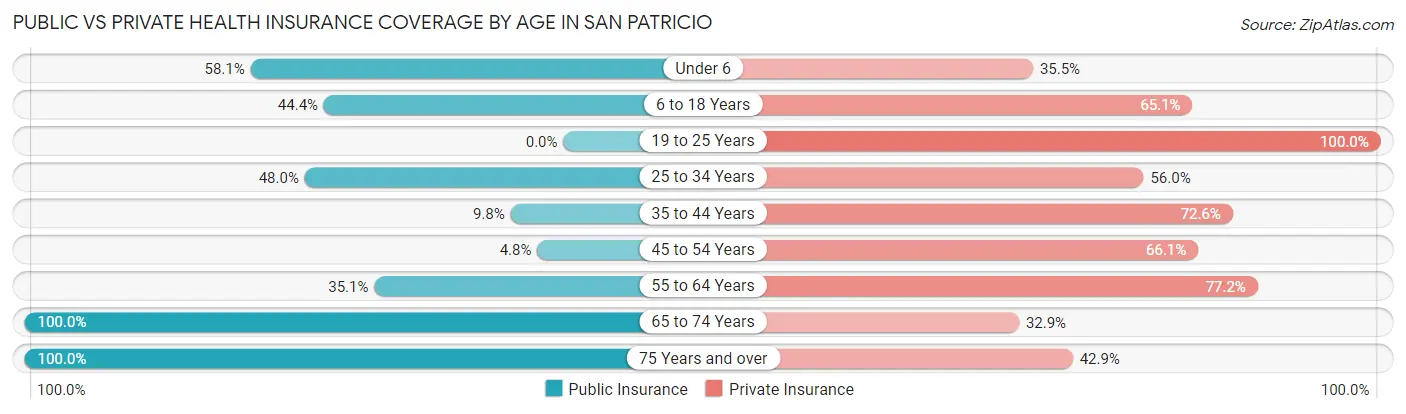
| Age Bracket | Public Insurance | Private Insurance |
| Under 6 | 18 (58.1%) | 11 (35.5%) |
| 6 to 18 Years | 28 (44.4%) | 41 (65.1%) |
| 19 to 25 Years | 0 (0.0%) | 8 (100.0%) |
| 25 to 34 Years | 12 (48.0%) | 14 (56.0%) |
| 35 to 44 Years | 5 (9.8%) | 37 (72.6%) |
| 45 to 54 Years | 3 (4.8%) | 41 (66.1%) |
| 55 to 64 Years | 20 (35.1%) | 44 (77.2%) |
| 65 to 74 Years | 73 (100.0%) | 24 (32.9%) |
| 75 Years and over | 21 (100.0%) | 9 (42.9%) |
| Total | 180 (46.0%) | 229 (58.6%) |
Disability Status by Sex by Age in San Patricio
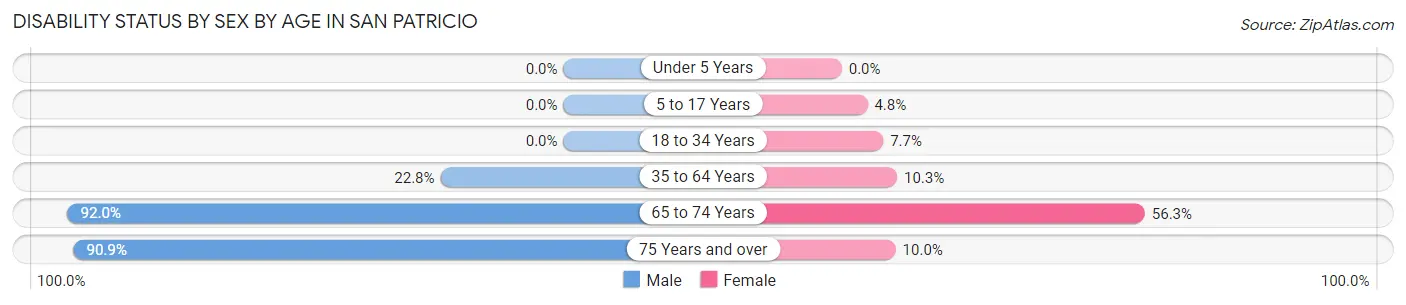
| Age Bracket | Male | Female |
| Under 5 Years | 0 (0.0%) | 0 (0.0%) |
| 5 to 17 Years | 0 (0.0%) | 2 (4.8%) |
| 18 to 34 Years | 0 (0.0%) | 2 (7.7%) |
| 35 to 64 Years | 21 (22.8%) | 8 (10.3%) |
| 65 to 74 Years | 23 (92.0%) | 27 (56.2%) |
| 75 Years and over | 10 (90.9%) | 1 (10.0%) |
Disability Class by Sex by Age in San Patricio
Disability Class: Hearing Difficulty
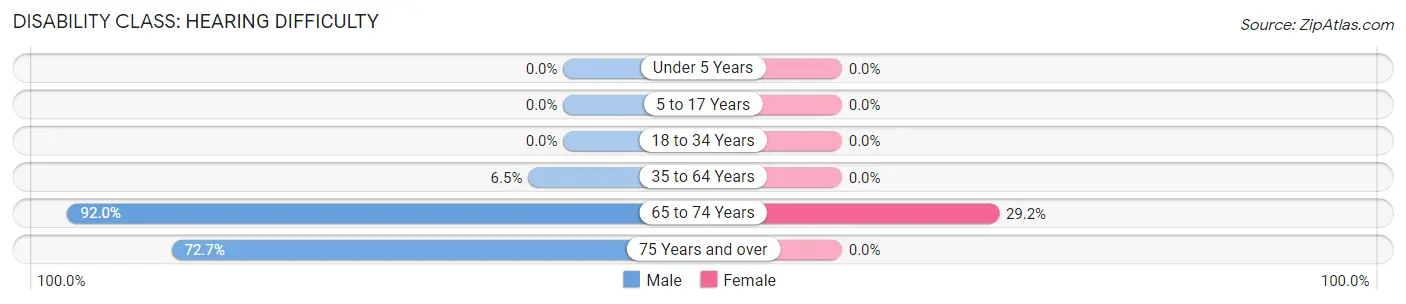
| Age Bracket | Male | Female |
| Under 5 Years | 0 (0.0%) | 0 (0.0%) |
| 5 to 17 Years | 0 (0.0%) | 0 (0.0%) |
| 18 to 34 Years | 0 (0.0%) | 0 (0.0%) |
| 35 to 64 Years | 6 (6.5%) | 0 (0.0%) |
| 65 to 74 Years | 23 (92.0%) | 14 (29.2%) |
| 75 Years and over | 8 (72.7%) | 0 (0.0%) |
Disability Class: Vision Difficulty
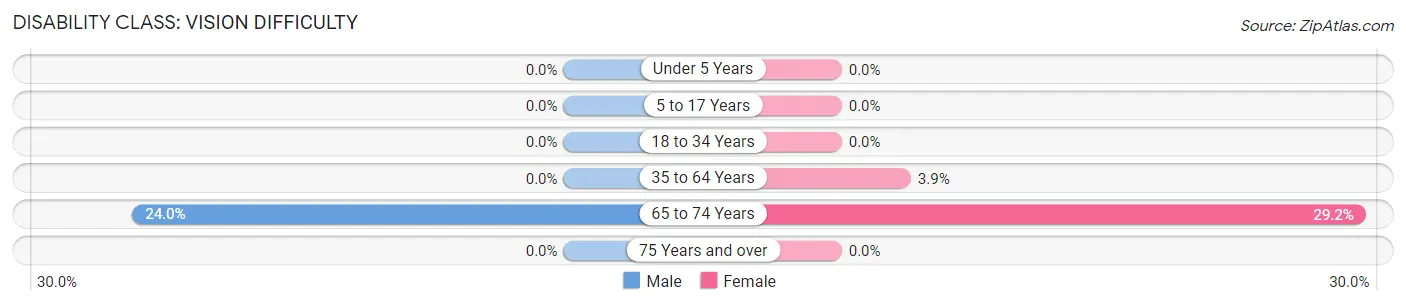
| Age Bracket | Male | Female |
| Under 5 Years | 0 (0.0%) | 0 (0.0%) |
| 5 to 17 Years | 0 (0.0%) | 0 (0.0%) |
| 18 to 34 Years | 0 (0.0%) | 0 (0.0%) |
| 35 to 64 Years | 0 (0.0%) | 3 (3.8%) |
| 65 to 74 Years | 6 (24.0%) | 14 (29.2%) |
| 75 Years and over | 0 (0.0%) | 0 (0.0%) |
Disability Class: Cognitive Difficulty
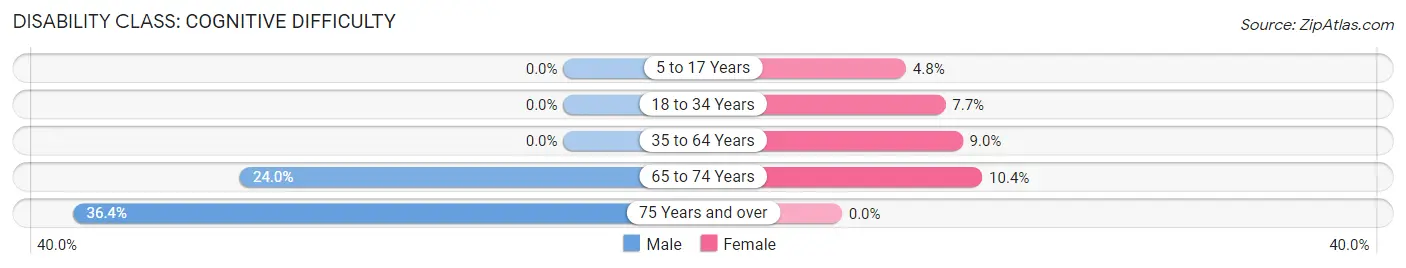
| Age Bracket | Male | Female |
| 5 to 17 Years | 0 (0.0%) | 2 (4.8%) |
| 18 to 34 Years | 0 (0.0%) | 2 (7.7%) |
| 35 to 64 Years | 0 (0.0%) | 7 (9.0%) |
| 65 to 74 Years | 6 (24.0%) | 5 (10.4%) |
| 75 Years and over | 4 (36.4%) | 0 (0.0%) |
Disability Class: Ambulatory Difficulty

| Age Bracket | Male | Female |
| 5 to 17 Years | 0 (0.0%) | 0 (0.0%) |
| 18 to 34 Years | 0 (0.0%) | 0 (0.0%) |
| 35 to 64 Years | 2 (2.2%) | 2 (2.6%) |
| 65 to 74 Years | 9 (36.0%) | 27 (56.2%) |
| 75 Years and over | 10 (90.9%) | 1 (10.0%) |
Disability Class: Self-Care Difficulty
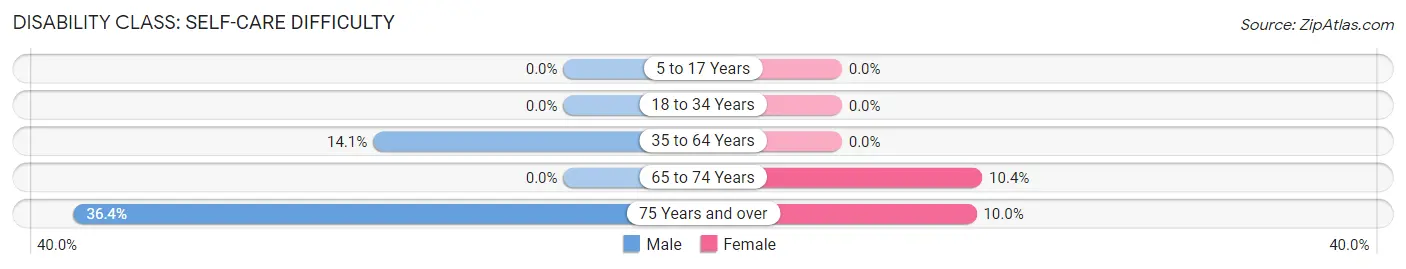
| Age Bracket | Male | Female |
| 5 to 17 Years | 0 (0.0%) | 0 (0.0%) |
| 18 to 34 Years | 0 (0.0%) | 0 (0.0%) |
| 35 to 64 Years | 13 (14.1%) | 0 (0.0%) |
| 65 to 74 Years | 0 (0.0%) | 5 (10.4%) |
| 75 Years and over | 4 (36.4%) | 1 (10.0%) |
Technology Access in San Patricio
Computing Device Access in San Patricio
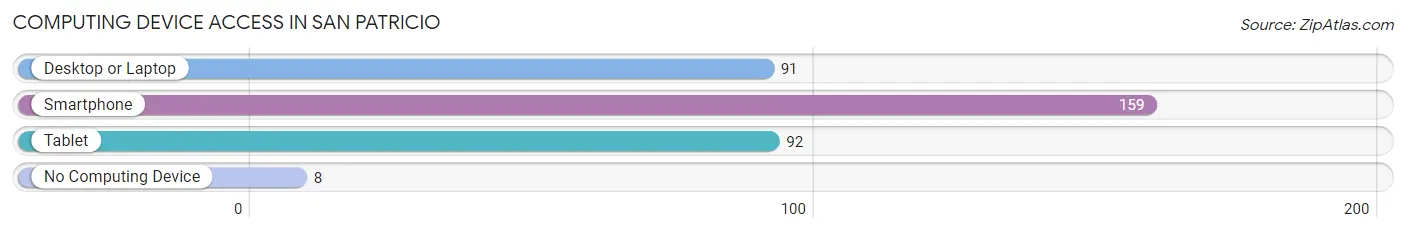
| Device Type | # Households | % Households |
| Desktop or Laptop | 91 | 54.5% |
| Smartphone | 159 | 95.2% |
| Tablet | 92 | 55.1% |
| No Computing Device | 8 | 4.8% |
| Total | 167 | 100.0% |
Internet Access in San Patricio
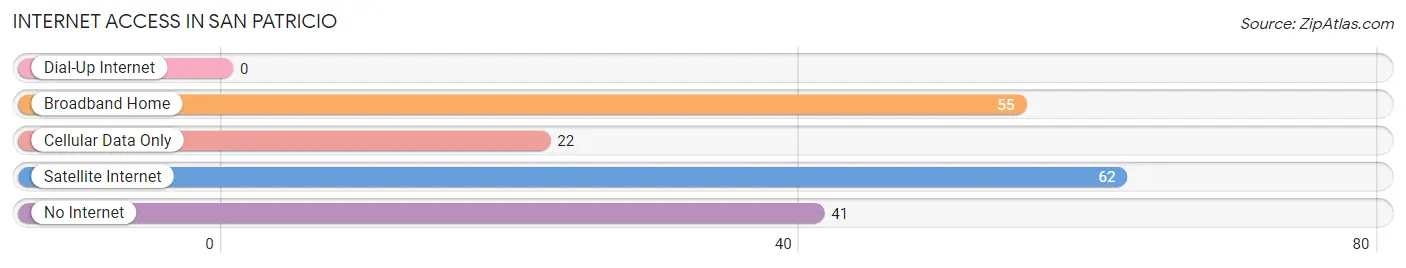
| Internet Type | # Households | % Households |
| Dial-Up Internet | 0 | 0.0% |
| Broadband Home | 55 | 32.9% |
| Cellular Data Only | 22 | 13.2% |
| Satellite Internet | 62 | 37.1% |
| No Internet | 41 | 24.5% |
| Total | 167 | 100.0% |
San Patricio Summary
San Patricio, Texas is a small town located in the Coastal Bend region of Texas. It is situated in Nueces County, approximately 30 miles south of Corpus Christi. The town was founded in 1852 and is named after Saint Patrick, the patron saint of Ireland. The population of San Patricio was estimated to be 2,945 in 2019.
History
San Patricio was founded in 1852 by Irish immigrants who had come to the area to work on the King Ranch. The town was originally called San Patricio de Hibernia, which translates to “Saint Patrick of Ireland”. The town was officially incorporated in 1876 and was named after the patron saint of Ireland.
The town was a major center for the cattle industry in the late 19th century. The King Ranch, which was founded in 1853, was the largest ranch in the world at the time and employed many of the town’s residents. The town was also home to several other large ranches, including the Santa Gertrudis, the San Patricio, and the San Antonio.
In the early 20th century, San Patricio began to diversify its economy. The town became a major center for the oil and gas industry, and several oil refineries were built in the area. The town also became a major center for the shrimp industry, and several shrimp processing plants were built in the area.
Geography
San Patricio is located in the Coastal Bend region of Texas, approximately 30 miles south of Corpus Christi. The town is situated on the banks of the Nueces River, which flows into the Gulf of Mexico. The town is surrounded by several small towns, including Sinton, Odem, and Taft.
The town has a humid subtropical climate, with hot summers and mild winters. The average annual temperature is 73°F (23°C), and the average annual precipitation is 33 inches (84 cm).
Economy
San Patricio’s economy is largely based on the oil and gas industry, as well as the shrimp industry. The town is home to several oil refineries, as well as several shrimp processing plants. The town is also home to several large ranches, including the King Ranch, the Santa Gertrudis, the San Patricio, and the San Antonio.
The town is also home to several small businesses, including restaurants, retail stores, and service providers. The town is also home to several tourist attractions, including the San Patricio County Historical Museum and the San Patricio County Courthouse.
Demographics
As of 2019, the population of San Patricio was estimated to be 2,945. The town has a diverse population, with a majority of the population being of Hispanic or Latino descent. The town also has a significant population of African Americans, as well as a small population of Native Americans.
The median household income in San Patricio is $41,945, and the median home value is $90,000. The town has a poverty rate of 17.3%, which is higher than the national average. The town also has a high unemployment rate of 8.2%.
Conclusion
San Patricio, Texas is a small town located in the Coastal Bend region of Texas. It was founded in 1852 by Irish immigrants and is named after Saint Patrick, the patron saint of Ireland. The town has a diverse population and is home to several large ranches, as well as several oil refineries and shrimp processing plants. The town’s economy is largely based on the oil and gas industry, as well as the shrimp industry. The town has a median household income of $41,945 and a median home value of $90,000. The town also has a high poverty rate and a high unemployment rate.
Common Questions
What is the Total Population of San Patricio?
Total Population of San Patricio is 391.
What is the Total Male Population of San Patricio?
Total Male Population of San Patricio is 173.
What is the Total Female Population of San Patricio?
Total Female Population of San Patricio is 218.
What is the Ratio of Males per 100 Females in San Patricio?
There are 79.36 Males per 100 Females in San Patricio.
What is the Ratio of Females per 100 Males in San Patricio?
There are 126.01 Females per 100 Males in San Patricio.
What is the Median Population Age in San Patricio?
Median Population Age in San Patricio is 50.2 Years.
What is the Average Family Size in San Patricio
Average Family Size in San Patricio is 2.8 People.
What is the Average Household Size in San Patricio
Average Household Size in San Patricio is 2.3 People.
What is Per Capita Income in San Patricio?
Per Capita income in San Patricio is $30,506.
What is the Median Family Income in San Patricio?
Median Family Income in San Patricio is $63,125.
What is the Median Household income in San Patricio?
Median Household Income in San Patricio is $61,875.
What is Income or Wage Gap in San Patricio?
Income or Wage Gap in San Patricio is 45.5%.
Women in San Patricio earn 54.5 cents for every dollar earned by a man.
What is Inequality or Gini Index in San Patricio?
Inequality or Gini Index in San Patricio is 0.44.
How Large is the Labor Force in San Patricio?
There are 145 People in the Labor Forcein in San Patricio.
What is the Percentage of People in the Labor Force in San Patricio?
47.7% of People are in the Labor Force in San Patricio.
What is the Unemployment Rate in San Patricio?
Unemployment Rate in San Patricio is 3.4%.