Roaring Springs, TX
Roaring Springs Map
Roaring Springs Overview
195
TOTAL POPULATION
84
MALE POPULATION
111
FEMALE POPULATION
75.68
MALES / 100 FEMALES
132.14
FEMALES / 100 MALES
61.0
MEDIAN AGE
3.5
AVG FAMILY SIZE
2.6
AVG HOUSEHOLD SIZE
$20,078
PER CAPITA INCOME
$37,857
AVG FAMILY INCOME
$36,071
AVG HOUSEHOLD INCOME
0.38
INEQUALITY / GINI INDEX
62
LABOR FORCE [ PEOPLE ]
32.6%
PERCENT IN LABOR FORCE
Roaring Springs Zip Codes
Roaring Springs Area Codes
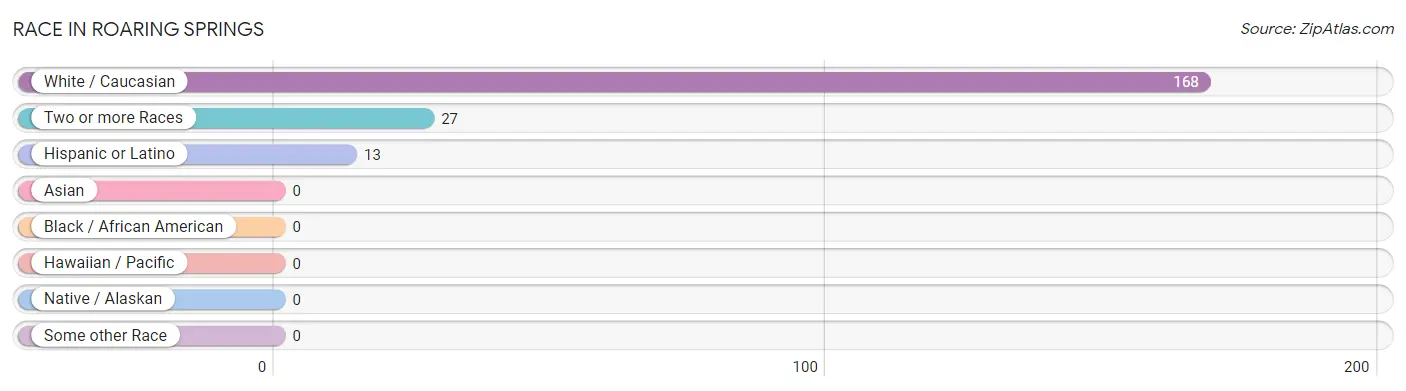
Race in Roaring Springs
The most populous races in Roaring Springs are White / Caucasian (168 | 86.2%), Two or more Races (27 | 13.9%), and Hispanic or Latino (13 | 6.7%).
| Race | # Population | % Population |
| Asian | 0 | 0.0% |
| Black / African American | 0 | 0.0% |
| Hawaiian / Pacific | 0 | 0.0% |
| Hispanic or Latino | 13 | 6.7% |
| Native / Alaskan | 0 | 0.0% |
| White / Caucasian | 168 | 86.2% |
| Two or more Races | 27 | 13.9% |
| Some other Race | 0 | 0.0% |
| Total | 195 | 100.0% |
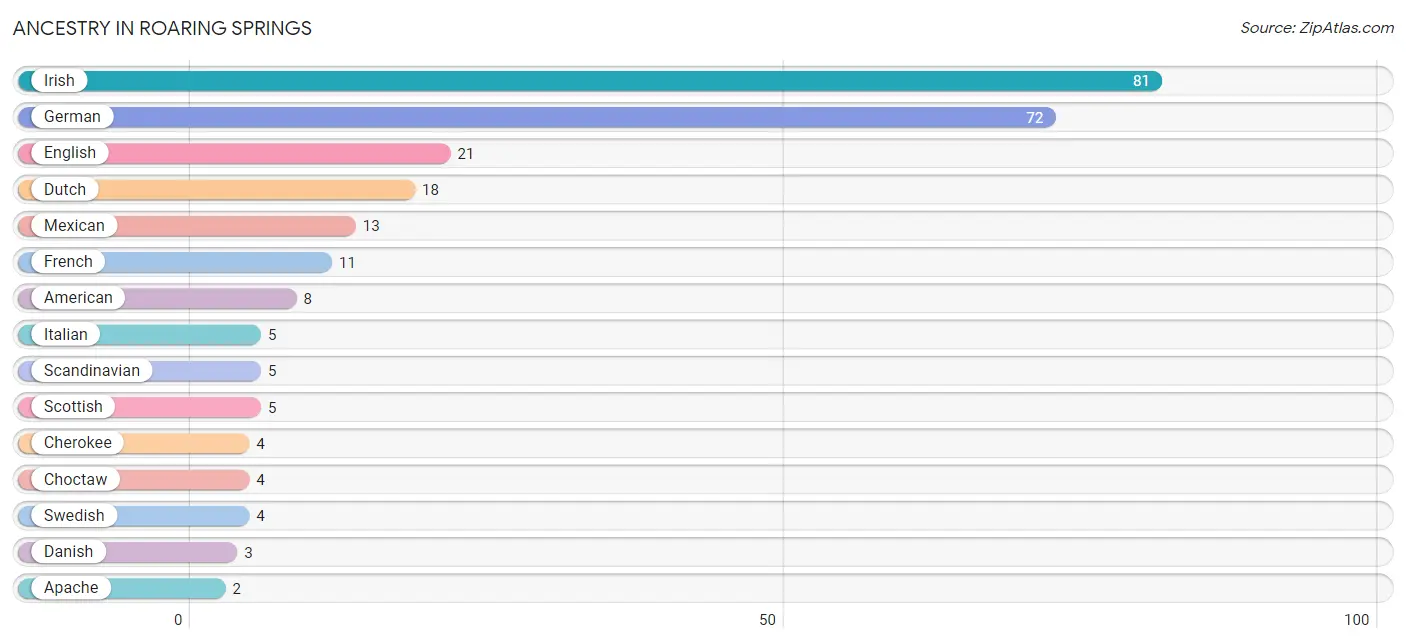
Ancestry in Roaring Springs
The most populous ancestries reported in Roaring Springs are Irish (81 | 41.5%), German (72 | 36.9%), English (21 | 10.8%), Dutch (18 | 9.2%), and Mexican (13 | 6.7%), together accounting for 105.1% of all Roaring Springs residents.
| Ancestry | # Population | % Population |
| American | 8 | 4.1% |
| Apache | 2 | 1.0% |
| British | 2 | 1.0% |
| Cherokee | 4 | 2.1% |
| Choctaw | 4 | 2.1% |
| Danish | 3 | 1.5% |
| Dutch | 18 | 9.2% |
| English | 21 | 10.8% |
| French | 11 | 5.6% |
| German | 72 | 36.9% |
| Irish | 81 | 41.5% |
| Italian | 5 | 2.6% |
| Mexican | 13 | 6.7% |
| Scandinavian | 5 | 2.6% |
| Scottish | 5 | 2.6% |
| Swedish | 4 | 2.1% | View All 16 Rows |
Immigrants in Roaring Springs

| Immigration Origin | # Population | % Population | View All 0 Rows |
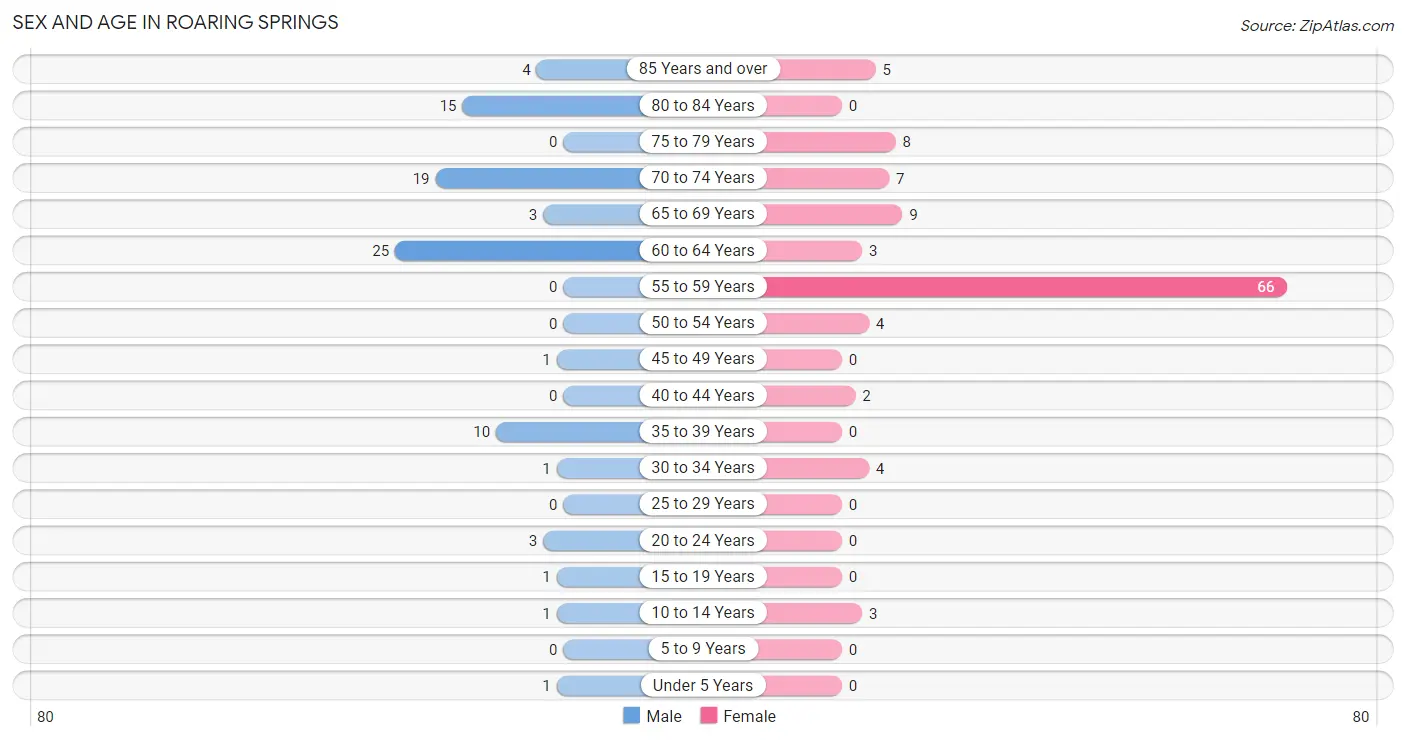
Sex and Age in Roaring Springs
Sex and Age in Roaring Springs
The most populous age groups in Roaring Springs are 60 to 64 Years (25 | 29.8%) for men and 55 to 59 Years (66 | 59.5%) for women.
| Age Bracket | Male | Female |
| Under 5 Years | 1 (1.2%) | 0 (0.0%) |
| 5 to 9 Years | 0 (0.0%) | 0 (0.0%) |
| 10 to 14 Years | 1 (1.2%) | 3 (2.7%) |
| 15 to 19 Years | 1 (1.2%) | 0 (0.0%) |
| 20 to 24 Years | 3 (3.6%) | 0 (0.0%) |
| 25 to 29 Years | 0 (0.0%) | 0 (0.0%) |
| 30 to 34 Years | 1 (1.2%) | 4 (3.6%) |
| 35 to 39 Years | 10 (11.9%) | 0 (0.0%) |
| 40 to 44 Years | 0 (0.0%) | 2 (1.8%) |
| 45 to 49 Years | 1 (1.2%) | 0 (0.0%) |
| 50 to 54 Years | 0 (0.0%) | 4 (3.6%) |
| 55 to 59 Years | 0 (0.0%) | 66 (59.5%) |
| 60 to 64 Years | 25 (29.8%) | 3 (2.7%) |
| 65 to 69 Years | 3 (3.6%) | 9 (8.1%) |
| 70 to 74 Years | 19 (22.6%) | 7 (6.3%) |
| 75 to 79 Years | 0 (0.0%) | 8 (7.2%) |
| 80 to 84 Years | 15 (17.9%) | 0 (0.0%) |
| 85 Years and over | 4 (4.8%) | 5 (4.5%) |
| Total | 84 (100.0%) | 111 (100.0%) |
Families and Households in Roaring Springs
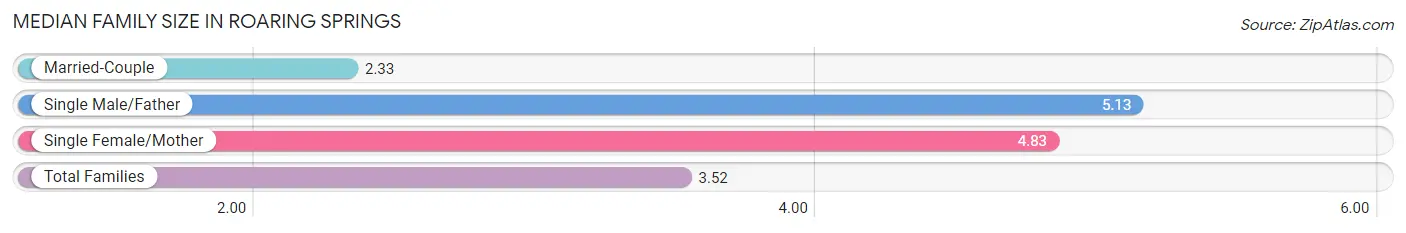
Median Family Size in Roaring Springs
The median family size in Roaring Springs is 3.52 persons per family, with single male/father families (15 | 31.2%) accounting for the largest median family size of 5.13 persons per family. On the other hand, married-couple families (27 | 56.2%) represent the smallest median family size with 2.33 persons per family.
| Family Type | # Families | Family Size |
| Married-Couple | 27 (56.2%) | 2.33 |
| Single Male/Father | 15 (31.2%) | 5.13 |
| Single Female/Mother | 6 (12.5%) | 4.83 |
| Total Families | 48 (100.0%) | 3.52 |
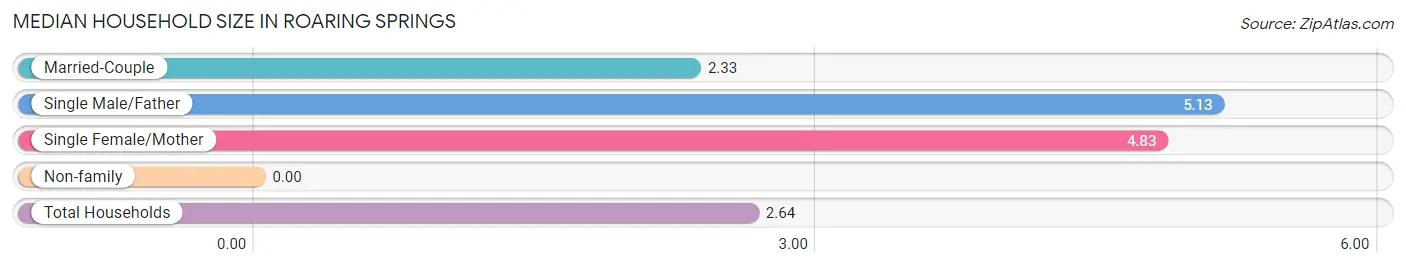
Median Household Size in Roaring Springs
| Household Type | # Households | Household Size |
| Married-Couple | 27 (36.5%) | 2.33 |
| Single Male/Father | 15 (20.3%) | 5.13 |
| Single Female/Mother | 6 (8.1%) | 4.83 |
| Non-family | 26 (35.1%) | - |
| Total Households | 74 (100.0%) | 2.64 |
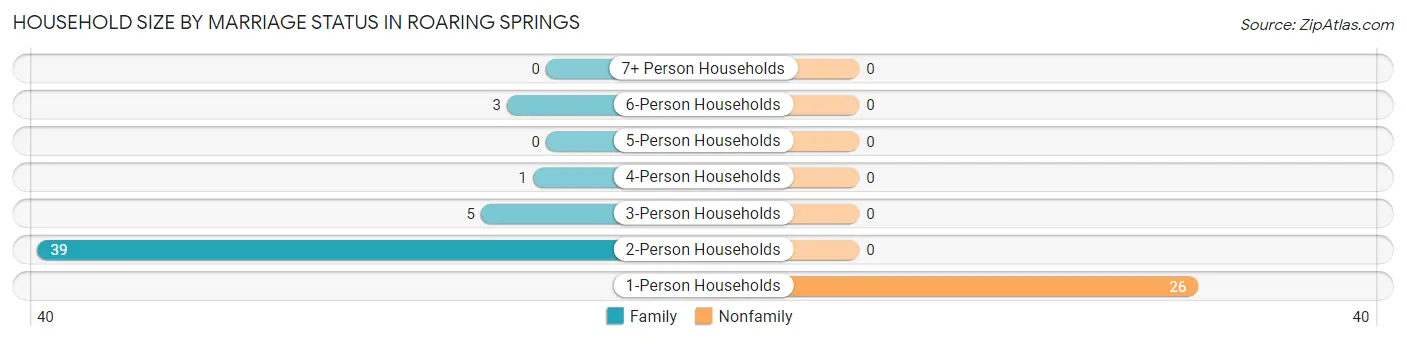
Household Size by Marriage Status in Roaring Springs
Out of a total of 74 households in Roaring Springs, 48 (64.9%) are family households, while 26 (35.1%) are nonfamily households. The most numerous type of family households are 2-person households, comprising 39, and the most common type of nonfamily households are 1-person households, comprising 26.
| Household Size | Family Households | Nonfamily Households |
| 1-Person Households | - | 26 (35.1%) |
| 2-Person Households | 39 (52.7%) | 0 (0.0%) |
| 3-Person Households | 5 (6.8%) | 0 (0.0%) |
| 4-Person Households | 1 (1.3%) | 0 (0.0%) |
| 5-Person Households | 0 (0.0%) | 0 (0.0%) |
| 6-Person Households | 3 (4.1%) | 0 (0.0%) |
| 7+ Person Households | 0 (0.0%) | 0 (0.0%) |
| Total | 48 (64.9%) | 26 (35.1%) |
Female Fertility in Roaring Springs
Fertility by Age in Roaring Springs
| Age Bracket | Women with Births | Births / 1,000 Women |
| 15 to 19 years | 0 (0.0%) | 0.0 |
| 20 to 34 years | 0 (0.0%) | 0.0 |
| 35 to 50 years | 0 (0.0%) | 0.0 |
| Total | 0 (0.0%) | 0.0 |
Fertility by Age by Marriage Status in Roaring Springs
| Age Bracket | Married | Unmarried |
| 15 to 19 years | 0 (0.0%) | 0 (0.0%) |
| 20 to 34 years | 0 (0.0%) | 0 (0.0%) |
| 35 to 50 years | 0 (0.0%) | 0 (0.0%) |
| Total | 0 (0.0%) | 0 (0.0%) |
Fertility by Education in Roaring Springs
| Educational Attainment | Women with Births | Births / 1,000 Women |
| Less than High School | 0 (0.0%) | 0.0 |
| High School Diploma | 0 (0.0%) | 0.0 |
| College or Associate's Degree | 0 (0.0%) | 0.0 |
| Bachelor's Degree | 0 (0.0%) | 0.0 |
| Graduate Degree | 0 (0.0%) | 0.0 |
| Total | 0 (0.0%) | 0.0 |
Fertility by Education by Marriage Status in Roaring Springs
| Educational Attainment | Married | Unmarried |
| Less than High School | 0 (0.0%) | 0 (0.0%) |
| High School Diploma | 0 (0.0%) | 0 (0.0%) |
| College or Associate's Degree | 0 (0.0%) | 0 (0.0%) |
| Bachelor's Degree | 0 (0.0%) | 0 (0.0%) |
| Graduate Degree | 0 (0.0%) | 0 (0.0%) |
| Total | 0 (0.0%) | 0 (0.0%) |
Income in Roaring Springs
Income Overview in Roaring Springs
Per Capita Income in Roaring Springs is $20,078, while median incomes of families and households are $37,857 and $36,071 respectively.
| Characteristic | Number | Measure |
| Per Capita Income | 195 | $20,078 |
| Median Family Income | 48 | $37,857 |
| Mean Family Income | 48 | $52,813 |
| Median Household Income | 74 | $36,071 |
| Mean Household Income | 74 | $42,449 |
| Income Deficit | 48 | $0 |
| Wage / Income Gap (%) | 195 | 0.00% |
| Wage / Income Gap ($) | 195 | 100.00¢ per $1 |
| Gini / Inequality Index | 195 | 0.38 |
Earnings by Sex in Roaring Springs
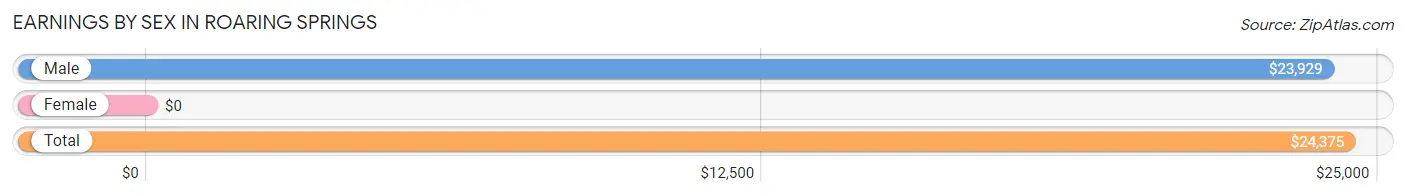
| Sex | Number | Average Earnings |
| Male | 46 (74.2%) | $23,929 |
| Female | 16 (25.8%) | $0 |
| Total | 62 (100.0%) | $24,375 |
Earnings by Sex by Income Bracket in Roaring Springs
The most common earnings brackets in Roaring Springs are $25,000 to $29,999 for men (14 | 30.4%) and $45,000 to $49,999 for women (4 | 25.0%).
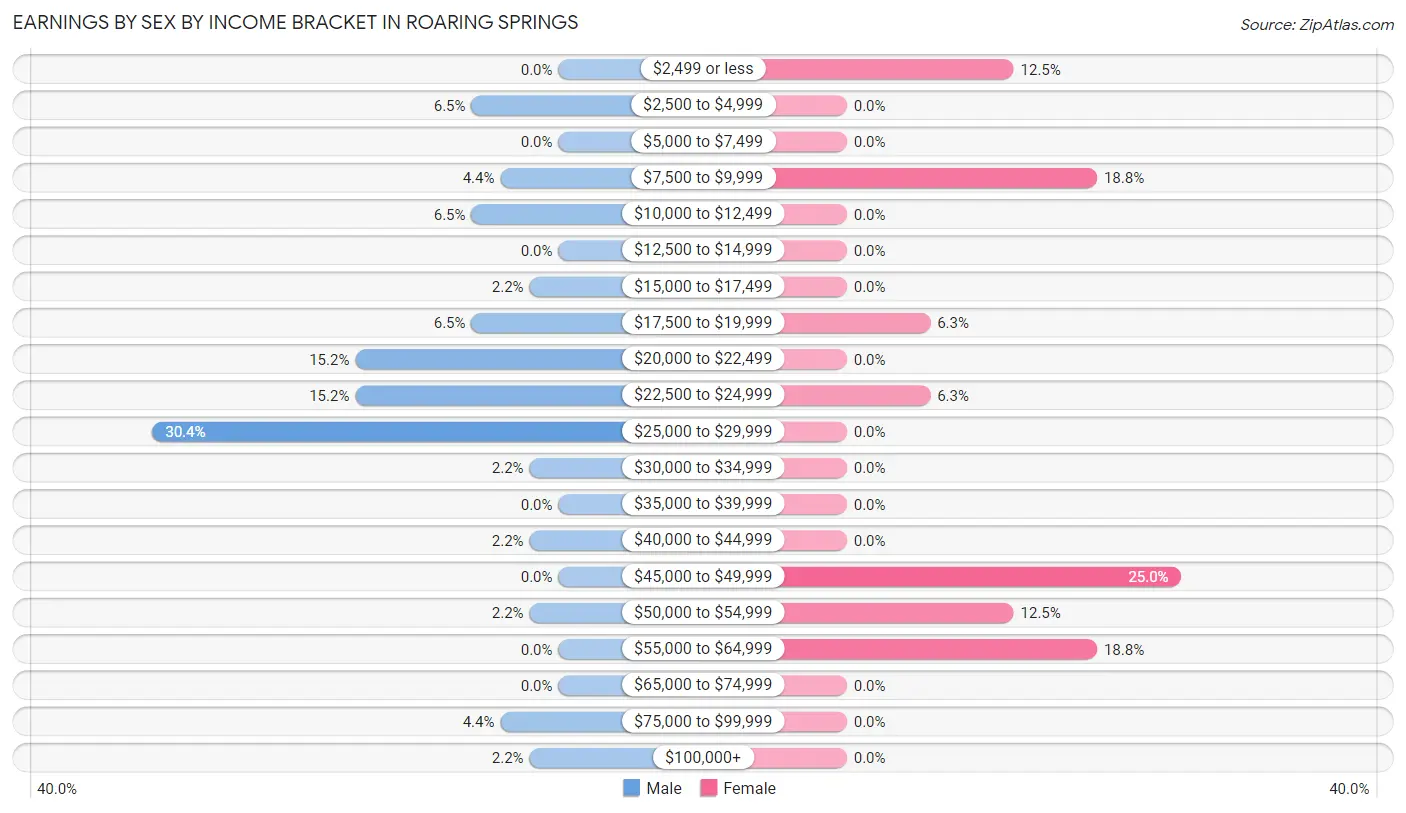
| Income | Male | Female |
| $2,499 or less | 0 (0.0%) | 2 (12.5%) |
| $2,500 to $4,999 | 3 (6.5%) | 0 (0.0%) |
| $5,000 to $7,499 | 0 (0.0%) | 0 (0.0%) |
| $7,500 to $9,999 | 2 (4.3%) | 3 (18.8%) |
| $10,000 to $12,499 | 3 (6.5%) | 0 (0.0%) |
| $12,500 to $14,999 | 0 (0.0%) | 0 (0.0%) |
| $15,000 to $17,499 | 1 (2.2%) | 0 (0.0%) |
| $17,500 to $19,999 | 3 (6.5%) | 1 (6.2%) |
| $20,000 to $22,499 | 7 (15.2%) | 0 (0.0%) |
| $22,500 to $24,999 | 7 (15.2%) | 1 (6.2%) |
| $25,000 to $29,999 | 14 (30.4%) | 0 (0.0%) |
| $30,000 to $34,999 | 1 (2.2%) | 0 (0.0%) |
| $35,000 to $39,999 | 0 (0.0%) | 0 (0.0%) |
| $40,000 to $44,999 | 1 (2.2%) | 0 (0.0%) |
| $45,000 to $49,999 | 0 (0.0%) | 4 (25.0%) |
| $50,000 to $54,999 | 1 (2.2%) | 2 (12.5%) |
| $55,000 to $64,999 | 0 (0.0%) | 3 (18.8%) |
| $65,000 to $74,999 | 0 (0.0%) | 0 (0.0%) |
| $75,000 to $99,999 | 2 (4.3%) | 0 (0.0%) |
| $100,000+ | 1 (2.2%) | 0 (0.0%) |
| Total | 46 (100.0%) | 16 (100.0%) |
Earnings by Sex by Educational Attainment in Roaring Springs
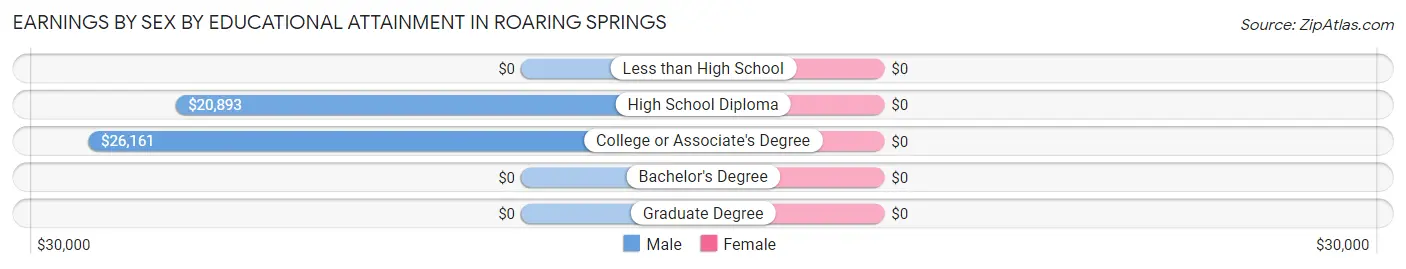
| Educational Attainment | Male Income | Female Income |
| Less than High School | - | - |
| High School Diploma | $20,893 | $0 |
| College or Associate's Degree | $26,161 | $0 |
| Bachelor's Degree | - | - |
| Graduate Degree | - | - |
| Total | $24,464 | $0 |
Family Income in Roaring Springs
Family Income Brackets in Roaring Springs
According to the Roaring Springs family income data, there are 24 families falling into the $35,000 to $49,999 income range, which is the most common income bracket and makes up 50.0% of all families.
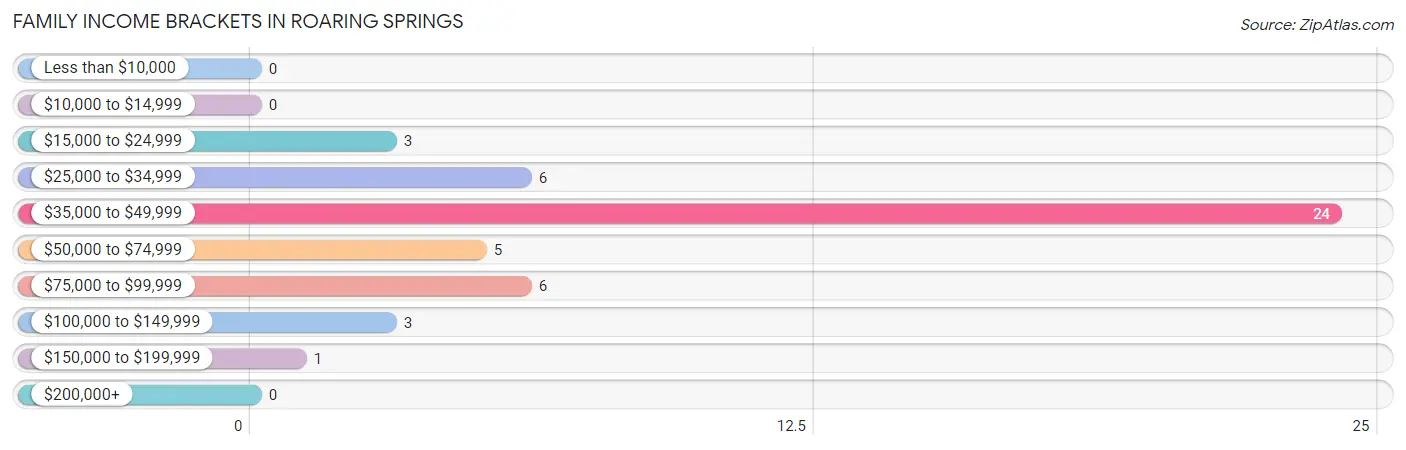
| Income Bracket | # Families | % Families |
| Less than $10,000 | 0 | 0.0% |
| $10,000 to $14,999 | 0 | 0.0% |
| $15,000 to $24,999 | 3 | 6.3% |
| $25,000 to $34,999 | 6 | 12.5% |
| $35,000 to $49,999 | 24 | 50.0% |
| $50,000 to $74,999 | 5 | 10.4% |
| $75,000 to $99,999 | 6 | 12.5% |
| $100,000 to $149,999 | 3 | 6.3% |
| $150,000 to $199,999 | 1 | 2.1% |
| $200,000+ | 0 | 0.0% |
Family Income by Famaliy Size in Roaring Springs
2-person families (39 | 81.2%) account for the highest median family income in Roaring Springs with $37,232 per family, while 2-person families (39 | 81.2%) have the highest median income of $18,616 per family member.
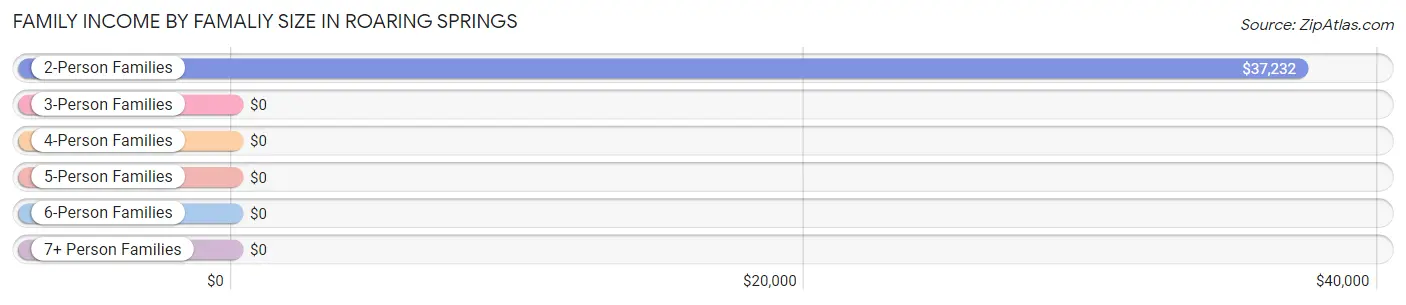
| Income Bracket | # Families | Median Income |
| 2-Person Families | 39 (81.2%) | $37,232 |
| 3-Person Families | 5 (10.4%) | $0 |
| 4-Person Families | 1 (2.1%) | $0 |
| 5-Person Families | 0 (0.0%) | $0 |
| 6-Person Families | 3 (6.2%) | $0 |
| 7+ Person Families | 0 (0.0%) | $0 |
| Total | 48 (100.0%) | $37,857 |
Family Income by Number of Earners in Roaring Springs
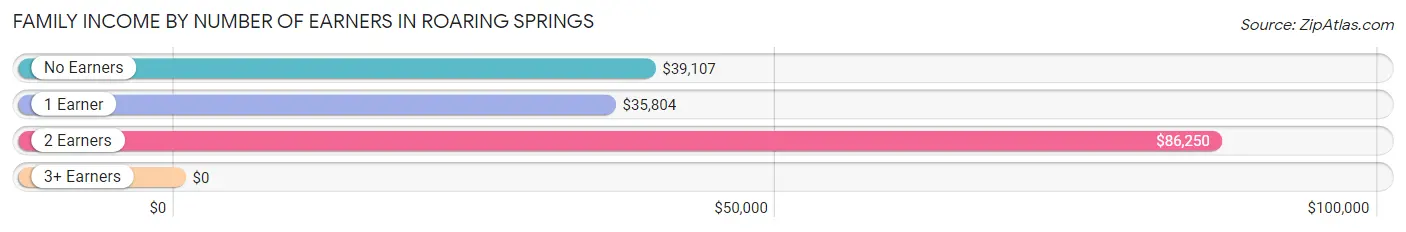
| Number of Earners | # Families | Median Income |
| No Earners | 15 (31.2%) | $39,107 |
| 1 Earner | 21 (43.8%) | $35,804 |
| 2 Earners | 9 (18.8%) | $86,250 |
| 3+ Earners | 3 (6.2%) | $0 |
| Total | 48 (100.0%) | $37,857 |
Household Income in Roaring Springs
Household Income Brackets in Roaring Springs
With 26 households falling in the category, the $35,000 to $49,999 income range is the most frequent in Roaring Springs, accounting for 35.1% of all households.
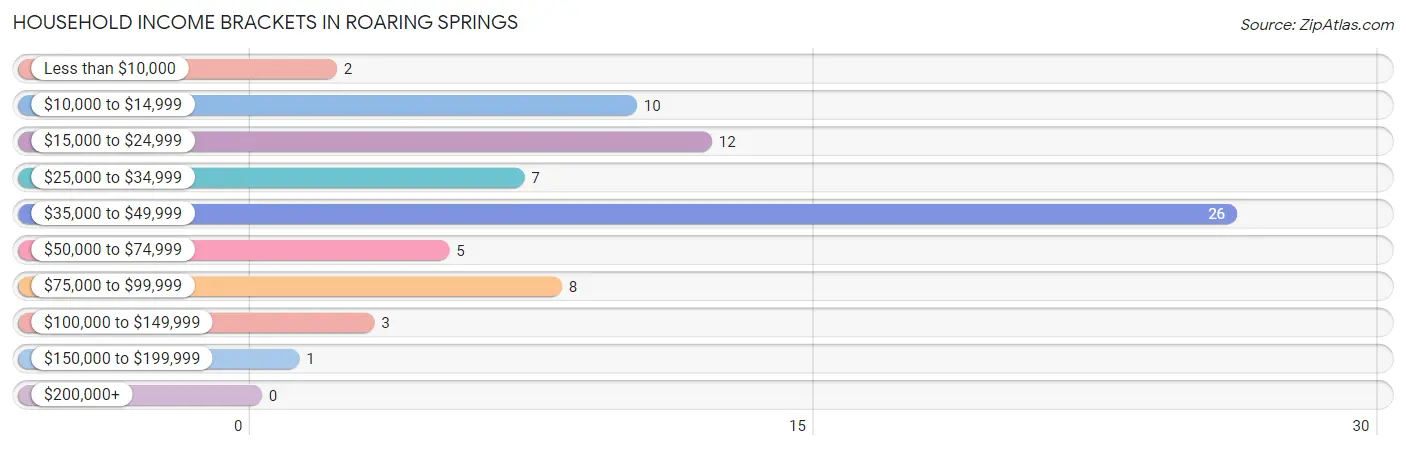
| Income Bracket | # Households | % Households |
| Less than $10,000 | 2 | 2.7% |
| $10,000 to $14,999 | 10 | 13.5% |
| $15,000 to $24,999 | 12 | 16.2% |
| $25,000 to $34,999 | 7 | 9.5% |
| $35,000 to $49,999 | 26 | 35.1% |
| $50,000 to $74,999 | 5 | 6.8% |
| $75,000 to $99,999 | 8 | 10.8% |
| $100,000 to $149,999 | 3 | 4.1% |
| $150,000 to $199,999 | 1 | 1.4% |
| $200,000+ | 0 | 0.0% |
Household Income by Householder Age in Roaring Springs
The median household income in Roaring Springs is $36,071, with the highest median household income of $36,786 found in the 45 to 64 years age bracket for the primary householder. A total of 28 households (37.8%) fall into this category.
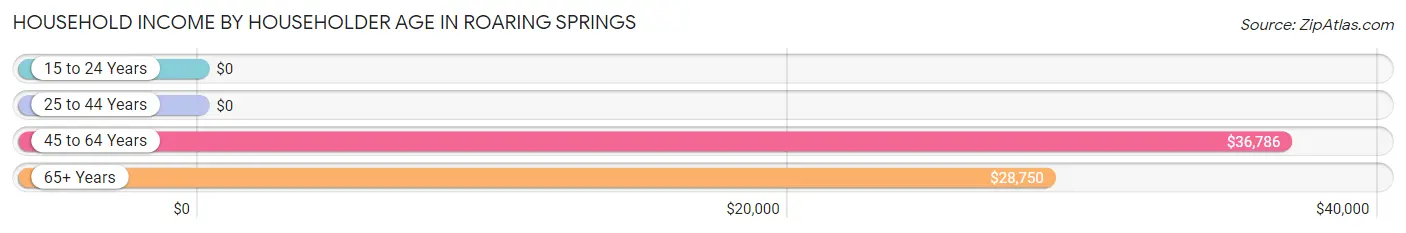
| Income Bracket | # Households | Median Income |
| 15 to 24 Years | 0 (0.0%) | $0 |
| 25 to 44 Years | 4 (5.4%) | $0 |
| 45 to 64 Years | 28 (37.8%) | $36,786 |
| 65+ Years | 42 (56.8%) | $28,750 |
| Total | 74 (100.0%) | $36,071 |
Poverty in Roaring Springs
Income Below Poverty by Sex and Age in Roaring Springs
With 2.4% poverty level for males and 4.5% for females among the residents of Roaring Springs, 65 to 74 year old males and 65 to 74 year old females are the most vulnerable to poverty, with 2 males (9.1%) and 2 females (12.5%) in their respective age groups living below the poverty level.
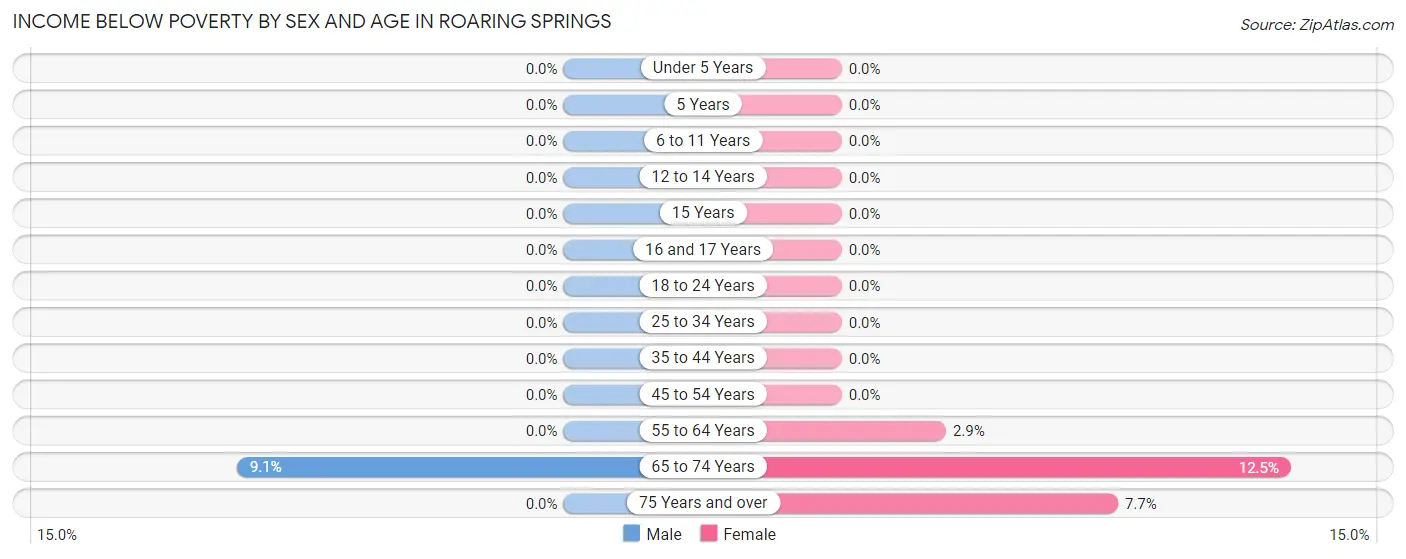
| Age Bracket | Male | Female |
| Under 5 Years | 0 (0.0%) | 0 (0.0%) |
| 5 Years | 0 (0.0%) | 0 (0.0%) |
| 6 to 11 Years | 0 (0.0%) | 0 (0.0%) |
| 12 to 14 Years | 0 (0.0%) | 0 (0.0%) |
| 15 Years | 0 (0.0%) | 0 (0.0%) |
| 16 and 17 Years | 0 (0.0%) | 0 (0.0%) |
| 18 to 24 Years | 0 (0.0%) | 0 (0.0%) |
| 25 to 34 Years | 0 (0.0%) | 0 (0.0%) |
| 35 to 44 Years | 0 (0.0%) | 0 (0.0%) |
| 45 to 54 Years | 0 (0.0%) | 0 (0.0%) |
| 55 to 64 Years | 0 (0.0%) | 2 (2.9%) |
| 65 to 74 Years | 2 (9.1%) | 2 (12.5%) |
| 75 Years and over | 0 (0.0%) | 1 (7.7%) |
| Total | 2 (2.4%) | 5 (4.5%) |
Income Above Poverty by Sex and Age in Roaring Springs
According to the poverty statistics in Roaring Springs, males aged under 5 years and females aged 6 to 11 years are the age groups that are most secure financially, with 100.0% of males and 100.0% of females in these age groups living above the poverty line.
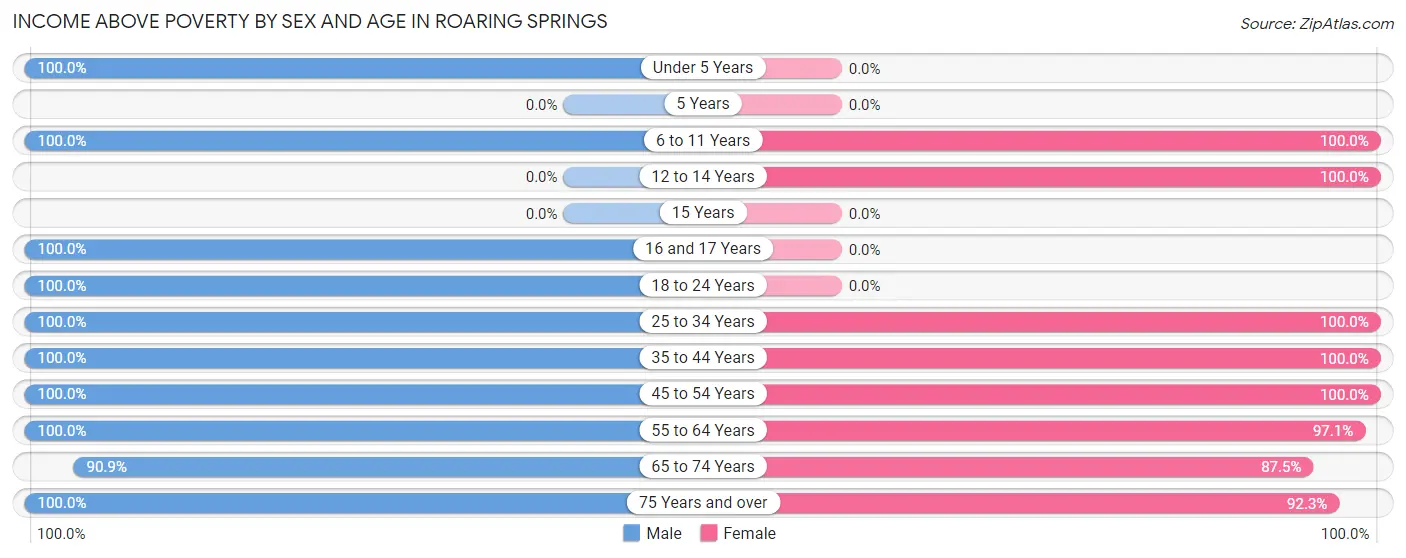
| Age Bracket | Male | Female |
| Under 5 Years | 1 (100.0%) | 0 (0.0%) |
| 5 Years | 0 (0.0%) | 0 (0.0%) |
| 6 to 11 Years | 1 (100.0%) | 1 (100.0%) |
| 12 to 14 Years | 0 (0.0%) | 2 (100.0%) |
| 15 Years | 0 (0.0%) | 0 (0.0%) |
| 16 and 17 Years | 1 (100.0%) | 0 (0.0%) |
| 18 to 24 Years | 3 (100.0%) | 0 (0.0%) |
| 25 to 34 Years | 1 (100.0%) | 4 (100.0%) |
| 35 to 44 Years | 10 (100.0%) | 2 (100.0%) |
| 45 to 54 Years | 1 (100.0%) | 4 (100.0%) |
| 55 to 64 Years | 25 (100.0%) | 67 (97.1%) |
| 65 to 74 Years | 20 (90.9%) | 14 (87.5%) |
| 75 Years and over | 19 (100.0%) | 12 (92.3%) |
| Total | 82 (97.6%) | 106 (95.5%) |
Income Below Poverty Among Married-Couple Families in Roaring Springs
| Children | Above Poverty | Below Poverty |
| No Children | 24 (100.0%) | 0 (0.0%) |
| 1 or 2 Children | 3 (100.0%) | 0 (0.0%) |
| 3 or 4 Children | 0 (0.0%) | 0 (0.0%) |
| 5 or more Children | 0 (0.0%) | 0 (0.0%) |
| Total | 27 (100.0%) | 0 (0.0%) |
Income Below Poverty Among Single-Parent Households in Roaring Springs
| Children | Single Father | Single Mother |
| No Children | 0 (0.0%) | 0 (0.0%) |
| 1 or 2 Children | 0 (0.0%) | 0 (0.0%) |
| 3 or 4 Children | 0 (0.0%) | 0 (0.0%) |
| 5 or more Children | 0 (0.0%) | 0 (0.0%) |
| Total | 0 (0.0%) | 0 (0.0%) |
Income Below Poverty Among Married-Couple vs Single-Parent Households in Roaring Springs
| Children | Married-Couple Families | Single-Parent Households |
| No Children | 0 (0.0%) | 0 (0.0%) |
| 1 or 2 Children | 0 (0.0%) | 0 (0.0%) |
| 3 or 4 Children | 0 (0.0%) | 0 (0.0%) |
| 5 or more Children | 0 (0.0%) | 0 (0.0%) |
| Total | 0 (0.0%) | 0 (0.0%) |
Employment Characteristics in Roaring Springs
Employment by Class of Employer in Roaring Springs
Among the 59 employed individuals in Roaring Springs, private company employees (34 | 57.6%), not-for-profit organizations (9 | 15.2%), and self-employed (not incorporated) (8 | 13.6%) make up the most common classes of employment.
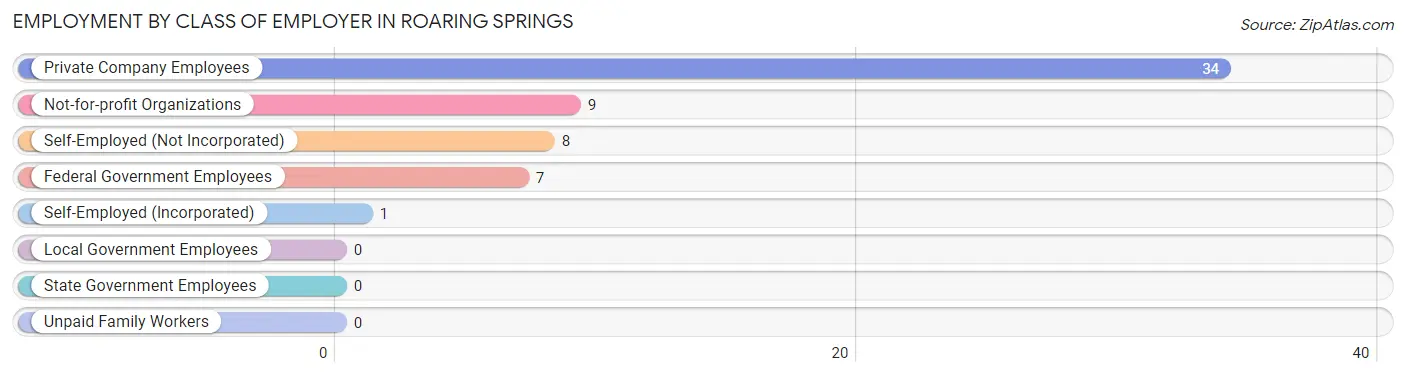
| Employer Class | # Employees | % Employees |
| Private Company Employees | 34 | 57.6% |
| Self-Employed (Incorporated) | 1 | 1.7% |
| Self-Employed (Not Incorporated) | 8 | 13.6% |
| Not-for-profit Organizations | 9 | 15.2% |
| Local Government Employees | 0 | 0.0% |
| State Government Employees | 0 | 0.0% |
| Federal Government Employees | 7 | 11.9% |
| Unpaid Family Workers | 0 | 0.0% |
| Total | 59 | 100.0% |
Employment Status by Age in Roaring Springs
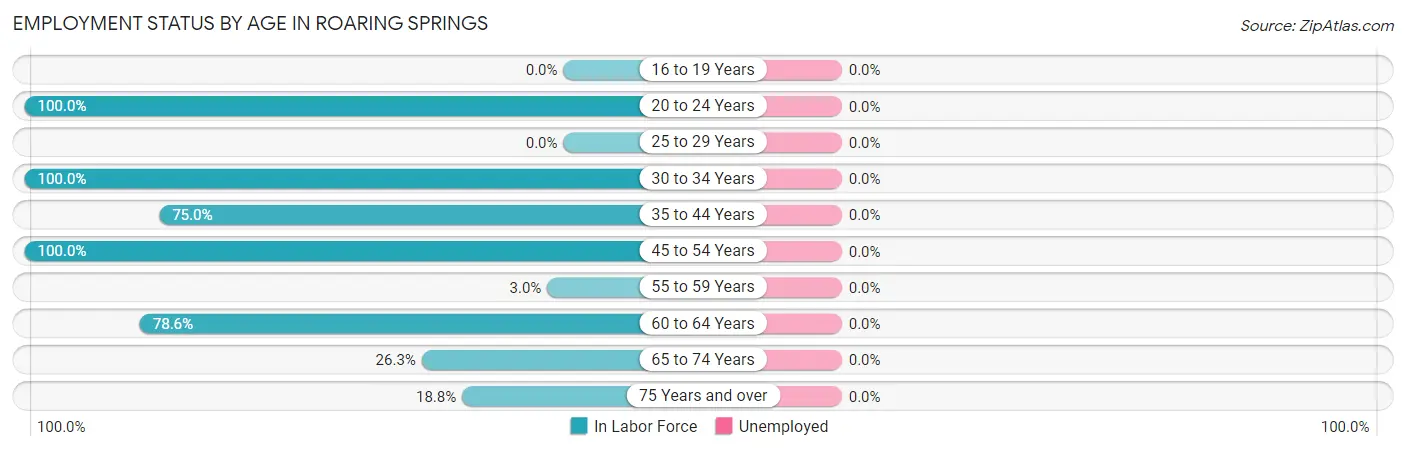
| Age Bracket | In Labor Force | Unemployed |
| 16 to 19 Years | 0 (0.0%) | 0 (0.0%) |
| 20 to 24 Years | 3 (100.0%) | 0 (0.0%) |
| 25 to 29 Years | 0 (0.0%) | 0 (0.0%) |
| 30 to 34 Years | 5 (100.0%) | 0 (0.0%) |
| 35 to 44 Years | 9 (75.0%) | 0 (0.0%) |
| 45 to 54 Years | 5 (100.0%) | 0 (0.0%) |
| 55 to 59 Years | 2 (3.0%) | 0 (0.0%) |
| 60 to 64 Years | 22 (78.6%) | 0 (0.0%) |
| 65 to 74 Years | 10 (26.3%) | 0 (0.0%) |
| 75 Years and over | 6 (18.8%) | 0 (0.0%) |
| Total | 62 (32.6%) | 0 (0.0%) |
Employment Status by Educational Attainment in Roaring Springs
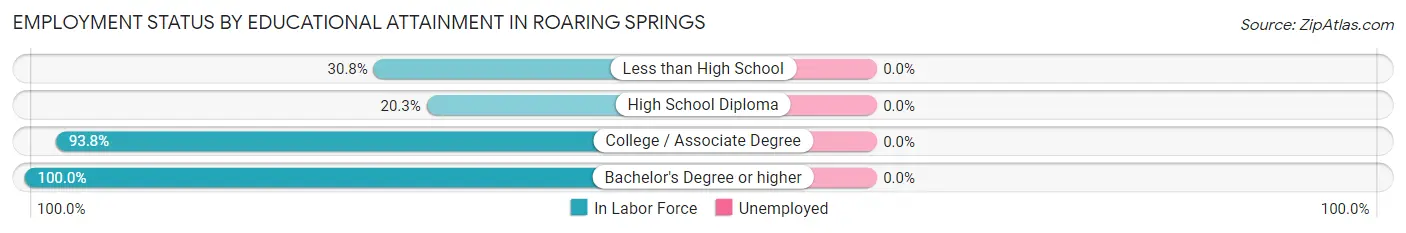
| Educational Attainment | In Labor Force | Unemployed |
| Less than High School | 4 (30.8%) | 0 (0.0%) |
| High School Diploma | 16 (20.3%) | 0 (0.0%) |
| College / Associate Degree | 15 (93.8%) | 0 (0.0%) |
| Bachelor's Degree or higher | 8 (100.0%) | 0 (0.0%) |
| Total | 43 (37.1%) | 0 (0.0%) |
Employment Occupations by Sex in Roaring Springs
Management, Business, Science and Arts Occupations
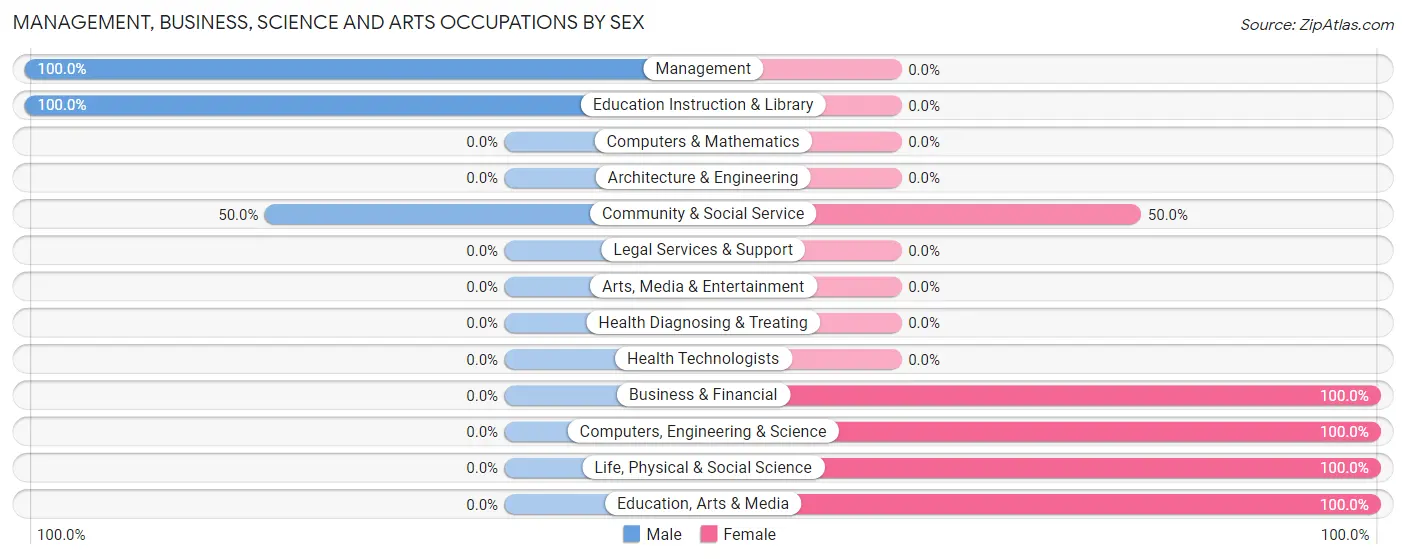
The most common Management, Business, Science and Arts occupations in Roaring Springs are Management (3 | 4.8%), Business & Financial (3 | 4.8%), Community & Social Service (2 | 3.2%), Computers, Engineering & Science (1 | 1.6%), and Life, Physical & Social Science (1 | 1.6%).
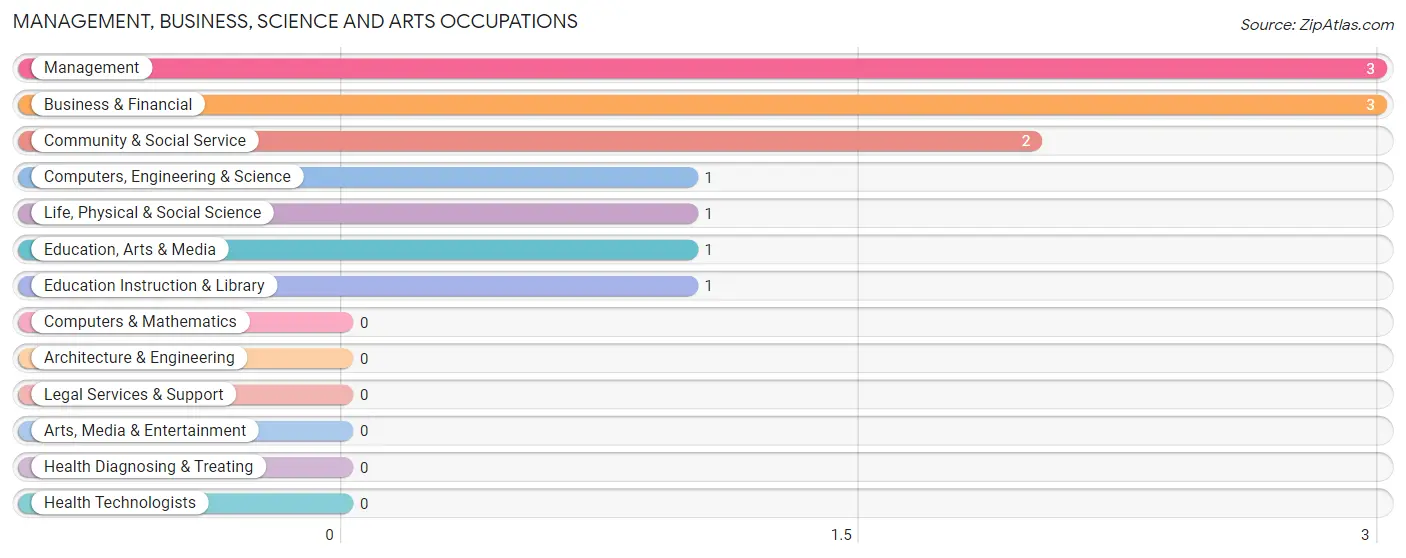
Management, Business, Science and Arts Occupations by Sex
Within the Management, Business, Science and Arts occupations in Roaring Springs, the most male-oriented occupations are Management (100.0%), Education Instruction & Library (100.0%), and Community & Social Service (50.0%), while the most female-oriented occupations are Business & Financial (100.0%), Computers, Engineering & Science (100.0%), and Life, Physical & Social Science (100.0%).
| Occupation | Male | Female |
| Management | 3 (100.0%) | 0 (0.0%) |
| Business & Financial | 0 (0.0%) | 3 (100.0%) |
| Computers, Engineering & Science | 0 (0.0%) | 1 (100.0%) |
| Computers & Mathematics | 0 (0.0%) | 0 (0.0%) |
| Architecture & Engineering | 0 (0.0%) | 0 (0.0%) |
| Life, Physical & Social Science | 0 (0.0%) | 1 (100.0%) |
| Community & Social Service | 1 (50.0%) | 1 (50.0%) |
| Education, Arts & Media | 0 (0.0%) | 1 (100.0%) |
| Legal Services & Support | 0 (0.0%) | 0 (0.0%) |
| Education Instruction & Library | 1 (100.0%) | 0 (0.0%) |
| Arts, Media & Entertainment | 0 (0.0%) | 0 (0.0%) |
| Health Diagnosing & Treating | 0 (0.0%) | 0 (0.0%) |
| Health Technologists | 0 (0.0%) | 0 (0.0%) |
| Total (Category) | 4 (44.4%) | 5 (55.6%) |
| Total (Overall) | 46 (74.2%) | 16 (25.8%) |
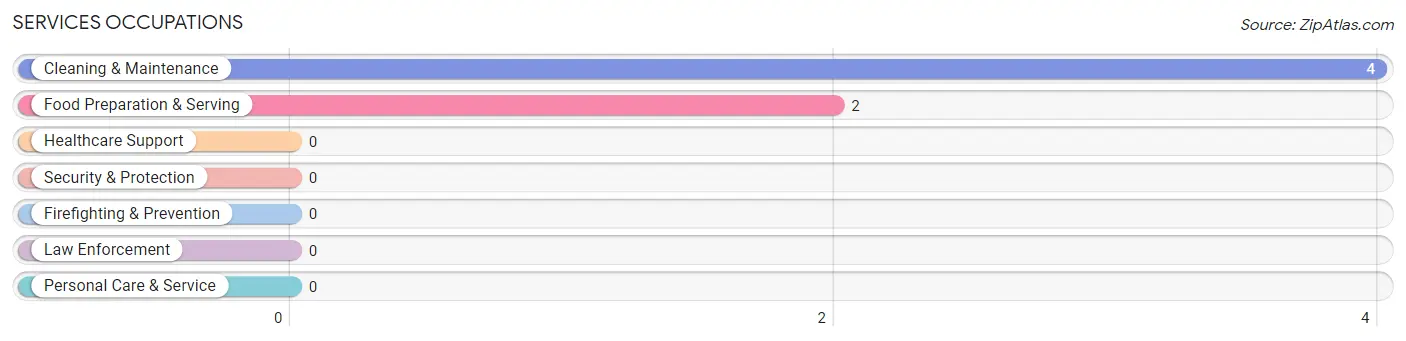
Services Occupations
The most common Services occupations in Roaring Springs are Cleaning & Maintenance (4 | 6.5%), and Food Preparation & Serving (2 | 3.2%).
Services Occupations by Sex
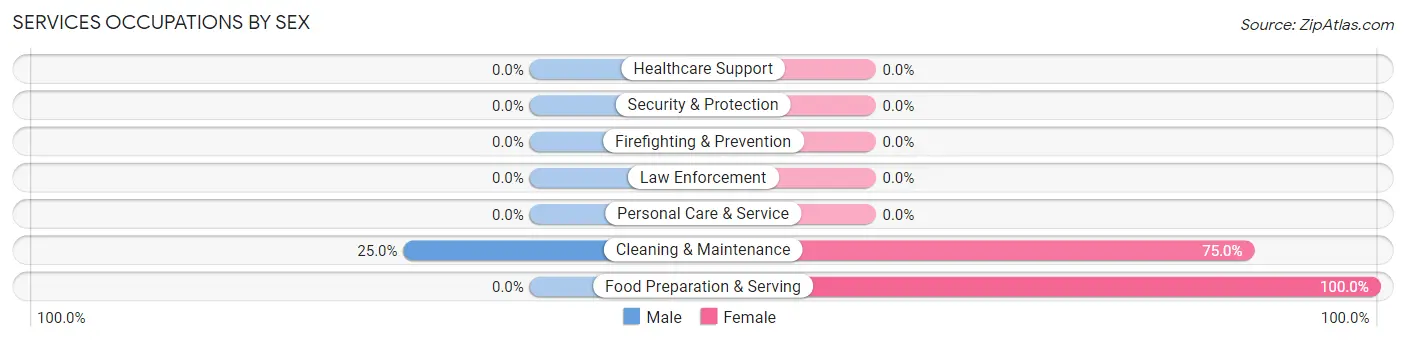
| Occupation | Male | Female |
| Healthcare Support | 0 (0.0%) | 0 (0.0%) |
| Security & Protection | 0 (0.0%) | 0 (0.0%) |
| Firefighting & Prevention | 0 (0.0%) | 0 (0.0%) |
| Law Enforcement | 0 (0.0%) | 0 (0.0%) |
| Food Preparation & Serving | 0 (0.0%) | 2 (100.0%) |
| Cleaning & Maintenance | 1 (25.0%) | 3 (75.0%) |
| Personal Care & Service | 0 (0.0%) | 0 (0.0%) |
| Total (Category) | 1 (16.7%) | 5 (83.3%) |
| Total (Overall) | 46 (74.2%) | 16 (25.8%) |
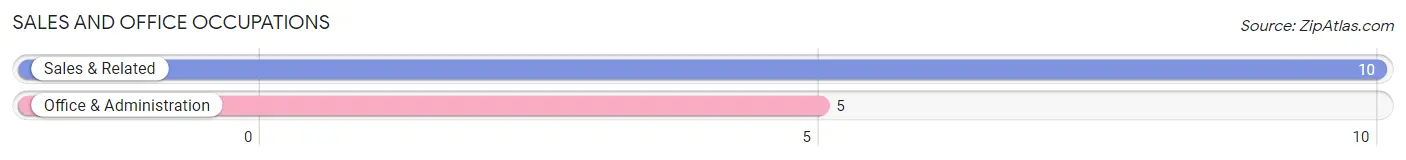
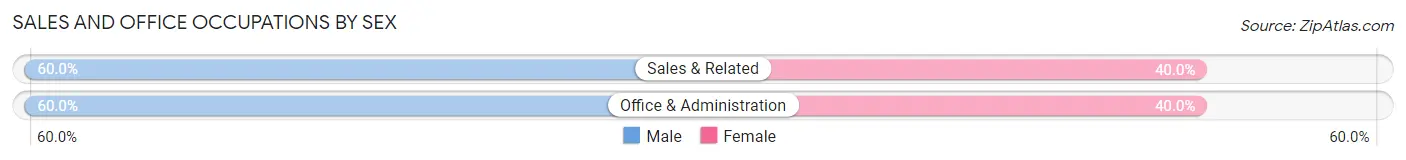
Sales and Office Occupations
The most common Sales and Office occupations in Roaring Springs are Sales & Related (10 | 16.1%), and Office & Administration (5 | 8.1%).
Sales and Office Occupations by Sex
| Occupation | Male | Female |
| Sales & Related | 6 (60.0%) | 4 (40.0%) |
| Office & Administration | 3 (60.0%) | 2 (40.0%) |
| Total (Category) | 9 (60.0%) | 6 (40.0%) |
| Total (Overall) | 46 (74.2%) | 16 (25.8%) |
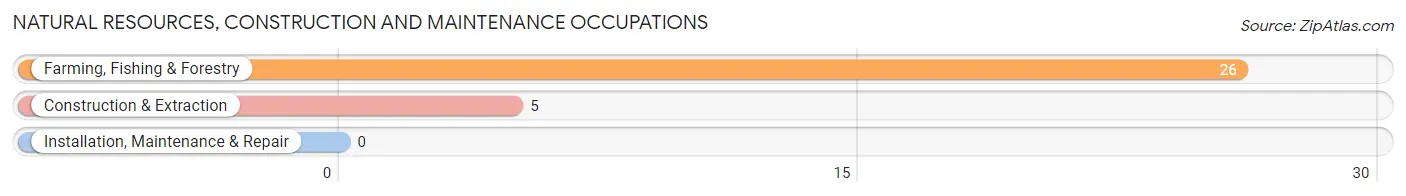
Natural Resources, Construction and Maintenance Occupations
The most common Natural Resources, Construction and Maintenance occupations in Roaring Springs are Farming, Fishing & Forestry (26 | 41.9%), and Construction & Extraction (5 | 8.1%).
Natural Resources, Construction and Maintenance Occupations by Sex
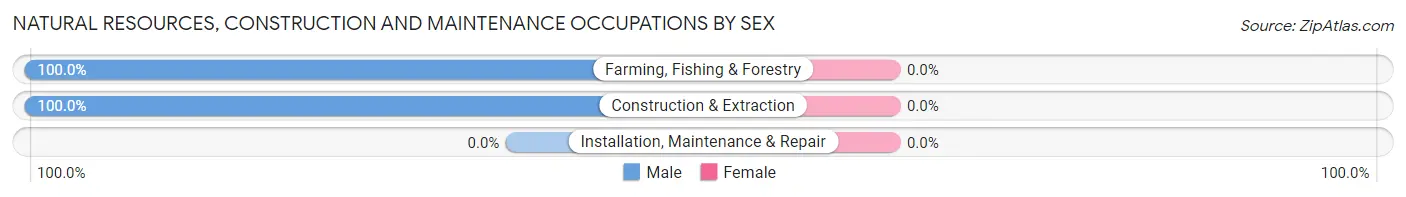
| Occupation | Male | Female |
| Farming, Fishing & Forestry | 26 (100.0%) | 0 (0.0%) |
| Construction & Extraction | 5 (100.0%) | 0 (0.0%) |
| Installation, Maintenance & Repair | 0 (0.0%) | 0 (0.0%) |
| Total (Category) | 31 (100.0%) | 0 (0.0%) |
| Total (Overall) | 46 (74.2%) | 16 (25.8%) |
Production, Transportation and Moving Occupations
The most common Production, Transportation and Moving occupations in Roaring Springs are , and Transportation (1 | 1.6%).
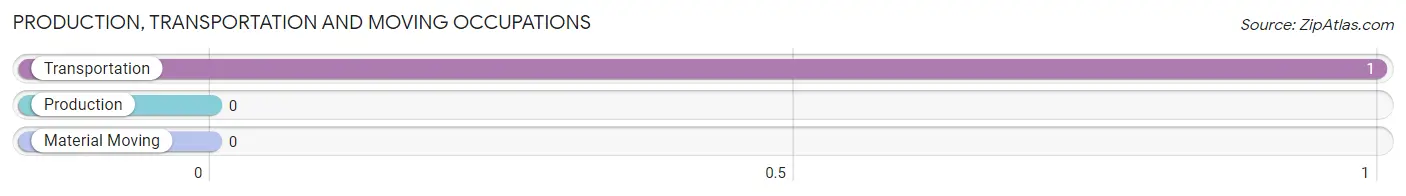
Production, Transportation and Moving Occupations by Sex
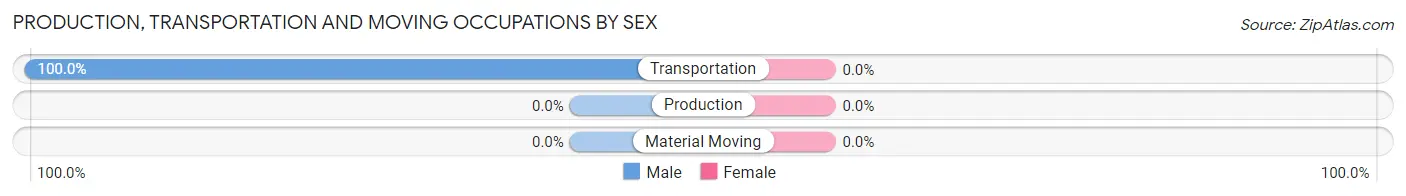
| Occupation | Male | Female |
| Production | 0 (0.0%) | 0 (0.0%) |
| Transportation | 1 (100.0%) | 0 (0.0%) |
| Material Moving | 0 (0.0%) | 0 (0.0%) |
| Total (Category) | 1 (100.0%) | 0 (0.0%) |
| Total (Overall) | 46 (74.2%) | 16 (25.8%) |
Employment Industries by Sex in Roaring Springs
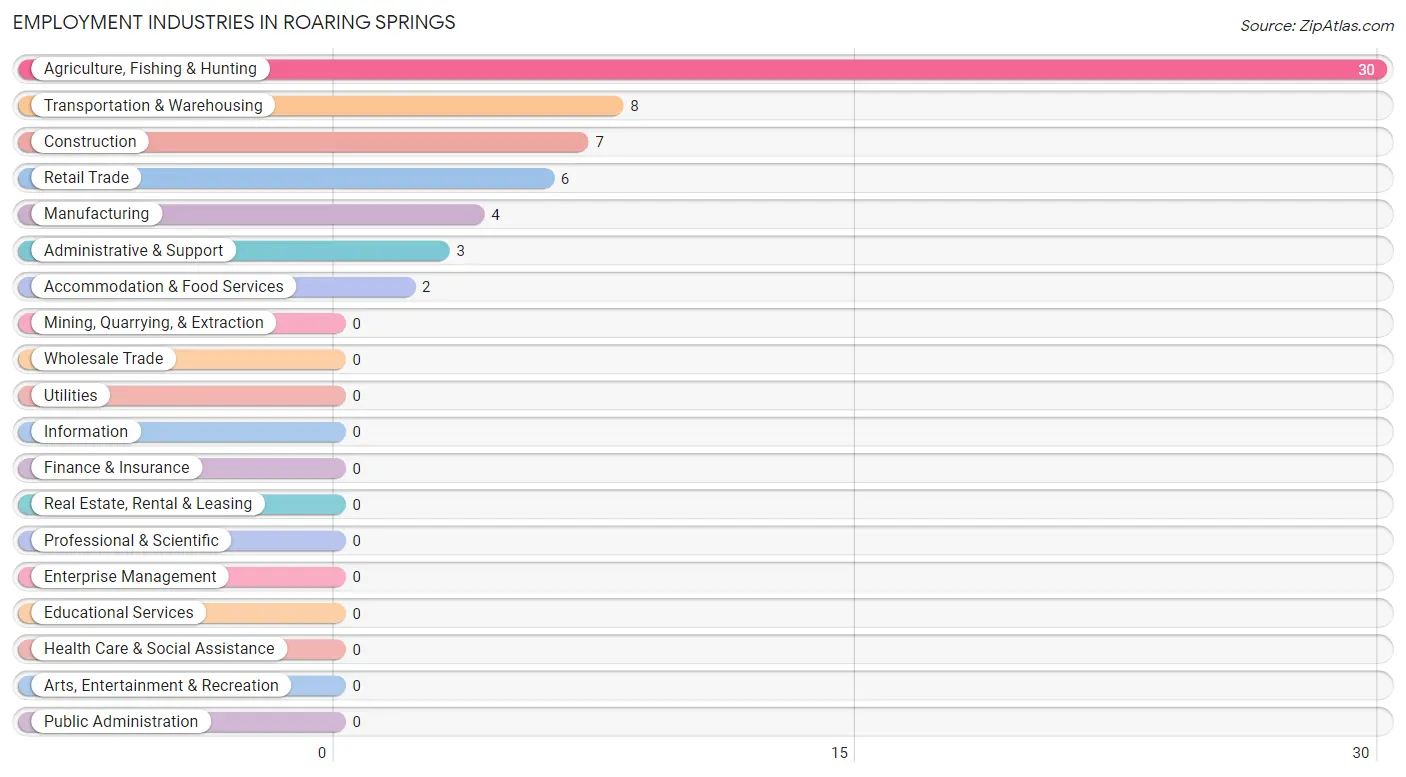
Employment Industries in Roaring Springs
The major employment industries in Roaring Springs include Agriculture, Fishing & Hunting (30 | 48.4%), Transportation & Warehousing (8 | 12.9%), Construction (7 | 11.3%), Retail Trade (6 | 9.7%), and Manufacturing (4 | 6.5%).
Employment Industries by Sex in Roaring Springs
The Roaring Springs industries that see more men than women are Retail Trade (100.0%), Agriculture, Fishing & Hunting (96.7%), and Construction (71.4%), whereas the industries that tend to have a higher number of women are Administrative & Support (100.0%), Accommodation & Food Services (100.0%), and Manufacturing (75.0%).
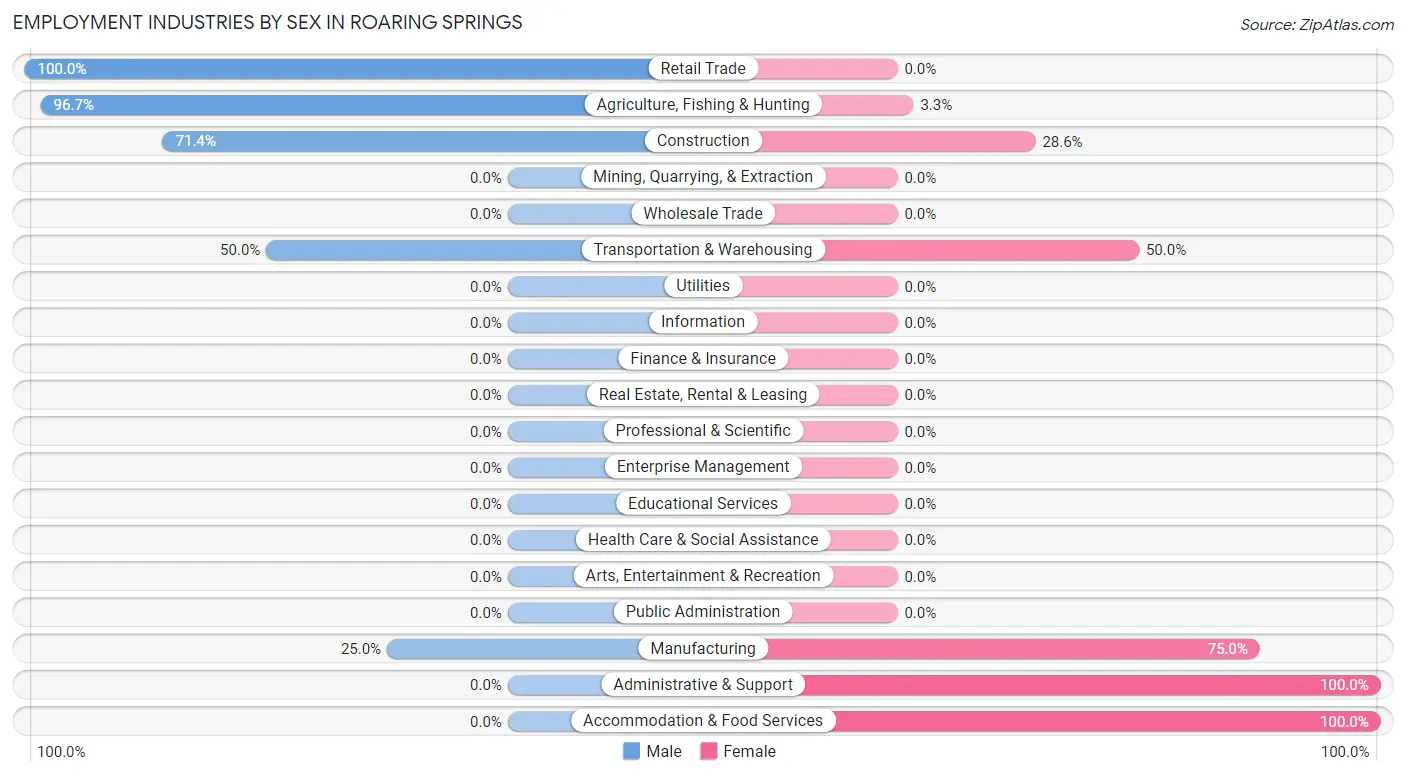
| Industry | Male | Female |
| Agriculture, Fishing & Hunting | 29 (96.7%) | 1 (3.3%) |
| Mining, Quarrying, & Extraction | 0 (0.0%) | 0 (0.0%) |
| Construction | 5 (71.4%) | 2 (28.6%) |
| Manufacturing | 1 (25.0%) | 3 (75.0%) |
| Wholesale Trade | 0 (0.0%) | 0 (0.0%) |
| Retail Trade | 6 (100.0%) | 0 (0.0%) |
| Transportation & Warehousing | 4 (50.0%) | 4 (50.0%) |
| Utilities | 0 (0.0%) | 0 (0.0%) |
| Information | 0 (0.0%) | 0 (0.0%) |
| Finance & Insurance | 0 (0.0%) | 0 (0.0%) |
| Real Estate, Rental & Leasing | 0 (0.0%) | 0 (0.0%) |
| Professional & Scientific | 0 (0.0%) | 0 (0.0%) |
| Enterprise Management | 0 (0.0%) | 0 (0.0%) |
| Administrative & Support | 0 (0.0%) | 3 (100.0%) |
| Educational Services | 0 (0.0%) | 0 (0.0%) |
| Health Care & Social Assistance | 0 (0.0%) | 0 (0.0%) |
| Arts, Entertainment & Recreation | 0 (0.0%) | 0 (0.0%) |
| Accommodation & Food Services | 0 (0.0%) | 2 (100.0%) |
| Public Administration | 0 (0.0%) | 0 (0.0%) |
| Total | 46 (74.2%) | 16 (25.8%) |
Education in Roaring Springs
School Enrollment in Roaring Springs
The most common levels of schooling among the 6 students in Roaring Springs are middle school (3 | 50.0%), nursery / preschool (1 | 16.7%), and elementary school (1 | 16.7%).
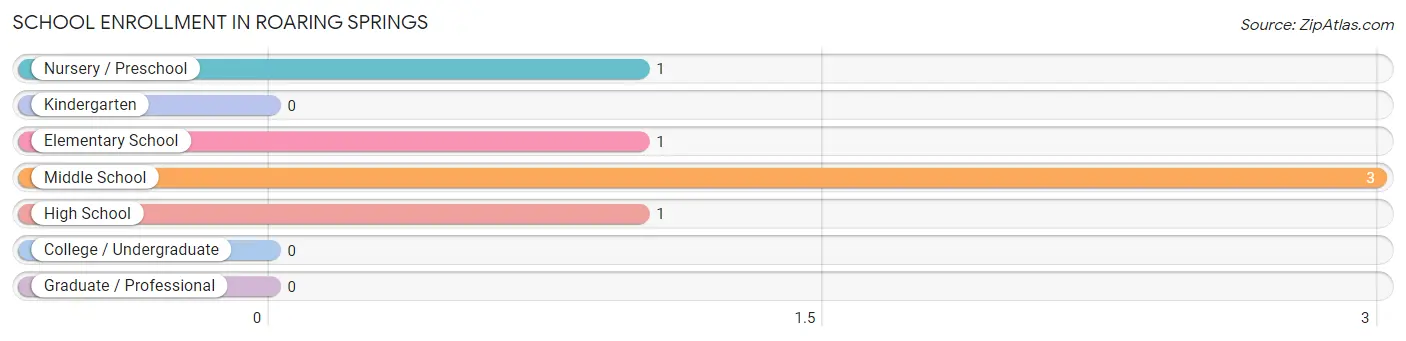
| School Level | # Students | % Students |
| Nursery / Preschool | 1 | 16.7% |
| Kindergarten | 0 | 0.0% |
| Elementary School | 1 | 16.7% |
| Middle School | 3 | 50.0% |
| High School | 1 | 16.7% |
| College / Undergraduate | 0 | 0.0% |
| Graduate / Professional | 0 | 0.0% |
| Total | 6 | 100.0% |
School Enrollment by Age by Funding Source in Roaring Springs
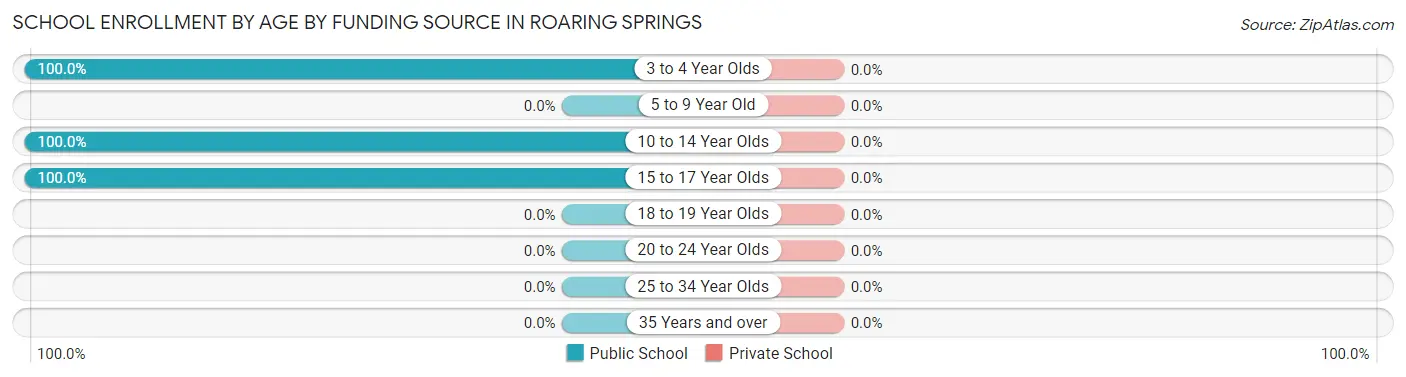
| Age Bracket | Public School | Private School |
| 3 to 4 Year Olds | 1 (100.0%) | 0 (0.0%) |
| 5 to 9 Year Old | 0 (0.0%) | 0 (0.0%) |
| 10 to 14 Year Olds | 4 (100.0%) | 0 (0.0%) |
| 15 to 17 Year Olds | 1 (100.0%) | 0 (0.0%) |
| 18 to 19 Year Olds | 0 (0.0%) | 0 (0.0%) |
| 20 to 24 Year Olds | 0 (0.0%) | 0 (0.0%) |
| 25 to 34 Year Olds | 0 (0.0%) | 0 (0.0%) |
| 35 Years and over | 0 (0.0%) | 0 (0.0%) |
| Total | 6 (100.0%) | 0 (0.0%) |
Educational Attainment by Field of Study in Roaring Springs
Education (10 | 50.0%), social sciences (4 | 20.0%), bio, nature & agricultural (3 | 15.0%), business (2 | 10.0%), and liberal arts & history (1 | 5.0%) are the most common fields of study among 20 individuals in Roaring Springs who have obtained a bachelor's degree or higher.
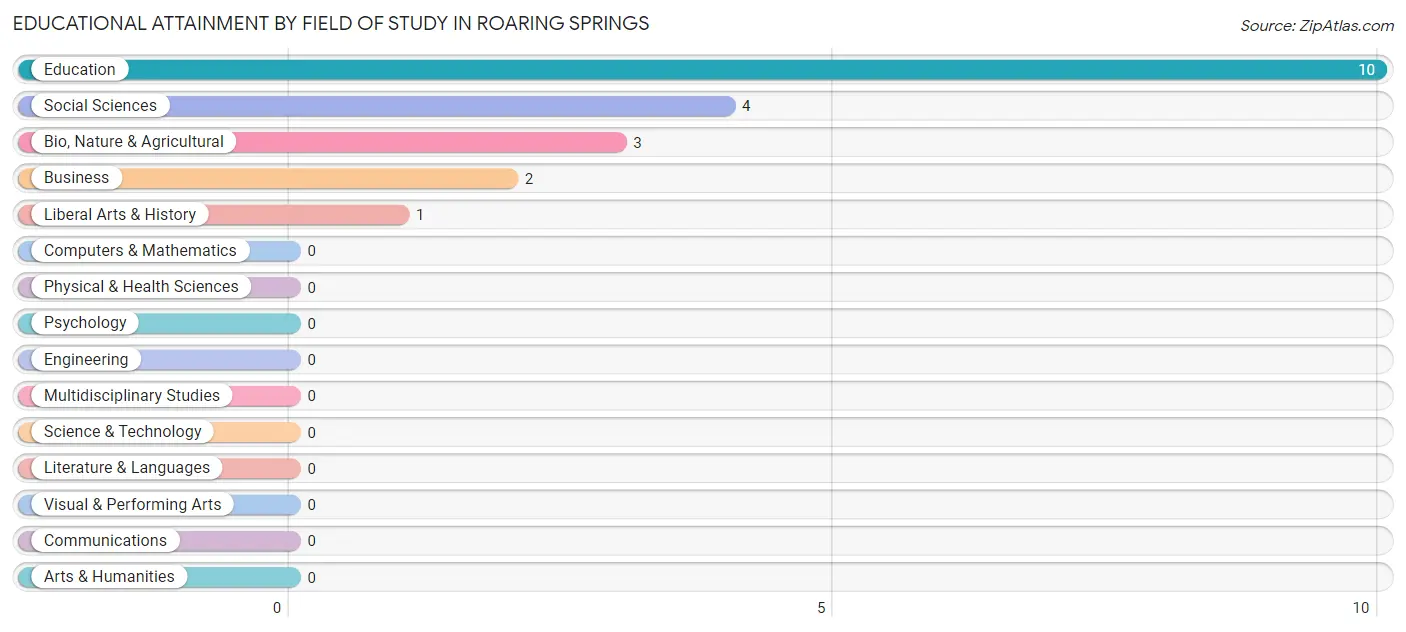
| Field of Study | # Graduates | % Graduates |
| Computers & Mathematics | 0 | 0.0% |
| Bio, Nature & Agricultural | 3 | 15.0% |
| Physical & Health Sciences | 0 | 0.0% |
| Psychology | 0 | 0.0% |
| Social Sciences | 4 | 20.0% |
| Engineering | 0 | 0.0% |
| Multidisciplinary Studies | 0 | 0.0% |
| Science & Technology | 0 | 0.0% |
| Business | 2 | 10.0% |
| Education | 10 | 50.0% |
| Literature & Languages | 0 | 0.0% |
| Liberal Arts & History | 1 | 5.0% |
| Visual & Performing Arts | 0 | 0.0% |
| Communications | 0 | 0.0% |
| Arts & Humanities | 0 | 0.0% |
| Total | 20 | 100.0% |
Transportation & Commute in Roaring Springs
Vehicle Availability by Sex in Roaring Springs
The most prevalent vehicle ownership categories in Roaring Springs are males with 2 vehicles (24, accounting for 55.8%) and females with 2 vehicles (1, making up 150.0%).
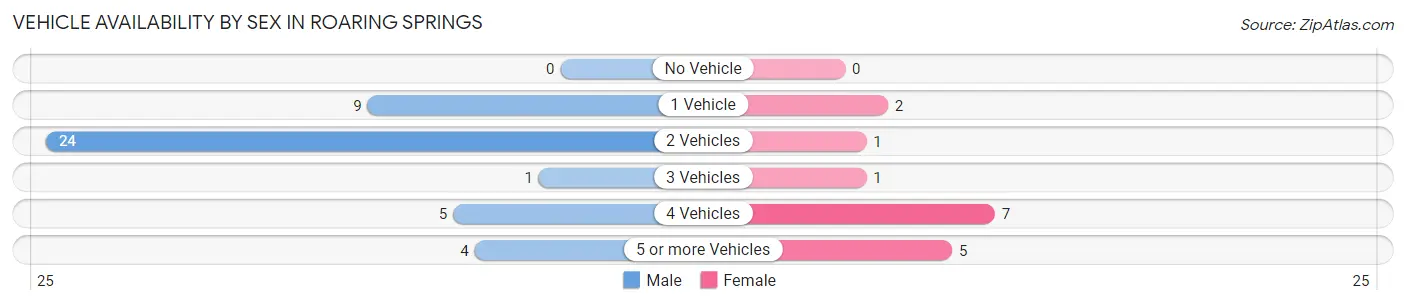
| Vehicles Available | Male | Female |
| No Vehicle | 0 (0.0%) | 0 (0.0%) |
| 1 Vehicle | 9 (20.9%) | 2 (12.5%) |
| 2 Vehicles | 24 (55.8%) | 1 (6.2%) |
| 3 Vehicles | 1 (2.3%) | 1 (6.2%) |
| 4 Vehicles | 5 (11.6%) | 7 (43.8%) |
| 5 or more Vehicles | 4 (9.3%) | 5 (31.2%) |
| Total | 43 (100.0%) | 16 (100.0%) |
Commute Time in Roaring Springs
The most frequently occuring commute durations in Roaring Springs are 30 to 34 minutes (16 commuters, 28.6%), 15 to 19 minutes (12 commuters, 21.4%), and less than 5 minutes (7 commuters, 12.5%).
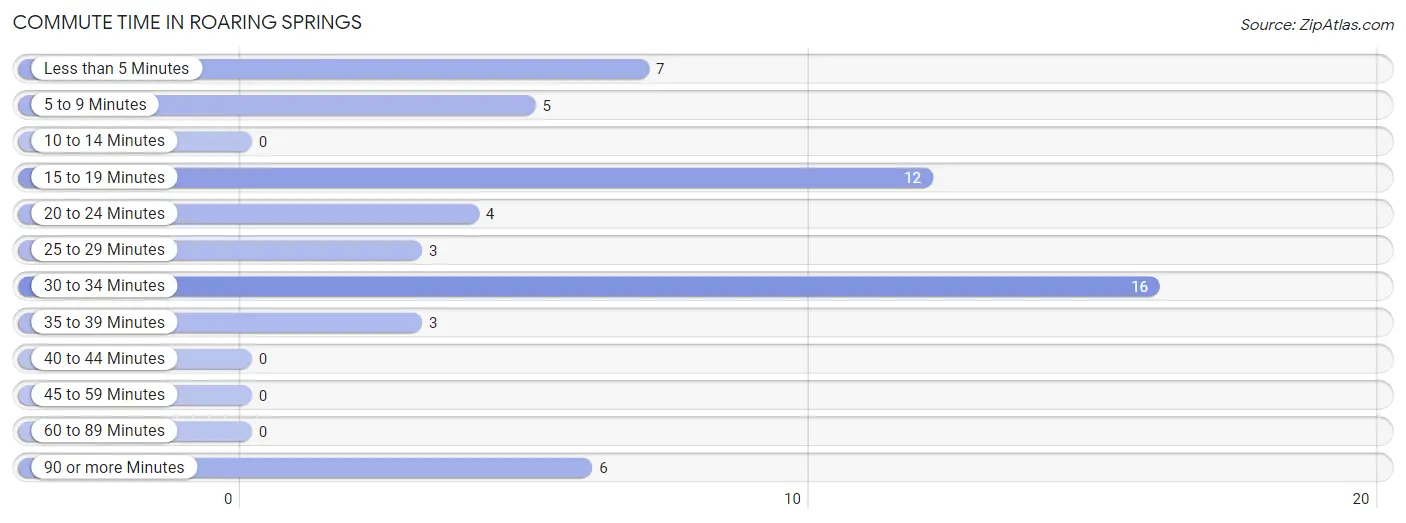
| Commute Time | # Commuters | % Commuters |
| Less than 5 Minutes | 7 | 12.5% |
| 5 to 9 Minutes | 5 | 8.9% |
| 10 to 14 Minutes | 0 | 0.0% |
| 15 to 19 Minutes | 12 | 21.4% |
| 20 to 24 Minutes | 4 | 7.1% |
| 25 to 29 Minutes | 3 | 5.4% |
| 30 to 34 Minutes | 16 | 28.6% |
| 35 to 39 Minutes | 3 | 5.4% |
| 40 to 44 Minutes | 0 | 0.0% |
| 45 to 59 Minutes | 0 | 0.0% |
| 60 to 89 Minutes | 0 | 0.0% |
| 90 or more Minutes | 6 | 10.7% |
Commute Time by Sex in Roaring Springs
The most common commute times in Roaring Springs are 30 to 34 minutes (16 commuters, 38.1%) for males and 90 or more minutes (6 commuters, 42.9%) for females.
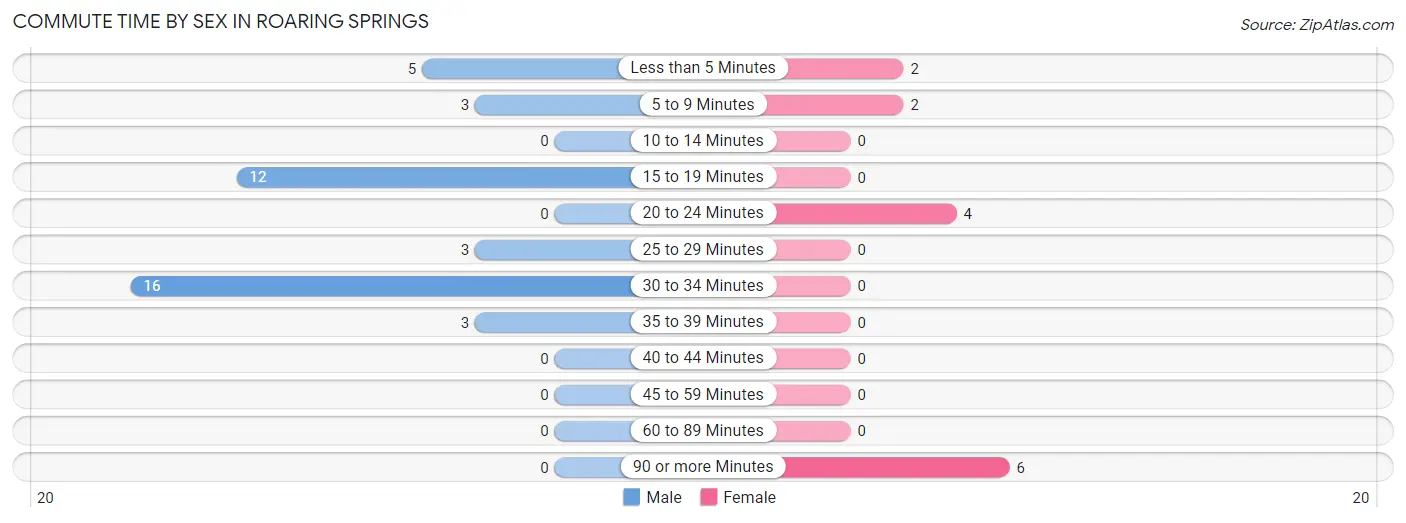
| Commute Time | Male | Female |
| Less than 5 Minutes | 5 (11.9%) | 2 (14.3%) |
| 5 to 9 Minutes | 3 (7.1%) | 2 (14.3%) |
| 10 to 14 Minutes | 0 (0.0%) | 0 (0.0%) |
| 15 to 19 Minutes | 12 (28.6%) | 0 (0.0%) |
| 20 to 24 Minutes | 0 (0.0%) | 4 (28.6%) |
| 25 to 29 Minutes | 3 (7.1%) | 0 (0.0%) |
| 30 to 34 Minutes | 16 (38.1%) | 0 (0.0%) |
| 35 to 39 Minutes | 3 (7.1%) | 0 (0.0%) |
| 40 to 44 Minutes | 0 (0.0%) | 0 (0.0%) |
| 45 to 59 Minutes | 0 (0.0%) | 0 (0.0%) |
| 60 to 89 Minutes | 0 (0.0%) | 0 (0.0%) |
| 90 or more Minutes | 0 (0.0%) | 6 (42.9%) |
Time of Departure to Work by Sex in Roaring Springs
The most frequent times of departure to work in Roaring Springs are 6:30 AM to 6:59 AM (14, 33.3%) for males and 7:30 AM to 7:59 AM (6, 42.9%) for females.
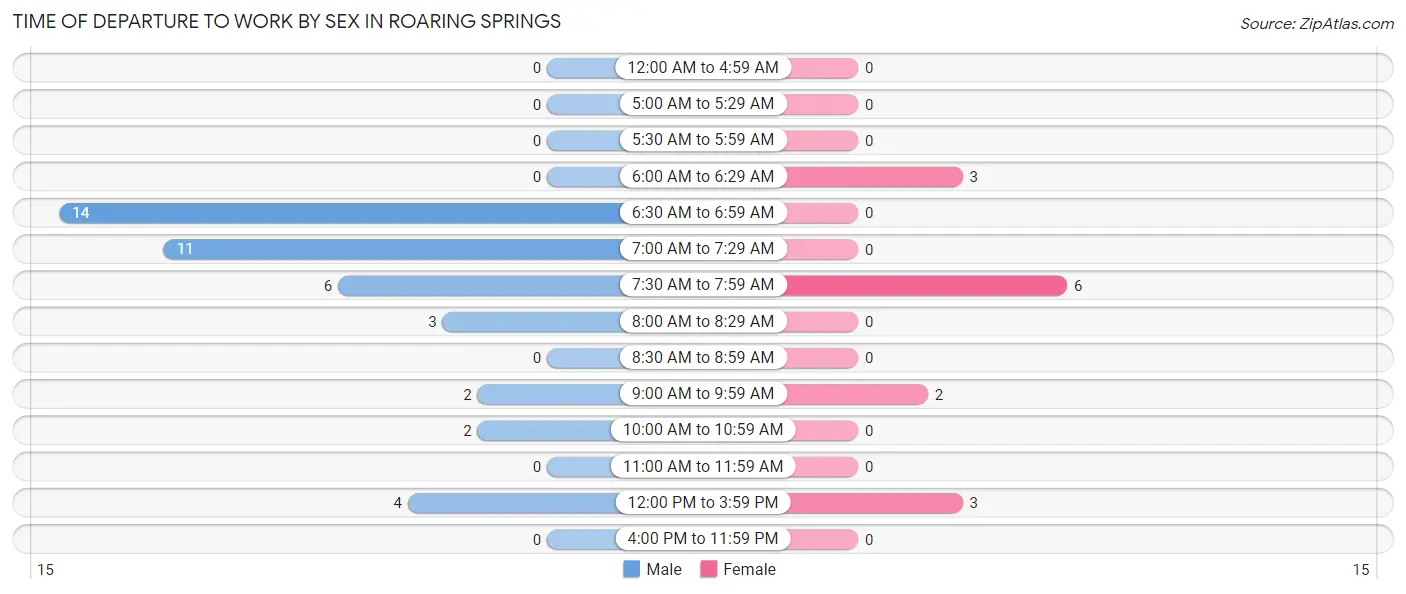
| Time of Departure | Male | Female |
| 12:00 AM to 4:59 AM | 0 (0.0%) | 0 (0.0%) |
| 5:00 AM to 5:29 AM | 0 (0.0%) | 0 (0.0%) |
| 5:30 AM to 5:59 AM | 0 (0.0%) | 0 (0.0%) |
| 6:00 AM to 6:29 AM | 0 (0.0%) | 3 (21.4%) |
| 6:30 AM to 6:59 AM | 14 (33.3%) | 0 (0.0%) |
| 7:00 AM to 7:29 AM | 11 (26.2%) | 0 (0.0%) |
| 7:30 AM to 7:59 AM | 6 (14.3%) | 6 (42.9%) |
| 8:00 AM to 8:29 AM | 3 (7.1%) | 0 (0.0%) |
| 8:30 AM to 8:59 AM | 0 (0.0%) | 0 (0.0%) |
| 9:00 AM to 9:59 AM | 2 (4.8%) | 2 (14.3%) |
| 10:00 AM to 10:59 AM | 2 (4.8%) | 0 (0.0%) |
| 11:00 AM to 11:59 AM | 0 (0.0%) | 0 (0.0%) |
| 12:00 PM to 3:59 PM | 4 (9.5%) | 3 (21.4%) |
| 4:00 PM to 11:59 PM | 0 (0.0%) | 0 (0.0%) |
| Total | 42 (100.0%) | 14 (100.0%) |
Housing Occupancy in Roaring Springs
Occupancy by Ownership in Roaring Springs
Of the total 74 dwellings in Roaring Springs, owner-occupied units account for 58 (78.4%), while renter-occupied units make up 16 (21.6%).
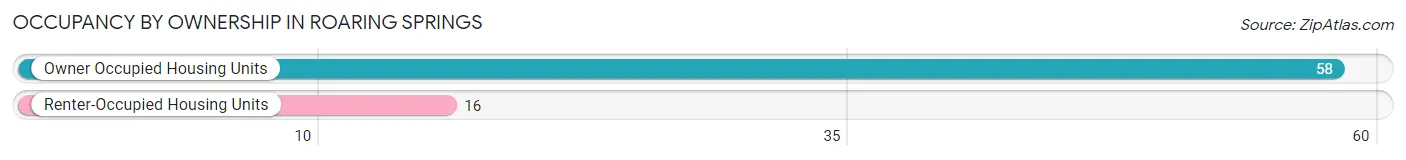
| Occupancy | # Housing Units | % Housing Units |
| Owner Occupied Housing Units | 58 | 78.4% |
| Renter-Occupied Housing Units | 16 | 21.6% |
| Total Occupied Housing Units | 74 | 100.0% |
Occupancy by Household Size in Roaring Springs
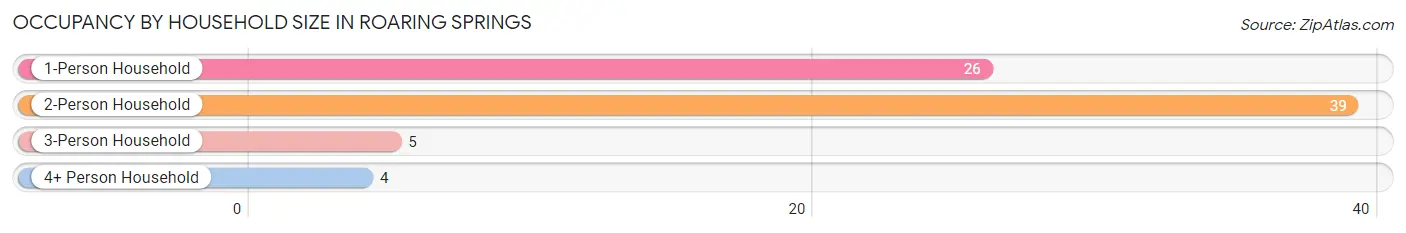
| Household Size | # Housing Units | % Housing Units |
| 1-Person Household | 26 | 35.1% |
| 2-Person Household | 39 | 52.7% |
| 3-Person Household | 5 | 6.8% |
| 4+ Person Household | 4 | 5.4% |
| Total Housing Units | 74 | 100.0% |
Occupancy by Ownership by Household Size in Roaring Springs
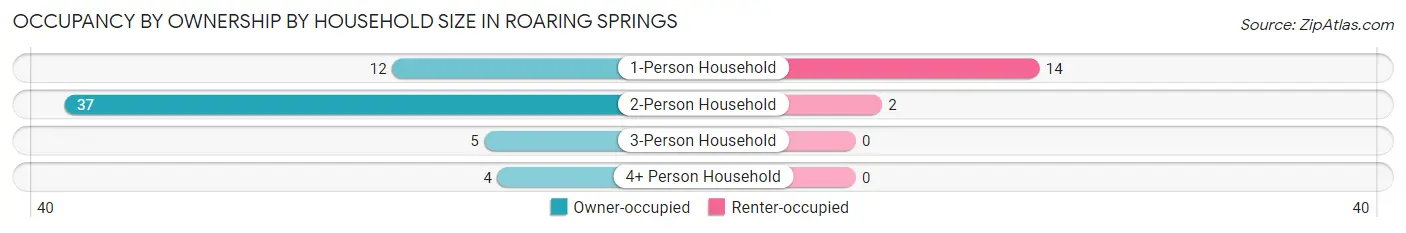
| Household Size | Owner-occupied | Renter-occupied |
| 1-Person Household | 12 (46.2%) | 14 (53.8%) |
| 2-Person Household | 37 (94.9%) | 2 (5.1%) |
| 3-Person Household | 5 (100.0%) | 0 (0.0%) |
| 4+ Person Household | 4 (100.0%) | 0 (0.0%) |
| Total Housing Units | 58 (78.4%) | 16 (21.6%) |
Occupancy by Educational Attainment in Roaring Springs

| Household Size | Owner-occupied | Renter-occupied |
| Less than High School | 10 (71.4%) | 4 (28.6%) |
| High School Diploma | 15 (75.0%) | 5 (25.0%) |
| College/Associate Degree | 24 (100.0%) | 0 (0.0%) |
| Bachelor's Degree or higher | 9 (56.2%) | 7 (43.8%) |
Occupancy by Age of Householder in Roaring Springs
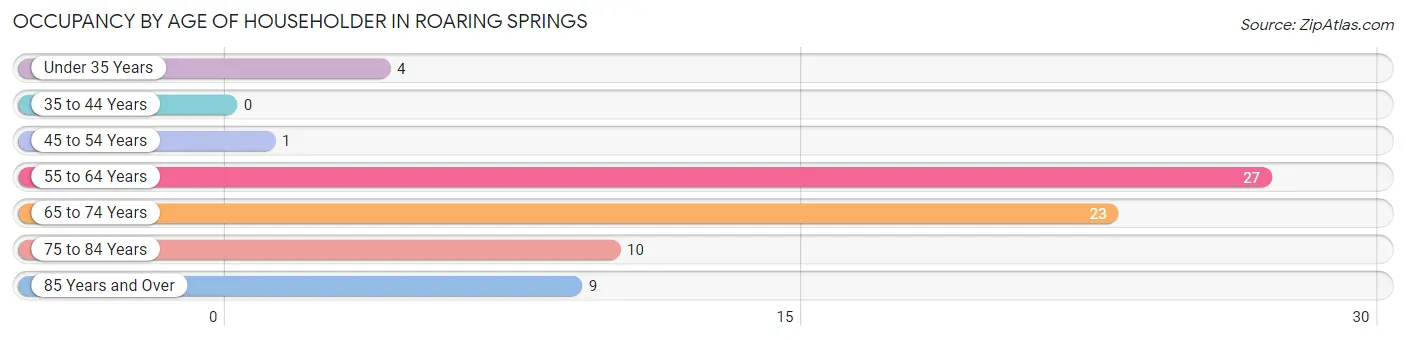
| Age Bracket | # Households | % Households |
| Under 35 Years | 4 | 5.4% |
| 35 to 44 Years | 0 | 0.0% |
| 45 to 54 Years | 1 | 1.3% |
| 55 to 64 Years | 27 | 36.5% |
| 65 to 74 Years | 23 | 31.1% |
| 75 to 84 Years | 10 | 13.5% |
| 85 Years and Over | 9 | 12.2% |
| Total | 74 | 100.0% |
Housing Finances in Roaring Springs
Median Income by Occupancy in Roaring Springs
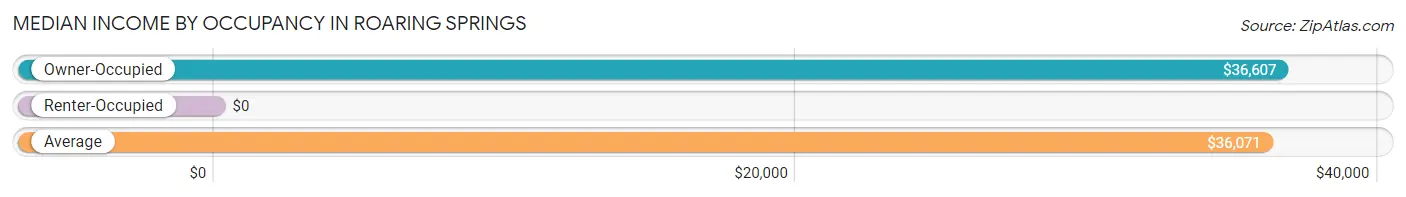
| Occupancy Type | # Households | Median Income |
| Owner-Occupied | 58 (78.4%) | $36,607 |
| Renter-Occupied | 16 (21.6%) | $0 |
| Average | 74 (100.0%) | $36,071 |
Occupancy by Householder Income Bracket in Roaring Springs
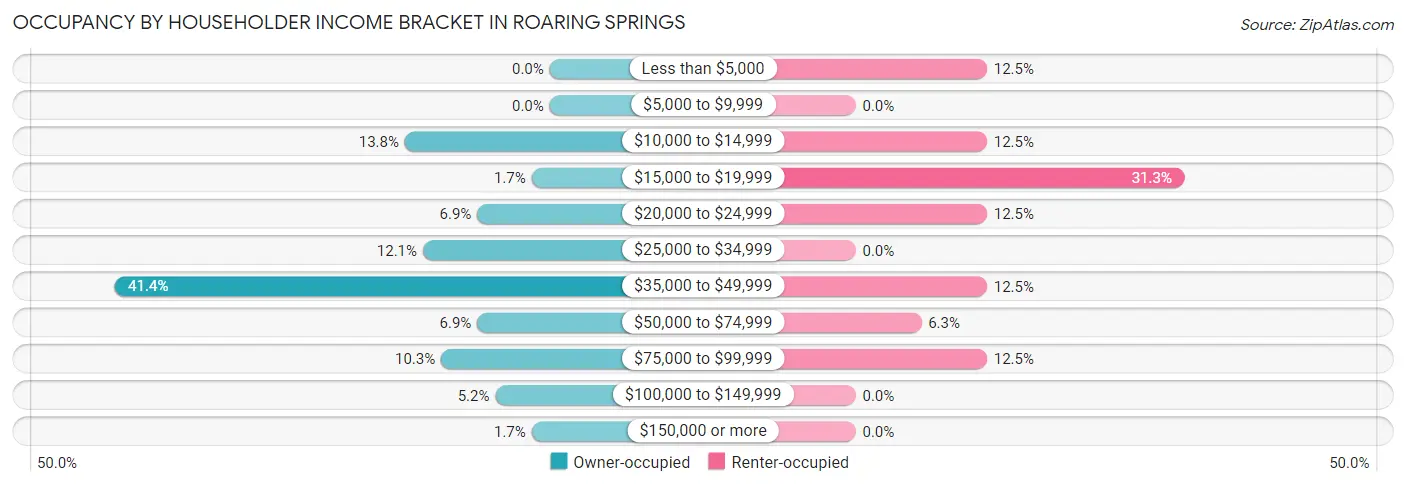
| Income Bracket | Owner-occupied | Renter-occupied |
| Less than $5,000 | 0 (0.0%) | 2 (12.5%) |
| $5,000 to $9,999 | 0 (0.0%) | 0 (0.0%) |
| $10,000 to $14,999 | 8 (13.8%) | 2 (12.5%) |
| $15,000 to $19,999 | 1 (1.7%) | 5 (31.2%) |
| $20,000 to $24,999 | 4 (6.9%) | 2 (12.5%) |
| $25,000 to $34,999 | 7 (12.1%) | 0 (0.0%) |
| $35,000 to $49,999 | 24 (41.4%) | 2 (12.5%) |
| $50,000 to $74,999 | 4 (6.9%) | 1 (6.2%) |
| $75,000 to $99,999 | 6 (10.3%) | 2 (12.5%) |
| $100,000 to $149,999 | 3 (5.2%) | 0 (0.0%) |
| $150,000 or more | 1 (1.7%) | 0 (0.0%) |
| Total | 58 (100.0%) | 16 (100.0%) |
Monthly Housing Cost Tiers in Roaring Springs
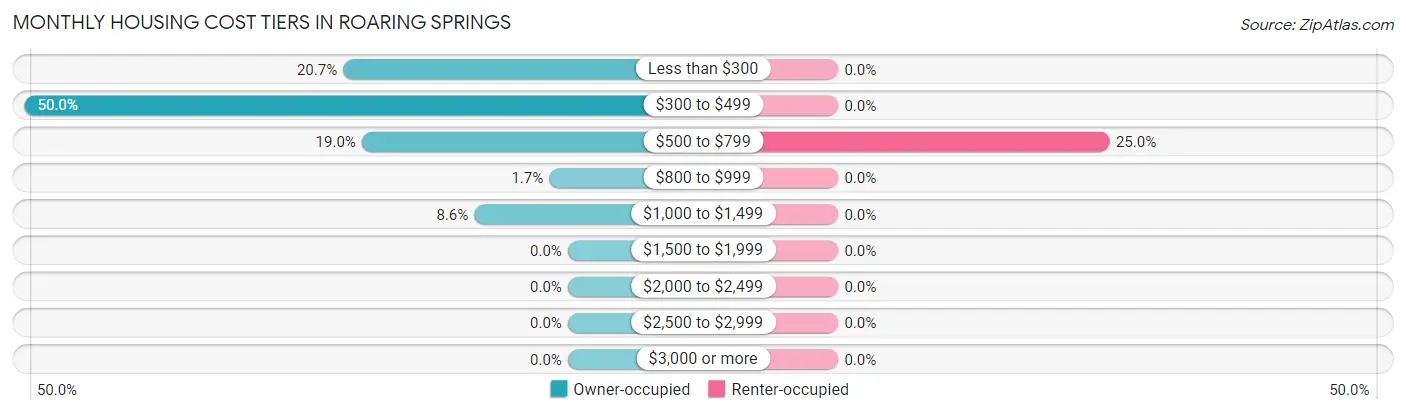
| Monthly Cost | Owner-occupied | Renter-occupied |
| Less than $300 | 12 (20.7%) | 0 (0.0%) |
| $300 to $499 | 29 (50.0%) | 0 (0.0%) |
| $500 to $799 | 11 (19.0%) | 4 (25.0%) |
| $800 to $999 | 1 (1.7%) | 0 (0.0%) |
| $1,000 to $1,499 | 5 (8.6%) | 0 (0.0%) |
| $1,500 to $1,999 | 0 (0.0%) | 0 (0.0%) |
| $2,000 to $2,499 | 0 (0.0%) | 0 (0.0%) |
| $2,500 to $2,999 | 0 (0.0%) | 0 (0.0%) |
| $3,000 or more | 0 (0.0%) | 0 (0.0%) |
| Total | 58 (100.0%) | 16 (100.0%) |
Physical Housing Characteristics in Roaring Springs
Housing Structures in Roaring Springs
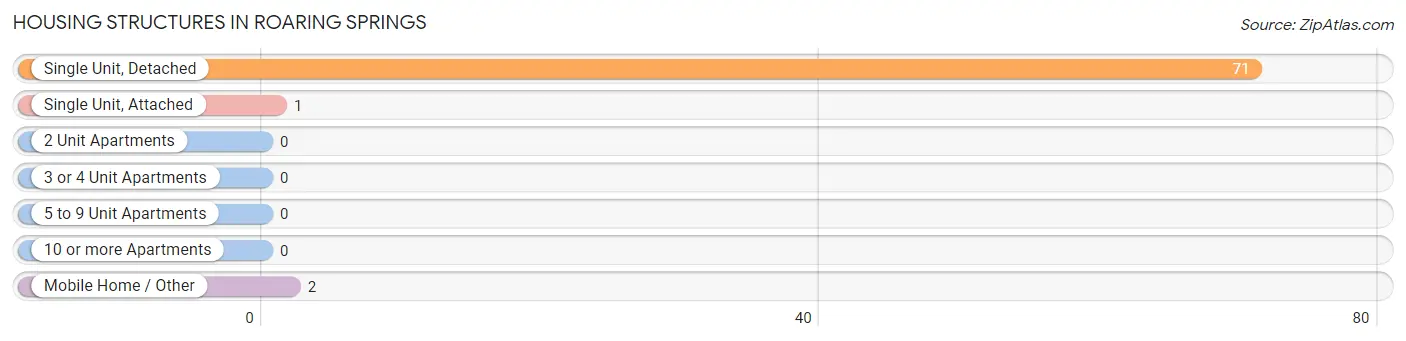
| Structure Type | # Housing Units | % Housing Units |
| Single Unit, Detached | 71 | 96.0% |
| Single Unit, Attached | 1 | 1.3% |
| 2 Unit Apartments | 0 | 0.0% |
| 3 or 4 Unit Apartments | 0 | 0.0% |
| 5 to 9 Unit Apartments | 0 | 0.0% |
| 10 or more Apartments | 0 | 0.0% |
| Mobile Home / Other | 2 | 2.7% |
| Total | 74 | 100.0% |
Housing Structures by Occupancy in Roaring Springs
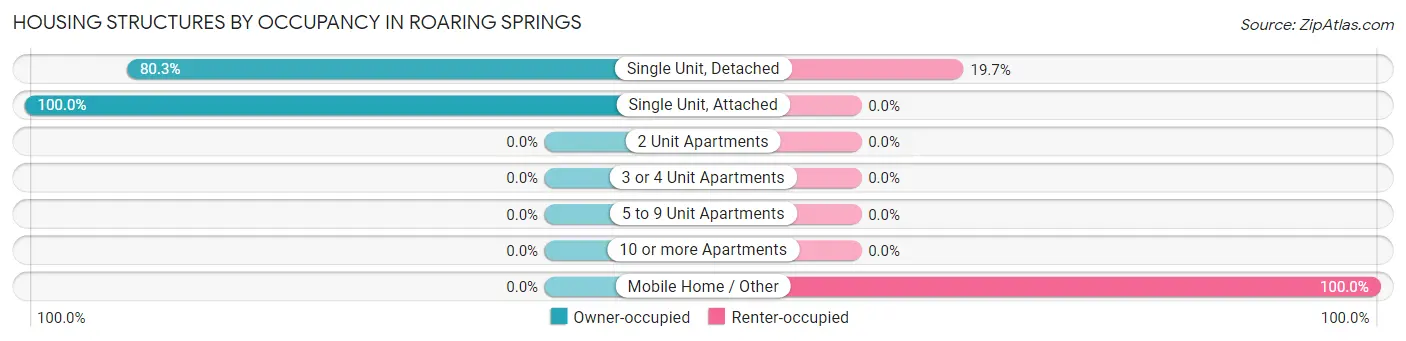
| Structure Type | Owner-occupied | Renter-occupied |
| Single Unit, Detached | 57 (80.3%) | 14 (19.7%) |
| Single Unit, Attached | 1 (100.0%) | 0 (0.0%) |
| 2 Unit Apartments | 0 (0.0%) | 0 (0.0%) |
| 3 or 4 Unit Apartments | 0 (0.0%) | 0 (0.0%) |
| 5 to 9 Unit Apartments | 0 (0.0%) | 0 (0.0%) |
| 10 or more Apartments | 0 (0.0%) | 0 (0.0%) |
| Mobile Home / Other | 0 (0.0%) | 2 (100.0%) |
| Total | 58 (78.4%) | 16 (21.6%) |
Housing Structures by Number of Rooms in Roaring Springs
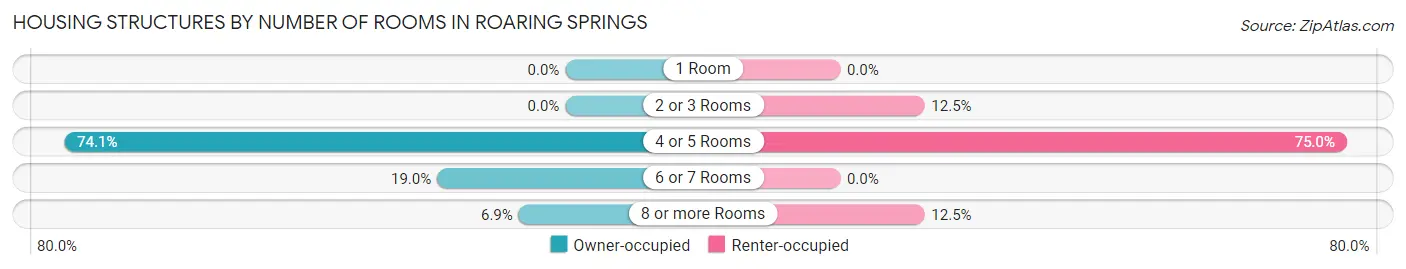
| Number of Rooms | Owner-occupied | Renter-occupied |
| 1 Room | 0 (0.0%) | 0 (0.0%) |
| 2 or 3 Rooms | 0 (0.0%) | 2 (12.5%) |
| 4 or 5 Rooms | 43 (74.1%) | 12 (75.0%) |
| 6 or 7 Rooms | 11 (19.0%) | 0 (0.0%) |
| 8 or more Rooms | 4 (6.9%) | 2 (12.5%) |
| Total | 58 (100.0%) | 16 (100.0%) |
Housing Structure by Heating Type in Roaring Springs
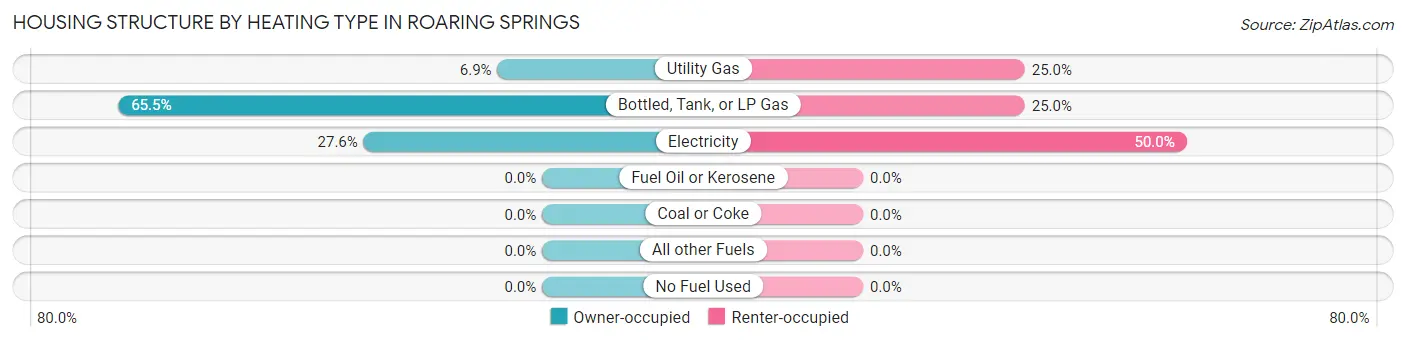
| Heating Type | Owner-occupied | Renter-occupied |
| Utility Gas | 4 (6.9%) | 4 (25.0%) |
| Bottled, Tank, or LP Gas | 38 (65.5%) | 4 (25.0%) |
| Electricity | 16 (27.6%) | 8 (50.0%) |
| Fuel Oil or Kerosene | 0 (0.0%) | 0 (0.0%) |
| Coal or Coke | 0 (0.0%) | 0 (0.0%) |
| All other Fuels | 0 (0.0%) | 0 (0.0%) |
| No Fuel Used | 0 (0.0%) | 0 (0.0%) |
| Total | 58 (100.0%) | 16 (100.0%) |
Household Vehicle Usage in Roaring Springs
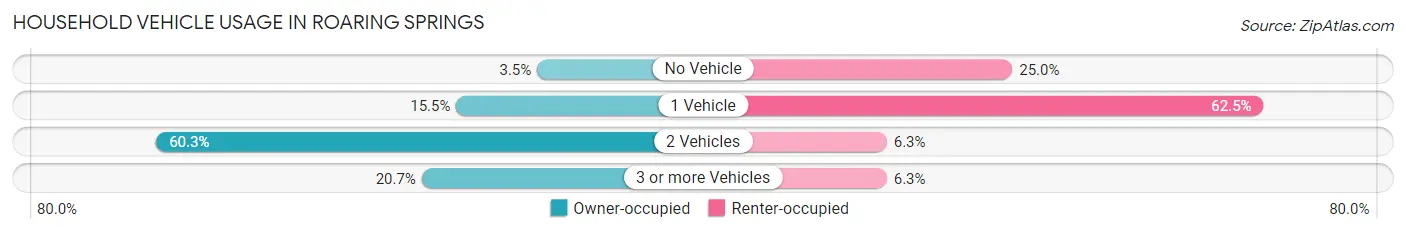
| Vehicles per Household | Owner-occupied | Renter-occupied |
| No Vehicle | 2 (3.5%) | 4 (25.0%) |
| 1 Vehicle | 9 (15.5%) | 10 (62.5%) |
| 2 Vehicles | 35 (60.3%) | 1 (6.2%) |
| 3 or more Vehicles | 12 (20.7%) | 1 (6.2%) |
| Total | 58 (100.0%) | 16 (100.0%) |
Real Estate & Mortgages in Roaring Springs
Real Estate and Mortgage Overview in Roaring Springs
| Characteristic | Without Mortgage | With Mortgage |
| Housing Units | 55 | 3 |
| Median Property Value | $34,500 | $0 |
| Median Household Income | $36,339 | $0 |
| Monthly Housing Costs | $384 | $0 |
| Real Estate Taxes | - | - |
Property Value by Mortgage Status in Roaring Springs
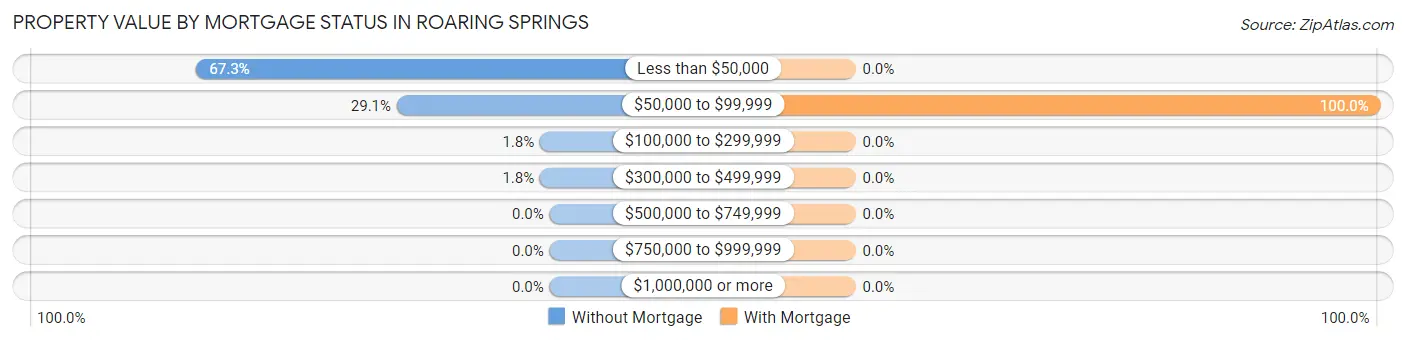
| Property Value | Without Mortgage | With Mortgage |
| Less than $50,000 | 37 (67.3%) | 0 (0.0%) |
| $50,000 to $99,999 | 16 (29.1%) | 3 (100.0%) |
| $100,000 to $299,999 | 1 (1.8%) | 0 (0.0%) |
| $300,000 to $499,999 | 1 (1.8%) | 0 (0.0%) |
| $500,000 to $749,999 | 0 (0.0%) | 0 (0.0%) |
| $750,000 to $999,999 | 0 (0.0%) | 0 (0.0%) |
| $1,000,000 or more | 0 (0.0%) | 0 (0.0%) |
| Total | 55 (100.0%) | 3 (100.0%) |
Household Income by Mortgage Status in Roaring Springs
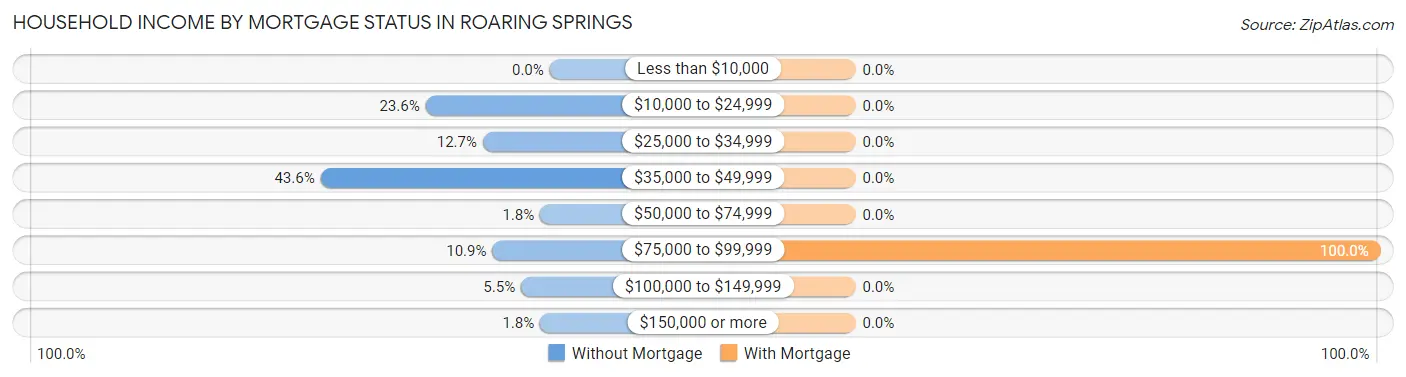
| Household Income | Without Mortgage | With Mortgage |
| Less than $10,000 | 0 (0.0%) | 0 (0.0%) |
| $10,000 to $24,999 | 13 (23.6%) | 0 (0.0%) |
| $25,000 to $34,999 | 7 (12.7%) | 0 (0.0%) |
| $35,000 to $49,999 | 24 (43.6%) | 0 (0.0%) |
| $50,000 to $74,999 | 1 (1.8%) | 0 (0.0%) |
| $75,000 to $99,999 | 6 (10.9%) | 3 (100.0%) |
| $100,000 to $149,999 | 3 (5.4%) | 0 (0.0%) |
| $150,000 or more | 1 (1.8%) | 0 (0.0%) |
| Total | 55 (100.0%) | 3 (100.0%) |
Property Value to Household Income Ratio in Roaring Springs
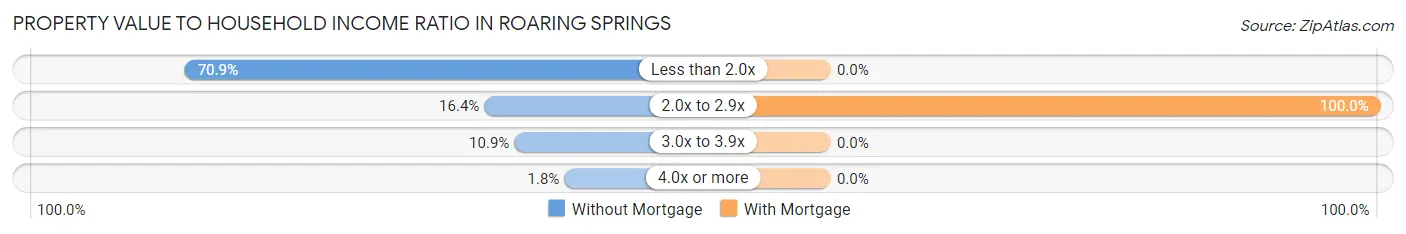
| Value-to-Income Ratio | Without Mortgage | With Mortgage |
| Less than 2.0x | 39 (70.9%) | 0 (0.0%) |
| 2.0x to 2.9x | 9 (16.4%) | 3 (100.0%) |
| 3.0x to 3.9x | 6 (10.9%) | 0 (0.0%) |
| 4.0x or more | 1 (1.8%) | 0 (0.0%) |
| Total | 55 (100.0%) | 3 (100.0%) |
Real Estate Taxes by Mortgage Status in Roaring Springs
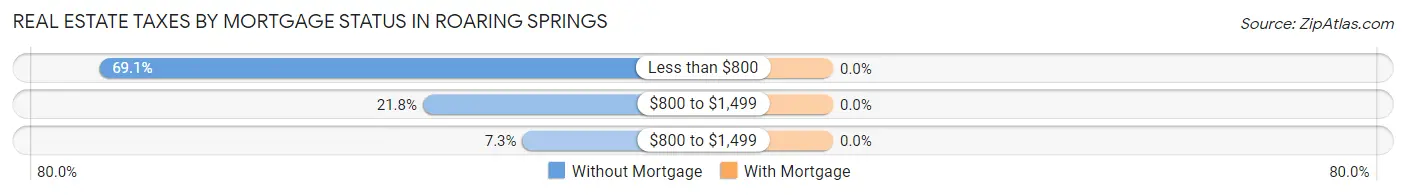
| Property Taxes | Without Mortgage | With Mortgage |
| Less than $800 | 38 (69.1%) | 0 (0.0%) |
| $800 to $1,499 | 12 (21.8%) | 0 (0.0%) |
| $800 to $1,499 | 4 (7.3%) | 0 (0.0%) |
| Total | 55 (100.0%) | 3 (100.0%) |
Health & Disability in Roaring Springs
Health Insurance Coverage by Age in Roaring Springs
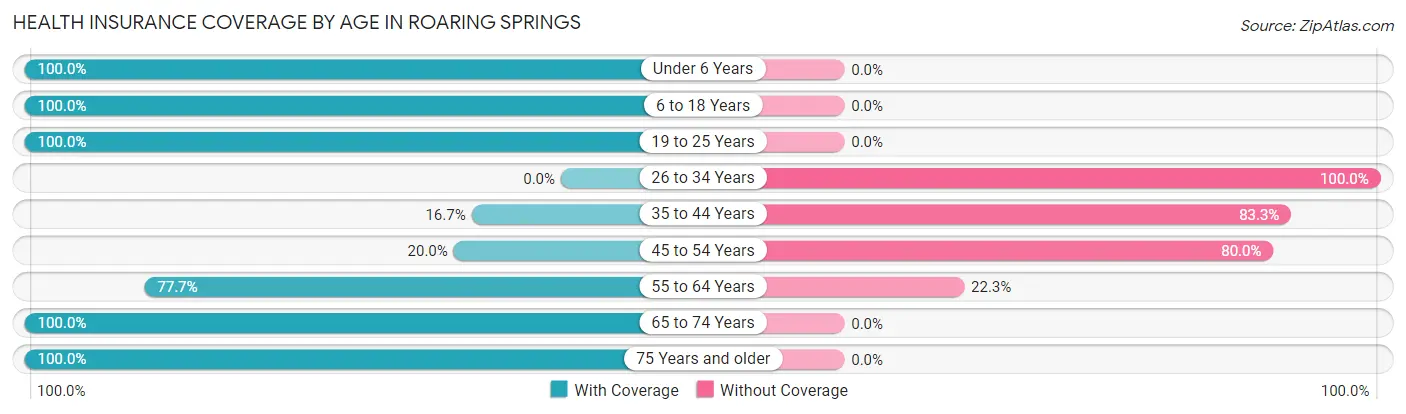
| Age Bracket | With Coverage | Without Coverage |
| Under 6 Years | 1 (100.0%) | 0 (0.0%) |
| 6 to 18 Years | 5 (100.0%) | 0 (0.0%) |
| 19 to 25 Years | 3 (100.0%) | 0 (0.0%) |
| 26 to 34 Years | 0 (0.0%) | 5 (100.0%) |
| 35 to 44 Years | 2 (16.7%) | 10 (83.3%) |
| 45 to 54 Years | 1 (20.0%) | 4 (80.0%) |
| 55 to 64 Years | 73 (77.7%) | 21 (22.3%) |
| 65 to 74 Years | 38 (100.0%) | 0 (0.0%) |
| 75 Years and older | 32 (100.0%) | 0 (0.0%) |
| Total | 155 (79.5%) | 40 (20.5%) |
Health Insurance Coverage by Citizenship Status in Roaring Springs
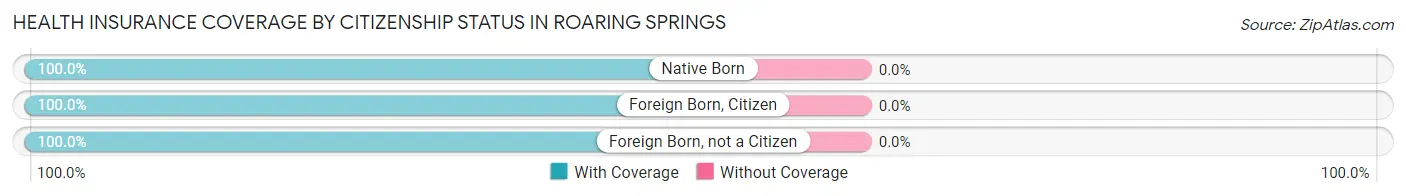
| Citizenship Status | With Coverage | Without Coverage |
| Native Born | 1 (100.0%) | 0 (0.0%) |
| Foreign Born, Citizen | 5 (100.0%) | 0 (0.0%) |
| Foreign Born, not a Citizen | 3 (100.0%) | 0 (0.0%) |
Health Insurance Coverage by Household Income in Roaring Springs
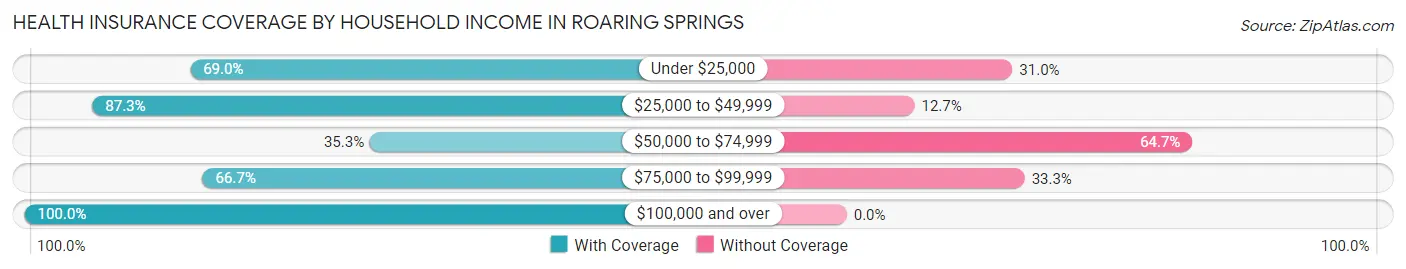
| Household Income | With Coverage | Without Coverage |
| Under $25,000 | 20 (69.0%) | 9 (31.0%) |
| $25,000 to $49,999 | 110 (87.3%) | 16 (12.7%) |
| $50,000 to $74,999 | 6 (35.3%) | 11 (64.7%) |
| $75,000 to $99,999 | 8 (66.7%) | 4 (33.3%) |
| $100,000 and over | 11 (100.0%) | 0 (0.0%) |
Public vs Private Health Insurance Coverage by Age in Roaring Springs
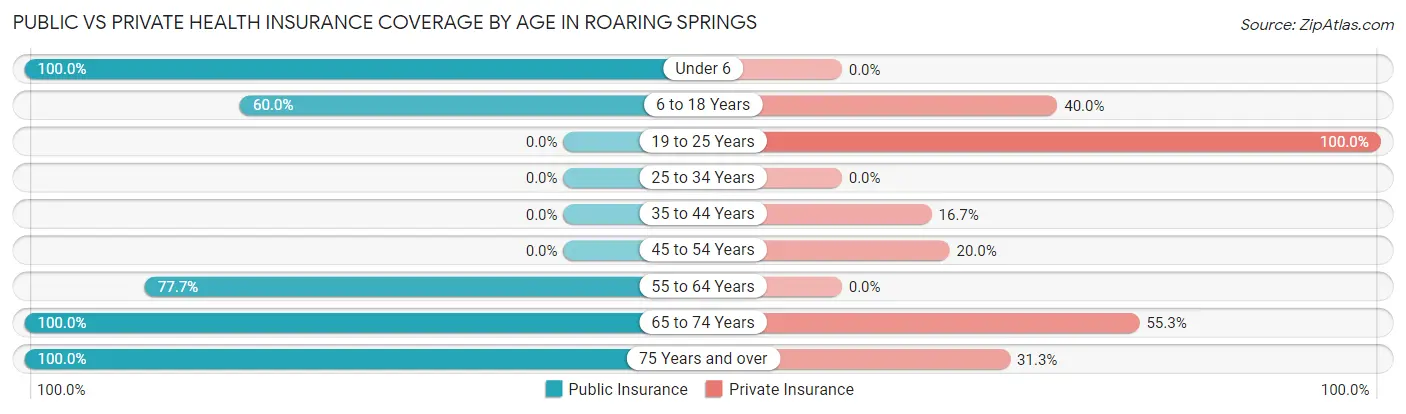
| Age Bracket | Public Insurance | Private Insurance |
| Under 6 | 1 (100.0%) | 0 (0.0%) |
| 6 to 18 Years | 3 (60.0%) | 2 (40.0%) |
| 19 to 25 Years | 0 (0.0%) | 3 (100.0%) |
| 25 to 34 Years | 0 (0.0%) | 0 (0.0%) |
| 35 to 44 Years | 0 (0.0%) | 2 (16.7%) |
| 45 to 54 Years | 0 (0.0%) | 1 (20.0%) |
| 55 to 64 Years | 73 (77.7%) | 0 (0.0%) |
| 65 to 74 Years | 38 (100.0%) | 21 (55.3%) |
| 75 Years and over | 32 (100.0%) | 10 (31.2%) |
| Total | 147 (75.4%) | 39 (20.0%) |
Disability Status by Sex by Age in Roaring Springs
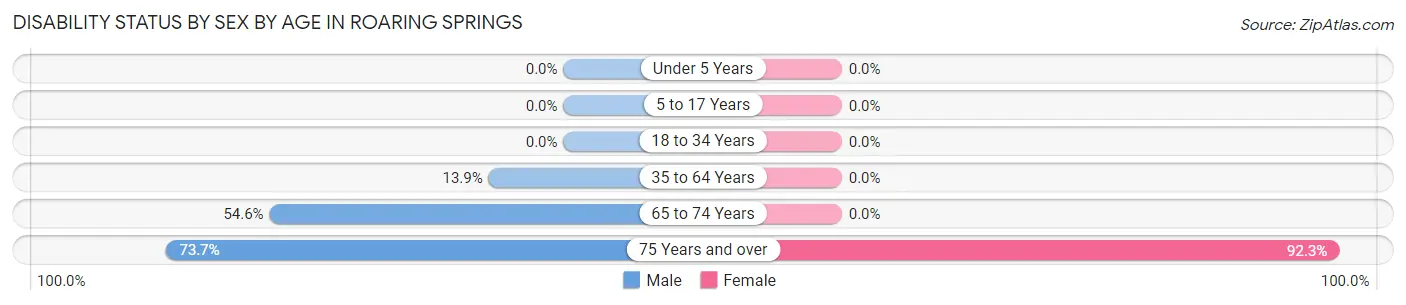
| Age Bracket | Male | Female |
| Under 5 Years | 0 (0.0%) | 0 (0.0%) |
| 5 to 17 Years | 0 (0.0%) | 0 (0.0%) |
| 18 to 34 Years | 0 (0.0%) | 0 (0.0%) |
| 35 to 64 Years | 5 (13.9%) | 0 (0.0%) |
| 65 to 74 Years | 12 (54.5%) | 0 (0.0%) |
| 75 Years and over | 14 (73.7%) | 12 (92.3%) |
Disability Class by Sex by Age in Roaring Springs
Disability Class: Hearing Difficulty
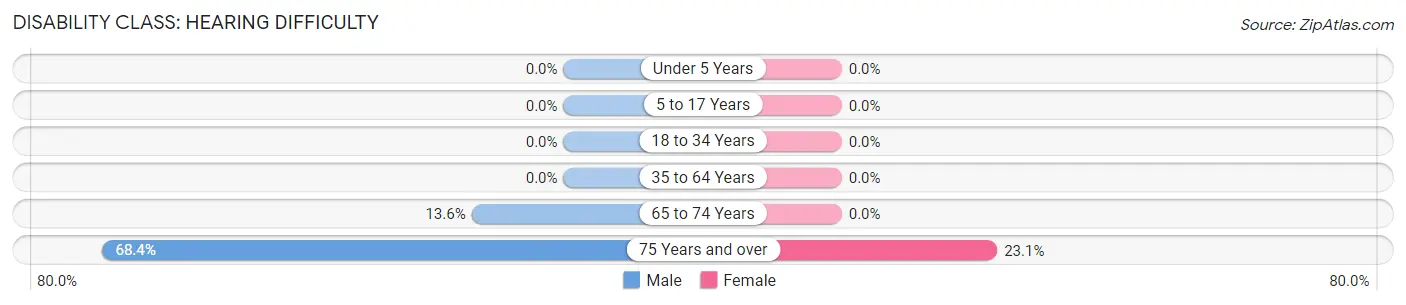
| Age Bracket | Male | Female |
| Under 5 Years | 0 (0.0%) | 0 (0.0%) |
| 5 to 17 Years | 0 (0.0%) | 0 (0.0%) |
| 18 to 34 Years | 0 (0.0%) | 0 (0.0%) |
| 35 to 64 Years | 0 (0.0%) | 0 (0.0%) |
| 65 to 74 Years | 3 (13.6%) | 0 (0.0%) |
| 75 Years and over | 13 (68.4%) | 3 (23.1%) |
Disability Class: Vision Difficulty
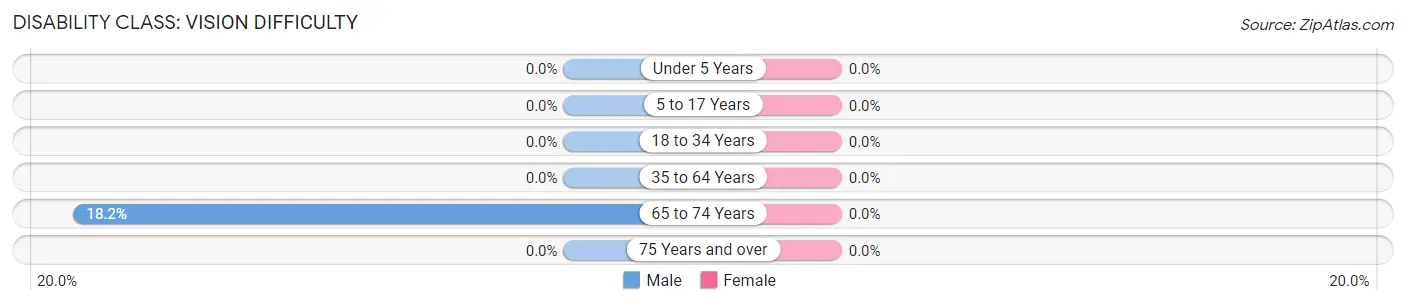
| Age Bracket | Male | Female |
| Under 5 Years | 0 (0.0%) | 0 (0.0%) |
| 5 to 17 Years | 0 (0.0%) | 0 (0.0%) |
| 18 to 34 Years | 0 (0.0%) | 0 (0.0%) |
| 35 to 64 Years | 0 (0.0%) | 0 (0.0%) |
| 65 to 74 Years | 4 (18.2%) | 0 (0.0%) |
| 75 Years and over | 0 (0.0%) | 0 (0.0%) |
Disability Class: Cognitive Difficulty
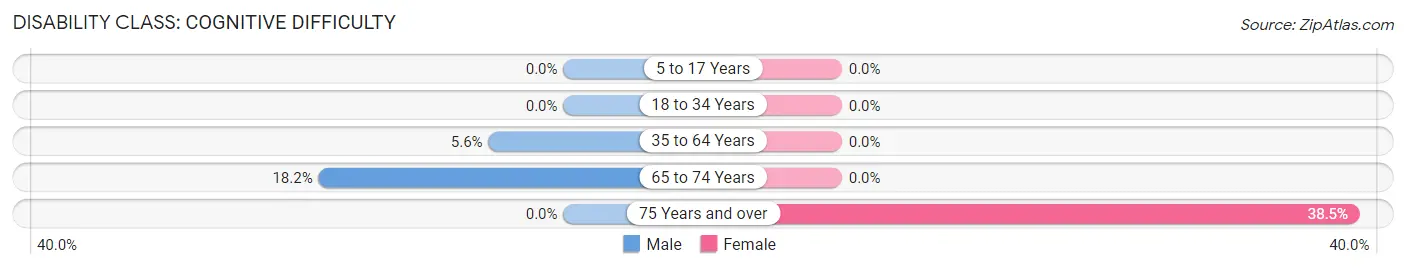
| Age Bracket | Male | Female |
| 5 to 17 Years | 0 (0.0%) | 0 (0.0%) |
| 18 to 34 Years | 0 (0.0%) | 0 (0.0%) |
| 35 to 64 Years | 2 (5.6%) | 0 (0.0%) |
| 65 to 74 Years | 4 (18.2%) | 0 (0.0%) |
| 75 Years and over | 0 (0.0%) | 5 (38.5%) |
Disability Class: Ambulatory Difficulty
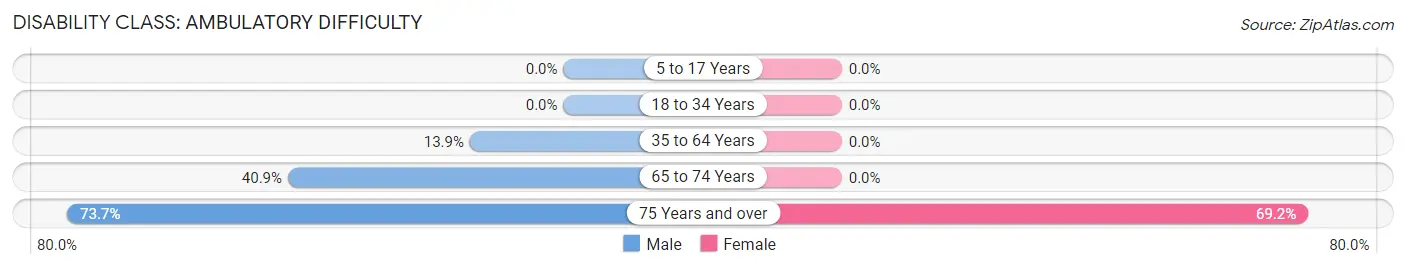
| Age Bracket | Male | Female |
| 5 to 17 Years | 0 (0.0%) | 0 (0.0%) |
| 18 to 34 Years | 0 (0.0%) | 0 (0.0%) |
| 35 to 64 Years | 5 (13.9%) | 0 (0.0%) |
| 65 to 74 Years | 9 (40.9%) | 0 (0.0%) |
| 75 Years and over | 14 (73.7%) | 9 (69.2%) |
Disability Class: Self-Care Difficulty
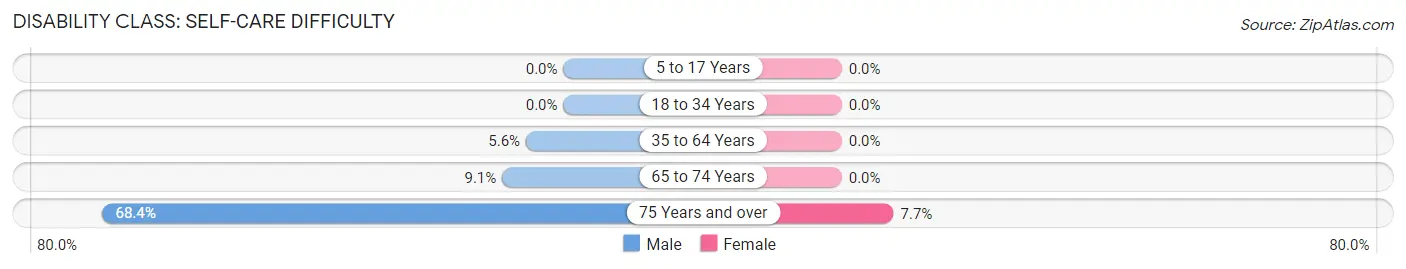
| Age Bracket | Male | Female |
| 5 to 17 Years | 0 (0.0%) | 0 (0.0%) |
| 18 to 34 Years | 0 (0.0%) | 0 (0.0%) |
| 35 to 64 Years | 2 (5.6%) | 0 (0.0%) |
| 65 to 74 Years | 2 (9.1%) | 0 (0.0%) |
| 75 Years and over | 13 (68.4%) | 1 (7.7%) |
Technology Access in Roaring Springs
Computing Device Access in Roaring Springs
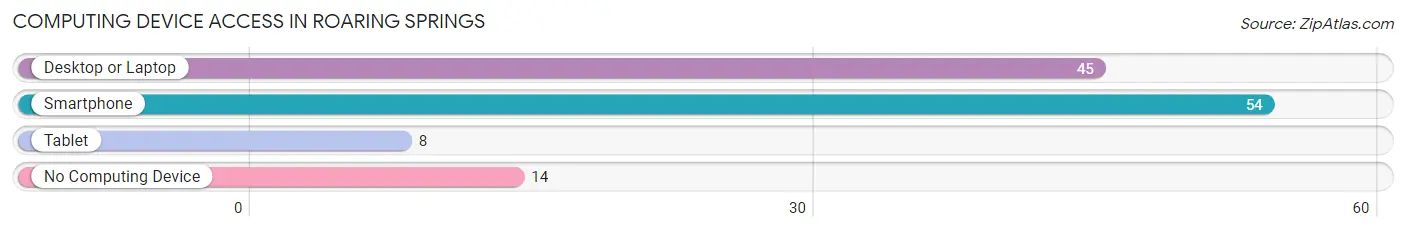
| Device Type | # Households | % Households |
| Desktop or Laptop | 45 | 60.8% |
| Smartphone | 54 | 73.0% |
| Tablet | 8 | 10.8% |
| No Computing Device | 14 | 18.9% |
| Total | 74 | 100.0% |
Internet Access in Roaring Springs
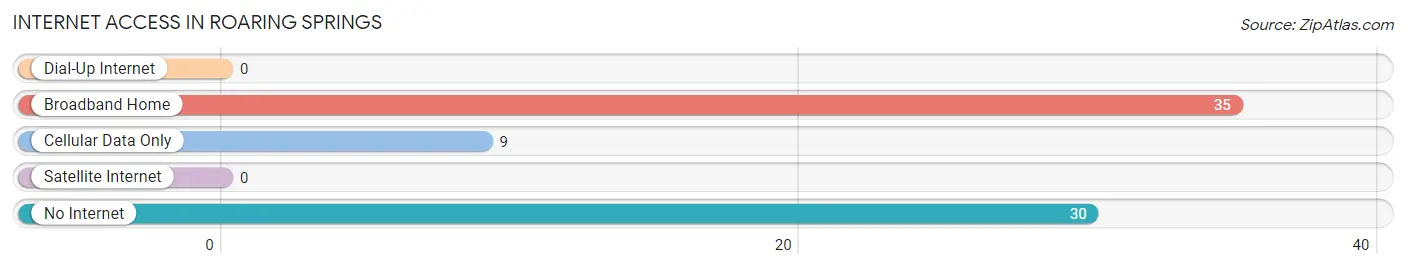
| Internet Type | # Households | % Households |
| Dial-Up Internet | 0 | 0.0% |
| Broadband Home | 35 | 47.3% |
| Cellular Data Only | 9 | 12.2% |
| Satellite Internet | 0 | 0.0% |
| No Internet | 30 | 40.5% |
| Total | 74 | 100.0% |
Roaring Springs Summary
Roaring Springs is a small town located in Motley County, Texas, United States. The population was 545 at the 2010 census. It is part of the Lubbock Metropolitan Statistical Area.
History
Roaring Springs was founded in 1891 by a group of settlers from the nearby town of Matador. The town was named after a nearby spring that was known for its loud roar. The town was incorporated in 1909 and has remained a small, rural community ever since.
The town was originally a farming and ranching community, but in the early 20th century, the discovery of oil and natural gas in the area led to an economic boom. The town's population grew rapidly and by the mid-1920s, Roaring Springs had become a thriving oil and gas town.
The town's economy was further bolstered by the construction of a cotton gin in the 1930s. The gin was a major employer in the area and helped to keep the town's economy afloat during the Great Depression.
Geography
Roaring Springs is located in Motley County, Texas, at the intersection of U.S. Route 62 and State Highway 70. The town is situated in the rolling plains of the Texas Panhandle, about 70 miles east of Lubbock.
The town is surrounded by farmland and ranches, and is located near several small lakes and reservoirs. The nearest major city is Lubbock, which is about 70 miles to the west.
Economy
The economy of Roaring Springs is largely based on agriculture and oil and gas production. The town is home to several large farms and ranches, and the surrounding area is known for its production of cotton, wheat, and other crops.
The town is also home to several oil and gas production companies, which have been a major source of employment for the town's residents. In addition, the town is home to several small businesses, including a grocery store, a hardware store, and a few restaurants.
Demographics
As of the 2010 census, the population of Roaring Springs was 545. The racial makeup of the town was 94.2% White, 0.2% African American, 0.4% Native American, 0.2% Asian, 0.2% Pacific Islander, 3.3% from other races, and 1.5% from two or more races. Hispanic or Latino of any race were 6.2% of the population.
The median household income in Roaring Springs was $31,250, and the median family income was $37,500. The per capita income for the town was $15,945. About 16.2% of families and 19.2% of the population were below the poverty line, including 25.2% of those under age 18 and 10.2% of those age 65 or over.
Common Questions
What is the Total Population of Roaring Springs?
Total Population of Roaring Springs is 195.
What is the Total Male Population of Roaring Springs?
Total Male Population of Roaring Springs is 84.
What is the Total Female Population of Roaring Springs?
Total Female Population of Roaring Springs is 111.
What is the Ratio of Males per 100 Females in Roaring Springs?
There are 75.68 Males per 100 Females in Roaring Springs.
What is the Ratio of Females per 100 Males in Roaring Springs?
There are 132.14 Females per 100 Males in Roaring Springs.
What is the Median Population Age in Roaring Springs?
Median Population Age in Roaring Springs is 61.0 Years.
What is the Average Family Size in Roaring Springs
Average Family Size in Roaring Springs is 3.5 People.
What is the Average Household Size in Roaring Springs
Average Household Size in Roaring Springs is 2.6 People.
What is Per Capita Income in Roaring Springs?
Per Capita income in Roaring Springs is $20,078.
What is the Median Family Income in Roaring Springs?
Median Family Income in Roaring Springs is $37,857.
What is the Median Household income in Roaring Springs?
Median Household Income in Roaring Springs is $36,071.
What is Inequality or Gini Index in Roaring Springs?
Inequality or Gini Index in Roaring Springs is 0.38.
How Large is the Labor Force in Roaring Springs?
There are 62 People in the Labor Forcein in Roaring Springs.
What is the Percentage of People in the Labor Force in Roaring Springs?
32.6% of People are in the Labor Force in Roaring Springs.