Pittsburg, TX
Pittsburg Map
Pittsburg Overview
4,382
TOTAL POPULATION
2,007
MALE POPULATION
2,375
FEMALE POPULATION
84.51
MALES / 100 FEMALES
118.34
FEMALES / 100 MALES
32.3
MEDIAN AGE
3.8
AVG FAMILY SIZE
2.8
AVG HOUSEHOLD SIZE
$22,869
PER CAPITA INCOME
$53,795
AVG FAMILY INCOME
$46,885
AVG HOUSEHOLD INCOME
56.2%
WAGE / INCOME GAP [ % ]
43.8¢/ $1
WAGE / INCOME GAP [ $ ]
$4,709
FAMILY INCOME DEFICIT
0.39
INEQUALITY / GINI INDEX
1,957
LABOR FORCE [ PEOPLE ]
62.0%
PERCENT IN LABOR FORCE
3.9%
UNEMPLOYMENT RATE
Pittsburg Zip Codes
Pittsburg Area Codes
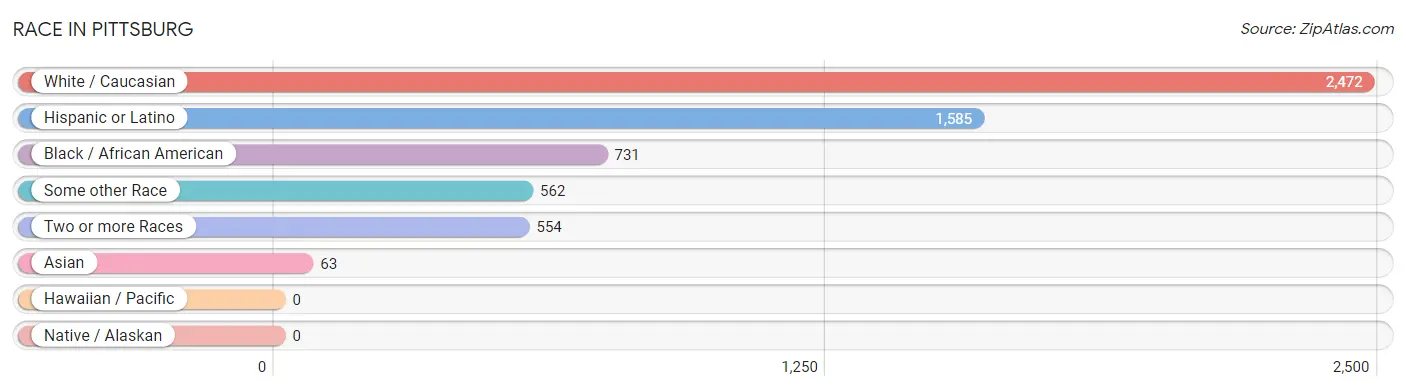
Race in Pittsburg
The most populous races in Pittsburg are White / Caucasian (2,472 | 56.4%), Hispanic or Latino (1,585 | 36.2%), and Black / African American (731 | 16.7%).
| Race | # Population | % Population |
| Asian | 63 | 1.4% |
| Black / African American | 731 | 16.7% |
| Hawaiian / Pacific | 0 | 0.0% |
| Hispanic or Latino | 1,585 | 36.2% |
| Native / Alaskan | 0 | 0.0% |
| White / Caucasian | 2,472 | 56.4% |
| Two or more Races | 554 | 12.6% |
| Some other Race | 562 | 12.8% |
| Total | 4,382 | 100.0% |
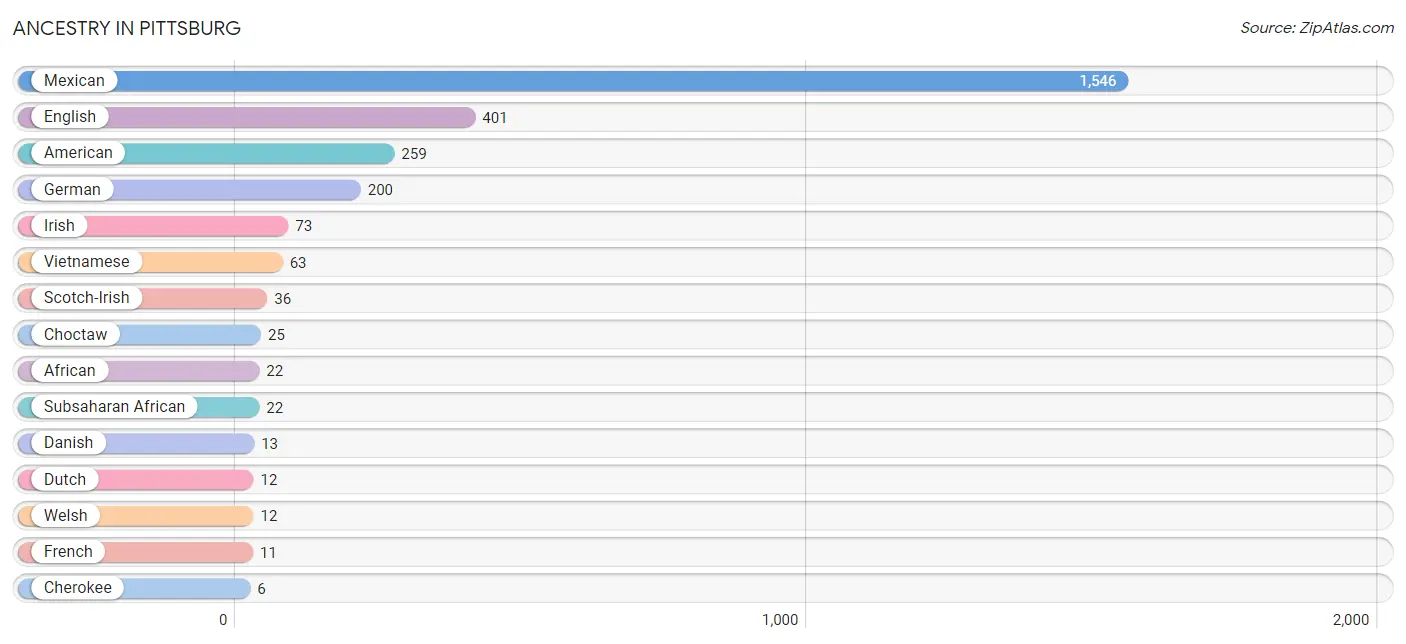
Ancestry in Pittsburg
The most populous ancestries reported in Pittsburg are Mexican (1,546 | 35.3%), English (401 | 9.1%), American (259 | 5.9%), German (200 | 4.6%), and Irish (73 | 1.7%), together accounting for 56.6% of all Pittsburg residents.
| Ancestry | # Population | % Population |
| African | 22 | 0.5% |
| American | 259 | 5.9% |
| British | 3 | 0.1% |
| Cherokee | 6 | 0.1% |
| Choctaw | 25 | 0.6% |
| Danish | 13 | 0.3% |
| Dutch | 12 | 0.3% |
| Dutch West Indian | 6 | 0.1% |
| English | 401 | 9.1% |
| French | 11 | 0.3% |
| German | 200 | 4.6% |
| Irish | 73 | 1.7% |
| Mexican | 1,546 | 35.3% |
| Navajo | 5 | 0.1% |
| Scotch-Irish | 36 | 0.8% |
| Scottish | 5 | 0.1% |
| Spaniard | 5 | 0.1% |
| Subsaharan African | 22 | 0.5% |
| Vietnamese | 63 | 1.4% |
| Welsh | 12 | 0.3% | View All 20 Rows |
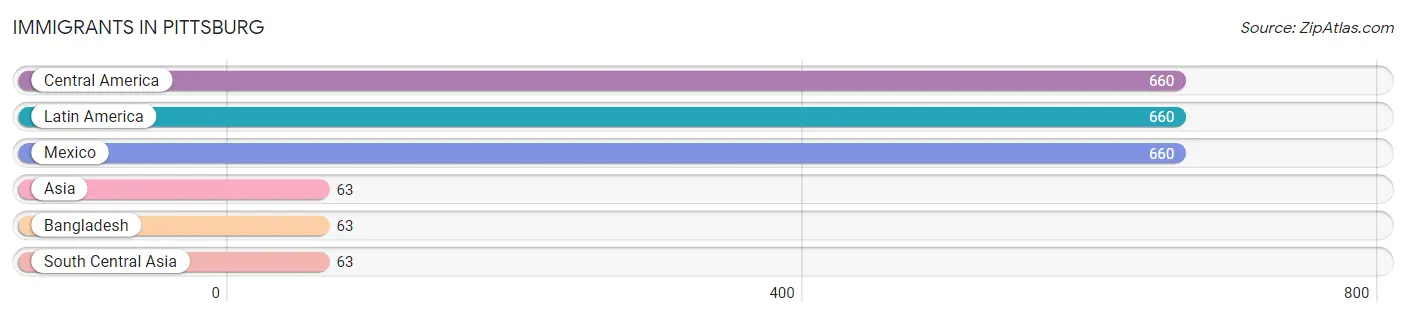
Immigrants in Pittsburg
The most numerous immigrant groups reported in Pittsburg came from Central America (660 | 15.1%), Latin America (660 | 15.1%), Mexico (660 | 15.1%), Asia (63 | 1.4%), and Bangladesh (63 | 1.4%), together accounting for 48.1% of all Pittsburg residents.
| Immigration Origin | # Population | % Population |
| Asia | 63 | 1.4% |
| Bangladesh | 63 | 1.4% |
| Central America | 660 | 15.1% |
| Latin America | 660 | 15.1% |
| Mexico | 660 | 15.1% |
| South Central Asia | 63 | 1.4% | View All 6 Rows |
Sex and Age in Pittsburg
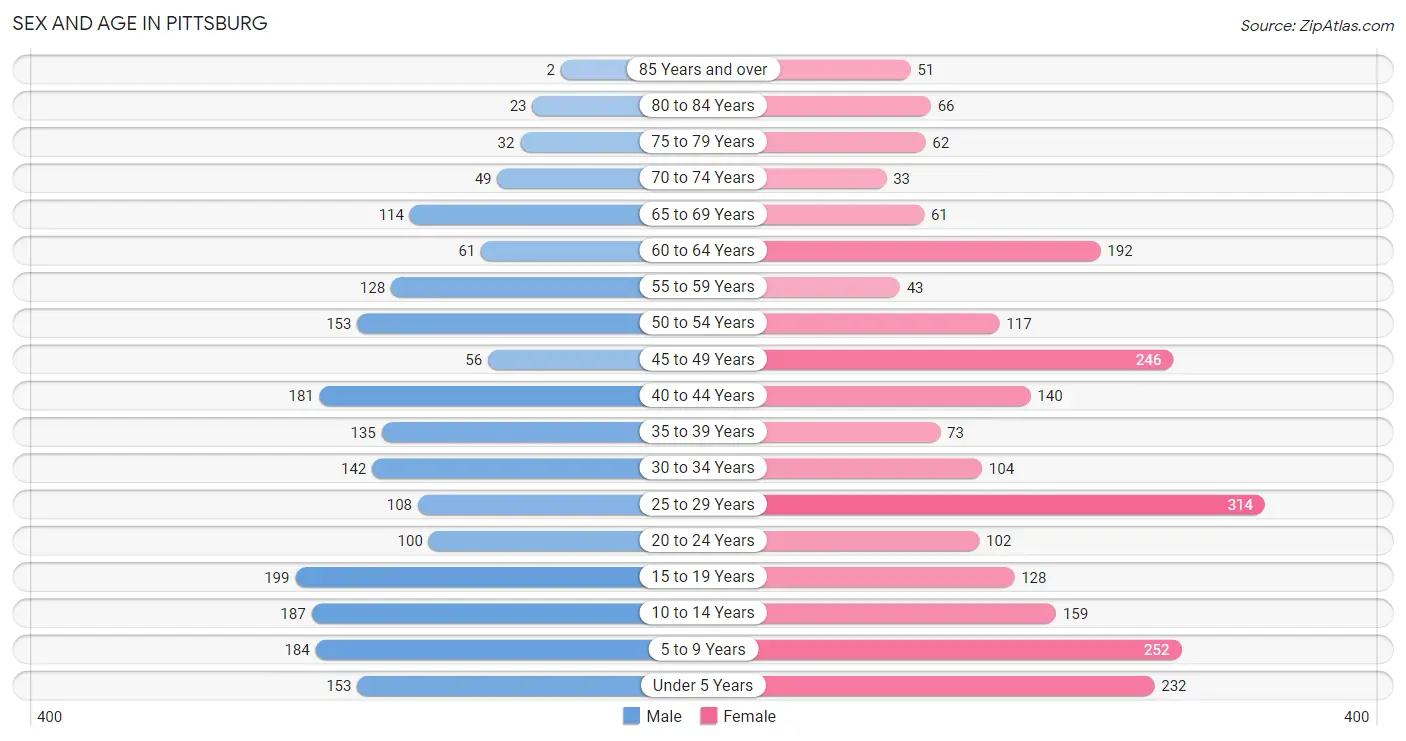
Sex and Age in Pittsburg
The most populous age groups in Pittsburg are 15 to 19 Years (199 | 9.9%) for men and 25 to 29 Years (314 | 13.2%) for women.
| Age Bracket | Male | Female |
| Under 5 Years | 153 (7.6%) | 232 (9.8%) |
| 5 to 9 Years | 184 (9.2%) | 252 (10.6%) |
| 10 to 14 Years | 187 (9.3%) | 159 (6.7%) |
| 15 to 19 Years | 199 (9.9%) | 128 (5.4%) |
| 20 to 24 Years | 100 (5.0%) | 102 (4.3%) |
| 25 to 29 Years | 108 (5.4%) | 314 (13.2%) |
| 30 to 34 Years | 142 (7.1%) | 104 (4.4%) |
| 35 to 39 Years | 135 (6.7%) | 73 (3.1%) |
| 40 to 44 Years | 181 (9.0%) | 140 (5.9%) |
| 45 to 49 Years | 56 (2.8%) | 246 (10.4%) |
| 50 to 54 Years | 153 (7.6%) | 117 (4.9%) |
| 55 to 59 Years | 128 (6.4%) | 43 (1.8%) |
| 60 to 64 Years | 61 (3.0%) | 192 (8.1%) |
| 65 to 69 Years | 114 (5.7%) | 61 (2.6%) |
| 70 to 74 Years | 49 (2.4%) | 33 (1.4%) |
| 75 to 79 Years | 32 (1.6%) | 62 (2.6%) |
| 80 to 84 Years | 23 (1.1%) | 66 (2.8%) |
| 85 Years and over | 2 (0.1%) | 51 (2.1%) |
| Total | 2,007 (100.0%) | 2,375 (100.0%) |
Families and Households in Pittsburg
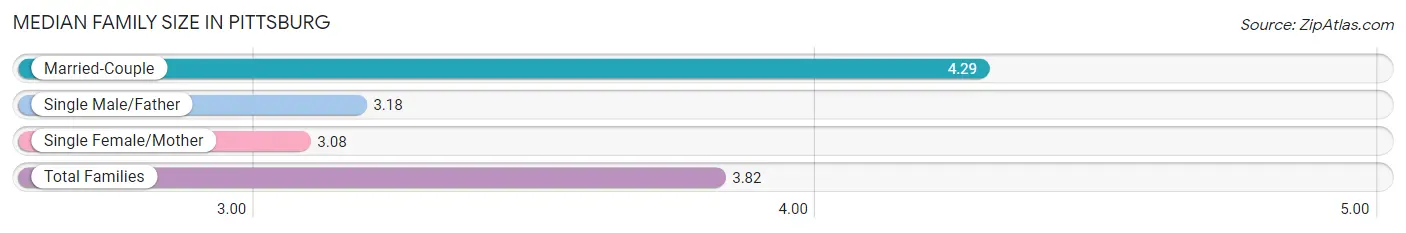
Median Family Size in Pittsburg
The median family size in Pittsburg is 3.82 persons per family, with married-couple families (550 | 61.0%) accounting for the largest median family size of 4.29 persons per family. On the other hand, single female/mother families (285 | 31.6%) represent the smallest median family size with 3.08 persons per family.
| Family Type | # Families | Family Size |
| Married-Couple | 550 (61.0%) | 4.29 |
| Single Male/Father | 67 (7.4%) | 3.18 |
| Single Female/Mother | 285 (31.6%) | 3.08 |
| Total Families | 902 (100.0%) | 3.82 |
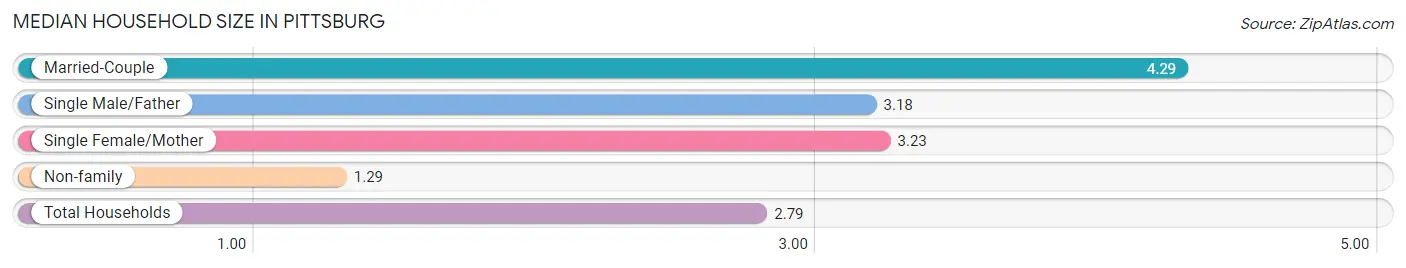
Median Household Size in Pittsburg
The median household size in Pittsburg is 2.79 persons per household, with married-couple households (550 | 35.5%) accounting for the largest median household size of 4.29 persons per household. non-family households (646 | 41.7%) represent the smallest median household size with 1.29 persons per household.
| Household Type | # Households | Household Size |
| Married-Couple | 550 (35.5%) | 4.29 |
| Single Male/Father | 67 (4.3%) | 3.18 |
| Single Female/Mother | 285 (18.4%) | 3.23 |
| Non-family | 646 (41.7%) | 1.29 |
| Total Households | 1,548 (100.0%) | 2.79 |
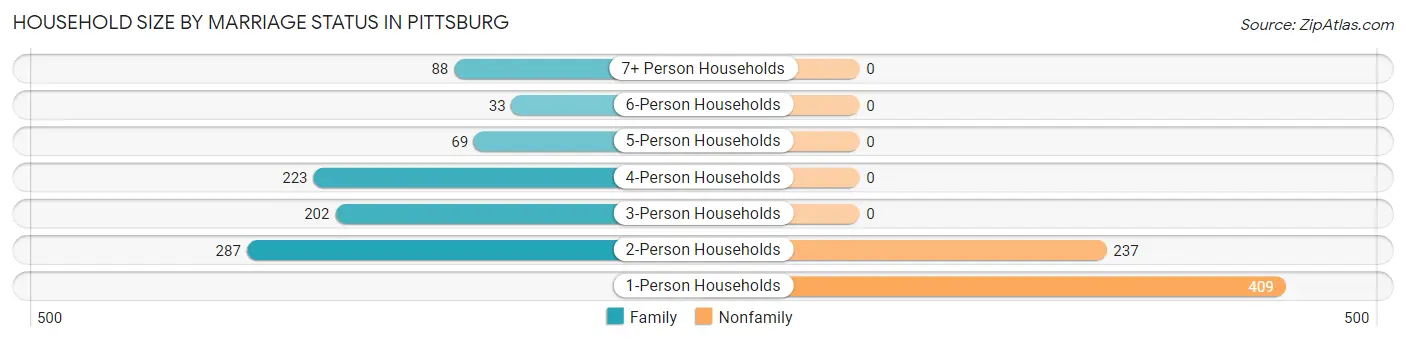
Household Size by Marriage Status in Pittsburg
Out of a total of 1,548 households in Pittsburg, 902 (58.3%) are family households, while 646 (41.7%) are nonfamily households. The most numerous type of family households are 2-person households, comprising 287, and the most common type of nonfamily households are 1-person households, comprising 409.
| Household Size | Family Households | Nonfamily Households |
| 1-Person Households | - | 409 (26.4%) |
| 2-Person Households | 287 (18.5%) | 237 (15.3%) |
| 3-Person Households | 202 (13.1%) | 0 (0.0%) |
| 4-Person Households | 223 (14.4%) | 0 (0.0%) |
| 5-Person Households | 69 (4.5%) | 0 (0.0%) |
| 6-Person Households | 33 (2.1%) | 0 (0.0%) |
| 7+ Person Households | 88 (5.7%) | 0 (0.0%) |
| Total | 902 (58.3%) | 646 (41.7%) |
Female Fertility in Pittsburg
Fertility by Age in Pittsburg
Average fertility rate in Pittsburg is 21.0 births per 1,000 women. Women in the age bracket of 20 to 34 years have the highest fertility rate with 46.0 births per 1,000 women. Women in the age bracket of 20 to 34 years acount for 100.0% of all women with births.
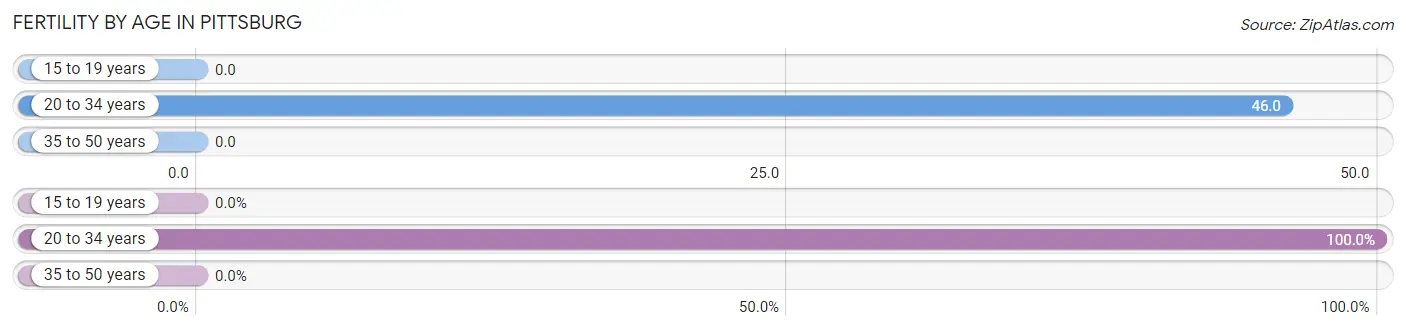
| Age Bracket | Women with Births | Births / 1,000 Women |
| 15 to 19 years | 0 (0.0%) | 0.0 |
| 20 to 34 years | 24 (100.0%) | 46.0 |
| 35 to 50 years | 0 (0.0%) | 0.0 |
| Total | 24 (100.0%) | 21.0 |
Fertility by Age by Marriage Status in Pittsburg
75.0% of women with births (24) in Pittsburg are married. The highest percentage of unmarried women with births falls into 20 to 34 years age bracket with 25.0% of them unmarried at the time of birth, while the lowest percentage of unmarried women with births belong to 20 to 34 years age bracket with 25.0% of them unmarried.
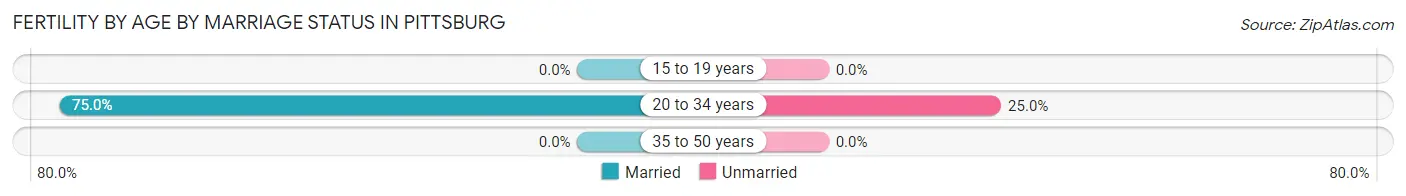
| Age Bracket | Married | Unmarried |
| 15 to 19 years | 0 (0.0%) | 0 (0.0%) |
| 20 to 34 years | 18 (75.0%) | 6 (25.0%) |
| 35 to 50 years | 0 (0.0%) | 0 (0.0%) |
| Total | 18 (75.0%) | 6 (25.0%) |
Fertility by Education in Pittsburg
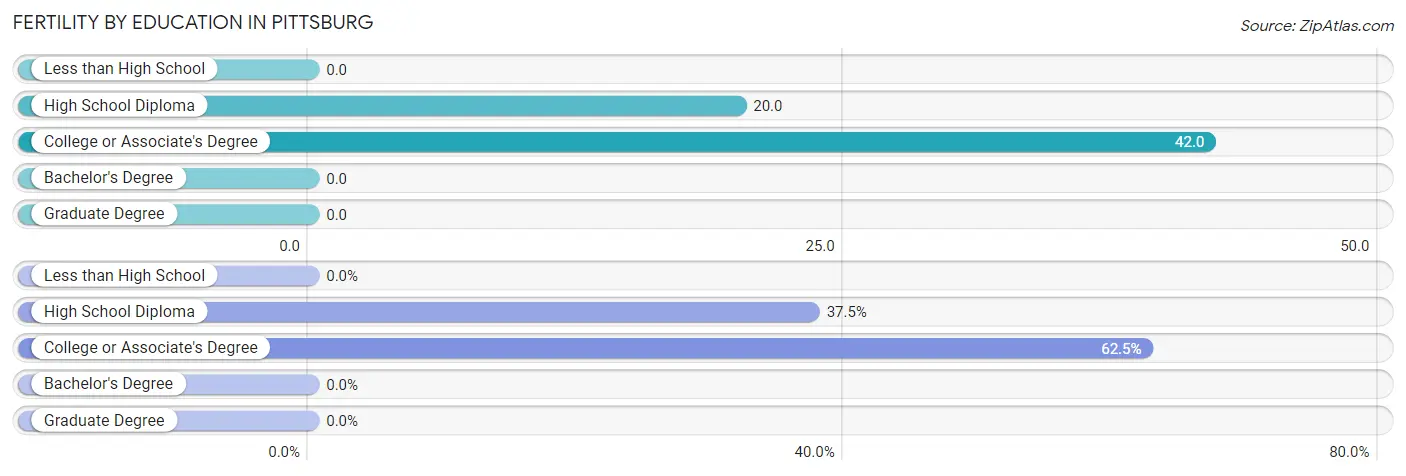
| Educational Attainment | Women with Births | Births / 1,000 Women |
| Less than High School | 0 (0.0%) | 0.0 |
| High School Diploma | 9 (37.5%) | 20.0 |
| College or Associate's Degree | 15 (62.5%) | 42.0 |
| Bachelor's Degree | 0 (0.0%) | 0.0 |
| Graduate Degree | 0 (0.0%) | 0.0 |
| Total | 24 (100.0%) | 21.0 |
Fertility by Education by Marriage Status in Pittsburg
25.0% of women with births in Pittsburg are unmarried. Women with the educational attainment of high school diploma are most likely to be married with 100.0% of them married at childbirth, while women with the educational attainment of college or associate's degree are least likely to be married with 40.0% of them unmarried at childbirth.
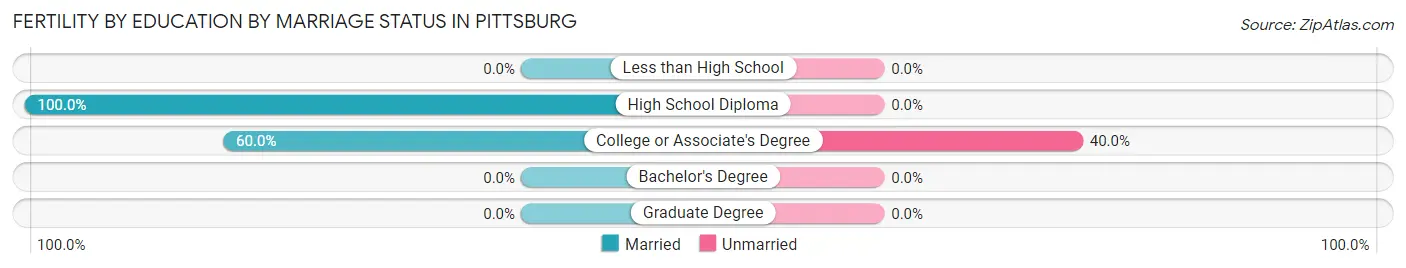
| Educational Attainment | Married | Unmarried |
| Less than High School | 0 (0.0%) | 0 (0.0%) |
| High School Diploma | 9 (100.0%) | 0 (0.0%) |
| College or Associate's Degree | 9 (60.0%) | 6 (40.0%) |
| Bachelor's Degree | 0 (0.0%) | 0 (0.0%) |
| Graduate Degree | 0 (0.0%) | 0 (0.0%) |
| Total | 18 (75.0%) | 6 (25.0%) |
Income in Pittsburg
Income Overview in Pittsburg
Per Capita Income in Pittsburg is $22,869, while median incomes of families and households are $53,795 and $46,885 respectively.
| Characteristic | Number | Measure |
| Per Capita Income | 4,382 | $22,869 |
| Median Family Income | 902 | $53,795 |
| Mean Family Income | 902 | $70,074 |
| Median Household Income | 1,548 | $46,885 |
| Mean Household Income | 1,548 | $60,314 |
| Income Deficit | 902 | $4,709 |
| Wage / Income Gap (%) | 4,382 | 56.17% |
| Wage / Income Gap ($) | 4,382 | 43.83¢ per $1 |
| Gini / Inequality Index | 4,382 | 0.39 |
Earnings by Sex in Pittsburg
Average Earnings in Pittsburg are $33,976, $46,690 for men and $20,464 for women, a difference of 56.2%.
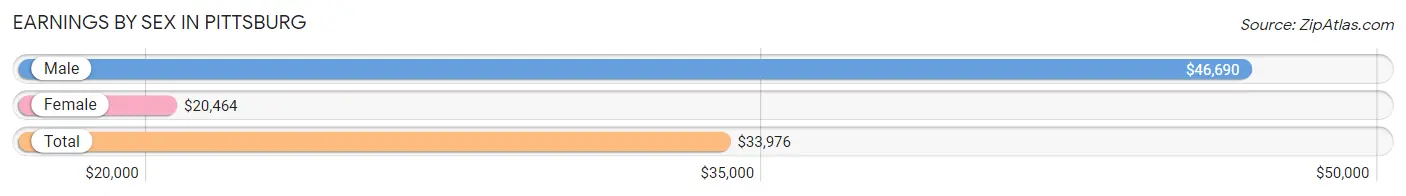
| Sex | Number | Average Earnings |
| Male | 998 (49.3%) | $46,690 |
| Female | 1,025 (50.7%) | $20,464 |
| Total | 2,023 (100.0%) | $33,976 |
Earnings by Sex by Income Bracket in Pittsburg
The most common earnings brackets in Pittsburg are $100,000+ for men (138 | 13.8%) and $30,000 to $34,999 for women (129 | 12.6%).
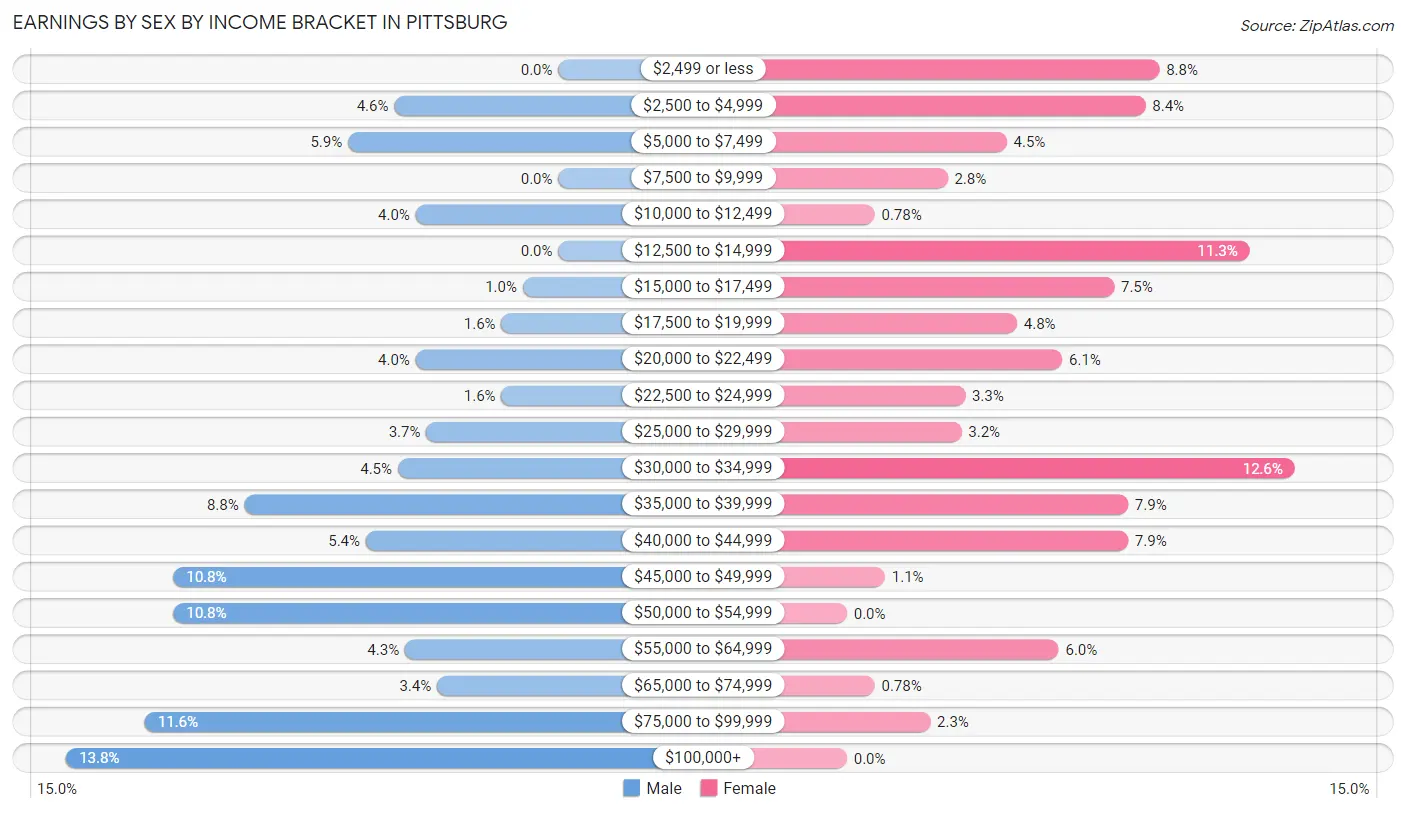
| Income | Male | Female |
| $2,499 or less | 0 (0.0%) | 90 (8.8%) |
| $2,500 to $4,999 | 46 (4.6%) | 86 (8.4%) |
| $5,000 to $7,499 | 59 (5.9%) | 46 (4.5%) |
| $7,500 to $9,999 | 0 (0.0%) | 29 (2.8%) |
| $10,000 to $12,499 | 40 (4.0%) | 8 (0.8%) |
| $12,500 to $14,999 | 0 (0.0%) | 116 (11.3%) |
| $15,000 to $17,499 | 10 (1.0%) | 77 (7.5%) |
| $17,500 to $19,999 | 16 (1.6%) | 49 (4.8%) |
| $20,000 to $22,499 | 40 (4.0%) | 62 (6.0%) |
| $22,500 to $24,999 | 16 (1.6%) | 34 (3.3%) |
| $25,000 to $29,999 | 37 (3.7%) | 33 (3.2%) |
| $30,000 to $34,999 | 45 (4.5%) | 129 (12.6%) |
| $35,000 to $39,999 | 88 (8.8%) | 81 (7.9%) |
| $40,000 to $44,999 | 54 (5.4%) | 81 (7.9%) |
| $45,000 to $49,999 | 108 (10.8%) | 11 (1.1%) |
| $50,000 to $54,999 | 108 (10.8%) | 0 (0.0%) |
| $55,000 to $64,999 | 43 (4.3%) | 61 (5.9%) |
| $65,000 to $74,999 | 34 (3.4%) | 8 (0.8%) |
| $75,000 to $99,999 | 116 (11.6%) | 24 (2.3%) |
| $100,000+ | 138 (13.8%) | 0 (0.0%) |
| Total | 998 (100.0%) | 1,025 (100.0%) |
Earnings by Sex by Educational Attainment in Pittsburg
Average earnings in Pittsburg are $52,149 for men and $24,850 for women, a difference of 52.3%. Men with an educational attainment of high school diploma enjoy the highest average annual earnings of $80,675, while those with college or associate's degree education earn the least with $44,750. Women with an educational attainment of high school diploma earn the most with the average annual earnings of $33,883, while those with bachelor's degree education have the smallest earnings of $16,611.
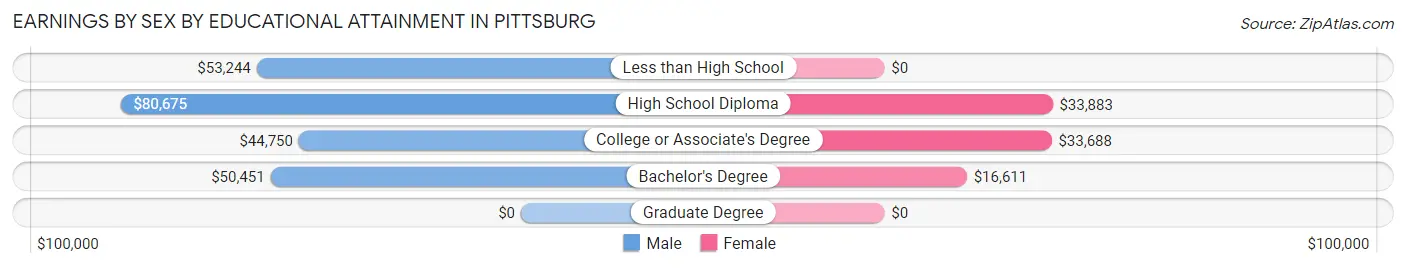
| Educational Attainment | Male Income | Female Income |
| Less than High School | $53,244 | $0 |
| High School Diploma | $80,675 | $33,883 |
| College or Associate's Degree | $44,750 | $33,688 |
| Bachelor's Degree | $50,451 | $16,611 |
| Graduate Degree | - | - |
| Total | $52,149 | $24,850 |
Family Income in Pittsburg
Family Income Brackets in Pittsburg
According to the Pittsburg family income data, there are 222 families falling into the $50,000 to $74,999 income range, which is the most common income bracket and makes up 24.6% of all families.
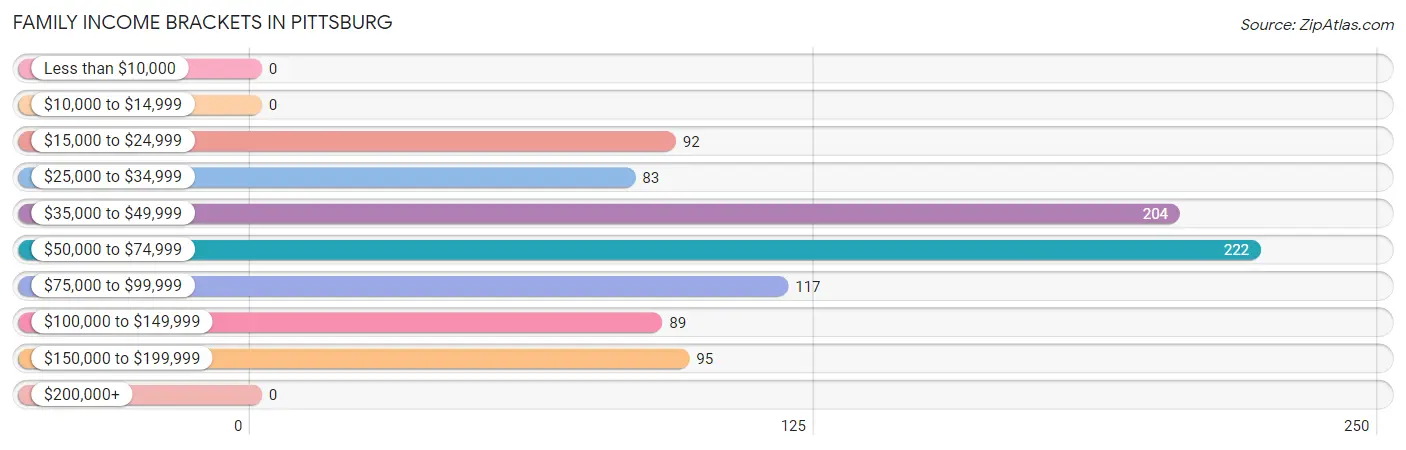
| Income Bracket | # Families | % Families |
| Less than $10,000 | 0 | 0.0% |
| $10,000 to $14,999 | 0 | 0.0% |
| $15,000 to $24,999 | 92 | 10.2% |
| $25,000 to $34,999 | 83 | 9.2% |
| $35,000 to $49,999 | 204 | 22.6% |
| $50,000 to $74,999 | 222 | 24.6% |
| $75,000 to $99,999 | 117 | 13.0% |
| $100,000 to $149,999 | 89 | 9.9% |
| $150,000 to $199,999 | 95 | 10.5% |
| $200,000+ | 0 | 0.0% |
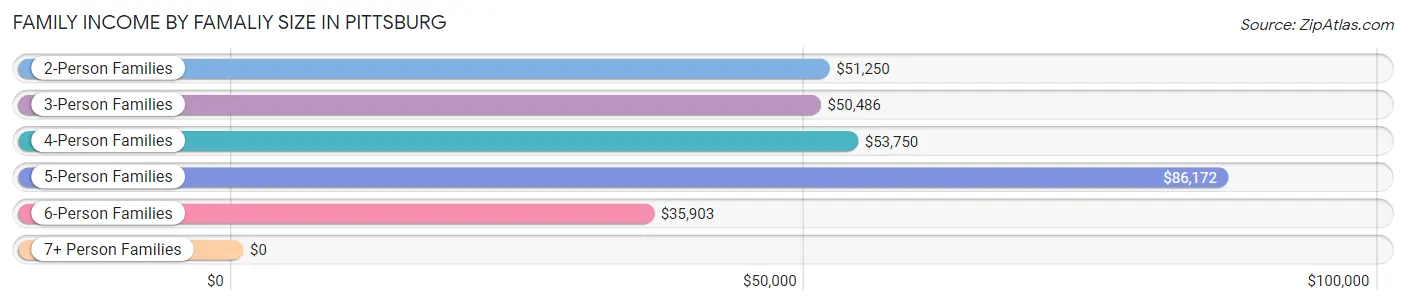
Family Income by Famaliy Size in Pittsburg
5-person families (69 | 7.6%) account for the highest median family income in Pittsburg with $86,172 per family, while 2-person families (305 | 33.8%) have the highest median income of $25,625 per family member.
| Income Bracket | # Families | Median Income |
| 2-Person Families | 305 (33.8%) | $51,250 |
| 3-Person Families | 184 (20.4%) | $50,486 |
| 4-Person Families | 223 (24.7%) | $53,750 |
| 5-Person Families | 69 (7.6%) | $86,172 |
| 6-Person Families | 33 (3.7%) | $35,903 |
| 7+ Person Families | 88 (9.8%) | $0 |
| Total | 902 (100.0%) | $53,795 |
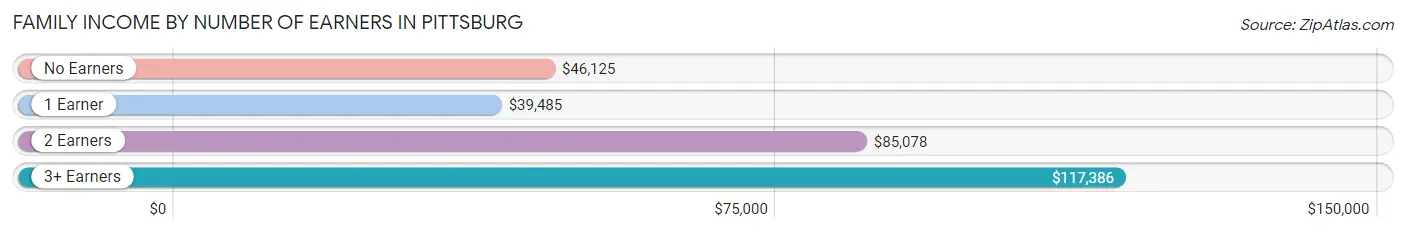
Family Income by Number of Earners in Pittsburg
The median family income in Pittsburg is $53,795, with families comprising 3+ earners (65) having the highest median family income of $117,386, while families with 1 earner (343) have the lowest median family income of $39,485, accounting for 7.2% and 38.0% of families, respectively.
| Number of Earners | # Families | Median Income |
| No Earners | 77 (8.5%) | $46,125 |
| 1 Earner | 343 (38.0%) | $39,485 |
| 2 Earners | 417 (46.2%) | $85,078 |
| 3+ Earners | 65 (7.2%) | $117,386 |
| Total | 902 (100.0%) | $53,795 |
Household Income in Pittsburg
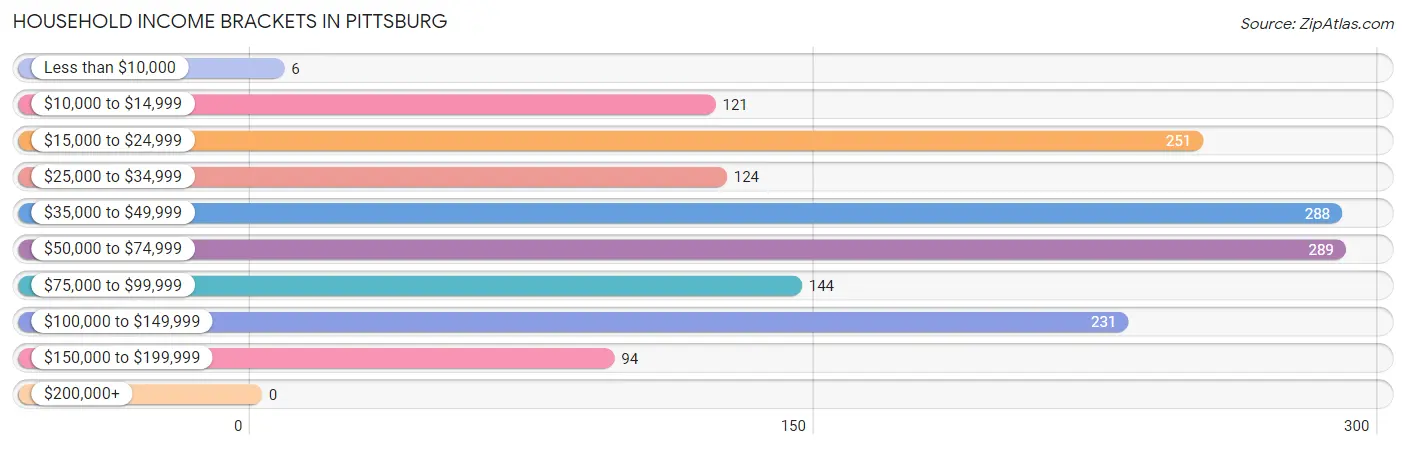
Household Income Brackets in Pittsburg
With 289 households falling in the category, the $50,000 to $74,999 income range is the most frequent in Pittsburg, accounting for 18.7% of all households.
| Income Bracket | # Households | % Households |
| Less than $10,000 | 6 | 0.4% |
| $10,000 to $14,999 | 121 | 7.8% |
| $15,000 to $24,999 | 251 | 16.2% |
| $25,000 to $34,999 | 124 | 8.0% |
| $35,000 to $49,999 | 288 | 18.6% |
| $50,000 to $74,999 | 289 | 18.7% |
| $75,000 to $99,999 | 144 | 9.3% |
| $100,000 to $149,999 | 231 | 14.9% |
| $150,000 to $199,999 | 94 | 6.1% |
| $200,000+ | 0 | 0.0% |
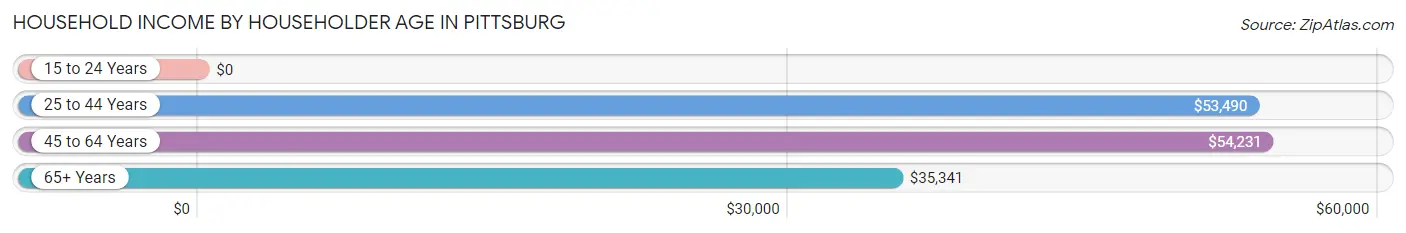
Household Income by Householder Age in Pittsburg
The median household income in Pittsburg is $46,885, with the highest median household income of $54,231 found in the 45 to 64 years age bracket for the primary householder. A total of 482 households (31.1%) fall into this category. Meanwhile, the 15 to 24 years age bracket for the primary householder has the lowest median household income of $0, with 48 households (3.1%) in this group.
| Income Bracket | # Households | Median Income |
| 15 to 24 Years | 48 (3.1%) | $0 |
| 25 to 44 Years | 693 (44.8%) | $53,490 |
| 45 to 64 Years | 482 (31.1%) | $54,231 |
| 65+ Years | 325 (21.0%) | $35,341 |
| Total | 1,548 (100.0%) | $46,885 |
Poverty in Pittsburg
Income Below Poverty by Sex and Age in Pittsburg
With 12.3% poverty level for males and 22.6% for females among the residents of Pittsburg, 6 to 11 year old males and 16 and 17 year old females are the most vulnerable to poverty, with 52 males (27.7%) and 6 females (66.7%) in their respective age groups living below the poverty level.
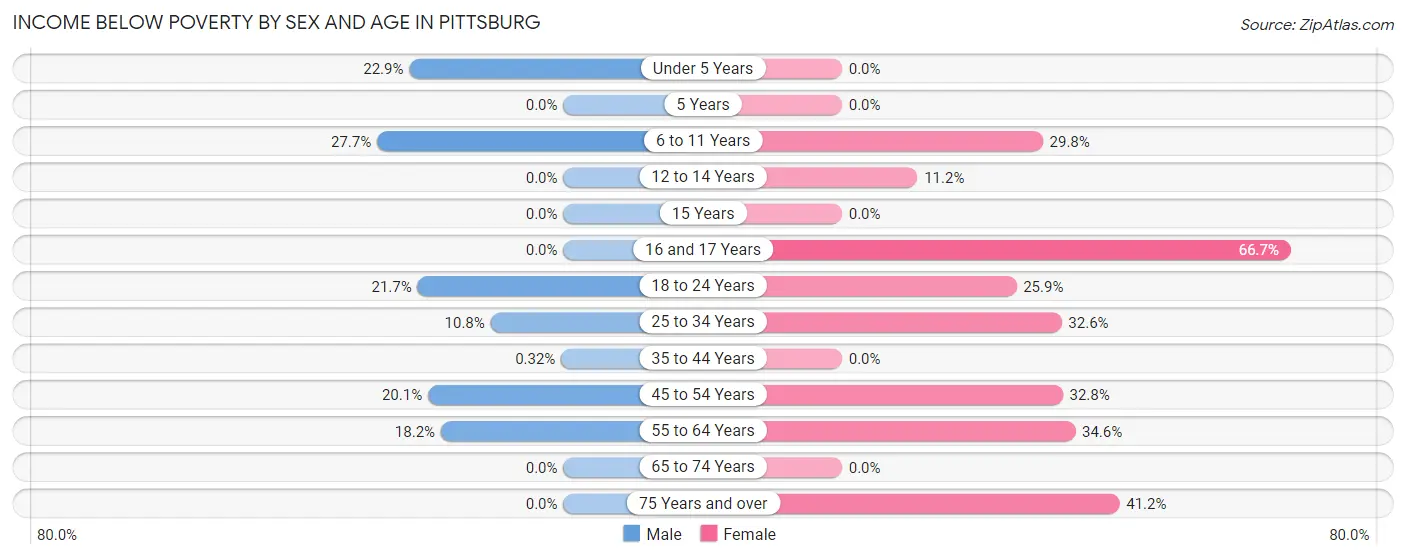
| Age Bracket | Male | Female |
| Under 5 Years | 35 (22.9%) | 0 (0.0%) |
| 5 Years | 0 (0.0%) | 0 (0.0%) |
| 6 to 11 Years | 52 (27.7%) | 65 (29.8%) |
| 12 to 14 Years | 0 (0.0%) | 14 (11.2%) |
| 15 Years | 0 (0.0%) | 0 (0.0%) |
| 16 and 17 Years | 0 (0.0%) | 6 (66.7%) |
| 18 to 24 Years | 55 (21.6%) | 43 (25.9%) |
| 25 to 34 Years | 27 (10.8%) | 136 (32.6%) |
| 35 to 44 Years | 1 (0.3%) | 0 (0.0%) |
| 45 to 54 Years | 42 (20.1%) | 119 (32.8%) |
| 55 to 64 Years | 30 (18.2%) | 80 (34.6%) |
| 65 to 74 Years | 0 (0.0%) | 0 (0.0%) |
| 75 Years and over | 0 (0.0%) | 68 (41.2%) |
| Total | 242 (12.3%) | 531 (22.6%) |
Income Above Poverty by Sex and Age in Pittsburg
According to the poverty statistics in Pittsburg, males aged 5 years and females aged under 5 years are the age groups that are most secure financially, with 100.0% of males and 100.0% of females in these age groups living above the poverty line.
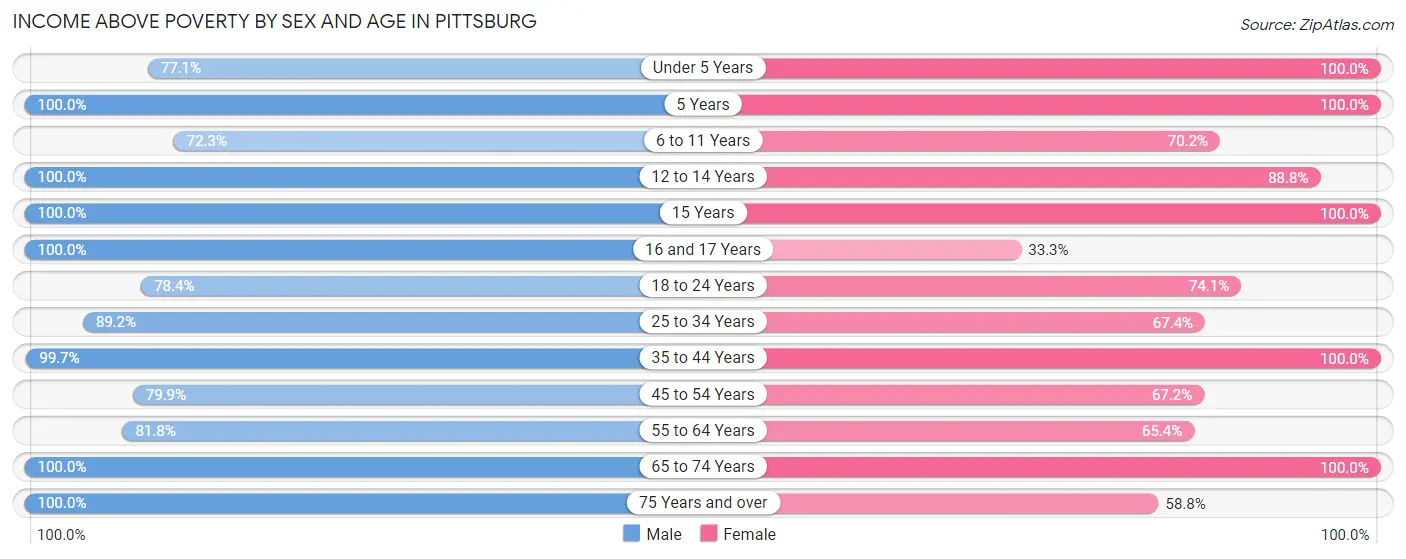
| Age Bracket | Male | Female |
| Under 5 Years | 118 (77.1%) | 232 (100.0%) |
| 5 Years | 29 (100.0%) | 68 (100.0%) |
| 6 to 11 Years | 136 (72.3%) | 153 (70.2%) |
| 12 to 14 Years | 154 (100.0%) | 111 (88.8%) |
| 15 Years | 3 (100.0%) | 55 (100.0%) |
| 16 and 17 Years | 42 (100.0%) | 3 (33.3%) |
| 18 to 24 Years | 199 (78.3%) | 123 (74.1%) |
| 25 to 34 Years | 223 (89.2%) | 281 (67.4%) |
| 35 to 44 Years | 315 (99.7%) | 213 (100.0%) |
| 45 to 54 Years | 167 (79.9%) | 244 (67.2%) |
| 55 to 64 Years | 135 (81.8%) | 151 (65.4%) |
| 65 to 74 Years | 155 (100.0%) | 91 (100.0%) |
| 75 Years and over | 55 (100.0%) | 97 (58.8%) |
| Total | 1,731 (87.7%) | 1,822 (77.4%) |
Income Below Poverty Among Married-Couple Families in Pittsburg
The poverty statistics for married-couple families in Pittsburg show that 9.1% or 50 of the total 550 families live below the poverty line. Families with 3 or 4 children have the highest poverty rate of 23.0%, comprising of 28 families. On the other hand, families with no children have the lowest poverty rate of 0.0%, which includes 0 families.
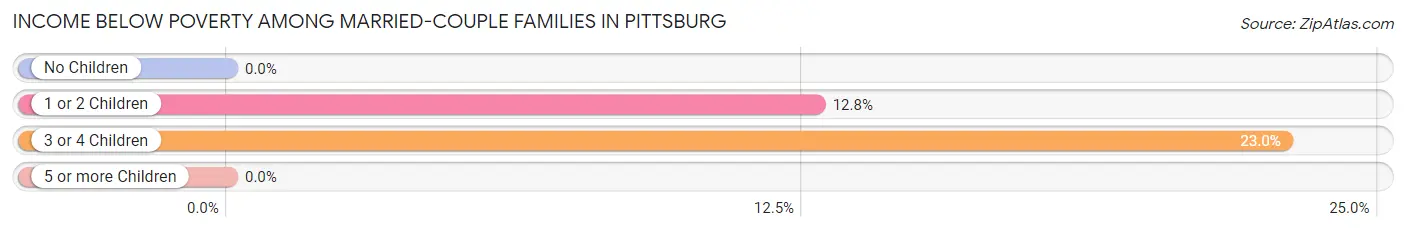
| Children | Above Poverty | Below Poverty |
| No Children | 231 (100.0%) | 0 (0.0%) |
| 1 or 2 Children | 150 (87.2%) | 22 (12.8%) |
| 3 or 4 Children | 94 (77.0%) | 28 (23.0%) |
| 5 or more Children | 25 (100.0%) | 0 (0.0%) |
| Total | 500 (90.9%) | 50 (9.1%) |
Income Below Poverty Among Single-Parent Households in Pittsburg
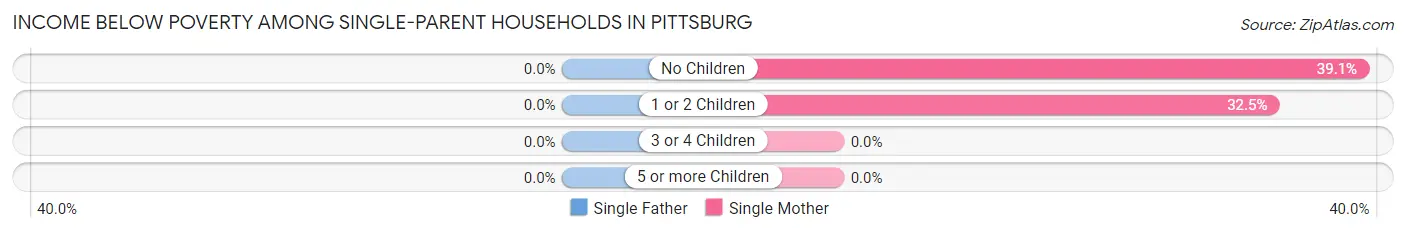
| Children | Single Father | Single Mother |
| No Children | 0 (0.0%) | 18 (39.1%) |
| 1 or 2 Children | 0 (0.0%) | 61 (32.5%) |
| 3 or 4 Children | 0 (0.0%) | 0 (0.0%) |
| 5 or more Children | 0 (0.0%) | 0 (0.0%) |
| Total | 0 (0.0%) | 79 (27.7%) |
Income Below Poverty Among Married-Couple vs Single-Parent Households in Pittsburg
The poverty data for Pittsburg shows that 50 of the married-couple family households (9.1%) and 79 of the single-parent households (22.4%) are living below the poverty level. Within the married-couple family households, those with 3 or 4 children have the highest poverty rate, with 28 households (23.0%) falling below the poverty line. Among the single-parent households, those with 1 or 2 children have the highest poverty rate, with 61 household (27.2%) living below poverty.
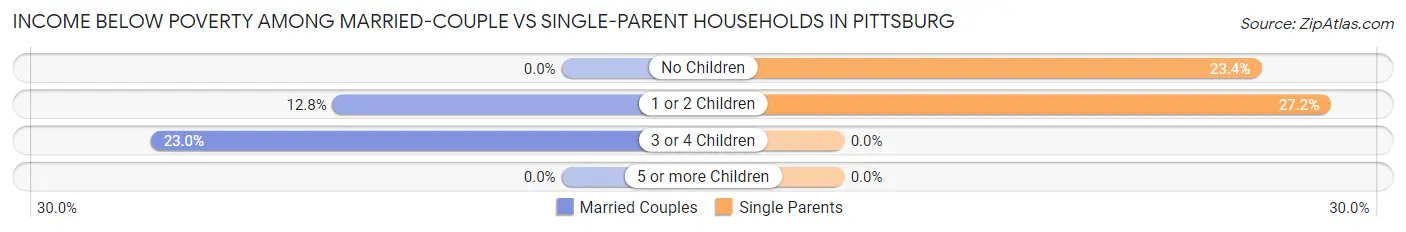
| Children | Married-Couple Families | Single-Parent Households |
| No Children | 0 (0.0%) | 18 (23.4%) |
| 1 or 2 Children | 22 (12.8%) | 61 (27.2%) |
| 3 or 4 Children | 28 (23.0%) | 0 (0.0%) |
| 5 or more Children | 0 (0.0%) | 0 (0.0%) |
| Total | 50 (9.1%) | 79 (22.4%) |
Employment Characteristics in Pittsburg
Employment by Class of Employer in Pittsburg
Among the 1,871 employed individuals in Pittsburg, private company employees (1,490 | 79.6%), local government employees (159 | 8.5%), and not-for-profit organizations (85 | 4.5%) make up the most common classes of employment.
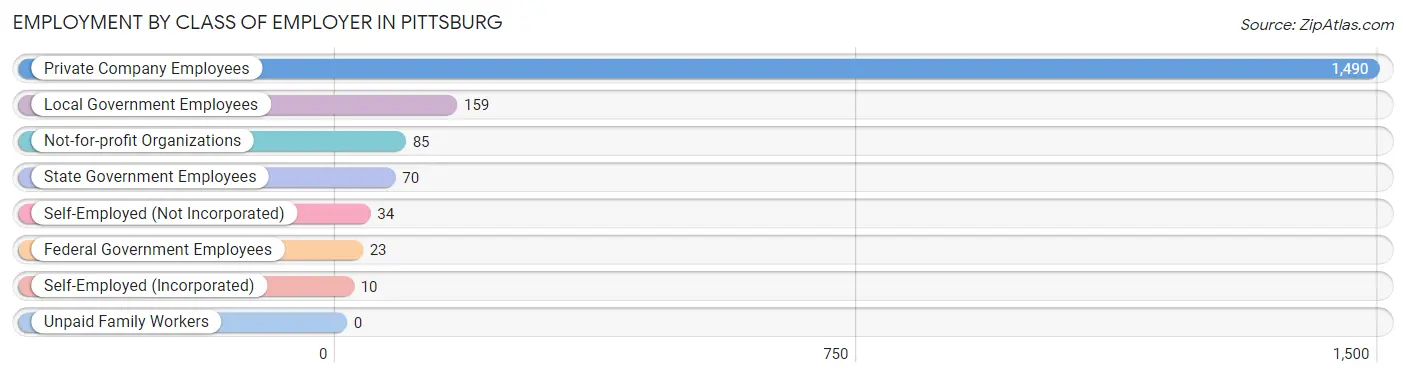
| Employer Class | # Employees | % Employees |
| Private Company Employees | 1,490 | 79.6% |
| Self-Employed (Incorporated) | 10 | 0.5% |
| Self-Employed (Not Incorporated) | 34 | 1.8% |
| Not-for-profit Organizations | 85 | 4.5% |
| Local Government Employees | 159 | 8.5% |
| State Government Employees | 70 | 3.7% |
| Federal Government Employees | 23 | 1.2% |
| Unpaid Family Workers | 0 | 0.0% |
| Total | 1,871 | 100.0% |
Employment Status by Age in Pittsburg
According to the labor force statistics for Pittsburg, out of the total population over 16 years of age (3,157), 62.0% or 1,957 individuals are in the labor force, with 3.9% or 76 of them unemployed. The age group with the highest labor force participation rate is 20 to 24 years, with 92.6% or 187 individuals in the labor force. Within the labor force, the 35 to 44 years age range has the highest percentage of unemployed individuals, with 18.1% or 77 of them being unemployed.
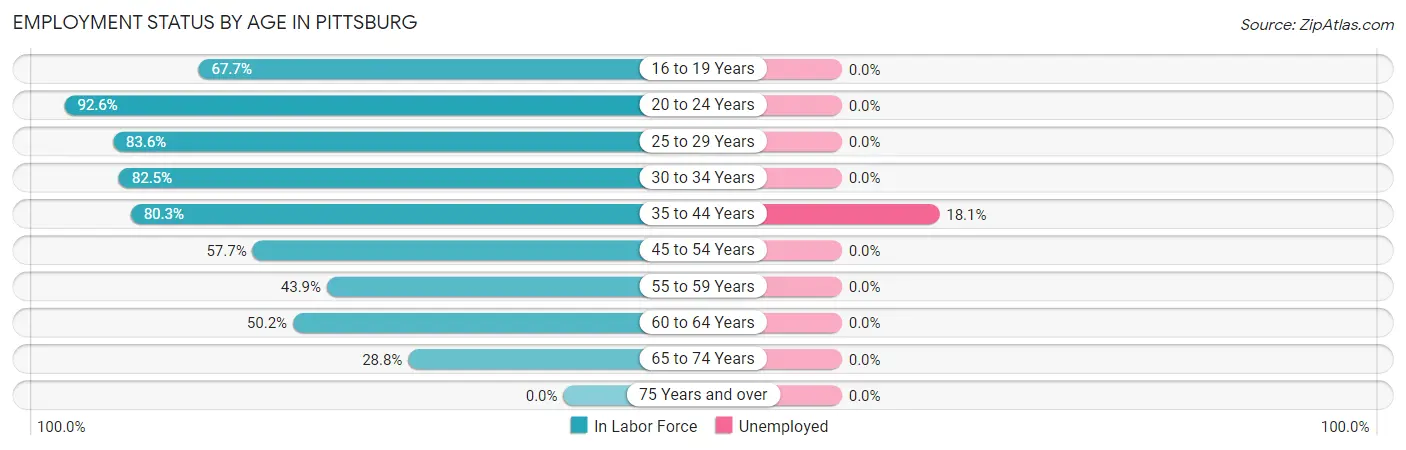
| Age Bracket | In Labor Force | Unemployed |
| 16 to 19 Years | 182 (67.7%) | 0 (0.0%) |
| 20 to 24 Years | 187 (92.6%) | 0 (0.0%) |
| 25 to 29 Years | 353 (83.6%) | 0 (0.0%) |
| 30 to 34 Years | 203 (82.5%) | 0 (0.0%) |
| 35 to 44 Years | 425 (80.3%) | 77 (18.1%) |
| 45 to 54 Years | 330 (57.7%) | 0 (0.0%) |
| 55 to 59 Years | 75 (43.9%) | 0 (0.0%) |
| 60 to 64 Years | 127 (50.2%) | 0 (0.0%) |
| 65 to 74 Years | 74 (28.8%) | 0 (0.0%) |
| 75 Years and over | 0 (0.0%) | 0 (0.0%) |
| Total | 1,957 (62.0%) | 76 (3.9%) |
Employment Status by Educational Attainment in Pittsburg
According to labor force statistics for Pittsburg, 69.0% of individuals (1,513) out of the total population between 25 and 64 years of age (2,193) are in the labor force, with 5.1% or 77 of them being unemployed. The group with the highest labor force participation rate are those with the educational attainment of bachelor's degree or higher, with 92.5% or 333 individuals in the labor force. Within the labor force, individuals with college / associate degree education have the highest percentage of unemployment, with 11.4% or 41 of them being unemployed.
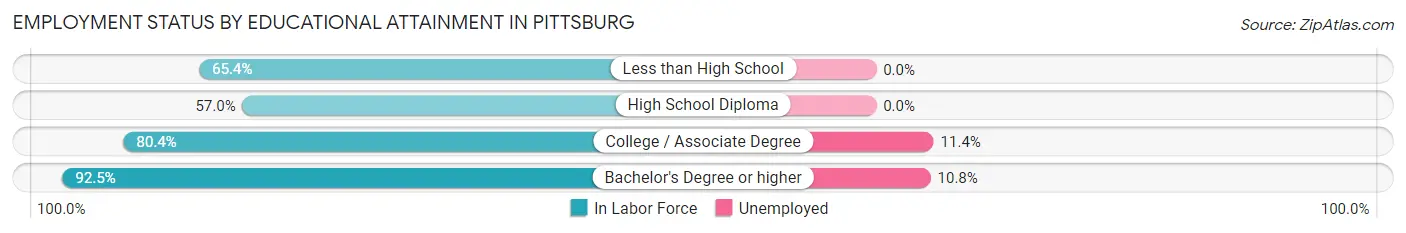
| Educational Attainment | In Labor Force | Unemployed |
| Less than High School | 231 (65.4%) | 0 (0.0%) |
| High School Diploma | 588 (57.0%) | 0 (0.0%) |
| College / Associate Degree | 361 (80.4%) | 51 (11.4%) |
| Bachelor's Degree or higher | 333 (92.5%) | 39 (10.8%) |
| Total | 1,513 (69.0%) | 112 (5.1%) |
Employment Occupations by Sex in Pittsburg
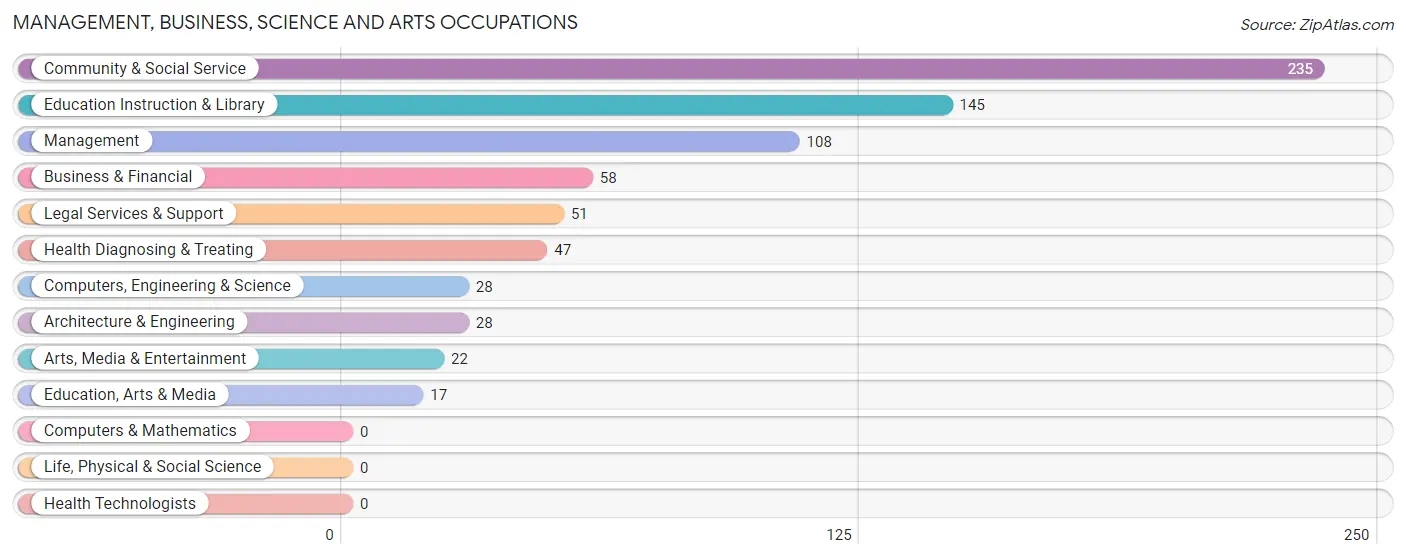
Management, Business, Science and Arts Occupations
The most common Management, Business, Science and Arts occupations in Pittsburg are Community & Social Service (235 | 12.5%), Education Instruction & Library (145 | 7.7%), Management (108 | 5.8%), Business & Financial (58 | 3.1%), and Legal Services & Support (51 | 2.7%).
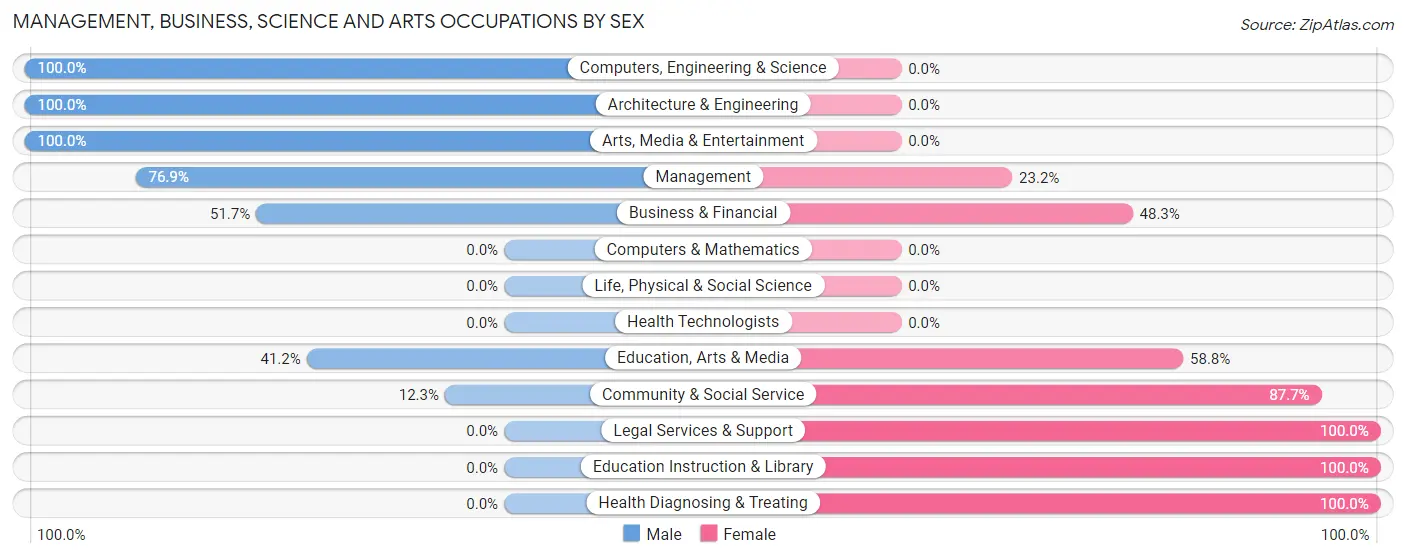
Management, Business, Science and Arts Occupations by Sex
Within the Management, Business, Science and Arts occupations in Pittsburg, the most male-oriented occupations are Computers, Engineering & Science (100.0%), Architecture & Engineering (100.0%), and Arts, Media & Entertainment (100.0%), while the most female-oriented occupations are Legal Services & Support (100.0%), Education Instruction & Library (100.0%), and Health Diagnosing & Treating (100.0%).
| Occupation | Male | Female |
| Management | 83 (76.8%) | 25 (23.2%) |
| Business & Financial | 30 (51.7%) | 28 (48.3%) |
| Computers, Engineering & Science | 28 (100.0%) | 0 (0.0%) |
| Computers & Mathematics | 0 (0.0%) | 0 (0.0%) |
| Architecture & Engineering | 28 (100.0%) | 0 (0.0%) |
| Life, Physical & Social Science | 0 (0.0%) | 0 (0.0%) |
| Community & Social Service | 29 (12.3%) | 206 (87.7%) |
| Education, Arts & Media | 7 (41.2%) | 10 (58.8%) |
| Legal Services & Support | 0 (0.0%) | 51 (100.0%) |
| Education Instruction & Library | 0 (0.0%) | 145 (100.0%) |
| Arts, Media & Entertainment | 22 (100.0%) | 0 (0.0%) |
| Health Diagnosing & Treating | 0 (0.0%) | 47 (100.0%) |
| Health Technologists | 0 (0.0%) | 0 (0.0%) |
| Total (Category) | 170 (35.7%) | 306 (64.3%) |
| Total (Overall) | 929 (49.4%) | 950 (50.6%) |
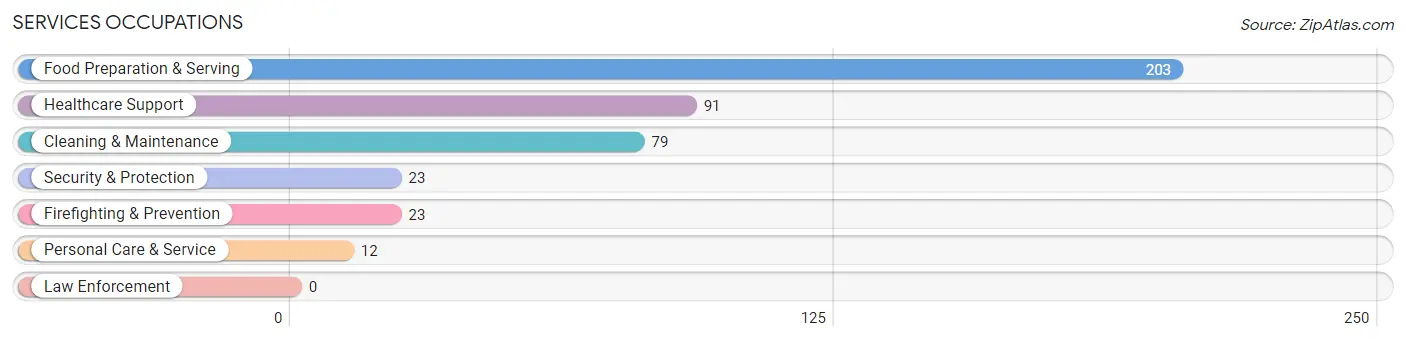
Services Occupations
The most common Services occupations in Pittsburg are Food Preparation & Serving (203 | 10.8%), Healthcare Support (91 | 4.8%), Cleaning & Maintenance (79 | 4.2%), Security & Protection (23 | 1.2%), and Firefighting & Prevention (23 | 1.2%).
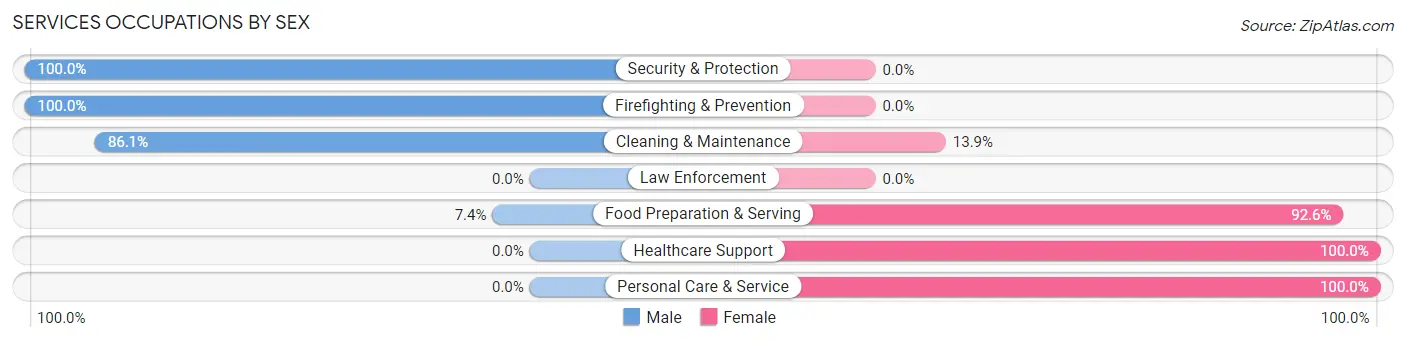
Services Occupations by Sex
Within the Services occupations in Pittsburg, the most male-oriented occupations are Security & Protection (100.0%), Firefighting & Prevention (100.0%), and Cleaning & Maintenance (86.1%), while the most female-oriented occupations are Healthcare Support (100.0%), Personal Care & Service (100.0%), and Food Preparation & Serving (92.6%).
| Occupation | Male | Female |
| Healthcare Support | 0 (0.0%) | 91 (100.0%) |
| Security & Protection | 23 (100.0%) | 0 (0.0%) |
| Firefighting & Prevention | 23 (100.0%) | 0 (0.0%) |
| Law Enforcement | 0 (0.0%) | 0 (0.0%) |
| Food Preparation & Serving | 15 (7.4%) | 188 (92.6%) |
| Cleaning & Maintenance | 68 (86.1%) | 11 (13.9%) |
| Personal Care & Service | 0 (0.0%) | 12 (100.0%) |
| Total (Category) | 106 (26.0%) | 302 (74.0%) |
| Total (Overall) | 929 (49.4%) | 950 (50.6%) |
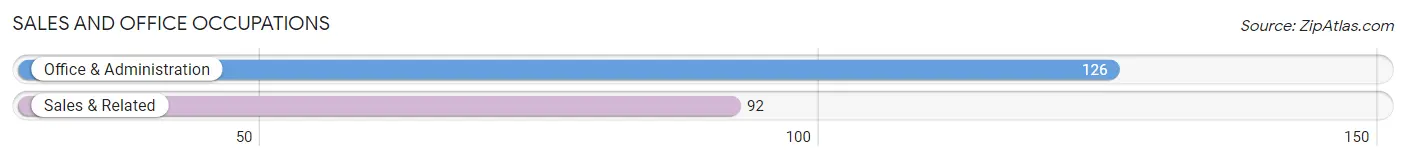
Sales and Office Occupations
The most common Sales and Office occupations in Pittsburg are Office & Administration (126 | 6.7%), and Sales & Related (92 | 4.9%).
Sales and Office Occupations by Sex
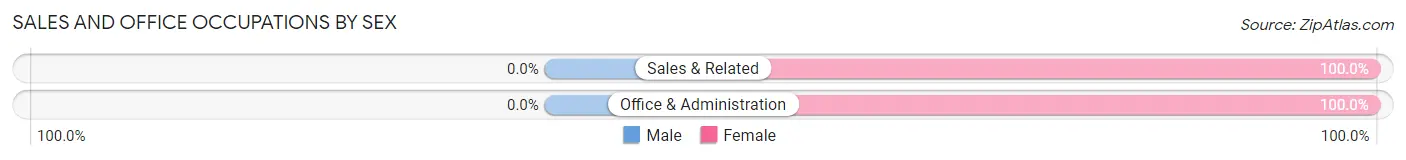
| Occupation | Male | Female |
| Sales & Related | 0 (0.0%) | 92 (100.0%) |
| Office & Administration | 0 (0.0%) | 126 (100.0%) |
| Total (Category) | 0 (0.0%) | 218 (100.0%) |
| Total (Overall) | 929 (49.4%) | 950 (50.6%) |
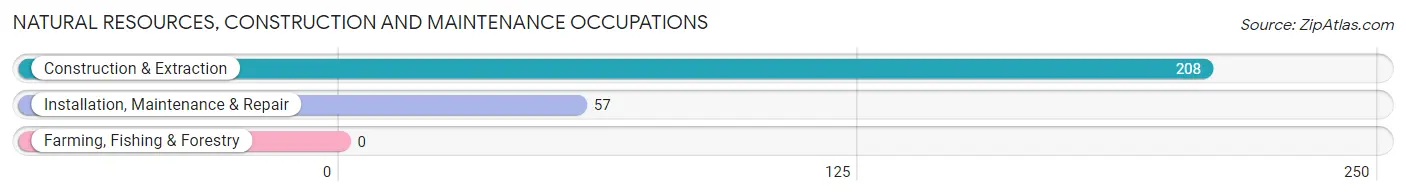
Natural Resources, Construction and Maintenance Occupations
The most common Natural Resources, Construction and Maintenance occupations in Pittsburg are Construction & Extraction (208 | 11.1%), and Installation, Maintenance & Repair (57 | 3.0%).
Natural Resources, Construction and Maintenance Occupations by Sex
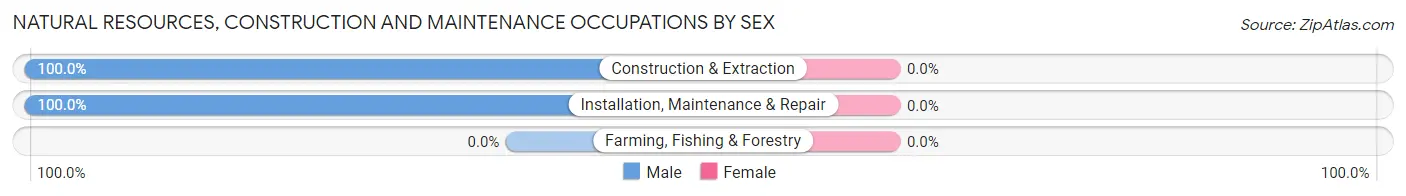
| Occupation | Male | Female |
| Farming, Fishing & Forestry | 0 (0.0%) | 0 (0.0%) |
| Construction & Extraction | 208 (100.0%) | 0 (0.0%) |
| Installation, Maintenance & Repair | 57 (100.0%) | 0 (0.0%) |
| Total (Category) | 265 (100.0%) | 0 (0.0%) |
| Total (Overall) | 929 (49.4%) | 950 (50.6%) |
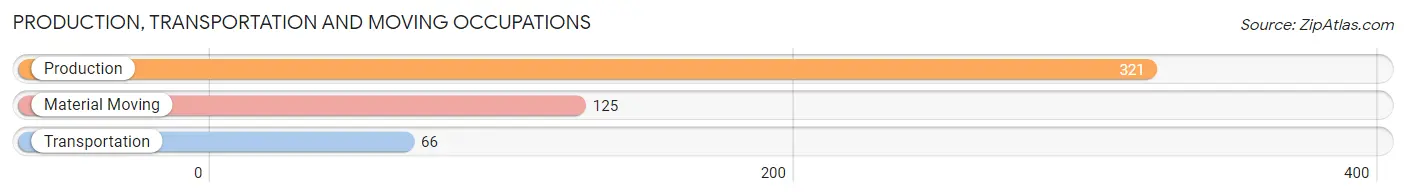
Production, Transportation and Moving Occupations
The most common Production, Transportation and Moving occupations in Pittsburg are Production (321 | 17.1%), Material Moving (125 | 6.7%), and Transportation (66 | 3.5%).
Production, Transportation and Moving Occupations by Sex
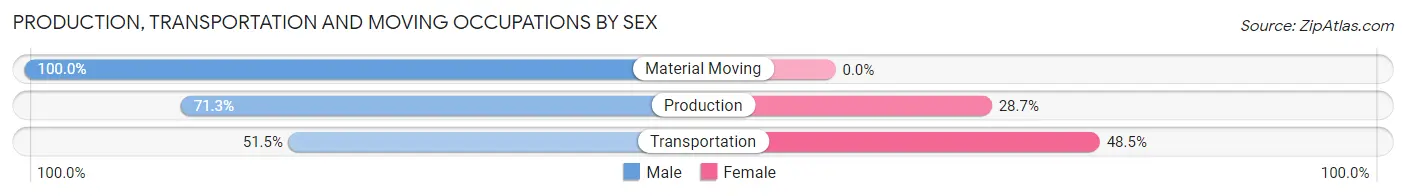
| Occupation | Male | Female |
| Production | 229 (71.3%) | 92 (28.7%) |
| Transportation | 34 (51.5%) | 32 (48.5%) |
| Material Moving | 125 (100.0%) | 0 (0.0%) |
| Total (Category) | 388 (75.8%) | 124 (24.2%) |
| Total (Overall) | 929 (49.4%) | 950 (50.6%) |
Employment Industries by Sex in Pittsburg
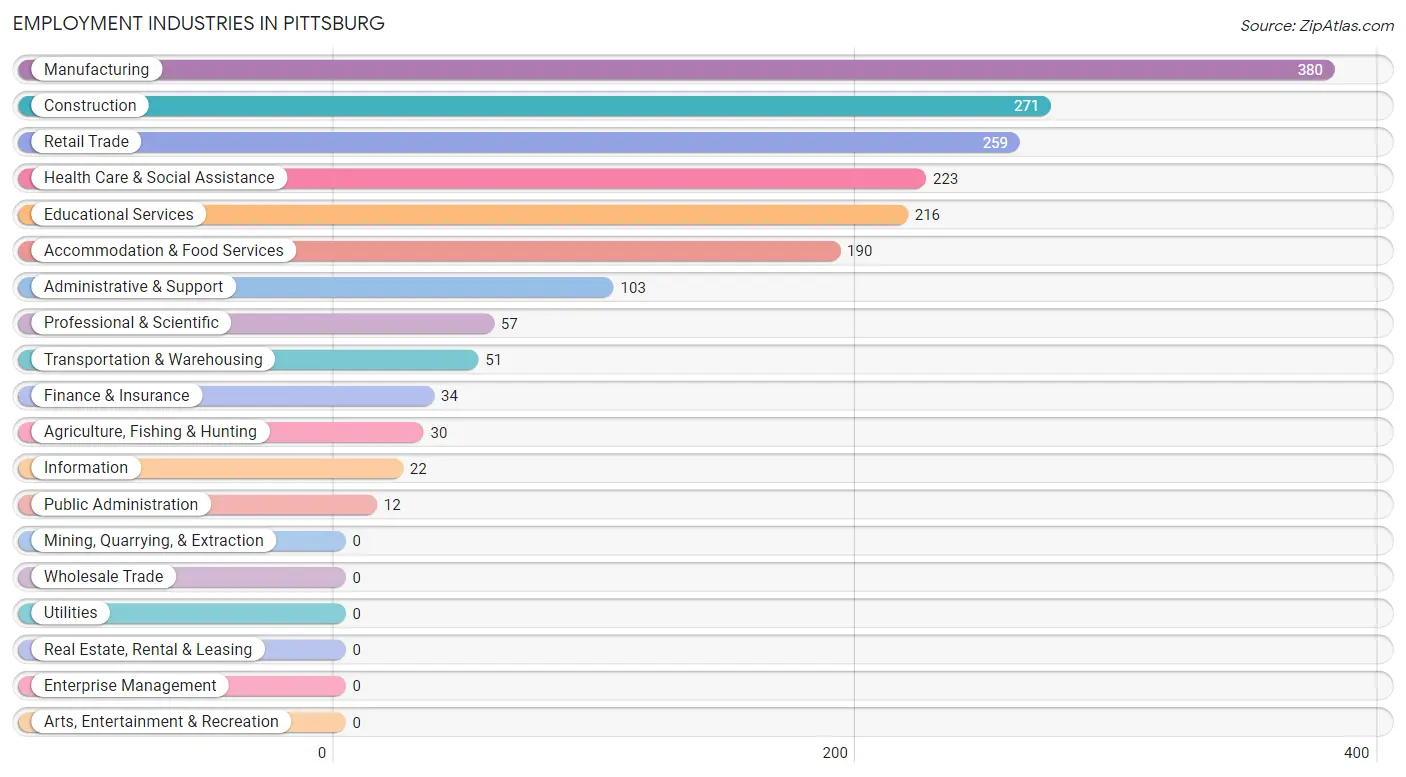
Employment Industries in Pittsburg
The major employment industries in Pittsburg include Manufacturing (380 | 20.2%), Construction (271 | 14.4%), Retail Trade (259 | 13.8%), Health Care & Social Assistance (223 | 11.9%), and Educational Services (216 | 11.5%).
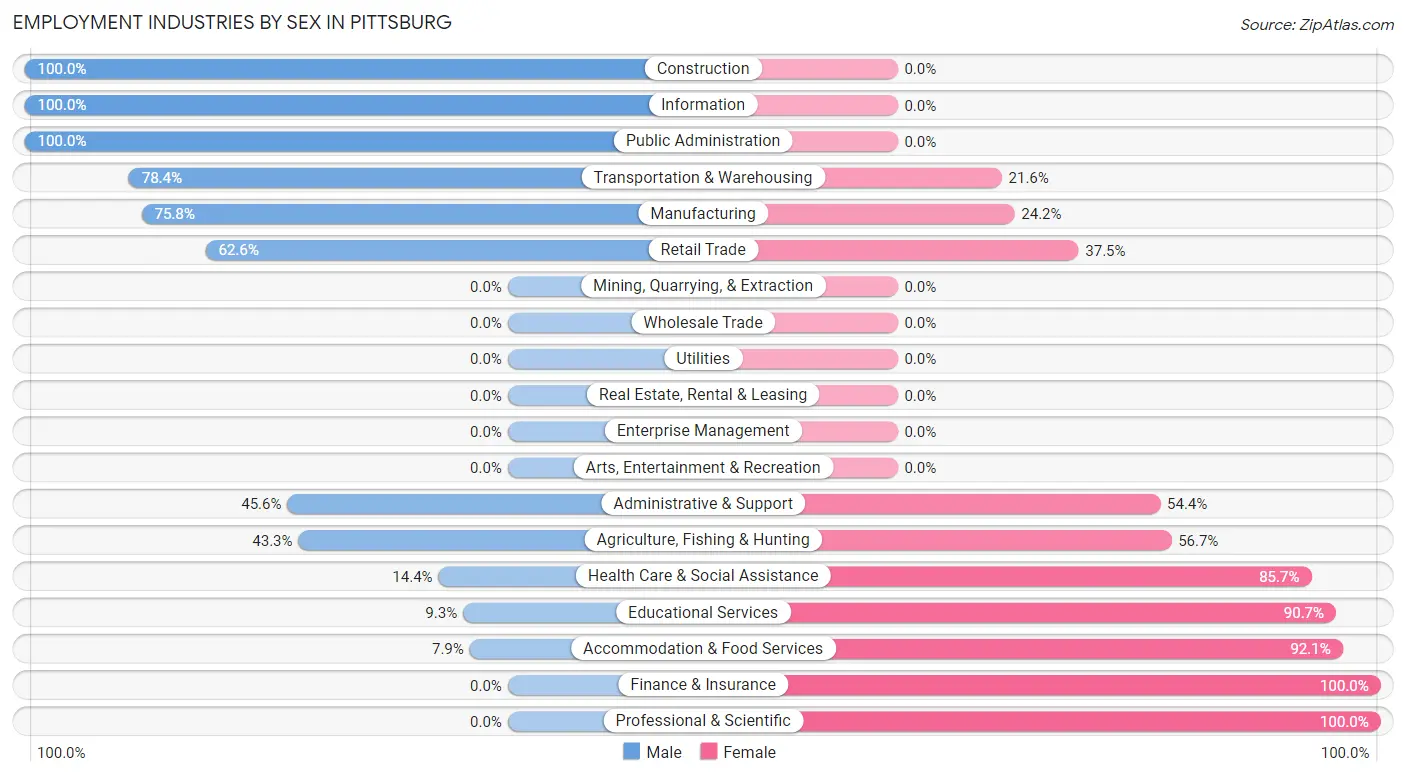
Employment Industries by Sex in Pittsburg
The Pittsburg industries that see more men than women are Construction (100.0%), Information (100.0%), and Public Administration (100.0%), whereas the industries that tend to have a higher number of women are Finance & Insurance (100.0%), Professional & Scientific (100.0%), and Accommodation & Food Services (92.1%).
| Industry | Male | Female |
| Agriculture, Fishing & Hunting | 13 (43.3%) | 17 (56.7%) |
| Mining, Quarrying, & Extraction | 0 (0.0%) | 0 (0.0%) |
| Construction | 271 (100.0%) | 0 (0.0%) |
| Manufacturing | 288 (75.8%) | 92 (24.2%) |
| Wholesale Trade | 0 (0.0%) | 0 (0.0%) |
| Retail Trade | 162 (62.5%) | 97 (37.4%) |
| Transportation & Warehousing | 40 (78.4%) | 11 (21.6%) |
| Utilities | 0 (0.0%) | 0 (0.0%) |
| Information | 22 (100.0%) | 0 (0.0%) |
| Finance & Insurance | 0 (0.0%) | 34 (100.0%) |
| Real Estate, Rental & Leasing | 0 (0.0%) | 0 (0.0%) |
| Professional & Scientific | 0 (0.0%) | 57 (100.0%) |
| Enterprise Management | 0 (0.0%) | 0 (0.0%) |
| Administrative & Support | 47 (45.6%) | 56 (54.4%) |
| Educational Services | 20 (9.3%) | 196 (90.7%) |
| Health Care & Social Assistance | 32 (14.3%) | 191 (85.7%) |
| Arts, Entertainment & Recreation | 0 (0.0%) | 0 (0.0%) |
| Accommodation & Food Services | 15 (7.9%) | 175 (92.1%) |
| Public Administration | 12 (100.0%) | 0 (0.0%) |
| Total | 929 (49.4%) | 950 (50.6%) |
Education in Pittsburg
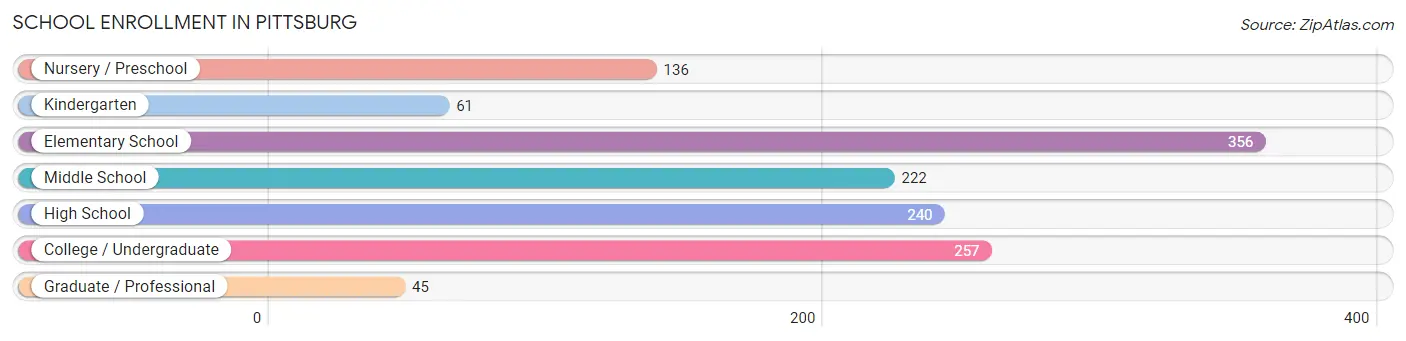
School Enrollment in Pittsburg
The most common levels of schooling among the 1,317 students in Pittsburg are elementary school (356 | 27.0%), college / undergraduate (257 | 19.5%), and high school (240 | 18.2%).
| School Level | # Students | % Students |
| Nursery / Preschool | 136 | 10.3% |
| Kindergarten | 61 | 4.6% |
| Elementary School | 356 | 27.0% |
| Middle School | 222 | 16.9% |
| High School | 240 | 18.2% |
| College / Undergraduate | 257 | 19.5% |
| Graduate / Professional | 45 | 3.4% |
| Total | 1,317 | 100.0% |
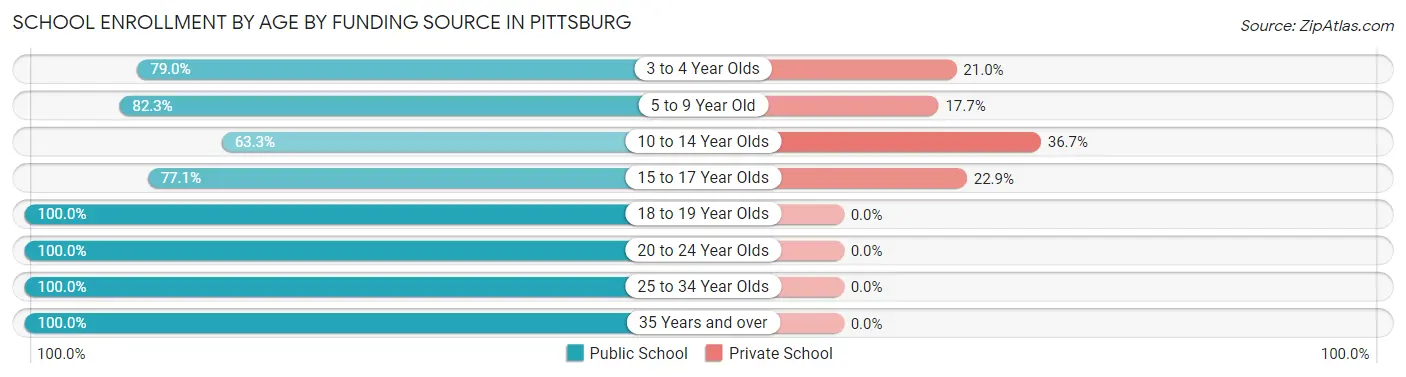
School Enrollment by Age by Funding Source in Pittsburg
Out of a total of 1,317 students who are enrolled in schools in Pittsburg, 246 (18.7%) attend a private institution, while the remaining 1,071 (81.3%) are enrolled in public schools. The age group of 10 to 14 year olds has the highest likelihood of being enrolled in private schools, with 123 (36.7% in the age bracket) enrolled. Conversely, the age group of 18 to 19 year olds has the lowest likelihood of being enrolled in a private school, with 118 (100.0% in the age bracket) attending a public institution.
| Age Bracket | Public School | Private School |
| 3 to 4 Year Olds | 79 (79.0%) | 21 (21.0%) |
| 5 to 9 Year Old | 359 (82.3%) | 77 (17.7%) |
| 10 to 14 Year Olds | 212 (63.3%) | 123 (36.7%) |
| 15 to 17 Year Olds | 84 (77.1%) | 25 (22.9%) |
| 18 to 19 Year Olds | 118 (100.0%) | 0 (0.0%) |
| 20 to 24 Year Olds | 98 (100.0%) | 0 (0.0%) |
| 25 to 34 Year Olds | 97 (100.0%) | 0 (0.0%) |
| 35 Years and over | 24 (100.0%) | 0 (0.0%) |
| Total | 1,071 (81.3%) | 246 (18.7%) |
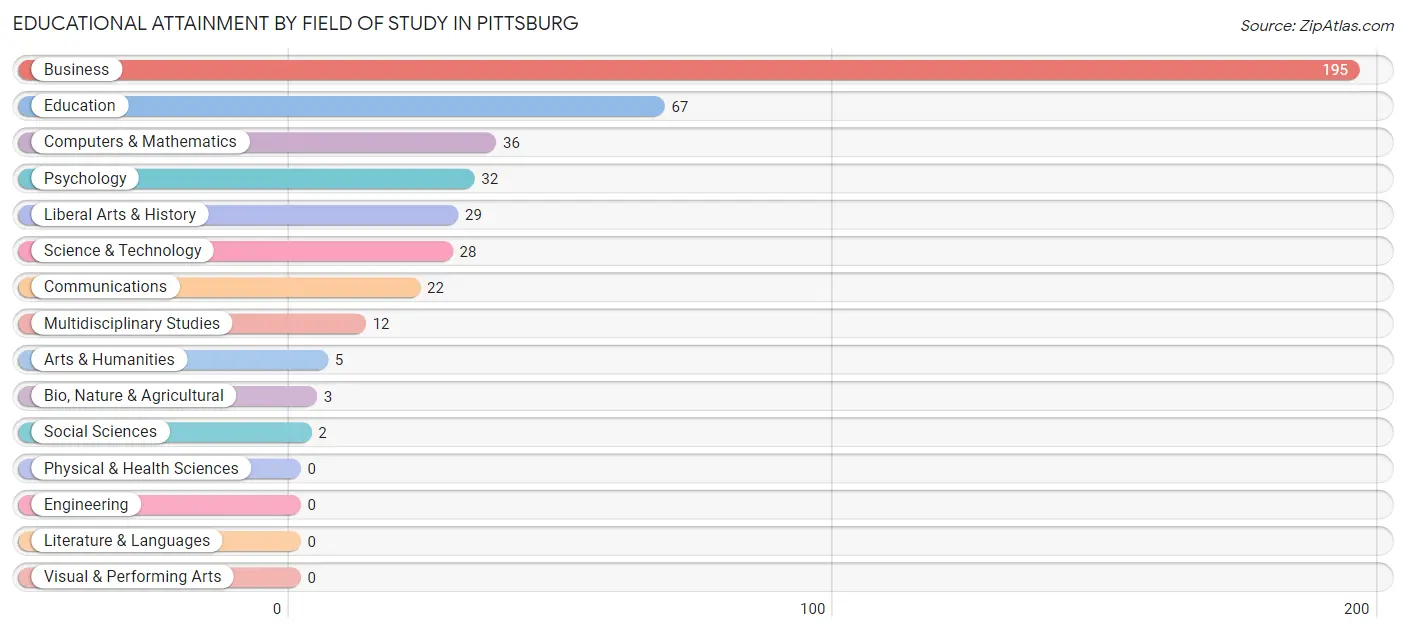
Educational Attainment by Field of Study in Pittsburg
Business (195 | 45.2%), education (67 | 15.5%), computers & mathematics (36 | 8.4%), psychology (32 | 7.4%), and liberal arts & history (29 | 6.7%) are the most common fields of study among 431 individuals in Pittsburg who have obtained a bachelor's degree or higher.
| Field of Study | # Graduates | % Graduates |
| Computers & Mathematics | 36 | 8.4% |
| Bio, Nature & Agricultural | 3 | 0.7% |
| Physical & Health Sciences | 0 | 0.0% |
| Psychology | 32 | 7.4% |
| Social Sciences | 2 | 0.5% |
| Engineering | 0 | 0.0% |
| Multidisciplinary Studies | 12 | 2.8% |
| Science & Technology | 28 | 6.5% |
| Business | 195 | 45.2% |
| Education | 67 | 15.5% |
| Literature & Languages | 0 | 0.0% |
| Liberal Arts & History | 29 | 6.7% |
| Visual & Performing Arts | 0 | 0.0% |
| Communications | 22 | 5.1% |
| Arts & Humanities | 5 | 1.2% |
| Total | 431 | 100.0% |
Transportation & Commute in Pittsburg
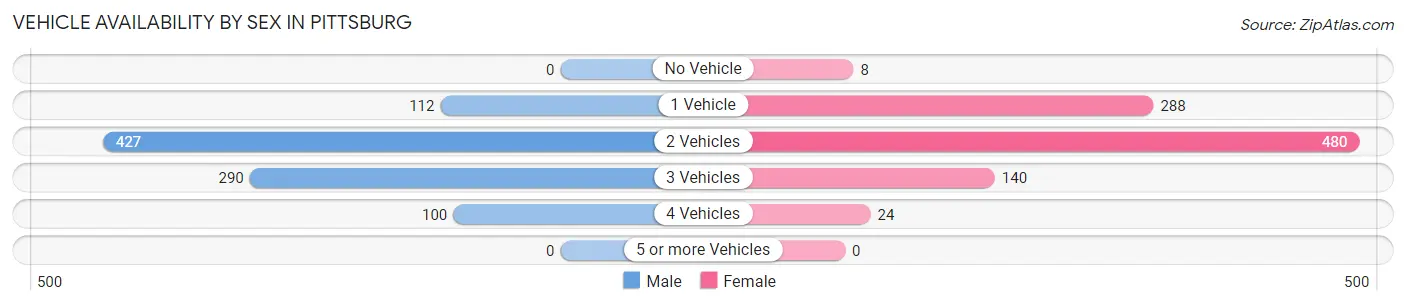
Vehicle Availability by Sex in Pittsburg
The most prevalent vehicle ownership categories in Pittsburg are males with 2 vehicles (427, accounting for 46.0%) and females with 2 vehicles (480, making up 45.4%).
| Vehicles Available | Male | Female |
| No Vehicle | 0 (0.0%) | 8 (0.9%) |
| 1 Vehicle | 112 (12.1%) | 288 (30.6%) |
| 2 Vehicles | 427 (46.0%) | 480 (51.1%) |
| 3 Vehicles | 290 (31.2%) | 140 (14.9%) |
| 4 Vehicles | 100 (10.8%) | 24 (2.5%) |
| 5 or more Vehicles | 0 (0.0%) | 0 (0.0%) |
| Total | 929 (100.0%) | 940 (100.0%) |
Commute Time in Pittsburg
The most frequently occuring commute durations in Pittsburg are 20 to 24 minutes (503 commuters, 26.9%), 15 to 19 minutes (400 commuters, 21.4%), and 5 to 9 minutes (347 commuters, 18.5%).
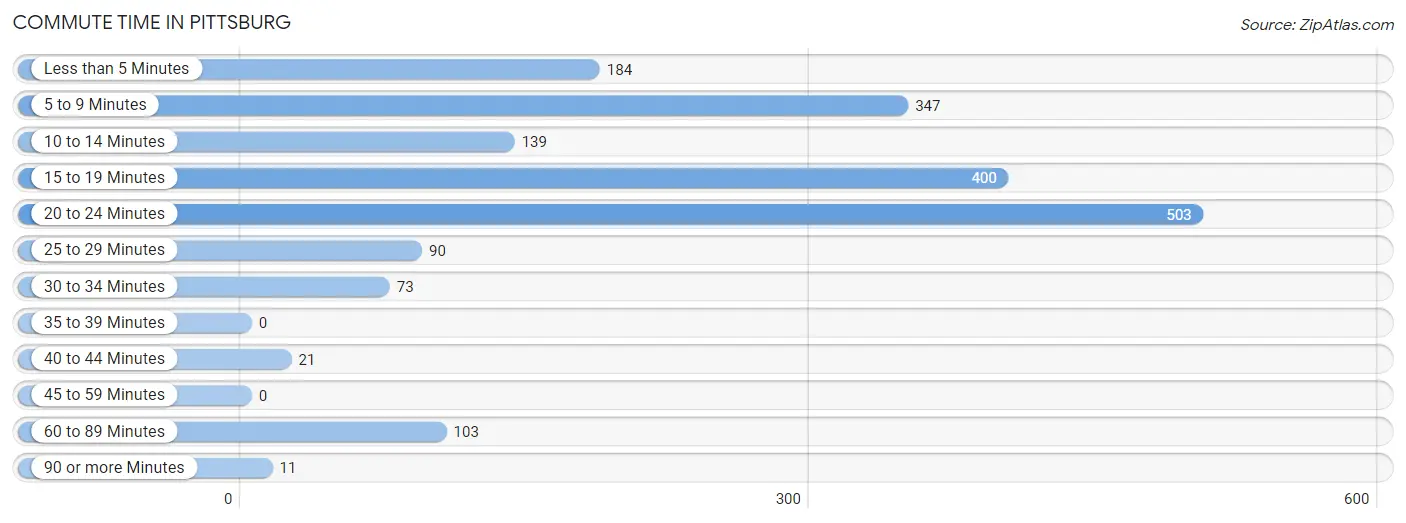
| Commute Time | # Commuters | % Commuters |
| Less than 5 Minutes | 184 | 9.8% |
| 5 to 9 Minutes | 347 | 18.5% |
| 10 to 14 Minutes | 139 | 7.4% |
| 15 to 19 Minutes | 400 | 21.4% |
| 20 to 24 Minutes | 503 | 26.9% |
| 25 to 29 Minutes | 90 | 4.8% |
| 30 to 34 Minutes | 73 | 3.9% |
| 35 to 39 Minutes | 0 | 0.0% |
| 40 to 44 Minutes | 21 | 1.1% |
| 45 to 59 Minutes | 0 | 0.0% |
| 60 to 89 Minutes | 103 | 5.5% |
| 90 or more Minutes | 11 | 0.6% |
Commute Time by Sex in Pittsburg
The most common commute times in Pittsburg are 5 to 9 minutes (296 commuters, 31.9%) for males and 20 to 24 minutes (261 commuters, 27.7%) for females.
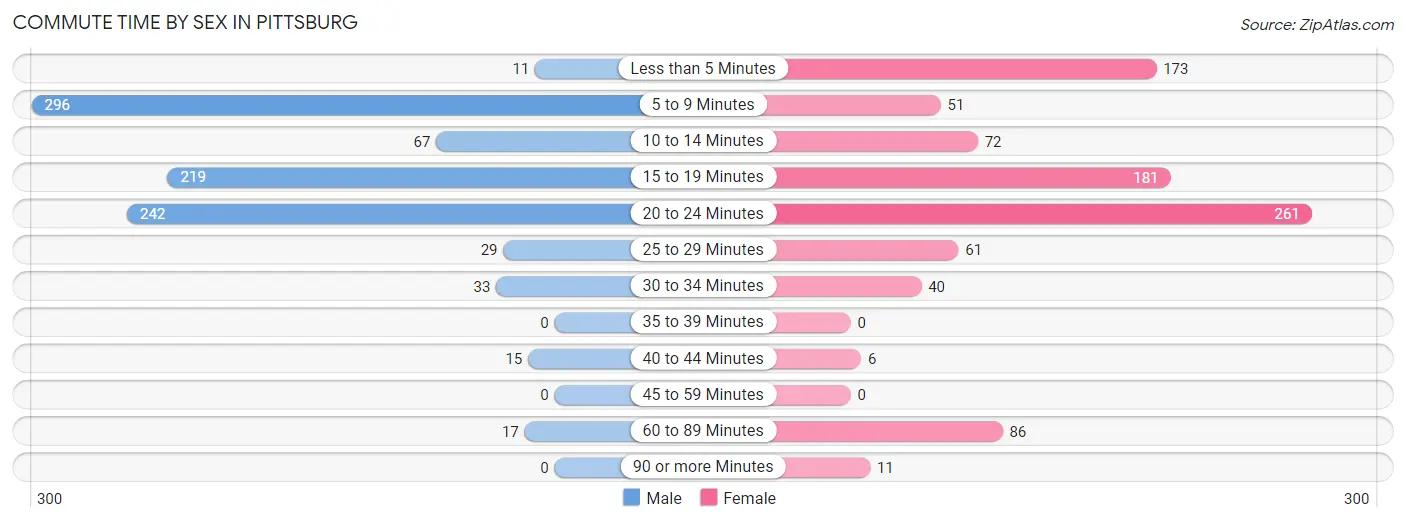
| Commute Time | Male | Female |
| Less than 5 Minutes | 11 (1.2%) | 173 (18.4%) |
| 5 to 9 Minutes | 296 (31.9%) | 51 (5.4%) |
| 10 to 14 Minutes | 67 (7.2%) | 72 (7.6%) |
| 15 to 19 Minutes | 219 (23.6%) | 181 (19.2%) |
| 20 to 24 Minutes | 242 (26.1%) | 261 (27.7%) |
| 25 to 29 Minutes | 29 (3.1%) | 61 (6.5%) |
| 30 to 34 Minutes | 33 (3.5%) | 40 (4.3%) |
| 35 to 39 Minutes | 0 (0.0%) | 0 (0.0%) |
| 40 to 44 Minutes | 15 (1.6%) | 6 (0.6%) |
| 45 to 59 Minutes | 0 (0.0%) | 0 (0.0%) |
| 60 to 89 Minutes | 17 (1.8%) | 86 (9.1%) |
| 90 or more Minutes | 0 (0.0%) | 11 (1.2%) |
Time of Departure to Work by Sex in Pittsburg
The most frequent times of departure to work in Pittsburg are 7:30 AM to 7:59 AM (203, 21.8%) for males and 7:30 AM to 7:59 AM (353, 37.5%) for females.
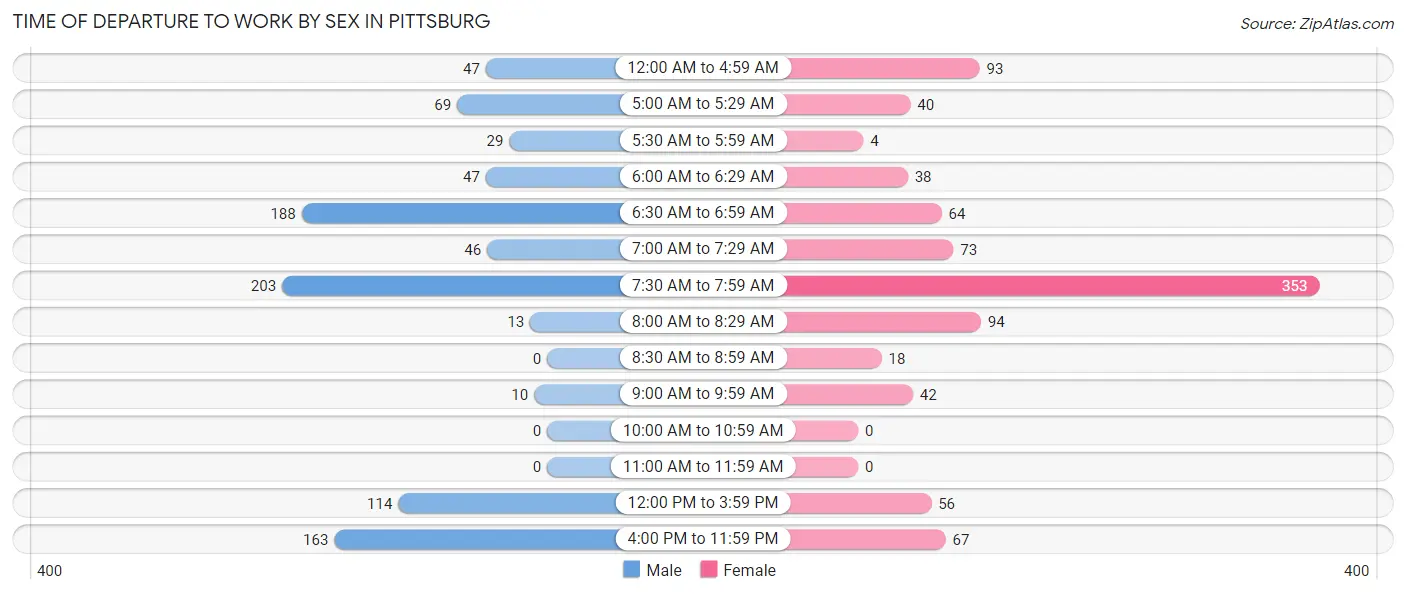
| Time of Departure | Male | Female |
| 12:00 AM to 4:59 AM | 47 (5.1%) | 93 (9.9%) |
| 5:00 AM to 5:29 AM | 69 (7.4%) | 40 (4.3%) |
| 5:30 AM to 5:59 AM | 29 (3.1%) | 4 (0.4%) |
| 6:00 AM to 6:29 AM | 47 (5.1%) | 38 (4.0%) |
| 6:30 AM to 6:59 AM | 188 (20.2%) | 64 (6.8%) |
| 7:00 AM to 7:29 AM | 46 (5.0%) | 73 (7.7%) |
| 7:30 AM to 7:59 AM | 203 (21.8%) | 353 (37.5%) |
| 8:00 AM to 8:29 AM | 13 (1.4%) | 94 (10.0%) |
| 8:30 AM to 8:59 AM | 0 (0.0%) | 18 (1.9%) |
| 9:00 AM to 9:59 AM | 10 (1.1%) | 42 (4.5%) |
| 10:00 AM to 10:59 AM | 0 (0.0%) | 0 (0.0%) |
| 11:00 AM to 11:59 AM | 0 (0.0%) | 0 (0.0%) |
| 12:00 PM to 3:59 PM | 114 (12.3%) | 56 (5.9%) |
| 4:00 PM to 11:59 PM | 163 (17.5%) | 67 (7.1%) |
| Total | 929 (100.0%) | 942 (100.0%) |
Housing Occupancy in Pittsburg
Occupancy by Ownership in Pittsburg
Of the total 1,548 dwellings in Pittsburg, owner-occupied units account for 911 (58.9%), while renter-occupied units make up 637 (41.1%).
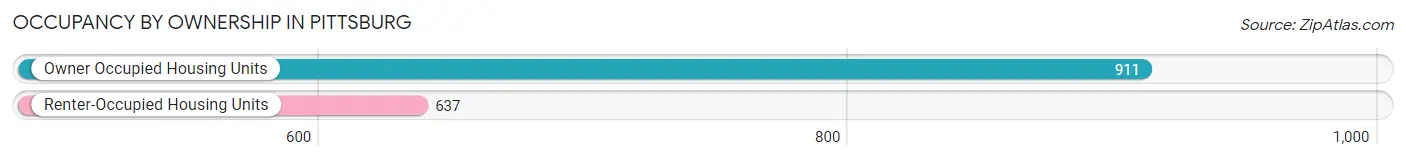
| Occupancy | # Housing Units | % Housing Units |
| Owner Occupied Housing Units | 911 | 58.9% |
| Renter-Occupied Housing Units | 637 | 41.1% |
| Total Occupied Housing Units | 1,548 | 100.0% |
Occupancy by Household Size in Pittsburg
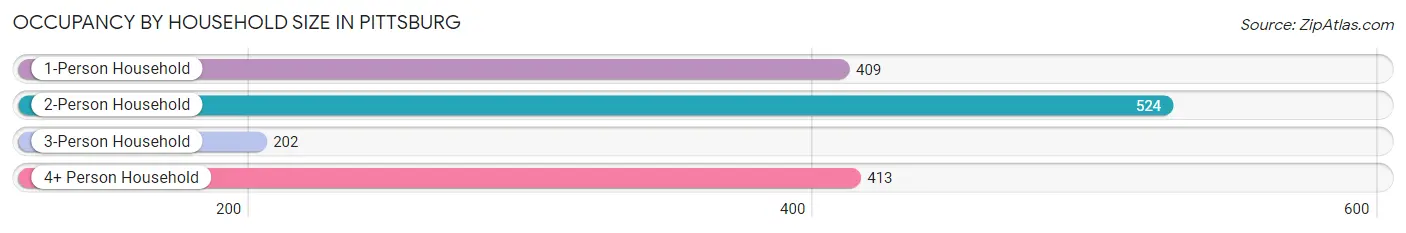
| Household Size | # Housing Units | % Housing Units |
| 1-Person Household | 409 | 26.4% |
| 2-Person Household | 524 | 33.9% |
| 3-Person Household | 202 | 13.1% |
| 4+ Person Household | 413 | 26.7% |
| Total Housing Units | 1,548 | 100.0% |
Occupancy by Ownership by Household Size in Pittsburg
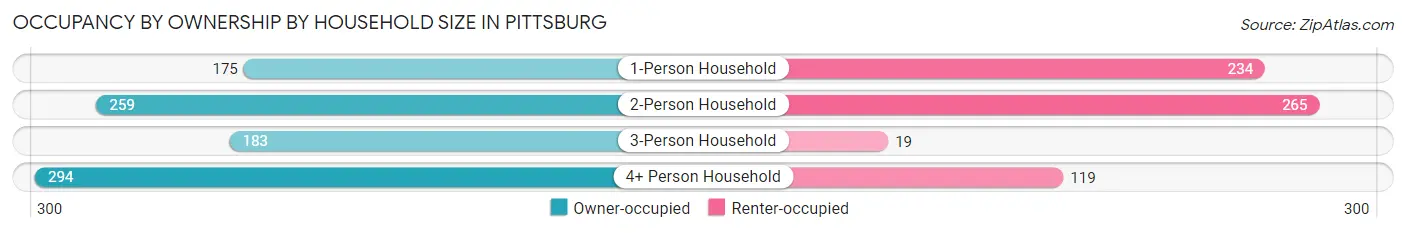
| Household Size | Owner-occupied | Renter-occupied |
| 1-Person Household | 175 (42.8%) | 234 (57.2%) |
| 2-Person Household | 259 (49.4%) | 265 (50.6%) |
| 3-Person Household | 183 (90.6%) | 19 (9.4%) |
| 4+ Person Household | 294 (71.2%) | 119 (28.8%) |
| Total Housing Units | 911 (58.9%) | 637 (41.1%) |
Occupancy by Educational Attainment in Pittsburg
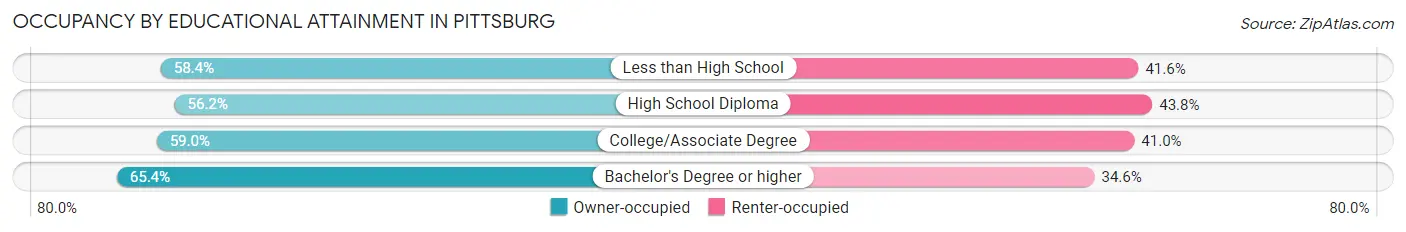
| Household Size | Owner-occupied | Renter-occupied |
| Less than High School | 80 (58.4%) | 57 (41.6%) |
| High School Diploma | 390 (56.2%) | 304 (43.8%) |
| College/Associate Degree | 258 (59.0%) | 179 (41.0%) |
| Bachelor's Degree or higher | 183 (65.4%) | 97 (34.6%) |
Occupancy by Age of Householder in Pittsburg
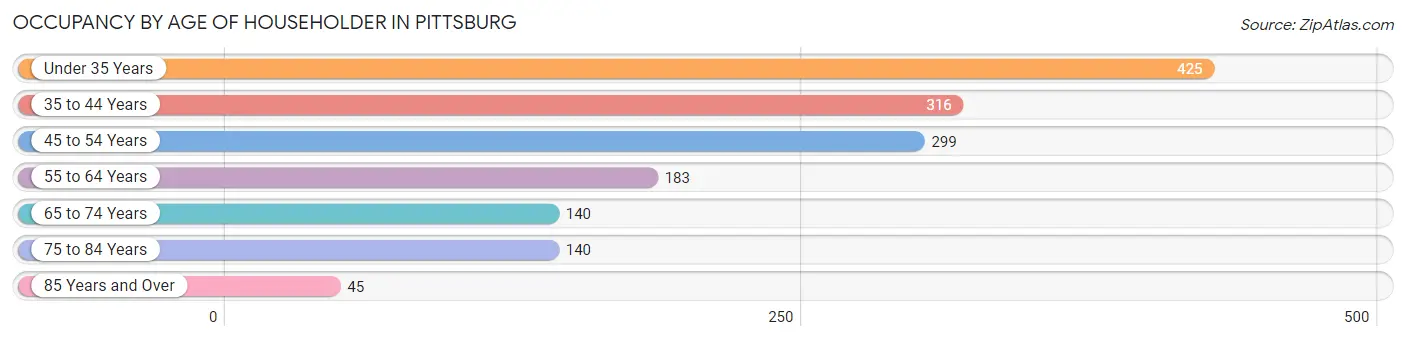
| Age Bracket | # Households | % Households |
| Under 35 Years | 425 | 27.5% |
| 35 to 44 Years | 316 | 20.4% |
| 45 to 54 Years | 299 | 19.3% |
| 55 to 64 Years | 183 | 11.8% |
| 65 to 74 Years | 140 | 9.0% |
| 75 to 84 Years | 140 | 9.0% |
| 85 Years and Over | 45 | 2.9% |
| Total | 1,548 | 100.0% |
Housing Finances in Pittsburg
Median Income by Occupancy in Pittsburg
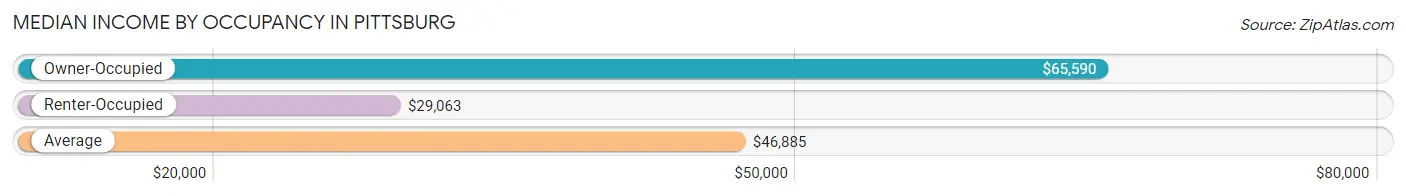
| Occupancy Type | # Households | Median Income |
| Owner-Occupied | 911 (58.9%) | $65,590 |
| Renter-Occupied | 637 (41.1%) | $29,063 |
| Average | 1,548 (100.0%) | $46,885 |
Occupancy by Householder Income Bracket in Pittsburg
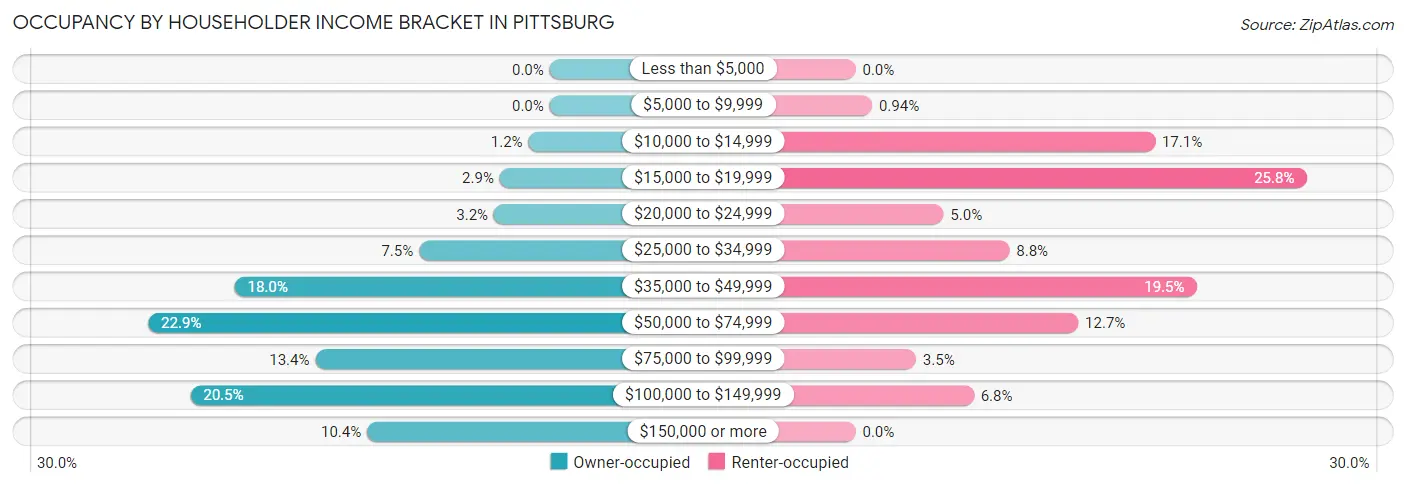
| Income Bracket | Owner-occupied | Renter-occupied |
| Less than $5,000 | 0 (0.0%) | 0 (0.0%) |
| $5,000 to $9,999 | 0 (0.0%) | 6 (0.9%) |
| $10,000 to $14,999 | 11 (1.2%) | 109 (17.1%) |
| $15,000 to $19,999 | 26 (2.9%) | 164 (25.8%) |
| $20,000 to $24,999 | 29 (3.2%) | 32 (5.0%) |
| $25,000 to $34,999 | 68 (7.5%) | 56 (8.8%) |
| $35,000 to $49,999 | 164 (18.0%) | 124 (19.5%) |
| $50,000 to $74,999 | 209 (22.9%) | 81 (12.7%) |
| $75,000 to $99,999 | 122 (13.4%) | 22 (3.5%) |
| $100,000 to $149,999 | 187 (20.5%) | 43 (6.8%) |
| $150,000 or more | 95 (10.4%) | 0 (0.0%) |
| Total | 911 (100.0%) | 637 (100.0%) |
Monthly Housing Cost Tiers in Pittsburg
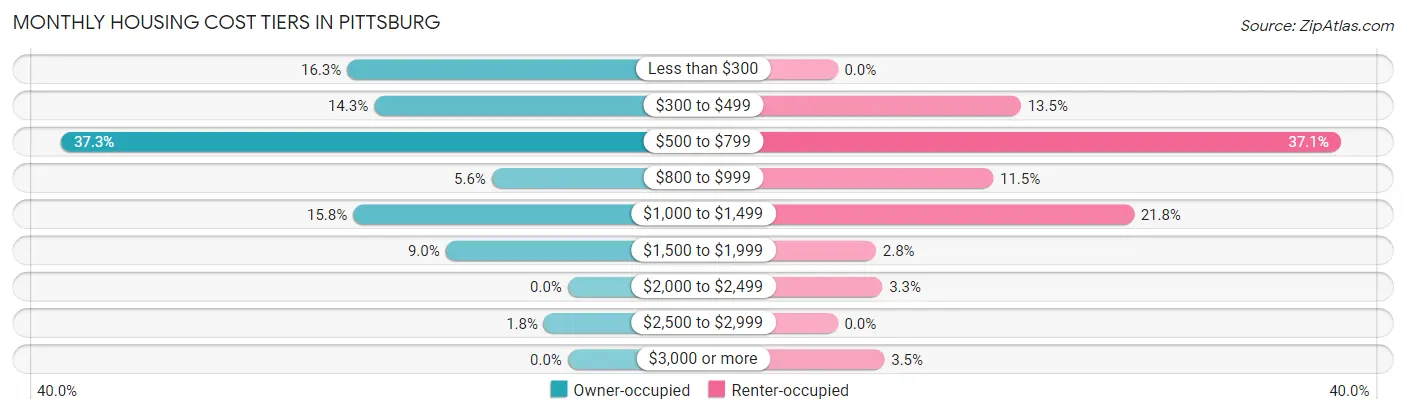
| Monthly Cost | Owner-occupied | Renter-occupied |
| Less than $300 | 148 (16.3%) | 0 (0.0%) |
| $300 to $499 | 130 (14.3%) | 86 (13.5%) |
| $500 to $799 | 340 (37.3%) | 236 (37.0%) |
| $800 to $999 | 51 (5.6%) | 73 (11.5%) |
| $1,000 to $1,499 | 144 (15.8%) | 139 (21.8%) |
| $1,500 to $1,999 | 82 (9.0%) | 18 (2.8%) |
| $2,000 to $2,499 | 0 (0.0%) | 21 (3.3%) |
| $2,500 to $2,999 | 16 (1.8%) | 0 (0.0%) |
| $3,000 or more | 0 (0.0%) | 22 (3.5%) |
| Total | 911 (100.0%) | 637 (100.0%) |
Physical Housing Characteristics in Pittsburg
Housing Structures in Pittsburg
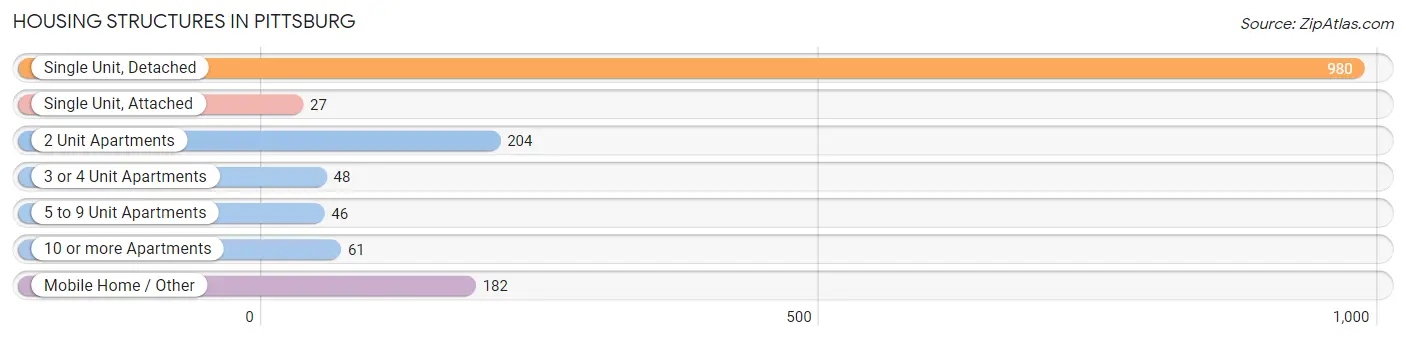
| Structure Type | # Housing Units | % Housing Units |
| Single Unit, Detached | 980 | 63.3% |
| Single Unit, Attached | 27 | 1.7% |
| 2 Unit Apartments | 204 | 13.2% |
| 3 or 4 Unit Apartments | 48 | 3.1% |
| 5 to 9 Unit Apartments | 46 | 3.0% |
| 10 or more Apartments | 61 | 3.9% |
| Mobile Home / Other | 182 | 11.8% |
| Total | 1,548 | 100.0% |
Housing Structures by Occupancy in Pittsburg
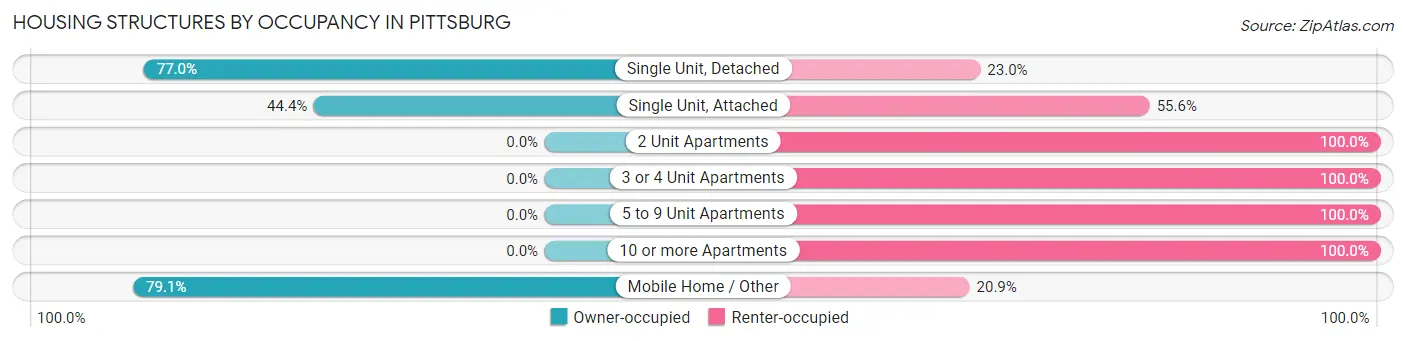
| Structure Type | Owner-occupied | Renter-occupied |
| Single Unit, Detached | 755 (77.0%) | 225 (23.0%) |
| Single Unit, Attached | 12 (44.4%) | 15 (55.6%) |
| 2 Unit Apartments | 0 (0.0%) | 204 (100.0%) |
| 3 or 4 Unit Apartments | 0 (0.0%) | 48 (100.0%) |
| 5 to 9 Unit Apartments | 0 (0.0%) | 46 (100.0%) |
| 10 or more Apartments | 0 (0.0%) | 61 (100.0%) |
| Mobile Home / Other | 144 (79.1%) | 38 (20.9%) |
| Total | 911 (58.9%) | 637 (41.1%) |
Housing Structures by Number of Rooms in Pittsburg
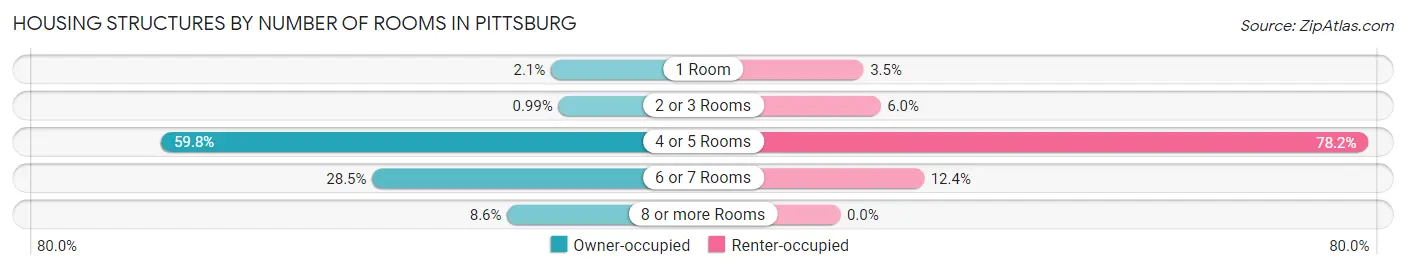
| Number of Rooms | Owner-occupied | Renter-occupied |
| 1 Room | 19 (2.1%) | 22 (3.5%) |
| 2 or 3 Rooms | 9 (1.0%) | 38 (6.0%) |
| 4 or 5 Rooms | 545 (59.8%) | 498 (78.2%) |
| 6 or 7 Rooms | 260 (28.5%) | 79 (12.4%) |
| 8 or more Rooms | 78 (8.6%) | 0 (0.0%) |
| Total | 911 (100.0%) | 637 (100.0%) |
Housing Structure by Heating Type in Pittsburg
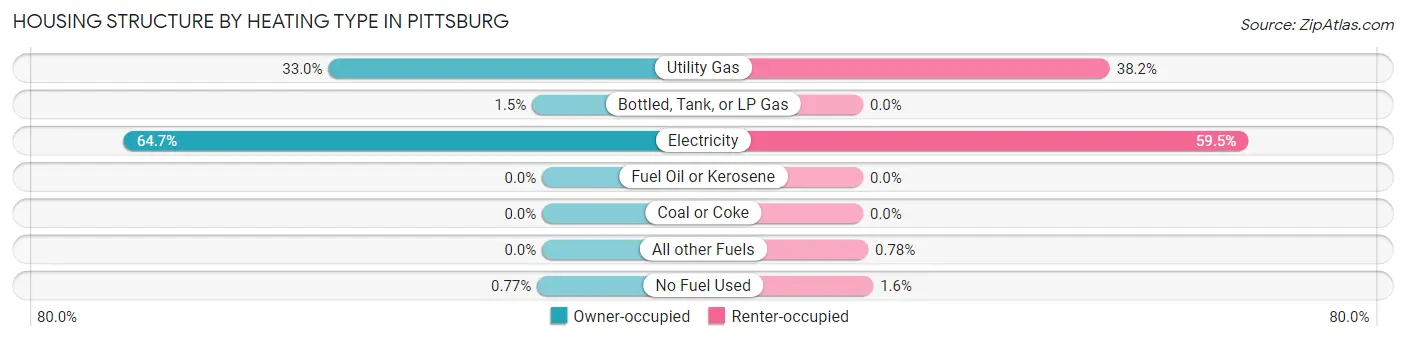
| Heating Type | Owner-occupied | Renter-occupied |
| Utility Gas | 301 (33.0%) | 243 (38.2%) |
| Bottled, Tank, or LP Gas | 14 (1.5%) | 0 (0.0%) |
| Electricity | 589 (64.6%) | 379 (59.5%) |
| Fuel Oil or Kerosene | 0 (0.0%) | 0 (0.0%) |
| Coal or Coke | 0 (0.0%) | 0 (0.0%) |
| All other Fuels | 0 (0.0%) | 5 (0.8%) |
| No Fuel Used | 7 (0.8%) | 10 (1.6%) |
| Total | 911 (100.0%) | 637 (100.0%) |
Household Vehicle Usage in Pittsburg
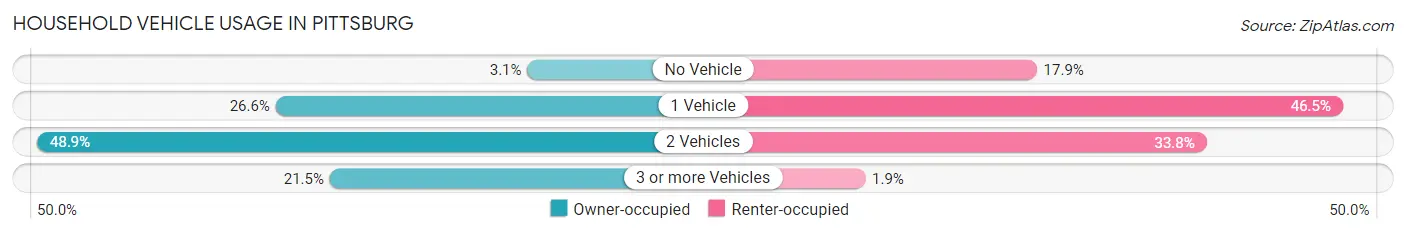
| Vehicles per Household | Owner-occupied | Renter-occupied |
| No Vehicle | 28 (3.1%) | 114 (17.9%) |
| 1 Vehicle | 242 (26.6%) | 296 (46.5%) |
| 2 Vehicles | 445 (48.8%) | 215 (33.8%) |
| 3 or more Vehicles | 196 (21.5%) | 12 (1.9%) |
| Total | 911 (100.0%) | 637 (100.0%) |
Real Estate & Mortgages in Pittsburg
Real Estate and Mortgage Overview in Pittsburg
| Characteristic | Without Mortgage | With Mortgage |
| Housing Units | 503 | 408 |
| Median Property Value | $125,100 | $126,400 |
| Median Household Income | $56,302 | $88 |
| Monthly Housing Costs | $434 | $0 |
| Real Estate Taxes | $1,722 | $13 |
Property Value by Mortgage Status in Pittsburg
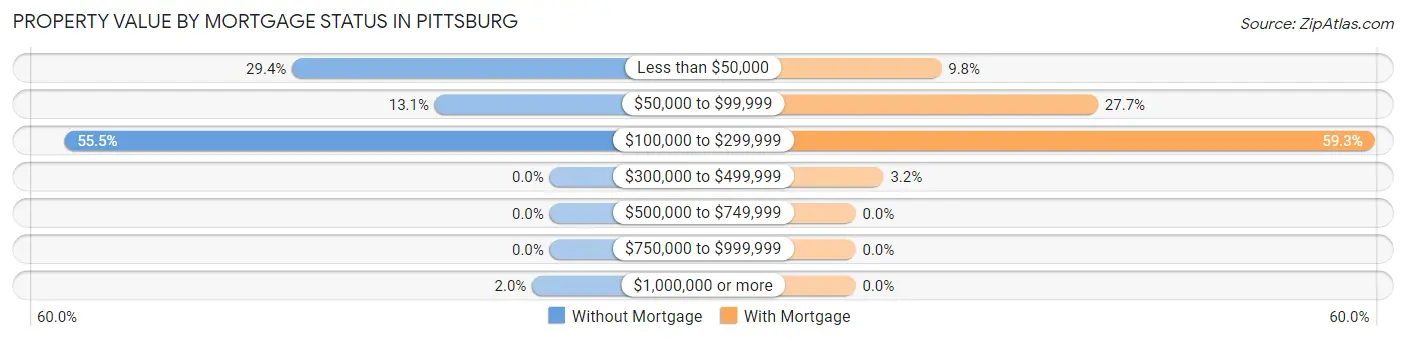
| Property Value | Without Mortgage | With Mortgage |
| Less than $50,000 | 148 (29.4%) | 40 (9.8%) |
| $50,000 to $99,999 | 66 (13.1%) | 113 (27.7%) |
| $100,000 to $299,999 | 279 (55.5%) | 242 (59.3%) |
| $300,000 to $499,999 | 0 (0.0%) | 13 (3.2%) |
| $500,000 to $749,999 | 0 (0.0%) | 0 (0.0%) |
| $750,000 to $999,999 | 0 (0.0%) | 0 (0.0%) |
| $1,000,000 or more | 10 (2.0%) | 0 (0.0%) |
| Total | 503 (100.0%) | 408 (100.0%) |
Household Income by Mortgage Status in Pittsburg
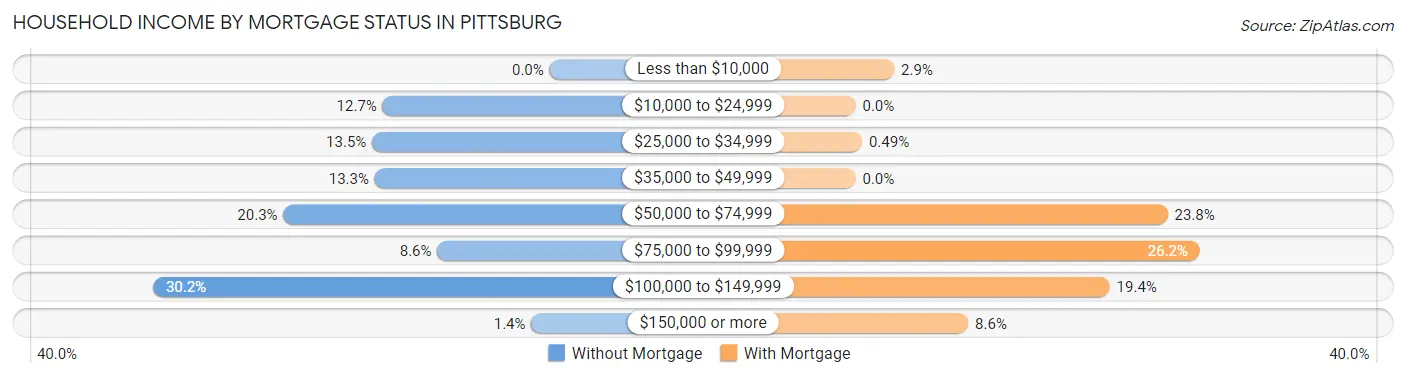
| Household Income | Without Mortgage | With Mortgage |
| Less than $10,000 | 0 (0.0%) | 12 (2.9%) |
| $10,000 to $24,999 | 64 (12.7%) | 0 (0.0%) |
| $25,000 to $34,999 | 68 (13.5%) | 2 (0.5%) |
| $35,000 to $49,999 | 67 (13.3%) | 0 (0.0%) |
| $50,000 to $74,999 | 102 (20.3%) | 97 (23.8%) |
| $75,000 to $99,999 | 43 (8.6%) | 107 (26.2%) |
| $100,000 to $149,999 | 152 (30.2%) | 79 (19.4%) |
| $150,000 or more | 7 (1.4%) | 35 (8.6%) |
| Total | 503 (100.0%) | 408 (100.0%) |
Property Value to Household Income Ratio in Pittsburg
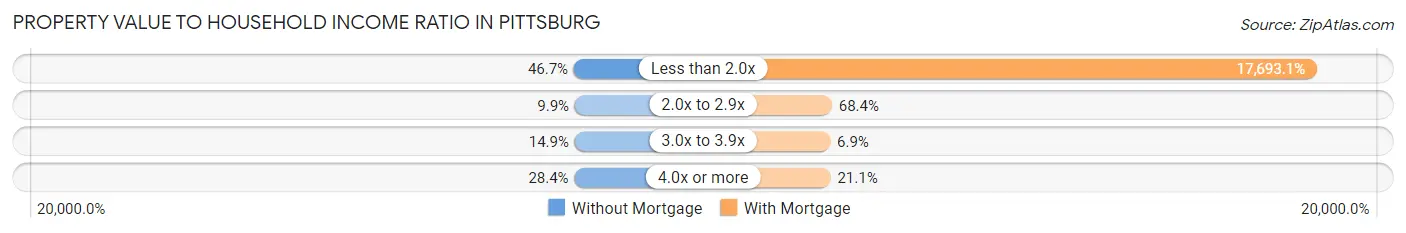
| Value-to-Income Ratio | Without Mortgage | With Mortgage |
| Less than 2.0x | 235 (46.7%) | 72,188 (17,693.1%) |
| 2.0x to 2.9x | 50 (9.9%) | 279 (68.4%) |
| 3.0x to 3.9x | 75 (14.9%) | 28 (6.9%) |
| 4.0x or more | 143 (28.4%) | 86 (21.1%) |
| Total | 503 (100.0%) | 408 (100.0%) |
Real Estate Taxes by Mortgage Status in Pittsburg
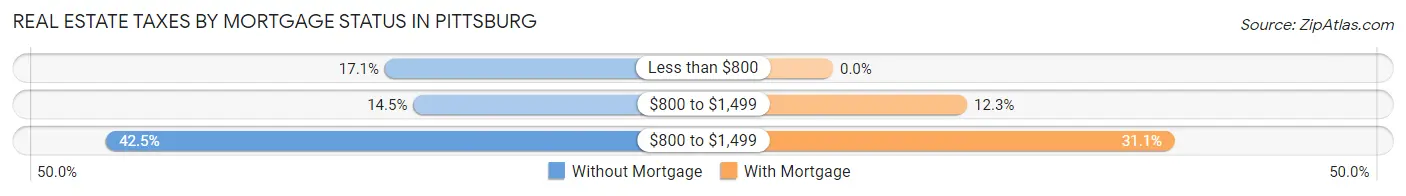
| Property Taxes | Without Mortgage | With Mortgage |
| Less than $800 | 86 (17.1%) | 0 (0.0%) |
| $800 to $1,499 | 73 (14.5%) | 50 (12.2%) |
| $800 to $1,499 | 214 (42.5%) | 127 (31.1%) |
| Total | 503 (100.0%) | 408 (100.0%) |
Health & Disability in Pittsburg
Health Insurance Coverage by Age in Pittsburg
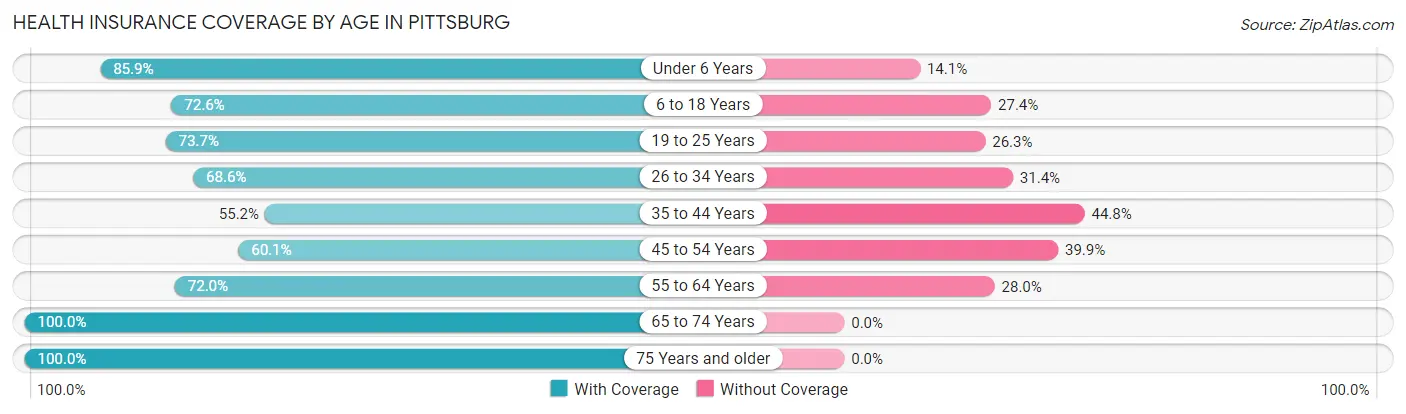
| Age Bracket | With Coverage | Without Coverage |
| Under 6 Years | 414 (85.9%) | 68 (14.1%) |
| 6 to 18 Years | 703 (72.6%) | 265 (27.4%) |
| 19 to 25 Years | 258 (73.7%) | 92 (26.3%) |
| 26 to 34 Years | 386 (68.6%) | 177 (31.4%) |
| 35 to 44 Years | 292 (55.2%) | 237 (44.8%) |
| 45 to 54 Years | 344 (60.1%) | 228 (39.9%) |
| 55 to 64 Years | 285 (72.0%) | 111 (28.0%) |
| 65 to 74 Years | 246 (100.0%) | 0 (0.0%) |
| 75 Years and older | 220 (100.0%) | 0 (0.0%) |
| Total | 3,148 (72.8%) | 1,178 (27.2%) |
Health Insurance Coverage by Citizenship Status in Pittsburg
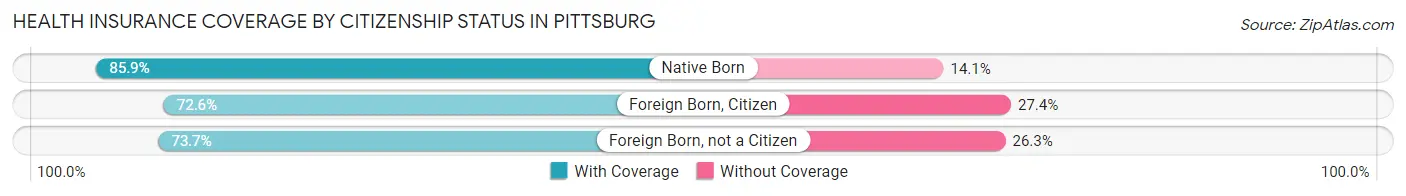
| Citizenship Status | With Coverage | Without Coverage |
| Native Born | 414 (85.9%) | 68 (14.1%) |
| Foreign Born, Citizen | 703 (72.6%) | 265 (27.4%) |
| Foreign Born, not a Citizen | 258 (73.7%) | 92 (26.3%) |
Health Insurance Coverage by Household Income in Pittsburg
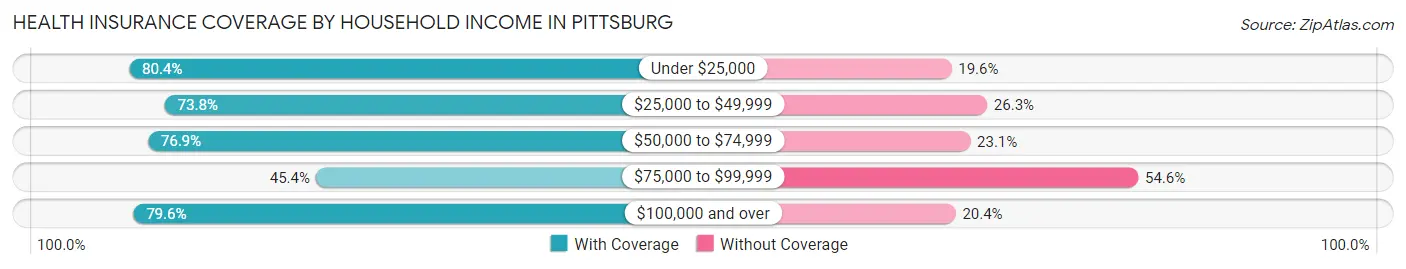
| Household Income | With Coverage | Without Coverage |
| Under $25,000 | 456 (80.4%) | 111 (19.6%) |
| $25,000 to $49,999 | 823 (73.8%) | 293 (26.3%) |
| $50,000 to $74,999 | 576 (76.9%) | 173 (23.1%) |
| $75,000 to $99,999 | 284 (45.4%) | 341 (54.6%) |
| $100,000 and over | 1,009 (79.6%) | 258 (20.4%) |
Public vs Private Health Insurance Coverage by Age in Pittsburg
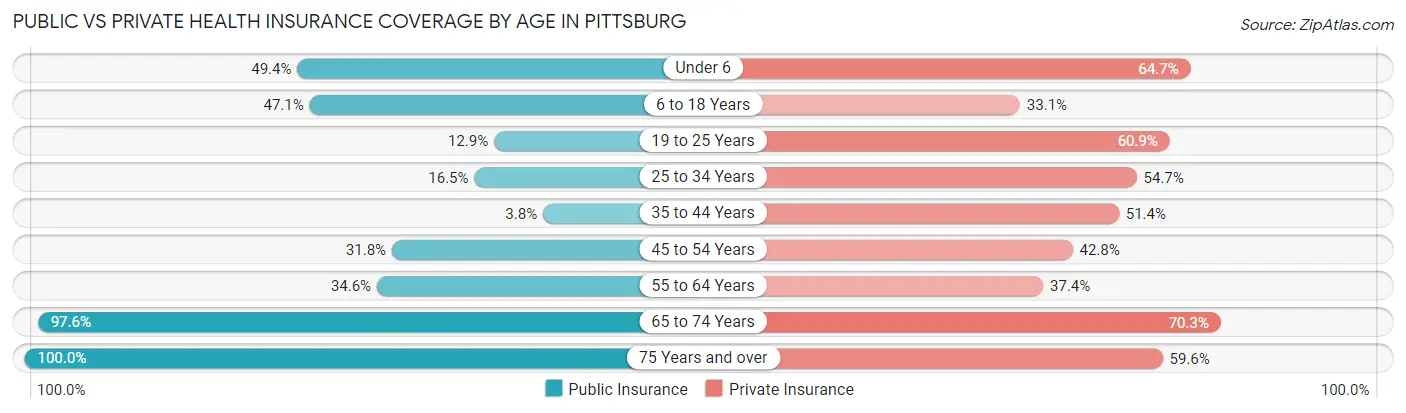
| Age Bracket | Public Insurance | Private Insurance |
| Under 6 | 238 (49.4%) | 312 (64.7%) |
| 6 to 18 Years | 456 (47.1%) | 320 (33.1%) |
| 19 to 25 Years | 45 (12.9%) | 213 (60.9%) |
| 25 to 34 Years | 93 (16.5%) | 308 (54.7%) |
| 35 to 44 Years | 20 (3.8%) | 272 (51.4%) |
| 45 to 54 Years | 182 (31.8%) | 245 (42.8%) |
| 55 to 64 Years | 137 (34.6%) | 148 (37.4%) |
| 65 to 74 Years | 240 (97.6%) | 173 (70.3%) |
| 75 Years and over | 220 (100.0%) | 131 (59.6%) |
| Total | 1,631 (37.7%) | 2,122 (49.0%) |
Disability Status by Sex by Age in Pittsburg
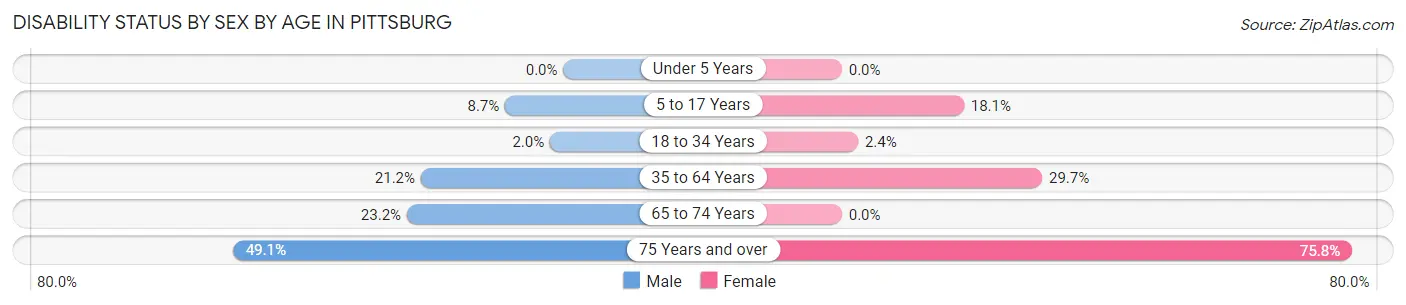
| Age Bracket | Male | Female |
| Under 5 Years | 0 (0.0%) | 0 (0.0%) |
| 5 to 17 Years | 36 (8.6%) | 86 (18.1%) |
| 18 to 34 Years | 10 (2.0%) | 14 (2.4%) |
| 35 to 64 Years | 146 (21.2%) | 240 (29.7%) |
| 65 to 74 Years | 36 (23.2%) | 0 (0.0%) |
| 75 Years and over | 27 (49.1%) | 125 (75.8%) |
Disability Class by Sex by Age in Pittsburg
Disability Class: Hearing Difficulty
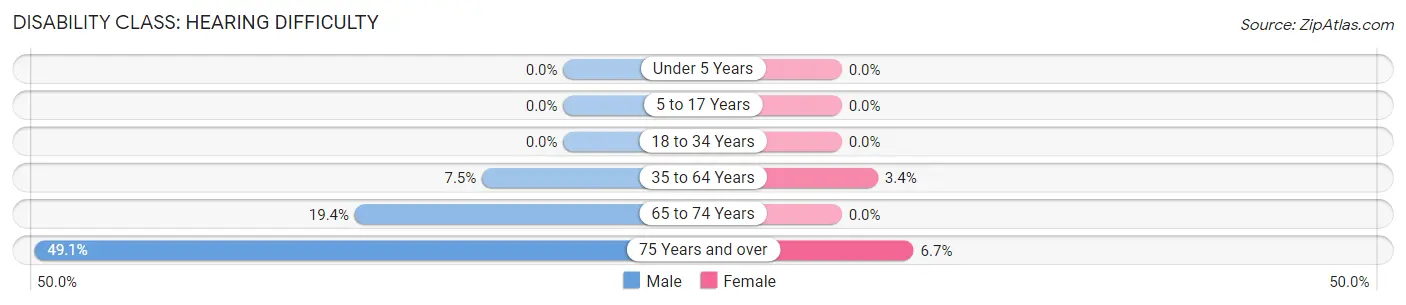
| Age Bracket | Male | Female |
| Under 5 Years | 0 (0.0%) | 0 (0.0%) |
| 5 to 17 Years | 0 (0.0%) | 0 (0.0%) |
| 18 to 34 Years | 0 (0.0%) | 0 (0.0%) |
| 35 to 64 Years | 52 (7.5%) | 27 (3.4%) |
| 65 to 74 Years | 30 (19.4%) | 0 (0.0%) |
| 75 Years and over | 27 (49.1%) | 11 (6.7%) |
Disability Class: Vision Difficulty
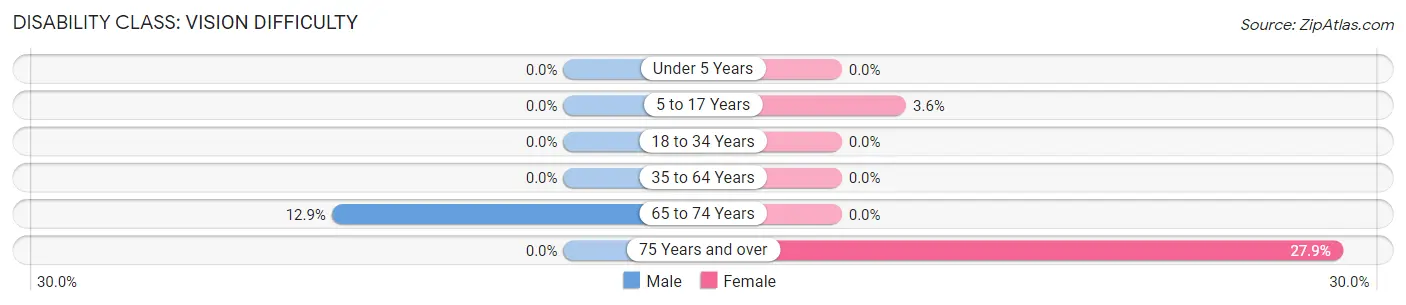
| Age Bracket | Male | Female |
| Under 5 Years | 0 (0.0%) | 0 (0.0%) |
| 5 to 17 Years | 0 (0.0%) | 17 (3.6%) |
| 18 to 34 Years | 0 (0.0%) | 0 (0.0%) |
| 35 to 64 Years | 0 (0.0%) | 0 (0.0%) |
| 65 to 74 Years | 20 (12.9%) | 0 (0.0%) |
| 75 Years and over | 0 (0.0%) | 46 (27.9%) |
Disability Class: Cognitive Difficulty
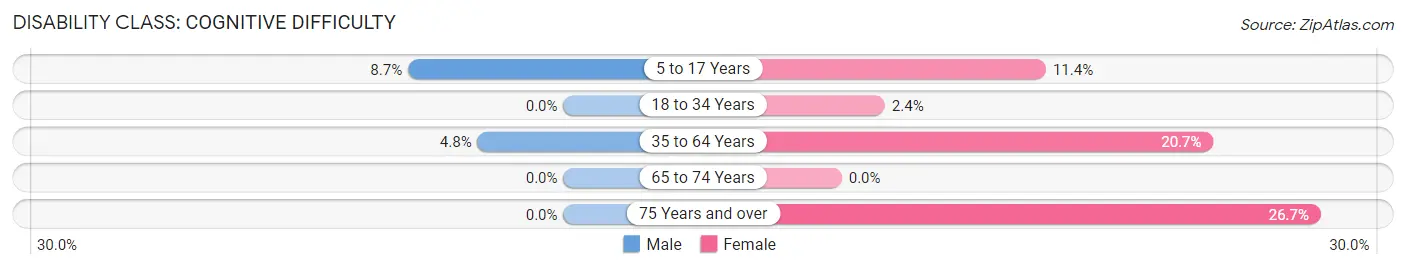
| Age Bracket | Male | Female |
| 5 to 17 Years | 36 (8.6%) | 54 (11.4%) |
| 18 to 34 Years | 0 (0.0%) | 14 (2.4%) |
| 35 to 64 Years | 33 (4.8%) | 167 (20.7%) |
| 65 to 74 Years | 0 (0.0%) | 0 (0.0%) |
| 75 Years and over | 0 (0.0%) | 44 (26.7%) |
Disability Class: Ambulatory Difficulty
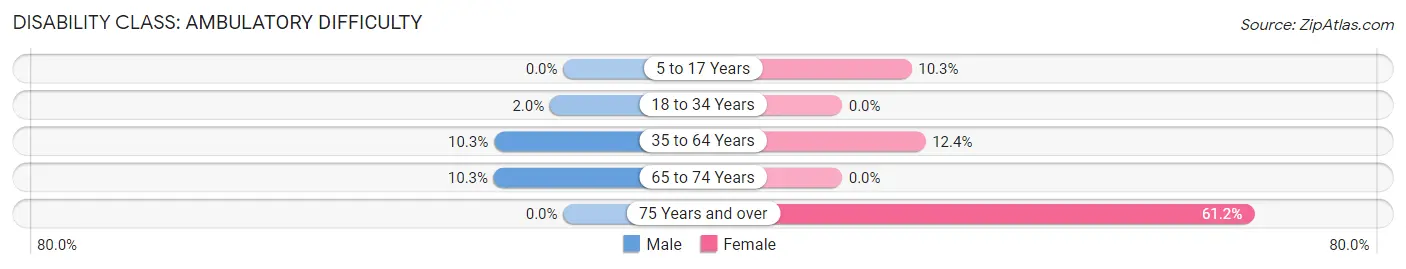
| Age Bracket | Male | Female |
| 5 to 17 Years | 0 (0.0%) | 49 (10.3%) |
| 18 to 34 Years | 10 (2.0%) | 0 (0.0%) |
| 35 to 64 Years | 71 (10.3%) | 100 (12.4%) |
| 65 to 74 Years | 16 (10.3%) | 0 (0.0%) |
| 75 Years and over | 0 (0.0%) | 101 (61.2%) |
Disability Class: Self-Care Difficulty
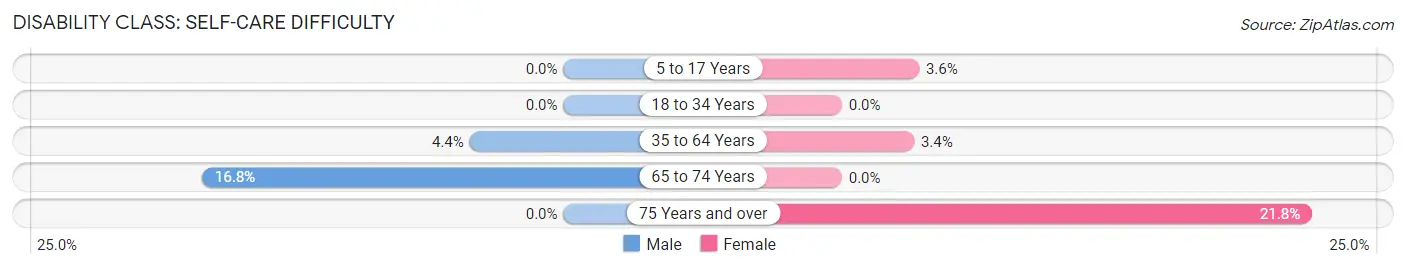
| Age Bracket | Male | Female |
| 5 to 17 Years | 0 (0.0%) | 17 (3.6%) |
| 18 to 34 Years | 0 (0.0%) | 0 (0.0%) |
| 35 to 64 Years | 30 (4.3%) | 27 (3.4%) |
| 65 to 74 Years | 26 (16.8%) | 0 (0.0%) |
| 75 Years and over | 0 (0.0%) | 36 (21.8%) |
Technology Access in Pittsburg
Computing Device Access in Pittsburg
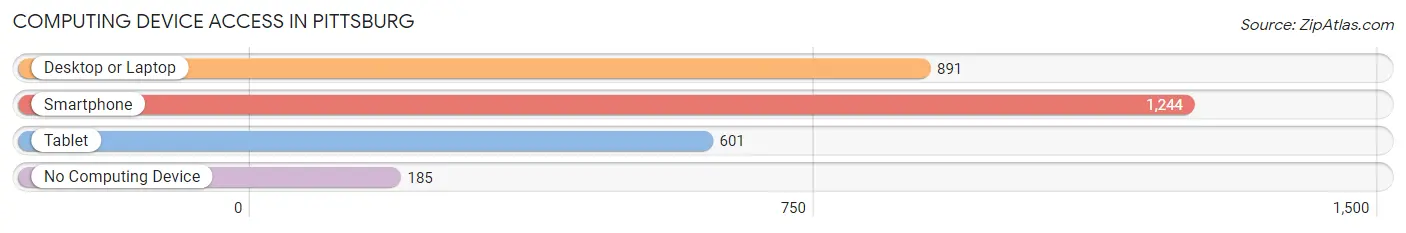
| Device Type | # Households | % Households |
| Desktop or Laptop | 891 | 57.6% |
| Smartphone | 1,244 | 80.4% |
| Tablet | 601 | 38.8% |
| No Computing Device | 185 | 11.9% |
| Total | 1,548 | 100.0% |
Internet Access in Pittsburg
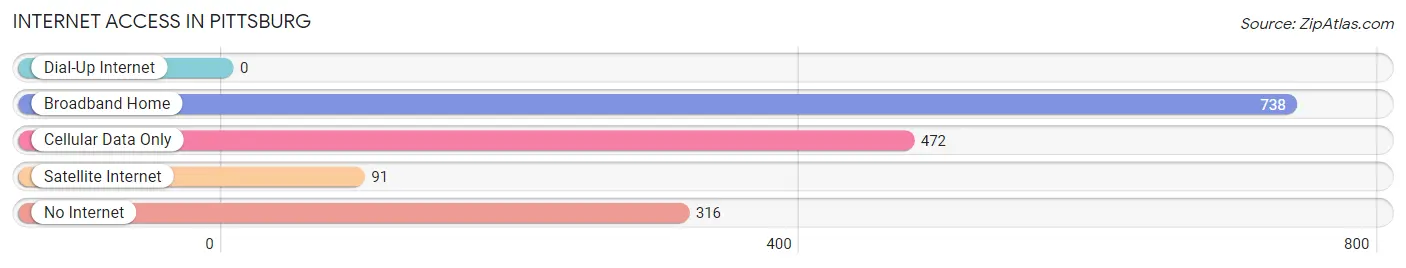
| Internet Type | # Households | % Households |
| Dial-Up Internet | 0 | 0.0% |
| Broadband Home | 738 | 47.7% |
| Cellular Data Only | 472 | 30.5% |
| Satellite Internet | 91 | 5.9% |
| No Internet | 316 | 20.4% |
| Total | 1,548 | 100.0% |
Pittsburg Summary
Pittsburg, Texas is a small town located in the northeast corner of the state, in Camp County. It is situated on the banks of the Big Cypress Creek, and is the county seat of Camp County. The town was founded in 1872, and was named after the industrial city of Pittsburgh, Pennsylvania. The population of Pittsburg was 2,764 at the 2010 census, and the town covers an area of 2.3 square miles.
Geography
Pittsburg is located in the northeast corner of Texas, in Camp County. It is situated on the banks of the Big Cypress Creek, and is the county seat of Camp County. The town is located at the intersection of U.S. Highway 271 and State Highway 11. The terrain of the area is mostly flat, with some rolling hills. The climate is humid subtropical, with hot summers and mild winters.
Economy
The economy of Pittsburg is largely based on agriculture and timber. The town is home to several large farms, as well as a number of small businesses. The town is also home to a number of manufacturing companies, including a paper mill, a furniture factory, and a plastics plant. The town is also home to a number of retail stores, restaurants, and other businesses.
Demographics
As of the 2010 census, the population of Pittsburg was 2,764. The racial makeup of the town was 79.3% White, 17.2% African American, 0.7% Native American, 0.3% Asian, 0.1% Pacific Islander, 1.2% from other races, and 1.4% from two or more races. Hispanic or Latino of any race were 3.2% of the population.
The median income for a household in the town was $30,938, and the median income for a family was $37,917. The per capita income for the town was $15,945. About 17.2% of families and 20.3% of the population were below the poverty line, including 28.3% of those under age 18 and 14.2% of those age 65 or over.
History
Pittsburg was founded in 1872, and was named after the industrial city of Pittsburgh, Pennsylvania. The town was originally a farming community, and the first settlers were mostly of German and Irish descent. The town was incorporated in 1876, and the first post office was established in 1877.
In the early 1900s, the town began to grow and prosper, and the population increased. The town was home to several businesses, including a cotton gin, a sawmill, and a gristmill. The town was also home to a number of churches, schools, and other organizations.
In the late 1900s, the town began to decline, and the population decreased. The town was hit hard by the Great Depression, and many of the businesses closed. The town was also affected by the decline of the timber industry, and the population continued to decline.
Today, Pittsburg is a small town with a population of just over 2,700. The town is still largely agricultural, and the economy is based on farming and timber. The town is also home to a number of small businesses, and is a popular tourist destination.
Common Questions
What is the Total Population of Pittsburg?
Total Population of Pittsburg is 4,382.
What is the Total Male Population of Pittsburg?
Total Male Population of Pittsburg is 2,007.
What is the Total Female Population of Pittsburg?
Total Female Population of Pittsburg is 2,375.
What is the Ratio of Males per 100 Females in Pittsburg?
There are 84.51 Males per 100 Females in Pittsburg.
What is the Ratio of Females per 100 Males in Pittsburg?
There are 118.34 Females per 100 Males in Pittsburg.
What is the Median Population Age in Pittsburg?
Median Population Age in Pittsburg is 32.3 Years.
What is the Average Family Size in Pittsburg
Average Family Size in Pittsburg is 3.8 People.
What is the Average Household Size in Pittsburg
Average Household Size in Pittsburg is 2.8 People.
What is Per Capita Income in Pittsburg?
Per Capita income in Pittsburg is $22,869.
What is the Median Family Income in Pittsburg?
Median Family Income in Pittsburg is $53,795.
What is the Median Household income in Pittsburg?
Median Household Income in Pittsburg is $46,885.
What is Income or Wage Gap in Pittsburg?
Income or Wage Gap in Pittsburg is 56.2%.
Women in Pittsburg earn 43.8 cents for every dollar earned by a man.
What is Family Income Deficit in Pittsburg?
Family Income Deficit in Pittsburg is $4,709.
Families that are below poverty line in Pittsburg earn $4,709 less on average than the poverty threshold level.
What is Inequality or Gini Index in Pittsburg?
Inequality or Gini Index in Pittsburg is 0.39.
How Large is the Labor Force in Pittsburg?
There are 1,957 People in the Labor Forcein in Pittsburg.
What is the Percentage of People in the Labor Force in Pittsburg?
62.0% of People are in the Labor Force in Pittsburg.
What is the Unemployment Rate in Pittsburg?
Unemployment Rate in Pittsburg is 3.9%.