Pine Forest, TX
Pine Forest Map
Pine Forest Overview
467
TOTAL POPULATION
231
MALE POPULATION
236
FEMALE POPULATION
97.88
MALES / 100 FEMALES
102.16
FEMALES / 100 MALES
37.4
MEDIAN AGE
3.3
AVG FAMILY SIZE
3.0
AVG HOUSEHOLD SIZE
$37,087
PER CAPITA INCOME
$115,417
AVG FAMILY INCOME
$108,333
AVG HOUSEHOLD INCOME
20.0%
WAGE / INCOME GAP [ % ]
80.0¢/ $1
WAGE / INCOME GAP [ $ ]
0.40
INEQUALITY / GINI INDEX
185
LABOR FORCE [ PEOPLE ]
51.5%
PERCENT IN LABOR FORCE
2.7%
UNEMPLOYMENT RATE
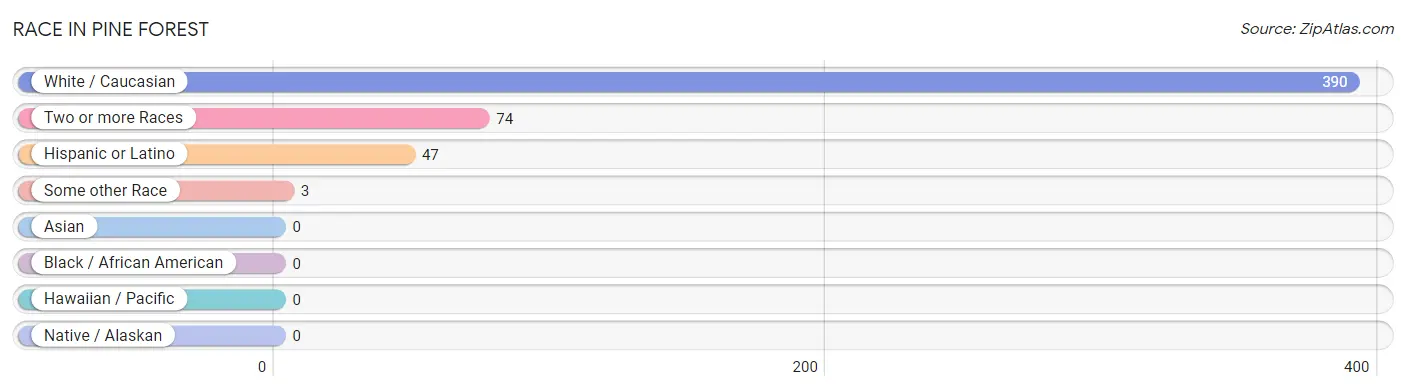
Race in Pine Forest
The most populous races in Pine Forest are White / Caucasian (390 | 83.5%), Two or more Races (74 | 15.9%), and Hispanic or Latino (47 | 10.1%).
| Race | # Population | % Population |
| Asian | 0 | 0.0% |
| Black / African American | 0 | 0.0% |
| Hawaiian / Pacific | 0 | 0.0% |
| Hispanic or Latino | 47 | 10.1% |
| Native / Alaskan | 0 | 0.0% |
| White / Caucasian | 390 | 83.5% |
| Two or more Races | 74 | 15.9% |
| Some other Race | 3 | 0.6% |
| Total | 467 | 100.0% |
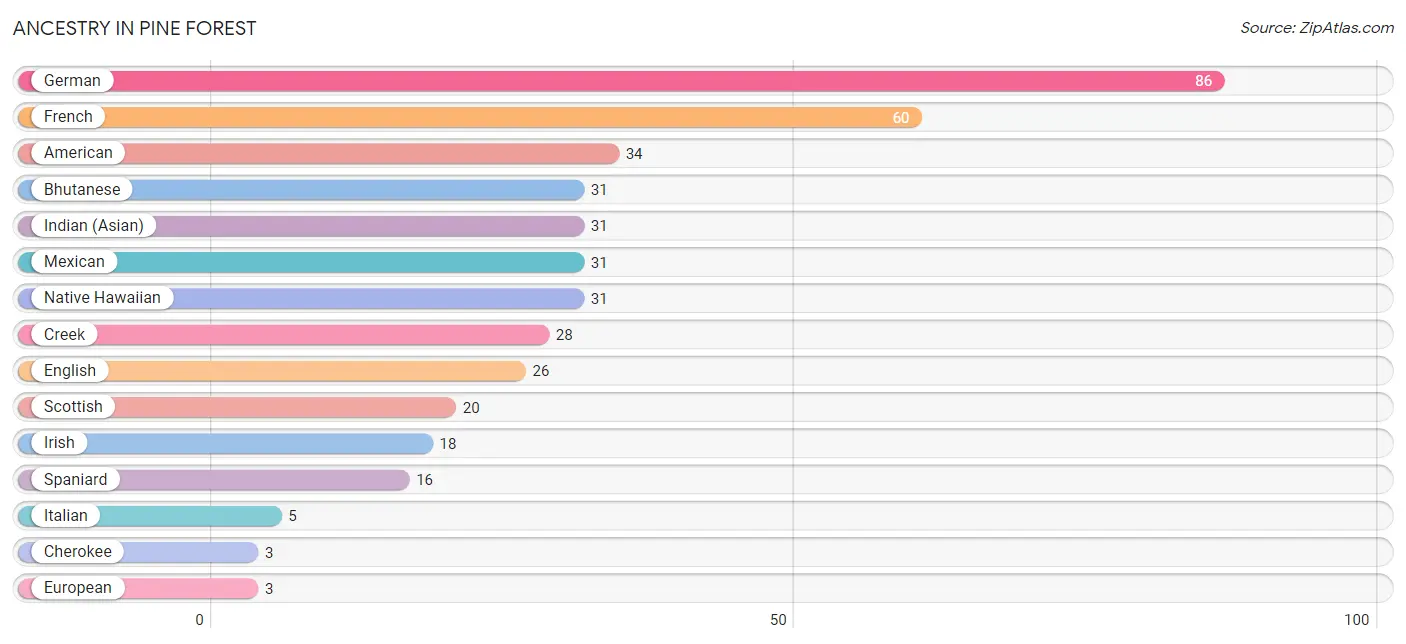
Ancestry in Pine Forest
The most populous ancestries reported in Pine Forest are German (86 | 18.4%), French (60 | 12.9%), American (34 | 7.3%), Bhutanese (31 | 6.6%), and Indian (Asian) (31 | 6.6%), together accounting for 51.8% of all Pine Forest residents.
| Ancestry | # Population | % Population |
| American | 34 | 7.3% |
| Bhutanese | 31 | 6.6% |
| Cherokee | 3 | 0.6% |
| Creek | 28 | 6.0% |
| Czech | 1 | 0.2% |
| English | 26 | 5.6% |
| European | 3 | 0.6% |
| French | 60 | 12.9% |
| German | 86 | 18.4% |
| Indian (Asian) | 31 | 6.6% |
| Irish | 18 | 3.8% |
| Italian | 5 | 1.1% |
| Mexican | 31 | 6.6% |
| Native Hawaiian | 31 | 6.6% |
| Norwegian | 2 | 0.4% |
| Polish | 3 | 0.6% |
| Scottish | 20 | 4.3% |
| Seminole | 1 | 0.2% |
| Spaniard | 16 | 3.4% |
| Swedish | 1 | 0.2% |
| Welsh | 1 | 0.2% | View All 21 Rows |
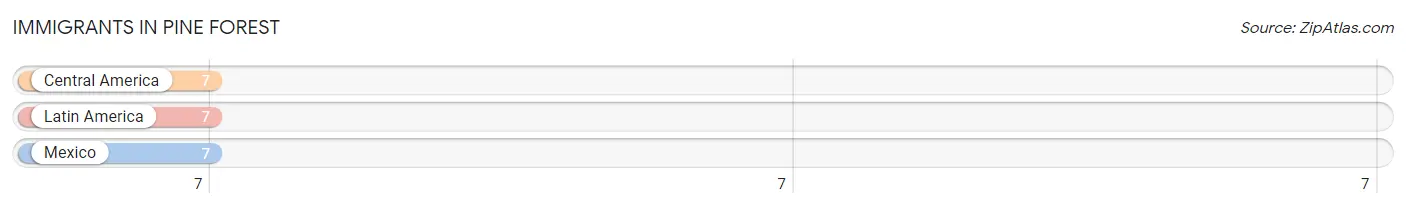
Immigrants in Pine Forest
The most numerous immigrant groups reported in Pine Forest came from Central America (7 | 1.5%), Latin America (7 | 1.5%), and Mexico (7 | 1.5%), together accounting for 4.5% of all Pine Forest residents.
| Immigration Origin | # Population | % Population |
| Central America | 7 | 1.5% |
| Latin America | 7 | 1.5% |
| Mexico | 7 | 1.5% | View All 3 Rows |
Sex and Age in Pine Forest
Sex and Age in Pine Forest
The most populous age groups in Pine Forest are 55 to 59 Years (38 | 16.5%) for men and 10 to 14 Years (32 | 13.6%) for women.
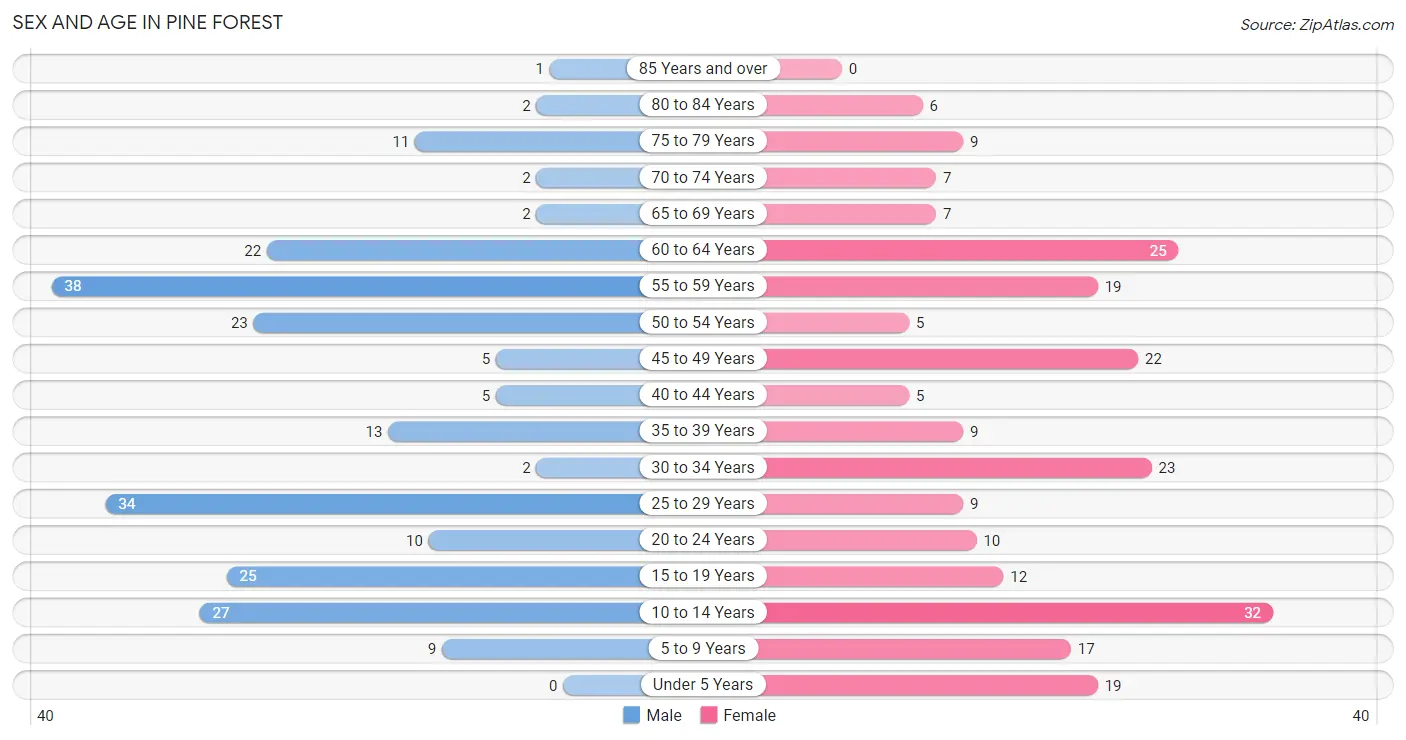
| Age Bracket | Male | Female |
| Under 5 Years | 0 (0.0%) | 19 (8.1%) |
| 5 to 9 Years | 9 (3.9%) | 17 (7.2%) |
| 10 to 14 Years | 27 (11.7%) | 32 (13.6%) |
| 15 to 19 Years | 25 (10.8%) | 12 (5.1%) |
| 20 to 24 Years | 10 (4.3%) | 10 (4.2%) |
| 25 to 29 Years | 34 (14.7%) | 9 (3.8%) |
| 30 to 34 Years | 2 (0.9%) | 23 (9.8%) |
| 35 to 39 Years | 13 (5.6%) | 9 (3.8%) |
| 40 to 44 Years | 5 (2.2%) | 5 (2.1%) |
| 45 to 49 Years | 5 (2.2%) | 22 (9.3%) |
| 50 to 54 Years | 23 (10.0%) | 5 (2.1%) |
| 55 to 59 Years | 38 (16.5%) | 19 (8.1%) |
| 60 to 64 Years | 22 (9.5%) | 25 (10.6%) |
| 65 to 69 Years | 2 (0.9%) | 7 (3.0%) |
| 70 to 74 Years | 2 (0.9%) | 7 (3.0%) |
| 75 to 79 Years | 11 (4.8%) | 9 (3.8%) |
| 80 to 84 Years | 2 (0.9%) | 6 (2.5%) |
| 85 Years and over | 1 (0.4%) | 0 (0.0%) |
| Total | 231 (100.0%) | 236 (100.0%) |
Families and Households in Pine Forest
Median Family Size in Pine Forest
The median family size in Pine Forest is 3.34 persons per family, with single male/father families (1 | 0.8%) accounting for the largest median family size of 4 persons per family. On the other hand, married-couple families (104 | 86.0%) represent the smallest median family size with 3.28 persons per family.
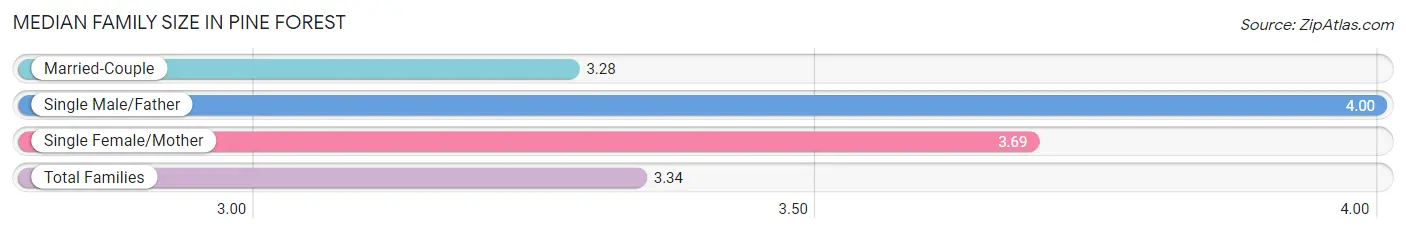
| Family Type | # Families | Family Size |
| Married-Couple | 104 (86.0%) | 3.28 |
| Single Male/Father | 1 (0.8%) | 4.00 |
| Single Female/Mother | 16 (13.2%) | 3.69 |
| Total Families | 121 (100.0%) | 3.34 |
Median Household Size in Pine Forest
The median household size in Pine Forest is 2.99 persons per household, with single female/mother households (16 | 10.3%) accounting for the largest median household size of 4.31 persons per household. non-family households (35 | 22.4%) represent the smallest median household size with 1.51 persons per household.
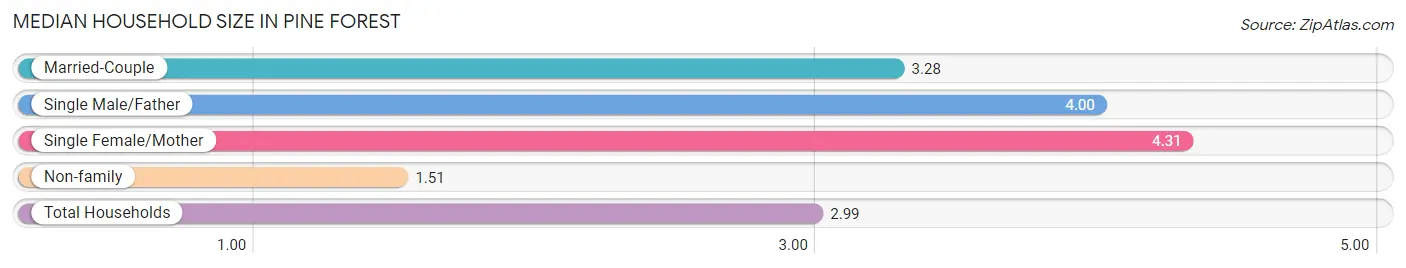
| Household Type | # Households | Household Size |
| Married-Couple | 104 (66.7%) | 3.28 |
| Single Male/Father | 1 (0.6%) | 4.00 |
| Single Female/Mother | 16 (10.3%) | 4.31 |
| Non-family | 35 (22.4%) | 1.51 |
| Total Households | 156 (100.0%) | 2.99 |
Household Size by Marriage Status in Pine Forest
Out of a total of 156 households in Pine Forest, 121 (77.6%) are family households, while 35 (22.4%) are nonfamily households. The most numerous type of family households are 2-person households, comprising 54, and the most common type of nonfamily households are 1-person households, comprising 25.
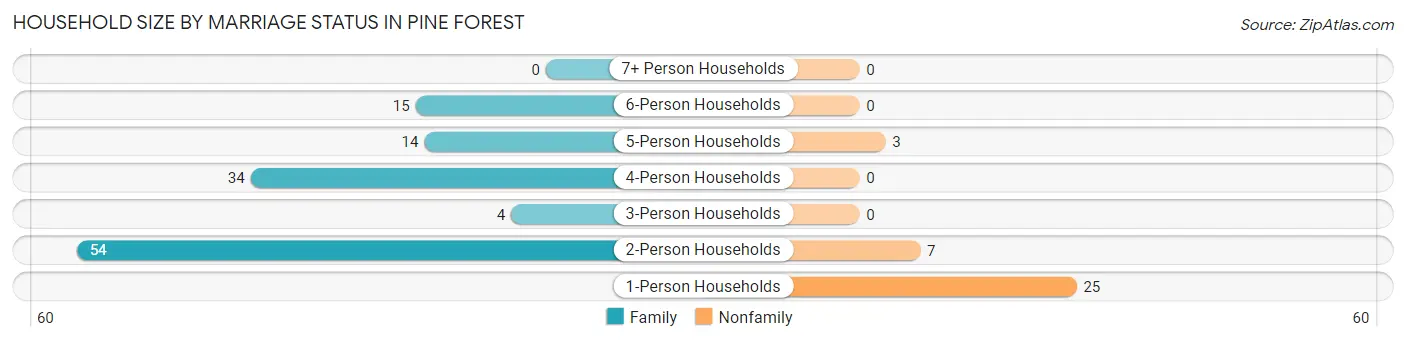
| Household Size | Family Households | Nonfamily Households |
| 1-Person Households | - | 25 (16.0%) |
| 2-Person Households | 54 (34.6%) | 7 (4.5%) |
| 3-Person Households | 4 (2.6%) | 0 (0.0%) |
| 4-Person Households | 34 (21.8%) | 0 (0.0%) |
| 5-Person Households | 14 (9.0%) | 3 (1.9%) |
| 6-Person Households | 15 (9.6%) | 0 (0.0%) |
| 7+ Person Households | 0 (0.0%) | 0 (0.0%) |
| Total | 121 (77.6%) | 35 (22.4%) |
Female Fertility in Pine Forest
Fertility by Age in Pine Forest
| Age Bracket | Women with Births | Births / 1,000 Women |
| 15 to 19 years | 0 (0.0%) | 0.0 |
| 20 to 34 years | 0 (0.0%) | 0.0 |
| 35 to 50 years | 0 (0.0%) | 0.0 |
| Total | 0 (0.0%) | 0.0 |
Fertility by Age by Marriage Status in Pine Forest
| Age Bracket | Married | Unmarried |
| 15 to 19 years | 0 (0.0%) | 0 (0.0%) |
| 20 to 34 years | 0 (0.0%) | 0 (0.0%) |
| 35 to 50 years | 0 (0.0%) | 0 (0.0%) |
| Total | 0 (0.0%) | 0 (0.0%) |
Fertility by Education in Pine Forest
| Educational Attainment | Women with Births | Births / 1,000 Women |
| Less than High School | 0 (0.0%) | 0.0 |
| High School Diploma | 0 (0.0%) | 0.0 |
| College or Associate's Degree | 0 (0.0%) | 0.0 |
| Bachelor's Degree | 0 (0.0%) | 0.0 |
| Graduate Degree | 0 (0.0%) | 0.0 |
| Total | 0 (0.0%) | 0.0 |
Fertility by Education by Marriage Status in Pine Forest
| Educational Attainment | Married | Unmarried |
| Less than High School | 0 (0.0%) | 0 (0.0%) |
| High School Diploma | 0 (0.0%) | 0 (0.0%) |
| College or Associate's Degree | 0 (0.0%) | 0 (0.0%) |
| Bachelor's Degree | 0 (0.0%) | 0 (0.0%) |
| Graduate Degree | 0 (0.0%) | 0 (0.0%) |
| Total | 0 (0.0%) | 0 (0.0%) |
Income in Pine Forest
Income Overview in Pine Forest
Per Capita Income in Pine Forest is $37,087, while median incomes of families and households are $115,417 and $108,333 respectively.
| Characteristic | Number | Measure |
| Per Capita Income | 467 | $37,087 |
| Median Family Income | 121 | $115,417 |
| Mean Family Income | 121 | $126,678 |
| Median Household Income | 156 | $108,333 |
| Mean Household Income | 156 | $112,794 |
| Income Deficit | 121 | $0 |
| Wage / Income Gap (%) | 467 | 20.00% |
| Wage / Income Gap ($) | 467 | 80.00¢ per $1 |
| Gini / Inequality Index | 467 | 0.40 |
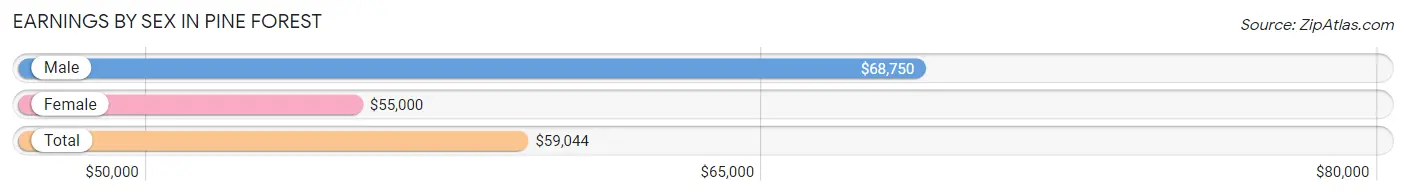
Earnings by Sex in Pine Forest
Average Earnings in Pine Forest are $59,044, $68,750 for men and $55,000 for women, a difference of 20.0%.
| Sex | Number | Average Earnings |
| Male | 118 (59.0%) | $68,750 |
| Female | 82 (41.0%) | $55,000 |
| Total | 200 (100.0%) | $59,044 |
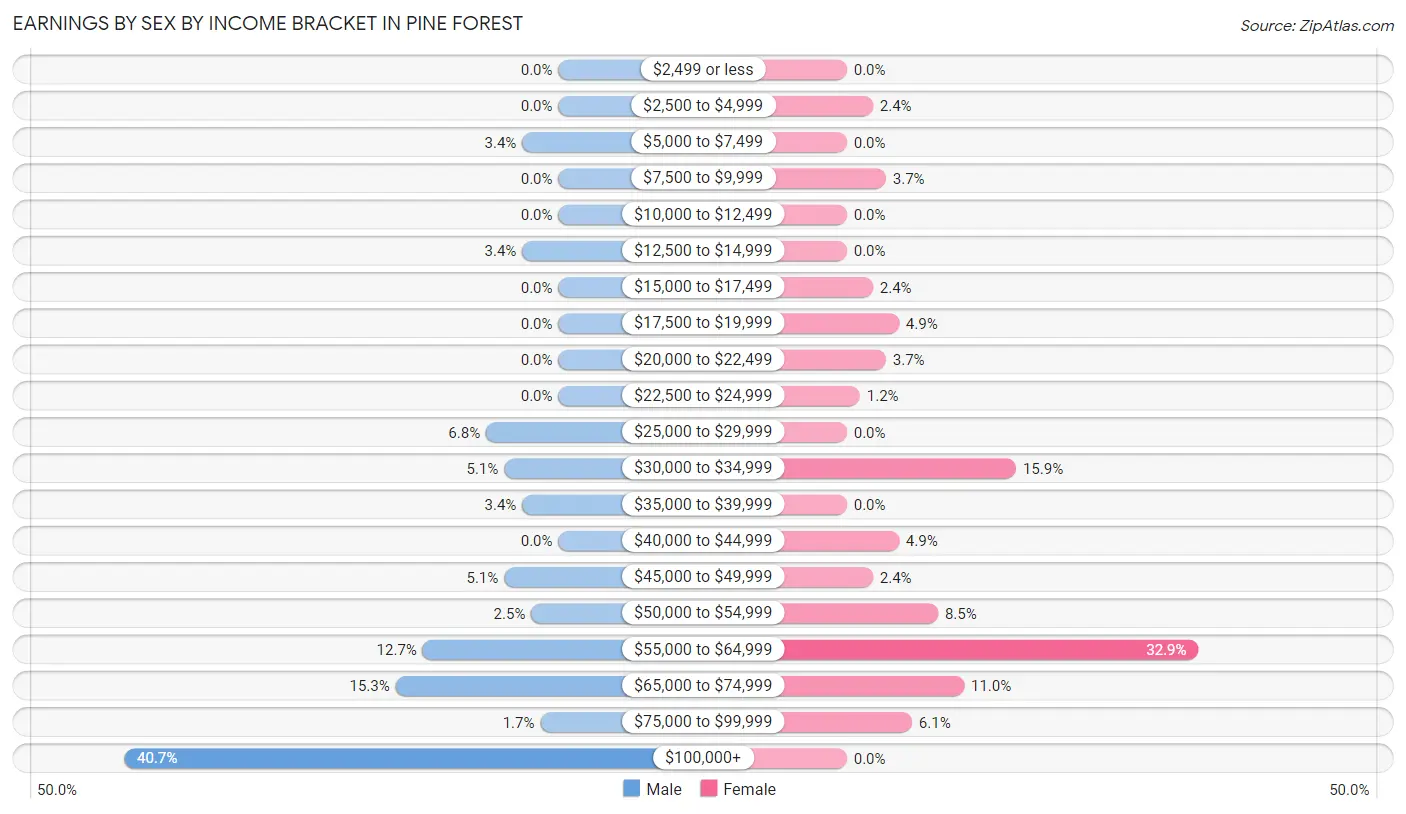
Earnings by Sex by Income Bracket in Pine Forest
The most common earnings brackets in Pine Forest are $100,000+ for men (48 | 40.7%) and $55,000 to $64,999 for women (27 | 32.9%).
| Income | Male | Female |
| $2,499 or less | 0 (0.0%) | 0 (0.0%) |
| $2,500 to $4,999 | 0 (0.0%) | 2 (2.4%) |
| $5,000 to $7,499 | 4 (3.4%) | 0 (0.0%) |
| $7,500 to $9,999 | 0 (0.0%) | 3 (3.7%) |
| $10,000 to $12,499 | 0 (0.0%) | 0 (0.0%) |
| $12,500 to $14,999 | 4 (3.4%) | 0 (0.0%) |
| $15,000 to $17,499 | 0 (0.0%) | 2 (2.4%) |
| $17,500 to $19,999 | 0 (0.0%) | 4 (4.9%) |
| $20,000 to $22,499 | 0 (0.0%) | 3 (3.7%) |
| $22,500 to $24,999 | 0 (0.0%) | 1 (1.2%) |
| $25,000 to $29,999 | 8 (6.8%) | 0 (0.0%) |
| $30,000 to $34,999 | 6 (5.1%) | 13 (15.9%) |
| $35,000 to $39,999 | 4 (3.4%) | 0 (0.0%) |
| $40,000 to $44,999 | 0 (0.0%) | 4 (4.9%) |
| $45,000 to $49,999 | 6 (5.1%) | 2 (2.4%) |
| $50,000 to $54,999 | 3 (2.5%) | 7 (8.5%) |
| $55,000 to $64,999 | 15 (12.7%) | 27 (32.9%) |
| $65,000 to $74,999 | 18 (15.2%) | 9 (11.0%) |
| $75,000 to $99,999 | 2 (1.7%) | 5 (6.1%) |
| $100,000+ | 48 (40.7%) | 0 (0.0%) |
| Total | 118 (100.0%) | 82 (100.0%) |
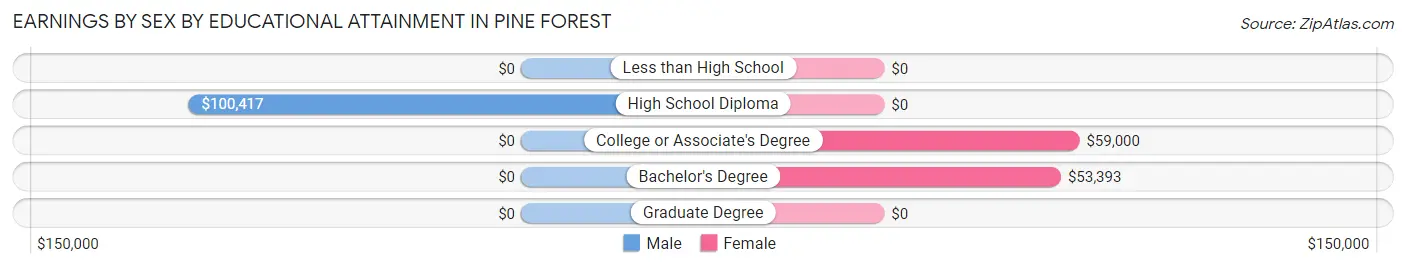
Earnings by Sex by Educational Attainment in Pine Forest
Average earnings in Pine Forest are $69,653 for men and $56,667 for women, a difference of 18.6%. Men with an educational attainment of high school diploma enjoy the highest average annual earnings of $100,417, while those with high school diploma education earn the least with $100,417. Women with an educational attainment of college or associate's degree earn the most with the average annual earnings of $59,000, while those with bachelor's degree education have the smallest earnings of $53,393.
| Educational Attainment | Male Income | Female Income |
| Less than High School | - | - |
| High School Diploma | $100,417 | $0 |
| College or Associate's Degree | - | - |
| Bachelor's Degree | - | - |
| Graduate Degree | - | - |
| Total | $69,653 | $56,667 |
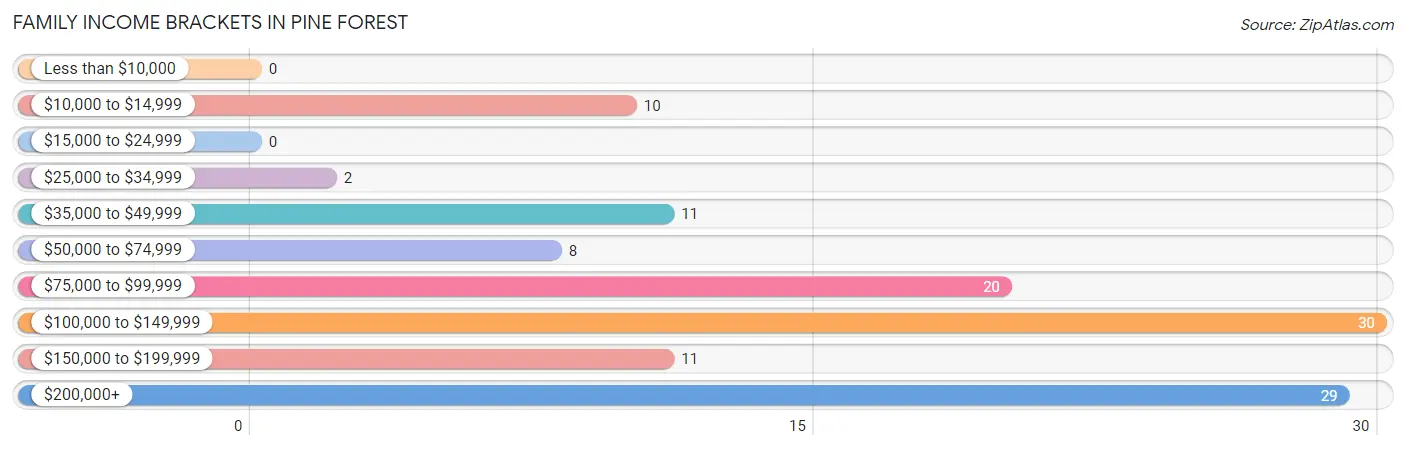
Family Income in Pine Forest
Family Income Brackets in Pine Forest
According to the Pine Forest family income data, there are 30 families falling into the $100,000 to $149,999 income range, which is the most common income bracket and makes up 24.8% of all families.
| Income Bracket | # Families | % Families |
| Less than $10,000 | 0 | 0.0% |
| $10,000 to $14,999 | 10 | 8.3% |
| $15,000 to $24,999 | 0 | 0.0% |
| $25,000 to $34,999 | 2 | 1.7% |
| $35,000 to $49,999 | 11 | 9.1% |
| $50,000 to $74,999 | 8 | 6.6% |
| $75,000 to $99,999 | 20 | 16.5% |
| $100,000 to $149,999 | 30 | 24.8% |
| $150,000 to $199,999 | 11 | 9.1% |
| $200,000+ | 29 | 24.0% |
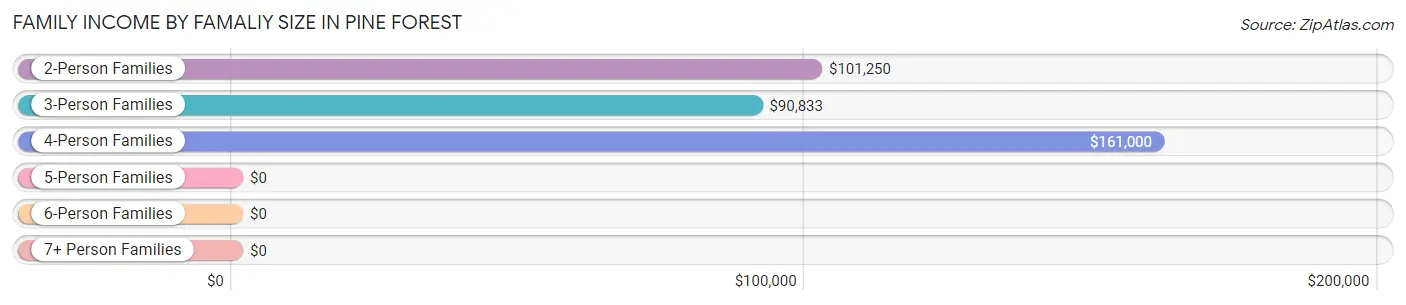
Family Income by Famaliy Size in Pine Forest
4-person families (34 | 28.1%) account for the highest median family income in Pine Forest with $161,000 per family, while 2-person families (54 | 44.6%) have the highest median income of $50,625 per family member.
| Income Bracket | # Families | Median Income |
| 2-Person Families | 54 (44.6%) | $101,250 |
| 3-Person Families | 10 (8.3%) | $90,833 |
| 4-Person Families | 34 (28.1%) | $161,000 |
| 5-Person Families | 8 (6.6%) | $0 |
| 6-Person Families | 15 (12.4%) | $0 |
| 7+ Person Families | 0 (0.0%) | $0 |
| Total | 121 (100.0%) | $115,417 |
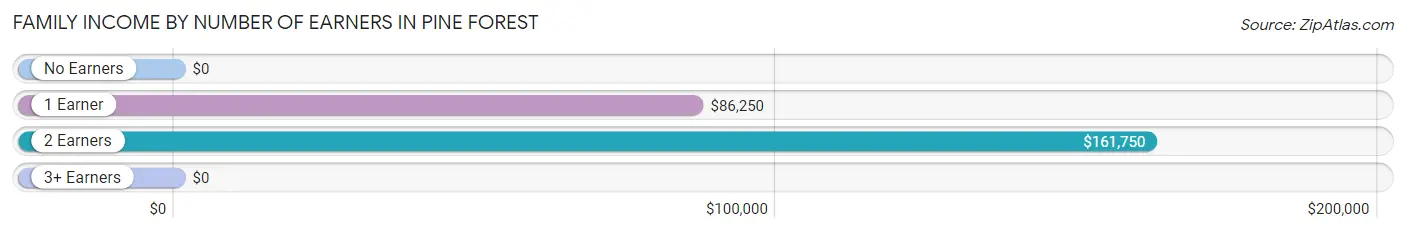
Family Income by Number of Earners in Pine Forest
| Number of Earners | # Families | Median Income |
| No Earners | 20 (16.5%) | $0 |
| 1 Earner | 28 (23.1%) | $86,250 |
| 2 Earners | 64 (52.9%) | $161,750 |
| 3+ Earners | 9 (7.4%) | $0 |
| Total | 121 (100.0%) | $115,417 |
Household Income in Pine Forest
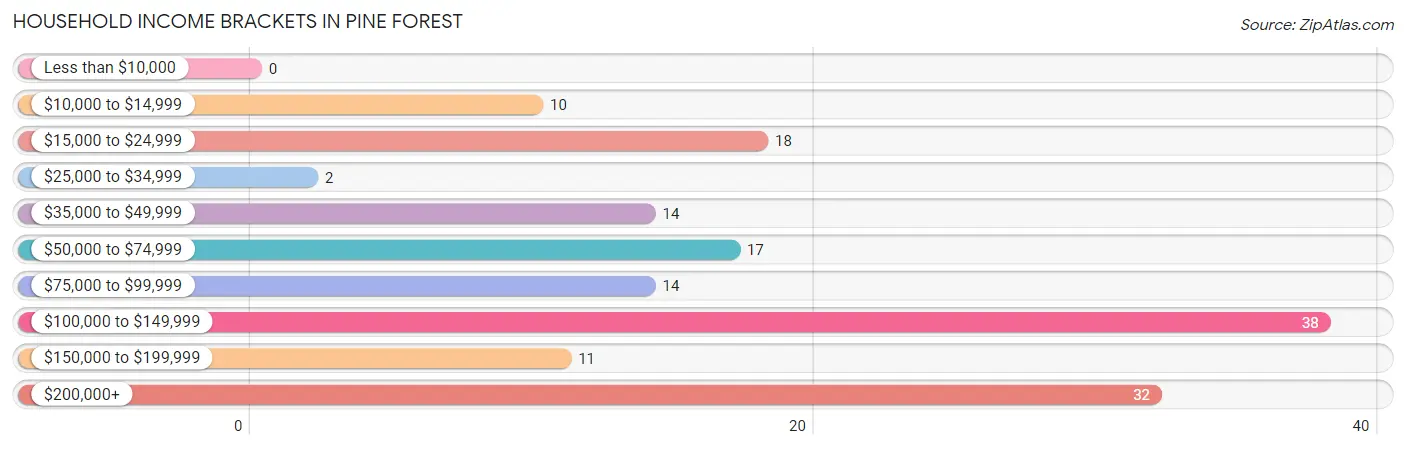
Household Income Brackets in Pine Forest
With 38 households falling in the category, the $100,000 to $149,999 income range is the most frequent in Pine Forest, accounting for 24.4% of all households.
| Income Bracket | # Households | % Households |
| Less than $10,000 | 0 | 0.0% |
| $10,000 to $14,999 | 10 | 6.4% |
| $15,000 to $24,999 | 18 | 11.5% |
| $25,000 to $34,999 | 2 | 1.3% |
| $35,000 to $49,999 | 14 | 9.0% |
| $50,000 to $74,999 | 17 | 10.9% |
| $75,000 to $99,999 | 14 | 9.0% |
| $100,000 to $149,999 | 38 | 24.4% |
| $150,000 to $199,999 | 11 | 7.1% |
| $200,000+ | 32 | 20.5% |
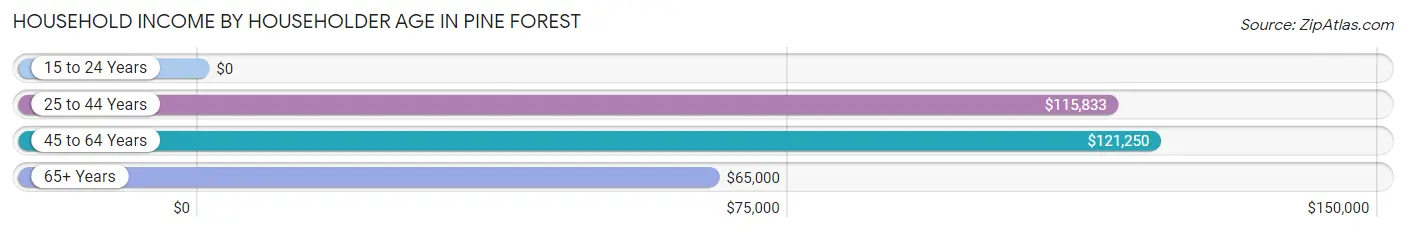
Household Income by Householder Age in Pine Forest
The median household income in Pine Forest is $108,333, with the highest median household income of $121,250 found in the 45 to 64 years age bracket for the primary householder. A total of 79 households (50.6%) fall into this category. Meanwhile, the 15 to 24 years age bracket for the primary householder has the lowest median household income of $0, with 3 households (1.9%) in this group.
| Income Bracket | # Households | Median Income |
| 15 to 24 Years | 3 (1.9%) | $0 |
| 25 to 44 Years | 44 (28.2%) | $115,833 |
| 45 to 64 Years | 79 (50.6%) | $121,250 |
| 65+ Years | 30 (19.2%) | $65,000 |
| Total | 156 (100.0%) | $108,333 |
Poverty in Pine Forest
Income Below Poverty by Sex and Age in Pine Forest
With 17.1% poverty level for males and 12.9% for females among the residents of Pine Forest, 15 year old males and under 5 year old females are the most vulnerable to poverty, with 4 males (100.0%) and 8 females (42.1%) in their respective age groups living below the poverty level.
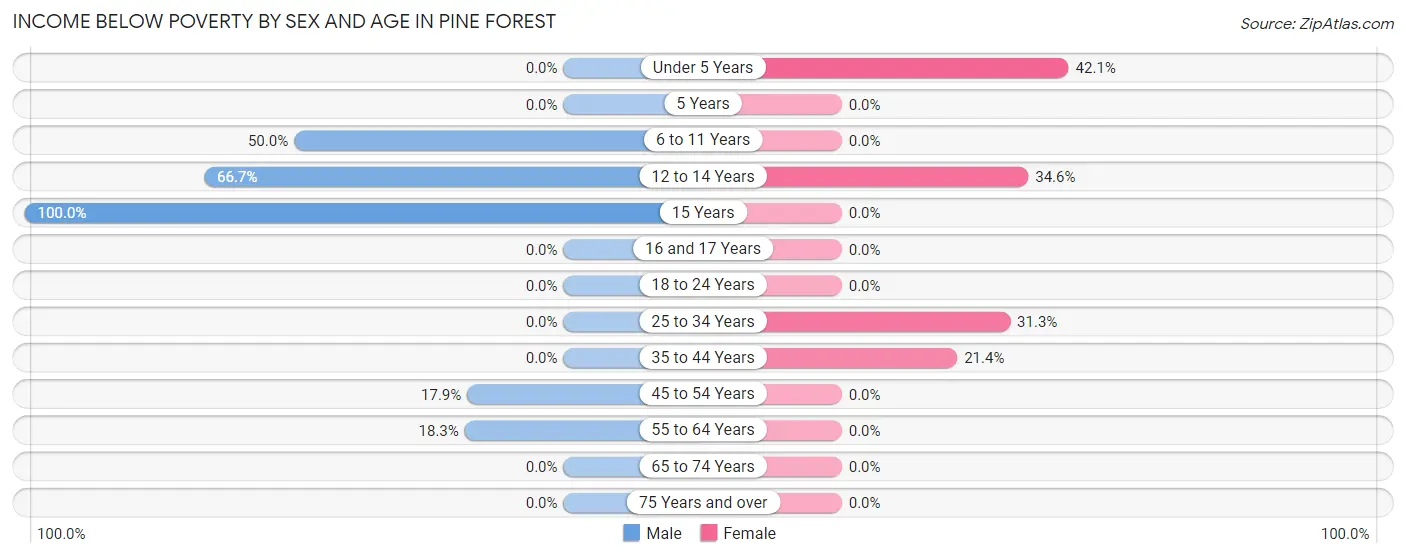
| Age Bracket | Male | Female |
| Under 5 Years | 0 (0.0%) | 8 (42.1%) |
| 5 Years | 0 (0.0%) | 0 (0.0%) |
| 6 to 11 Years | 9 (50.0%) | 0 (0.0%) |
| 12 to 14 Years | 10 (66.7%) | 9 (34.6%) |
| 15 Years | 4 (100.0%) | 0 (0.0%) |
| 16 and 17 Years | 0 (0.0%) | 0 (0.0%) |
| 18 to 24 Years | 0 (0.0%) | 0 (0.0%) |
| 25 to 34 Years | 0 (0.0%) | 10 (31.2%) |
| 35 to 44 Years | 0 (0.0%) | 3 (21.4%) |
| 45 to 54 Years | 5 (17.9%) | 0 (0.0%) |
| 55 to 64 Years | 11 (18.3%) | 0 (0.0%) |
| 65 to 74 Years | 0 (0.0%) | 0 (0.0%) |
| 75 Years and over | 0 (0.0%) | 0 (0.0%) |
| Total | 39 (17.1%) | 30 (12.9%) |
Income Above Poverty by Sex and Age in Pine Forest
According to the poverty statistics in Pine Forest, males aged 16 and 17 years and females aged 6 to 11 years are the age groups that are most secure financially, with 100.0% of males and 100.0% of females in these age groups living above the poverty line.
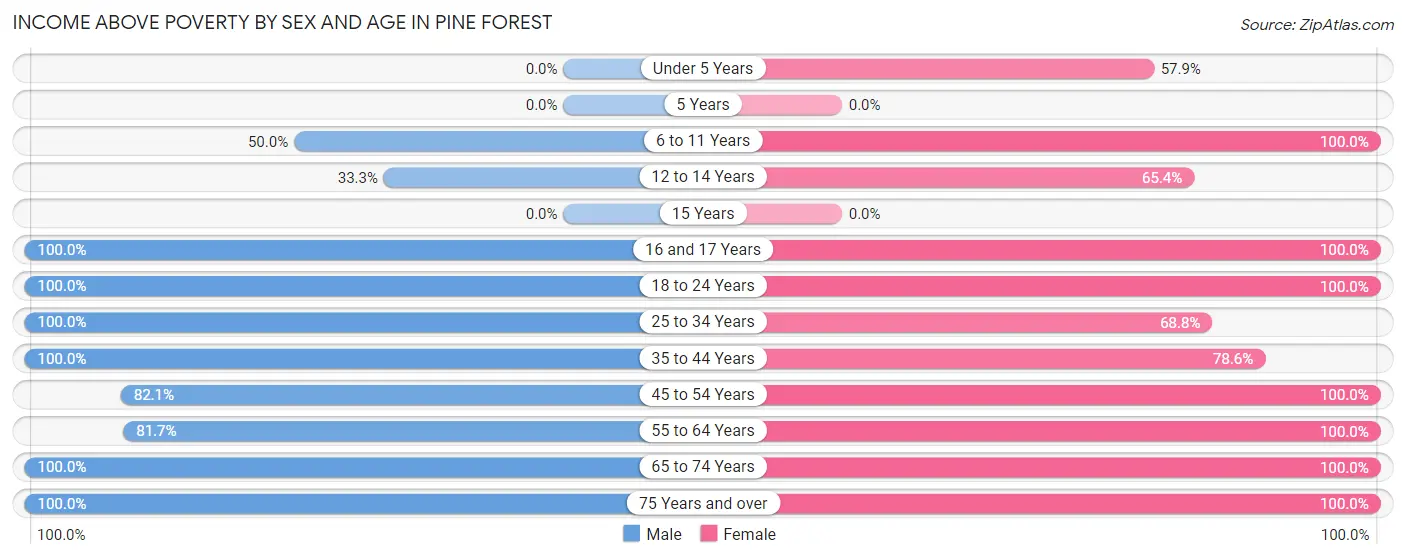
| Age Bracket | Male | Female |
| Under 5 Years | 0 (0.0%) | 11 (57.9%) |
| 5 Years | 0 (0.0%) | 0 (0.0%) |
| 6 to 11 Years | 9 (50.0%) | 20 (100.0%) |
| 12 to 14 Years | 5 (33.3%) | 17 (65.4%) |
| 15 Years | 0 (0.0%) | 0 (0.0%) |
| 16 and 17 Years | 21 (100.0%) | 12 (100.0%) |
| 18 to 24 Years | 10 (100.0%) | 10 (100.0%) |
| 25 to 34 Years | 36 (100.0%) | 22 (68.8%) |
| 35 to 44 Years | 18 (100.0%) | 11 (78.6%) |
| 45 to 54 Years | 23 (82.1%) | 27 (100.0%) |
| 55 to 64 Years | 49 (81.7%) | 44 (100.0%) |
| 65 to 74 Years | 4 (100.0%) | 14 (100.0%) |
| 75 Years and over | 14 (100.0%) | 15 (100.0%) |
| Total | 189 (82.9%) | 203 (87.1%) |
Income Below Poverty Among Married-Couple Families in Pine Forest
The poverty statistics for married-couple families in Pine Forest show that 9.6% or 10 of the total 104 families live below the poverty line. Families with 3 or 4 children have the highest poverty rate of 58.8%, comprising of 10 families. On the other hand, families with no children have the lowest poverty rate of 0.0%, which includes 0 families.
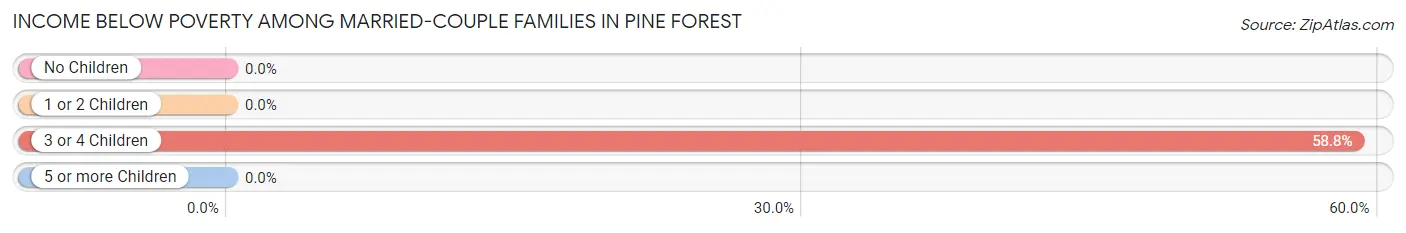
| Children | Above Poverty | Below Poverty |
| No Children | 49 (100.0%) | 0 (0.0%) |
| 1 or 2 Children | 38 (100.0%) | 0 (0.0%) |
| 3 or 4 Children | 7 (41.2%) | 10 (58.8%) |
| 5 or more Children | 0 (0.0%) | 0 (0.0%) |
| Total | 94 (90.4%) | 10 (9.6%) |
Income Below Poverty Among Single-Parent Households in Pine Forest
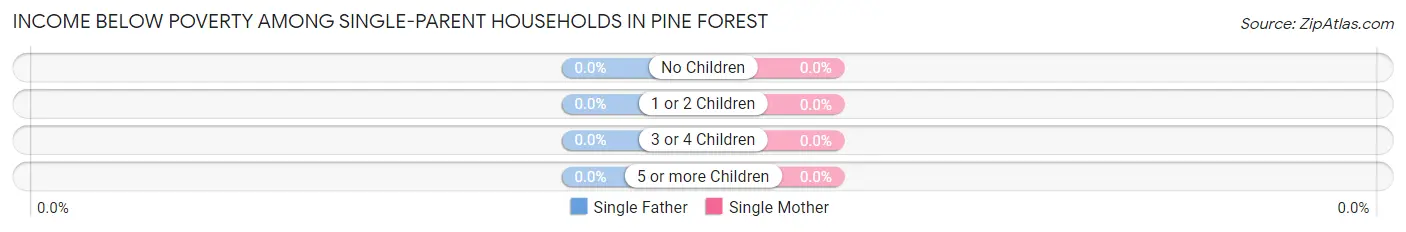
| Children | Single Father | Single Mother |
| No Children | 0 (0.0%) | 0 (0.0%) |
| 1 or 2 Children | 0 (0.0%) | 0 (0.0%) |
| 3 or 4 Children | 0 (0.0%) | 0 (0.0%) |
| 5 or more Children | 0 (0.0%) | 0 (0.0%) |
| Total | 0 (0.0%) | 0 (0.0%) |
Income Below Poverty Among Married-Couple vs Single-Parent Households in Pine Forest
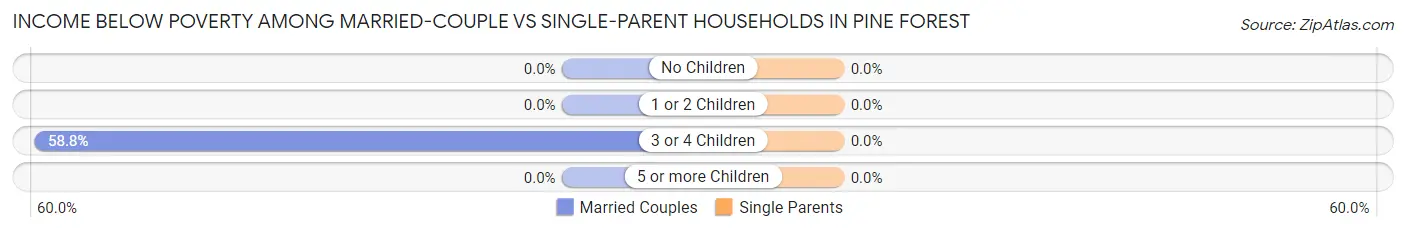
| Children | Married-Couple Families | Single-Parent Households |
| No Children | 0 (0.0%) | 0 (0.0%) |
| 1 or 2 Children | 0 (0.0%) | 0 (0.0%) |
| 3 or 4 Children | 10 (58.8%) | 0 (0.0%) |
| 5 or more Children | 0 (0.0%) | 0 (0.0%) |
| Total | 10 (9.6%) | 0 (0.0%) |
Employment Characteristics in Pine Forest
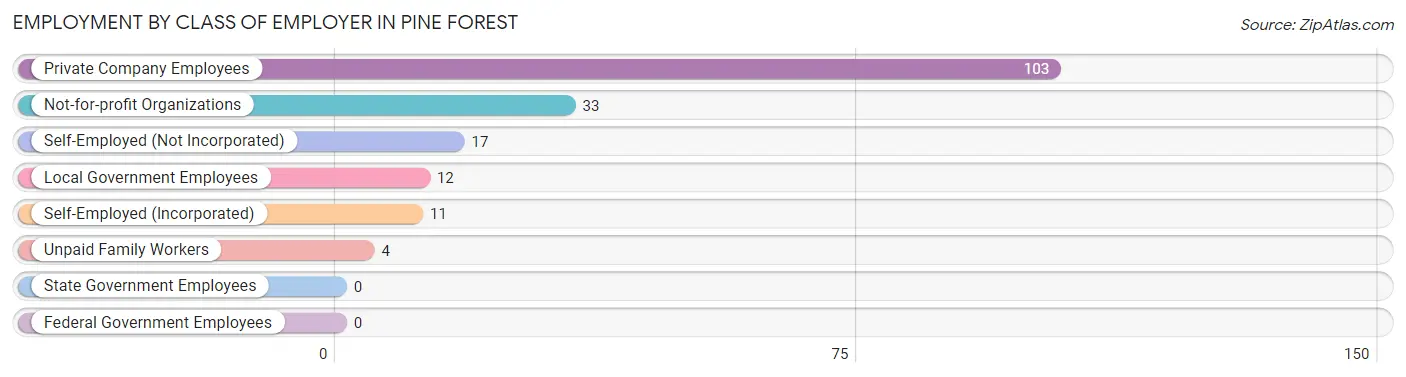
Employment by Class of Employer in Pine Forest
Among the 180 employed individuals in Pine Forest, private company employees (103 | 57.2%), not-for-profit organizations (33 | 18.3%), and self-employed (not incorporated) (17 | 9.4%) make up the most common classes of employment.
| Employer Class | # Employees | % Employees |
| Private Company Employees | 103 | 57.2% |
| Self-Employed (Incorporated) | 11 | 6.1% |
| Self-Employed (Not Incorporated) | 17 | 9.4% |
| Not-for-profit Organizations | 33 | 18.3% |
| Local Government Employees | 12 | 6.7% |
| State Government Employees | 0 | 0.0% |
| Federal Government Employees | 0 | 0.0% |
| Unpaid Family Workers | 4 | 2.2% |
| Total | 180 | 100.0% |
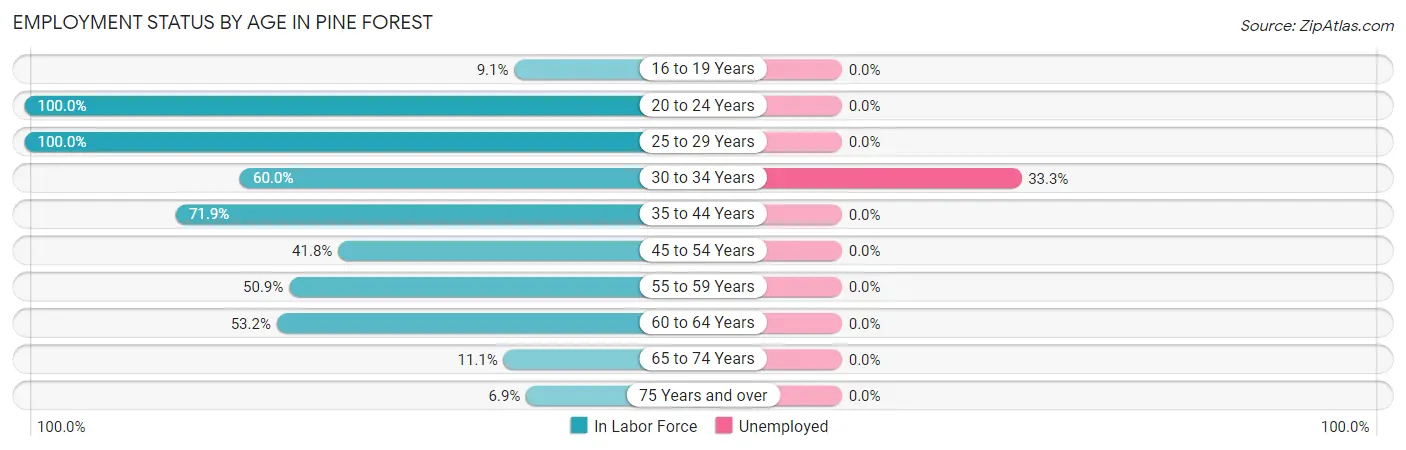
Employment Status by Age in Pine Forest
According to the labor force statistics for Pine Forest, out of the total population over 16 years of age (359), 51.5% or 185 individuals are in the labor force, with 2.7% or 5 of them unemployed. The age group with the highest labor force participation rate is 20 to 24 years, with 100.0% or 20 individuals in the labor force. Within the labor force, the 30 to 34 years age range has the highest percentage of unemployed individuals, with 33.3% or 5 of them being unemployed.
| Age Bracket | In Labor Force | Unemployed |
| 16 to 19 Years | 3 (9.1%) | 0 (0.0%) |
| 20 to 24 Years | 20 (100.0%) | 0 (0.0%) |
| 25 to 29 Years | 43 (100.0%) | 0 (0.0%) |
| 30 to 34 Years | 15 (60.0%) | 5 (33.3%) |
| 35 to 44 Years | 23 (71.9%) | 0 (0.0%) |
| 45 to 54 Years | 23 (41.8%) | 0 (0.0%) |
| 55 to 59 Years | 29 (50.9%) | 0 (0.0%) |
| 60 to 64 Years | 25 (53.2%) | 0 (0.0%) |
| 65 to 74 Years | 2 (11.1%) | 0 (0.0%) |
| 75 Years and over | 2 (6.9%) | 0 (0.0%) |
| Total | 185 (51.5%) | 5 (2.7%) |
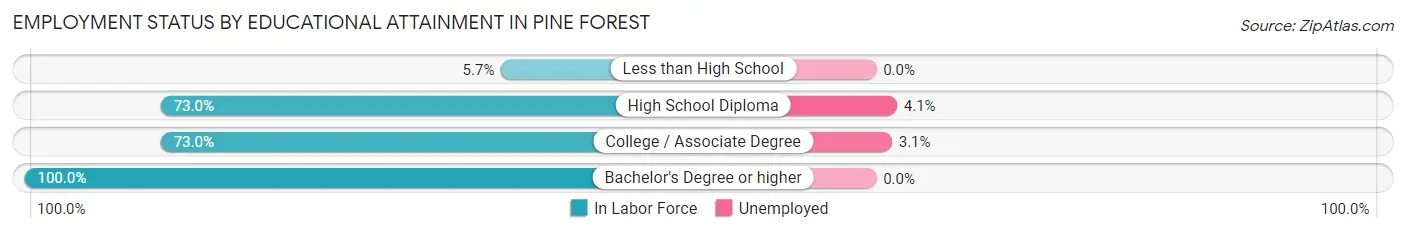
Employment Status by Educational Attainment in Pine Forest
According to labor force statistics for Pine Forest, 61.0% of individuals (158) out of the total population between 25 and 64 years of age (259) are in the labor force, with 3.2% or 5 of them being unemployed. The group with the highest labor force participation rate are those with the educational attainment of bachelor's degree or higher, with 100.0% or 17 individuals in the labor force. Within the labor force, individuals with high school diploma education have the highest percentage of unemployment, with 4.1% or 3 of them being unemployed.
| Educational Attainment | In Labor Force | Unemployed |
| Less than High School | 3 (5.7%) | 0 (0.0%) |
| High School Diploma | 73 (73.0%) | 4 (4.1%) |
| College / Associate Degree | 65 (73.0%) | 3 (3.1%) |
| Bachelor's Degree or higher | 17 (100.0%) | 0 (0.0%) |
| Total | 158 (61.0%) | 8 (3.2%) |
Employment Occupations by Sex in Pine Forest
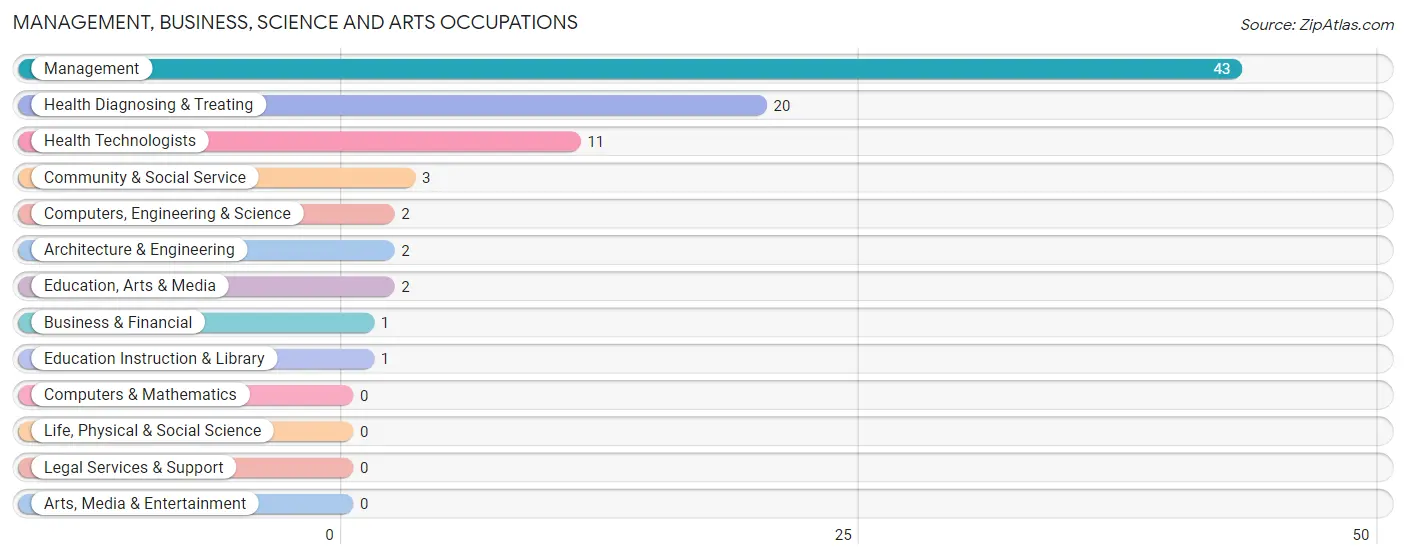
Management, Business, Science and Arts Occupations
The most common Management, Business, Science and Arts occupations in Pine Forest are Management (43 | 23.9%), Health Diagnosing & Treating (20 | 11.1%), Health Technologists (11 | 6.1%), Community & Social Service (3 | 1.7%), and Computers, Engineering & Science (2 | 1.1%).
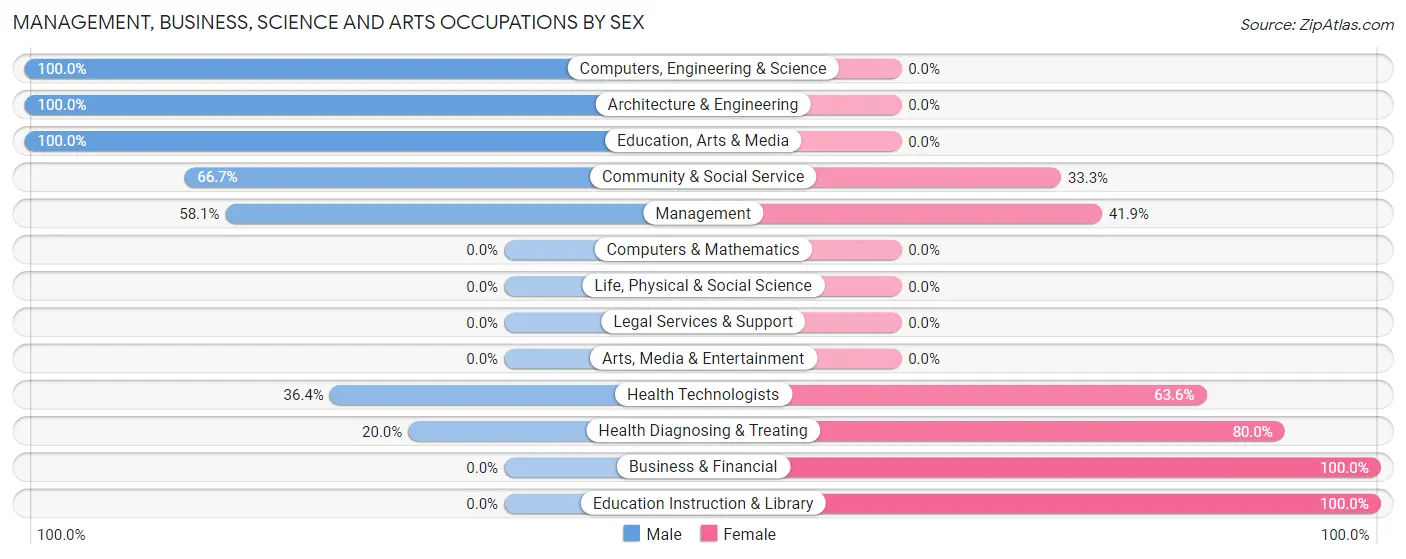
Management, Business, Science and Arts Occupations by Sex
Within the Management, Business, Science and Arts occupations in Pine Forest, the most male-oriented occupations are Computers, Engineering & Science (100.0%), Architecture & Engineering (100.0%), and Education, Arts & Media (100.0%), while the most female-oriented occupations are Business & Financial (100.0%), Education Instruction & Library (100.0%), and Health Diagnosing & Treating (80.0%).
| Occupation | Male | Female |
| Management | 25 (58.1%) | 18 (41.9%) |
| Business & Financial | 0 (0.0%) | 1 (100.0%) |
| Computers, Engineering & Science | 2 (100.0%) | 0 (0.0%) |
| Computers & Mathematics | 0 (0.0%) | 0 (0.0%) |
| Architecture & Engineering | 2 (100.0%) | 0 (0.0%) |
| Life, Physical & Social Science | 0 (0.0%) | 0 (0.0%) |
| Community & Social Service | 2 (66.7%) | 1 (33.3%) |
| Education, Arts & Media | 2 (100.0%) | 0 (0.0%) |
| Legal Services & Support | 0 (0.0%) | 0 (0.0%) |
| Education Instruction & Library | 0 (0.0%) | 1 (100.0%) |
| Arts, Media & Entertainment | 0 (0.0%) | 0 (0.0%) |
| Health Diagnosing & Treating | 4 (20.0%) | 16 (80.0%) |
| Health Technologists | 4 (36.4%) | 7 (63.6%) |
| Total (Category) | 33 (47.8%) | 36 (52.2%) |
| Total (Overall) | 103 (57.2%) | 77 (42.8%) |
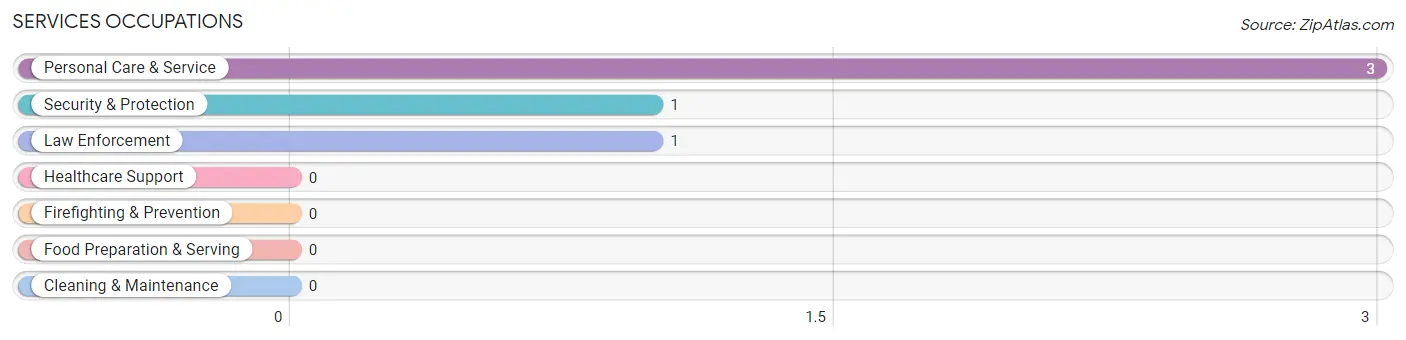
Services Occupations
The most common Services occupations in Pine Forest are Personal Care & Service (3 | 1.7%), Security & Protection (1 | 0.6%), and Law Enforcement (1 | 0.6%).
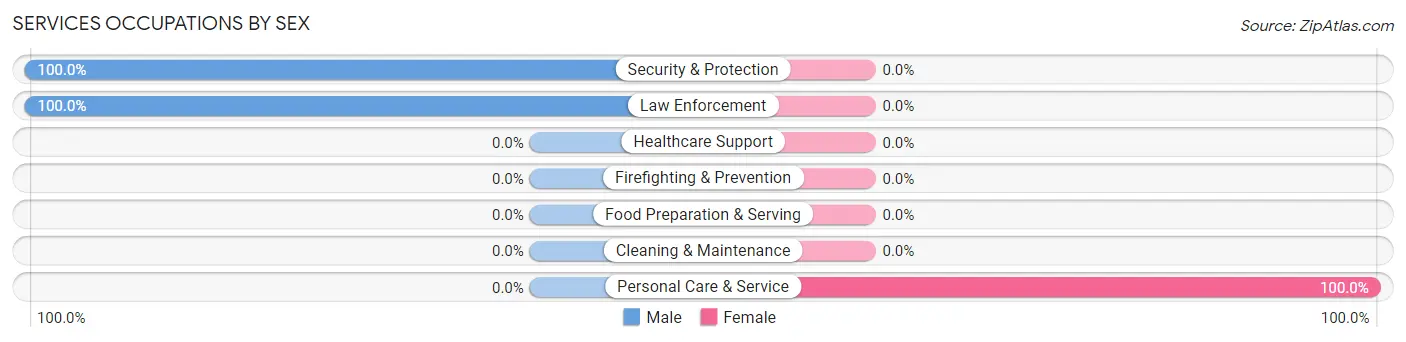
Services Occupations by Sex
| Occupation | Male | Female |
| Healthcare Support | 0 (0.0%) | 0 (0.0%) |
| Security & Protection | 1 (100.0%) | 0 (0.0%) |
| Firefighting & Prevention | 0 (0.0%) | 0 (0.0%) |
| Law Enforcement | 1 (100.0%) | 0 (0.0%) |
| Food Preparation & Serving | 0 (0.0%) | 0 (0.0%) |
| Cleaning & Maintenance | 0 (0.0%) | 0 (0.0%) |
| Personal Care & Service | 0 (0.0%) | 3 (100.0%) |
| Total (Category) | 1 (25.0%) | 3 (75.0%) |
| Total (Overall) | 103 (57.2%) | 77 (42.8%) |
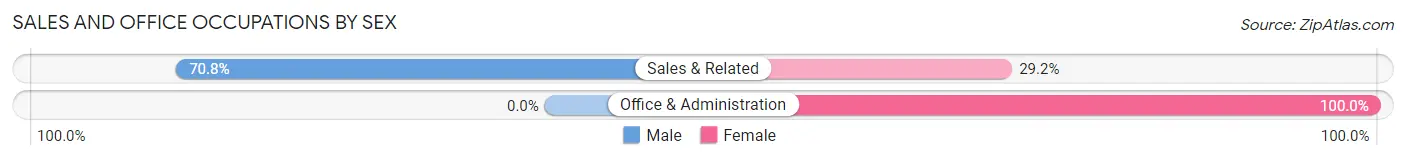
Sales and Office Occupations
The most common Sales and Office occupations in Pine Forest are Sales & Related (24 | 13.3%), and Office & Administration (24 | 13.3%).
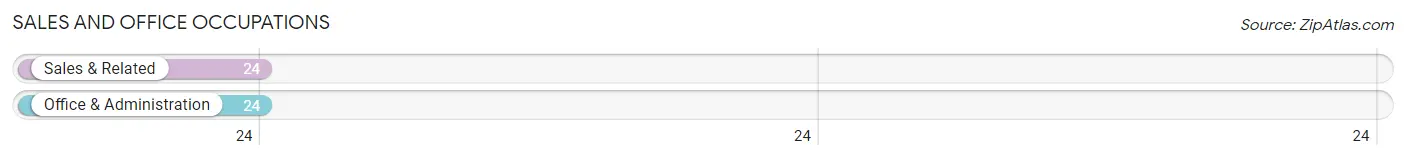
Sales and Office Occupations by Sex
| Occupation | Male | Female |
| Sales & Related | 17 (70.8%) | 7 (29.2%) |
| Office & Administration | 0 (0.0%) | 24 (100.0%) |
| Total (Category) | 17 (35.4%) | 31 (64.6%) |
| Total (Overall) | 103 (57.2%) | 77 (42.8%) |
Natural Resources, Construction and Maintenance Occupations
The most common Natural Resources, Construction and Maintenance occupations in Pine Forest are Construction & Extraction (22 | 12.2%), and Installation, Maintenance & Repair (18 | 10.0%).
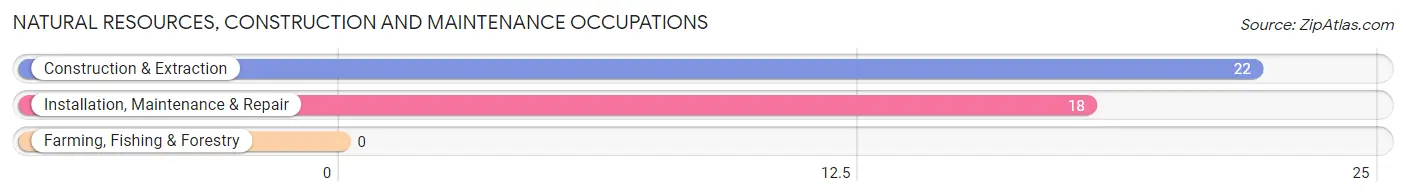
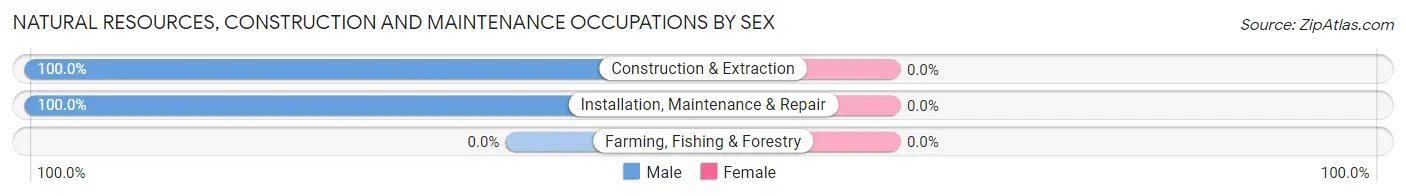
Natural Resources, Construction and Maintenance Occupations by Sex
| Occupation | Male | Female |
| Farming, Fishing & Forestry | 0 (0.0%) | 0 (0.0%) |
| Construction & Extraction | 22 (100.0%) | 0 (0.0%) |
| Installation, Maintenance & Repair | 18 (100.0%) | 0 (0.0%) |
| Total (Category) | 40 (100.0%) | 0 (0.0%) |
| Total (Overall) | 103 (57.2%) | 77 (42.8%) |
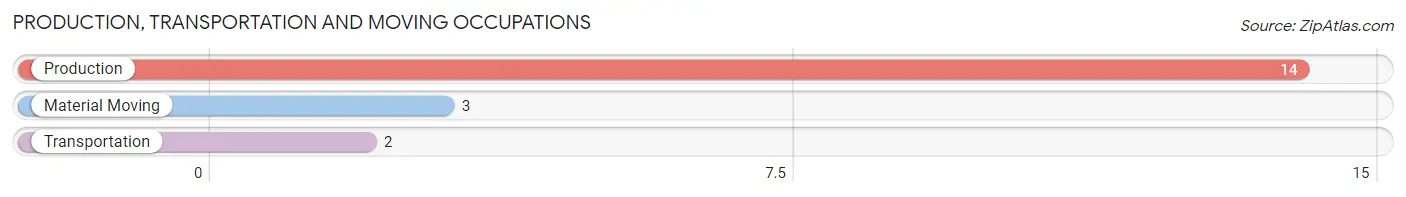
Production, Transportation and Moving Occupations
The most common Production, Transportation and Moving occupations in Pine Forest are Production (14 | 7.8%), Material Moving (3 | 1.7%), and Transportation (2 | 1.1%).
Production, Transportation and Moving Occupations by Sex
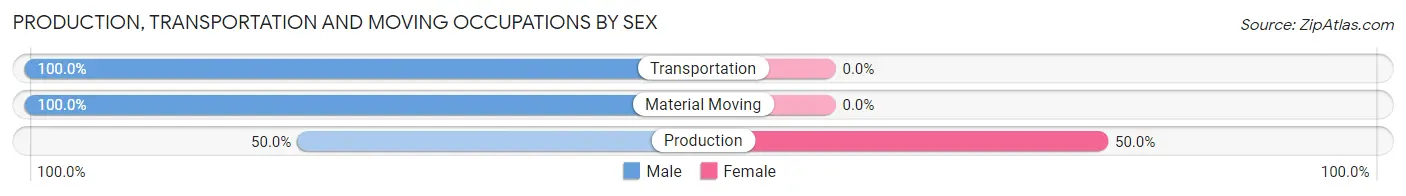
| Occupation | Male | Female |
| Production | 7 (50.0%) | 7 (50.0%) |
| Transportation | 2 (100.0%) | 0 (0.0%) |
| Material Moving | 3 (100.0%) | 0 (0.0%) |
| Total (Category) | 12 (63.2%) | 7 (36.8%) |
| Total (Overall) | 103 (57.2%) | 77 (42.8%) |
Employment Industries by Sex in Pine Forest
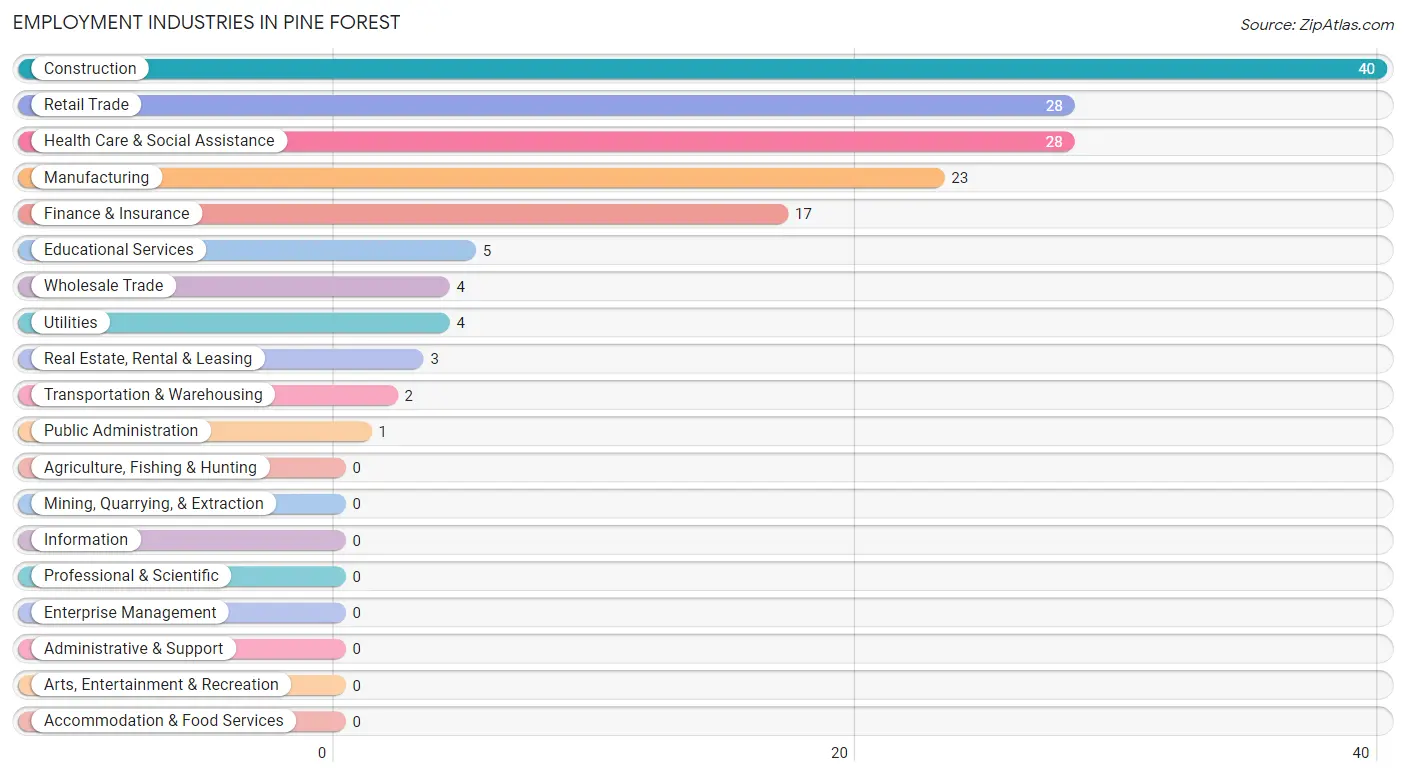
Employment Industries in Pine Forest
The major employment industries in Pine Forest include Construction (40 | 22.2%), Retail Trade (28 | 15.6%), Health Care & Social Assistance (28 | 15.6%), Manufacturing (23 | 12.8%), and Finance & Insurance (17 | 9.4%).
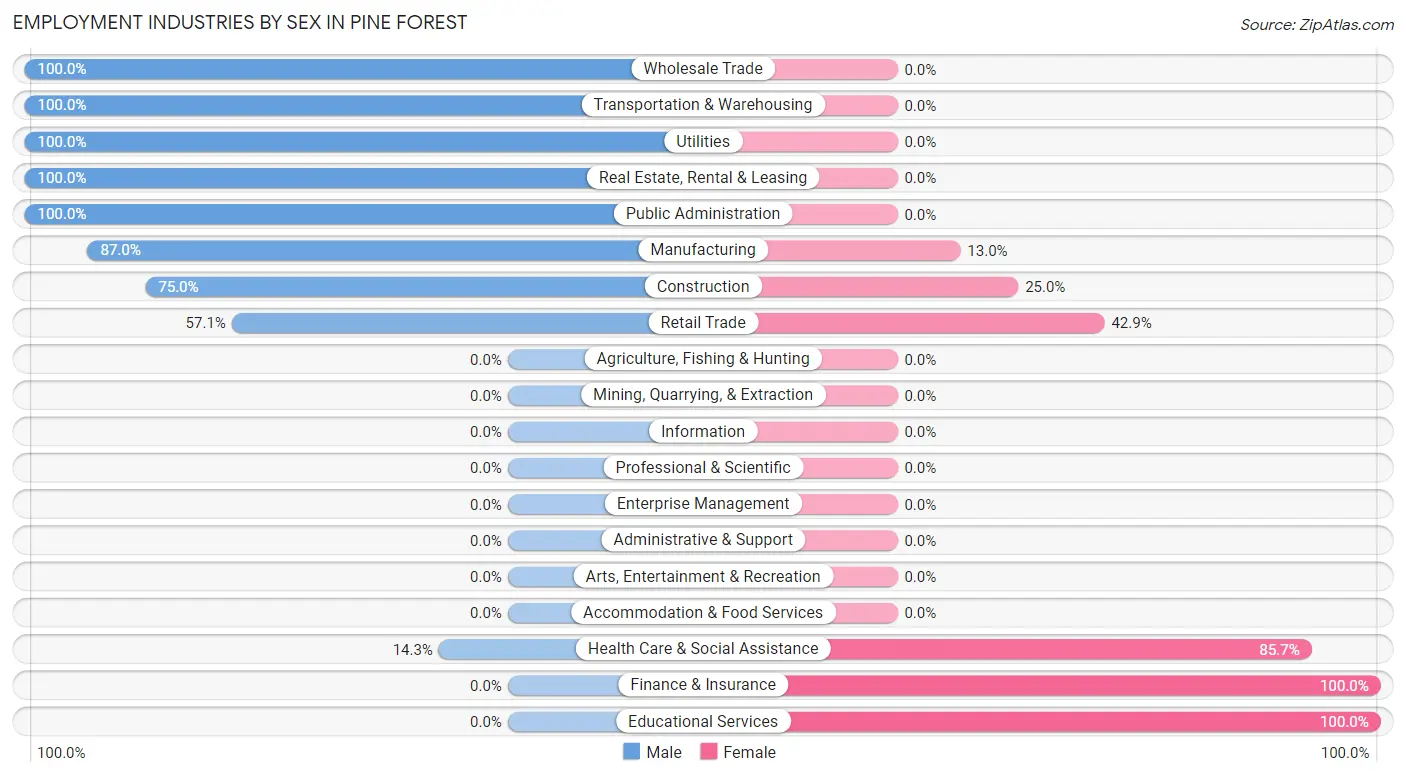
Employment Industries by Sex in Pine Forest
The Pine Forest industries that see more men than women are Wholesale Trade (100.0%), Transportation & Warehousing (100.0%), and Utilities (100.0%), whereas the industries that tend to have a higher number of women are Finance & Insurance (100.0%), Educational Services (100.0%), and Health Care & Social Assistance (85.7%).
| Industry | Male | Female |
| Agriculture, Fishing & Hunting | 0 (0.0%) | 0 (0.0%) |
| Mining, Quarrying, & Extraction | 0 (0.0%) | 0 (0.0%) |
| Construction | 30 (75.0%) | 10 (25.0%) |
| Manufacturing | 20 (87.0%) | 3 (13.0%) |
| Wholesale Trade | 4 (100.0%) | 0 (0.0%) |
| Retail Trade | 16 (57.1%) | 12 (42.9%) |
| Transportation & Warehousing | 2 (100.0%) | 0 (0.0%) |
| Utilities | 4 (100.0%) | 0 (0.0%) |
| Information | 0 (0.0%) | 0 (0.0%) |
| Finance & Insurance | 0 (0.0%) | 17 (100.0%) |
| Real Estate, Rental & Leasing | 3 (100.0%) | 0 (0.0%) |
| Professional & Scientific | 0 (0.0%) | 0 (0.0%) |
| Enterprise Management | 0 (0.0%) | 0 (0.0%) |
| Administrative & Support | 0 (0.0%) | 0 (0.0%) |
| Educational Services | 0 (0.0%) | 5 (100.0%) |
| Health Care & Social Assistance | 4 (14.3%) | 24 (85.7%) |
| Arts, Entertainment & Recreation | 0 (0.0%) | 0 (0.0%) |
| Accommodation & Food Services | 0 (0.0%) | 0 (0.0%) |
| Public Administration | 1 (100.0%) | 0 (0.0%) |
| Total | 103 (57.2%) | 77 (42.8%) |
Education in Pine Forest
School Enrollment in Pine Forest
The most common levels of schooling among the 124 students in Pine Forest are middle school (49 | 39.5%), high school (33 | 26.6%), and elementary school (22 | 17.7%).
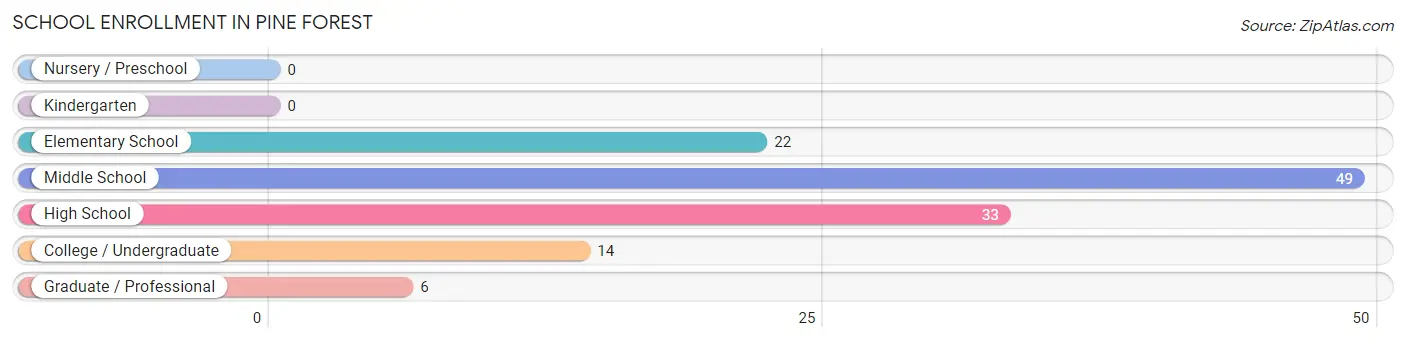
| School Level | # Students | % Students |
| Nursery / Preschool | 0 | 0.0% |
| Kindergarten | 0 | 0.0% |
| Elementary School | 22 | 17.7% |
| Middle School | 49 | 39.5% |
| High School | 33 | 26.6% |
| College / Undergraduate | 14 | 11.3% |
| Graduate / Professional | 6 | 4.8% |
| Total | 124 | 100.0% |
School Enrollment by Age by Funding Source in Pine Forest
Out of a total of 124 students who are enrolled in schools in Pine Forest, 23 (18.5%) attend a private institution, while the remaining 101 (81.5%) are enrolled in public schools. The age group of 10 to 14 year olds has the highest likelihood of being enrolled in private schools, with 15 (25.4% in the age bracket) enrolled. Conversely, the age group of 5 to 9 year old has the lowest likelihood of being enrolled in a private school, with 16 (100.0% in the age bracket) attending a public institution.
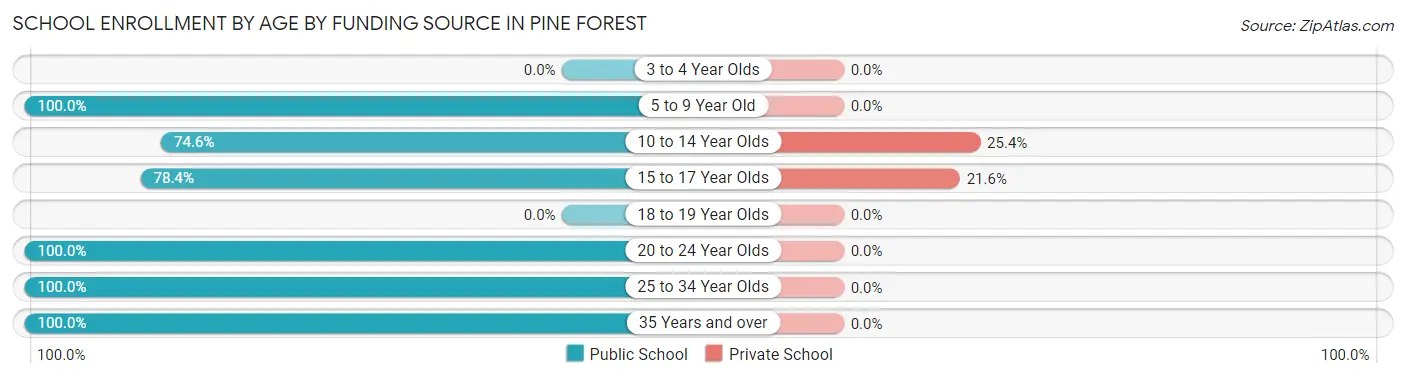
| Age Bracket | Public School | Private School |
| 3 to 4 Year Olds | 0 (0.0%) | 0 (0.0%) |
| 5 to 9 Year Old | 16 (100.0%) | 0 (0.0%) |
| 10 to 14 Year Olds | 44 (74.6%) | 15 (25.4%) |
| 15 to 17 Year Olds | 29 (78.4%) | 8 (21.6%) |
| 18 to 19 Year Olds | 0 (0.0%) | 0 (0.0%) |
| 20 to 24 Year Olds | 4 (100.0%) | 0 (0.0%) |
| 25 to 34 Year Olds | 3 (100.0%) | 0 (0.0%) |
| 35 Years and over | 5 (100.0%) | 0 (0.0%) |
| Total | 101 (81.5%) | 23 (18.5%) |
Educational Attainment by Field of Study in Pine Forest
Science & technology (9 | 39.1%), education (4 | 17.4%), business (3 | 13.0%), liberal arts & history (3 | 13.0%), and physical & health sciences (2 | 8.7%) are the most common fields of study among 23 individuals in Pine Forest who have obtained a bachelor's degree or higher.
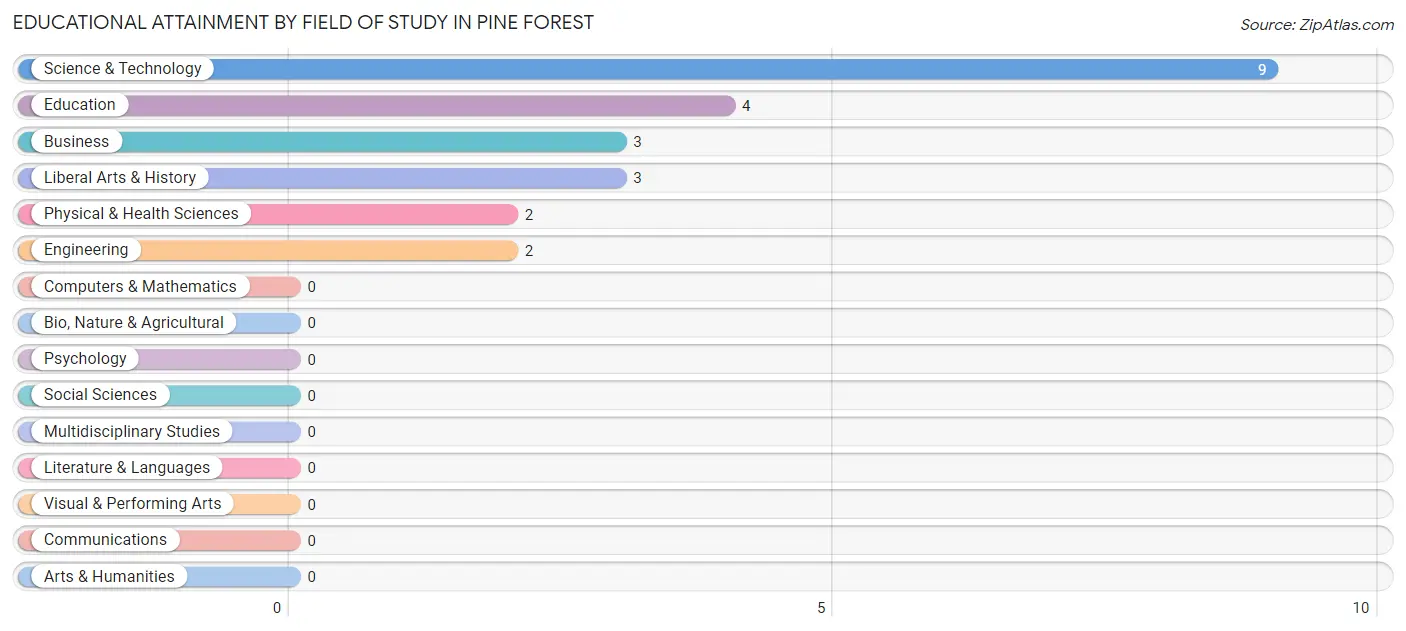
| Field of Study | # Graduates | % Graduates |
| Computers & Mathematics | 0 | 0.0% |
| Bio, Nature & Agricultural | 0 | 0.0% |
| Physical & Health Sciences | 2 | 8.7% |
| Psychology | 0 | 0.0% |
| Social Sciences | 0 | 0.0% |
| Engineering | 2 | 8.7% |
| Multidisciplinary Studies | 0 | 0.0% |
| Science & Technology | 9 | 39.1% |
| Business | 3 | 13.0% |
| Education | 4 | 17.4% |
| Literature & Languages | 0 | 0.0% |
| Liberal Arts & History | 3 | 13.0% |
| Visual & Performing Arts | 0 | 0.0% |
| Communications | 0 | 0.0% |
| Arts & Humanities | 0 | 0.0% |
| Total | 23 | 100.0% |
Transportation & Commute in Pine Forest
Vehicle Availability by Sex in Pine Forest
The most prevalent vehicle ownership categories in Pine Forest are males with 2 vehicles (65, accounting for 63.1%) and females with 2 vehicles (52, making up 84.4%).
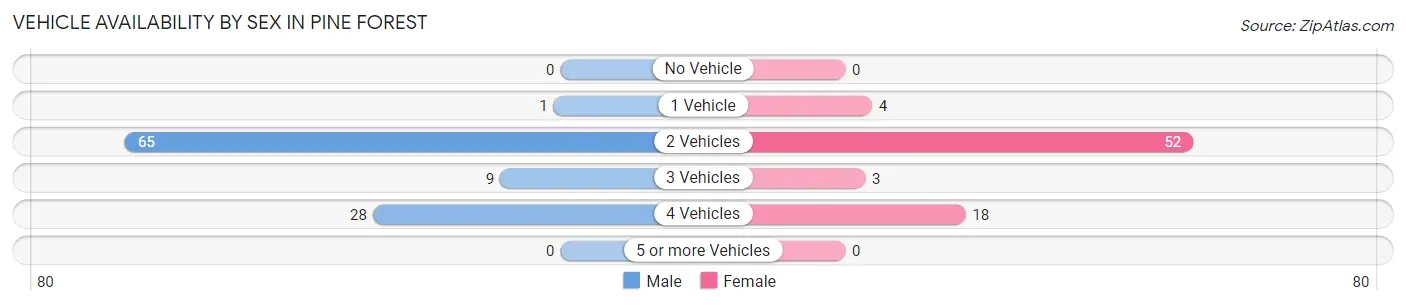
| Vehicles Available | Male | Female |
| No Vehicle | 0 (0.0%) | 0 (0.0%) |
| 1 Vehicle | 1 (1.0%) | 4 (5.2%) |
| 2 Vehicles | 65 (63.1%) | 52 (67.5%) |
| 3 Vehicles | 9 (8.7%) | 3 (3.9%) |
| 4 Vehicles | 28 (27.2%) | 18 (23.4%) |
| 5 or more Vehicles | 0 (0.0%) | 0 (0.0%) |
| Total | 103 (100.0%) | 77 (100.0%) |
Commute Time in Pine Forest
The most frequently occuring commute durations in Pine Forest are 30 to 34 minutes (45 commuters, 25.1%), 5 to 9 minutes (42 commuters, 23.5%), and 20 to 24 minutes (31 commuters, 17.3%).
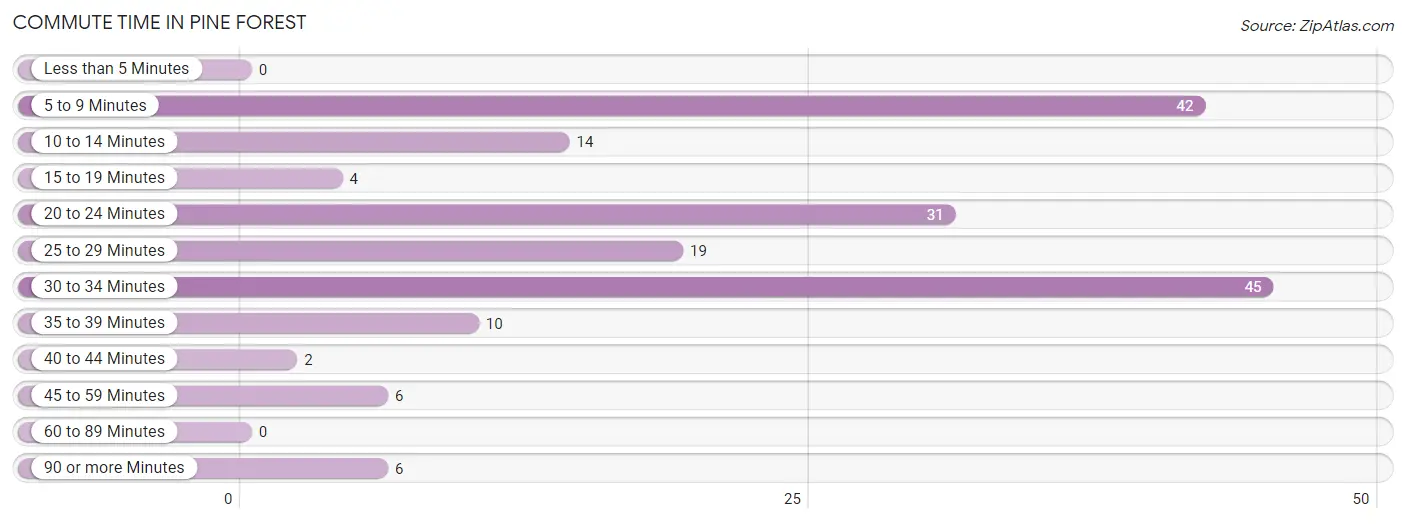
| Commute Time | # Commuters | % Commuters |
| Less than 5 Minutes | 0 | 0.0% |
| 5 to 9 Minutes | 42 | 23.5% |
| 10 to 14 Minutes | 14 | 7.8% |
| 15 to 19 Minutes | 4 | 2.2% |
| 20 to 24 Minutes | 31 | 17.3% |
| 25 to 29 Minutes | 19 | 10.6% |
| 30 to 34 Minutes | 45 | 25.1% |
| 35 to 39 Minutes | 10 | 5.6% |
| 40 to 44 Minutes | 2 | 1.1% |
| 45 to 59 Minutes | 6 | 3.4% |
| 60 to 89 Minutes | 0 | 0.0% |
| 90 or more Minutes | 6 | 3.4% |
Commute Time by Sex in Pine Forest
The most common commute times in Pine Forest are 5 to 9 minutes (38 commuters, 36.9%) for males and 20 to 24 minutes (31 commuters, 40.8%) for females.
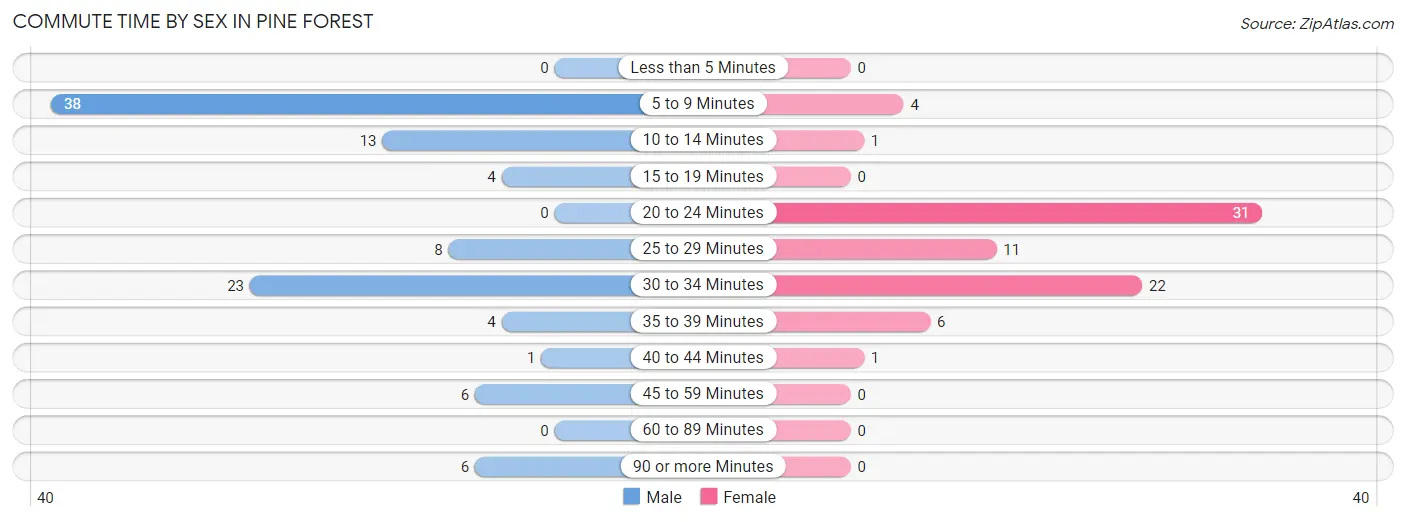
| Commute Time | Male | Female |
| Less than 5 Minutes | 0 (0.0%) | 0 (0.0%) |
| 5 to 9 Minutes | 38 (36.9%) | 4 (5.3%) |
| 10 to 14 Minutes | 13 (12.6%) | 1 (1.3%) |
| 15 to 19 Minutes | 4 (3.9%) | 0 (0.0%) |
| 20 to 24 Minutes | 0 (0.0%) | 31 (40.8%) |
| 25 to 29 Minutes | 8 (7.8%) | 11 (14.5%) |
| 30 to 34 Minutes | 23 (22.3%) | 22 (28.9%) |
| 35 to 39 Minutes | 4 (3.9%) | 6 (7.9%) |
| 40 to 44 Minutes | 1 (1.0%) | 1 (1.3%) |
| 45 to 59 Minutes | 6 (5.8%) | 0 (0.0%) |
| 60 to 89 Minutes | 0 (0.0%) | 0 (0.0%) |
| 90 or more Minutes | 6 (5.8%) | 0 (0.0%) |
Time of Departure to Work by Sex in Pine Forest
The most frequent times of departure to work in Pine Forest are 5:30 AM to 5:59 AM (39, 37.9%) for males and 7:30 AM to 7:59 AM (34, 44.7%) for females.
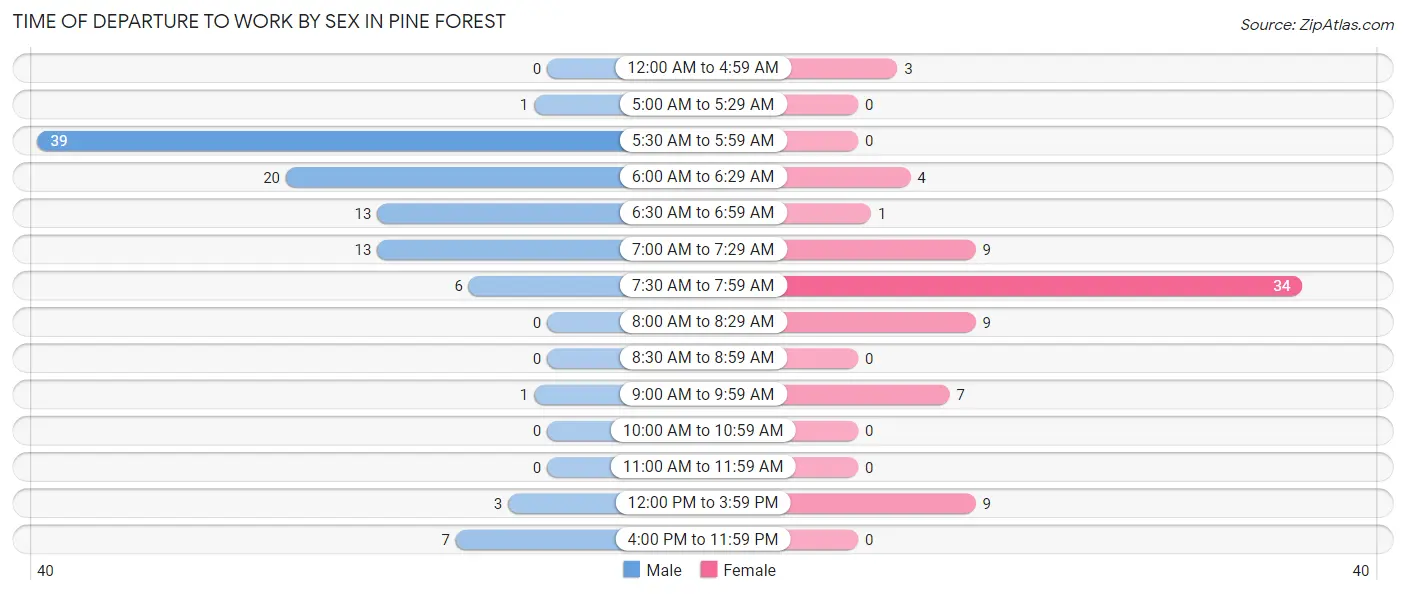
| Time of Departure | Male | Female |
| 12:00 AM to 4:59 AM | 0 (0.0%) | 3 (4.0%) |
| 5:00 AM to 5:29 AM | 1 (1.0%) | 0 (0.0%) |
| 5:30 AM to 5:59 AM | 39 (37.9%) | 0 (0.0%) |
| 6:00 AM to 6:29 AM | 20 (19.4%) | 4 (5.3%) |
| 6:30 AM to 6:59 AM | 13 (12.6%) | 1 (1.3%) |
| 7:00 AM to 7:29 AM | 13 (12.6%) | 9 (11.8%) |
| 7:30 AM to 7:59 AM | 6 (5.8%) | 34 (44.7%) |
| 8:00 AM to 8:29 AM | 0 (0.0%) | 9 (11.8%) |
| 8:30 AM to 8:59 AM | 0 (0.0%) | 0 (0.0%) |
| 9:00 AM to 9:59 AM | 1 (1.0%) | 7 (9.2%) |
| 10:00 AM to 10:59 AM | 0 (0.0%) | 0 (0.0%) |
| 11:00 AM to 11:59 AM | 0 (0.0%) | 0 (0.0%) |
| 12:00 PM to 3:59 PM | 3 (2.9%) | 9 (11.8%) |
| 4:00 PM to 11:59 PM | 7 (6.8%) | 0 (0.0%) |
| Total | 103 (100.0%) | 76 (100.0%) |
Housing Occupancy in Pine Forest
Occupancy by Ownership in Pine Forest
Of the total 156 dwellings in Pine Forest, owner-occupied units account for 128 (82.1%), while renter-occupied units make up 28 (17.9%).
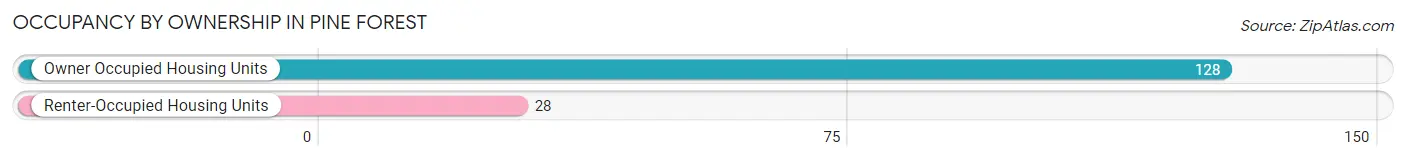
| Occupancy | # Housing Units | % Housing Units |
| Owner Occupied Housing Units | 128 | 82.1% |
| Renter-Occupied Housing Units | 28 | 17.9% |
| Total Occupied Housing Units | 156 | 100.0% |
Occupancy by Household Size in Pine Forest
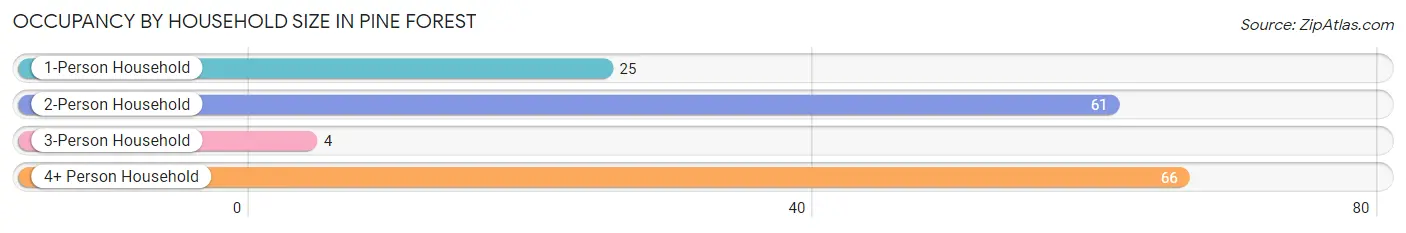
| Household Size | # Housing Units | % Housing Units |
| 1-Person Household | 25 | 16.0% |
| 2-Person Household | 61 | 39.1% |
| 3-Person Household | 4 | 2.6% |
| 4+ Person Household | 66 | 42.3% |
| Total Housing Units | 156 | 100.0% |
Occupancy by Ownership by Household Size in Pine Forest
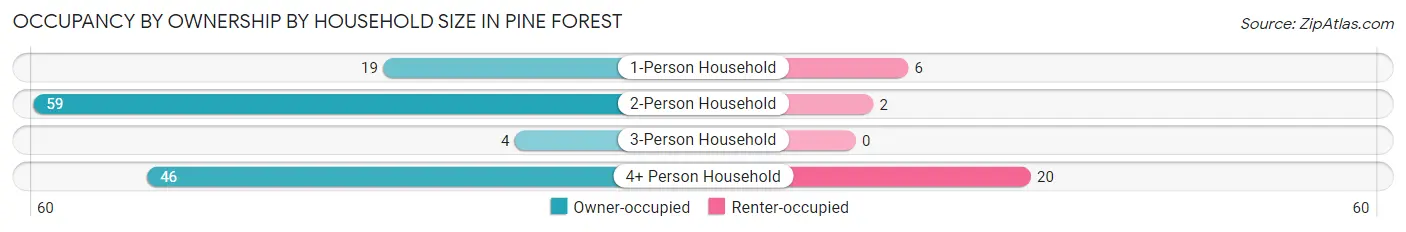
| Household Size | Owner-occupied | Renter-occupied |
| 1-Person Household | 19 (76.0%) | 6 (24.0%) |
| 2-Person Household | 59 (96.7%) | 2 (3.3%) |
| 3-Person Household | 4 (100.0%) | 0 (0.0%) |
| 4+ Person Household | 46 (69.7%) | 20 (30.3%) |
| Total Housing Units | 128 (82.1%) | 28 (17.9%) |
Occupancy by Educational Attainment in Pine Forest
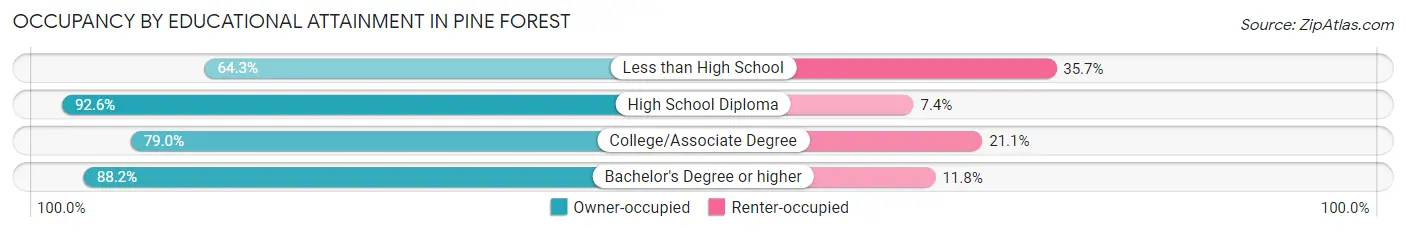
| Household Size | Owner-occupied | Renter-occupied |
| Less than High School | 18 (64.3%) | 10 (35.7%) |
| High School Diploma | 50 (92.6%) | 4 (7.4%) |
| College/Associate Degree | 45 (78.9%) | 12 (21.0%) |
| Bachelor's Degree or higher | 15 (88.2%) | 2 (11.8%) |
Occupancy by Age of Householder in Pine Forest
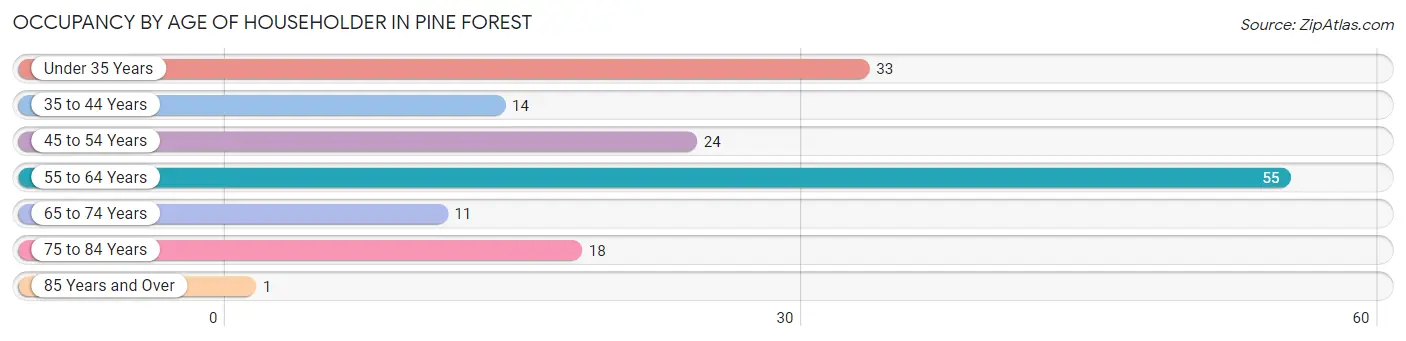
| Age Bracket | # Households | % Households |
| Under 35 Years | 33 | 21.1% |
| 35 to 44 Years | 14 | 9.0% |
| 45 to 54 Years | 24 | 15.4% |
| 55 to 64 Years | 55 | 35.3% |
| 65 to 74 Years | 11 | 7.0% |
| 75 to 84 Years | 18 | 11.5% |
| 85 Years and Over | 1 | 0.6% |
| Total | 156 | 100.0% |
Housing Finances in Pine Forest
Median Income by Occupancy in Pine Forest
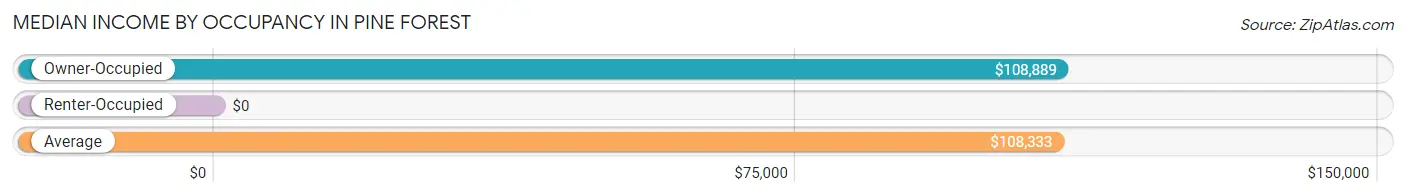
| Occupancy Type | # Households | Median Income |
| Owner-Occupied | 128 (82.1%) | $108,889 |
| Renter-Occupied | 28 (17.9%) | $0 |
| Average | 156 (100.0%) | $108,333 |
Occupancy by Householder Income Bracket in Pine Forest
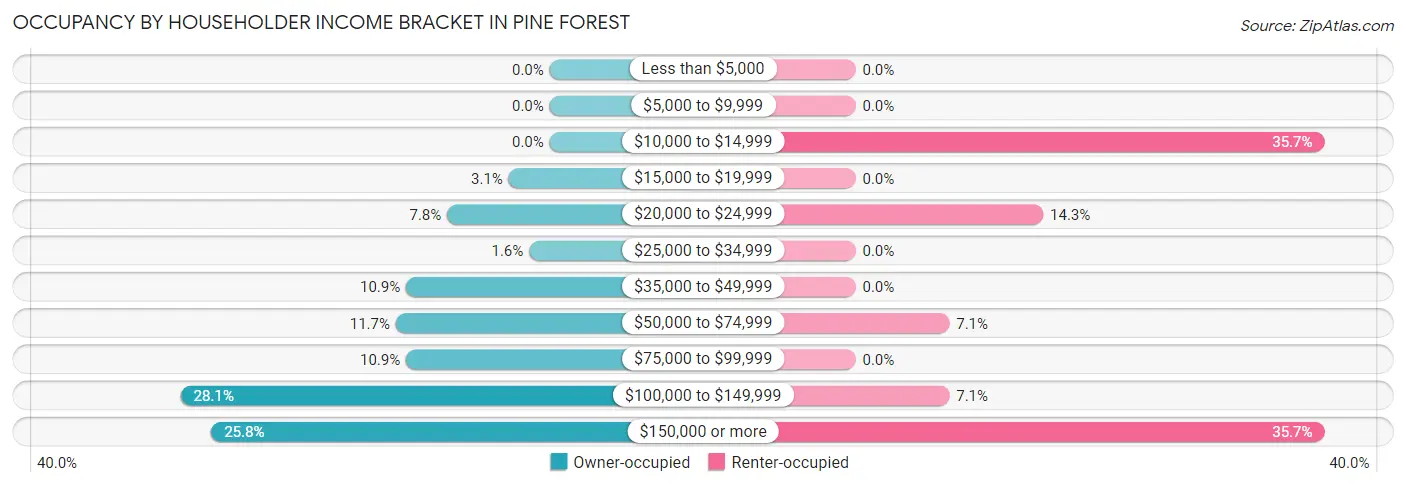
| Income Bracket | Owner-occupied | Renter-occupied |
| Less than $5,000 | 0 (0.0%) | 0 (0.0%) |
| $5,000 to $9,999 | 0 (0.0%) | 0 (0.0%) |
| $10,000 to $14,999 | 0 (0.0%) | 10 (35.7%) |
| $15,000 to $19,999 | 4 (3.1%) | 0 (0.0%) |
| $20,000 to $24,999 | 10 (7.8%) | 4 (14.3%) |
| $25,000 to $34,999 | 2 (1.6%) | 0 (0.0%) |
| $35,000 to $49,999 | 14 (10.9%) | 0 (0.0%) |
| $50,000 to $74,999 | 15 (11.7%) | 2 (7.1%) |
| $75,000 to $99,999 | 14 (10.9%) | 0 (0.0%) |
| $100,000 to $149,999 | 36 (28.1%) | 2 (7.1%) |
| $150,000 or more | 33 (25.8%) | 10 (35.7%) |
| Total | 128 (100.0%) | 28 (100.0%) |
Monthly Housing Cost Tiers in Pine Forest
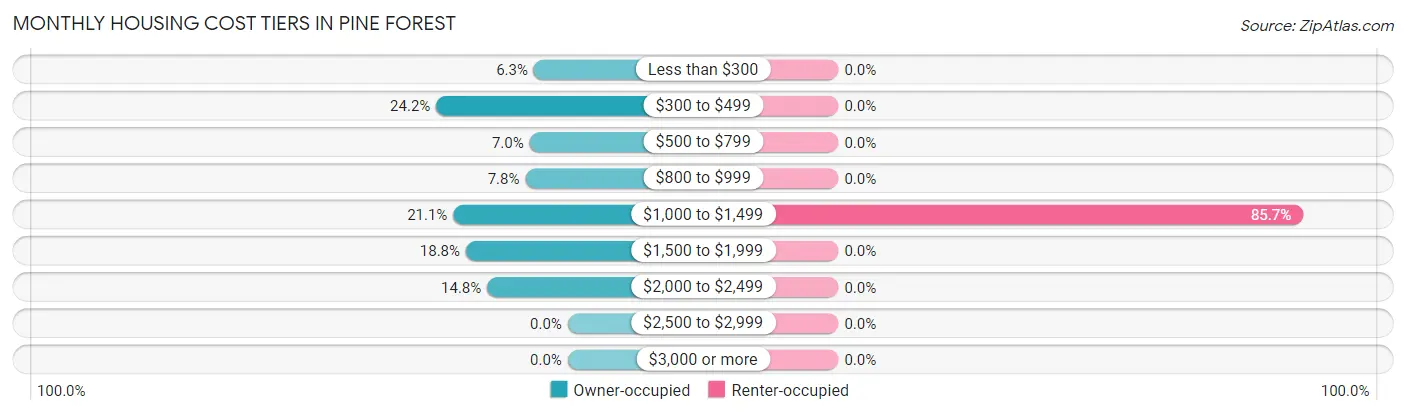
| Monthly Cost | Owner-occupied | Renter-occupied |
| Less than $300 | 8 (6.2%) | 0 (0.0%) |
| $300 to $499 | 31 (24.2%) | 0 (0.0%) |
| $500 to $799 | 9 (7.0%) | 0 (0.0%) |
| $800 to $999 | 10 (7.8%) | 0 (0.0%) |
| $1,000 to $1,499 | 27 (21.1%) | 24 (85.7%) |
| $1,500 to $1,999 | 24 (18.8%) | 0 (0.0%) |
| $2,000 to $2,499 | 19 (14.8%) | 0 (0.0%) |
| $2,500 to $2,999 | 0 (0.0%) | 0 (0.0%) |
| $3,000 or more | 0 (0.0%) | 0 (0.0%) |
| Total | 128 (100.0%) | 28 (100.0%) |
Physical Housing Characteristics in Pine Forest
Housing Structures in Pine Forest
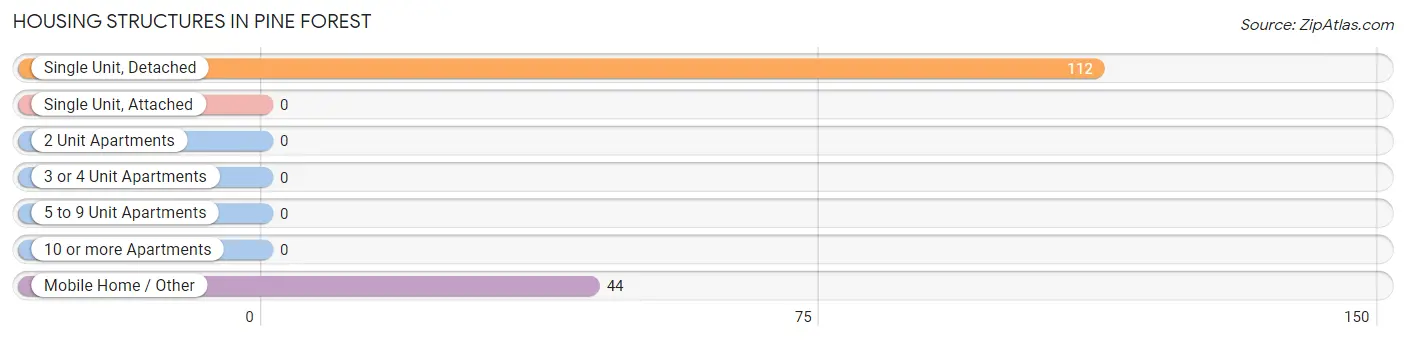
| Structure Type | # Housing Units | % Housing Units |
| Single Unit, Detached | 112 | 71.8% |
| Single Unit, Attached | 0 | 0.0% |
| 2 Unit Apartments | 0 | 0.0% |
| 3 or 4 Unit Apartments | 0 | 0.0% |
| 5 to 9 Unit Apartments | 0 | 0.0% |
| 10 or more Apartments | 0 | 0.0% |
| Mobile Home / Other | 44 | 28.2% |
| Total | 156 | 100.0% |
Housing Structures by Occupancy in Pine Forest
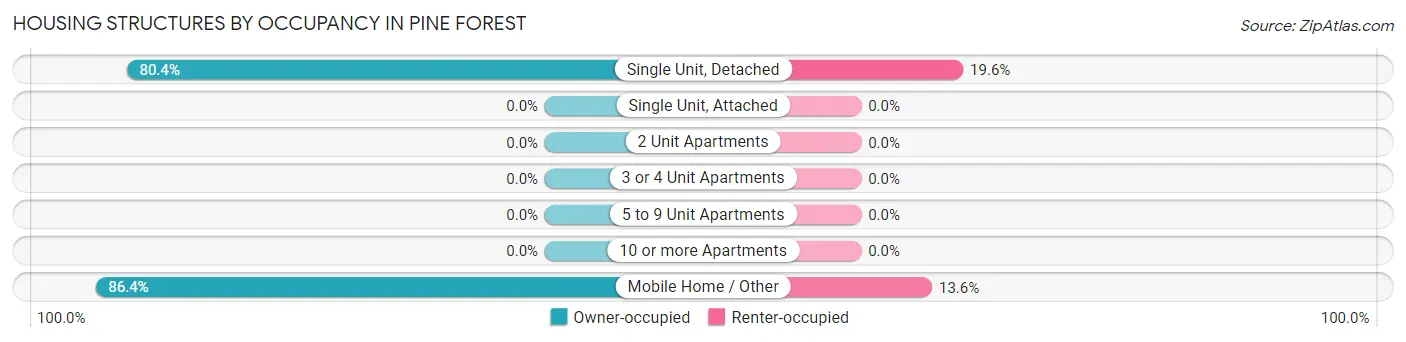
| Structure Type | Owner-occupied | Renter-occupied |
| Single Unit, Detached | 90 (80.4%) | 22 (19.6%) |
| Single Unit, Attached | 0 (0.0%) | 0 (0.0%) |
| 2 Unit Apartments | 0 (0.0%) | 0 (0.0%) |
| 3 or 4 Unit Apartments | 0 (0.0%) | 0 (0.0%) |
| 5 to 9 Unit Apartments | 0 (0.0%) | 0 (0.0%) |
| 10 or more Apartments | 0 (0.0%) | 0 (0.0%) |
| Mobile Home / Other | 38 (86.4%) | 6 (13.6%) |
| Total | 128 (82.1%) | 28 (17.9%) |
Housing Structures by Number of Rooms in Pine Forest
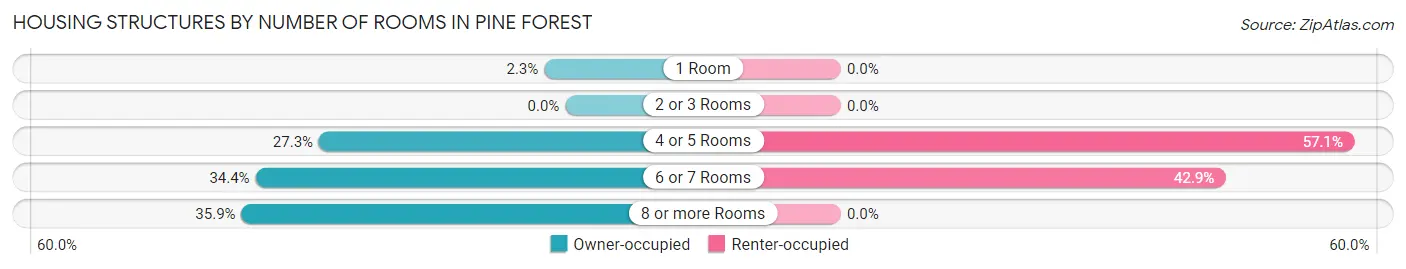
| Number of Rooms | Owner-occupied | Renter-occupied |
| 1 Room | 3 (2.3%) | 0 (0.0%) |
| 2 or 3 Rooms | 0 (0.0%) | 0 (0.0%) |
| 4 or 5 Rooms | 35 (27.3%) | 16 (57.1%) |
| 6 or 7 Rooms | 44 (34.4%) | 12 (42.9%) |
| 8 or more Rooms | 46 (35.9%) | 0 (0.0%) |
| Total | 128 (100.0%) | 28 (100.0%) |
Housing Structure by Heating Type in Pine Forest
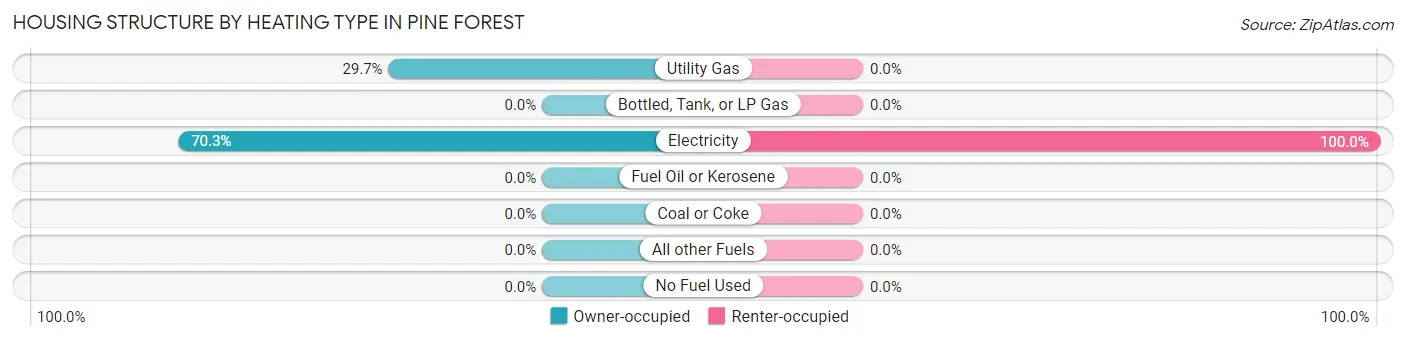
| Heating Type | Owner-occupied | Renter-occupied |
| Utility Gas | 38 (29.7%) | 0 (0.0%) |
| Bottled, Tank, or LP Gas | 0 (0.0%) | 0 (0.0%) |
| Electricity | 90 (70.3%) | 28 (100.0%) |
| Fuel Oil or Kerosene | 0 (0.0%) | 0 (0.0%) |
| Coal or Coke | 0 (0.0%) | 0 (0.0%) |
| All other Fuels | 0 (0.0%) | 0 (0.0%) |
| No Fuel Used | 0 (0.0%) | 0 (0.0%) |
| Total | 128 (100.0%) | 28 (100.0%) |
Household Vehicle Usage in Pine Forest
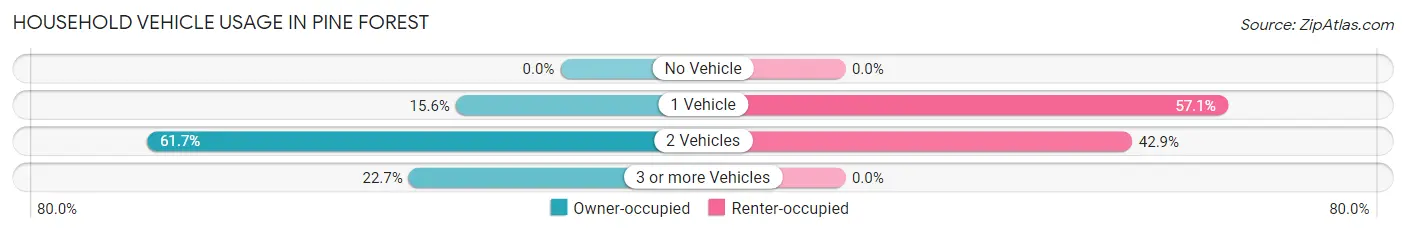
| Vehicles per Household | Owner-occupied | Renter-occupied |
| No Vehicle | 0 (0.0%) | 0 (0.0%) |
| 1 Vehicle | 20 (15.6%) | 16 (57.1%) |
| 2 Vehicles | 79 (61.7%) | 12 (42.9%) |
| 3 or more Vehicles | 29 (22.7%) | 0 (0.0%) |
| Total | 128 (100.0%) | 28 (100.0%) |
Real Estate & Mortgages in Pine Forest
Real Estate and Mortgage Overview in Pine Forest
| Characteristic | Without Mortgage | With Mortgage |
| Housing Units | 59 | 69 |
| Median Property Value | $120,300 | $135,400 |
| Median Household Income | $92,813 | $15 |
| Monthly Housing Costs | $437 | $0 |
| Real Estate Taxes | $880 | $0 |
Property Value by Mortgage Status in Pine Forest
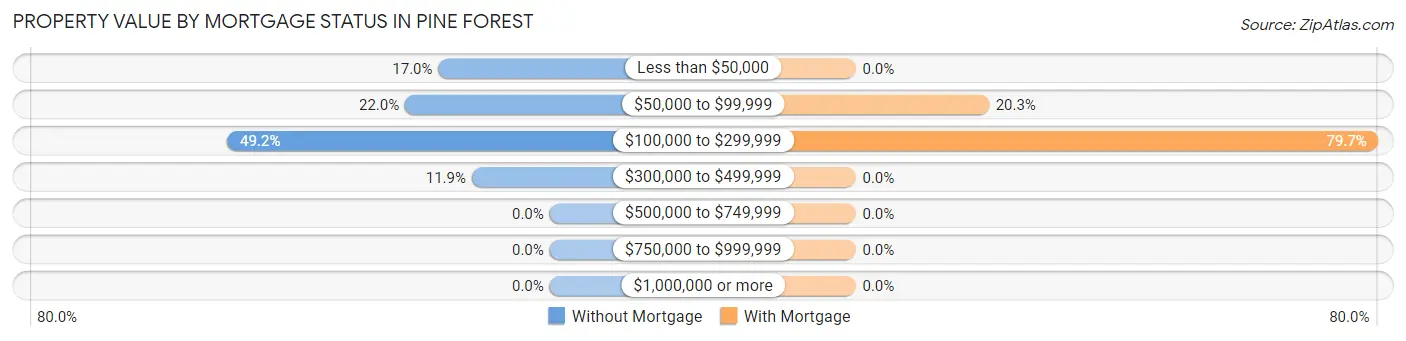
| Property Value | Without Mortgage | With Mortgage |
| Less than $50,000 | 10 (17.0%) | 0 (0.0%) |
| $50,000 to $99,999 | 13 (22.0%) | 14 (20.3%) |
| $100,000 to $299,999 | 29 (49.1%) | 55 (79.7%) |
| $300,000 to $499,999 | 7 (11.9%) | 0 (0.0%) |
| $500,000 to $749,999 | 0 (0.0%) | 0 (0.0%) |
| $750,000 to $999,999 | 0 (0.0%) | 0 (0.0%) |
| $1,000,000 or more | 0 (0.0%) | 0 (0.0%) |
| Total | 59 (100.0%) | 69 (100.0%) |
Household Income by Mortgage Status in Pine Forest
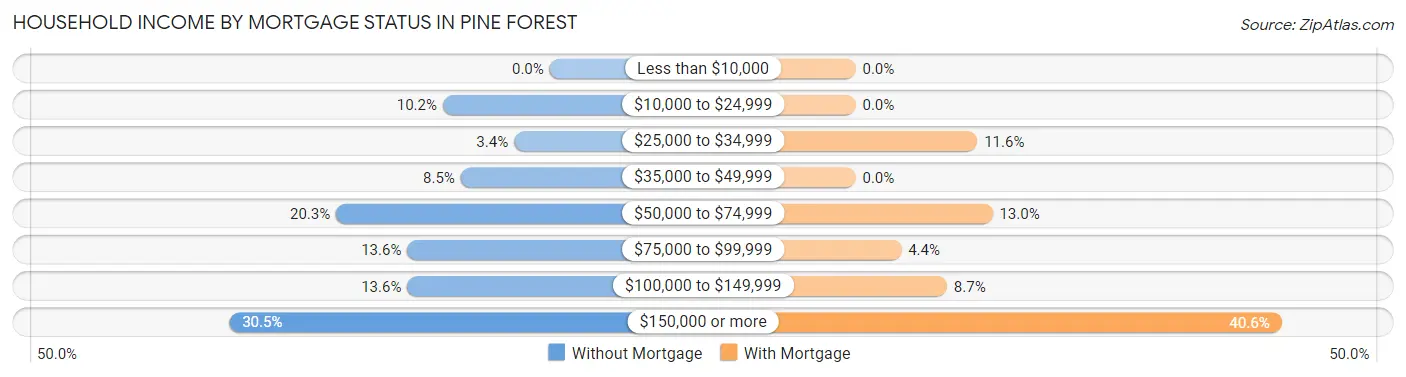
| Household Income | Without Mortgage | With Mortgage |
| Less than $10,000 | 0 (0.0%) | 0 (0.0%) |
| $10,000 to $24,999 | 6 (10.2%) | 0 (0.0%) |
| $25,000 to $34,999 | 2 (3.4%) | 8 (11.6%) |
| $35,000 to $49,999 | 5 (8.5%) | 0 (0.0%) |
| $50,000 to $74,999 | 12 (20.3%) | 9 (13.0%) |
| $75,000 to $99,999 | 8 (13.6%) | 3 (4.3%) |
| $100,000 to $149,999 | 8 (13.6%) | 6 (8.7%) |
| $150,000 or more | 18 (30.5%) | 28 (40.6%) |
| Total | 59 (100.0%) | 69 (100.0%) |
Property Value to Household Income Ratio in Pine Forest
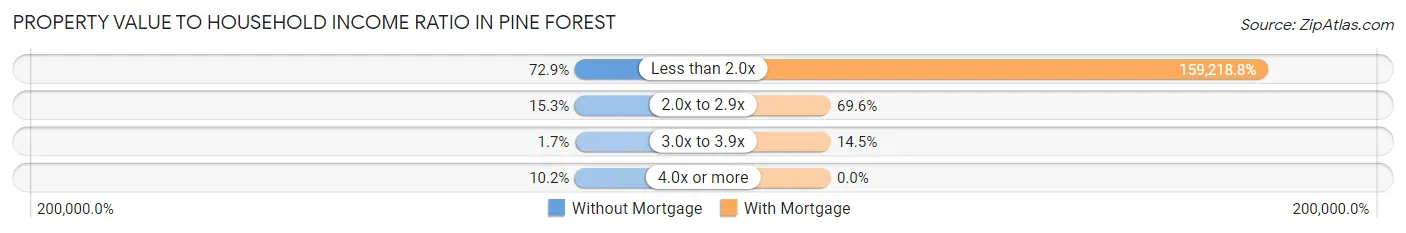
| Value-to-Income Ratio | Without Mortgage | With Mortgage |
| Less than 2.0x | 43 (72.9%) | 109,861 (159,218.8%) |
| 2.0x to 2.9x | 9 (15.2%) | 48 (69.6%) |
| 3.0x to 3.9x | 1 (1.7%) | 10 (14.5%) |
| 4.0x or more | 6 (10.2%) | 0 (0.0%) |
| Total | 59 (100.0%) | 69 (100.0%) |
Real Estate Taxes by Mortgage Status in Pine Forest
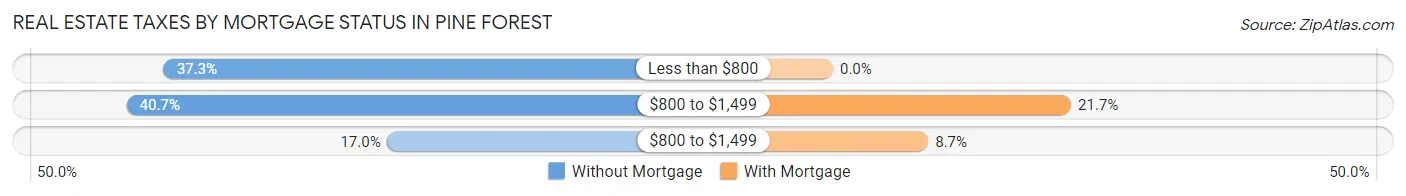
| Property Taxes | Without Mortgage | With Mortgage |
| Less than $800 | 22 (37.3%) | 0 (0.0%) |
| $800 to $1,499 | 24 (40.7%) | 15 (21.7%) |
| $800 to $1,499 | 10 (17.0%) | 6 (8.7%) |
| Total | 59 (100.0%) | 69 (100.0%) |
Health & Disability in Pine Forest
Health Insurance Coverage by Age in Pine Forest
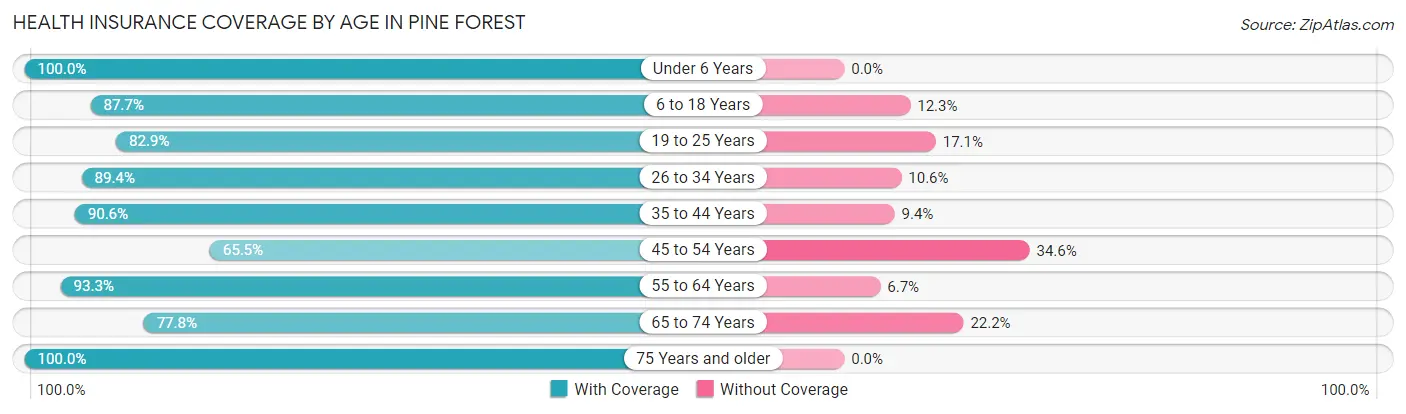
| Age Bracket | With Coverage | Without Coverage |
| Under 6 Years | 19 (100.0%) | 0 (0.0%) |
| 6 to 18 Years | 107 (87.7%) | 15 (12.3%) |
| 19 to 25 Years | 34 (82.9%) | 7 (17.1%) |
| 26 to 34 Years | 42 (89.4%) | 5 (10.6%) |
| 35 to 44 Years | 29 (90.6%) | 3 (9.4%) |
| 45 to 54 Years | 36 (65.4%) | 19 (34.5%) |
| 55 to 64 Years | 97 (93.3%) | 7 (6.7%) |
| 65 to 74 Years | 14 (77.8%) | 4 (22.2%) |
| 75 Years and older | 29 (100.0%) | 0 (0.0%) |
| Total | 407 (87.2%) | 60 (12.9%) |
Health Insurance Coverage by Citizenship Status in Pine Forest
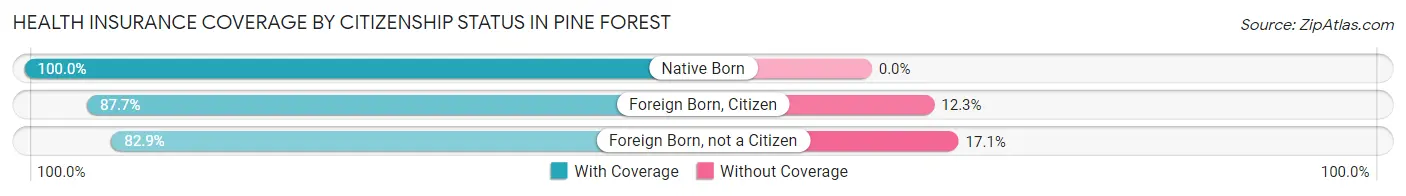
| Citizenship Status | With Coverage | Without Coverage |
| Native Born | 19 (100.0%) | 0 (0.0%) |
| Foreign Born, Citizen | 107 (87.7%) | 15 (12.3%) |
| Foreign Born, not a Citizen | 34 (82.9%) | 7 (17.1%) |
Health Insurance Coverage by Household Income in Pine Forest
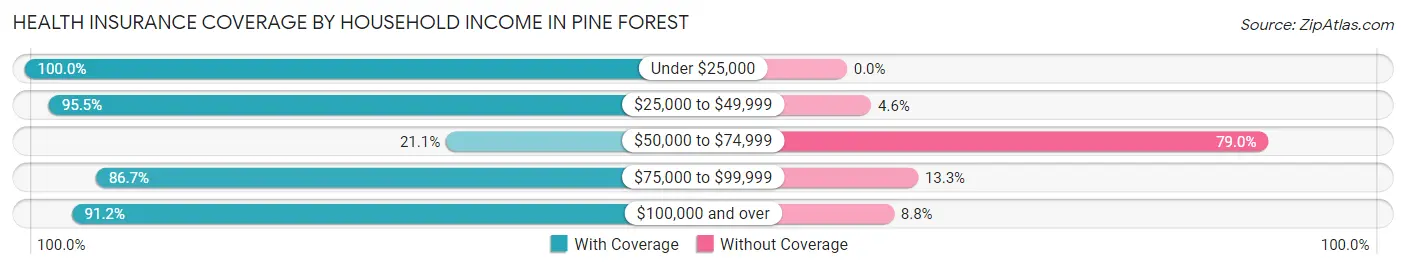
| Household Income | With Coverage | Without Coverage |
| Under $25,000 | 72 (100.0%) | 0 (0.0%) |
| $25,000 to $49,999 | 63 (95.5%) | 3 (4.5%) |
| $50,000 to $74,999 | 8 (21.0%) | 30 (78.9%) |
| $75,000 to $99,999 | 26 (86.7%) | 4 (13.3%) |
| $100,000 and over | 238 (91.2%) | 23 (8.8%) |
Public vs Private Health Insurance Coverage by Age in Pine Forest
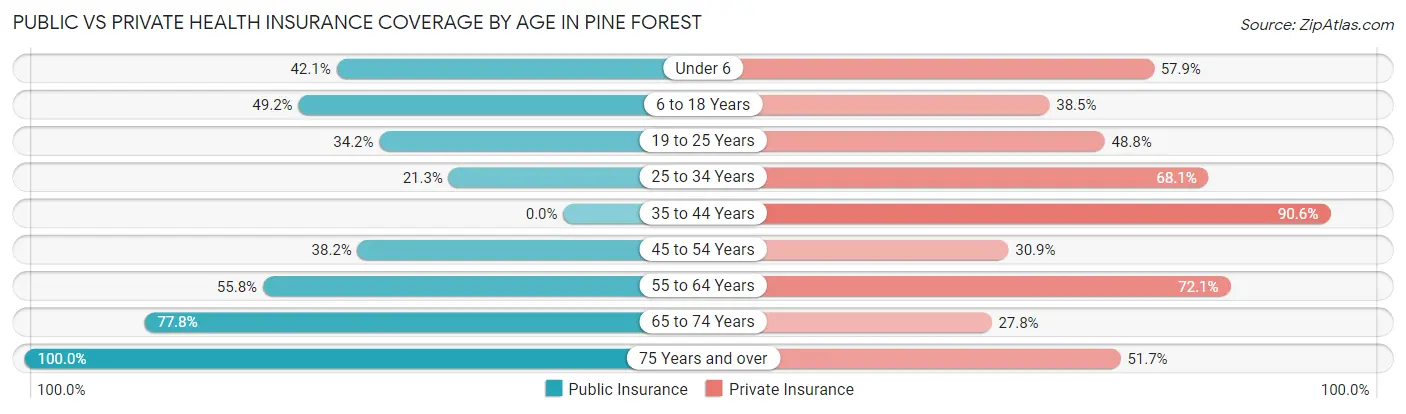
| Age Bracket | Public Insurance | Private Insurance |
| Under 6 | 8 (42.1%) | 11 (57.9%) |
| 6 to 18 Years | 60 (49.2%) | 47 (38.5%) |
| 19 to 25 Years | 14 (34.2%) | 20 (48.8%) |
| 25 to 34 Years | 10 (21.3%) | 32 (68.1%) |
| 35 to 44 Years | 0 (0.0%) | 29 (90.6%) |
| 45 to 54 Years | 21 (38.2%) | 17 (30.9%) |
| 55 to 64 Years | 58 (55.8%) | 75 (72.1%) |
| 65 to 74 Years | 14 (77.8%) | 5 (27.8%) |
| 75 Years and over | 29 (100.0%) | 15 (51.7%) |
| Total | 214 (45.8%) | 251 (53.7%) |
Disability Status by Sex by Age in Pine Forest
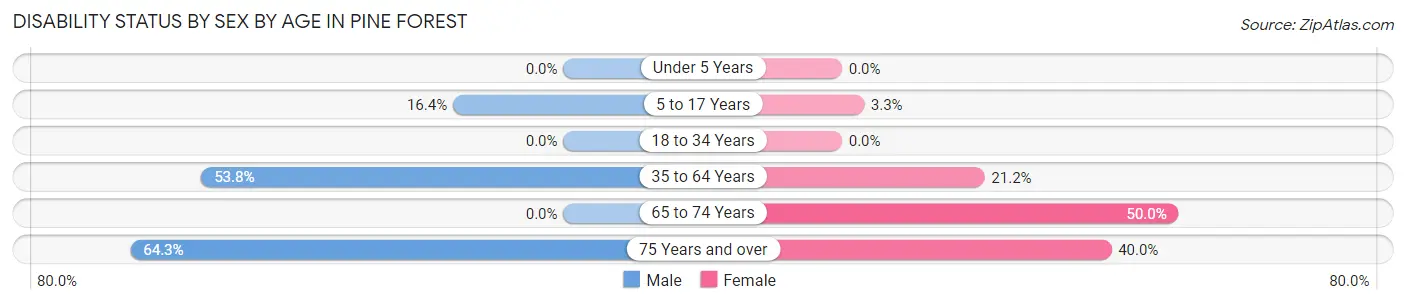
| Age Bracket | Male | Female |
| Under 5 Years | 0 (0.0%) | 0 (0.0%) |
| 5 to 17 Years | 10 (16.4%) | 2 (3.3%) |
| 18 to 34 Years | 0 (0.0%) | 0 (0.0%) |
| 35 to 64 Years | 57 (53.8%) | 18 (21.2%) |
| 65 to 74 Years | 0 (0.0%) | 7 (50.0%) |
| 75 Years and over | 9 (64.3%) | 6 (40.0%) |
Disability Class by Sex by Age in Pine Forest
Disability Class: Hearing Difficulty
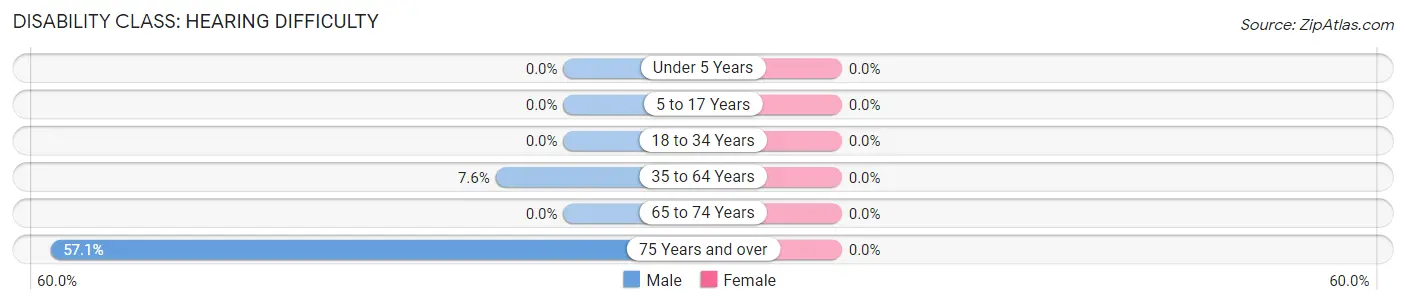
| Age Bracket | Male | Female |
| Under 5 Years | 0 (0.0%) | 0 (0.0%) |
| 5 to 17 Years | 0 (0.0%) | 0 (0.0%) |
| 18 to 34 Years | 0 (0.0%) | 0 (0.0%) |
| 35 to 64 Years | 8 (7.5%) | 0 (0.0%) |
| 65 to 74 Years | 0 (0.0%) | 0 (0.0%) |
| 75 Years and over | 8 (57.1%) | 0 (0.0%) |
Disability Class: Vision Difficulty
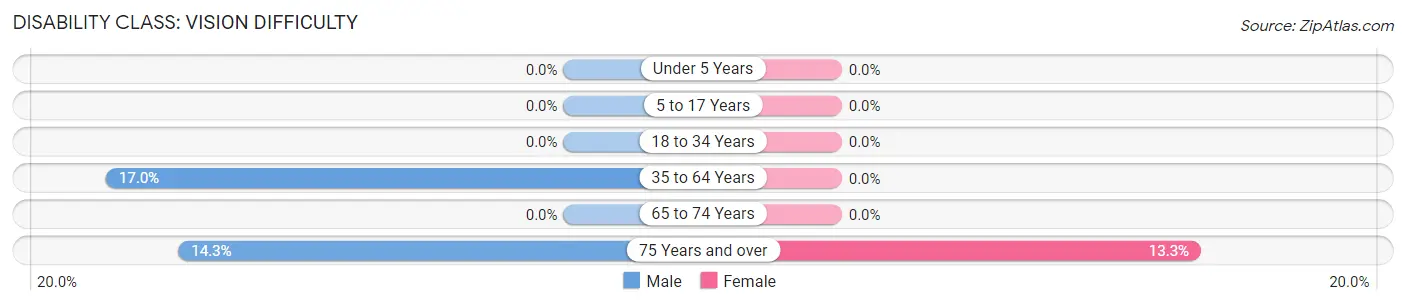
| Age Bracket | Male | Female |
| Under 5 Years | 0 (0.0%) | 0 (0.0%) |
| 5 to 17 Years | 0 (0.0%) | 0 (0.0%) |
| 18 to 34 Years | 0 (0.0%) | 0 (0.0%) |
| 35 to 64 Years | 18 (17.0%) | 0 (0.0%) |
| 65 to 74 Years | 0 (0.0%) | 0 (0.0%) |
| 75 Years and over | 2 (14.3%) | 2 (13.3%) |
Disability Class: Cognitive Difficulty
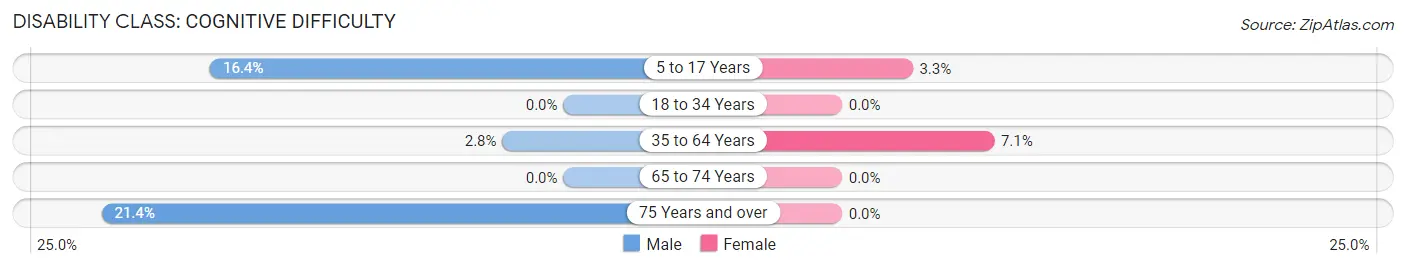
| Age Bracket | Male | Female |
| 5 to 17 Years | 10 (16.4%) | 2 (3.3%) |
| 18 to 34 Years | 0 (0.0%) | 0 (0.0%) |
| 35 to 64 Years | 3 (2.8%) | 6 (7.1%) |
| 65 to 74 Years | 0 (0.0%) | 0 (0.0%) |
| 75 Years and over | 3 (21.4%) | 0 (0.0%) |
Disability Class: Ambulatory Difficulty
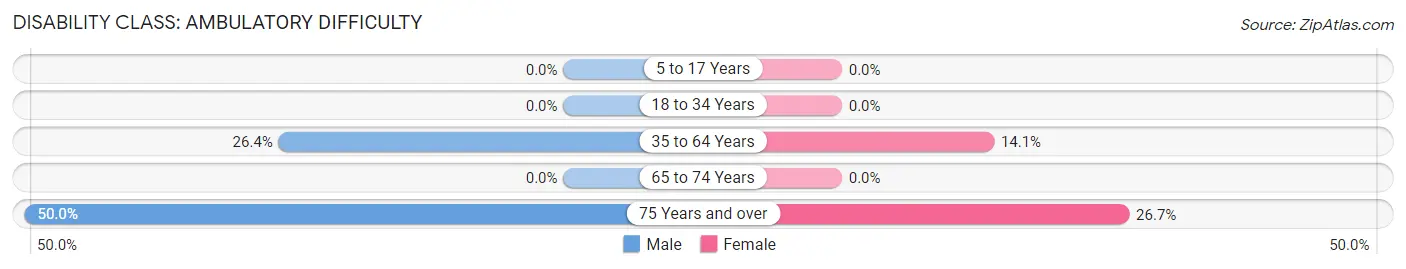
| Age Bracket | Male | Female |
| 5 to 17 Years | 0 (0.0%) | 0 (0.0%) |
| 18 to 34 Years | 0 (0.0%) | 0 (0.0%) |
| 35 to 64 Years | 28 (26.4%) | 12 (14.1%) |
| 65 to 74 Years | 0 (0.0%) | 0 (0.0%) |
| 75 Years and over | 7 (50.0%) | 4 (26.7%) |
Disability Class: Self-Care Difficulty
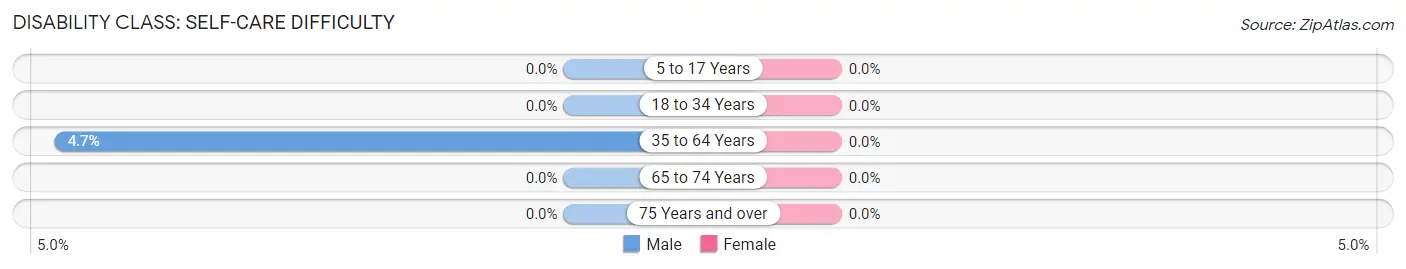
| Age Bracket | Male | Female |
| 5 to 17 Years | 0 (0.0%) | 0 (0.0%) |
| 18 to 34 Years | 0 (0.0%) | 0 (0.0%) |
| 35 to 64 Years | 5 (4.7%) | 0 (0.0%) |
| 65 to 74 Years | 0 (0.0%) | 0 (0.0%) |
| 75 Years and over | 0 (0.0%) | 0 (0.0%) |
Technology Access in Pine Forest
Computing Device Access in Pine Forest
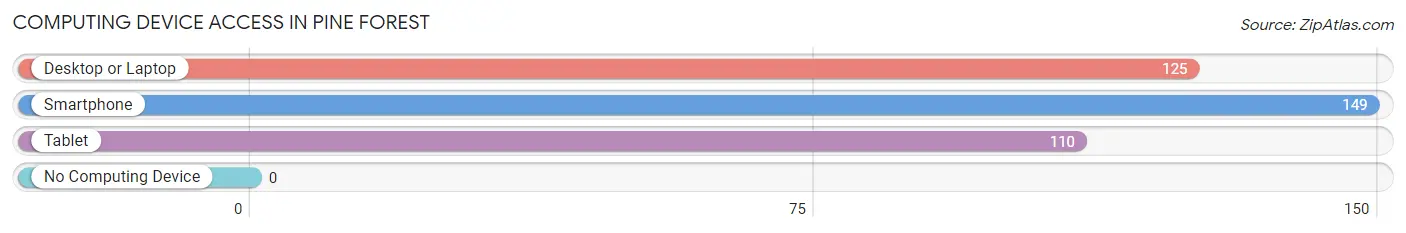
| Device Type | # Households | % Households |
| Desktop or Laptop | 125 | 80.1% |
| Smartphone | 149 | 95.5% |
| Tablet | 110 | 70.5% |
| No Computing Device | 0 | 0.0% |
| Total | 156 | 100.0% |
Internet Access in Pine Forest
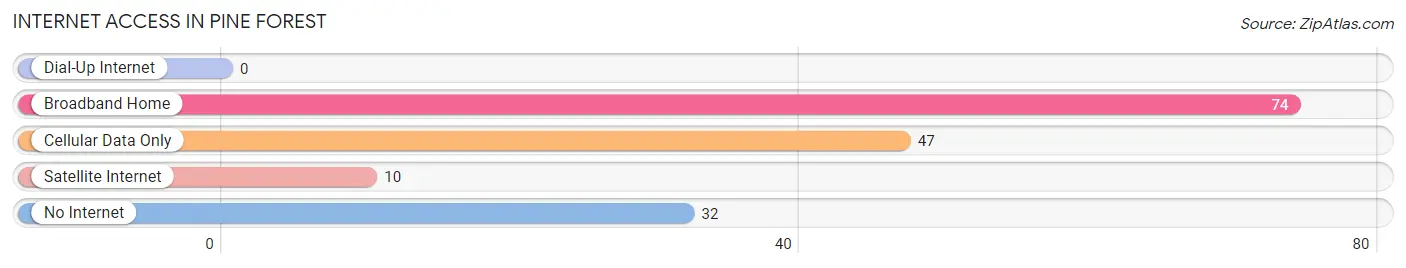
| Internet Type | # Households | % Households |
| Dial-Up Internet | 0 | 0.0% |
| Broadband Home | 74 | 47.4% |
| Cellular Data Only | 47 | 30.1% |
| Satellite Internet | 10 | 6.4% |
| No Internet | 32 | 20.5% |
| Total | 156 | 100.0% |
Pine Forest Summary
Pine Forest, Texas is a small town located in the southeastern corner of Texas, in the county of Trinity. It is situated on the banks of the Trinity River, and is surrounded by rolling hills and lush pine forests. The town has a population of just over 1,000 people, and is known for its rural charm and friendly atmosphere.
History
Pine Forest was first settled in the late 1800s by a group of settlers from the nearby town of Trinity. The settlers were looking for a place to call home, and the area around Pine Forest seemed to fit the bill. The town was officially established in 1891, and was named after the abundance of pine trees in the area.
The town quickly grew, and by the early 1900s, it had become a bustling center of commerce and industry. The town was home to several sawmills, a cotton gin, and a number of other businesses. The town also had a school, a post office, and a number of churches.
In the mid-1900s, the town began to decline as the local economy shifted away from the lumber and cotton industries. The town’s population began to dwindle, and by the 1970s, the town was nearly abandoned. In the 1980s, the town began to experience a resurgence, as new businesses and residents moved in. Today, Pine Forest is a thriving small town, with a population of just over 1,000 people.
Geography
Pine Forest is located in the southeastern corner of Texas, in the county of Trinity. It is situated on the banks of the Trinity River, and is surrounded by rolling hills and lush pine forests. The town is located about 50 miles east of Houston, and about 100 miles north of Beaumont.
The town is located in a humid subtropical climate zone, and experiences hot, humid summers and mild winters. The average annual temperature is around 70 degrees Fahrenheit, and the average annual precipitation is around 40 inches.
Economy
The economy of Pine Forest is largely based on agriculture and tourism. The town is home to several farms, which produce a variety of crops, including cotton, corn, soybeans, and hay. The town is also home to several tourist attractions, including the Pine Forest Museum, the Pine Forest Country Club, and the Pine Forest Golf Course.
The town is also home to several small businesses, including restaurants, shops, and other services. The town is served by the Trinity County Airport, which provides air service to the surrounding area.
Demographics
As of the 2010 census, the population of Pine Forest was 1,072. The racial makeup of the town was 94.3% White, 0.7% African American, 0.3% Native American, 0.2% Asian, 0.1% Pacific Islander, 2.7% from other races, and 1.7% from two or more races. Hispanic or Latino of any race were 5.2% of the population.
The median income for a household in the town was $31,250, and the median income for a family was $37,500. The per capita income for the town was $15,945. About 16.2% of families and 19.2% of the population were below the poverty line, including 25.2% of those under age 18 and 10.2% of those age 65 or over.
Common Questions
What is the Total Population of Pine Forest?
Total Population of Pine Forest is 467.
What is the Total Male Population of Pine Forest?
Total Male Population of Pine Forest is 231.
What is the Total Female Population of Pine Forest?
Total Female Population of Pine Forest is 236.
What is the Ratio of Males per 100 Females in Pine Forest?
There are 97.88 Males per 100 Females in Pine Forest.
What is the Ratio of Females per 100 Males in Pine Forest?
There are 102.16 Females per 100 Males in Pine Forest.
What is the Median Population Age in Pine Forest?
Median Population Age in Pine Forest is 37.4 Years.
What is the Average Family Size in Pine Forest
Average Family Size in Pine Forest is 3.3 People.
What is the Average Household Size in Pine Forest
Average Household Size in Pine Forest is 3.0 People.
What is Per Capita Income in Pine Forest?
Per Capita income in Pine Forest is $37,087.
What is the Median Family Income in Pine Forest?
Median Family Income in Pine Forest is $115,417.
What is the Median Household income in Pine Forest?
Median Household Income in Pine Forest is $108,333.
What is Income or Wage Gap in Pine Forest?
Income or Wage Gap in Pine Forest is 20.0%.
Women in Pine Forest earn 80.0 cents for every dollar earned by a man.
What is Inequality or Gini Index in Pine Forest?
Inequality or Gini Index in Pine Forest is 0.40.
How Large is the Labor Force in Pine Forest?
There are 185 People in the Labor Forcein in Pine Forest.
What is the Percentage of People in the Labor Force in Pine Forest?
51.5% of People are in the Labor Force in Pine Forest.
What is the Unemployment Rate in Pine Forest?
Unemployment Rate in Pine Forest is 2.7%.