Midway South, TX
Midway South Map
Midway South Overview
2,419
TOTAL POPULATION
1,110
MALE POPULATION
1,309
FEMALE POPULATION
84.80
MALES / 100 FEMALES
117.93
FEMALES / 100 MALES
28.0
MEDIAN AGE
3.8
AVG FAMILY SIZE
3.8
AVG HOUSEHOLD SIZE
$21,457
PER CAPITA INCOME
$62,045
AVG FAMILY INCOME
$85,326
AVG HOUSEHOLD INCOME
47.6%
WAGE / INCOME GAP [ % ]
52.4¢/ $1
WAGE / INCOME GAP [ $ ]
$10,748
FAMILY INCOME DEFICIT
0.36
INEQUALITY / GINI INDEX
1,133
LABOR FORCE [ PEOPLE ]
63.6%
PERCENT IN LABOR FORCE
6.4%
UNEMPLOYMENT RATE
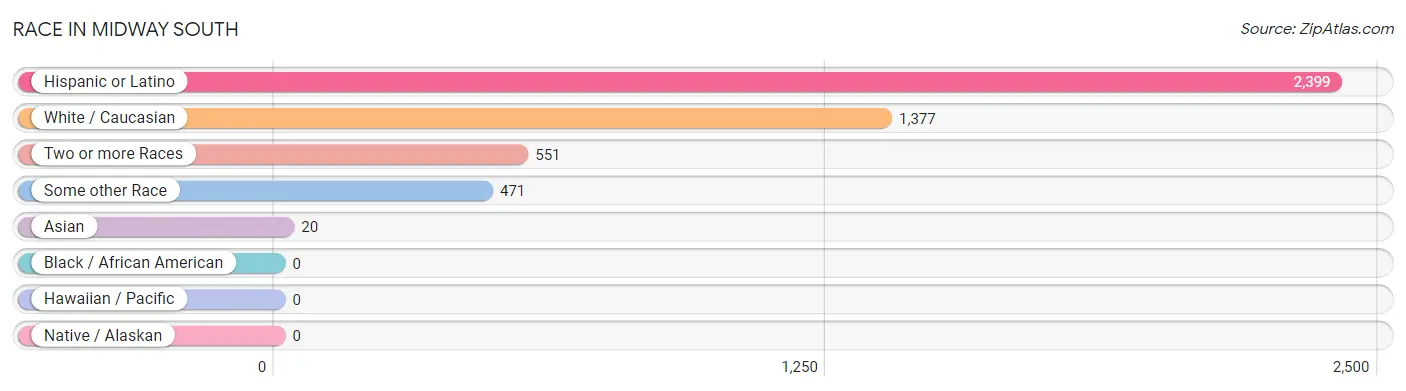
Race in Midway South
The most populous races in Midway South are Hispanic or Latino (2,399 | 99.2%), White / Caucasian (1,377 | 56.9%), and Two or more Races (551 | 22.8%).
| Race | # Population | % Population |
| Asian | 20 | 0.8% |
| Black / African American | 0 | 0.0% |
| Hawaiian / Pacific | 0 | 0.0% |
| Hispanic or Latino | 2,399 | 99.2% |
| Native / Alaskan | 0 | 0.0% |
| White / Caucasian | 1,377 | 56.9% |
| Two or more Races | 551 | 22.8% |
| Some other Race | 471 | 19.5% |
| Total | 2,419 | 100.0% |
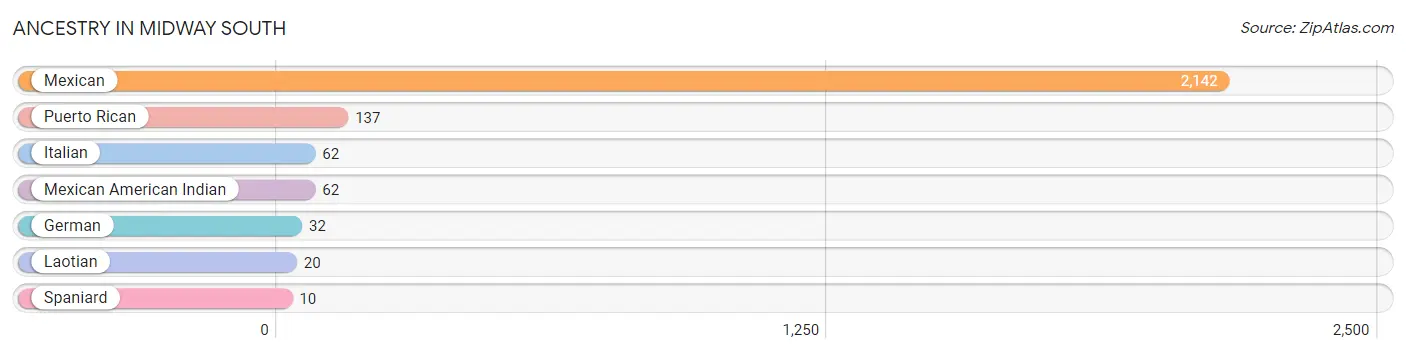
Ancestry in Midway South
The most populous ancestries reported in Midway South are Mexican (2,142 | 88.5%), Puerto Rican (137 | 5.7%), Italian (62 | 2.6%), Mexican American Indian (62 | 2.6%), and German (32 | 1.3%), together accounting for 100.6% of all Midway South residents.
| Ancestry | # Population | % Population |
| German | 32 | 1.3% |
| Italian | 62 | 2.6% |
| Laotian | 20 | 0.8% |
| Mexican | 2,142 | 88.5% |
| Mexican American Indian | 62 | 2.6% |
| Puerto Rican | 137 | 5.7% |
| Spaniard | 10 | 0.4% | View All 7 Rows |
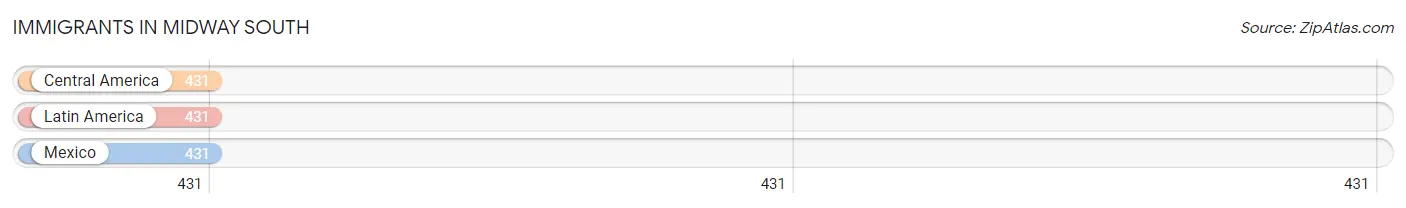
Immigrants in Midway South
The most numerous immigrant groups reported in Midway South came from Central America (431 | 17.8%), Latin America (431 | 17.8%), and Mexico (431 | 17.8%), together accounting for 53.5% of all Midway South residents.
| Immigration Origin | # Population | % Population |
| Central America | 431 | 17.8% |
| Latin America | 431 | 17.8% |
| Mexico | 431 | 17.8% | View All 3 Rows |
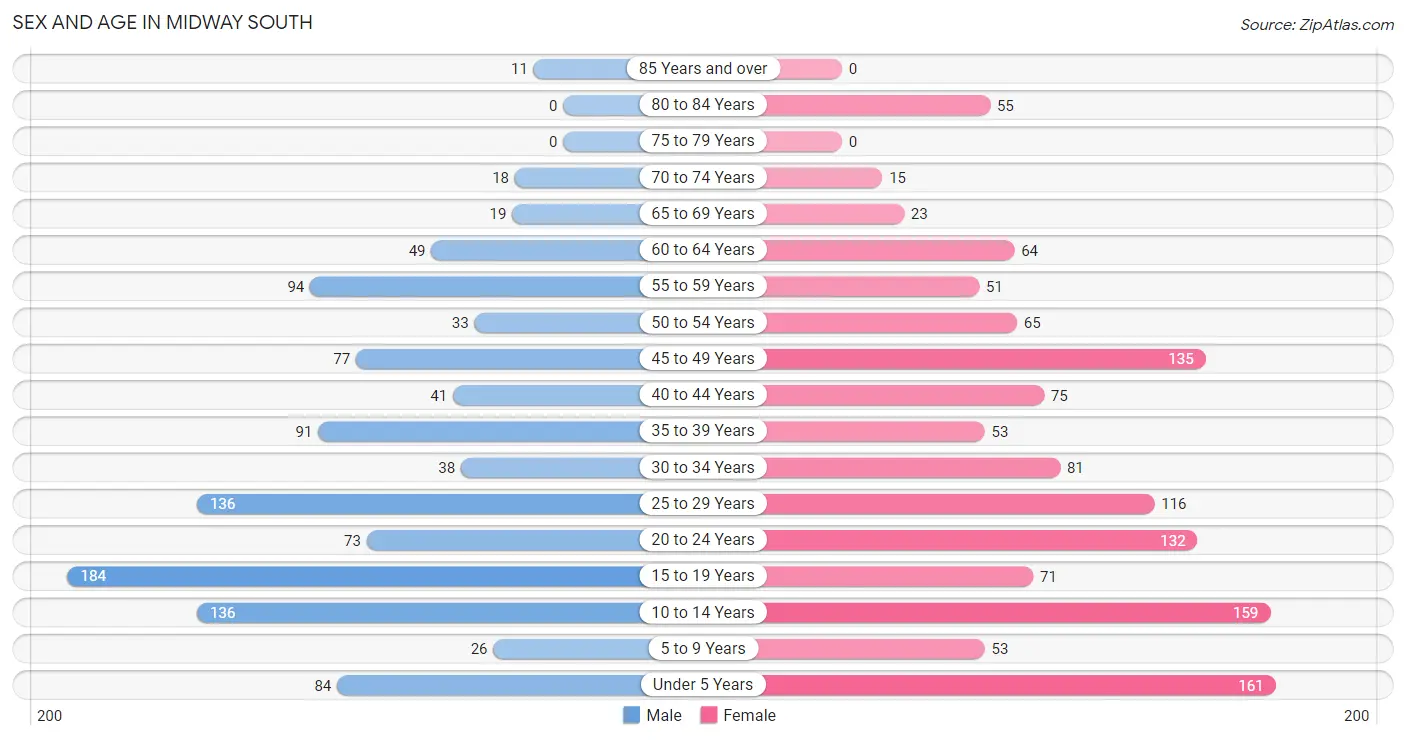
Sex and Age in Midway South
Sex and Age in Midway South
The most populous age groups in Midway South are 15 to 19 Years (184 | 16.6%) for men and Under 5 Years (161 | 12.3%) for women.
| Age Bracket | Male | Female |
| Under 5 Years | 84 (7.6%) | 161 (12.3%) |
| 5 to 9 Years | 26 (2.3%) | 53 (4.1%) |
| 10 to 14 Years | 136 (12.2%) | 159 (12.1%) |
| 15 to 19 Years | 184 (16.6%) | 71 (5.4%) |
| 20 to 24 Years | 73 (6.6%) | 132 (10.1%) |
| 25 to 29 Years | 136 (12.2%) | 116 (8.9%) |
| 30 to 34 Years | 38 (3.4%) | 81 (6.2%) |
| 35 to 39 Years | 91 (8.2%) | 53 (4.1%) |
| 40 to 44 Years | 41 (3.7%) | 75 (5.7%) |
| 45 to 49 Years | 77 (6.9%) | 135 (10.3%) |
| 50 to 54 Years | 33 (3.0%) | 65 (5.0%) |
| 55 to 59 Years | 94 (8.5%) | 51 (3.9%) |
| 60 to 64 Years | 49 (4.4%) | 64 (4.9%) |
| 65 to 69 Years | 19 (1.7%) | 23 (1.8%) |
| 70 to 74 Years | 18 (1.6%) | 15 (1.1%) |
| 75 to 79 Years | 0 (0.0%) | 0 (0.0%) |
| 80 to 84 Years | 0 (0.0%) | 55 (4.2%) |
| 85 Years and over | 11 (1.0%) | 0 (0.0%) |
| Total | 1,110 (100.0%) | 1,309 (100.0%) |
Families and Households in Midway South
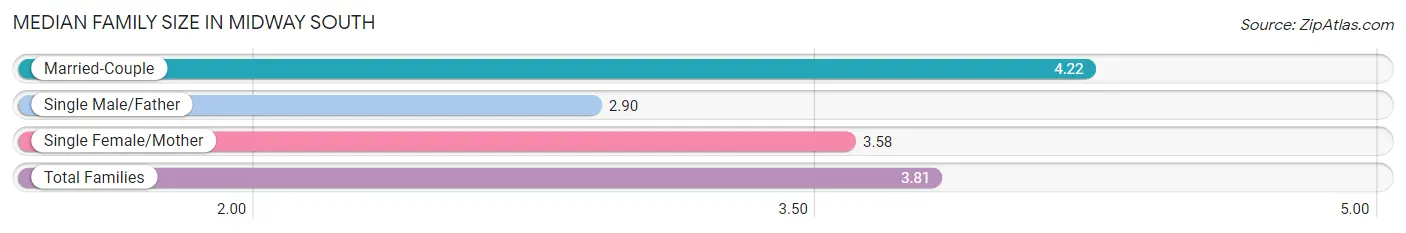
Median Family Size in Midway South
The median family size in Midway South is 3.81 persons per family, with married-couple families (321 | 53.7%) accounting for the largest median family size of 4.22 persons per family. On the other hand, single male/father families (97 | 16.2%) represent the smallest median family size with 2.90 persons per family.
| Family Type | # Families | Family Size |
| Married-Couple | 321 (53.7%) | 4.22 |
| Single Male/Father | 97 (16.2%) | 2.90 |
| Single Female/Mother | 180 (30.1%) | 3.58 |
| Total Families | 598 (100.0%) | 3.81 |
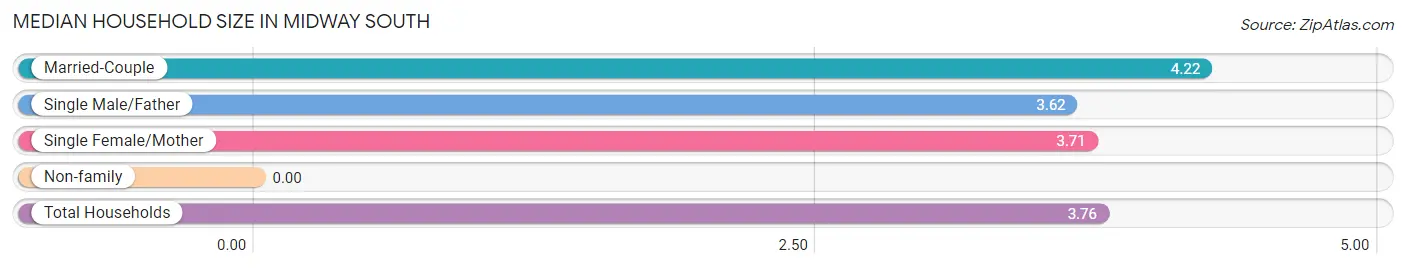
Median Household Size in Midway South
| Household Type | # Households | Household Size |
| Married-Couple | 321 (49.8%) | 4.22 |
| Single Male/Father | 97 (15.1%) | 3.62 |
| Single Female/Mother | 180 (28.0%) | 3.71 |
| Non-family | 46 (7.1%) | - |
| Total Households | 644 (100.0%) | 3.76 |
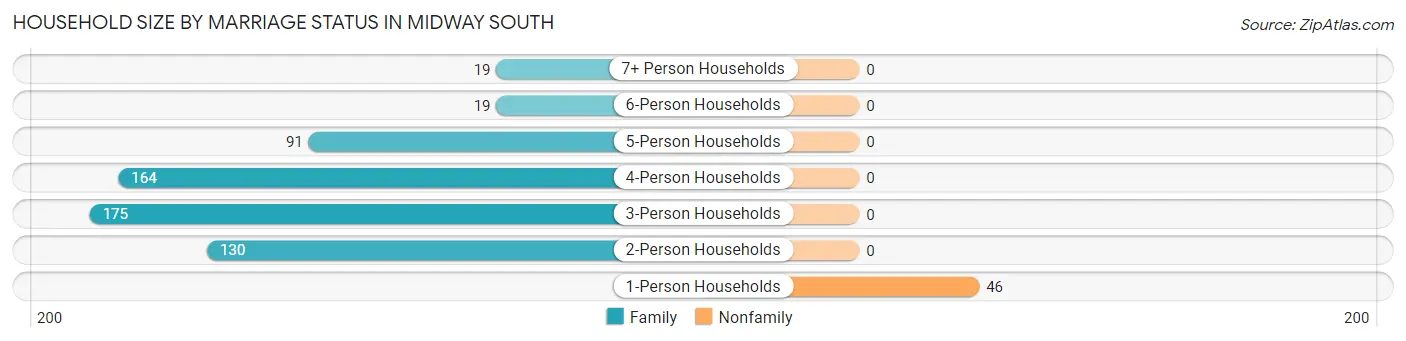
Household Size by Marriage Status in Midway South
Out of a total of 644 households in Midway South, 598 (92.9%) are family households, while 46 (7.1%) are nonfamily households. The most numerous type of family households are 3-person households, comprising 175, and the most common type of nonfamily households are 1-person households, comprising 46.
| Household Size | Family Households | Nonfamily Households |
| 1-Person Households | - | 46 (7.1%) |
| 2-Person Households | 130 (20.2%) | 0 (0.0%) |
| 3-Person Households | 175 (27.2%) | 0 (0.0%) |
| 4-Person Households | 164 (25.5%) | 0 (0.0%) |
| 5-Person Households | 91 (14.1%) | 0 (0.0%) |
| 6-Person Households | 19 (2.9%) | 0 (0.0%) |
| 7+ Person Households | 19 (2.9%) | 0 (0.0%) |
| Total | 598 (92.9%) | 46 (7.1%) |
Female Fertility in Midway South
Fertility by Age in Midway South
Average fertility rate in Midway South is 113.0 births per 1,000 women. Women in the age bracket of 20 to 34 years have the highest fertility rate with 176.0 births per 1,000 women. Women in the age bracket of 20 to 34 years acount for 76.3% of all women with births.
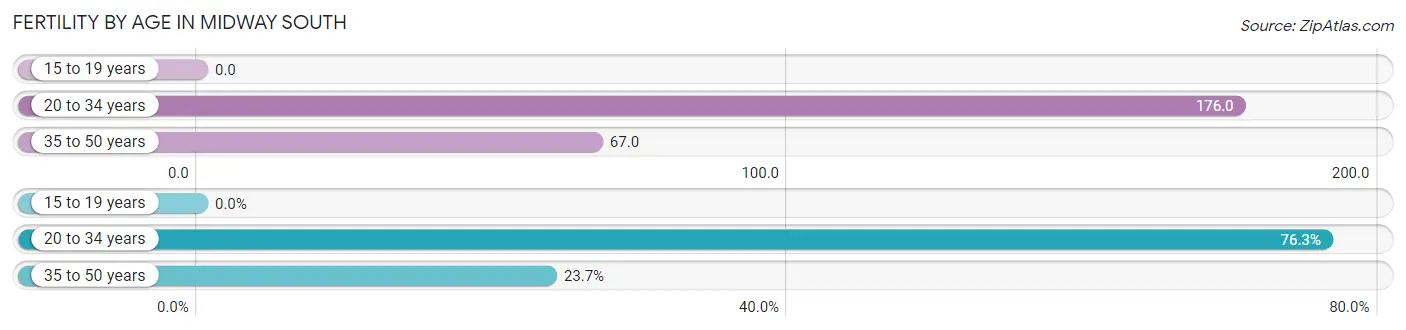
| Age Bracket | Women with Births | Births / 1,000 Women |
| 15 to 19 years | 0 (0.0%) | 0.0 |
| 20 to 34 years | 58 (76.3%) | 176.0 |
| 35 to 50 years | 18 (23.7%) | 67.0 |
| Total | 76 (100.0%) | 113.0 |
Fertility by Age by Marriage Status in Midway South
23.7% of women with births (76) in Midway South are married. The highest percentage of unmarried women with births falls into 20 to 34 years age bracket with 100.0% of them unmarried at the time of birth, while the lowest percentage of unmarried women with births belong to 35 to 50 years age bracket with 0.0% of them unmarried.
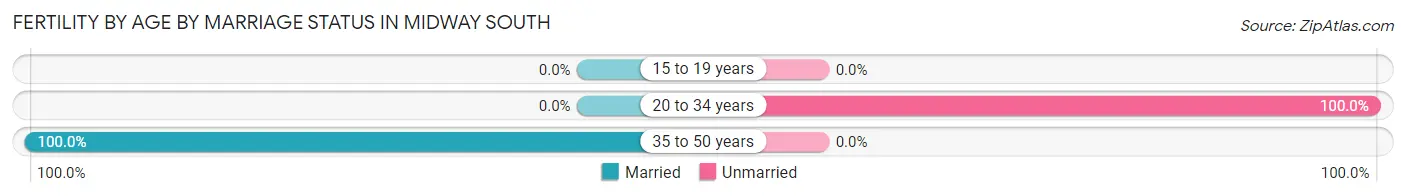
| Age Bracket | Married | Unmarried |
| 15 to 19 years | 0 (0.0%) | 0 (0.0%) |
| 20 to 34 years | 0 (0.0%) | 58 (100.0%) |
| 35 to 50 years | 18 (100.0%) | 0 (0.0%) |
| Total | 18 (23.7%) | 58 (76.3%) |
Fertility by Education in Midway South
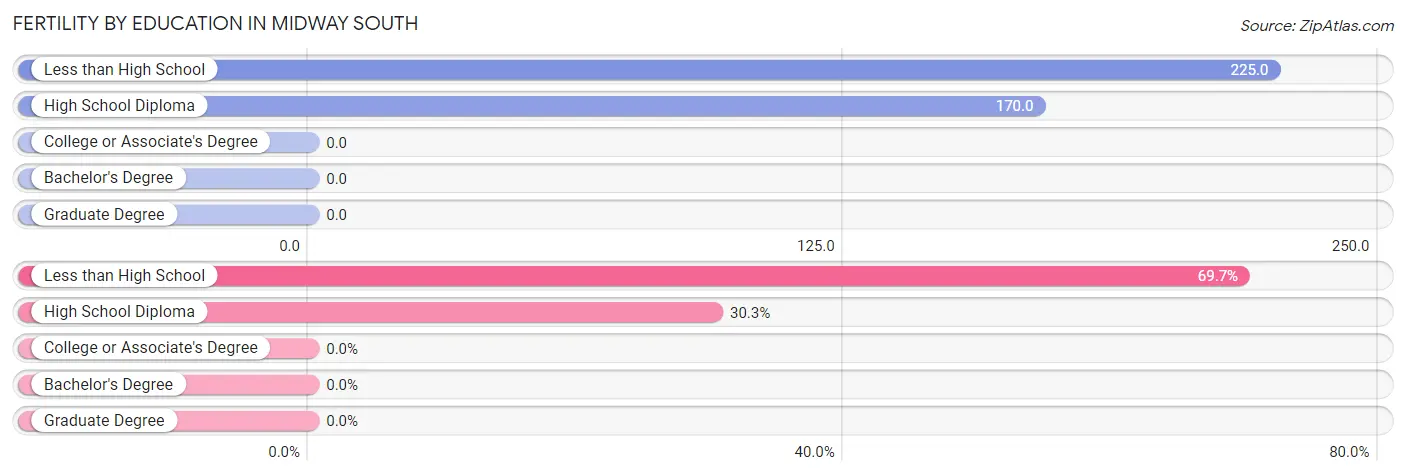
| Educational Attainment | Women with Births | Births / 1,000 Women |
| Less than High School | 53 (69.7%) | 225.0 |
| High School Diploma | 23 (30.3%) | 170.0 |
| College or Associate's Degree | 0 (0.0%) | 0.0 |
| Bachelor's Degree | 0 (0.0%) | 0.0 |
| Graduate Degree | 0 (0.0%) | 0.0 |
| Total | 76 (100.0%) | 113.0 |
Fertility by Education by Marriage Status in Midway South
76.3% of women with births in Midway South are unmarried. Women with the educational attainment of less than high school are most likely to be married with 34.0% of them married at childbirth, while women with the educational attainment of high school diploma are least likely to be married with 100.0% of them unmarried at childbirth.
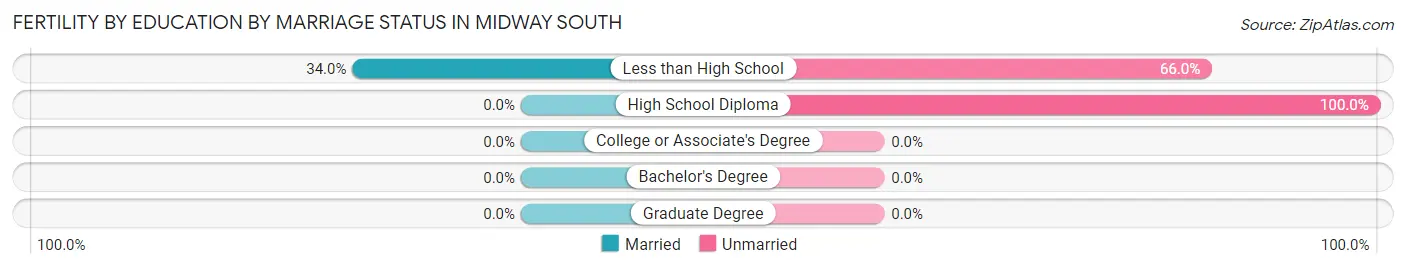
| Educational Attainment | Married | Unmarried |
| Less than High School | 18 (34.0%) | 35 (66.0%) |
| High School Diploma | 0 (0.0%) | 23 (100.0%) |
| College or Associate's Degree | 0 (0.0%) | 0 (0.0%) |
| Bachelor's Degree | 0 (0.0%) | 0 (0.0%) |
| Graduate Degree | 0 (0.0%) | 0 (0.0%) |
| Total | 18 (23.7%) | 58 (76.3%) |
Income in Midway South
Income Overview in Midway South
Per Capita Income in Midway South is $21,457, while median incomes of families and households are $62,045 and $85,326 respectively.
| Characteristic | Number | Measure |
| Per Capita Income | 2,419 | $21,457 |
| Median Family Income | 598 | $62,045 |
| Mean Family Income | 598 | $76,015 |
| Median Household Income | 644 | $85,326 |
| Mean Household Income | 644 | $78,372 |
| Income Deficit | 598 | $10,748 |
| Wage / Income Gap (%) | 2,419 | 47.61% |
| Wage / Income Gap ($) | 2,419 | 52.39¢ per $1 |
| Gini / Inequality Index | 2,419 | 0.36 |
Earnings by Sex in Midway South
Average Earnings in Midway South are $30,987, $39,476 for men and $20,682 for women, a difference of 47.6%.
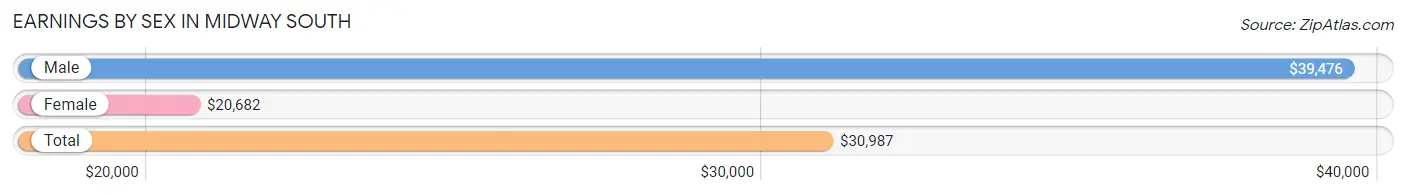
| Sex | Number | Average Earnings |
| Male | 521 (44.6%) | $39,476 |
| Female | 646 (55.4%) | $20,682 |
| Total | 1,167 (100.0%) | $30,987 |
Earnings by Sex by Income Bracket in Midway South
The most common earnings brackets in Midway South are $55,000 to $64,999 for men (135 | 25.9%) and $2,499 or less for women (104 | 16.1%).
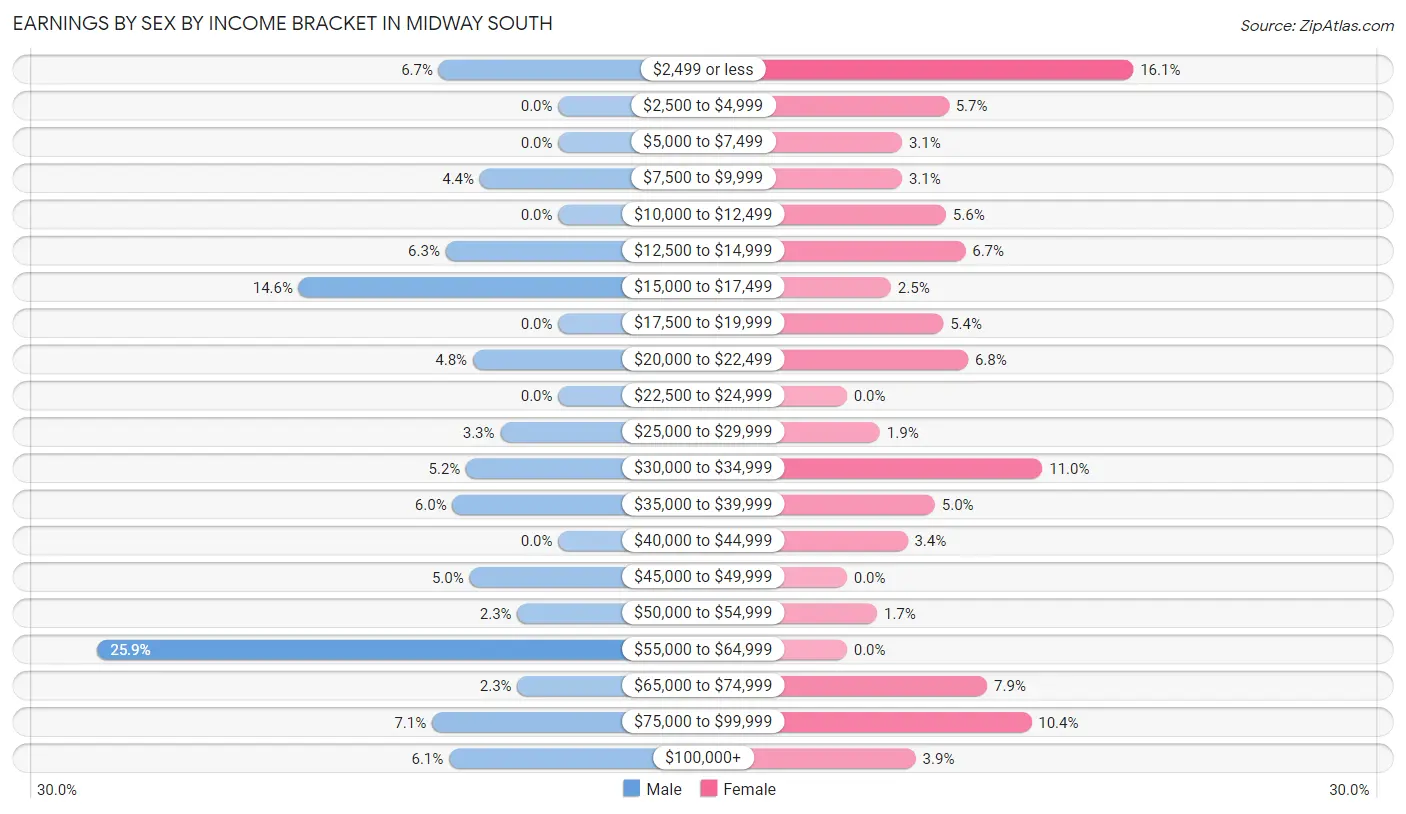
| Income | Male | Female |
| $2,499 or less | 35 (6.7%) | 104 (16.1%) |
| $2,500 to $4,999 | 0 (0.0%) | 37 (5.7%) |
| $5,000 to $7,499 | 0 (0.0%) | 20 (3.1%) |
| $7,500 to $9,999 | 23 (4.4%) | 20 (3.1%) |
| $10,000 to $12,499 | 0 (0.0%) | 36 (5.6%) |
| $12,500 to $14,999 | 33 (6.3%) | 43 (6.7%) |
| $15,000 to $17,499 | 76 (14.6%) | 16 (2.5%) |
| $17,500 to $19,999 | 0 (0.0%) | 35 (5.4%) |
| $20,000 to $22,499 | 25 (4.8%) | 44 (6.8%) |
| $22,500 to $24,999 | 0 (0.0%) | 0 (0.0%) |
| $25,000 to $29,999 | 17 (3.3%) | 12 (1.9%) |
| $30,000 to $34,999 | 27 (5.2%) | 71 (11.0%) |
| $35,000 to $39,999 | 31 (5.9%) | 32 (5.0%) |
| $40,000 to $44,999 | 0 (0.0%) | 22 (3.4%) |
| $45,000 to $49,999 | 26 (5.0%) | 0 (0.0%) |
| $50,000 to $54,999 | 12 (2.3%) | 11 (1.7%) |
| $55,000 to $64,999 | 135 (25.9%) | 0 (0.0%) |
| $65,000 to $74,999 | 12 (2.3%) | 51 (7.9%) |
| $75,000 to $99,999 | 37 (7.1%) | 67 (10.4%) |
| $100,000+ | 32 (6.1%) | 25 (3.9%) |
| Total | 521 (100.0%) | 646 (100.0%) |
Earnings by Sex by Educational Attainment in Midway South
Average earnings in Midway South are $57,995 for men and $32,870 for women, a difference of 43.3%. Men with an educational attainment of high school diploma enjoy the highest average annual earnings of $90,169, while those with less than high school education earn the least with $38,145. Women with an educational attainment of college or associate's degree earn the most with the average annual earnings of $38,086, while those with less than high school education have the smallest earnings of $20,767.
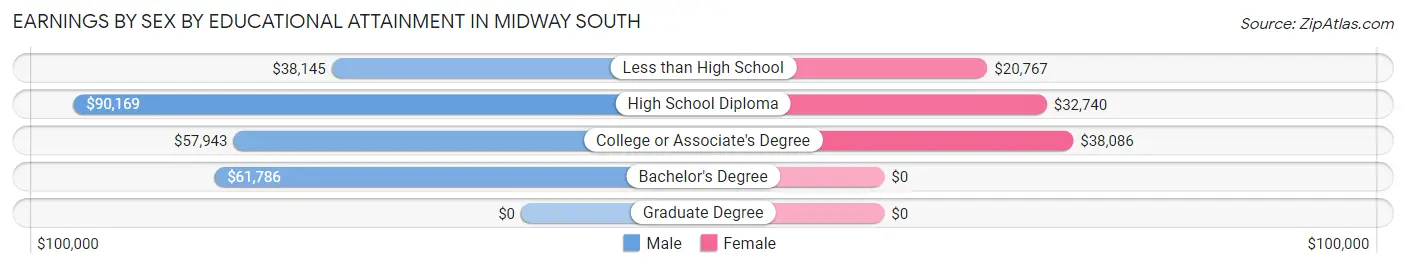
| Educational Attainment | Male Income | Female Income |
| Less than High School | $38,145 | $20,767 |
| High School Diploma | $90,169 | $32,740 |
| College or Associate's Degree | $57,943 | $38,086 |
| Bachelor's Degree | $61,786 | $0 |
| Graduate Degree | - | - |
| Total | $57,995 | $32,870 |
Family Income in Midway South
Family Income Brackets in Midway South
According to the Midway South family income data, there are 181 families falling into the $100,000 to $149,999 income range, which is the most common income bracket and makes up 30.3% of all families. Conversely, the $200,000+ income bracket is the least frequent group with only 6 families (1.0%) belonging to this category.
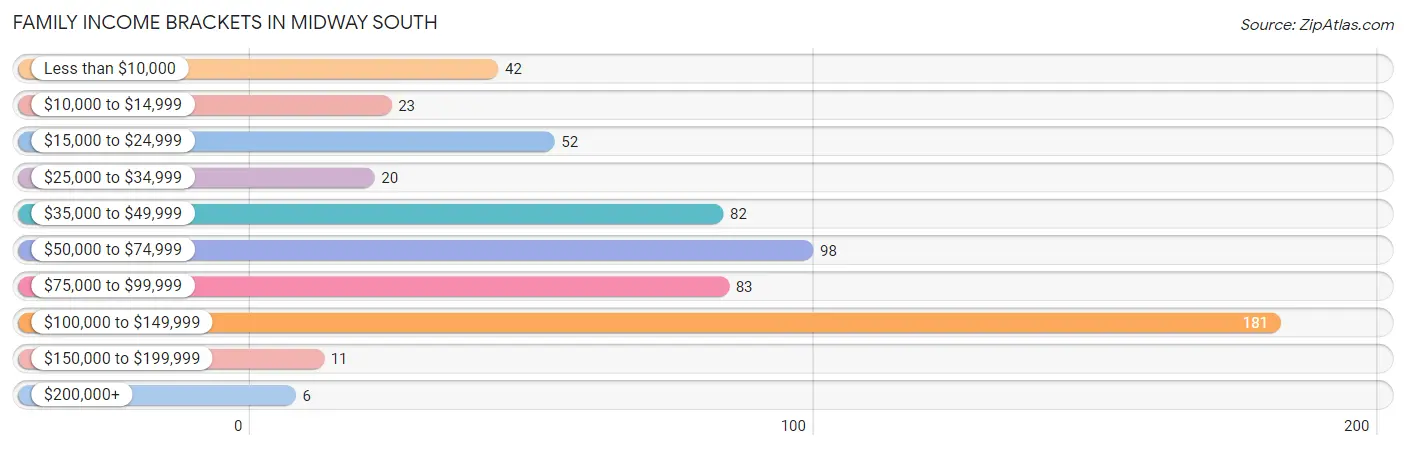
| Income Bracket | # Families | % Families |
| Less than $10,000 | 42 | 7.0% |
| $10,000 to $14,999 | 23 | 3.8% |
| $15,000 to $24,999 | 52 | 8.7% |
| $25,000 to $34,999 | 20 | 3.3% |
| $35,000 to $49,999 | 82 | 13.7% |
| $50,000 to $74,999 | 98 | 16.4% |
| $75,000 to $99,999 | 83 | 13.9% |
| $100,000 to $149,999 | 181 | 30.3% |
| $150,000 to $199,999 | 11 | 1.8% |
| $200,000+ | 6 | 1.0% |
Family Income by Famaliy Size in Midway South
5-person families (77 | 12.9%) account for the highest median family income in Midway South with $122,022 per family, while 3-person families (135 | 22.6%) have the highest median income of $29,952 per family member.
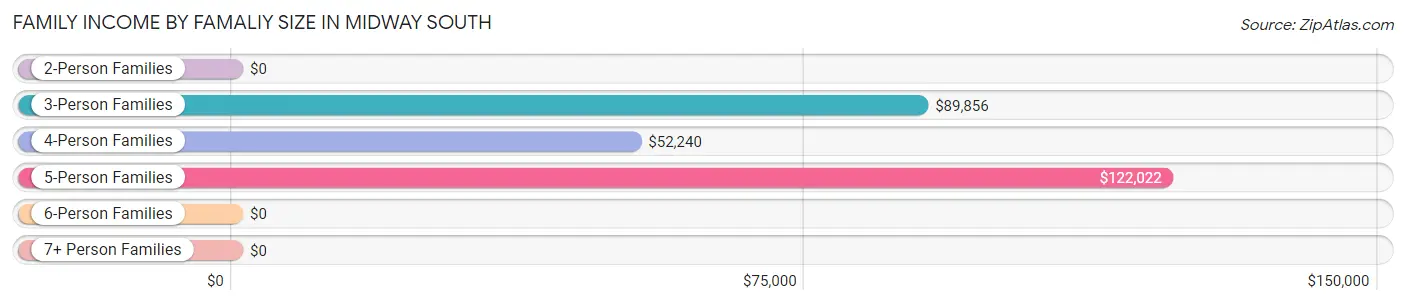
| Income Bracket | # Families | Median Income |
| 2-Person Families | 191 (31.9%) | $0 |
| 3-Person Families | 135 (22.6%) | $89,856 |
| 4-Person Families | 157 (26.3%) | $52,240 |
| 5-Person Families | 77 (12.9%) | $122,022 |
| 6-Person Families | 19 (3.2%) | $0 |
| 7+ Person Families | 19 (3.2%) | $0 |
| Total | 598 (100.0%) | $62,045 |
Family Income by Number of Earners in Midway South
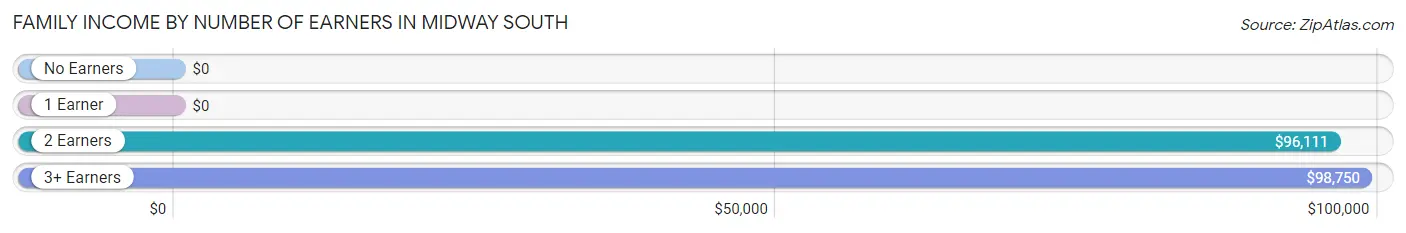
| Number of Earners | # Families | Median Income |
| No Earners | 74 (12.4%) | $0 |
| 1 Earner | 130 (21.7%) | $0 |
| 2 Earners | 328 (54.8%) | $96,111 |
| 3+ Earners | 66 (11.0%) | $98,750 |
| Total | 598 (100.0%) | $62,045 |
Household Income in Midway South
Household Income Brackets in Midway South
With 216 households falling in the category, the $100,000 to $149,999 income range is the most frequent in Midway South, accounting for 33.5% of all households. In contrast, only 6 households (0.9%) fall into the $200,000+ income bracket, making it the least populous group.
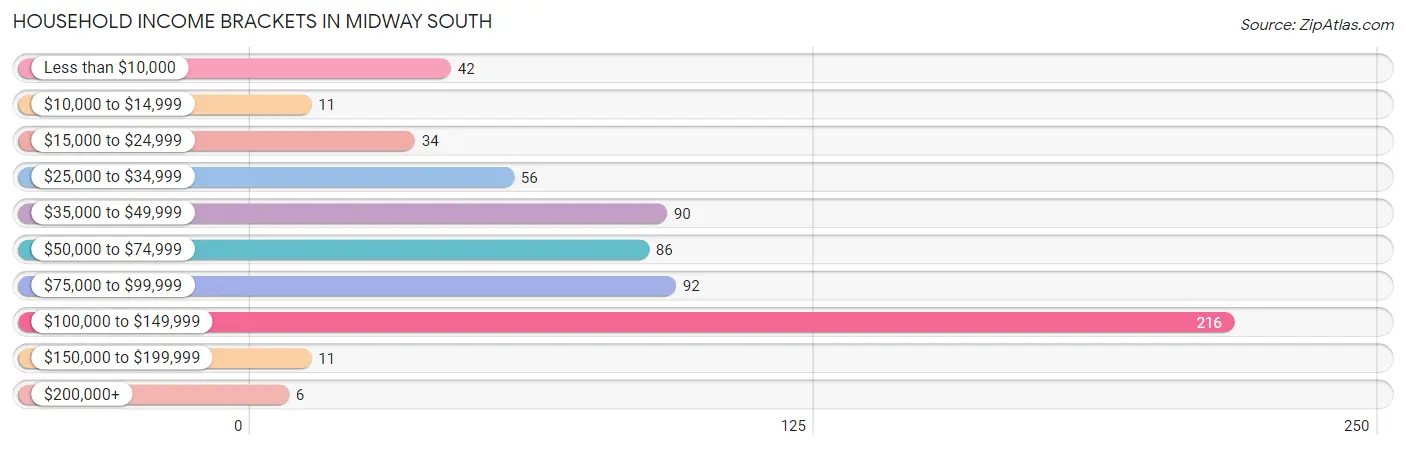
| Income Bracket | # Households | % Households |
| Less than $10,000 | 42 | 6.5% |
| $10,000 to $14,999 | 11 | 1.7% |
| $15,000 to $24,999 | 34 | 5.3% |
| $25,000 to $34,999 | 56 | 8.7% |
| $35,000 to $49,999 | 90 | 14.0% |
| $50,000 to $74,999 | 86 | 13.4% |
| $75,000 to $99,999 | 92 | 14.3% |
| $100,000 to $149,999 | 216 | 33.5% |
| $150,000 to $199,999 | 11 | 1.7% |
| $200,000+ | 6 | 0.9% |
Household Income by Householder Age in Midway South
The median household income in Midway South is $85,326, with the highest median household income of $89,279 found in the 45 to 64 years age bracket for the primary householder. A total of 317 households (49.2%) fall into this category.
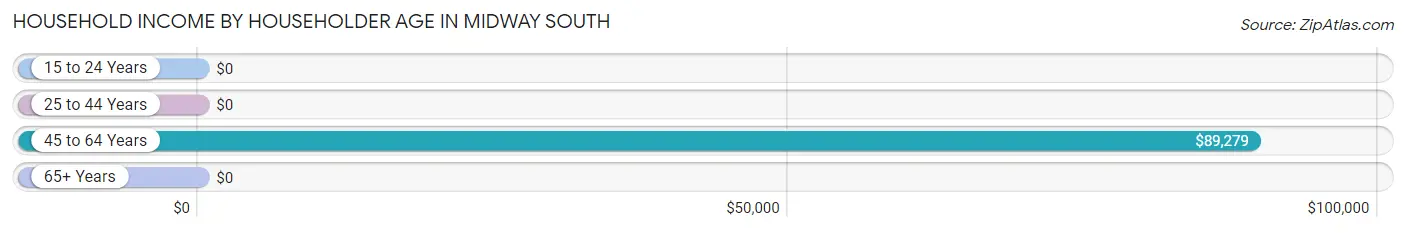
| Income Bracket | # Households | Median Income |
| 15 to 24 Years | 0 (0.0%) | $0 |
| 25 to 44 Years | 232 (36.0%) | $0 |
| 45 to 64 Years | 317 (49.2%) | $89,279 |
| 65+ Years | 95 (14.7%) | $0 |
| Total | 644 (100.0%) | $85,326 |
Poverty in Midway South
Income Below Poverty by Sex and Age in Midway South
With 22.1% poverty level for males and 25.4% for females among the residents of Midway South, 6 to 11 year old males and 6 to 11 year old females are the most vulnerable to poverty, with 54 males (78.3%) and 48 females (40.7%) in their respective age groups living below the poverty level.
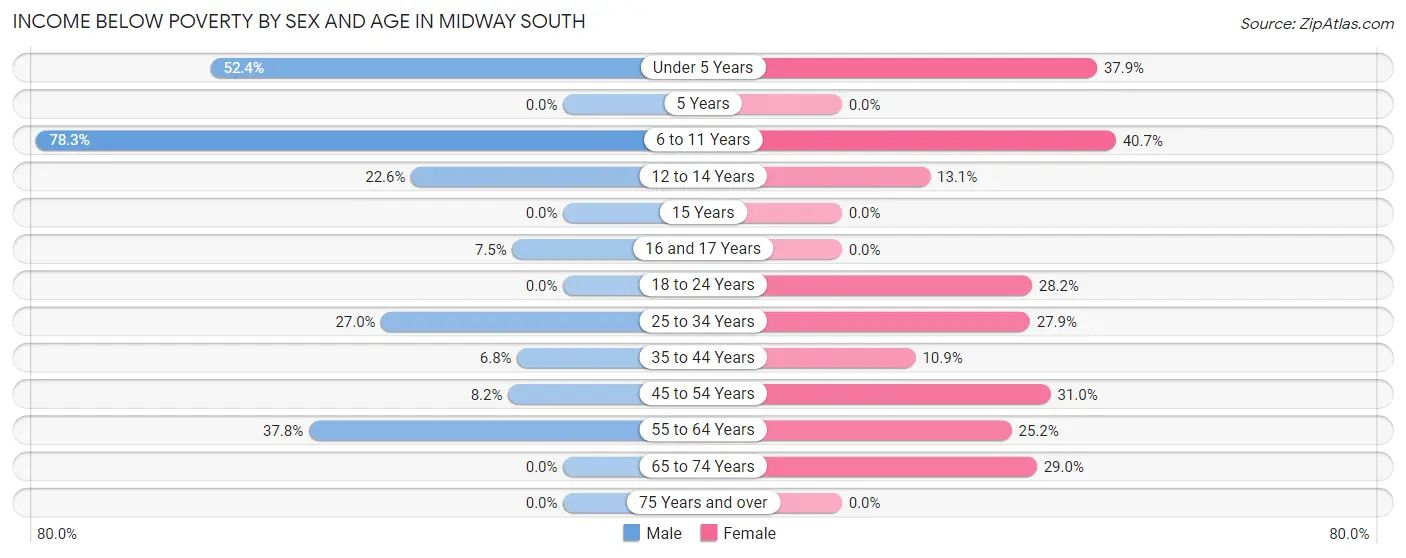
| Age Bracket | Male | Female |
| Under 5 Years | 44 (52.4%) | 61 (37.9%) |
| 5 Years | 0 (0.0%) | 0 (0.0%) |
| 6 to 11 Years | 54 (78.3%) | 48 (40.7%) |
| 12 to 14 Years | 21 (22.6%) | 8 (13.1%) |
| 15 Years | 0 (0.0%) | 0 (0.0%) |
| 16 and 17 Years | 7 (7.5%) | 0 (0.0%) |
| 18 to 24 Years | 0 (0.0%) | 44 (28.2%) |
| 25 to 34 Years | 47 (27.0%) | 55 (27.9%) |
| 35 to 44 Years | 9 (6.8%) | 14 (10.9%) |
| 45 to 54 Years | 9 (8.2%) | 62 (31.0%) |
| 55 to 64 Years | 54 (37.8%) | 29 (25.2%) |
| 65 to 74 Years | 0 (0.0%) | 11 (28.9%) |
| 75 Years and over | 0 (0.0%) | 0 (0.0%) |
| Total | 245 (22.1%) | 332 (25.4%) |
Income Above Poverty by Sex and Age in Midway South
According to the poverty statistics in Midway South, males aged 15 years and females aged 5 years are the age groups that are most secure financially, with 100.0% of males and 100.0% of females in these age groups living above the poverty line.
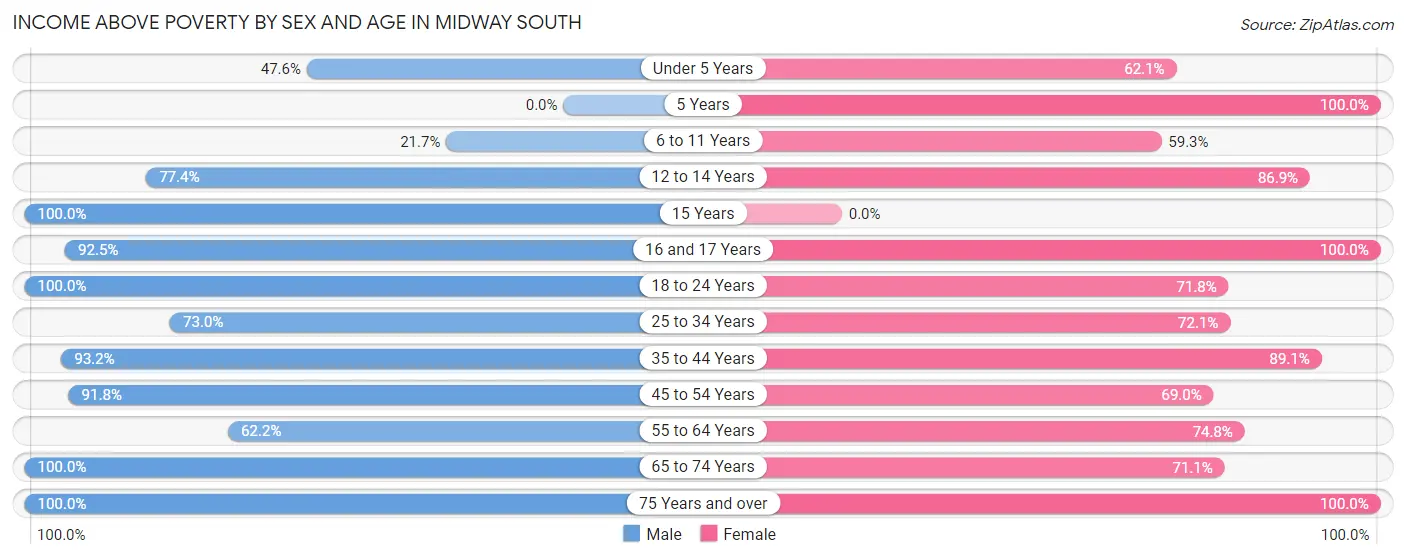
| Age Bracket | Male | Female |
| Under 5 Years | 40 (47.6%) | 100 (62.1%) |
| 5 Years | 0 (0.0%) | 33 (100.0%) |
| 6 to 11 Years | 15 (21.7%) | 70 (59.3%) |
| 12 to 14 Years | 72 (77.4%) | 53 (86.9%) |
| 15 Years | 19 (100.0%) | 0 (0.0%) |
| 16 and 17 Years | 86 (92.5%) | 47 (100.0%) |
| 18 to 24 Years | 145 (100.0%) | 112 (71.8%) |
| 25 to 34 Years | 127 (73.0%) | 142 (72.1%) |
| 35 to 44 Years | 123 (93.2%) | 114 (89.1%) |
| 45 to 54 Years | 101 (91.8%) | 138 (69.0%) |
| 55 to 64 Years | 89 (62.2%) | 86 (74.8%) |
| 65 to 74 Years | 37 (100.0%) | 27 (71.1%) |
| 75 Years and over | 11 (100.0%) | 55 (100.0%) |
| Total | 865 (77.9%) | 977 (74.6%) |
Income Below Poverty Among Married-Couple Families in Midway South
The poverty statistics for married-couple families in Midway South show that 13.1% or 42 of the total 321 families live below the poverty line. Families with 3 or 4 children have the highest poverty rate of 37.2%, comprising of 19 families. On the other hand, families with no children have the lowest poverty rate of 8.1%, which includes 11 families.
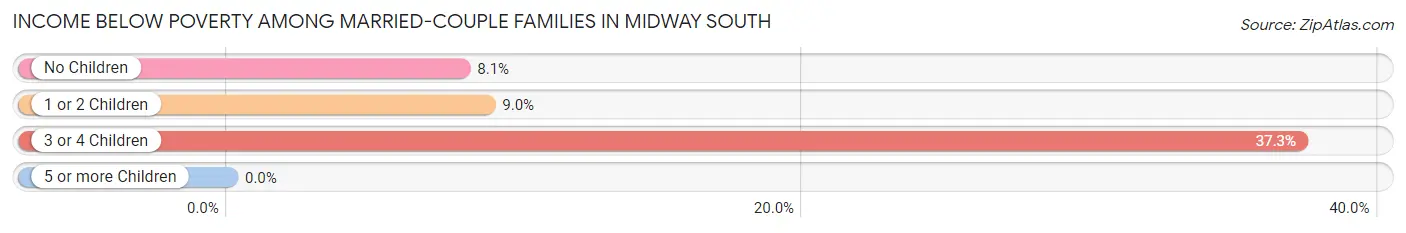
| Children | Above Poverty | Below Poverty |
| No Children | 125 (91.9%) | 11 (8.1%) |
| 1 or 2 Children | 122 (91.0%) | 12 (9.0%) |
| 3 or 4 Children | 32 (62.7%) | 19 (37.2%) |
| 5 or more Children | 0 (0.0%) | 0 (0.0%) |
| Total | 279 (86.9%) | 42 (13.1%) |
Income Below Poverty Among Single-Parent Households in Midway South
According to the poverty data in Midway South, 44.3% or 43 single-father households and 27.2% or 49 single-mother households are living below the poverty line. Among single-father households, those with 3 or 4 children have the highest poverty rate, with 11 households (100.0%) experiencing poverty. Likewise, among single-mother households, those with 1 or 2 children have the highest poverty rate, with 42 households (35.6%) falling below the poverty line.
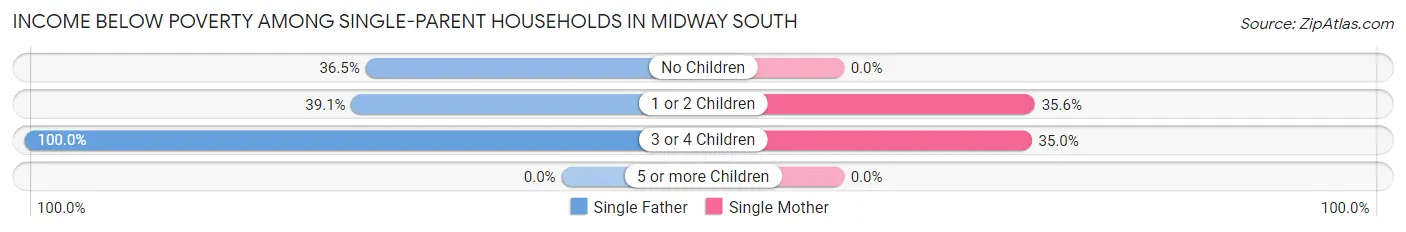
| Children | Single Father | Single Mother |
| No Children | 23 (36.5%) | 0 (0.0%) |
| 1 or 2 Children | 9 (39.1%) | 42 (35.6%) |
| 3 or 4 Children | 11 (100.0%) | 7 (35.0%) |
| 5 or more Children | 0 (0.0%) | 0 (0.0%) |
| Total | 43 (44.3%) | 49 (27.2%) |
Income Below Poverty Among Married-Couple vs Single-Parent Households in Midway South
The poverty data for Midway South shows that 42 of the married-couple family households (13.1%) and 92 of the single-parent households (33.2%) are living below the poverty level. Within the married-couple family households, those with 3 or 4 children have the highest poverty rate, with 19 households (37.2%) falling below the poverty line. Among the single-parent households, those with 3 or 4 children have the highest poverty rate, with 18 household (58.1%) living below poverty.
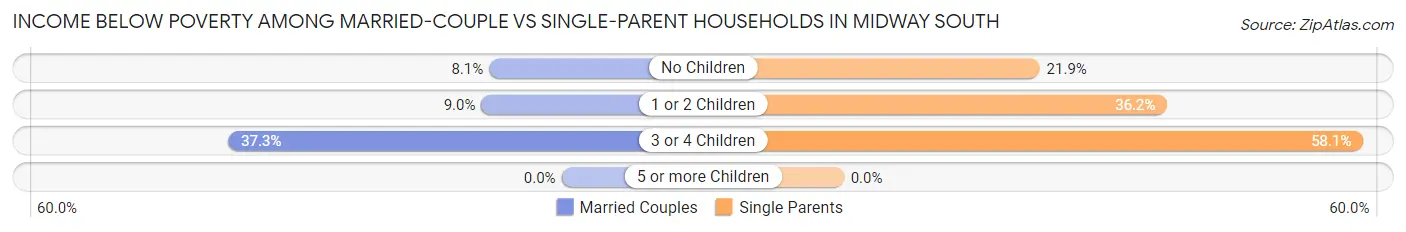
| Children | Married-Couple Families | Single-Parent Households |
| No Children | 11 (8.1%) | 23 (21.9%) |
| 1 or 2 Children | 12 (9.0%) | 51 (36.2%) |
| 3 or 4 Children | 19 (37.2%) | 18 (58.1%) |
| 5 or more Children | 0 (0.0%) | 0 (0.0%) |
| Total | 42 (13.1%) | 92 (33.2%) |
Employment Characteristics in Midway South
Employment by Class of Employer in Midway South
Among the 1,059 employed individuals in Midway South, private company employees (857 | 80.9%), self-employed (not incorporated) (91 | 8.6%), and local government employees (63 | 5.9%) make up the most common classes of employment.
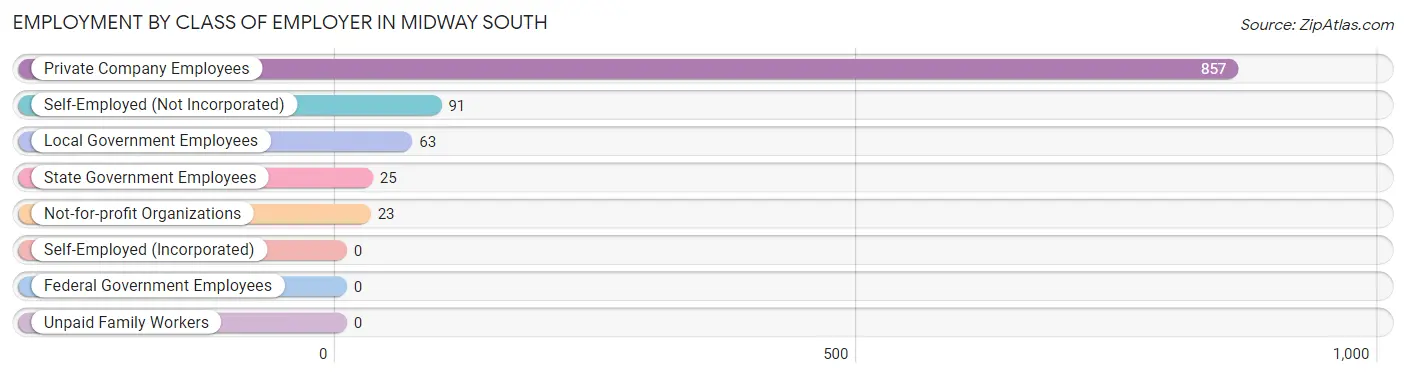
| Employer Class | # Employees | % Employees |
| Private Company Employees | 857 | 80.9% |
| Self-Employed (Incorporated) | 0 | 0.0% |
| Self-Employed (Not Incorporated) | 91 | 8.6% |
| Not-for-profit Organizations | 23 | 2.2% |
| Local Government Employees | 63 | 5.9% |
| State Government Employees | 25 | 2.4% |
| Federal Government Employees | 0 | 0.0% |
| Unpaid Family Workers | 0 | 0.0% |
| Total | 1,059 | 100.0% |
Employment Status by Age in Midway South
According to the labor force statistics for Midway South, out of the total population over 16 years of age (1,781), 63.6% or 1,133 individuals are in the labor force, with 6.4% or 73 of them unemployed. The age group with the highest labor force participation rate is 45 to 54 years, with 92.6% or 287 individuals in the labor force. Within the labor force, the 16 to 19 years age range has the highest percentage of unemployed individuals, with 36.4% or 12 of them being unemployed.
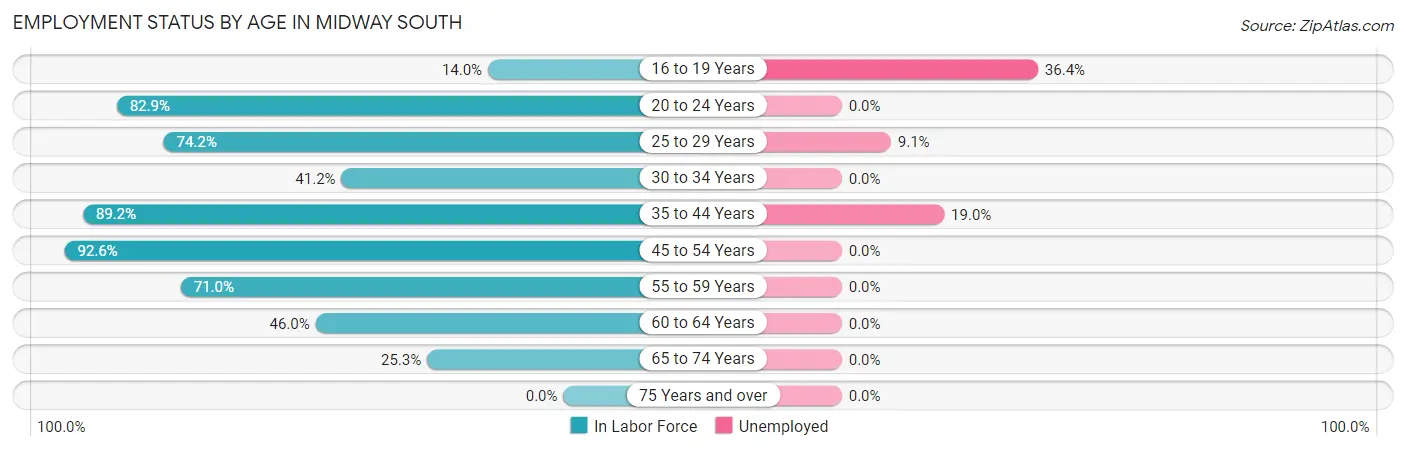
| Age Bracket | In Labor Force | Unemployed |
| 16 to 19 Years | 33 (14.0%) | 12 (36.4%) |
| 20 to 24 Years | 170 (82.9%) | 0 (0.0%) |
| 25 to 29 Years | 187 (74.2%) | 17 (9.1%) |
| 30 to 34 Years | 49 (41.2%) | 0 (0.0%) |
| 35 to 44 Years | 232 (89.2%) | 44 (19.0%) |
| 45 to 54 Years | 287 (92.6%) | 0 (0.0%) |
| 55 to 59 Years | 103 (71.0%) | 0 (0.0%) |
| 60 to 64 Years | 52 (46.0%) | 0 (0.0%) |
| 65 to 74 Years | 19 (25.3%) | 0 (0.0%) |
| 75 Years and over | 0 (0.0%) | 0 (0.0%) |
| Total | 1,133 (63.6%) | 73 (6.4%) |
Employment Status by Educational Attainment in Midway South
According to labor force statistics for Midway South, 75.9% of individuals (910) out of the total population between 25 and 64 years of age (1,199) are in the labor force, with 6.7% or 61 of them being unemployed. The group with the highest labor force participation rate are those with the educational attainment of college / associate degree, with 95.5% or 234 individuals in the labor force. Within the labor force, individuals with less than high school education have the highest percentage of unemployment, with 16.7% or 44 of them being unemployed.
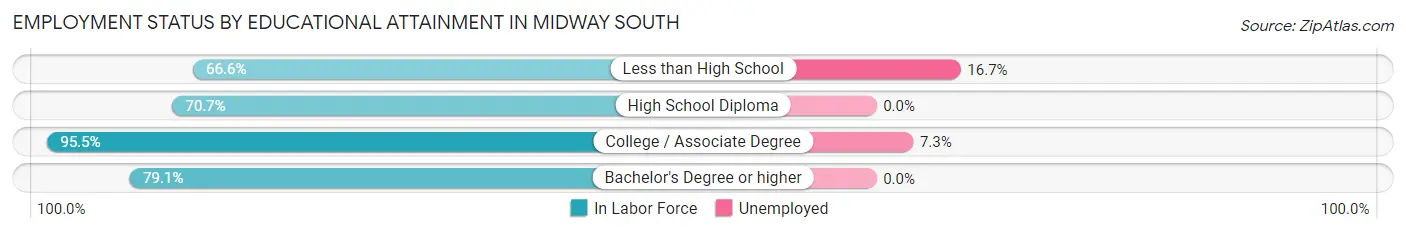
| Educational Attainment | In Labor Force | Unemployed |
| Less than High School | 263 (66.6%) | 66 (16.7%) |
| High School Diploma | 246 (70.7%) | 0 (0.0%) |
| College / Associate Degree | 234 (95.5%) | 18 (7.3%) |
| Bachelor's Degree or higher | 167 (79.1%) | 0 (0.0%) |
| Total | 910 (75.9%) | 80 (6.7%) |
Employment Occupations by Sex in Midway South
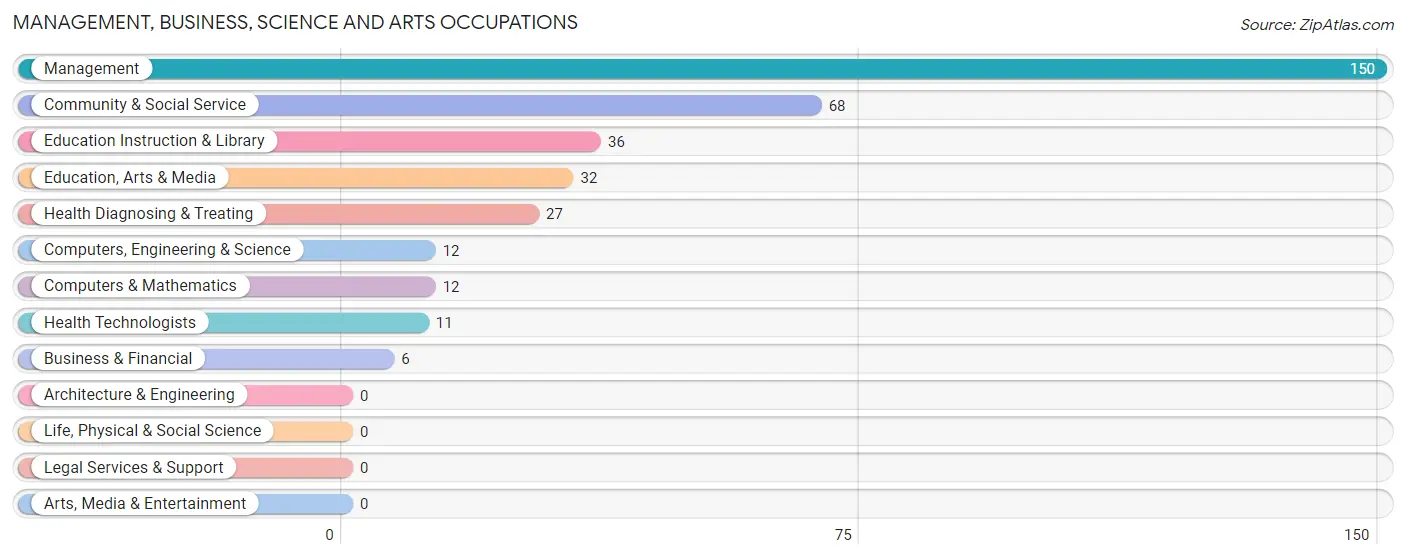
Management, Business, Science and Arts Occupations
The most common Management, Business, Science and Arts occupations in Midway South are Management (150 | 14.2%), Community & Social Service (68 | 6.4%), Education Instruction & Library (36 | 3.4%), Education, Arts & Media (32 | 3.0%), and Health Diagnosing & Treating (27 | 2.5%).
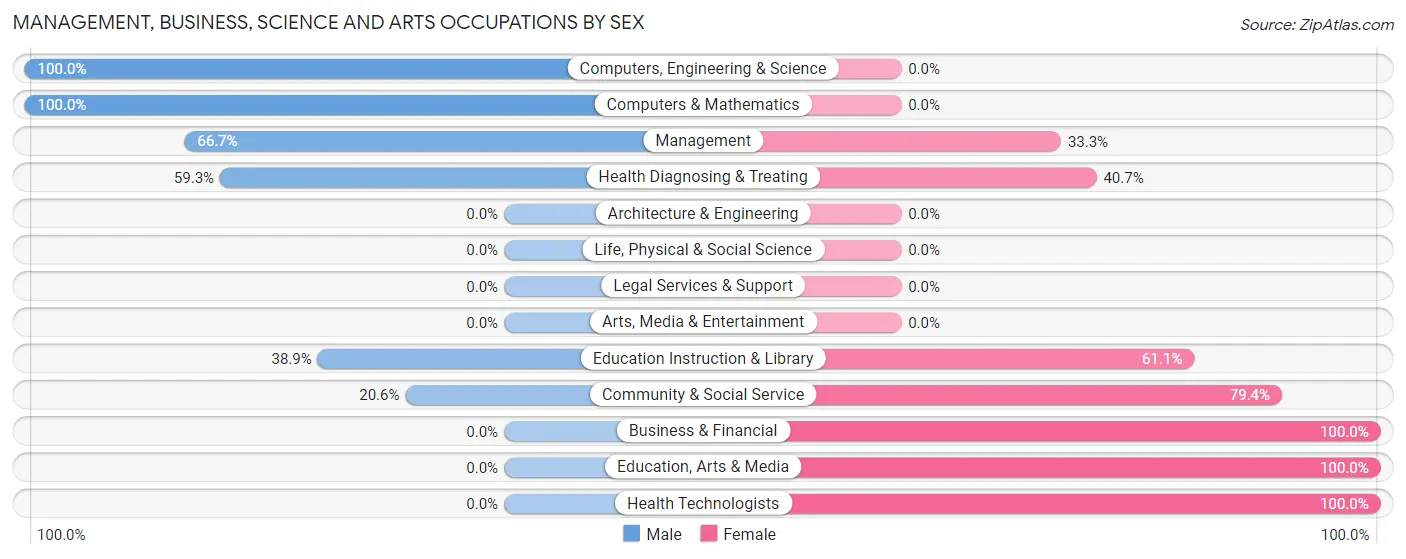
Management, Business, Science and Arts Occupations by Sex
Within the Management, Business, Science and Arts occupations in Midway South, the most male-oriented occupations are Computers, Engineering & Science (100.0%), Computers & Mathematics (100.0%), and Management (66.7%), while the most female-oriented occupations are Business & Financial (100.0%), Education, Arts & Media (100.0%), and Health Technologists (100.0%).
| Occupation | Male | Female |
| Management | 100 (66.7%) | 50 (33.3%) |
| Business & Financial | 0 (0.0%) | 6 (100.0%) |
| Computers, Engineering & Science | 12 (100.0%) | 0 (0.0%) |
| Computers & Mathematics | 12 (100.0%) | 0 (0.0%) |
| Architecture & Engineering | 0 (0.0%) | 0 (0.0%) |
| Life, Physical & Social Science | 0 (0.0%) | 0 (0.0%) |
| Community & Social Service | 14 (20.6%) | 54 (79.4%) |
| Education, Arts & Media | 0 (0.0%) | 32 (100.0%) |
| Legal Services & Support | 0 (0.0%) | 0 (0.0%) |
| Education Instruction & Library | 14 (38.9%) | 22 (61.1%) |
| Arts, Media & Entertainment | 0 (0.0%) | 0 (0.0%) |
| Health Diagnosing & Treating | 16 (59.3%) | 11 (40.7%) |
| Health Technologists | 0 (0.0%) | 11 (100.0%) |
| Total (Category) | 142 (54.0%) | 121 (46.0%) |
| Total (Overall) | 495 (46.7%) | 564 (53.3%) |
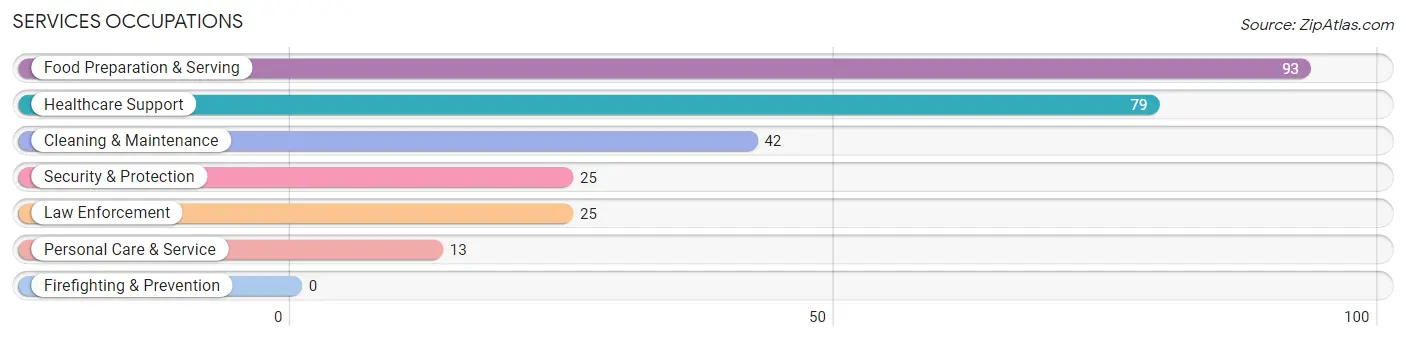
Services Occupations
The most common Services occupations in Midway South are Food Preparation & Serving (93 | 8.8%), Healthcare Support (79 | 7.5%), Cleaning & Maintenance (42 | 4.0%), Security & Protection (25 | 2.4%), and Law Enforcement (25 | 2.4%).
Services Occupations by Sex
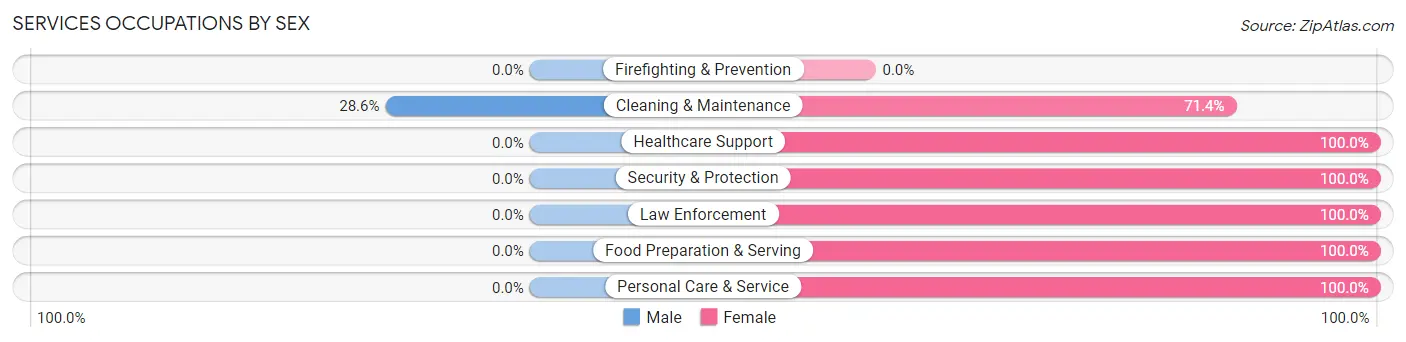
| Occupation | Male | Female |
| Healthcare Support | 0 (0.0%) | 79 (100.0%) |
| Security & Protection | 0 (0.0%) | 25 (100.0%) |
| Firefighting & Prevention | 0 (0.0%) | 0 (0.0%) |
| Law Enforcement | 0 (0.0%) | 25 (100.0%) |
| Food Preparation & Serving | 0 (0.0%) | 93 (100.0%) |
| Cleaning & Maintenance | 12 (28.6%) | 30 (71.4%) |
| Personal Care & Service | 0 (0.0%) | 13 (100.0%) |
| Total (Category) | 12 (4.8%) | 240 (95.2%) |
| Total (Overall) | 495 (46.7%) | 564 (53.3%) |
Sales and Office Occupations
The most common Sales and Office occupations in Midway South are Sales & Related (244 | 23.0%), and Office & Administration (56 | 5.3%).
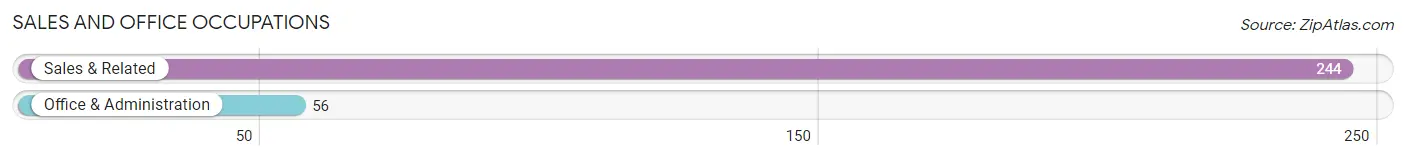
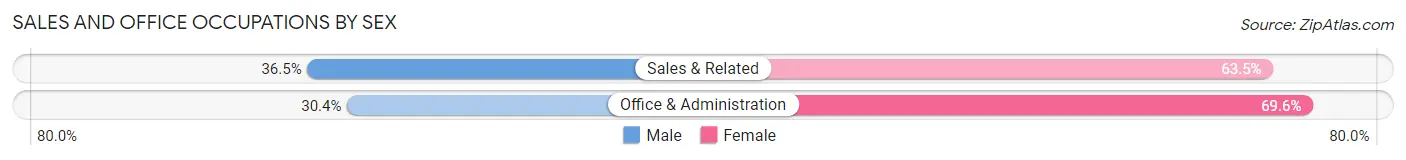
Sales and Office Occupations by Sex
| Occupation | Male | Female |
| Sales & Related | 89 (36.5%) | 155 (63.5%) |
| Office & Administration | 17 (30.4%) | 39 (69.6%) |
| Total (Category) | 106 (35.3%) | 194 (64.7%) |
| Total (Overall) | 495 (46.7%) | 564 (53.3%) |
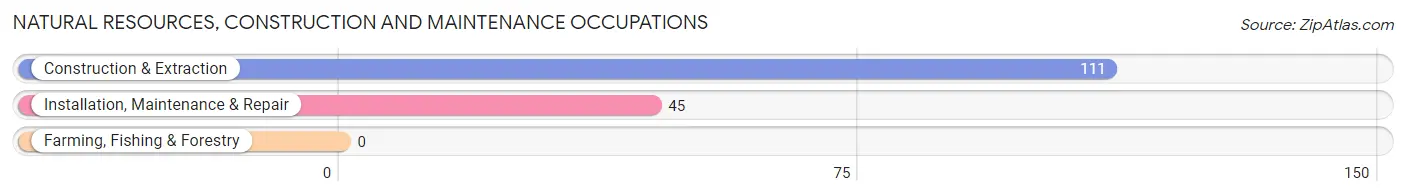
Natural Resources, Construction and Maintenance Occupations
The most common Natural Resources, Construction and Maintenance occupations in Midway South are Construction & Extraction (111 | 10.5%), and Installation, Maintenance & Repair (45 | 4.3%).
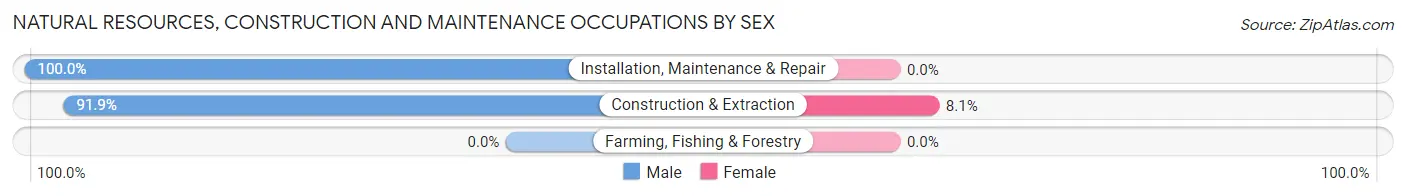
Natural Resources, Construction and Maintenance Occupations by Sex
| Occupation | Male | Female |
| Farming, Fishing & Forestry | 0 (0.0%) | 0 (0.0%) |
| Construction & Extraction | 102 (91.9%) | 9 (8.1%) |
| Installation, Maintenance & Repair | 45 (100.0%) | 0 (0.0%) |
| Total (Category) | 147 (94.2%) | 9 (5.8%) |
| Total (Overall) | 495 (46.7%) | 564 (53.3%) |
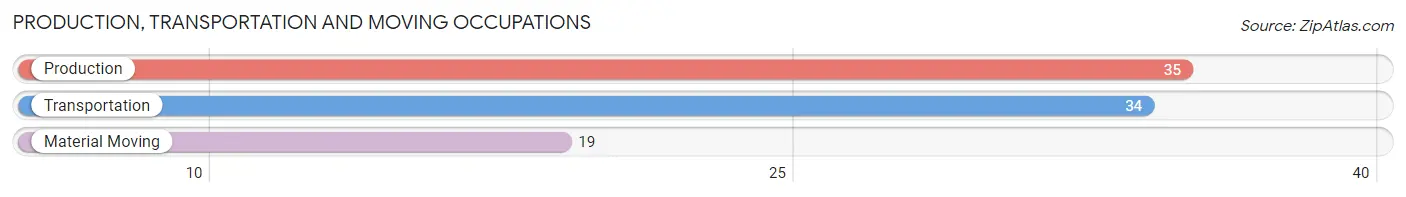
Production, Transportation and Moving Occupations
The most common Production, Transportation and Moving occupations in Midway South are Production (35 | 3.3%), Transportation (34 | 3.2%), and Material Moving (19 | 1.8%).
Production, Transportation and Moving Occupations by Sex
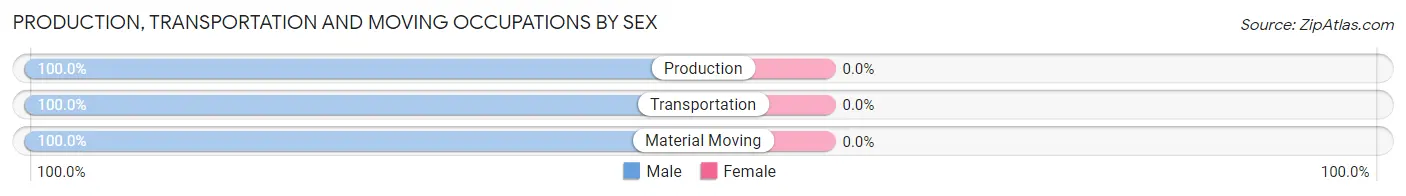
| Occupation | Male | Female |
| Production | 35 (100.0%) | 0 (0.0%) |
| Transportation | 34 (100.0%) | 0 (0.0%) |
| Material Moving | 19 (100.0%) | 0 (0.0%) |
| Total (Category) | 88 (100.0%) | 0 (0.0%) |
| Total (Overall) | 495 (46.7%) | 564 (53.3%) |
Employment Industries by Sex in Midway South
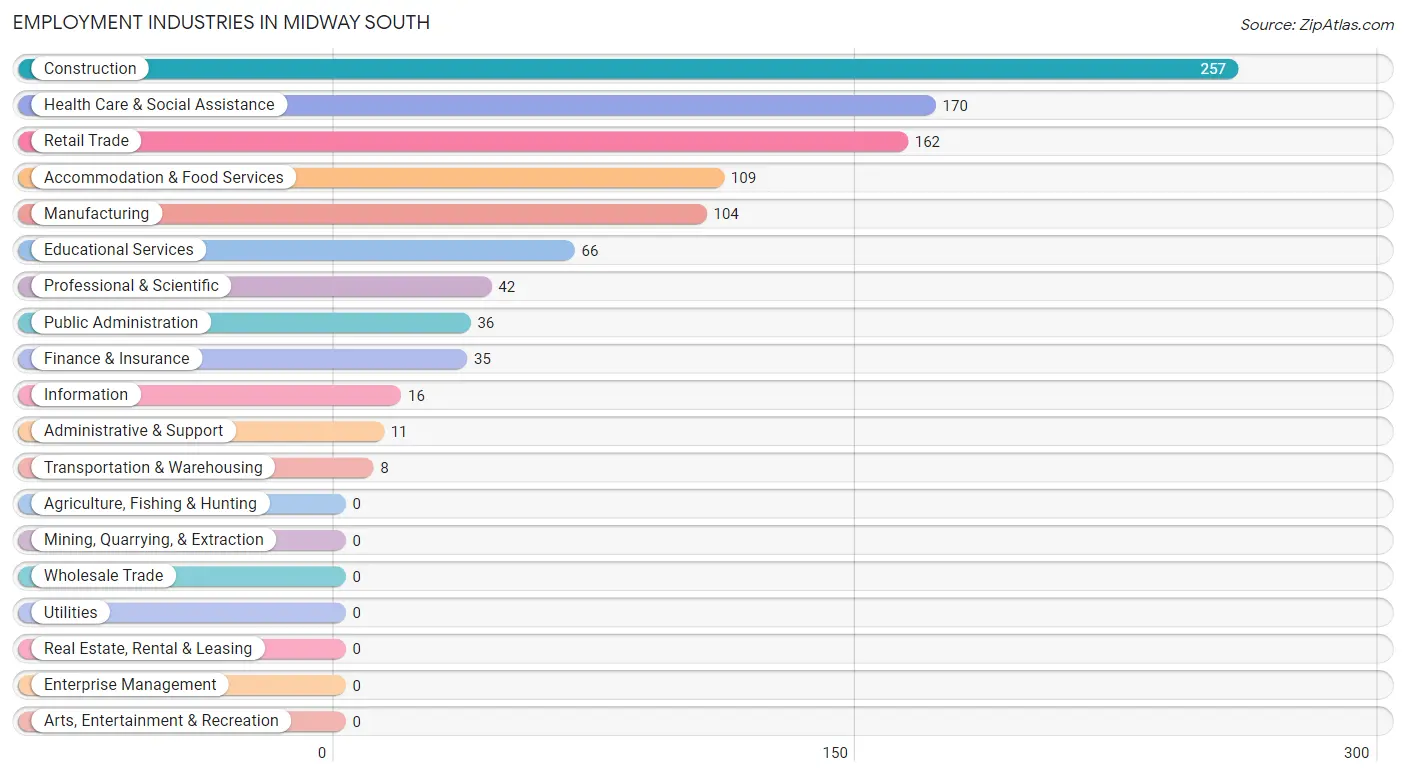
Employment Industries in Midway South
The major employment industries in Midway South include Construction (257 | 24.3%), Health Care & Social Assistance (170 | 16.1%), Retail Trade (162 | 15.3%), Accommodation & Food Services (109 | 10.3%), and Manufacturing (104 | 9.8%).
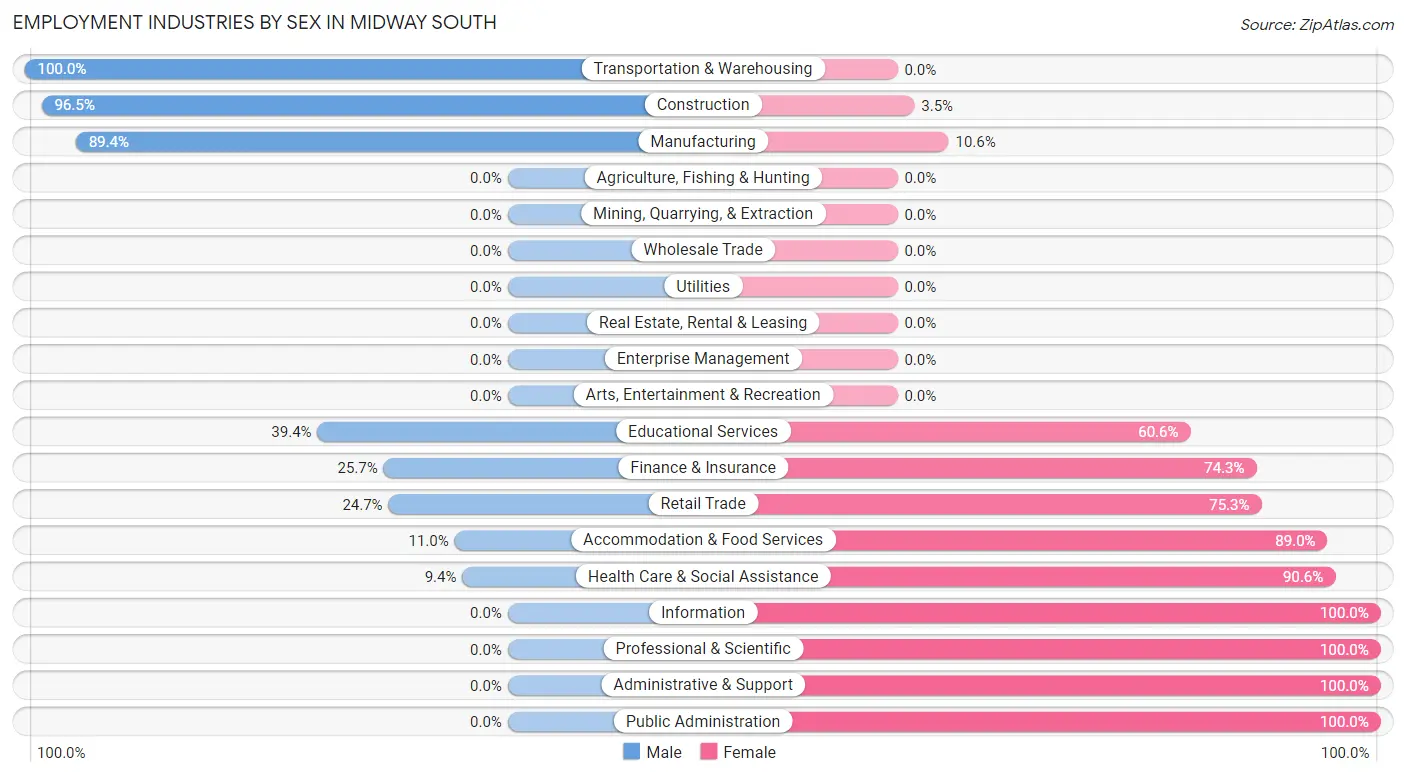
Employment Industries by Sex in Midway South
The Midway South industries that see more men than women are Transportation & Warehousing (100.0%), Construction (96.5%), and Manufacturing (89.4%), whereas the industries that tend to have a higher number of women are Information (100.0%), Professional & Scientific (100.0%), and Administrative & Support (100.0%).
| Industry | Male | Female |
| Agriculture, Fishing & Hunting | 0 (0.0%) | 0 (0.0%) |
| Mining, Quarrying, & Extraction | 0 (0.0%) | 0 (0.0%) |
| Construction | 248 (96.5%) | 9 (3.5%) |
| Manufacturing | 93 (89.4%) | 11 (10.6%) |
| Wholesale Trade | 0 (0.0%) | 0 (0.0%) |
| Retail Trade | 40 (24.7%) | 122 (75.3%) |
| Transportation & Warehousing | 8 (100.0%) | 0 (0.0%) |
| Utilities | 0 (0.0%) | 0 (0.0%) |
| Information | 0 (0.0%) | 16 (100.0%) |
| Finance & Insurance | 9 (25.7%) | 26 (74.3%) |
| Real Estate, Rental & Leasing | 0 (0.0%) | 0 (0.0%) |
| Professional & Scientific | 0 (0.0%) | 42 (100.0%) |
| Enterprise Management | 0 (0.0%) | 0 (0.0%) |
| Administrative & Support | 0 (0.0%) | 11 (100.0%) |
| Educational Services | 26 (39.4%) | 40 (60.6%) |
| Health Care & Social Assistance | 16 (9.4%) | 154 (90.6%) |
| Arts, Entertainment & Recreation | 0 (0.0%) | 0 (0.0%) |
| Accommodation & Food Services | 12 (11.0%) | 97 (89.0%) |
| Public Administration | 0 (0.0%) | 36 (100.0%) |
| Total | 495 (46.7%) | 564 (53.3%) |
Education in Midway South
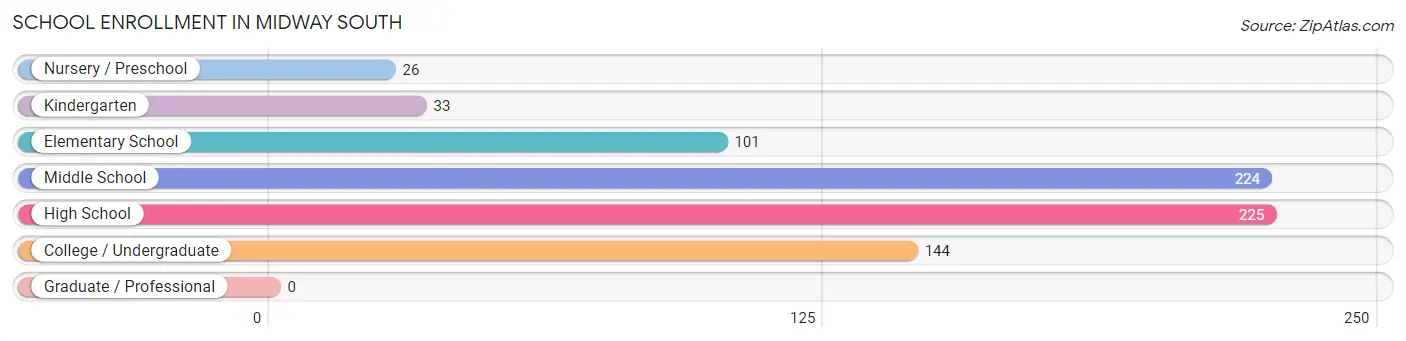
School Enrollment in Midway South
The most common levels of schooling among the 753 students in Midway South are high school (225 | 29.9%), middle school (224 | 29.7%), and college / undergraduate (144 | 19.1%).
| School Level | # Students | % Students |
| Nursery / Preschool | 26 | 3.5% |
| Kindergarten | 33 | 4.4% |
| Elementary School | 101 | 13.4% |
| Middle School | 224 | 29.7% |
| High School | 225 | 29.9% |
| College / Undergraduate | 144 | 19.1% |
| Graduate / Professional | 0 | 0.0% |
| Total | 753 | 100.0% |
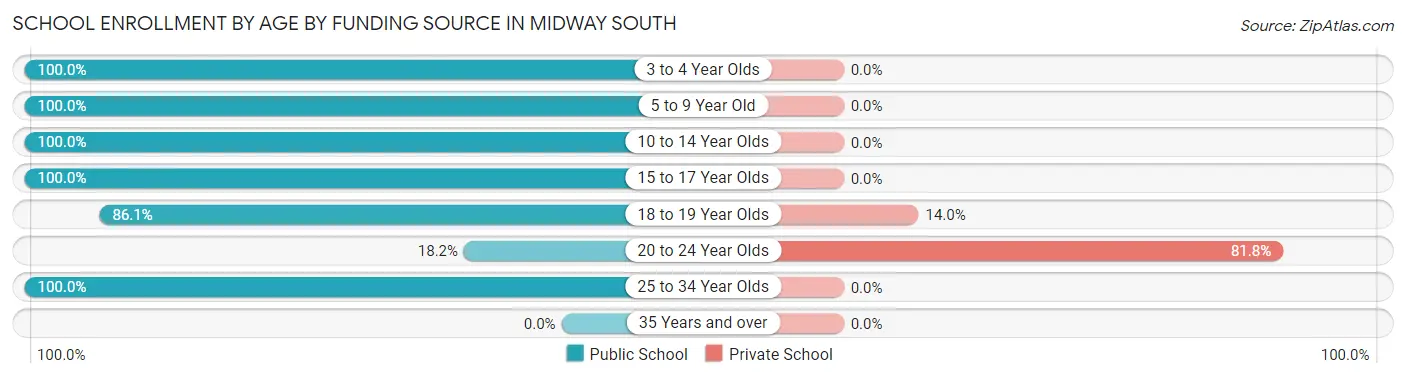
School Enrollment by Age by Funding Source in Midway South
Out of a total of 753 students who are enrolled in schools in Midway South, 84 (11.2%) attend a private institution, while the remaining 669 (88.8%) are enrolled in public schools. The age group of 20 to 24 year olds has the highest likelihood of being enrolled in private schools, with 72 (81.8% in the age bracket) enrolled. Conversely, the age group of 3 to 4 year olds has the lowest likelihood of being enrolled in a private school, with 26 (100.0% in the age bracket) attending a public institution.
| Age Bracket | Public School | Private School |
| 3 to 4 Year Olds | 26 (100.0%) | 0 (0.0%) |
| 5 to 9 Year Old | 79 (100.0%) | 0 (0.0%) |
| 10 to 14 Year Olds | 283 (100.0%) | 0 (0.0%) |
| 15 to 17 Year Olds | 159 (100.0%) | 0 (0.0%) |
| 18 to 19 Year Olds | 74 (86.1%) | 12 (14.0%) |
| 20 to 24 Year Olds | 16 (18.2%) | 72 (81.8%) |
| 25 to 34 Year Olds | 32 (100.0%) | 0 (0.0%) |
| 35 Years and over | 0 (0.0%) | 0 (0.0%) |
| Total | 669 (88.8%) | 84 (11.2%) |
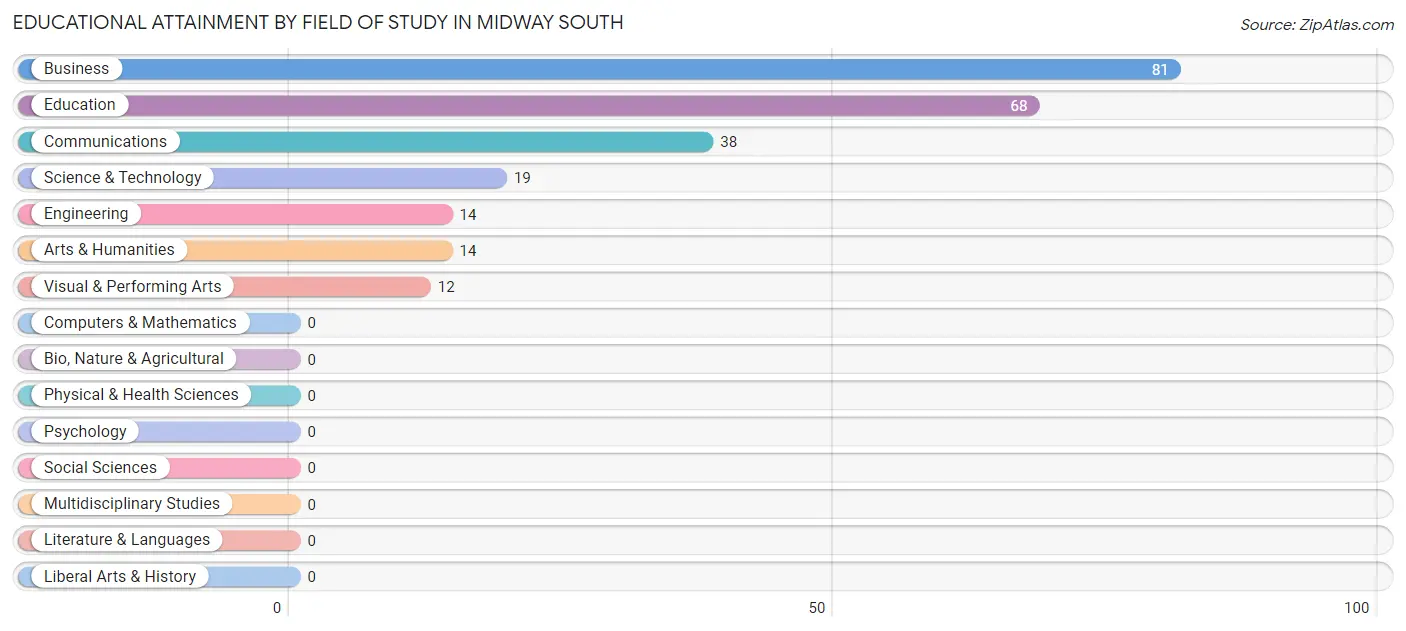
Educational Attainment by Field of Study in Midway South
Business (81 | 32.9%), education (68 | 27.6%), communications (38 | 15.4%), science & technology (19 | 7.7%), and engineering (14 | 5.7%) are the most common fields of study among 246 individuals in Midway South who have obtained a bachelor's degree or higher.
| Field of Study | # Graduates | % Graduates |
| Computers & Mathematics | 0 | 0.0% |
| Bio, Nature & Agricultural | 0 | 0.0% |
| Physical & Health Sciences | 0 | 0.0% |
| Psychology | 0 | 0.0% |
| Social Sciences | 0 | 0.0% |
| Engineering | 14 | 5.7% |
| Multidisciplinary Studies | 0 | 0.0% |
| Science & Technology | 19 | 7.7% |
| Business | 81 | 32.9% |
| Education | 68 | 27.6% |
| Literature & Languages | 0 | 0.0% |
| Liberal Arts & History | 0 | 0.0% |
| Visual & Performing Arts | 12 | 4.9% |
| Communications | 38 | 15.4% |
| Arts & Humanities | 14 | 5.7% |
| Total | 246 | 100.0% |
Transportation & Commute in Midway South
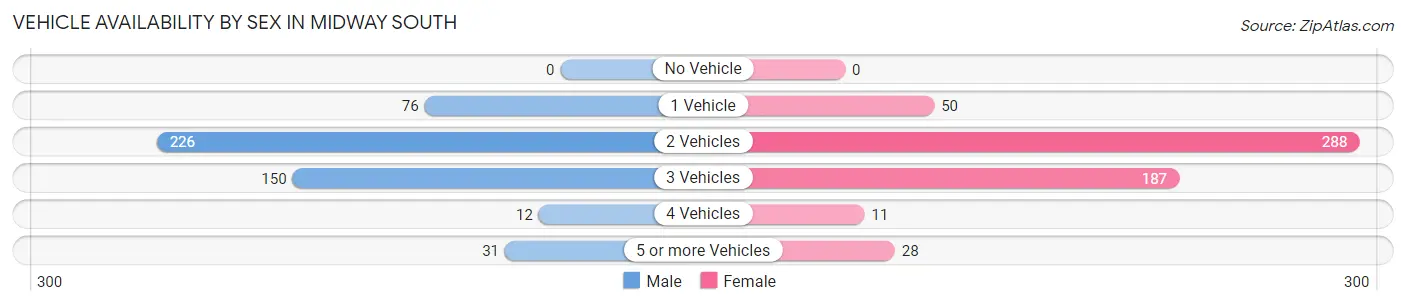
Vehicle Availability by Sex in Midway South
The most prevalent vehicle ownership categories in Midway South are males with 2 vehicles (226, accounting for 45.7%) and females with 2 vehicles (288, making up 40.1%).
| Vehicles Available | Male | Female |
| No Vehicle | 0 (0.0%) | 0 (0.0%) |
| 1 Vehicle | 76 (15.3%) | 50 (8.9%) |
| 2 Vehicles | 226 (45.7%) | 288 (51.1%) |
| 3 Vehicles | 150 (30.3%) | 187 (33.2%) |
| 4 Vehicles | 12 (2.4%) | 11 (1.9%) |
| 5 or more Vehicles | 31 (6.3%) | 28 (5.0%) |
| Total | 495 (100.0%) | 564 (100.0%) |
Commute Time in Midway South
The most frequently occuring commute durations in Midway South are 30 to 34 minutes (276 commuters, 28.0%), 15 to 19 minutes (190 commuters, 19.3%), and 10 to 14 minutes (171 commuters, 17.3%).
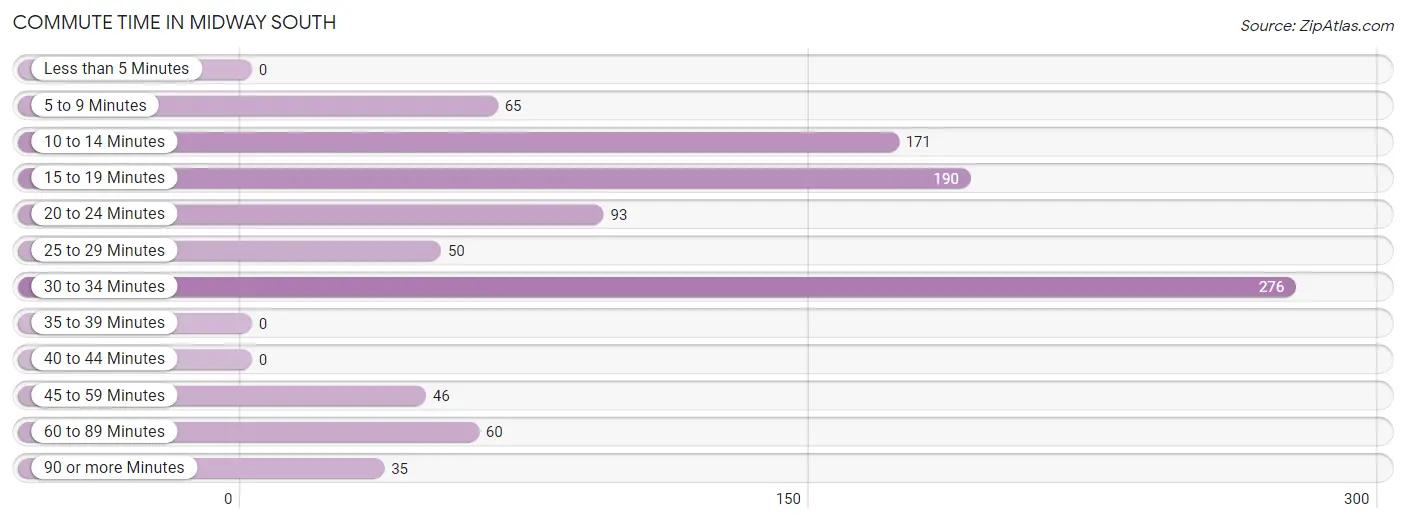
| Commute Time | # Commuters | % Commuters |
| Less than 5 Minutes | 0 | 0.0% |
| 5 to 9 Minutes | 65 | 6.6% |
| 10 to 14 Minutes | 171 | 17.3% |
| 15 to 19 Minutes | 190 | 19.3% |
| 20 to 24 Minutes | 93 | 9.4% |
| 25 to 29 Minutes | 50 | 5.1% |
| 30 to 34 Minutes | 276 | 28.0% |
| 35 to 39 Minutes | 0 | 0.0% |
| 40 to 44 Minutes | 0 | 0.0% |
| 45 to 59 Minutes | 46 | 4.7% |
| 60 to 89 Minutes | 60 | 6.1% |
| 90 or more Minutes | 35 | 3.5% |
Commute Time by Sex in Midway South
The most common commute times in Midway South are 15 to 19 minutes (171 commuters, 35.9%) for males and 30 to 34 minutes (236 commuters, 46.3%) for females.
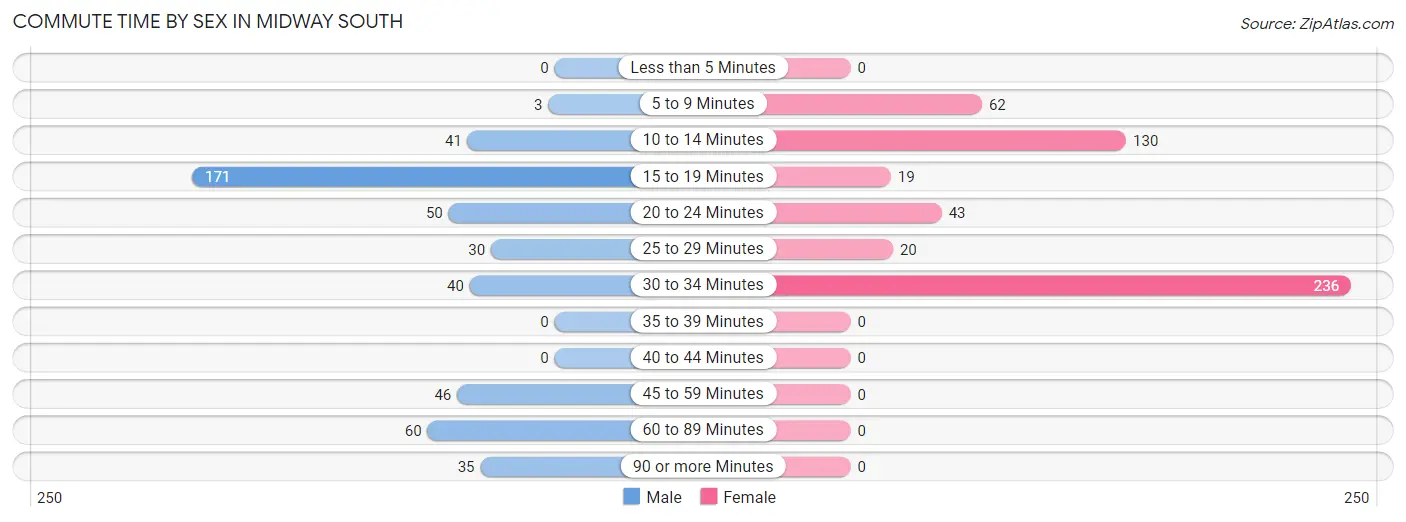
| Commute Time | Male | Female |
| Less than 5 Minutes | 0 (0.0%) | 0 (0.0%) |
| 5 to 9 Minutes | 3 (0.6%) | 62 (12.2%) |
| 10 to 14 Minutes | 41 (8.6%) | 130 (25.5%) |
| 15 to 19 Minutes | 171 (35.9%) | 19 (3.7%) |
| 20 to 24 Minutes | 50 (10.5%) | 43 (8.4%) |
| 25 to 29 Minutes | 30 (6.3%) | 20 (3.9%) |
| 30 to 34 Minutes | 40 (8.4%) | 236 (46.3%) |
| 35 to 39 Minutes | 0 (0.0%) | 0 (0.0%) |
| 40 to 44 Minutes | 0 (0.0%) | 0 (0.0%) |
| 45 to 59 Minutes | 46 (9.7%) | 0 (0.0%) |
| 60 to 89 Minutes | 60 (12.6%) | 0 (0.0%) |
| 90 or more Minutes | 35 (7.3%) | 0 (0.0%) |
Time of Departure to Work by Sex in Midway South
The most frequent times of departure to work in Midway South are 7:00 AM to 7:29 AM (174, 36.5%) for males and 8:00 AM to 8:29 AM (193, 37.8%) for females.
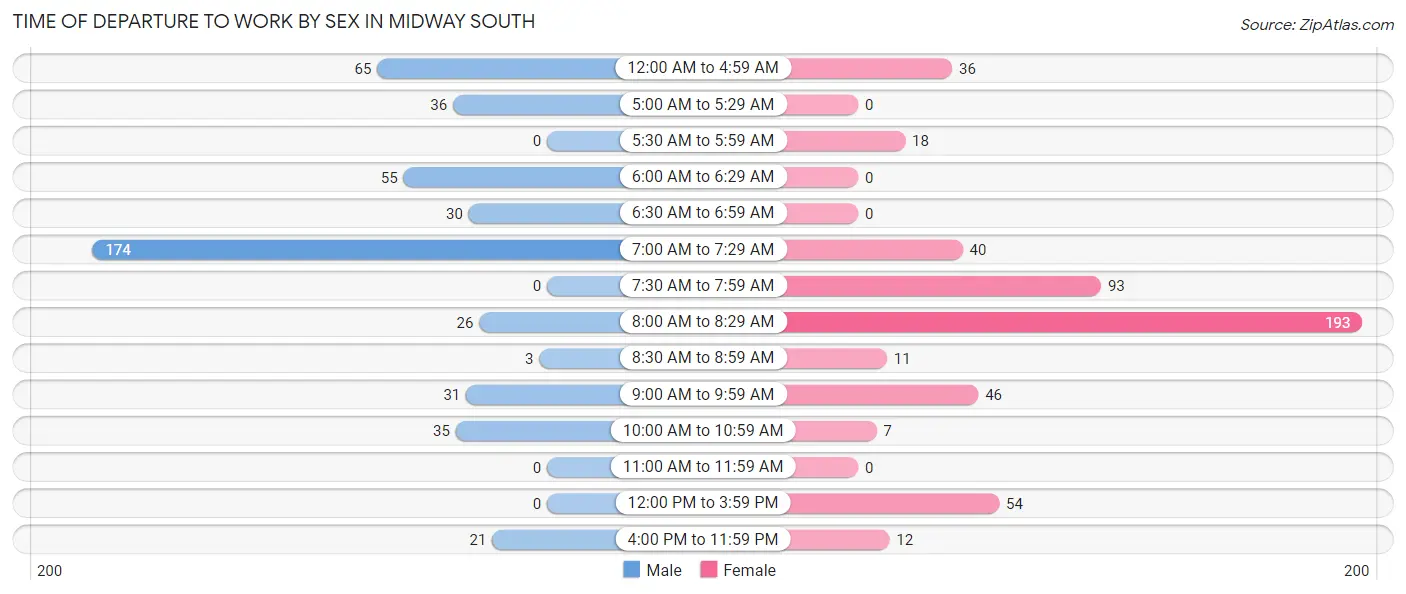
| Time of Departure | Male | Female |
| 12:00 AM to 4:59 AM | 65 (13.7%) | 36 (7.1%) |
| 5:00 AM to 5:29 AM | 36 (7.6%) | 0 (0.0%) |
| 5:30 AM to 5:59 AM | 0 (0.0%) | 18 (3.5%) |
| 6:00 AM to 6:29 AM | 55 (11.6%) | 0 (0.0%) |
| 6:30 AM to 6:59 AM | 30 (6.3%) | 0 (0.0%) |
| 7:00 AM to 7:29 AM | 174 (36.5%) | 40 (7.8%) |
| 7:30 AM to 7:59 AM | 0 (0.0%) | 93 (18.2%) |
| 8:00 AM to 8:29 AM | 26 (5.5%) | 193 (37.8%) |
| 8:30 AM to 8:59 AM | 3 (0.6%) | 11 (2.2%) |
| 9:00 AM to 9:59 AM | 31 (6.5%) | 46 (9.0%) |
| 10:00 AM to 10:59 AM | 35 (7.3%) | 7 (1.4%) |
| 11:00 AM to 11:59 AM | 0 (0.0%) | 0 (0.0%) |
| 12:00 PM to 3:59 PM | 0 (0.0%) | 54 (10.6%) |
| 4:00 PM to 11:59 PM | 21 (4.4%) | 12 (2.4%) |
| Total | 476 (100.0%) | 510 (100.0%) |
Housing Occupancy in Midway South
Occupancy by Ownership in Midway South
Of the total 644 dwellings in Midway South, owner-occupied units account for 566 (87.9%), while renter-occupied units make up 78 (12.1%).

| Occupancy | # Housing Units | % Housing Units |
| Owner Occupied Housing Units | 566 | 87.9% |
| Renter-Occupied Housing Units | 78 | 12.1% |
| Total Occupied Housing Units | 644 | 100.0% |
Occupancy by Household Size in Midway South
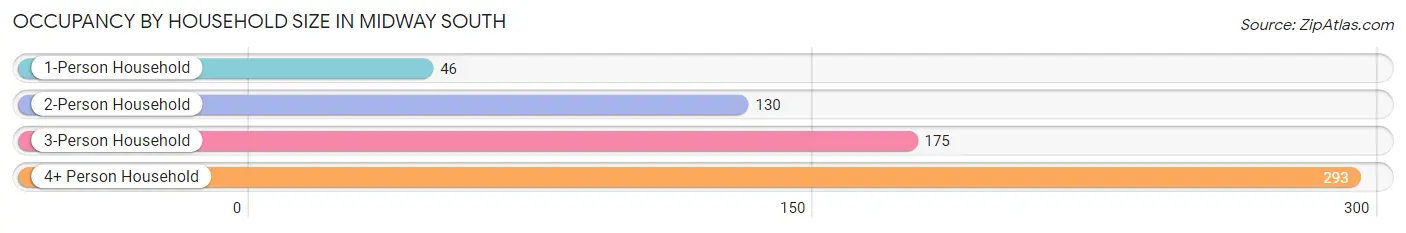
| Household Size | # Housing Units | % Housing Units |
| 1-Person Household | 46 | 7.1% |
| 2-Person Household | 130 | 20.2% |
| 3-Person Household | 175 | 27.2% |
| 4+ Person Household | 293 | 45.5% |
| Total Housing Units | 644 | 100.0% |
Occupancy by Ownership by Household Size in Midway South
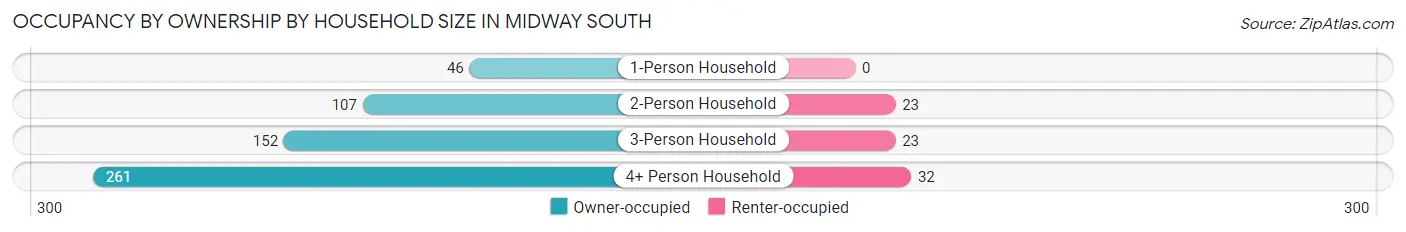
| Household Size | Owner-occupied | Renter-occupied |
| 1-Person Household | 46 (100.0%) | 0 (0.0%) |
| 2-Person Household | 107 (82.3%) | 23 (17.7%) |
| 3-Person Household | 152 (86.9%) | 23 (13.1%) |
| 4+ Person Household | 261 (89.1%) | 32 (10.9%) |
| Total Housing Units | 566 (87.9%) | 78 (12.1%) |
Occupancy by Educational Attainment in Midway South
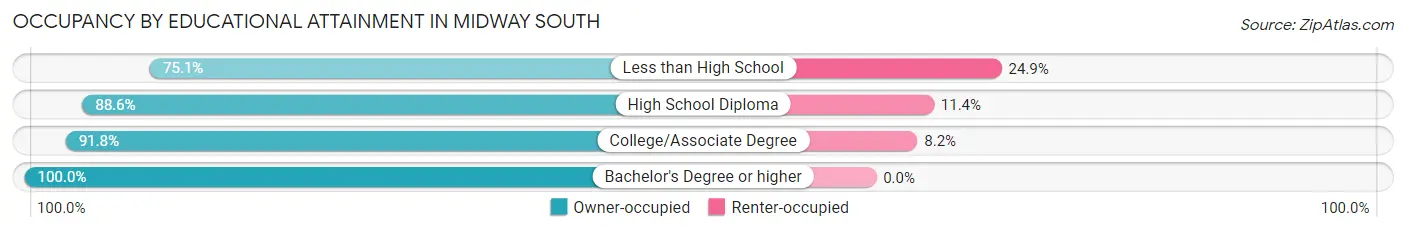
| Household Size | Owner-occupied | Renter-occupied |
| Less than High School | 130 (75.1%) | 43 (24.9%) |
| High School Diploma | 178 (88.6%) | 23 (11.4%) |
| College/Associate Degree | 135 (91.8%) | 12 (8.2%) |
| Bachelor's Degree or higher | 123 (100.0%) | 0 (0.0%) |
Occupancy by Age of Householder in Midway South
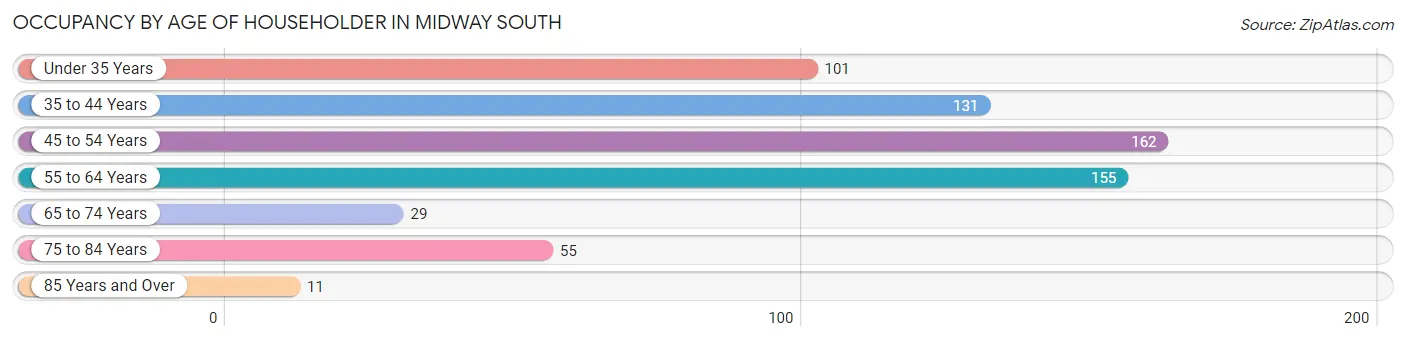
| Age Bracket | # Households | % Households |
| Under 35 Years | 101 | 15.7% |
| 35 to 44 Years | 131 | 20.3% |
| 45 to 54 Years | 162 | 25.2% |
| 55 to 64 Years | 155 | 24.1% |
| 65 to 74 Years | 29 | 4.5% |
| 75 to 84 Years | 55 | 8.5% |
| 85 Years and Over | 11 | 1.7% |
| Total | 644 | 100.0% |
Housing Finances in Midway South
Median Income by Occupancy in Midway South
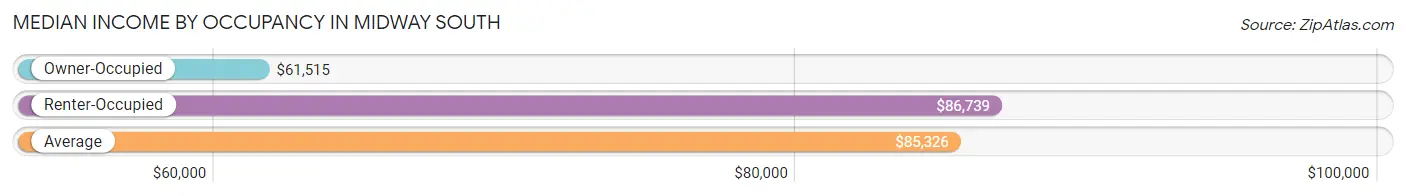
| Occupancy Type | # Households | Median Income |
| Owner-Occupied | 566 (87.9%) | $61,515 |
| Renter-Occupied | 78 (12.1%) | $86,739 |
| Average | 644 (100.0%) | $85,326 |
Occupancy by Householder Income Bracket in Midway South
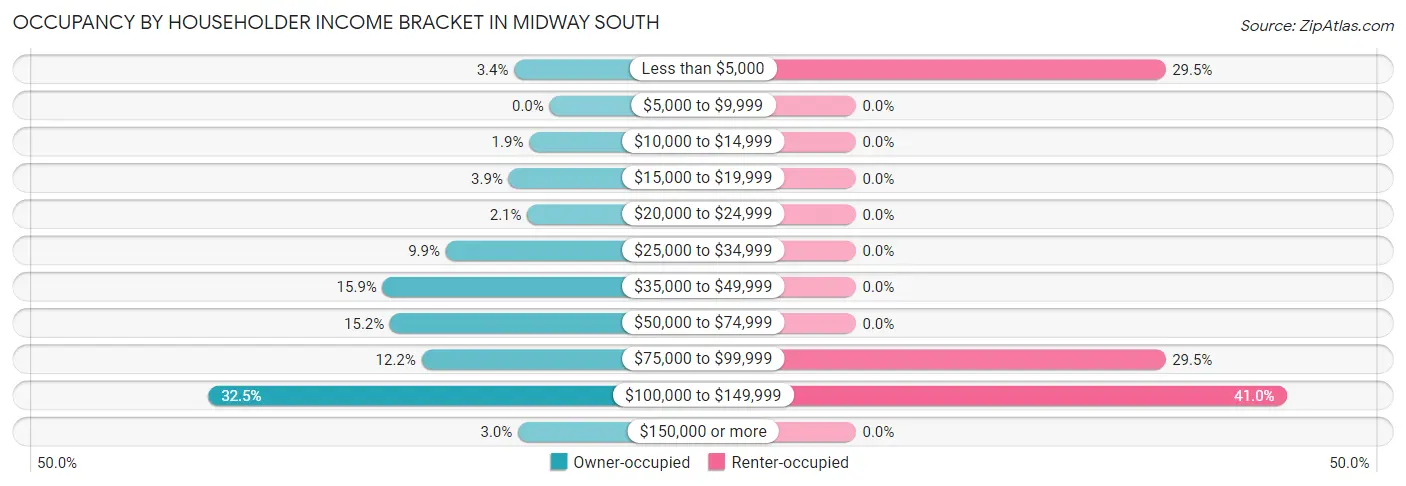
| Income Bracket | Owner-occupied | Renter-occupied |
| Less than $5,000 | 19 (3.4%) | 23 (29.5%) |
| $5,000 to $9,999 | 0 (0.0%) | 0 (0.0%) |
| $10,000 to $14,999 | 11 (1.9%) | 0 (0.0%) |
| $15,000 to $19,999 | 22 (3.9%) | 0 (0.0%) |
| $20,000 to $24,999 | 12 (2.1%) | 0 (0.0%) |
| $25,000 to $34,999 | 56 (9.9%) | 0 (0.0%) |
| $35,000 to $49,999 | 90 (15.9%) | 0 (0.0%) |
| $50,000 to $74,999 | 86 (15.2%) | 0 (0.0%) |
| $75,000 to $99,999 | 69 (12.2%) | 23 (29.5%) |
| $100,000 to $149,999 | 184 (32.5%) | 32 (41.0%) |
| $150,000 or more | 17 (3.0%) | 0 (0.0%) |
| Total | 566 (100.0%) | 78 (100.0%) |
Monthly Housing Cost Tiers in Midway South
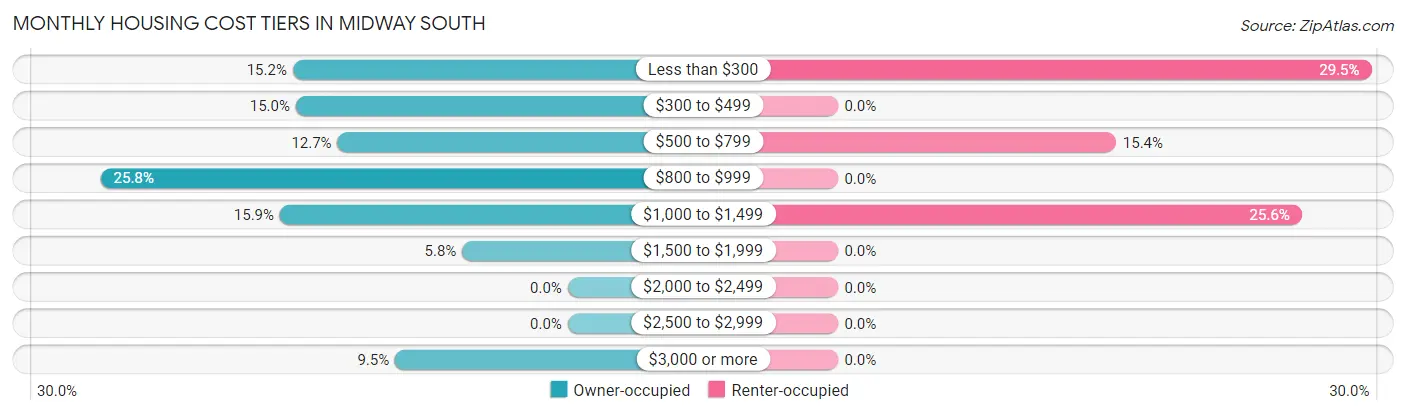
| Monthly Cost | Owner-occupied | Renter-occupied |
| Less than $300 | 86 (15.2%) | 23 (29.5%) |
| $300 to $499 | 85 (15.0%) | 0 (0.0%) |
| $500 to $799 | 72 (12.7%) | 12 (15.4%) |
| $800 to $999 | 146 (25.8%) | 0 (0.0%) |
| $1,000 to $1,499 | 90 (15.9%) | 20 (25.6%) |
| $1,500 to $1,999 | 33 (5.8%) | 0 (0.0%) |
| $2,000 to $2,499 | 0 (0.0%) | 0 (0.0%) |
| $2,500 to $2,999 | 0 (0.0%) | 0 (0.0%) |
| $3,000 or more | 54 (9.5%) | 0 (0.0%) |
| Total | 566 (100.0%) | 78 (100.0%) |
Physical Housing Characteristics in Midway South
Housing Structures in Midway South
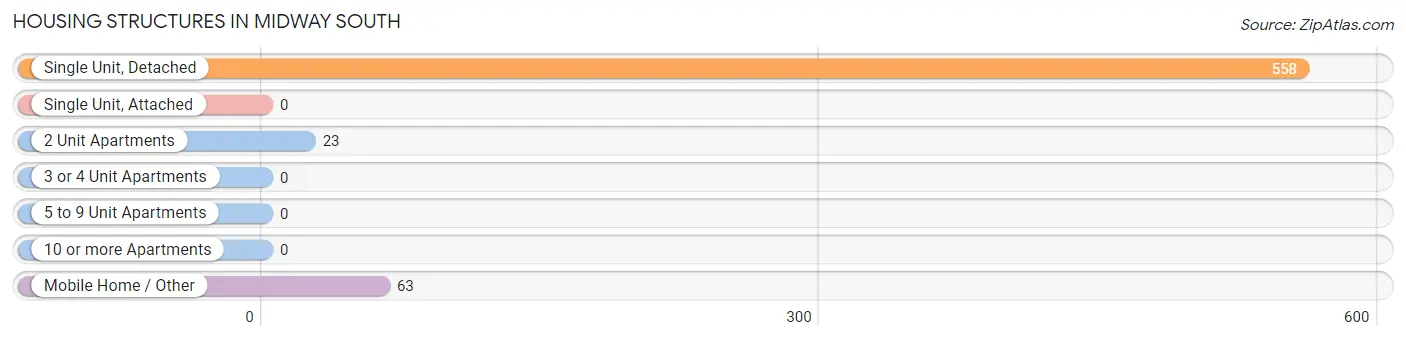
| Structure Type | # Housing Units | % Housing Units |
| Single Unit, Detached | 558 | 86.7% |
| Single Unit, Attached | 0 | 0.0% |
| 2 Unit Apartments | 23 | 3.6% |
| 3 or 4 Unit Apartments | 0 | 0.0% |
| 5 to 9 Unit Apartments | 0 | 0.0% |
| 10 or more Apartments | 0 | 0.0% |
| Mobile Home / Other | 63 | 9.8% |
| Total | 644 | 100.0% |
Housing Structures by Occupancy in Midway South
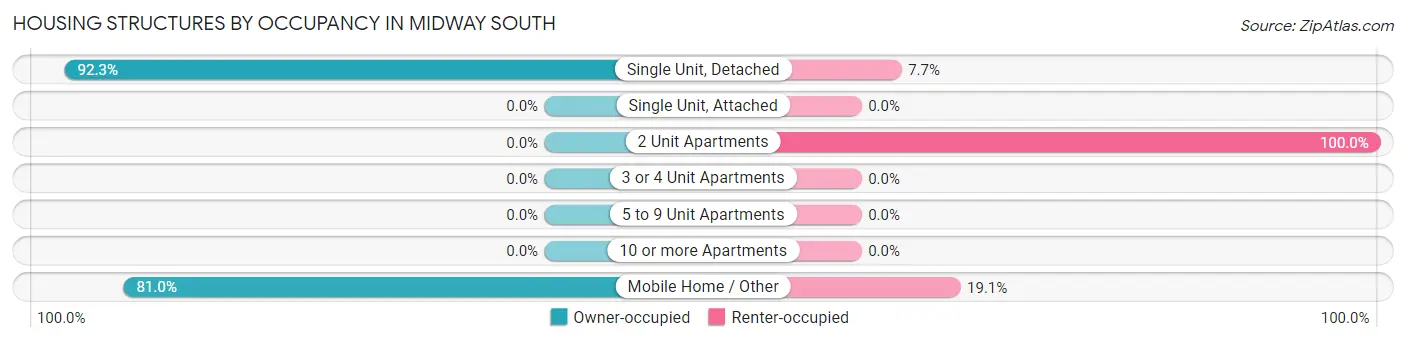
| Structure Type | Owner-occupied | Renter-occupied |
| Single Unit, Detached | 515 (92.3%) | 43 (7.7%) |
| Single Unit, Attached | 0 (0.0%) | 0 (0.0%) |
| 2 Unit Apartments | 0 (0.0%) | 23 (100.0%) |
| 3 or 4 Unit Apartments | 0 (0.0%) | 0 (0.0%) |
| 5 to 9 Unit Apartments | 0 (0.0%) | 0 (0.0%) |
| 10 or more Apartments | 0 (0.0%) | 0 (0.0%) |
| Mobile Home / Other | 51 (80.9%) | 12 (19.1%) |
| Total | 566 (87.9%) | 78 (12.1%) |
Housing Structures by Number of Rooms in Midway South
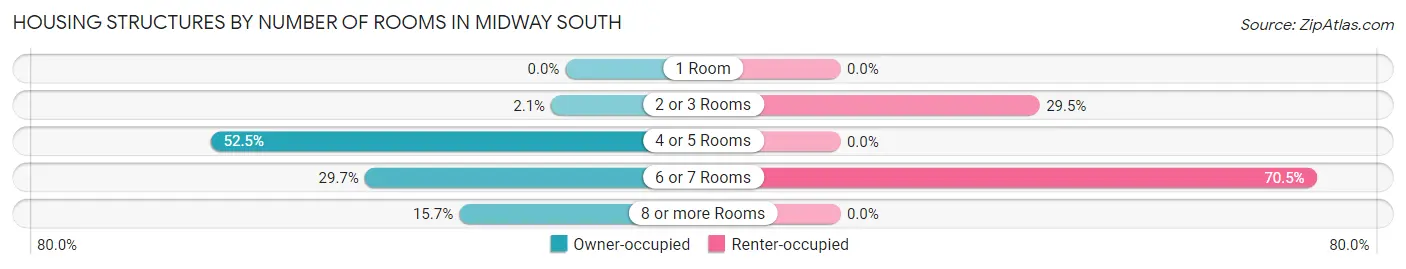
| Number of Rooms | Owner-occupied | Renter-occupied |
| 1 Room | 0 (0.0%) | 0 (0.0%) |
| 2 or 3 Rooms | 12 (2.1%) | 23 (29.5%) |
| 4 or 5 Rooms | 297 (52.5%) | 0 (0.0%) |
| 6 or 7 Rooms | 168 (29.7%) | 55 (70.5%) |
| 8 or more Rooms | 89 (15.7%) | 0 (0.0%) |
| Total | 566 (100.0%) | 78 (100.0%) |
Housing Structure by Heating Type in Midway South
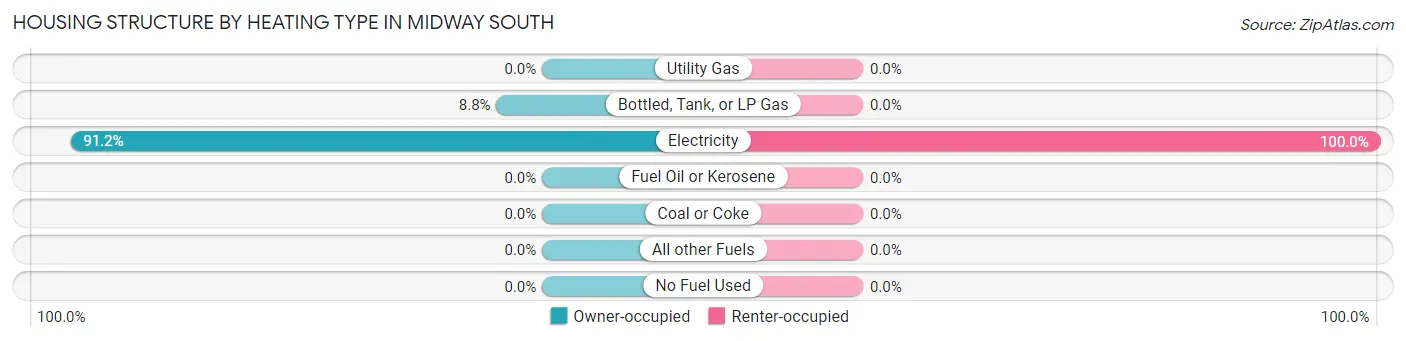
| Heating Type | Owner-occupied | Renter-occupied |
| Utility Gas | 0 (0.0%) | 0 (0.0%) |
| Bottled, Tank, or LP Gas | 50 (8.8%) | 0 (0.0%) |
| Electricity | 516 (91.2%) | 78 (100.0%) |
| Fuel Oil or Kerosene | 0 (0.0%) | 0 (0.0%) |
| Coal or Coke | 0 (0.0%) | 0 (0.0%) |
| All other Fuels | 0 (0.0%) | 0 (0.0%) |
| No Fuel Used | 0 (0.0%) | 0 (0.0%) |
| Total | 566 (100.0%) | 78 (100.0%) |
Household Vehicle Usage in Midway South
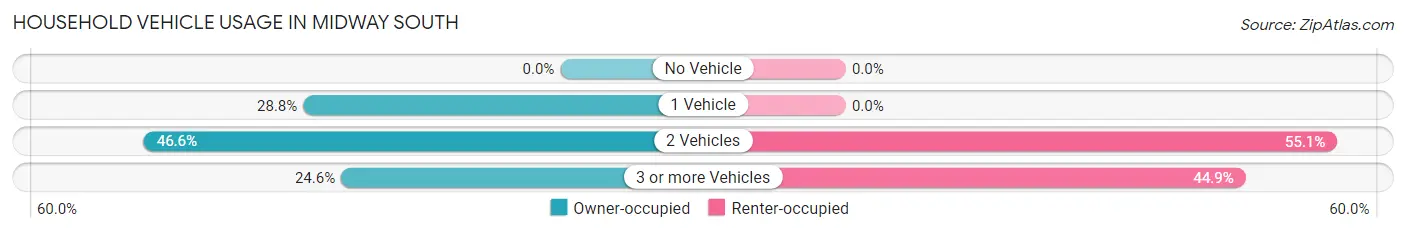
| Vehicles per Household | Owner-occupied | Renter-occupied |
| No Vehicle | 0 (0.0%) | 0 (0.0%) |
| 1 Vehicle | 163 (28.8%) | 0 (0.0%) |
| 2 Vehicles | 264 (46.6%) | 43 (55.1%) |
| 3 or more Vehicles | 139 (24.6%) | 35 (44.9%) |
| Total | 566 (100.0%) | 78 (100.0%) |
Real Estate & Mortgages in Midway South
Real Estate and Mortgage Overview in Midway South
| Characteristic | Without Mortgage | With Mortgage |
| Housing Units | 255 | 311 |
| Median Property Value | $82,600 | $113,000 |
| Median Household Income | $51,101 | $6 |
| Monthly Housing Costs | $349 | $54 |
| Real Estate Taxes | $599 | $0 |
Property Value by Mortgage Status in Midway South
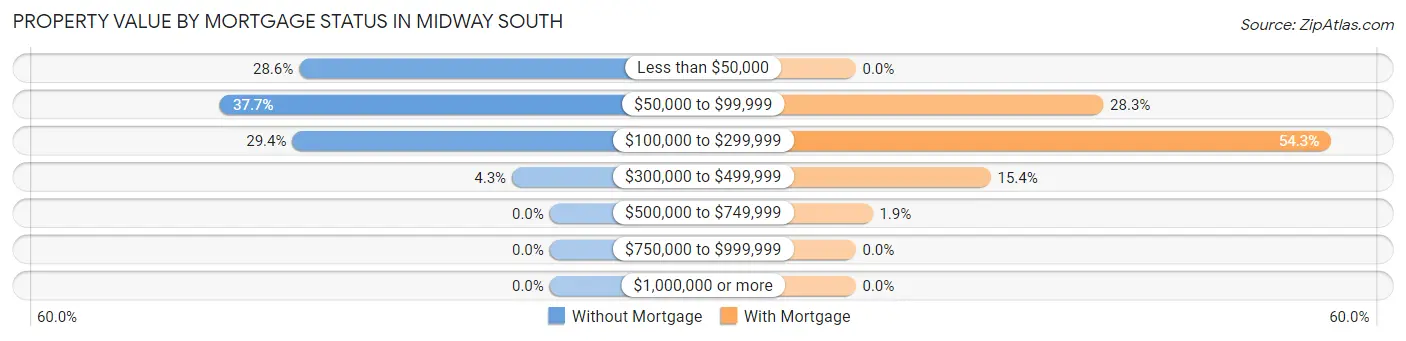
| Property Value | Without Mortgage | With Mortgage |
| Less than $50,000 | 73 (28.6%) | 0 (0.0%) |
| $50,000 to $99,999 | 96 (37.7%) | 88 (28.3%) |
| $100,000 to $299,999 | 75 (29.4%) | 169 (54.3%) |
| $300,000 to $499,999 | 11 (4.3%) | 48 (15.4%) |
| $500,000 to $749,999 | 0 (0.0%) | 6 (1.9%) |
| $750,000 to $999,999 | 0 (0.0%) | 0 (0.0%) |
| $1,000,000 or more | 0 (0.0%) | 0 (0.0%) |
| Total | 255 (100.0%) | 311 (100.0%) |
Household Income by Mortgage Status in Midway South
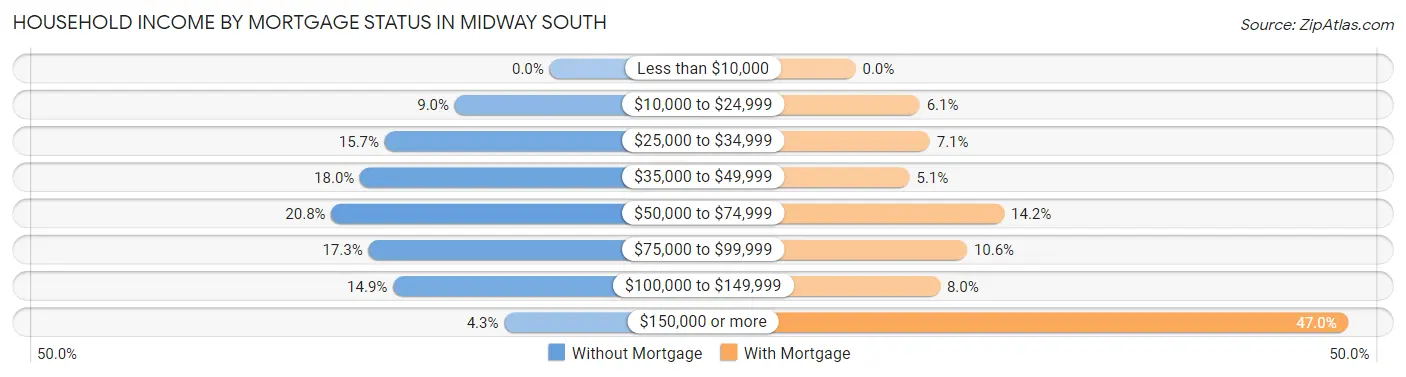
| Household Income | Without Mortgage | With Mortgage |
| Less than $10,000 | 0 (0.0%) | 0 (0.0%) |
| $10,000 to $24,999 | 23 (9.0%) | 19 (6.1%) |
| $25,000 to $34,999 | 40 (15.7%) | 22 (7.1%) |
| $35,000 to $49,999 | 46 (18.0%) | 16 (5.1%) |
| $50,000 to $74,999 | 53 (20.8%) | 44 (14.1%) |
| $75,000 to $99,999 | 44 (17.2%) | 33 (10.6%) |
| $100,000 to $149,999 | 38 (14.9%) | 25 (8.0%) |
| $150,000 or more | 11 (4.3%) | 146 (46.9%) |
| Total | 255 (100.0%) | 311 (100.0%) |
Property Value to Household Income Ratio in Midway South
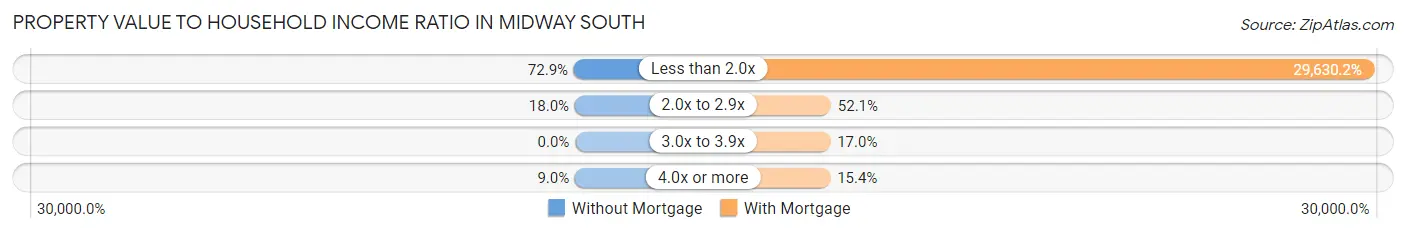
| Value-to-Income Ratio | Without Mortgage | With Mortgage |
| Less than 2.0x | 186 (72.9%) | 92,150 (29,630.2%) |
| 2.0x to 2.9x | 46 (18.0%) | 162 (52.1%) |
| 3.0x to 3.9x | 0 (0.0%) | 53 (17.0%) |
| 4.0x or more | 23 (9.0%) | 48 (15.4%) |
| Total | 255 (100.0%) | 311 (100.0%) |
Real Estate Taxes by Mortgage Status in Midway South
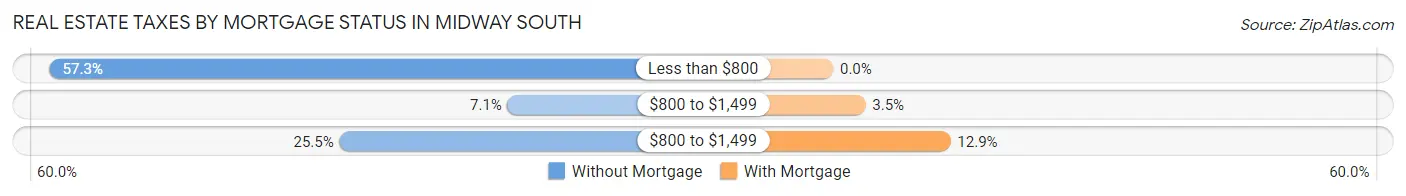
| Property Taxes | Without Mortgage | With Mortgage |
| Less than $800 | 146 (57.3%) | 0 (0.0%) |
| $800 to $1,499 | 18 (7.1%) | 11 (3.5%) |
| $800 to $1,499 | 65 (25.5%) | 40 (12.9%) |
| Total | 255 (100.0%) | 311 (100.0%) |
Health & Disability in Midway South
Health Insurance Coverage by Age in Midway South
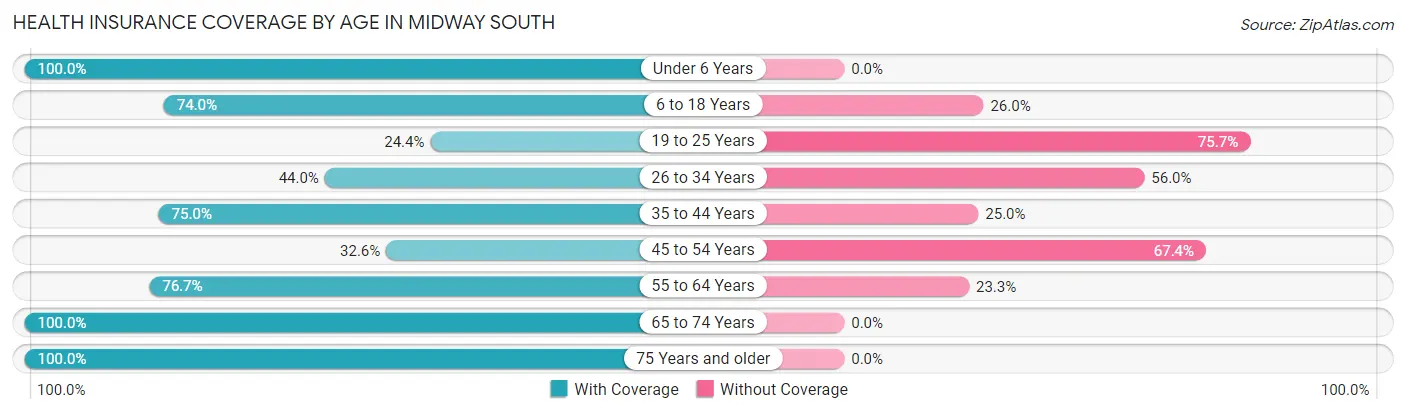
| Age Bracket | With Coverage | Without Coverage |
| Under 6 Years | 278 (100.0%) | 0 (0.0%) |
| 6 to 18 Years | 425 (74.0%) | 149 (26.0%) |
| 19 to 25 Years | 66 (24.3%) | 205 (75.6%) |
| 26 to 34 Years | 144 (44.0%) | 183 (56.0%) |
| 35 to 44 Years | 195 (75.0%) | 65 (25.0%) |
| 45 to 54 Years | 101 (32.6%) | 209 (67.4%) |
| 55 to 64 Years | 198 (76.7%) | 60 (23.3%) |
| 65 to 74 Years | 75 (100.0%) | 0 (0.0%) |
| 75 Years and older | 66 (100.0%) | 0 (0.0%) |
| Total | 1,548 (64.0%) | 871 (36.0%) |
Health Insurance Coverage by Citizenship Status in Midway South
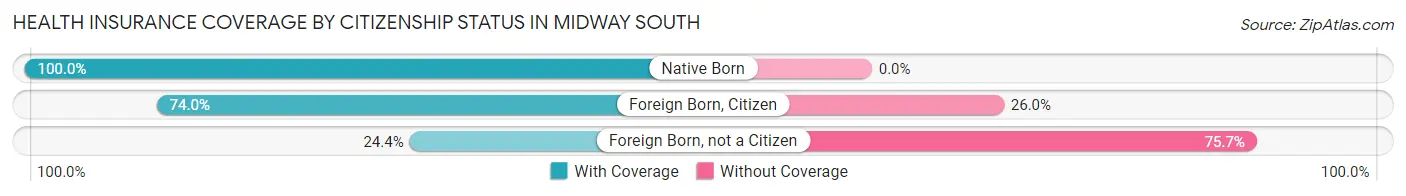
| Citizenship Status | With Coverage | Without Coverage |
| Native Born | 278 (100.0%) | 0 (0.0%) |
| Foreign Born, Citizen | 425 (74.0%) | 149 (26.0%) |
| Foreign Born, not a Citizen | 66 (24.3%) | 205 (75.6%) |
Health Insurance Coverage by Household Income in Midway South
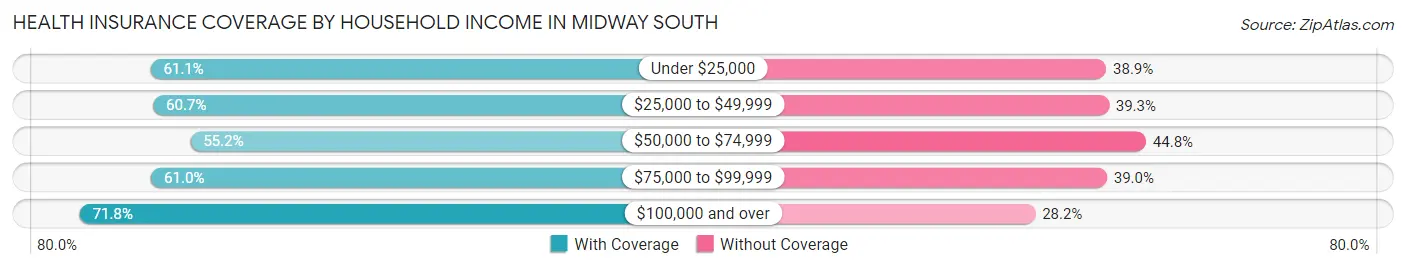
| Household Income | With Coverage | Without Coverage |
| Under $25,000 | 162 (61.1%) | 103 (38.9%) |
| $25,000 to $49,999 | 348 (60.7%) | 225 (39.3%) |
| $50,000 to $74,999 | 224 (55.2%) | 182 (44.8%) |
| $75,000 to $99,999 | 166 (61.0%) | 106 (39.0%) |
| $100,000 and over | 648 (71.8%) | 255 (28.2%) |
Public vs Private Health Insurance Coverage by Age in Midway South
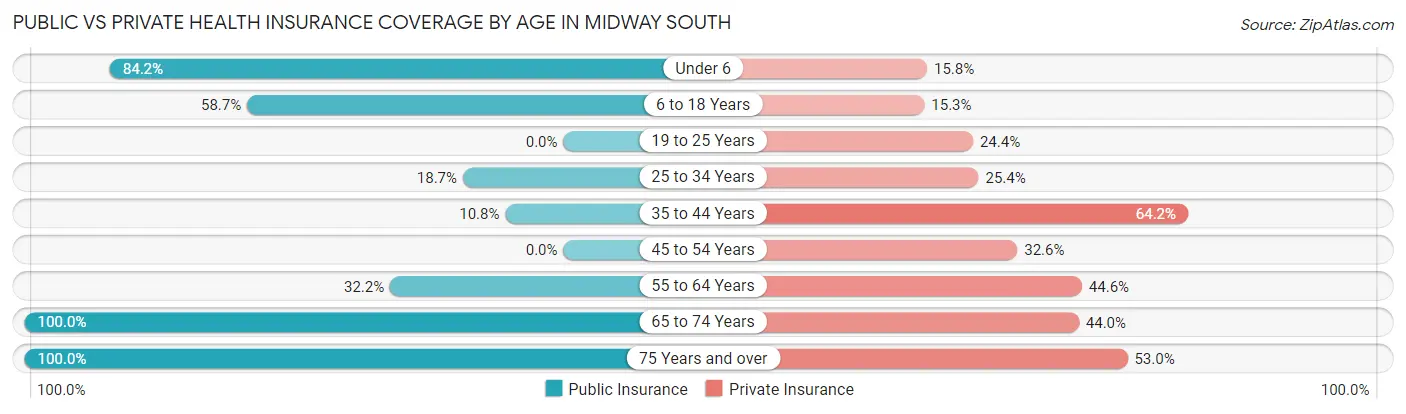
| Age Bracket | Public Insurance | Private Insurance |
| Under 6 | 234 (84.2%) | 44 (15.8%) |
| 6 to 18 Years | 337 (58.7%) | 88 (15.3%) |
| 19 to 25 Years | 0 (0.0%) | 66 (24.3%) |
| 25 to 34 Years | 61 (18.6%) | 83 (25.4%) |
| 35 to 44 Years | 28 (10.8%) | 167 (64.2%) |
| 45 to 54 Years | 0 (0.0%) | 101 (32.6%) |
| 55 to 64 Years | 83 (32.2%) | 115 (44.6%) |
| 65 to 74 Years | 75 (100.0%) | 33 (44.0%) |
| 75 Years and over | 66 (100.0%) | 35 (53.0%) |
| Total | 884 (36.5%) | 732 (30.3%) |
Disability Status by Sex by Age in Midway South
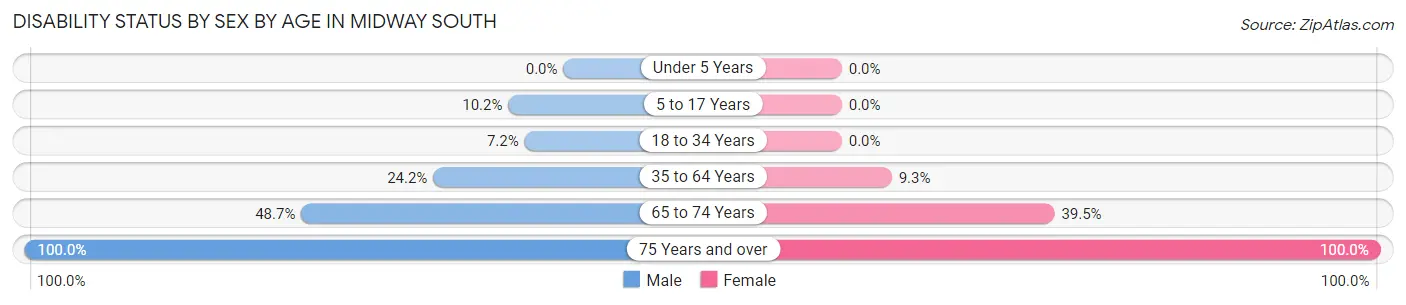
| Age Bracket | Male | Female |
| Under 5 Years | 0 (0.0%) | 0 (0.0%) |
| 5 to 17 Years | 28 (10.2%) | 0 (0.0%) |
| 18 to 34 Years | 23 (7.2%) | 0 (0.0%) |
| 35 to 64 Years | 93 (24.2%) | 41 (9.3%) |
| 65 to 74 Years | 18 (48.6%) | 15 (39.5%) |
| 75 Years and over | 11 (100.0%) | 55 (100.0%) |
Disability Class by Sex by Age in Midway South
Disability Class: Hearing Difficulty
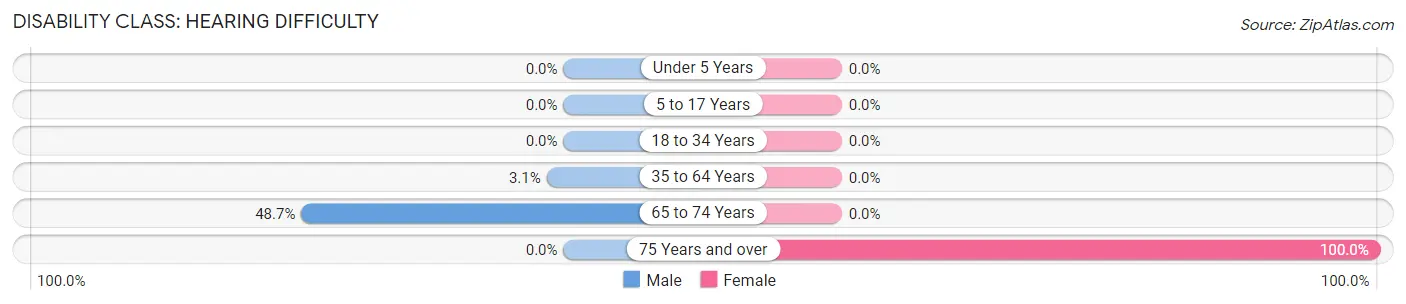
| Age Bracket | Male | Female |
| Under 5 Years | 0 (0.0%) | 0 (0.0%) |
| 5 to 17 Years | 0 (0.0%) | 0 (0.0%) |
| 18 to 34 Years | 0 (0.0%) | 0 (0.0%) |
| 35 to 64 Years | 12 (3.1%) | 0 (0.0%) |
| 65 to 74 Years | 18 (48.6%) | 0 (0.0%) |
| 75 Years and over | 0 (0.0%) | 55 (100.0%) |
Disability Class: Vision Difficulty
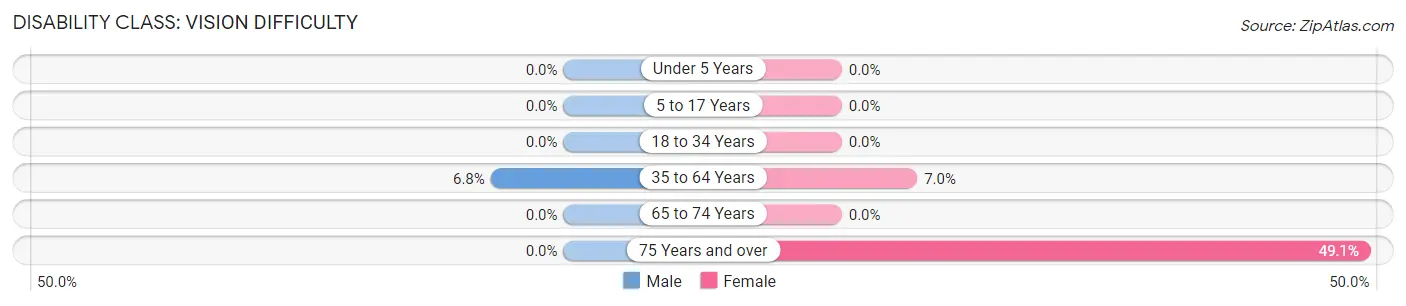
| Age Bracket | Male | Female |
| Under 5 Years | 0 (0.0%) | 0 (0.0%) |
| 5 to 17 Years | 0 (0.0%) | 0 (0.0%) |
| 18 to 34 Years | 0 (0.0%) | 0 (0.0%) |
| 35 to 64 Years | 26 (6.8%) | 31 (7.0%) |
| 65 to 74 Years | 0 (0.0%) | 0 (0.0%) |
| 75 Years and over | 0 (0.0%) | 27 (49.1%) |
Disability Class: Cognitive Difficulty
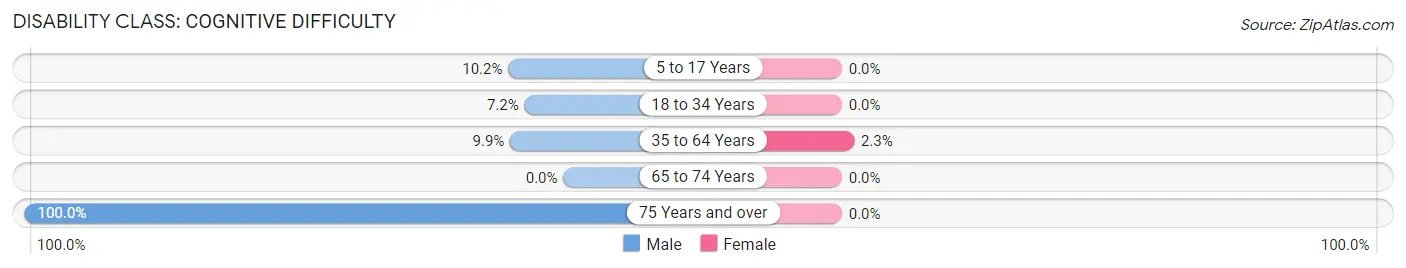
| Age Bracket | Male | Female |
| 5 to 17 Years | 28 (10.2%) | 0 (0.0%) |
| 18 to 34 Years | 23 (7.2%) | 0 (0.0%) |
| 35 to 64 Years | 38 (9.9%) | 10 (2.3%) |
| 65 to 74 Years | 0 (0.0%) | 0 (0.0%) |
| 75 Years and over | 11 (100.0%) | 0 (0.0%) |
Disability Class: Ambulatory Difficulty
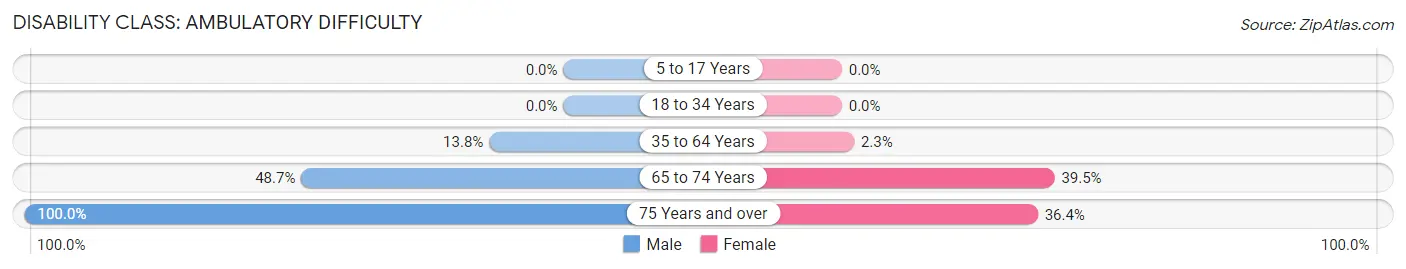
| Age Bracket | Male | Female |
| 5 to 17 Years | 0 (0.0%) | 0 (0.0%) |
| 18 to 34 Years | 0 (0.0%) | 0 (0.0%) |
| 35 to 64 Years | 53 (13.8%) | 10 (2.3%) |
| 65 to 74 Years | 18 (48.6%) | 15 (39.5%) |
| 75 Years and over | 11 (100.0%) | 20 (36.4%) |
Disability Class: Self-Care Difficulty
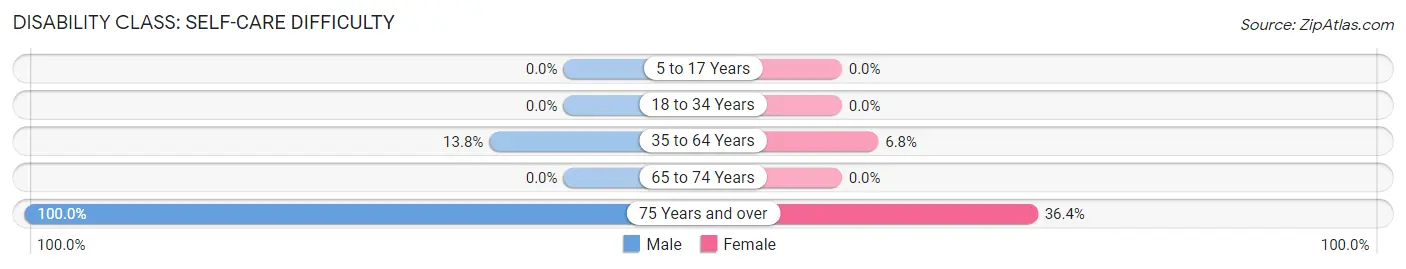
| Age Bracket | Male | Female |
| 5 to 17 Years | 0 (0.0%) | 0 (0.0%) |
| 18 to 34 Years | 0 (0.0%) | 0 (0.0%) |
| 35 to 64 Years | 53 (13.8%) | 30 (6.8%) |
| 65 to 74 Years | 0 (0.0%) | 0 (0.0%) |
| 75 Years and over | 11 (100.0%) | 20 (36.4%) |
Technology Access in Midway South
Computing Device Access in Midway South
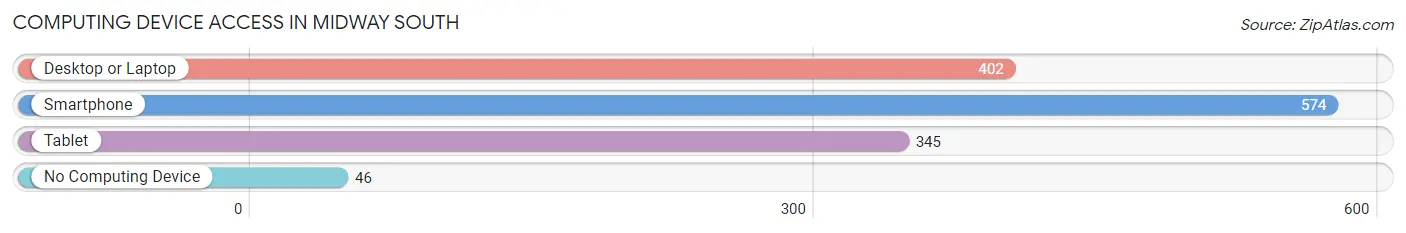
| Device Type | # Households | % Households |
| Desktop or Laptop | 402 | 62.4% |
| Smartphone | 574 | 89.1% |
| Tablet | 345 | 53.6% |
| No Computing Device | 46 | 7.1% |
| Total | 644 | 100.0% |
Internet Access in Midway South
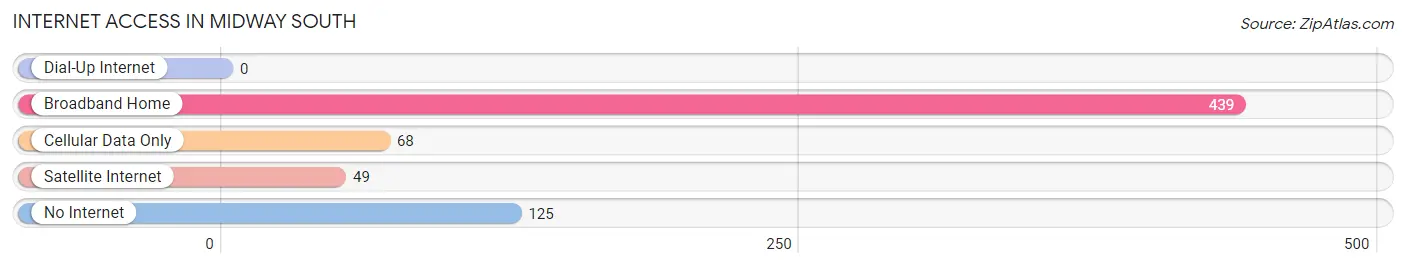
| Internet Type | # Households | % Households |
| Dial-Up Internet | 0 | 0.0% |
| Broadband Home | 439 | 68.2% |
| Cellular Data Only | 68 | 10.6% |
| Satellite Internet | 49 | 7.6% |
| No Internet | 125 | 19.4% |
| Total | 644 | 100.0% |
Midway South Summary
Midway South is a small unincorporated community located in the southeastern corner of Texas, in the county of Brazoria. It is situated on the Gulf Coast, approximately 40 miles south of Houston. The population of Midway South is estimated to be around 1,000 people.
History
Midway South was originally settled in the late 1800s by a group of settlers from the nearby town of Midway. The settlers were looking for a place to settle and start a new life. The area was originally known as Midway South, but the name was changed to Midway in the early 1900s.
The town of Midway South was officially incorporated in 1912. The town was named after the nearby town of Midway, which was founded in 1836. The town of Midway South was a small farming community, and the main crops grown were cotton, corn, and sugar cane.
In the early 1900s, the town of Midway South began to grow and develop. The town was home to several businesses, including a general store, a post office, a bank, and a hotel. The town also had a school, a church, and a library.
In the late 1940s, the town of Midway South began to decline. The population began to decrease, and many of the businesses closed. In the 1950s, the town was annexed by the city of Brazoria.
Geography
Midway South is located in the southeastern corner of Texas, in the county of Brazoria. It is situated on the Gulf Coast, approximately 40 miles south of Houston. The town is located on the banks of the Brazos River, and is surrounded by marshlands and wetlands.
The climate in Midway South is humid subtropical, with hot summers and mild winters. The average temperature in the summer is around 90 degrees Fahrenheit, and the average temperature in the winter is around 60 degrees Fahrenheit.
Economy
The economy of Midway South is largely based on agriculture and fishing. The town is home to several farms, which produce cotton, corn, and sugar cane. The town also has a fishing industry, which produces shrimp, oysters, and other seafood.
The town also has a few small businesses, including a general store, a post office, a bank, and a hotel. The town also has a school, a church, and a library.
Demographics
As of the 2010 census, the population of Midway South was estimated to be around 1,000 people. The racial makeup of the town was 94.7% White, 0.7% African American, 0.3% Native American, 0.3% Asian, and 4.0% from other races.
The median household income in Midway South was $37,500, and the median family income was $41,250. The per capita income in Midway South was $17,500. The poverty rate in Midway South was 16.7%.
Conclusion
Midway South is a small unincorporated community located in the southeastern corner of Texas, in the county of Brazoria. It is situated on the Gulf Coast, approximately 40 miles south of Houston. The population of Midway South is estimated to be around 1,000 people. The economy of Midway South is largely based on agriculture and fishing, and the town is home to several farms, businesses, and a fishing industry. The racial makeup of the town is 94.7% White, 0.7% African American, 0.3% Native American, 0.3% Asian, and 4.0% from other races. The median household income in Midway South was $37,500, and the poverty rate was 16.7%.
Common Questions
What is the Total Population of Midway South?
Total Population of Midway South is 2,419.
What is the Total Male Population of Midway South?
Total Male Population of Midway South is 1,110.
What is the Total Female Population of Midway South?
Total Female Population of Midway South is 1,309.
What is the Ratio of Males per 100 Females in Midway South?
There are 84.80 Males per 100 Females in Midway South.
What is the Ratio of Females per 100 Males in Midway South?
There are 117.93 Females per 100 Males in Midway South.
What is the Median Population Age in Midway South?
Median Population Age in Midway South is 28.0 Years.
What is the Average Family Size in Midway South
Average Family Size in Midway South is 3.8 People.
What is the Average Household Size in Midway South
Average Household Size in Midway South is 3.8 People.
What is Per Capita Income in Midway South?
Per Capita income in Midway South is $21,457.
What is the Median Family Income in Midway South?
Median Family Income in Midway South is $62,045.
What is the Median Household income in Midway South?
Median Household Income in Midway South is $85,326.
What is Income or Wage Gap in Midway South?
Income or Wage Gap in Midway South is 47.6%.
Women in Midway South earn 52.4 cents for every dollar earned by a man.
What is Family Income Deficit in Midway South?
Family Income Deficit in Midway South is $10,748.
Families that are below poverty line in Midway South earn $10,748 less on average than the poverty threshold level.
What is Inequality or Gini Index in Midway South?
Inequality or Gini Index in Midway South is 0.36.
How Large is the Labor Force in Midway South?
There are 1,133 People in the Labor Forcein in Midway South.
What is the Percentage of People in the Labor Force in Midway South?
63.6% of People are in the Labor Force in Midway South.
What is the Unemployment Rate in Midway South?
Unemployment Rate in Midway South is 6.4%.